Phylogeography of the Afromontane Prunus africana reveals a former migration corridor between East...
14
Phylogeography of the Afromontane Prunus africana reveals a former migration corridor between East and West African highlands C. A. C. KADU,* 1 S. SCHUELER,* 1 H. KONRAD,* G. M. M. MULUVI,† O. EYOG-MATIG,‡ A. MUCHUGI,† V. L. WILLIAMS,§ L. RAMAMONJISOA, – C. KAPINGA,** B. FOAHOM,†† C. KATSVANGA,‡‡ D. HAFASHIMANA,§§ C. OBAMA –– and T. GEBUREK* *Federal Research Centre for Forests (BFW), Department of Genetics, Hauptstraße 7, A-1140 Vienna, Austria, †Kenyatta University, PO Box 43844, Nairobi, Kenya, ‡Bioversity International SSA, c ⁄ o CIFOR Regional Office, PO Box 2008, Messa, Yaounde, Cameroon, §School of Animal, Plant & Environmental Sciences, University of the Witwatersrand, Private Bag 3, Wits 2050, Johannesburg, South Africa, –Silo National des Graines Forestieres (SNGF), PO Box 5091, Antananarivo-101, Madagascar, **Tanzania Forestry Research Institute (TAFORI), PO Box 1854, Morogoro, Tanzania, ††Institute of Agricultural Research for Development (IRAD), PO Box 2123 or 2067, Yaounde, Cameroon, ‡‡Faculty of Agriculture and Environmental Science (Forestry Unit), Bindura University of Science Education, P. Bag 1020, Bindura, Zimbabwe, §§National Forestry Resources Research Institute (NaFORRI), PO Box 1752, Kampala, Uganda, ––Coordinador Nacional de la COMIFAC Ministerio de Agricultura y Bosques BP 207, Bata, Equatorial Guinea Abstract Scattered populations of the same tree species in montane forests through Africa have led to speculations on the origins of distributions. Here, we inferred the colonization history of the Afromontane tree Prunus africana using seven chloroplast DNA loci to study 582 individuals from 32 populations sampled in a range-wide survey from across Africa, revealing 22 haplotypes. The predominant haplotype, HT1a, occurred in 13 populations of eastern and southern Africa, while a second common haplotype, HT1m, occurred in populations of western Uganda and western Africa. The high differentiation observed between populations in East Africa was unexpected, with stands in western Uganda belonging with the western African lineage. High genetic differentiation among populations revealed using ordered alleles (N ST = 0.840) compared with unordered alleles (G ST = 0.735), indicated a clear phylogeographic pattern. Bayesian coalescence modelling suggested that ‘east’ and ‘west’ African types likely split early during southward migration of the species, while further more recent splitting events occurred among populations in the East of the continent. The high genetic similarity found between western Uganda and west African populations indicates that a former Afromontane migration corridor may have existed through Equatorial Africa. Keywords: African cherry, Afromontane, evolutionary history, organelle marker, Pygeum africa- num, Range-wide differentiation, rift valley Received 8 April 2010; revision received 15 September 2010; accepted 26 September 2010 Introduction The long-term environmental stability of Afromontane forest regions has been proposed as a mechanism for the accumulation and persistence of species during glacial periods, resulting in diverse species assemblages that are centres of endemism (Finch et al. 2009; Hall et al. 2009). Significant climate changes that occurred within Africa between the last glacial maximum (LGM) around 20 000 years ago and the present day have, however, caused considerable modifications in species ranges (e.g. Livingstone 1975; Castan ˜ eda et al. 2009). Pollen core Correspondence: Thomas Geburek, Fax: (+43) (1) 87838 2250; E-mail: [email protected] 1 Contributed equally. Ó 2010 Blackwell Publishing Ltd Molecular Ecology (2011) 20, 165–178 doi: 10.1111/j.1365-294X.2010.04931.x
-
Upload
independent -
Category
Documents
-
view
0 -
download
0
Transcript of Phylogeography of the Afromontane Prunus africana reveals a former migration corridor between East...

Molecular Ecology (2011) 20, 165–178 doi: 10.1111/j.1365-294X.2010.04931.x
Phylogeography of the Afromontane Prunus africanareveals a former migration corridor between East andWest African highlands
C. A. C. KADU,* 1 S . SCHUELER,* 1 H. KONRAD,* G. M. M. MULUVI ,† O. EYOG-MATIG,‡
A. MUCHUGI ,† V. L . WILLIAMS,§ L. RAMAMONJISOA,– C. KAPINGA,** B . FOAHOM,††
C. KATSVANGA,‡‡ D. HAFASHIMANA,§§ C. OBAMA–– and T. GEBUREK*
*Federal Research Centre for Forests (BFW), Department of Genetics, Hauptstraße 7, A-1140 Vienna, Austria, †Kenyatta
University, PO Box 43844, Nairobi, Kenya, ‡Bioversity International SSA, c ⁄ o CIFOR Regional Office, PO Box 2008, Messa,
Yaounde, Cameroon, §School of Animal, Plant & Environmental Sciences, University of the Witwatersrand, Private Bag 3, Wits
2050, Johannesburg, South Africa, –Silo National des Graines Forestieres (SNGF), PO Box 5091, Antananarivo-101,
Madagascar, **Tanzania Forestry Research Institute (TAFORI), PO Box 1854, Morogoro, Tanzania, ††Institute of Agricultural
Research for Development (IRAD), PO Box 2123 or 2067, Yaounde, Cameroon, ‡‡Faculty of Agriculture and Environmental
Science (Forestry Unit), Bindura University of Science Education, P. Bag 1020, Bindura, Zimbabwe, §§National Forestry
Resources Research Institute (NaFORRI), PO Box 1752, Kampala, Uganda, ––Coordinador Nacional de la COMIFAC
Ministerio de Agricultura y Bosques BP 207, Bata, Equatorial Guinea
Corresponde
E-mail: thom
1Contributed
� 2010 Black
Abstract
Scattered populations of the same tree species in montane forests through Africa have led
to speculations on the origins of distributions. Here, we inferred the colonization history
of the Afromontane tree Prunus africana using seven chloroplast DNA loci to study 582
individuals from 32 populations sampled in a range-wide survey from across Africa,
revealing 22 haplotypes. The predominant haplotype, HT1a, occurred in 13 populations
of eastern and southern Africa, while a second common haplotype, HT1m, occurred in
populations of western Uganda and western Africa. The high differentiation observed
between populations in East Africa was unexpected, with stands in western Uganda
belonging with the western African lineage. High genetic differentiation among
populations revealed using ordered alleles (NST = 0.840) compared with unordered
alleles (GST = 0.735), indicated a clear phylogeographic pattern. Bayesian coalescence
modelling suggested that ‘east’ and ‘west’ African types likely split early during
southward migration of the species, while further more recent splitting events occurred
among populations in the East of the continent. The high genetic similarity found
between western Uganda and west African populations indicates that a former
Afromontane migration corridor may have existed through Equatorial Africa.
Keywords: African cherry, Afromontane, evolutionary history, organelle marker, Pygeum africa-
num, Range-wide differentiation, rift valley
Received 8 April 2010; revision received 15 September 2010; accepted 26 September 2010
Introduction
The long-term environmental stability of Afromontane
forest regions has been proposed as a mechanism for the
nce: Thomas Geburek, Fax: (+43) (1) 87838 2250;
equally.
well Publishing Ltd
accumulation and persistence of species during glacial
periods, resulting in diverse species assemblages that
are centres of endemism (Finch et al. 2009; Hall et al.
2009). Significant climate changes that occurred within
Africa between the last glacial maximum (LGM) around
20 000 years ago and the present day have, however,
caused considerable modifications in species ranges (e.g.
Livingstone 1975; Castaneda et al. 2009). Pollen core

166 C . A . C . K A D U ET AL.
data suggest that during the LGM vegetation now classi-
fied as montane extended to wider areas of lower eleva-
tion in East, Central and West Africa (Van Zinderen
Bakker & Clarke 1962; Caratini & Giresse 1979; Elenga
1987; Maley 1987, 1989). Later, during the early part of
the Holocene, an increase in temperature caused an
expansion of evergreen forests and a retraction of ‘mon-
tane’ species to current higher elevation distributions
(Livingstone 1975; Maley 1991). High similarities
between east and west African montane forests in their
insect, bird and plant communities have long been evi-
dent and indicate connection between them, possibly via
past lowland bridges (Moreau 1966; Hall 1973). The
location of this connection and the time frame of its exis-
tence have been the subject of extensive discussion
among paleoecologists (e.g. Hedberg 1969; Coetzee &
Van Zinderen Bakker 1970; Wickens 1976). As the most
recent connection, White (1981) proposed the southern
migratory tract (SMT), where extant, patchily distributed
Afromontane forests in the southern Democratic Repub-
lic of Congo, Zambia, northern Angola and Gabon could
have acted as ‘stepping stones’ for various species
(White 1983, 1993). Unfortunately, past vegetation pat-
terns can only partly be reconstructed by pollen analysis
because of a lack of lake sediments, particularly in Cen-
tral Africa. Alternative methods to study past distribu-
tions, such as those based on phylogeographic
reconstructions of typical representatives of the Afro-
montane flora based on DNA studies, can improve our
knowledge of the historical processes responsible for
determining current distributions and assist in predict-
ing future responses to anthropogenic climate change.
Prunus africana (Hook.f.) Kalkman (synonym Pygeum
africanum Hook.f.) (Rosaceae) is an evergreen tree typi-
cal of Afromontane forests. With the exception of some
disjunct island populations in Madagascar, the Comoros
and the Gulf of Guinea (Hall et al. 2000), P. africana is
confined to the physiographic domain referred to as
‘High Africa’, extending from 34 �S to 12 �N. Within
‘High Africa’, the species occurs primarily in mountain-
ous and volcanic highlands. In southern Africa, the
range is between 600 and 1000 m in elevation, although
in the Bloukrans River Gorge of South Africa it has
been recorded to grow as low as 60 m (Geldenhuys
1981). Its occurrence below the montane zone is mainly
in rocky areas and boulder accumulations or at drain-
age lines (Hall et al. 2000). In equatorial Africa, it is
found at elevations ranging from 1000 to 3500 m; the
distribution is generally typified by a relatively temper-
ate climate and an annual rainfall from 500 to 700 mm
at high latitudes to over 3000 mm at low latitudes. The
species is a long-lived hermaphrodite tree that may
grow to a height of more than 40 m and can attain a
diameter greater than 1 m. It produces small white
flowers in elongated clusters that are primarily insect
pollinated. Flowering has been reported to start as early
as age 5 and as late as age 20 (Hall et al. 2000). Its fle-
shy one-seeded fruits are dispersed by birds and mam-
mals (Farwig et al. 2006). The species has been of
considerable commercial interest in recent decades
because bark extracts are used for the treatment of
benign prostatic hyperplasia (Cunningham et al. 1997;
Simons et al. 1998). This has led to significant interna-
tional trade, overexploitation of natural populations and
(since 1995) listing under Appendix II of CITES (http://
www.cites.org/eng/prog/african_cherry.shtml).
There have been various speculations about the pro-
cesses leading to the current distribution of P. africana,
and several migration paths have been inferred based on
extant stands (Aubreville 1976; Kalkman 1988). Aubre-
ville (1976) suggested a Laurasian origin of Prunus (con-
sidering only subgenus Laurocerasus, which includes
P. africana, in his work) with subsequent movement
through the Middle East into northeast of Africa. On the
other hand, Kalkman (1988) proposed a Gondwanian
origin of species of the tribe Pruneae (containing the gen-
era Maddenia, Prinsepia and Prunus), with northwards
movement along a path starting in regions correspond-
ing to Australia, South America and Africa. Another
open question is the phylogeographic history of P. afri-
cana within Africa, which seems to be strongly connected
with past vegetation dynamics and the distribution of
Afromontane vegetation in general (White 1983). Based
on a genetic study using random amplified polymorphic
DNA (RAPD) markers, Muchugi et al. (2006) concluded
that both long-distance seed dispersal and migration via
the SMT could be responsible for the occurrence of
P. africana in outlying islands and the distant West Afri-
can mountain massifs. Because of the large genetic dif-
ferences observed among western and eastern Kenyan
populations, Muchugi et al. (2006) supported Aubre-
ville’s path of immigration (Aubreville 1976) and pro-
posed the rift valley as a probable barrier to gene flow.
Organellar genome analysis has been intensively
employed over the last two decades for phylogeograph-
ic studies in a wide range of plants, including within
Rosaceae the tree genera Sorbus (Oddou-Muratorio et al.
2001), Prunus (Mohanty et al. 2001) and Malus (Vornam
& Gebhardt 2000). In Rosaceae, chloroplast genomes are
maternally inherited (e.g. Ishigawa et al. 1992; Matsum-
oto et al. 1997; Oddou-Muratorio et al. 2001), and mark-
ers therefore provide information on the spatial
distribution of variation as a consequence of seed flows
and founding events (Birky et al. 1989; McCauley et al.
2003). Chloroplast DNA markers are especially apt for
investigating events that occurred in the more distant
past (Petit et al. 1993a; Hewitt 2000). The approach we
employed here, chloroplast simple sequence repeat
� 2010 Blackwell Publishing Ltd
PHYLOGEOGRAPHY OF PRUNUS AFRICANA 167
(cpSSR) analysis (McCauley 1995; Vendramin & Ziegen-
hagen 1997), has been widely adopted for phylogeo-
graphic study of tropical and subtropical tree genera
such as Hagenia (Ayele et al. 2009), Eucalyptus (Nevill
et al. 2010) and Adansonia (Pock Tsy et al. 2009).
Our aim in this study was to investigate the phyloge-
ography of P. africana as a model to gain insights into
past vegetation patterns of Afromontane forests. This
involved testing cpSSR markers on a wide portion of
the natural distribution of the species based on field
sampling of material across nine African countries. This
collection represents the most significant, extensive
sampling of an Afromontane tree to be investigated in
genetic studies. In particular, we were interested in the
relationship between populations of east and west Afri-
can montane forests and how observed patterns of vari-
ation relate to proposed migration routes. Using
Bayesian coalescence modelling, we infer colonization
dynamics and past vegetation history.
Materials and methods
Population sampling and DNA isolation
Leaf samples were obtained from 32 natural stands of
P. africana covering the main block of the species’ geo-
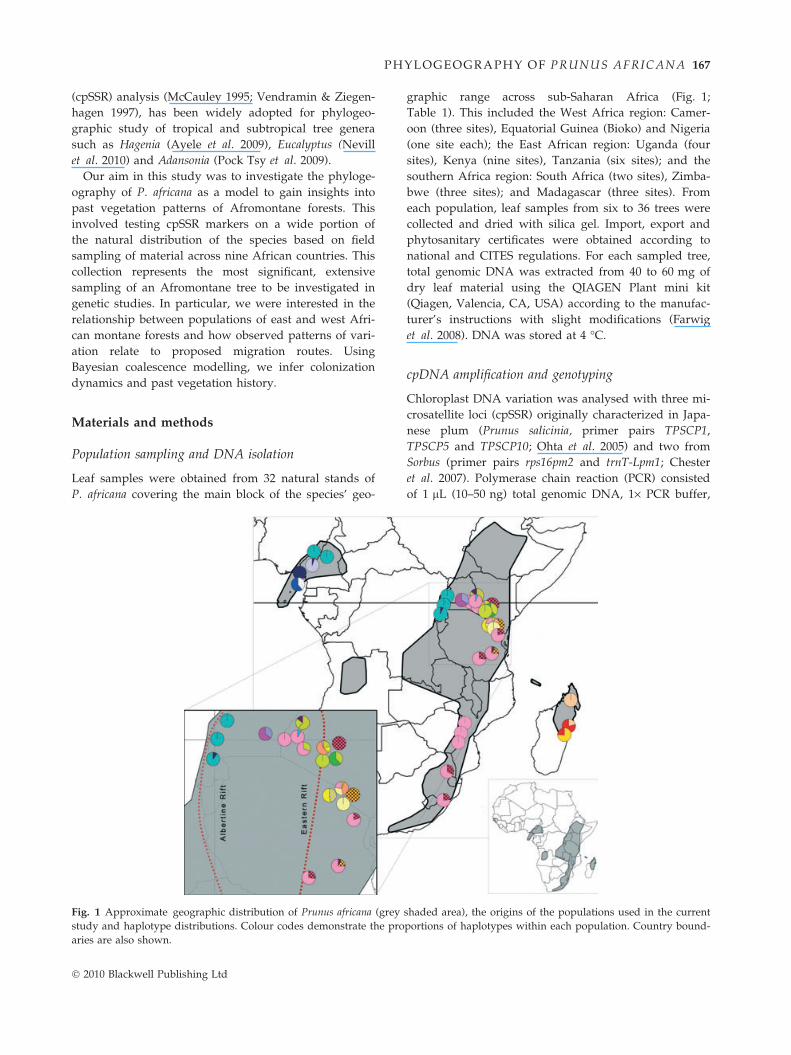
Fig. 1 Approximate geographic distribution of Prunus africana (grey
study and haplotype distributions. Colour codes demonstrate the pro
aries are also shown.
� 2010 Blackwell Publishing Ltd
graphic range across sub-Saharan Africa (Fig. 1;
Table 1). This included the West Africa region: Camer-
oon (three sites), Equatorial Guinea (Bioko) and Nigeria
(one site each); the East African region: Uganda (four
sites), Kenya (nine sites), Tanzania (six sites); and the
southern Africa region: South Africa (two sites), Zimba-
bwe (three sites); and Madagascar (three sites). From
each population, leaf samples from six to 36 trees were
collected and dried with silica gel. Import, export and
phytosanitary certificates were obtained according to
national and CITES regulations. For each sampled tree,
total genomic DNA was extracted from 40 to 60 mg of
dry leaf material using the QIAGEN Plant mini kit
(Qiagen, Valencia, CA, USA) according to the manufac-
turer’s instructions with slight modifications (Farwig
et al. 2008). DNA was stored at 4 �C.
cpDNA amplification and genotyping
Chloroplast DNA variation was analysed with three mi-
crosatellite loci (cpSSR) originally characterized in Japa-
nese plum (Prunus salicinia, primer pairs TPSCP1,
TPSCP5 and TPSCP10; Ohta et al. 2005) and two from
Sorbus (primer pairs rps16pm2 and trnT-Lpm1; Chester
et al. 2007). Polymerase chain reaction (PCR) consisted
of 1 lL (10–50 ng) total genomic DNA, 1· PCR buffer,
shaded area), the origins of the populations used in the current
portions of haplotypes within each population. Country bound-

Table 1 Description, location and haplotype diversity measures of investigated populations
Name of Population Code Country Longitude Latitude n Na Ne Np He
1. Ngashie-Mt Oku CA Cameroon 10.5092 6.2048 19 2 1.11 1 0.105 (0.092–0.158)
2. Lower Mann’s Spring, Mt Cameroon CB Cameroon 9.1192 4.1346 19 1 1 0 0.000 (0.000–0.000)
3. Mt Danoua CC Cameroon 11.9413 7.1871 20 1 1 0 0.000 (0.000–0.000)
4. Moka GQ Equatorial Guinea 8.6559 3.3625 18 2 1.91 2 0.503 (0.064–0.755)
5. Chuka, Central province KA Kenya 37.3645 )0.1798 20 1 1 0 0.000 (0.000–0.000)
6. Kinale, Central province KB Kenya 36.4151 )0.5278 19 4 2.46 0 0.626 (0.098–1.053)
7. Kapcherop, Cherangani Forest, Rift Valley KC Kenya 35.2161 1.0315 20 3 2.25 0 0.584 (0.091–0.955)
8. Kakamega Forest, Western Province KD Kenya 34.519 0.1415 20 1 1 0 0.000 (0.000–0.000)
9. Londiani, Rift Valley KE Kenya 35.1836 )0.2737 20 2 1.72 0 0.442 (0.087–0.663)
10. Ol Danyo Sambuk, Central Province KF Kenya 37.1501 )1.0744 19 2 1.87 1 0.491 (0.068–0.737)
11. Taita Hills, Coast Province KG Kenya 38.2088 )3.2462 20 1 1 0 0.000 (0.000–0.000)
12. Lari, Central Province KT Kenya 36.687 )1.0311 12 1 1 0 0.000 (0.000–0.000)
13. Kibiri forest, Western Province KS Kenya 34.8719 0.1502 16 2 1.13 1 0.125 (0.106–0.188)
14. Marovoay MA Madagascar 48.3069 )18.8023 5 2 1.47 0 0.400 (0.237–0.600)
15. Lakato forest MB Madagascar 48.2779 )19.1971 33 2 1.58 1 0.379 (0.079–0.568)
16. Antsahabiraoka MC Madagascar 49.2164 )14.4015 18 1 1 0 0.000 (0.000–0.000)
17. Ngel Nyaki Forest Reserve, Nigeria NG Nigeria 11.0271 7.066 9 1 1 0 0.000 (0.000–0.000)
18. Mpumalanga SA South Africa 30.7306 )25.0225 19 2 1.76 0 0.456 (0.085–0.684)
19. KwaZulu-Natal SB South Africa 30.2725 )29.2872 17 2 1.56 0 0.382 (0.113–0.574)
20. Meru Catchment Forest TA Tanzania 36.8074 )3.2925 19 2 1.99 1 0.526 (0.040–0.789)
21. Kilimanjaro Catchment Forest Reserve TB Tanzania 37.5237 )3.0036 17 4 3.18 0 0.728 (0.060–1.256)
22. Kindoroko Catchment Reserve TC Tanzania 37.6267 )3.7389 14 1 1 0 0.000 (0.000–0.000)
23. Shume Magamba Catchment
Forest Reserve
TD Tanzania 38.2521 )4.7544 20 2 1.47 0 0.337 (0.110–0.505)
24. Kidabaga TE Tanzania 35.9296 )8.1101 15 2 1.64 0 0.419 (0.113–0.629)
25. Udzungwa TT Tanzania 36.7791 )7.7668 16 3 1.66 0 0.425 (0.133–0.670)
26. Kibale Forest Natural Park UA Uganda 30.357 0.5644 20 1 1 0 0.000 (0.000–0.000)
27. Kalinzu Forest Reserve UB Uganda 30.1101 )0.3742 20 1 1 0 0.000 (0.000–0.000)
28. Bwindi Forest UC Uganda 29.7754 )1.0476 19 2 1.11 0 0.105 (0.092–0.158)
29. Mabira Forest UD Uganda 33.015 0.3806 20 2 1.83 2 0.479 (0.072–0.718)
30. Nyanga National Park ZWA Zimbabwe 32.7401 )18.2873 20 1 1 0 0.000 (0.000–0.000)
31. Cashel Valley Chimanimani ZWB Zimbabwe 32.8004 )19.5781 20 1 1 0 0.000 (0.000–0.000)
32. Chirinda forest Reserve Chipinge ZWC Zimbabwe 32.695 )20.409 19 1 1 0 0.000 (0.000–0.000)
n, number of individuals analysed; Na, number of haplotypes; Ne, effective number of haplotypes; Np, number of private haplotypes;
He, haplotype diversity and standard error as calculated by rarefaction analysis.
168 C . A . C . K A D U ET AL.
0.2 mM dNTPs, 1.5 mM MgCl2, 0.06–0.5 lM of fluores-
cence-labelled forward primer, the same amount of
unlabelled reverse primer and 0.5 units of Platinum�
Taq DNA Polymerase (Invitrogen, USA). Volumes were
made up to 10 lL with autoclaved deionized water.
Amplifications were run on a PTC-200 thermocycler
(MJ Research) using the following heating profile: 3 min
at 95 �C (initial denaturing step), followed by 35 cycles
of 30–60 s at 94�C (denaturing step), 50 s at 50 �C (for
TPSCP5, rps16pm2, trnT-Lpm1) or 60 s at 55 �C (for
TPSCP1, TPSCP10) (annealing step), 1–2 min at 72 �C
(extension step) and an additional 10 min at 72 �C (final
extension step). PCR products were analysed using a
CEQ8000 Beckmann Coulter Sequencer (Beckman-
Coulter, USA) with an internal standard to measure the
size of amplified bands. A volume of 1–2 lL of sample
of each diluted PCR product was added to 0.4 lL of
size standard in 35 lL sample loading solution. Differ-
ences in the sizes of products and the use of different
fluorescent labels allowed the analysis of two to three
microsatellites in a single run.
cpDNA variation and haplotype construction
To confirm the single nucleotide repeat motif of cpSSR
variation and to avoid misinterpretations caused
through size homoplasy, various alleles from each locus
were sequenced. Sequence comparisons revealed single
nucleotide steps for loci TPSCP1, TPSCP5 and TPSCP10,
whereas both of the loci rps16pm2 and trnT-Lpm1 were
found to contain two indels of 5–26 base pairs in the
flanking region. These indels were treated as two addi-
tional loci, namely rps16pm2a and rps16pm2b, and
trnT-Lpm1a and trnT-Lpm1b. Additional length variation
at the locus rps16pm2 was not considered because it
could not be resolved to unique mononucleotide repeat
� 2010 Blackwell Publishing Ltd

PHYLOGEOGRAPHY OF PRUNUS AFRICANA 169
variation. Sequences were deposited in GenBank under
the accession numbers HM749746–HM749785.
Multilocus haplotypes were constructed by combin-
ing single loci. The number of haplotypes per popula-
tion, the effective number of haplotypes, the number of
private haplotypes and haplotype diversity were calcu-
lated using GenAlEx 6.0 (Peakall & Smouse 2006). To
account for differences in sample size, rarefaction analy-
sis of haplotype diversity was undertaken using CON-
TRIB (Petit et al. 1998), giving an improved estimate of
haplotype diversity and its standard error. As mononu-
cleotide microsatellites are potentially prone to homo-
plasy (i.e. alleles can be identical in state but not
identical by descent owing to repeated forward and
backward mutations), linkage disequilibrium (LD)
among loci (including indels) was examined following
Hale et al. (2004) using the statistic rd implemented in
the software MultiLocus 1.2 (Agapow & Burt 2001). If
the multilocus LD is significantly high, we can expect
that alleles identical in size are also identical in descent;
phylogeographic inferences should then not be affected
(Hale et al. 2004; Angioi et al. 2009).
Haplotype relationships were inferred by constructing
a statistical parsimony network following a two-step
strategy according to Banfer et al. (2006). This proce-
dure accounted for the (presumably) different mutation
rates underlying indel and microsatellite variation. First,
haplotype data from the indel variation were employed
to construct a backbone network using the programme
TCS 1.18 (Clement et al. 2000). Second, the network was
enlarged by adding the variation at microsatellite loci
manually at the respective positions of the backbone;
mononucleotide microsatellites were coded according to
a stepwise mutation model.
Population structure and phylogeography
Total gene diversity (ht) and average within population
gene diversity (hs) were calculated according to Pons &
Petit (1995, 1996) using the software PERMUT (http://
www.pierroton.inra.fr/genetics/labo/Software). To test
for the existence of phylogeographic patterns, we com-
pared the two measures of differentiation NST and GST,
which are based on ordered and unordered alleles,
respectively. A significantly higher value for NST com-
pared with GST indicates the existence of a phylogeo-
graphic structure (Pons & Petit 1996). Significance was
tested based on 1000 permutations.
To analyse relatedness among populations without a
priori hypotheses, a spatial analysis of molecular vari-
ance (SAMOVA) was applied according to Dupanloup
et al. (2002). This method is based on a simulated
annealing procedure where populations are assigned to
a defined number (K) of groups. Groups are maximally
� 2010 Blackwell Publishing Ltd
differentiated from each other but include populations
that are geographically proximate. Using pairwise dif-
ferences among haplotypes, SAMOVA generates F-statis-
tics (FSC, FST and FCT) following an AMOVA approach
(Excoffier et al. 1992). By exploring the behaviour of the
indices FCT and FSC for different values of K, it is possi-
ble to identify the optimum number of groups for a set
of populations (Dupanloup et al. 2002). One hundred
simulated annealing processes were used for each value
of K, from K = 2 to 30.
Population history and coalescence
To relate the genealogical network to colonization his-
tory and the physical characteristics of Africa and its
changes within the Holocene, we used Bayesian coales-
cence modelling of past population splitting events. The
group structure defined by SAMOVA was used to identify
the time and sequence of divergence among regional
groups. The software BATWING generates random sam-
ples from posterior distributions of a variety of popula-
tion genetic parameters, e.g. mutation rate, effective
population size and growth rate, based on coalescence
theory (Wilson et al. 2003). Because of a lack of detailed
knowledge on population demographics, we used a
simple model of constant population size, where the
prior population size follows a uniform distribution
within an interval of 10–10 000 individuals. Although
diffuse, these size limits cover the most plausible values
for N, if we consider neighbourhood sizes, gene flow
distances and densities typical for tropical trees (Hardy
et al. 2006) and other Prunus species (Schueler et al.
2006). Prior mutation rates were set according to previ-
ous reports of chloroplast loci (Provan et al. 1999). We
specified two groups of loci, both following a gamma
distribution: the indels rps16pm2a, rps16pm2b, trnT-
Lpm1a and trnT-Lpm1b were set to priors of
l = 8 · 10)5, while the mononucleotide microsatellites
TPSCP1, TPSCP5 and TPSCP10 were set to priors of
l = 3.2 · 10)5 (Afzal-Rafii & Dodd 2007) because they
showed higher variation. With these priors, 55 000 sam-
ples in total were generated, from which the first 5000
were discarded as the ‘burn-in’. Posterior parameter
distributions for mutation rate, population size, splitting
times and splitting sequence were estimated from the
output of the remaining 50 000 samples.
Results
cpDNA variation and haplotype construction
Three cpDNA microsatellites and four cpDNA indels
generated data for 582 individuals of P. africana from
32 populations. Data from all primers yielded 2–4

Table 2 Haplotype construction and frequency in 32 Prunus africana populations revealed by four cpDNA indels (Loci 1–4) and
three cpDNA microsatellites (Loci 5–7). Alleles are represented as one for the presence of fragment and two for the absence of frag-
ment in the case of the indels (Loci 1–4) and repeat numbers in the case of microsatellites (Loci 5–7)
Backbone Nt 1 2 3 4 5
Nt subdivision a b c d e f g h i j k l m n o a b a b c a a
Indels†
1 2 2 2 2 2 2 2 2 2 2 2 2 2 2 2 2 2 1 1 1 2 2
2 1 1 1 1 1 1 1 1 1 1 1 1 1 1 1 1 1 1 1 1 2 1
3 1 1 1 1 1 1 1 1 1 1 1 1 1 1 1 2 2 1 1 1 1 1
4 1 1 1 1 1 1 1 1 1 1 1 1 1 1 1 1 1 1 1 1 1 2
MS‡
5 9 10 10 10 11 8 9 9 9 9 9 9 8 8 8 8 10 9 9 9 9 10
6 9 9 9 9 9 9 10 10 9 8 8 8 8 8 8 8 8 9 10 9 9 9
7 9 9 11 12 12 11 9 10 10 9 10 11 9 10 11 9 9 9 9 10 11 11
Population§
CA 1 18
CB 19
CC 20
GQ 7 11
KA 20
KB 1 4 3 11
KC 3 12 5
KD 20
KE 14 6
KF 7 12
KG 20
KS 15 1
KT 12
MA 4 1
MB 8 25
MC 18
NG 9
SA 13 6
SB 13 4
TA 10 9
TB 4 1 7 5
TC 14
TD 16 4
TE 11 4
TT 12 1 3
UA 20
UB 20
UC 18 1
UD 13 7
ZWA 20
ZWB 20
ZWC 19
Total 178 4 13 34 12 13 38 18 23 1 7 11 87 21 18 13 7 12 25 19 19 9
†Indel loci 1,2,3,4 are rps16pm2a, rps16pm2b, trnT-Lpm1a, and trnT-Lpm1b.
‡MS-Chloroplast microsatellite loci 5, 6, 7 are TPSCP1, TPSCP5, and TPSCP10.
§Populations are Ngashie Mt. Oku (CA), Lower Mann’s Spring, Mt. Cameroon (CB), Mt. Danoua (CC), Equatorial Guinea (GQ),
Chuka (KA), Kinale (KB), Kapcherop (KC), Kakamega (KD), Londiani (KE), Ol Danyo Sambuk (KF), Taita (KG), Lari (KT), Kibiri
forest (KS), Marovoay (MA), Lakato forest (MB), Antsahabiraoka (MC), Nigeria (NG), Mpumalanga (SA), Kwazulu Natal (SB), Meru
(TA), Kilimanjaro (TB), Kindoroko (TC), Shume Magamba (TD), Kidabaga (TE), Udzungwa (TT), Kibale (UA), Kalinzu (UB), Bwindi
(UC), Mabira (UD), Nyanga (ZWA), Chimanimani (ZWB) and Chipinge (ZWC).
170 C . A . C . K A D U ET AL.
� 2010 Blackwell Publishing Ltd

Fig. 2 Genealogical network revealing 22 haplotypes con-
structed from 19 alleles obtained from four cpDNA indels
(Loci 1–4) and three cpDNA microsatellites (Loci 5–7) within
32 Prunus africana populations. Circle size is representative of
the number of individuals having each haplotype (see
Table 2).
PHYLOGEOGRAPHY OF PRUNUS AFRICANA 171
alleles per locus and 19 alleles in total. The most vari-
able cpSSR loci were TPSCP1 and TPSCP10 with four
alleles each, followed by TPSCP5 with three alleles.
Overall multilocus LD was highly significant
(rd = 0.074, P < 0.002), indicating that homoplasy plays
a minor role in explaining the observed phylogeograph-
ic pattern in comparison with migration.
Combination of loci resulted in 22 haplotypes in total
(Table 2). The predominant haplotype HT1a (frequency
31%) occurred in 13 populations of East and southern
Africa. HT1m, the second most frequent haplotype (fre-
quency 14%), occurred only in populations of western
Uganda and West Africa (Fig. 1). The genetic character-
istics of chloroplast haplotypes in populations are shown
in Table 1. The number of haplotypes (Na) per popula-
tion ranged from one to four with an average of two,
with populations from the East African region harbour-
ing the highest number of haplotypes. Nine haplotypes
were private to single populations, while 13 occurred in
two or more stands. The island of Bioko (GQ) and one
population from Uganda (UD) each had two private
haplotypes (GQ: HT1k and HT1l; UD: 2a and 2b) and did
not share haplotypes with other populations. Fourteen
populations revealed only one haplotype. The highest
haplotype diversity (He) of 0.728 was found in the Tanza-
nian population from Mt. Kilimanjaro, followed by the
Kenyan population Kinale (He = 0.626).
The relationship between haplotypes is demonstrated
by the genealogical network given in Fig. 2. The back-
bone of the network consists of five main haplotypes
(denoted HT1–HT5), of which HT1 is the dominant type
on mainland Africa. Haplotypes of the HT3 family (3a–
3c) form a geographically distinct group in Madagascar.
The most common types HT1a and HT1m are separated
only by two mutational steps but are geographically dis-
tributed either in the ‘east’ or ‘west’ African populations,
respectively. HT1a and the haplotypes HT1b–HT1i can
be found only in east (excluding Uganda) from here
henceforth referred to as ‘east’ African populations and
southern African populations, whereas populations from
the eastern side of the Albertine Rift Valley in Uganda
and the western part of Africa contain haplotypes related
to HT1m (HT1j–HT1n) from here henceforth referred to
as ‘west’ African populations.
Population structure and phylogeography
The total gene diversity (ht) of 0.886 (SE = 0.0376) was
more than three times higher than the mean within
population diversity (hs) of 0.234 (SE = 0.0432), suggest-
ing high genetic differentiation among populations. This
was also demonstrated by the high levels of
differentiation of ordered (NST) and unordered (GST)
alleles (0.840, SE = 0.0395 and 0.735, SE = 0.0481, respec-
� 2010 Blackwell Publishing Ltd
tively). NST was significantly higher than GST (P < 0.01),
indicating a phylogeographic pattern for P. africana.
Spatial analysis of molecular variance revealed a con-
tinuous increase in FCT values from K = 2 to K = 20,
again demonstrating the high differentiation among
populations. FCT values remained constant for K > 20
groups. Table 3 shows groupings for different values of
K. Continuous bold lines depict barriers that remained
constant from low to high numbers, while dotted bold
lines depict barriers that occasionally disappear. Finer
lines show boundaries that appear only at higher values
of K (>14). The clearest spatial-genetic group is formed
by the three populations from Madagascar, because
their grouping is stable from K = 6 upwards. Interest-
ingly, three populations from western Uganda group
with the West Africa stands rather than other geograph-
ically proximate populations from East Africa. The East
African region shows the highest heterogeneity, where
for K = 2, a barrier was already found. The mainland
southern region is closely related to the East African
region, but within the mainland southern region popu-
lations are much less differentiated. The distribution of
molecular variance to populations, populations within
groups and groups is shown in Table 4; with increasing
K, variation among populations within groups
decreased and variation among groups increased.

Ta
ble
3G
enet
icst
ruct
ure
amo
ng
Pru
nu
saf
rica
na
po
pu
lati
on
sas
anal
yse
db
ysp
atia
lan
aly
sis
of
mo
lecu
lar
var
ian
ce(S
AM
OV
A).
Incr
easi
ng
val
ues
of
FC
Tfr
om
K=
2to
20g
rou
ps
are
sho
wn
.T
he
gro
up
ing
sfo
rd
iffe
ren
tv
alu
eso
fK
are
ind
icat
edb
yli
ne
dem
arca
tio
ns.
Ind
icat
edg
rou
pin
gs
rela
teto
geo
gra
ph
ico
rig
in
Table 4 Analysis of variance of population structure of 32
Prunus africana populations based on spatial analysis of molec-
ular variance (SAMOVA) structure analysis using K = 2 to 20
groups
K vg vpg vp FSC FST FCT
2 52.89 38.6 8.47 0.82 0.92 0.53
4 59.49 28.2 12.3 0.7 0.88 0.6
6 66.71 20.1 13.2 0.6 0.87 0.67
8 70.02 16.7 13.3 0.56 0.87 0.7
10 72.71 13 14.3 0.48 0.86 0.73
12 74.17 10.9 14.9 0.42 0.85 0.74
14 78.05 7.01 15 0.32 0.85 0.78
16 79.27 5.45 15.3 0.26 0.85 0.79
18 79.51 4.91 15.6 0.24 0.84 0.8
20 82.5 1.91 15.6 0.11 0.84 0.83
K, number of groups; vg, variation within groups; vpg,
variation of populations within groups; vp, variation within
populations; FSC, differentiation among populations within
groups; FST, differentiation among populations; FCT,
differentiation among groups of populations.
172 C . A . C . K A D U ET AL.
Population history and coalescence
For coalescence modelling of P. africana, populations
were aggregated into K = 6 regional groups according
to the spatial-genetic structure observed in SAMOVA; this
grouping provided an unbiased clustering of popula-
tions with a clear geographic distribution. To calculate
estimates for the time of splitting events, we converted
coalescent units given by BATWING into years by multi-
plying the population size given by the program with
the generation time (GT) of P. africana, which was
assumed to be 8 years at the lower limit and 15 years at
the upper limit (Hall et al. 2000).
The two most recent splitting events with a node sup-
port of more than 80% were found to have occurred
among populations of eastern and southern Africa
(Fig. 3). The estimated confidence limit for the time of
these population splitting events assuming a GT of
8 years ranged from 21 000 years before present (BP) to
1500 years BP for the second youngest split and from
6500 years BP until today for the youngest split, respec-
tively (see Table 5 and Fig. 4). The splitting among
‘west’ African groups (including populations from
Uganda) also received high node support (48%) and
dates either to the second, third or fourth oldest split-
ting event to times between 1400 and 67 000 years BP
(GT = 15: 2700–125 000 years). The split between Mada-
gascar and all East and South African groups dates to
the second and third oldest splitting events (from 7800
to 67 000 years BP using GT = 8 and from 14 600 to
125 000 years using GT = 15) and receives a node sup-
port of about 40%. Other potential splitting events at
the second or third oldest splitting event receive a node
� 2010 Blackwell Publishing Ltd

Fig. 3 Node support for various population splitting events identified by coalescence modelling using a Bayesian analysis. Only
splitting events with a node support of more than 5% are shown.
Table 5 Results of coalescence modelling using a Bayesian
analysis. Upper and lower 5% quantiles, mean and standard
deviation of a posteriori estimates of ancestral population size
(N) and mutation rates (l) are given
Quantile
5% Mean
Quantile
95%
Standard
deviation
Ancestral population size
N 3807 6419 9290 1663
Posterior mutation rates
l (loci 1–4) 1.94 · 10)5 3.57 · 10)5 5.74 · 10)5 1.18 · 10)5
l (loci 5–7) 8.10 · 10)5 12.06 · 10)5 16.93 · 10)5 2.72 · 10)5
Fig. 4 Time of population splitting events identified by coales-
cence modelling using a Bayesian analysis for two estimates of
generation time (8 years, solid line; 15 years, broken line). The
graph gives the upper and lower 5% quantiles and the mean
of the time estimates. In descending order, the upper line iden-
tifies the oldest event and the lowest one the youngest event.
PHYLOGEOGRAPHY OF PRUNUS AFRICANA 173
support of <20%, suggesting branching among groups
of ‘east’ and ‘west’ Africa occurred concurrently.
Discussion
In this study, we investigated the phylogeography of
P. africana as a model species to derive vegetation
� 2010 Blackwell Publishing Ltd
history of Afromontane forests. We detected high popu-
lation differentiation and significant phylogeographic
structure within the species. Populations from West
Africa were closely related to populations from Uganda.
This finding provides strong evidence for a former
migration corridor between ‘east’ and ‘west’ African
populations.
Genetic diversity and population structure
Compared to other tree species from Africa, the
observed differentiation among populations (GST =
0.735) is relatively high and comparable to that found
in Adansonia digitata (GST = 0.97; Pock Tsy et al. 2009)
and Hagenia abyssinica (GST = 0.899; Ayele et al. 2009),
although the observed within population diversity is
higher in P. africana (hs = 0.237) than in either Adansonia
(hs = 0.017) or Hagenia (hs = 0.079), maybe attributed to
the lower sample size in these studies. Also, tropical
species from South America show similar high patterns
of differentiation, e.g. Cedrela odorata (GST = 0.96; Cavers
et al. 2004) and Vouacapoua americana (GST = 0.89; Du-
tech et al. 2000).
In contrast, other range-wide cpDNA studies on
Rosaceous trees (e.g. from Europe) show markedly
lower genetic differentiation among populations, but
higher within population diversity, e.g. P. avium
(GST = 0.29; hs = 0.33; Mohanty et al. 2001), P. spinosa
(GST = 0.32; hs = 0.49; Mohanty et al. 2002) and Sorbus
torminalis (GST = 0.33, hs = 0.39; Oddou-Muratorio et al.
2001). Differences may be explained by either different
seed dispersal mechanisms or different population his-
tories. Seed dispersal mechanisms play a crucial role in
shaping distributions of haplotype diversity and genetic

Fig. 5 Hypothesized migration route of Prunus africana as
deduced from coalescence modelling and the observed phylog-
eographic—genetic structure. Black solid arrows indicate the
hypothetical route according to the present study, the black
broken arrow indicates Aubreville’s path of immigration of the
genus Prunus into Africa (Aubreville 1976). The putative
migration paths to West Africa are shown by thin broken
arrows: 1—split of eastern and western populations during
southward migration at the southern fringe of the Ethiopian
highlands, subsequently: 1a—migration from the Albertine Rift
to West Africa via a northern connection; 1b—southern migra-
174 C . A . C . K A D U ET AL.
differentiation (Petit et al. 1993b, 2003; Demesure et al.
1996; Dumolin-Lapegue et al. 1997). Farwig et al. (2006)
listed 36 frugivorous birds and mammals with body
sizes of 10–80 cm as seed dispersers for P. africana.
These dispersers should facilitate short- and medium-
distance seed dispersal at least as efficiently as seed dis-
persers of Prunus species in Europe. Therefore, we
rather believe that differences in the population history
of P. africana and European Prunus species are responsi-
ble for the stronger differentiation in the former. Euro-
pean Rosaceous tree populations have been affected by
ice ages and recent (within the last 10 000 years) post-
glacial recolonization of central and northern European
areas, whereas within the same period P. africana is
likely to have experienced only smaller altitudinal range
shifts. In comparison with latitudinal range shifts where
a loss of genetic diversity attributed to repeated bottle-
necks can occur (Hewitt 1996), range shifts in mountain
regions occur over much shorter geographic distances,
and population sizes may be more stable, thereby main-
taining diversity (Ehrich et al. 2007). The isolation of
mountain massifs from each other might limit gene
flow and facilitate differentiation in local populations
(Hewitt 2000). Thus, the history of single populations in
Africa is doubtless much older than that of European
Rosaceous tree populations. Similar strong differentia-
tion patterns were found for Afroalpine populations of
Arabis alpina in a comparison with European and Arctic
populations (Ehrich et al. 2007).
tory tract (SMT) following White (1993); 2—independent colo-nization of West Africa via a northern migration corridor and
subsequent colonization of the Albertine Rift from West Africa.
The grey arrow indicates ocean currents involved in the possi-
ble dispersal to Madagascar. Black dots represent locations
where population sampling was carried out in this study. The
bold bar indicates the putative barrier between eastern and
western lineage created by the upper river Nile and Lake
Victoria basins.
Phylogeography of Prunus africana—migration anddispersal within Africa
Mountain ranges that provide habitats for Afromontane
species today were formed within the late Pliocene and
throughout the Pleistocene (Hedberg 1994). During the
Pleistocene, several Afroalpine species colonized Africa
from Asia through the coastal mountain ranges of the
Arabian Peninsula (Koch et al. 2006). According to
Aubreville (1976), P. africana could have followed a simi-
lar path based on the putative Laurasian origin of the
genus Prunus. Our study was not able to provide data on
the original immigration path of P. africana into the Afri-
can continent as populations are not extant in the Ara-
bian Peninsula and palaeoecological evidence is not
available. However, our data provide the first significant
insights into the population history of P. africana within
mainland Africa and its neighbouring islands, as a signif-
icant signal for phylogeographic pattern was found.
Supported by Bayesian analysis where splitting
events between Madagascar and other African popula-
tions were estimated to be among the oldest, popula-
tions from Madagascar were found to be genetically
most distinct, suggesting an early split from the main
lineage. As the separation of Madagascar from Africa
was completed 100 Ma, (long before P. africana reached
Africa), the colonization of Madagascar may reflect
early and possibly unique dispersal events facilitated by
birds or the southern Monsoon drift or the Mozambique
current (Fig. 5).
On mainland Africa, a clear division between western
populations (including Ugandan populations east of the
Albertine Rift valley) and stands in eastern and south-
ern Africa was detected. The haplotype sharing
between West African and Ugandan populations sug-
gests the former existence of a migration corridor from
east to west. Although the exact migration routes to
West Africa cannot to be determined at present, our
data support two scenarios: (i) a split during southward
migration of P. africana at the southern fringe of the
� 2010 Blackwell Publishing Ltd

PHYLOGEOGRAPHY OF PRUNUS AFRICANA 175
Ethiopian highlands (Fig. 5, route 1) with migration of
Albertine Rift valley populations to West Africa (route
1a, 1b); or (ii) the independent colonization of West
Africa via a northwestern migration corridor and the
subsequent colonization of western Uganda from West
Africa (route 2). Both scenarios imply that a strong bar-
rier for gene flow has existed within East Africa and
that the distribution range of P. africana included large
areas of Central Africa at one time, where presently no
populations exist (Hall et al. 2000).
The first scenario of colonization from the Albertine
Rift to West Africa is supported by the relatively small
genetic distances (<4 mutations) among the haplotypes
found in West Africa, which suggests that all six
observed haplotypes originate from the dominant type
HT1m. In contrast, the various haplotypes found in
East Africa have a deeper root with up to five muta-
tions among them and include other main backbone
lineages. Thus, the high haplotype diversity found in
West Africa could be a result of younger differentiation
events coupled with isolated mountain habitats that
facilitated the fixation of newly mutated types. In con-
trast, further differentiation at the Albertine Rift may
have been prevented by regular seed exchange. The
colonization from East to West could have been
through either the SMT as defined according to White
(1981) or through a more northern direct connection.
Our data suggest a more direct connection as the SMT,
if it functioned as a bridge, must have originated south
of Lake Tanganyika. Here, the Albertine Rift and the
Eastern Rift meet and this should have provided
chance for lineage mixing: i.e. populations from West
Africa would then also be expected to contain haplo-
types from the eastern lineage. On the other hand, the
absence of such haplotypes in the west could be
explained by the later splitting events of the east and
southern populations compared with the splitting
events between the ‘east’ and ‘west’ African popula-
tions. More data from populations sampled south of
the Albertine Rift and following the SMT would be
needed to resolve this definitively.
Under the second scenario, P. africana could have
migrated directly from the Ethiopian highlands to
West Africa, possibly using the Marra Mountains
(Sudan) as stepping stones (cf. Wickens 1976). Thereafter,
subsequent colonization of Uganda from West Africa
could have occurred. This route would provide an
alternative explanation for the lower diversity shown in
the Albertine Rift valley populations. As there is no
extant Afromontane forest or P. africana in the central
African regions that must have been crossed, only an
extensive phylogeographic study of populations from
Ethiopian highlands could shed further light on this
second hypothesis.
� 2010 Blackwell Publishing Ltd
As key barriers to dispersal in the early population
history of the species we suggest the upper river Nile
basin and the Lake Victoria basin, because these areas
experienced severe drought conditions before 12 000 BP
(Livingstone 1975) and probably also earlier in the
Pleistocene. According to pollen analysis and radiocar-
bon data of lake sediments, the water level of Lake
Victoria at 14 000 BP was between 26 and 75 m lower
than today, and the surrounding landscape was likely
too dry for P. africana and characterized mainly by
open vegetation (Livingstone 1975). About 10 000 years
BP evergreen rainforest expanded into the region, which
again likely did not provide suitable habitat. Today, the
river Nile basin with Lake Kyoga and its surrounding
extensive marshy areas are still not suitable habitat for
Afromontane forest, although the climate has been
somewhat dryer since 6000 years BP, facilitating more
semideciduous forest (Livingstone 1975). Another rea-
son for past absence of P. africana in this part of
Uganda may be the relatively flat terrain, which did not
allow for altitudinal range shifts during past climatic
fluctuations. Within the adjacent rift valleys and moun-
tain ranges, such range shifts might have supported the
survival of populations during the unstable climatic his-
tory. Our data do not support the suggestion of
Muchugi et al. (2006) who from a study based on
RAPD markers of Cameroonian, Kenyan, and Ugandan
populations of P. africana concluded that the Eastern
Rift Valley acted as a barrier to gene flow, because in
our case on either side of both branches of the Rift simi-
lar chloroplast haplotypes occurred: HT1a east and west
of the Eastern Rift Valley, and HT1m east and west of
the Albertine Rift.
Our data on the close relationship between Albertine
Rift and west African populations of P. africana corre-
spond with ecological comparisons between east and
west African ornithological and entomological records.
Already in the 1960s, Moreau (1966) suggested that
montane vegetation belts were depressed to lower ele-
vations connecting east and west African mountain
regions during the last glacial period, although Living-
stone (1975) doubted that such a belt existed. Based on
data from palynological records from the last
15 000 years, Livingstone (1975) rather argued that for-
est trees were extremely rare in mountain regions and
at lower altitudes during the LGM. Instead, he
explained ecological affinities by the high migration
capacity of birds and butterflies and suggested smaller
isolated habitats to have served as stepping stones.
Although P. africana is a typical species of Afromontane
forest, it has also been reported to inhabit elevations
below the montane zone (Hall et al. 2000). It is difficult
to conclude whether such site conditions would have
allowed spread across a distance of around 2000 km,

176 C . A . C . K A D U ET AL.
but future genetic studies of additional wide-spread
Afromontane species should help to shed more light on
past montane vegetation belts.
Our proposed migration paths and splits were well
supported by both the genealogical network and the
Bayesian simulations of coalescence. In general, the
Bayesian simulations provided a broad estimate of split-
ting times for events. There is for example considerable
overlap between the three oldest splitting events
(Fig. 4). Although the uncertainties in estimating GT,
population size and mutation rate limit the accuracy of
the obtained splitting times, they elucidate the sequence
of events. For example, the two most recent splits are
sharply different from the older ones. Using the range
of GTs given in the literature (Hall et al. 2000), the time
of the population splits varies by a factor of 2–4. The
overall time frame of the simulations shows that the
complete colonization of the investigated distribution of
P. africana has most likely occurred within the last
100 000–180 000 years. On a global scale, this time per-
iod is known as the last glaciation period, suggesting
that the colonization of eastern and western Africa by
P. africana occurred mainly during colder climatic epi-
sodes. This study has provided evidence on the phylog-
eography of P. africana and on a past migration
corridor between Afromontane forests; to investigate
further aspects in colonization dynamics, sampling is
suggested in the Ethiopian highlands and in the south-
western ⁄ central African range.
Acknowledgements
We thank our national partners for carrying out the sample
collections. This research was financed by the Austrian Devel-
opment Agency through collaboration between BFW and Bio-
versity International. We kindly acknowledge colleagues in
Cameroon, Alistair Jump, Stephen Cavers and Hazel Chapman
for supplying us initial test samples and additional popula-
tions. We thank three anonymous referees and Ian Dawson for
helpful comments on the content of a former version of this
manuscript and improvements in style.
References
Afzal-Rafii Z, Dodd RS (2007) Chloroplast DNA supports a
hypothesis of glacial refugia over postglacial recolonization
in disjunct populations of black pine (Pinus nigra) in Western
Europe. Molecular Ecology, 16, 723–736.
Agapow P-M, Burt A (2001) Indices of multilocus linkage
disequilibrium. Molecular Ecology Notes, 1, 101–102.
Angioi SA, Desiderio F, Rau D, Bitocchi E, Attene G, Papa R
(2009) Development and use of chloroplast microsatellites in
Phaseolus spp. and other legumes. Plant Biology, 11, 598–612.
Aubreville A (1976) Centres tertiaires d’origine, radiations et
migrations des flores angiospermiques tropicales. Adansonia,
serie 2, 16, 297–354.
Ayele TB, Gailing O, Umer M, Finkeldey R (2009) Chloroplast
DNA haplotype diversity and postglacial recolonization of
Hagenia abyssinica (Bruce) J.F. Gmel. in Ethiopia. Plant
Systematics and Evolution, 280, 175–185.
Banfer G, Moog U, Fiala B, Mohamed M, Weising K, Blattner
FR (2006) A chloroplast genealogy of myrmecophytic
Macaranga species (Euphorbiaceae) in Southeast Asia reveals
hybridization, vicariance and long-distance dispersals.
Molecular Ecology, 15, 4409–4424.
Birky CW, Fuerst P, Maruyama T (1989) Organelle gene diver-
sity under migration, mutation, and drift: equilibrium expec-
tations, approach to equilibrium, effects of heteroplasmic cells,
and comparison to nuclear genes. Genetics, 121, 613–627.
Caratini C, Giresse P (1979) Contribution palynologique a la
connaissance des environnements continentaux et marins du
Congo a la fin du quaternaire. Comptes Rendus de l‘Academie
des Sciences. Paris, serie D, 288, 379–382.
Castaneda IS, Werne JP, Johnson TC, Filley TR (2009) Late
Quaternary vegetation history of southeast Africa: the molec-
ular isotopic record from Lake Malawi. Palaeogeography,
Palaeoclimatology, Palaeoecology, 275, 100–112.
Cavers S, Navarro C, Lowe AJ (2004) Targeting genetic resource
conservation in widespread species: a case study of Cedrela
odorata L. Forest Ecology and Management, 197, 285–294.
Chester M, Cowan RS, Fay MF, Rich TCG (2007) Parentage of
endemic Sorbus L. (Rosaceae) species in the British Isles:
evidence from plastid DNA. Botanical Journal of the Linnean
Society, 154, 291–304.
Clement M, Posada D, Crandall KA (2000) TCS: a computer
program to estimate gene genealogies. Molecular Ecology, 9,
1657–1660.
Coetzee JA, Van Zinderen Bakker EM (1970) Paleoecological
problems of the Quaternary of Africa. South African Journal of
Science, 66, 78–84.
Cunningham M, Cunningham AB, Schippmann U (1997) Trade
in Prunus africana and the Implementation of CITES.
Bundesamt fur Naturschutz, Bonn, Germany.
Demesure B, Comps B, Petit RJ (1996) Chloroplast DNA
phylogeography of the common beech (Fagus sylvatica L.) in
Europe. Evolution, 50, 2515–2520.
Dumolin-Lapegue S, Demesure B, Le Corre V, Fineschi S, Petit
RJ (1997) Phylogeographic structure of white oaks through-
out the European continent. Genetics, 146, 1475–1487.
Dupanloup I, Schneider S, Excoffier L (2002) A simulated
annealing approach to define genetic structure of popula-
tions. Molecular Ecology, 11, 2571–2581.
Dutech C, Maggia L, Joly HI (2000) Chloroplast diversity in
Vouacapoua americana (Caesalpiniaceae), a neotropical forest
tree. Molecular Ecology, 9, 1427–1432.
Ehrich D, Gaudeul M, Assefa A et al. (2007) Genetic
consequences of Pleistocene range shifts: contrast between
the Arctic, the Alps and the East African mountains.
Molecular Ecology, 16, 2542–2559.
Elenga H (1987) Les Plateaux Bateke (Congo). Paleoenvironnements
Quaternaries d’apres l’etude du sondage du bois de Bilanko.
Diplome d’Etudes Approfondies, Universite d’Aix-Marseille II,
Marseille, 41 pp.
Excoffier L, Smouse PE, Quattro JM (1992) Analysis of
molecular variance inferred from metric distances among
DNA haplotypes: application to human mitochondrial DNA
restriction data. Genetics, 131, 479–491.
� 2010 Blackwell Publishing Ltd

PHYLOGEOGRAPHY OF PRUNUS AFRICANA 177
Farwig N, Bohning-Gaese K, Bleher B (2006) Enhanced seed
dispersal of Prunus africana in fragmented and disturbed
forests? Oecologia, 147, 238–252.
Farwig N, Braun C, Bohning-Gaese K (2008) Human disturbance
reduces genetic diversity of an endangered tropical tree,
Prunus africana (Rosaceae). Conservation Genetics, 9, 317–321.
Finch J, Leng MJ, Marchant R (2009) Late Quaternary
vegetation dynamics in a biodiversity hotspot, the Uluguru
Mountains of Tanzania. Quaternary Research, 72, 111–122.
Geldenhuys CJ (1981) Prunus africana in the Bloukrans River
George Southern Cape. South African Forestry Journal, 118,
61–66.
Hale ML, Borland AM, Gustafsson MAG, Wolff K (2004)
Causes of size homoplasy among chloroplast microsatellites
in closely related Clusia species. Journal of Molecular
Evolution, 58, 182–190.
Hall JB (1973) Vegetational zones on the southern slopes of
Mount Cameroon. Vegetatio, 27, 49–69.
Hall JB, O’Brien EM, Munjuga M (2000) Ecology and biology.
In: Prunus africana: A Monograph. School of Agricultural and
Forest Sciences, vol. 18 (eds Hall JB, O’Brien EM, Sinclair FL),
pp. 3–25. University of Wales, Bangor.
Hall J, Burgess ND, Lovett J, Mbilinyi B, Gereau RE (2009)
Conservation implications of deforestation across an
elevational gradient in the Eastern Arc Mountains, Tanzania.
Biological Conservation, 142, 2510–2521.
Hardy OJ, Maggia L, Bandou E et al. (2006) Fine-scale genetic
structure and gene dispersal inferences in 10 Neotropical
tree species. Molecular Ecology, 15, 559–571.
Hedberg O (1969) Evolution and speciation in a tropical high
mountain flora. Biological Journal of the Linnean Society, 1,
135–148.
Hedberg O (1994) Afroalpine region. East and northeast
tropical Africa. In: Centres of Plant Diversity: A Guide and
Strategy for their Conservation (eds Davis SW, Heywood VH,
Hamilton AC), pp. 253–256. Information Press, Oxford.
Hewitt GM (1996) Some genetic consequences of ice ages, and
their role in divergence and speciation. Biological Journal of
the Linnean Society, 58, 247–276.
Hewitt GM (2000) The genetic legacy of the Quaternary ice
ages. Nature, 405, 907–913.
Ishigawa S, Kato S, Imakawa S, Mikami T, Shimamoto Y (1992)
Organelle DNA polymorphism in apple cultivars and
rootstocks. Theoretical and Applied Genetics, 83, 963–967.
Kalkman C (1988) The phylogeny of the Rosaceae. Botanical
Journal of the Linnean Society, 98, 37–59.
Koch MA, Kiefer C, Ehrich D, Vogel J, Brochmann C,
Mummenhoff K (2006) Three times out of Asia Minor: the
phylogeography of Arabis alpina L. (Brassicaceae). Molecular
Ecology, 15, 825–839.
Livingstone DA (1975) Late Quaternary climate change in
Africa. Annual Review of Ecology and Systematics, 6, 249–280.
Maley J (1987) Fragmentation de la foret dense humide afri-
caine et extension des biotopes montagnards au quaternaire
recent: nouvelles donnees polliniques et chronologiques.
Implications paleoclimatiques et biogeographiques. Palaeoe-
cology of Africa, 18, 307–334.
Maley J (1989) Late Quaternary climatic changes in the African
rain forest: forest refugia and the major role of sea surface
temperature variations. In: Paleoclimatology and Paleometeorol-
ogy: Modern and Past Patterns of Global Atmospheric Transport
� 2010 Blackwell Publishing Ltd
NATO Advances Sc. Inst. Series, C, Math. & Phys. Sc., 282
(eds Leinen M, Sarnthein M), pp. 585–616. Kluwer Academic
Publishers, Dordrecht.
Maley J (1991) The African Rain Forest vegetation and
palaeoenvironments during late Quaternary. Climatic Change,
19, 79–98.
Matsumoto S, Wakita H, Fukui H (1997) Molecular
classification of wild roses using organelle DNA probes.
Scientia Horticulturae, 68, 191–196.
McCauley DE (1995) The use of chloroplast DNA polymor-
phism in studies of gene flow in plants. Trends in Ecology and
Evolution, 10, 198–202.
McCauley DE, Smith RA, Lisenby JD, Hsieh C (2003) The
hierarchical spatial distribution of chloroplast DNA
polymorphism across the introduced range of Silene vulgaris.
Molecular Ecology, 12, 3227–3235.
Mohanty A, Martın JP, Aguinagalde I (2001) A population
genetic analysis of chloroplast DNA in wild populations of
Prunus avium L. in Europe. Heredity, 87, 421–427.
Mohanty A, Martın JP, Aguinagalde I (2002) Population
genetic analysis of European Prunus spinosa (Rosaceae) using
chloroplast DNA markers. American Journal of Botany, 89,
1223–1228.
Moreau RE (1966) The Birds Faunas of Africa and its Islands.
Academic Press, New York, 424 pp.
Muchugi A, Lengkeek AG, Kadu CAC, Muluvi GM, Njagi
ENM, Dawson IK (2006) Genetic variation in the threatened
medicinal tree Prunus africana in Cameroon and Kenya:
implications for current management and evolutionary
history. South African Journal of Botany, 72, 498–506.
Nevill PG, Bossinger G, Ades PK (2010) Phylogeography of the
world’s tallest angiosperm, Eucalyptus regnans: evidence for
multiple isolated Quaternary refugia. Journal of Biogeography,
37, 179–192.
Oddou-Muratorio S, Petit RJ, Le Guerroue B, Guesnet D,
Demesure B (2001) Pollen versus seed-mediated gene flow in
a scattered woody species, Sorbus torminalis L. (Crantz).
Evolution, 55, 1123–1135.
Ohta S, Nishitani C, Yamamoto T (2005) Chloroplast microsate-
llites in Prunus, Rosaceae. Molecular Ecology Notes, 5, 837–840.
Peakall R, Smouse PE (2006) GENALEX 6: genetic analysis in
Excel. Population genetic software for teaching and research.
Molecular Ecology Notes, 6, 288–295.
Petit RJ, Kremer A, Wagner DB (1993a) Finite island model for
organelle and nuclear genes in plants. Heredity, 71, 630–641.
Petit RJ, Kremer A, Wagner DB (1993b) Geographic structure
of chloroplast DNA polymorphisms in European oaks.
Theoretical and Applied Genetics, 87, 122–128.
Petit RJ, El Mousadik A, Pons O (1998) Identifying populations
for conservation on the basis of genetic markers. Conservation
Biology, 12, 844–855.
Petit RJ, Aguinagalde I, de Beaulieu J-L et al. (2003) Glacial
refugia: hotspots but not melting pots of genetic diversity.
Science, 300, 1563–1565.
Pock Tsy JML, Lumaret R, Mayne D et al. (2009) Chloroplast
DNA phylogeography suggests a West African centre of
origin for the baobab, Adansonia Digitata L. (Bombacoideae,
Malvaceae). Molecular Ecology, 18, 1707–1715.
Pons O, Petit RJ (1995) Estimation, variance and optimal
sampling of gene diversity. I. Haploid locus. Theoretical and
Applied Genetics, 90, 462–470.

178 C . A . C . K A D U ET AL.
Pons O, Petit RJ (1996) Measuring and testing genetic
differentiation with ordered versus unordered alleles.
Genetics, 144, 1237–1245.
Provan J, Soranzo N, Wilson NJ, Goldstein DB, Powell W
(1999) A low mutation rate for chloroplast microsatellites.
Genetics, 153, 943–947.
Schueler S, Tusch A, Scholz F (2006) Comparative analysis of
the within-population genetic structure in wild cherry
(Prunus avium L.) at the self-incompatibility locus and
nuclear microsatellites. Molecular Ecology, 15, 3231–3243.
Simons AJ, Dawson IK, Duguma B, Tchonndjeu Z (1998) Passing
problems: prostrate and Prunus. Herbalgram, 43, 49–53.
Van Zinderen Bakker EM, Clarke JD (1962) Pleistocene
climates and cultures in North Eastern Angola. Nature, 196,
639–642.
Vendramin GG, Ziegenhagen B (1997) Characterisation and
inheritance of polymorphic plastid microsatellites in Abies.
Genome, 40, 857–864.
Vornam B, Gebhardt K (2000) PCR-based markers reveal
genetic identity and diversity in subset collections of wild
and cultivated apple. Acta Horticulturae, 530, 463–467.
White F (1981) The history of the Afromontane archipelago
and the scientific need for its conservation. African Journal of
Ecology, 19, 33–54.
White F (1983) Long-distance dispersal and the origins of the
Afromontane flora. Sonderbande des Naturwissenschaftlichen
Vereins in Hamburg, 7, 87–116.
White F (1993) Refuge theory, ice-age aridity and the history of
tropical biota: an essay in plant geography. Fragmenta
Floristica et Geobotanica Supplement, 2, 385–409.
Wickens GE (1976) Speculations on long distance dispersal and
the flora of Jebel Marra, Sudan Republic. Kew Bulletin, 31,
105–150.
Wilson IJ, Weale ME, Balding DJ (2003) Inferences from DNA
data: population histories, evolutionary processes and
forensic match probabilities. Journal of the Royal Statistical
Society A, 166, 155–201.
CK is interested in the population genetics and phylogeo-
graphy of forest trees. This work constitutes part of her PhD
carried out at BFW and Kenyatta University, Nairobi, Kenya.
SS, HK and TG from the Department of Genetics at the BFW
have long standing interests in plant evolutionary biology. GM
is a professor at Kenyatta University in Biochemistry and Bio-
technology and has interests in population genetics. OE-M
works on forest plant genetic resources. AM has interests in
agroforestry species as well as tree population genetics and
biotechnology, VW has interests in Ethnobotany and Indige-
nous Plant Use and LR, CK, BF, CK, DH and CO are interested
in management and conservation of African tree species.
� 2010 Blackwell Publishing Ltd