Phylogeny of major lineages in Melastomataceae, subfamily Olisbeoideae: utility of nuclear...
15
107 Systematic Botany (2006), 31(1): pp. 107–121 Copyright 2006 by the American Society of Plant Taxonomists Phylogeny of Major Lineages in Melastomataceae, Subfamily Olisbeoideae: Utility of Nuclear Glyceraldehyde 3-Phosphate Dehydrogenase (GapC) Gene Sequences ROBERT DOUGLAS STONE University and Jepson Herbaria and Department of Integrative Biology, 1001 Valley Life Sciences Building #2465, University of California, Berkeley, California 94720-2465 Current address: Department of Systematic Botany, Evolutionary Biology Centre, Uppsala University, Norbyva ¨gen 18D, SE-752 36 Uppsala, Sweden ([email protected]) Communicating Editor: Wendy B. Zomlefer ABSTRACT. Evidence is presented for phylogenetic relationships in pantropical Melastomataceae, subfamily Olisbeoideae based on combined exon and intron sequences of the nuclear glyceraldehyde 3-phosphate dehydrogenase gene. Parsimony and maximum-likelihood analyses yielded a well-supported ingroup tree consistent with earlier morphologically based concepts of six genera—Memecylon, Mouriri, Votomita, Spathandra, Lijndenia, and Warneckea. The position of the root node in Olisbeoideae remains equivocal. Outgroup-rooted maximum parsimony suggests a deep divergence between Old and New World lineages, while the maximum-likelihood rooting resolved paleotropical genera as a paraphyletic grade basal to the neotropical taxa. The Fitch optimization method for estimating character evolution consistently inferred the strongly acrodro- mous leaf venation pattern as ancestral in Olisbeoideae, reinforcing the conclusion that the superficially uninervate or bro- chidodromiform venation pattern of Memecylon, the neotropical subclade, and some Lijndenia and Warneckea species is best interpreted as a series of independent losses of the strongly acrodromous condition. Genomic GapC sequences may have phylogenetic utility at intergeneric level in other angiosperm families, particularly those that have low apparent rates of chloroplast DNA sequence evolution. Sequences from the chloroplast genome and the in- ternal transcribed spacer (ITS) region of nuclear ribo- somal DNA have been used extensively in plant phy- logenetic studies over the past decade. Yet the inherent rates of sequence evolution in these DNA regions place limits on their phylogenetic informativeness at differ- ent taxonomic levels (e.g., Soltis and Soltis 1998). Mu- tations in chloroplast sequences tend to accumulate more slowly than in nuclear DNA (e.g., Wolfe et al. 1987), and even in the relatively fast-evolving matK gene and non-coding regions, the amount of variation may be insufficient for robust resolution of phyloge- netic relationships within some angiosperm families (but see Shaw et al. 2005). ITS sequences, on the other hand, are generally informative at or near the species level and may be unalignable at deeper levels or may exhibit excessive homoplasy (e.g., Baldwin et al. 1995). Increased emphasis is now on assessing utility of phylogenetic markers from low-copy regions of the nu- clear genome (reviewed by Sang 2002; Small et al. 2004), such as the glyceraldehyde 3-phosphate dehy- drogenase (GapC) gene that codes for one of the key enzymes in glycolysis (EC 1.2.1.12). In Arabidopsis thal- iana (L.) Heynh., the length of the GapC region is 2.7 kb and spans nine exons along with eight short inter- vening introns (ref. GenBank accession M64119). In ad- dition to the roughly equal number of coding and non- coding sites, the potential utility of GapC at both shal- low and deeper phylogenetic levels is suggested by re- sults from earlier plant phylogenetic studies. Martin et al. (1993) applied protein-coding sequences from this region to interfamilial relationships in angiosperms and found a low substitution rate (comparable to that of the chloroplast gene rbcL). Partial genomic GapC se- quences were subsequently used in population studies of Manihot esculenta Crantz (Euphorbiaceae; Olsen and Schaal 1999) and Amsinckia spectabilis Fisch. & C.A. Mey. (Boraginaceae; Pe ´russe and Schoen 2004). Wall (2002) combined GapC exon and intron sequences in a species-level analysis of the paleotropical moss genus Mitthyridium H. Robinson (Calymperaceae). The aim of the current study is to reconstruct phy- logenetic relationships among major lineages of Me- lastomataceae, subfamily Olisbeoideae (syn. Memecy- loideae, Memecyleae, or Memecylaceae of recent au- thors)—a group of shrubs and small trees with ca. 450 species and a pantropical distribution pattern. Previ- ous studies based on chloroplast DNA sequences sug- gested that this group is perhaps sister to Melasto- mataceae (Conti et al. 1997; Clausing and Renner 2001), but recent analyses of molecular and morpho- logical data provide strong support for the monophyly of Olisbeoideae and its recognition as one of four Me- lastomataceae subfamilies (Stone 2004 and unpubl. data). Following Cogniaux (1891), Olisbeoideae was long regarded as comprising Memecylon L. (wide- spread paleotropical, 300 spp.), Mouriri Aubl. (Amer- ican tropics, ca. 85 spp.), and Axinandra Thwaites (Indo-Malesia, 4 spp.). More recently, however, Axinan- dra has been transferred to Crypteroniaceae (van Beu- sekom-Osinga and van Beusekom 1975; Rutschmann et al. 2004), and Morley (1963, 1976) showed that the enigmatic neotropical genus Votomita Aubl. (10 spp.) should be included in Olisbeoideae. Also reestablished
Transcript of Phylogeny of major lineages in Melastomataceae, subfamily Olisbeoideae: utility of nuclear...
107
Systematic Botany (2006), 31(1): pp. 107–121� Copyright 2006 by the American Society of Plant Taxonomists
Phylogeny of Major Lineages in Melastomataceae, Subfamily Olisbeoideae:Utility of Nuclear Glyceraldehyde 3-Phosphate Dehydrogenase (GapC)
Gene Sequences
ROBERT DOUGLAS STONE
University and Jepson Herbaria and Department of Integrative Biology, 1001 Valley Life Sciences Building#2465, University of California, Berkeley, California 94720-2465
Current address: Department of Systematic Botany, Evolutionary Biology Centre, Uppsala University,Norbyvagen 18D, SE-752 36 Uppsala, Sweden ([email protected])
Communicating Editor: Wendy B. Zomlefer
ABSTRACT. Evidence is presented for phylogenetic relationships in pantropical Melastomataceae, subfamily Olisbeoideaebased on combined exon and intron sequences of the nuclear glyceraldehyde 3-phosphate dehydrogenase gene. Parsimonyand maximum-likelihood analyses yielded a well-supported ingroup tree consistent with earlier morphologically basedconcepts of six genera—Memecylon, Mouriri, Votomita, Spathandra, Lijndenia, and Warneckea. The position of the root node inOlisbeoideae remains equivocal. Outgroup-rooted maximum parsimony suggests a deep divergence between Old and NewWorld lineages, while the maximum-likelihood rooting resolved paleotropical genera as a paraphyletic grade basal to theneotropical taxa. The Fitch optimization method for estimating character evolution consistently inferred the strongly acrodro-mous leaf venation pattern as ancestral in Olisbeoideae, reinforcing the conclusion that the superficially uninervate or bro-chidodromiform venation pattern of Memecylon, the neotropical subclade, and some Lijndenia and Warneckea species is bestinterpreted as a series of independent losses of the strongly acrodromous condition. Genomic GapC sequences may havephylogenetic utility at intergeneric level in other angiosperm families, particularly those that have low apparent rates ofchloroplast DNA sequence evolution.
Sequences from the chloroplast genome and the in-ternal transcribed spacer (ITS) region of nuclear ribo-somal DNA have been used extensively in plant phy-logenetic studies over the past decade. Yet the inherentrates of sequence evolution in these DNA regions placelimits on their phylogenetic informativeness at differ-ent taxonomic levels (e.g., Soltis and Soltis 1998). Mu-tations in chloroplast sequences tend to accumulatemore slowly than in nuclear DNA (e.g., Wolfe et al.1987), and even in the relatively fast-evolving matKgene and non-coding regions, the amount of variationmay be insufficient for robust resolution of phyloge-netic relationships within some angiosperm families(but see Shaw et al. 2005). ITS sequences, on the otherhand, are generally informative at or near the specieslevel and may be unalignable at deeper levels or mayexhibit excessive homoplasy (e.g., Baldwin et al. 1995).
Increased emphasis is now on assessing utility ofphylogenetic markers from low-copy regions of the nu-clear genome (reviewed by Sang 2002; Small et al.2004), such as the glyceraldehyde 3-phosphate dehy-drogenase (GapC) gene that codes for one of the keyenzymes in glycolysis (EC 1.2.1.12). In Arabidopsis thal-iana (L.) Heynh., the length of the GapC region is 2.7kb and spans nine exons along with eight short inter-vening introns (ref. GenBank accession M64119). In ad-dition to the roughly equal number of coding and non-coding sites, the potential utility of GapC at both shal-low and deeper phylogenetic levels is suggested by re-sults from earlier plant phylogenetic studies. Martin etal. (1993) applied protein-coding sequences from thisregion to interfamilial relationships in angiosperms
and found a low substitution rate (comparable to thatof the chloroplast gene rbcL). Partial genomic GapC se-quences were subsequently used in population studiesof Manihot esculenta Crantz (Euphorbiaceae; Olsen andSchaal 1999) and Amsinckia spectabilis Fisch. & C.A.Mey. (Boraginaceae; Perusse and Schoen 2004). Wall(2002) combined GapC exon and intron sequences in aspecies-level analysis of the paleotropical moss genusMitthyridium H. Robinson (Calymperaceae).
The aim of the current study is to reconstruct phy-logenetic relationships among major lineages of Me-lastomataceae, subfamily Olisbeoideae (syn. Memecy-loideae, Memecyleae, or Memecylaceae of recent au-thors)—a group of shrubs and small trees with ca. 450species and a pantropical distribution pattern. Previ-ous studies based on chloroplast DNA sequences sug-gested that this group is perhaps sister to Melasto-mataceae (Conti et al. 1997; Clausing and Renner2001), but recent analyses of molecular and morpho-logical data provide strong support for the monophylyof Olisbeoideae and its recognition as one of four Me-lastomataceae subfamilies (Stone 2004 and unpubl.data). Following Cogniaux (1891), Olisbeoideae waslong regarded as comprising Memecylon L. (wide-spread paleotropical, 300� spp.), Mouriri Aubl. (Amer-ican tropics, ca. 85 spp.), and Axinandra Thwaites(Indo-Malesia, 4 spp.). More recently, however, Axinan-dra has been transferred to Crypteroniaceae (van Beu-sekom-Osinga and van Beusekom 1975; Rutschmannet al. 2004), and Morley (1963, 1976) showed that theenigmatic neotropical genus Votomita Aubl. (10 spp.)should be included in Olisbeoideae. Also reestablished
108 [Volume 31SYSTEMATIC BOTANY
in the subfamily were three additional Old World gen-era—Spathandra Guill. & Perr. (1 sp., west African),Lijndenia Zoll. & Moritzi (ca. 15 spp., widespread pa-leotropical), and Warneckea Gilg (ca. 50 spp., Afro-Mal-agasy)—on the basis of morphological and anatomicalinvestigations by Jacques-Felix (1978a,b) and Bremer(1982).
Olisbeoideae have diversified with little change infloral morphology. Bakhuizen van den Brink (1943)thus observed that vegetative characters have more usein the classification of the group; Jacques-Felix (1978a)also suggested that the flowers are ‘‘little evolved.’’ Re-cent generic concepts in the subfamily, especially in theOld World tropics, have been largely based on patternsof leaf venation (Jacques-Felix et al. 1978; Jacques-Felixand Mouton 1980); aspects of leaf anatomy, especiallythe morphology of sclereid idioblasts (Rao and Jacques-Felix 1978; Rao et al. 1983); and features of the embryoand germination of the seedling (Jacques-Felix 1977,1978b; Bremer 1981).
Preliminary investigations using several non-codingregions of the chloroplast genome (including the atpB-rbcL and trnT-trnL intergenic spacers as well as therpl16 intron) showed inadequate sequence divergencefor resolving lineages in Olisbeoideae. ITS sequencesare so variable that they are difficult to align with out-groups, and ingroup relationships are poorly resolvedbecause of unstable placement of several long branches(R. D. Stone, unpubl. data). In this paper, the utility ofGapC sequences is explored, and the results are usedto test the current generic classification of Olisbeoideaeand make inferences about trends in character evolu-tion within the subfamily.
MATERIALS AND METHODS
Taxonomic Sampling. The study includes partial GapC se-quences from 20 taxa (Appendix 1). All genera in subfamily Olis-beoideae were sampled. The outgroup includes sequences fromtwo species of Pternandra Jack, a woody Malesian genus regardedas the most likely sister group of Olisbeoideae (Stone 2004). Ad-ditional outgroup sequences were obtained from Tibouchina Aubl.(Melastomataceae, subfam. Melastomatoideae), Crypteronia Blume(Crypteroniaceae), and Heteropyxis Harv. (Myrtaceae s. l.).
Extraction and Purification of Total Genomic DNAs. Sampleswere ground from leaves of a single plant dried in silica gel (Chaseand Hills 1991), with the exception of Tibouchina (fresh leaves).Except as noted below, all DNAs were extracted using the DNeasyPlant Mini Kit (Qiagen, Inc.). The amount of starting material wasminimized to avoid ‘‘overloading’’ the kit, with two modificationsto the manufacturer’s protocol: (1) grinding of leaf material wasdone in the lysing buffer at room temperature (not in liquid N);and (2) lysates were incubated at 65�C for 1–2 hr (instead of theprescribed 10 min). DNAs of Pternandra were extracted by G. Kad-ereit at Johannes Gutenberg University, Mainz, Germany, using themethod described in Clausing and Renner (2001). Genomic DNAswere generally diluted at 1:10 or 1:50 in ddH2O for use in poly-merase chain reaction (PCR) experiments.
PCR Amplification, Cloning, and Sequencing. Symmetric PCRamplification of the GapC gene was accomplished using theGPDX7F and GPDX9R primers (Strand et al. 1997). A 20-�l reac-tion volume was employed, including the Bioneer AccuPower PCR
pre-mix (distributed by Bionexus, Inc.) along with 17 �l of pre-diluted genomic DNA and 0.75 �l of each primer (starting con-centration 10 �M). Thermal cycling involved initial denaturationat 95�C for 2 min, followed by 40 cycles of denaturation at 95�Cfor 30 sec, annealing at 50�C for 45 sec, and extension at 72�C for1 min, followed by a final extension at 72�C for 9 min.
Amplicons represented by bright bands in the size range of 500to 1,000 bp were separated prior to cloning by gel extraction andrecovery using the Zymoclean gel DNA recovery kit (Zymo Re-search). Gel-extracted products were cloned using either the TOPOTA cloning kit for sequencing or the Zero Blunt TOPO PCR clon-ing kit for sequencing (Invitrogen Corp.). Isolates were screenedby symmetric PCR using the standard M13F and M13R plasmidvector primers.
Products of the appropriate length were cycle sequenced usingthe ABI Prism BigDye Terminators kit, version 2.0 (Applied Bio-systems) in combination with one of the two vector primers. Theresulting single-stranded products were then run and analyzedon an Applied Biosystems ABI 377 automated sequencer. Sixty-four cloned GapC isolates were sequenced, including 39 frommembers of Olisbeoideae, and the rest from myrtalean outgrouptaxa. Several isolates per sample were sequenced in order to assessthe degree of allelic variation as well as the possible existence ofparalogous loci.
Sequence Assembly, Verification, and Alignment. Forward andreverse single-stranded sequences were assembled into overlap-ping contigs using Sequence Navigator, version 1.0.1 (Applied Bio-systems). For each GapC contig, the flanking 5� and 3� vector se-quences were excised, and the remaining sequence was subjectedto verification by a BLAST search against GenBank (Altschul et al.1997). An initial comparative alignment of GapC sequences usingClustal X, version 1.64b (Jeanmougin et al. 1998) showed no lengthvariation within any of the exon subregions. Subsequent manualalignments of GapC sequences included both exon and intron sub-regions, with sequence divergence between ingroup samples rang-ing from 1.4 to 9.2% (uncorrected for multiple substitutions).When outgroup sequences were added to the data matrix, thealignment of intron subregions became more problematic, as theoverall divergence between ingroup and outgroup sequencesranged from 15.6 to 36.8%.
Paralogy Assessment of Myrtalean GapC Isolates. To test forparalogy, exon subregions from multiple GapC isolates of Meme-cylon lateriflorum, Pternandra, Tibouchina, Crypteronia, and Heteropyx-is were aligned with previously published GapC coding sequencesfrom Zea mays L. (GenBank accession nos. X07156, U45855,U45856, and U45857). The resulting data set (TreeBASE study ac-cession S1364, matrix accession M2416) was then analyzed usingequally weighted, unordered parsimony (Fitch 1971), implement-ed by a branch-and-bound search in PAUP*, version 4.0 beta 10(Swofford 2002). Clade support was assessed using the non-para-metric bootstrap (Felsenstein 1985) and through relaxation of par-simony or ‘‘decay analysis’’ (Bremer 1988). Decay indices werecalculated using AutoDecay (T. Eriksson, Bergius Foundation, Roy-al Swedish Academy of Sciences, Stockholm), with commandscontrolling the relevant PAUP* searches generated by MacClade,version 4.0 (Maddison and Maddison 2000). By translating eachof the exon sequences, a corresponding data matrix of inferredamino acid sequences was assembled. Amino acid sequence di-vergence was then estimated in MacClade for each branch of thestrict consensus tree produced by the parsimony analysis of exonsequences.
Phylogenetic Analyses of Olisbeoideae GapC Sequences. Sub-sequent ingroup and outgroup-rooted analyses of GapC used amanually aligned data set of putatively orthologous genomic se-quences from 35 Olisbeoideae isolates and five Pternandra isolates(TreeBASE matrix accession M2415). Tree searches under bothmaximum-parsimony (MP) and maximum-likelihood (ML) em-ployed the heuristic algorithm in combination with tree bisectionand reconnection (TBR) branch swapping and multiple rounds ofrandom sequence addition. Gaps were treated as missing data(16% of total sites), except for the outgroup-rooted MP analysis inwhich 17 potentially informative gaps (defined as those shared by
2006] 109STONE: MELASTOMATACEAE SUBFAM. OLISBEOIDEAE
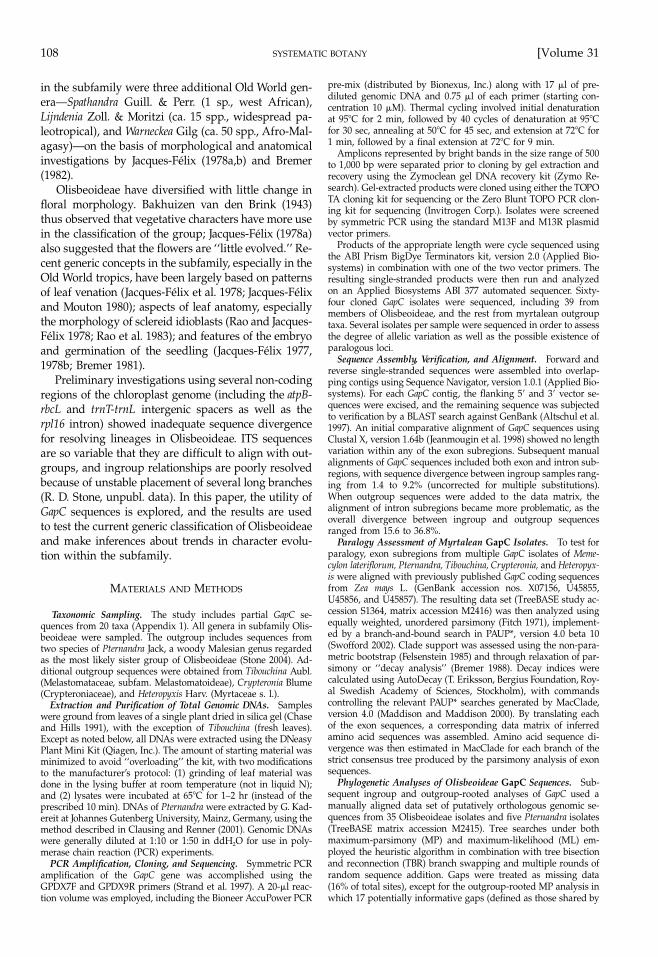
FIG. 1. Schematic representation of the sequenced GapC re-gion in Memecylon lateriflorum. Exon numbers correspond tothe structure in Arabidopsis thaliana. Arrows indicate the bind-ing sites for oligonucleotide primers GPDX7F and GPDX9R(Strand et al. 1997).
at least two different sequences) were coded as binary charactersusing the ‘‘simple indel coding method’’ (Simmons and Ochoter-ena 2000) and appended to the original data matrix. Model selec-tion for ML analyses was guided by nested likelihood ratio tests(Felsenstein 1981; Huelsenbeck and Rannala 1997) and by non-nested comparisons using the Akaike (1973, 1974) information cri-terion—both methods implemented in Modeltest, version 3.06 (Po-sada and Crandall 1998). The HKY�G model representing thebest fit to the combined GapC exon and intron data accounts forunequal base frequencies and bias in substitution rates favoringtransitions over transversions (Hasegawa et al. 1985), as well asrate inconstancy among sites following a gamma distribution(Yang 1993, 1994). Branch support was assessed by non-parametricbootstrapping and Bremer decay analyses, as described above.
Assessment of Long-branch Effects on Root Placement. Para-metric bootstrapping (Monte Carlo simulation; Huelsenbeck et al.1996) was used to explore whether any of several possible rootplacements can be attributed to long-branch attraction (error/biasinfluencing the placement of the root). The constraint trees hadthe same ML topology for the ingroup and differed by the positionof the first ingroup node. An HKY�G substitution model was as-sumed in each case, and values for the model parameters (includ-ing transition/transversion ratio, nucleotide frequencies, gammadistribution shape parameter, and branch lengths) were estimatedfrom the original data set. For each model tree, 25 sequence datasets were simulated (each with the same size and nucleotide fre-quencies as the original matrix) using Seq-Gen, version 1.2.7 (Ram-baut and Grassly 1997). An MP search of each simulated data setwas then conducted, and the results were tabulated to estimatethe Type I error (i.e., the probability of rejecting a certain rootplacement if it is true) and Type II error (the probability of mis-takenly accepting a certain root placement when it is false).
Effect of Model Specification on Root Placement. To determinewhether the ingroup rooting inferred by the best-fit HKY�G mod-el is a robust result, the ML root placement was studied undermodels of varying complexity. The evaluated models include thosein which nucleotide substitution rates are estimated by one param-eter (Jukes and Cantor 1969; Felsenstein 1981); those in which dif-ferent rates are incorporated for transitions and transversions (Ki-mura 1980; Hasegawa et al. 1985); as well as the general time-reversible model, which estimates different rates for each of thesix possible substitution types: A↔C, A↔G, A↔T, C↔G, C↔T,and G↔T (Lanave et al. 1984; Rodrıguez et al. 1990). Also ana-lyzed were variations on each of these substitution models thattake into account rate inconstancy among sites, an estimated pro-portion of invariant sites (Steel et al. 2000), or both.
Test of Rate Constancy under Alternative Root Placements. Toevaluate whether any of the possible root placements are consis-tent with a molecular clock, constraint topologies were generatedas described above for the parametric bootstrapping analysis. Inthis case, however, outgroup sequences were discarded after useto establish the position of the first ingroup node. Each of therooted ingroup topologies was then analyzed under the ML cri-terion, with parameter values of the assumed HKY�G model es-timated from the data and with or without enforcement of a clock.For each alternative root placement, the hypothesis of rate hetero-geneity across lineages was assessed using the global likelihoodratio test statistic (Felsenstein 1981), with significance approxi-mated by the �2 distribution and degrees of freedom given by thedifference in the number of free parameters between the rate-con-stant and unconstrained models (Sanderson 1998).
RESULTS
Paralogy Assessment of Myrtalean GapC Isolates.The structure of the GapC region in Myrtales is ex-emplified by one of the sequenced isolates from thewest-African Memecylon lateriflorum (Fig. 1). Whencompared with the same region in Arabidopsis thaliana,the myrtalean GapC region has additional introns—
one within exon 8 and the other in exon 9 near its 5�end. In this respect the structure of GapC in Myrtalesis similar to that reported earlier for Manihot esculenta(Olsen and Schaal 1999).
The possibility of different GapC paralogs was sug-gested when the Pternandra samples yielded PCRproducts of two different lengths—one ‘‘long’’ (973–979 bp) and the other ‘‘short’’ (764 bp). The presenceof conserved exons in both the long and short Pternan-dra sequences, in combination with the results of sub-sequent BLAST searches, indicates that this taxon likelyhas two functional, paralogous copies of GapC. Heter-opyxis also produced two putatively paralogous se-quences, but the length difference between copies wasnot as pronounced (1048–1049 versus 972 bp).
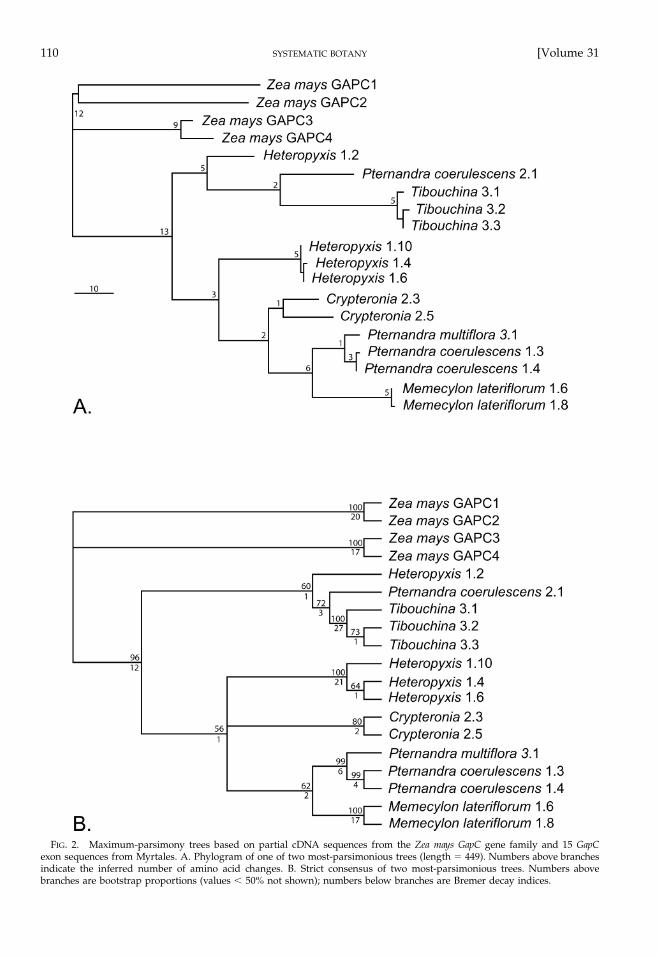
In Zea mays, previous workers have found four cop-ies (termed GapC1, GapC2, GapC3, and GapC4) that aredifferentially expressed under aerobic and anoxic con-ditions (Russell and Sachs 1989; Manjunath and Sachs1997). Results (Fig. 2) support the Z. mays GapC1/2and GapC3/4 groups as divergent and the myrtaleanGapC exon sequences as not more closely related toeither of the Z. mays sequence groups. This analysisalso resolves the myrtalean GapC exon sequences intwo different groups, one consisting of the ‘‘long’’ Het-eropyxis and Pternandra sequences plus Crypteronia andMemecylon, and the other of the ‘‘short’’ Heteropyxis andPternandra plus Tibouchina. Although the hypothesis oftwo myrtalean GapC paralogs is not strongly support-ed by the analysis of exon sequences, the intron se-quences of these groups (and in some cases from thesame organism) are so dissimilar that they cannot beunambiguously aligned. As the Memecylon sequences(Fig. 2) are clearly more closely related to the long Pter-nandra sequences than to the short ones, subsequentanalyses make use of the long Pternandra sequences toinfer the position of the root node in Olisbeoideae.
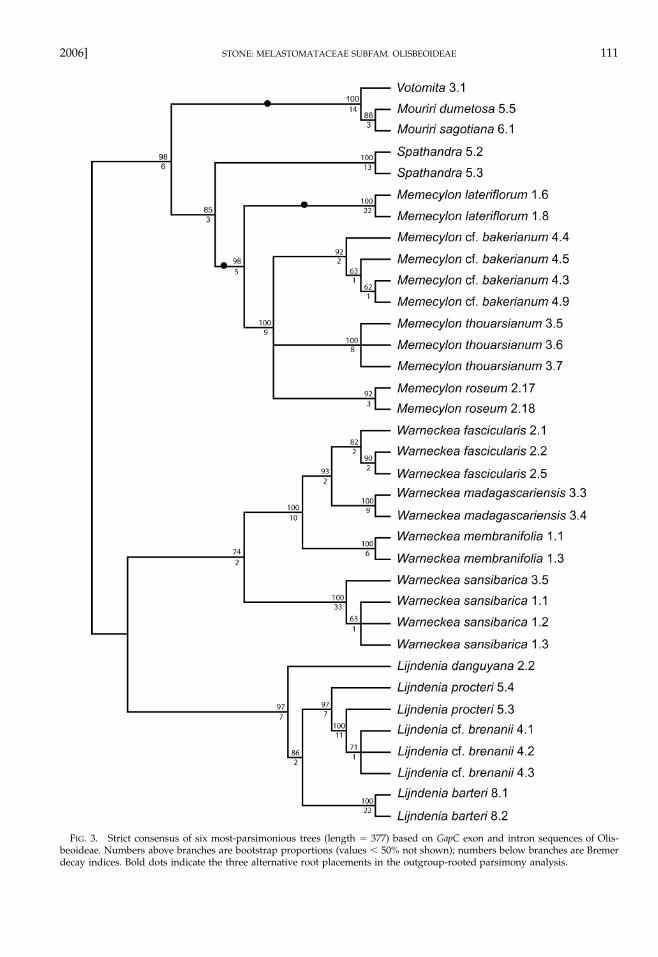
Phylogenetic Analyses of Olisbeoideae GapC Sequences.The GapC sequences from members of Olisbeoideaerange in length from 843 bp in Memecylon thouarsianumand M. cf. bakerianum to 878 bp in Warneckea madagas-cariensis. Exon sequences are rather highly conservedacross lineages; length variation is due to inferred in-sertion or deletion events in intron subregions. Parsi-mony analysis of ingroup sequences produced a well-resolved and -supported tree consistent with mono-phyly of the six genera in this subfamily (Fig. 3). Max-
110 [Volume 31SYSTEMATIC BOTANY
FIG. 2. Maximum-parsimony trees based on partial cDNA sequences from the Zea mays GapC gene family and 15 GapCexon sequences from Myrtales. A. Phylogram of one of two most-parsimonious trees (length � 449). Numbers above branchesindicate the inferred number of amino acid changes. B. Strict consensus of two most-parsimonious trees. Numbers abovebranches are bootstrap proportions (values � 50% not shown); numbers below branches are Bremer decay indices.
2006] 111STONE: MELASTOMATACEAE SUBFAM. OLISBEOIDEAE
FIG. 3. Strict consensus of six most-parsimonious trees (length � 377) based on GapC exon and intron sequences of Olis-beoideae. Numbers above branches are bootstrap proportions (values � 50% not shown); numbers below branches are Bremerdecay indices. Bold dots indicate the three alternative root placements in the outgroup-rooted parsimony analysis.

112 [Volume 31SYSTEMATIC BOTANY
TABLE 1. Summary statistics (ingroup only) for aligned, partial sequences of the nuclear GapC gene. In cases where two or more GapCisolates were available for a given sample, all but one was removed by selecting the sequence with the shortest branch length to theinferred ancestral node.
Aligned sequence length 884 bpNumber (and %) of sites coded as gaps or missing data 334 (2.4%)GC content 42.8%Variable sites (potentially informative sites) 231 (97)Number (and length) of most-parsimonious trees 1 (334)Mean branch length (� S.D.), corrected by maximum-likelihood
HKY � G model, all branches 0.014 � 0.010 substitutions site1
Range of corrected values for individual branch lengths 0.001 0.048 substitutions site1
Consistency index (C. I.) 0.80C. I., excluding autapomorphies 0.65Retention index 0.75
imum-likelihood analysis of ingroup sequences(HKY�G model) yielded a topology identical to oneof the six most-parsimonious trees (results not shown).Summary statistics for the GapC ingroup analyses arepresented in Table 1.
The sister-group relationship between Memecylonand Spathandra, which was recovered in the MP andML analyses of nucleotide substitution data, receivesadditional support from the shared deletion of 24 bpin the intron separating GapC exons 8b and 9a. Thisdeletion, not found in the other four memecyloid gen-era or in Pternandra, is likely a synapomorphy for theMemecylon � Spathandra subclade. Monophyly of Lijn-denia is strengthened by a shared, 1-bp deletion in theintron between GapC exons 7 and 8a. Warneckea is wellsupported as the sister group to Lijndenia. The twoNew World genera, Mouriri and Votomita, are well sup-ported as sister taxa.
The outgroup-rooted parsimony analysis of nucleo-tide substitution data produced 18 minimum-lengthtrees, of which the strict consensus has a five-way po-lytomy at the base of the ingroup. Inspection of themost-parsimonious trees indicates three alternativerootings (shown by bold dots in Fig. 3), either alongthe branch leading to Memecylon, the branch leading toM. lateriflorum, or the branch leading to the neotropicalsubclade (Mouriri � Votomita). Of these possible root-ings, the first two are unlikely because of the afore-mentioned deletion of 24 bp shared by Memecylon andSpathandra; assuming either the Memecylon or M. later-iflorum rooting would imply an evolutionary reversalfor the members of Olisbeoideae other than Memecylonand Spathandra to the presumably ancestral condition(lacking the deletion) seen in Pternandra.
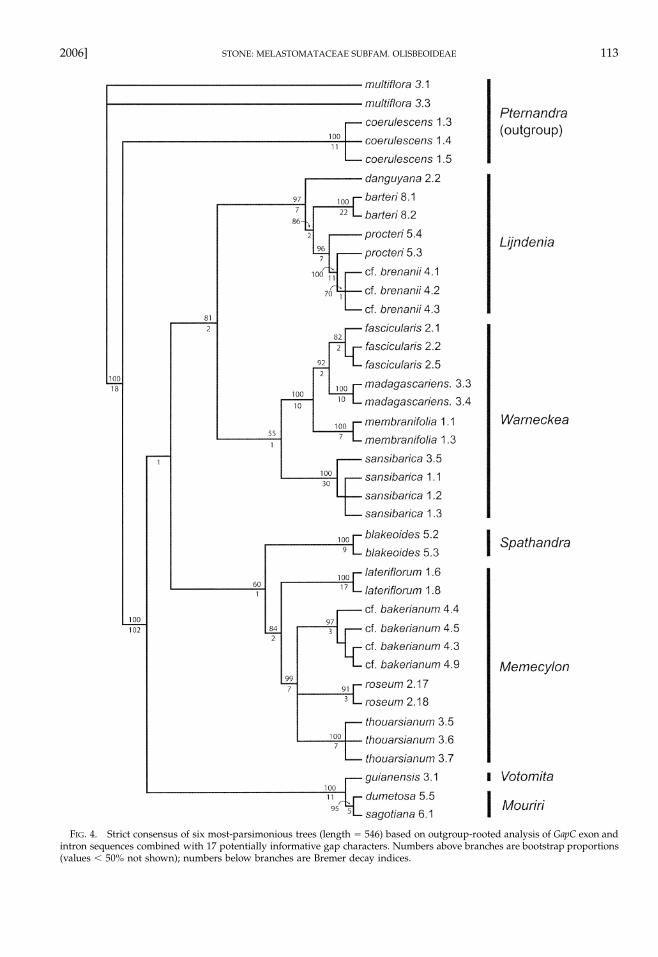
When potentially informative gaps are coded andanalyzed together with the nucleotide substitutiondata, the Memecylon and M. lateriflorum rootings dis-appear. The ingroup relationships estimated from thisanalysis are identical to those in the unrooted tree, andthe root was consistently placed along the internalbranch leading to the neotropical Mouriri � Votomita
subclade (Fig. 4). Low bootstrap and decay values forthe basal branches indicate that support for this root-ing is weak.
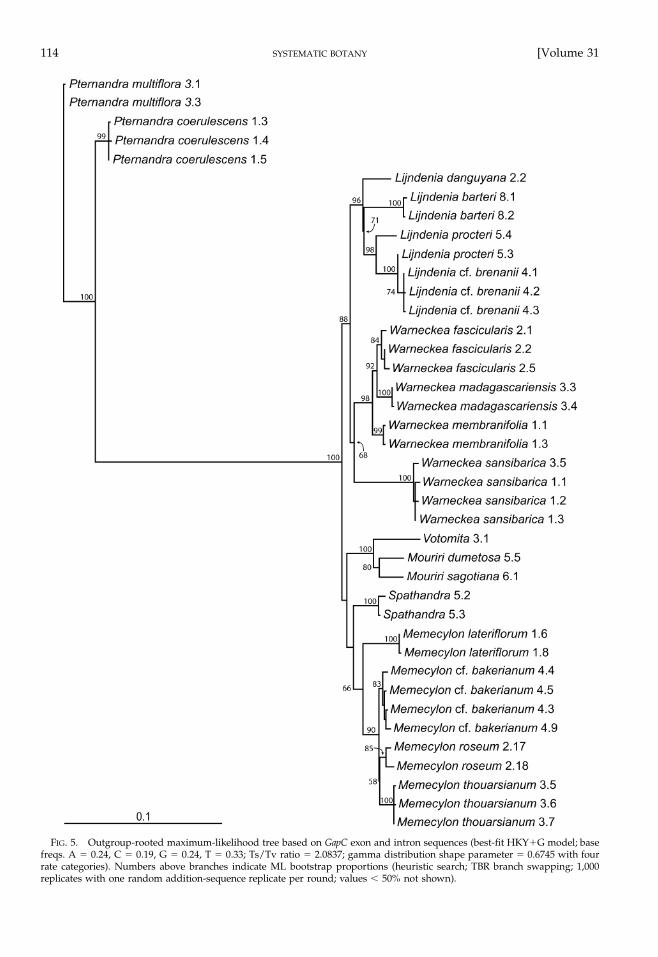
Outgroup-rooted maximum-likelihood analysis un-der the best-fit HKY�G model produced a single tree(Fig. 5) in which relationships among the major in-group lineages are consistent with the unrooted par-simony topology. The root of this ML tree is on theinternal branch between the (Lijndenia � Warneckea)sister group and a ((Mouriri � Votomita) (Memecylon �Spathandra)) subclade. This result is equivalent to themidpoint rooting in both the parsimony and ML anal-yses and is in a different position from any of the threealternative root placements obtained by parsimonyanalysis of the same data set. The ML/midpoint root-ing and the MP neotropical rooting are on adjacentinternal branches.
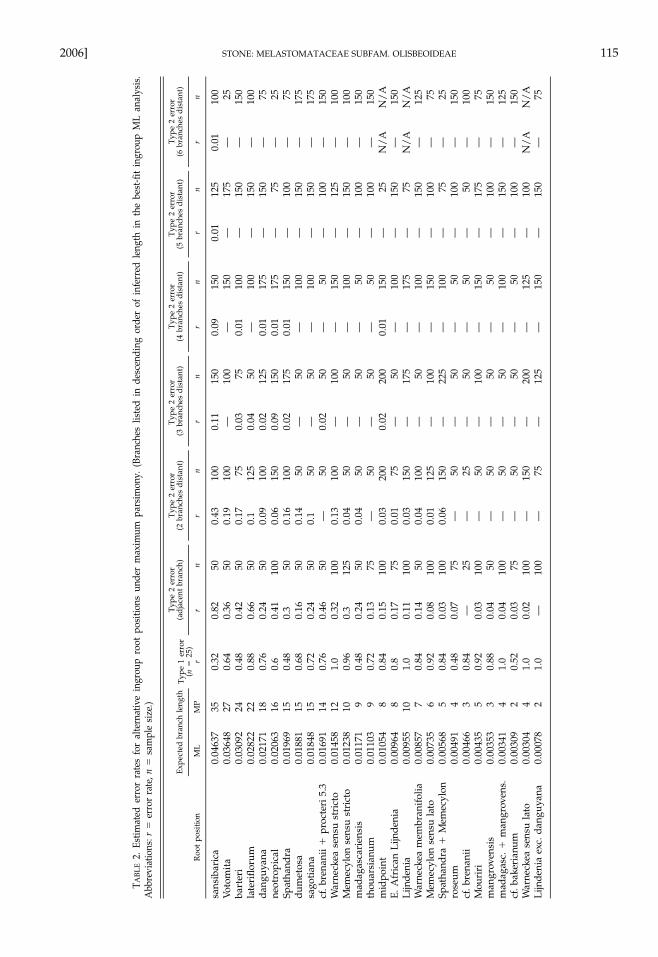
Assessment of Long-branch Effects on Root Placement.From simulation experiments of alternative root place-ments under maximum parsimony, a set of error esti-mates was generated (Table 2). These results suggestthat the Type I error rate is high in all simulated rootplacements and that the Type II error rate (i.e., the ten-dency for an ingroup branch to attract the outgroupbranch) is roughly proportional to the expected branchlength. The branch leading to Warneckea sansibarica (thelongest ingroup branch) is a strong attractor for theoutgroup as indicated by a Type II error rate of 0.82when the simulated rooting is on an adjacent branch.Attraction of the root by the W. sansibarica branch isalso seen when the ‘‘true’’ (i.e., simulated) root place-ment is two or three branches away (r � 0.11–0.43), orless frequently up to six branches away (r � 0.01). Sev-eral other ingroup branches (including the branch lead-ing to the neotropical subclade) are long enough toattract the outgroup with some regularity in parsi-mony analyses.
Effect of Model Specification on Root Placement. Fromthe assessment of root placement under different sub-stitution models (Table 3), one result is that none of theML models produced a rooting along the internal
2006] 113STONE: MELASTOMATACEAE SUBFAM. OLISBEOIDEAE
FIG. 4. Strict consensus of six most-parsimonious trees (length � 546) based on outgroup-rooted analysis of GapC exon andintron sequences combined with 17 potentially informative gap characters. Numbers above branches are bootstrap proportions(values � 50% not shown); numbers below branches are Bremer decay indices.
114 [Volume 31SYSTEMATIC BOTANY
FIG. 5. Outgroup-rooted maximum-likelihood tree based on GapC exon and intron sequences (best-fit HKY�G model; basefreqs. A � 0.24, C � 0.19, G � 0.24, T � 0.33; Ts/Tv ratio � 2.0837; gamma distribution shape parameter � 0.6745 with fourrate categories). Numbers above branches indicate ML bootstrap proportions (heuristic search; TBR branch swapping; 1,000replicates with one random addition-sequence replicate per round; values � 50% not shown).
2006] 115STONE: MELASTOMATACEAE SUBFAM. OLISBEOIDEAE
TAB
LE
2.Es
timat
eder
ror
rate
sfo
ral
tern
ativ
ein
grou
pro
otpo
sitio
nsun
der
max
imum
pars
imon
y.(B
ranc
hes
liste
din
desc
endi
ngor
der
ofin
ferr
edle
ngth
inth
ebe
st-fi
tin
grou
pM
Lan
alys
is.
Abb
revi
atio
ns:r
�er
ror
rate
,n�
sam
ple
size
.)
Roo
tpo
sitio
n
Exp
ecte
dbr
anch
leng
th
ML
MP
Typ
e1
erro
r(n
�25
)r
Typ
e2
erro
r(a
dja
cent
bran
ch)
rn
Typ
e2
erro
r(2
bran
ches
dis
tant
)
rn
Typ
e2
erro
r(3
bran
ches
dis
tant
)
rn
Typ
e2
erro
r(4
bran
ches
dis
tant
)
rn
Typ
e2
erro
r(5
bran
ches
dis
tant
)
rn
Typ
e2
erro
r(6
bran
ches
dis
tant
)
rn
sans
ibar
ica
Voto
mit
aba
rter
ila
teri
floru
mda
nguy
ana
0.04
637
0.03
648
0.03
092
0.02
822
0.02
171
35 27 24 22 18
0.32
0.64
0.48
0.88
0.76
0.82
0.36
0.42
0.66
0.24
50 50 50 50 50
0.43
0.19
0.17
0.1
0.09
100
100 75 125
100
0.11 — 0.03
0.04
0.02
150
100 75 50 125
0.09 — 0.01 — 0.01
150
150
100
100
175
0.01 — — — —
125
175
150
150
150
0.01 — — — —
100 25 150
100 75
neot
ropi
cal
Spat
hand
radu
met
osa
sago
tian
acf
.bre
nani
i�
proc
teri
5.3
0.02
063
0.01
969
0.01
881
0.01
848
0.01
691
16 15 15 15 14
0.6
0.48
0.68
0.72
0.76
0.41
0.3
0.16
0.24
0.46
100 50 50 50 50
0.06
0.16
0.14
0.1 —
150
100 50 50 50
0.09
0.02 — — 0.02
150
175 50 50 50
0.01
0.01 — — —
175
150
100
100 50
— — — — —
75 100
150
150
100
— — — — —
25 75 175
175
150
War
neck
ease
nsu
stri
cto
Mem
ecyl
onse
nsu
stri
cto
mad
agas
cari
ensi
sth
ouar
sian
umm
idpo
int
0.01
458
0.01
238
0.01
171
0.01
103
0.01
054
12 10 9 9 8
1.0
0.96
0.48
0.72
0.84
0.32
0.3
0.24
0.13
0.15
100
125 50 75 100
0.13
0.04
0.04 — 0.03
100 50 50 50 200
— — — — 0.02
100 50 50 50 200
— — — — 0.01
150
100 50 50 150
— — — — —
125
150
100
100 25
— — — — N/
A
100
100
150
150
N/
AE
.Afr
ican
Lijn
deni
aL
ijnde
nia
War
neck
eam
embr
anif
olia
Mem
ecyl
onse
nsu
lato
Spat
hand
ra�
Mem
ecyl
on
0.00
964
0.00
955
0.00
857
0.00
735
0.00
568
8 10 7 6 5
0.8
1.0
0.84
0.92
0.84
0.17
0.11
0.14
0.08
0.03
75 100 50 100
100
0.01
0.03
0.04
0.01
0.06
75 150
100
125
150
— — — — —
50 175 50 100
225
— — — — —
100
175
100
150
100
— — — — —
150 75 150
100 75
— N/
A— — —
150
N/
A12
5 75 25ro
seum
cf.b
rena
nii
Mou
riri
man
grov
ensi
sm
adag
asc.
�m
angr
oven
s.cf
.bak
eria
num
War
neck
ease
nsu
lato
Lijn
deni
aex
c.da
nguy
ana
0.00
491
0.00
466
0.00
435
0.00
353
0.00
341
0.00
309
0.00
304
0.00
078
4 3 5 3 4 2 4 2
0.48
0.84
0.92
0.88
1.0
0.52
1.0
1.0
0.07 — 0.03
0.04
0.04
0.03
0.02 —
75 25 100 50 100 75 100
100
— — — — — — — —
50 25 50 50 50 50 150 75
— — — — — — — —
50 50 100 50 50 50 200
125
— — — — — — — —
50 50 150 50 100 50 125
150
— — — — — — — —
100 50 175
100
150
100
100
150
— — — — — — N/
A—
150
100 75 150
125
150
N/
A 75
116 [Volume 31SYSTEMATIC BOTANY
TABLE 3. Maximum-likelihood placement of the root node underdifferent model conditions. Results are given in descending orderof likelihood score, with those from the best-fit HKY � G modelhighlighted in bold type.
Substitutionmodel -ln L Root placement
JCF81JC�IJC�GJC�I�G
4552.585174525.391204506.947754503.474904503.23205
Memecylon lateriflorumMemecylon lateriflorumMemecylonMemecylonMemecylon
F81�IF81�GF81�I�GK2PHKY
4479.933834476.727234476.443524435.481704401.78247
Memecylon lateriflorumMemecylon lateriflorumMemecylon lateriflorummidpointmidpoint
GTRK2P�IK2P�GK2P�I�GHKY�I
4400.475984388.660504384.623714384.388684355.79205
midpointmidpointmidpointmidpointmidpoint
GTR�IHKY�GHKY�I�GGTR�GGTR�I�G
4354.270624351.968554351.649724350.566204350.22128
midpointmidpointmidpointmidpointmidpoint
TABLE 4. Global test for rate heterogeneity across lineages with alternative placements of the ingroup root. Results are given inincreasing order of the likelihood ratio test statistic.
Root position -ln L (no clock) -ln L (clock enforced) LRT statistic Significance (34 d.f.)
midpointneotropicalSpathandra � MemecylonLinjdenia; Warneckea s.l.sansibarica
3501.22992 3522.517653523.082833523.394153524.643973525.3994
42.5754643.7058244.3284646.828148.33896
n.s.
Warneckea s.s.Memecylon s.l.SpathandraLijndenia exc. danguyana
3525.797283529.770923529.772713535.28027
49.1347257.08257.0855868.1007
0.05
0.01
danguyanaMouriri; Votomitabarteri; E. African Lijndenialateriflorum; Memecylon s.s.dumetosasagotiana
3535.282343535.552643537.713093537.897023543.307013543.30896
68.1048468.6454472.9663473.334284.1541884.15808
0.001
cf. brenanii � procteri 5.3 3552.93424 103.40864membranifolia; madagascariensis � mangrovensis 3560.61627 118.7727madagascariensismangrovensiscf. bakerianumroseum; thouarsianum
3578.308253578.31053579.055633588.48073
154.15666154.16116155.65142174.50162
cf. brenanii 3607.58276 212.70568
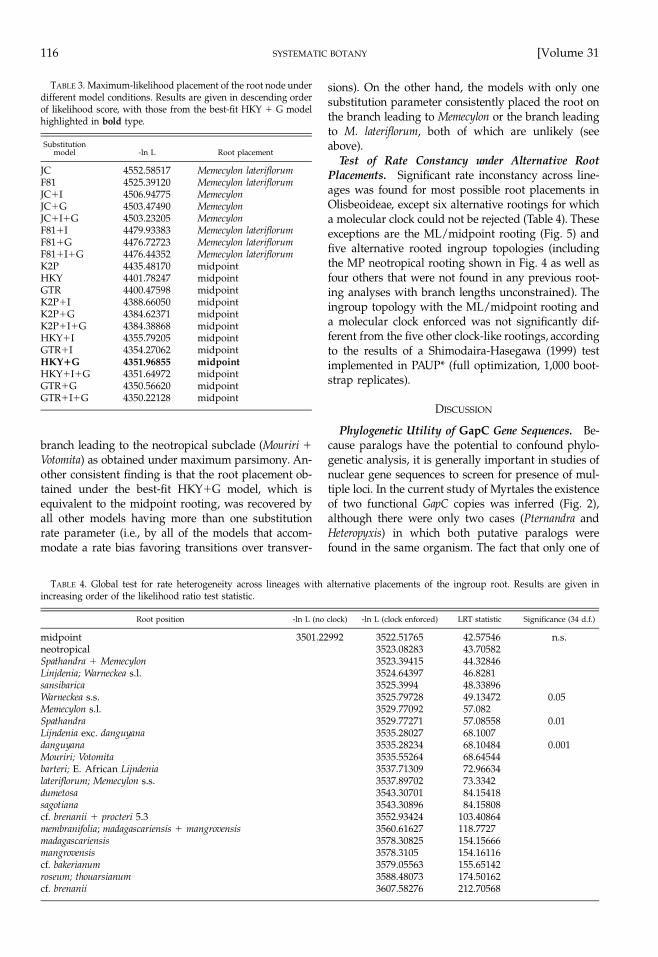
branch leading to the neotropical subclade (Mouriri �Votomita) as obtained under maximum parsimony. An-other consistent finding is that the root placement ob-tained under the best-fit HKY�G model, which isequivalent to the midpoint rooting, was recovered byall other models having more than one substitutionrate parameter (i.e., by all of the models that accom-modate a rate bias favoring transitions over transver-
sions). On the other hand, the models with only onesubstitution parameter consistently placed the root onthe branch leading to Memecylon or the branch leadingto M. lateriflorum, both of which are unlikely (seeabove).
Test of Rate Constancy under Alternative RootPlacements. Significant rate inconstancy across line-ages was found for most possible root placements inOlisbeoideae, except six alternative rootings for whicha molecular clock could not be rejected (Table 4). Theseexceptions are the ML/midpoint rooting (Fig. 5) andfive alternative rooted ingroup topologies (includingthe MP neotropical rooting shown in Fig. 4 as well asfour others that were not found in any previous root-ing analyses with branch lengths unconstrained). Theingroup topology with the ML/midpoint rooting anda molecular clock enforced was not significantly dif-ferent from the five other clock-like rootings, accordingto the results of a Shimodaira-Hasegawa (1999) testimplemented in PAUP* (full optimization, 1,000 boot-strap replicates).
DISCUSSION
Phylogenetic Utility of GapC Gene Sequences. Be-cause paralogs have the potential to confound phylo-genetic analysis, it is generally important in studies ofnuclear gene sequences to screen for presence of mul-tiple loci. In the current study of Myrtales the existenceof two functional GapC copies was inferred (Fig. 2),although there were only two cases (Pternandra andHeteropyxis) in which both putative paralogs werefound in the same organism. The fact that only one of
2006] 117STONE: MELASTOMATACEAE SUBFAM. OLISBEOIDEAE
the two paralogs was recovered in samples of Crypte-ronia, Tibouchina, and Olisbeoideae could be the resultof differential PCR amplification (as might be causedby divergent evolution at a primer binding site) or lin-eage-specific loss of one locus. Without additional se-quencing at deeper phylogenetic levels it is difficult tosuggest when the ancestral duplication giving rise tothe two myrtalean paralogs could have occurred, ex-cept that it was evidently independent of events thatproduced the GapC gene family in Zea mays. WithinOlisbeoideae both the inferred relationships and ob-served level of sequence divergence among infraspe-cific isolates are consistent with shallow coalescence ofalleles in a single-copy gene.
Previous authors (Felsenstein 1978; Albert et al. 1992;Yang 1998) have demonstrated that inaccurate parsi-mony reconstructions can result when the proportionof characters expected to change along each branch(denoted by ) exceeds 10%. As shown in Table 1, theaverage value for the GapC ingroup tree (correctedfor multiple substitutions according to the best-fitHKY�G model) is 1.4%, and none of the terminalbranches in the GapC ingroup tree have values ap-proaching 10% (the maximum value being 4.8% inWarneckea sansibarica). The fully resolved trees and ro-bustness to different model assumptions (i.e., parsi-mony or likelihood) provide additional evidence thatthe GapC analysis of Olisbeoideae is not plagued bylong-branch attraction. The results of the current studysuggest that genomic GapC sequences could have phy-logenetic utility at the intergeneric level in other an-giosperm families, particularly those that have low ap-parent rates of chloroplast DNA sequence evolution.
Character Evolution and Generic Classification ofOlisbeoideae. Assuming either the maximum-likeli-hood (midpoint) rooting of the GapC tree or the max-imum-parsimony (neotropical) rooting, then six gen-era—already well established on morphological andanatomical evidence—appear as reciprocally mono-phyletic groups (Figs. 4, 5). Each genus is also wellsupported in the unrooted ingroup tree (Fig. 3), exceptfor Warneckea where the lack of strong support is evi-dently caused by the divergent W. sansibarica. Circum-scription of Warneckea on morphological grounds isalso weakened by inclusion of W. sansibarica and itsclose relatives in sect. Carnosa Jacq.-Fel. (Jacques-Felix1978b, 1985a,b). Although the hypothesis of exclusivemonophyly for all six recognized genera of Olisbeo-ideae is based on limited sampling relative to the near-ly 500 extant species, this conclusion is corroboratedby additional, species-level analyses (using denser tax-onomic sampling and faster-evolving DNA markers)within Memecylon, Lijndenia, Warneckea, and Mouriri(Stone 2004 and unpubl. data). The main qualificationis the neotropical Votomita, for which additional DNAsamples are needed before monophyly can be tested.
In the GapC ingroup tree (Fig. 3), the groups (Lijnd-enia � Warneckea) and ((Mouriri � Votomita) (Spathandra� Memecylon)) are separated by a strongly supportedinternal branch. Assuming the midpoint rooting (Fig.5), each group forms a distinct subclade at the base ofthe ingroup tree. There are, however, no morphologicalor anatomical characters uniting the members of eachsubclade. One possible synapomorphy for a ((Mouriri� Votomita) (Spathandra � Memecylon)) subclade in-volves a change in basic chromosome number. The an-cestral base number in Myrtales may be x � 12 (Raven1975; Dahlgren and Thorne 1984), which is consistentwith one of the available counts from Olisbeoideae, aroot-tip (mitotic) count of 2n � 24 for Warneckea cin-namomoides (G. Don) Jacq.-Fel. (Favarger 1962). The fewremaining counts from the subfamily are consistentwith a base number of x � 7, including n � 7 meioticcounts for Memecylon heyneanum Benth. ex Wight &Arn. (Subramanyam 1942), Spathandra blakeoides (Fa-varger 1962), and M. edule Roxb. (Meenakumari andKuriachan 1990), as well as a mitotic count of 2n � 14for Mouriri myrtilloides (Sw.) Poir. (Solt and Wurdack1980). Additional chromosome counts are needed fromoutgroup taxa (e.g., Pternandra, Melastomataceae sub-fam. Astronioideae, Crypteroniaceae) to test this hy-pothesis.
Strongly acrodromous leaf venation, defined by thepresence of one or more pairs of well-developed lateralnerves, occurs in Spathandra, Lijndenia, and Warneckea.Assuming that this feature is plesiomorphic (Jacques-Felix 1995: 247; Stone 2004), then the venation patternfound in Memecylon, Mouriri, and Votomita—best de-scribed as obscurely acrodromous (i.e., only the mid-nerve conspicuous, the lateral nerves intramarginaland � invisible)—is derived. Evolution of leaf venationpatterns in Olisbeoideae, examined with the Fitch op-timization method according to the phylogenetic rela-tionships inferred by GapC, consistently resolvedstrongly acrodromous venation (the same characterstate as seen in the outgroup, Pternandra) at the firstingroup node. Also resolved were two independent or-igins of obscurely acrodromous venation, once on thebranch leading to Memecylon, and again in the stemlineage of the neotropical subclade (Mouriri � Voto-mita). The exception to this was under the midpointrooting and ACCTRAN optimization, which inferreda single origin of obscurely acrodromous venationwithin the subfamily, followed by a reversal to the an-cestral, strongly acrodromous condition in Spathandra.This last scenario does not seem likely based on theassumption that evolution of strongly acrodromous ve-nation is less likely than loss of that condition. Thestrongly acrodromous condition appears to have beenlost independently at least two more times in Olisbeo-ideae than is reflected by the taxonomic sampling inthe GapC phylogeny—once in the west-central African
118 [Volume 31SYSTEMATIC BOTANY
Warneckea bebaiensis (Gilg ex Engl.) Jacq.-Fel., and againamong some of the Lijndenia species of Madagascar,i.e., Lijndenia lutescens (Naudin) Jacq.-Fel., L. roborea(Naudin) Jacq.-Fel., and L. terminalis Jacq.-Fel.
Rooting the Olisbeoideae Phylogeny. Placement ofthe root node in Olisbeoideae is problematic becauseof the long branch separating this subfamily from itsnearest living relatives (Fig. 5). Although Pternandra asthe hypothesized sister group of Olisbeoideae is ar-guably the best choice of outgroup (Stone 2004), thelikelihood of spurious branch attraction might be re-duced by adding carefully chosen outgroup sequencesto the GapC analysis—specifically, sequences that apriori information suggests might shorten the longbranch between the first ingroup and outgroup nodes.Such selective taxon addition has been shown to im-prove the accuracy of phylogenetic reconstructions,both mathematically (Hendy and Penny 1989) and insimulation studies (e.g., Graybeal 1998). A prime can-didate is one of the early-branching lineages in Mela-stomatoideae, such as Astronia Blume or AstronidiumA. Gray (Stone 2004), although the possibility existsthat GapC sequences from these taxa are paralogouswith those from Olisbeoideae (as was already shownfor Tibouchina in Fig. 2).
The simulation results (Table 2) indicate that thebranch leading to the neotropical subclade (Mouriri �Votomita)—to which the root attaches under maximumparsimony (Fig. 4)—is long enough to be an attractorfor the outgroup branch (Type II error rate � 0.41when the simulated rooting is on an adjacent branch).The midpoint rooting obtained in the maximum-like-lihood analysis (Fig. 5) also attracted the outgroup insimulations, albeit less often (Type II error � 0.15). Amidpoint rooting is expected under a model of rateconstancy across lineages (Table 4; Swofford et al.1996; Sanderson and Shaffer 2002) and was recoveredin all likelihood models incorporating a bias favoringtransitions over transversions (Table 3; Ts/Tv ratio �2.0837 in the best-fit HKY�G model).
Wheeler (1990) emphasized the difficulty of rootingthe ingroup tree if the branch to the outgroup node isvery long and suggested that in these cases the out-group may ‘‘represent nothing more than a randomcollection of character states.’’ Such a random out-group would lack the historical information needed toestablish the proper position of the ingroup root andwould be expected to attach to the longest ingroupbranch. To investigate this hypothesis, 100 random se-quences were generated using MacClade, each se-quence the same length as the GapC ingroup sequencealignment. A set of parsimony analyses was then con-ducted in PAUP* using the GapC ingroup alignmentalong with one of the randomly generated outgroupsequences for each analysis. Under these circumstanc-es, the ingroup root was placed on the longest ingroup
branch (Warneckea sansibarica) in 39 of 100 analyses.Other ingroup branches attracting a random outgroupinclude Votomita (27 trials), Lijndenia barteri (6), and Me-mecylon lateriflorum (4). The root node in the remaining24 trials was placed on other ingroup branches, usuallyon a terminal but occasionally on an internal branch.Parsimony analysis using a random outgroup se-quence did not produce a mid-point rooting, such aswas found in the GapC maximum-likelihood tree (Fig.5). Analyses using non-simulated outgroup sequences(i.e., the sequences actually obtained from Pternandra)did not recover a rooting on the terminal branchesleading to W. sansibarica, Votomita, or L. barteri, regard-less of whether the optimality criterion was parsimonyor likelihood. The GapC sequences of Pternandra thusappear to contain important information for rootingthe ingroup, and root placements obtained from theparsimony and likelihood analyses would not be ex-pected to occur at random.
Although the maximum-parsimony rooting (Fig. 4)provides evidence for deep divergence between Oldand New World lineages of Olisbeoideae, the bootstrapsupport for this hypothesis is less than 50%, and therooting collapsed in the strict consensus of trees thatare one step longer. The maximum-likelihood mid-point rooting (Fig. 5) also has less than 50% bootstrapsupport, but has different implications for the histori-cal biogeography of Olisbeoideae: with that rootingthe Old World lineages together form a paraphyleticgroup, with the New World taxa (i.e., the Mouriri �Votomita subclade) nested within. The historical bio-geography of Olisbeoideae is being investigated sep-arately in the context of fossil-calibrated molecular di-vergence-time estimates (R. D. Stone, unpubl. data).
Preliminary results suggest that a change in basechromosome number has occurred within Olisbeo-ideae, and this, in turn, may bear on the question ofrooting. More chromosome counts are needed, how-ever, both within the subfamily (especially Lijndeniaand Votomita) and from closely related outgroup taxa.Adding more outgroup sequences and sequence datafrom more genomic regions might also be helpful.Phylogenetic theory and practice nonetheless indicatethat the range of model conditions that will produceerroneous reconstructions is greatly expanded underconditions involving such extreme branch-lengthasymmetry. Not only may it prove difficult to find ge-nomic regions (other than GapC) that have evolved atthe proper average rate, but there may be an inherentlimit on the utility of sequence data in solving this andother difficult phylogenetic problems. A more prom-ising approach may be to search for additional struc-tural characters (i.e., insertions, deletions, or rearrange-ments) at the genomic level, as was done here to infera sister-group relationship between Memecylon andSpathandra. Some structural characters, especially re-

2006] 119STONE: MELASTOMATACEAE SUBFAM. OLISBEOIDEAE
arrangements, have been found to be relatively free ofhomoplasy when compared with nucleotide substitu-tions (particularly at deeper phylogenetic levels), andhave provided evidence for other difficult phylogeneticproblems in angiosperms (e.g., Qiu et al. 1999; Grahamet al. 2000). Additional evidence for rooting the Olis-beoideae phylogeny might be provided by gene du-plications, similar to the method used by Mathews andDonoghue (1999) to infer the position of the root nodein angiosperms.
ACKNOWLEDGEMENTS. The author thanks the members of hisdissertation committee—Bruce Baldwin, Rudi Schmid, BrentMishler, and Rosemary Gillespie—for their guidance and con-structive criticism of an earlier version of this work. Comments byM. F. Wojciechowski and an anonymous reviewer were also ben-eficial. Funding and institutional support was provided by the De-partment of Integrative Biology, U. C. Berkeley; the University andJepson Herbaria (especially Isabelle Tavares); and the CaliforniaAcademy of Sciences (Frank Almeda and Brian Fisher). Collectingin Madagascar was possible with assistance and cooperation fromthe Association Nationale pour la Gestion des Aires Protegees(ANGAP), the Madagascar Institute pour la Conservation des En-vironnements Tropicaux (MICET), and the Water & Forestry De-partment, University of Antananarivo (ESSA-Forets). Field work inAfrica was aided by the National Herbarium of Cameroon (GastonAchoundong, Jean-Paul Ghogue); the National Museums of Kenya(Quentin Luke, Helida Oyieke); the Tanzania Commission for Sci-ence and Technology; the Department of Botany, University of Dares Salaam (Herbert Lyaruu, Frank Mbago); and the Royal BotanicGardens, Kew (Martin Cheek). The following are also thanked forcontributing leaf material for DNA analysis: Christopher Baraloto;the CIRAD research station at Paracou, French Guiana (PhilippeBirnbaum, Lilian Blanc, Pascal Petronelli); Gudrun Clausing-Ka-dereit; J. F. Maxwell; the Missouri Botanical Garden (Jim Solomon);Jean-Francois Molino; the National Botanic Garden of Belgium(Frieda Billiet); Susanne Renner; and the U. C. Davis BotanicalConservatory (Ernesto Sandoval).
LITERATURE CITED
AKAIKE, H. 1973. Information theory as an extension of the max-imum likelihood principle. Pp. 267–281 in Proceedings of the2nd International Symposium on Information Theory, eds. B. Pe-trov and F. Csaki. Budapest: Akademiai Kiado.
———. 1974. A new look at the statistical model identification.Institute of Electrical and Electronics Engineers, Transactions onAutomatic Control 19: 716–723.
ALBERT, V. A., B. D. MISHLER, and M. W. CHASE. 1992. Character-state weighting for restriction site data in phylogenetic re-construction, with an example from chloroplast DNA. Pp.369–403 in Molecular systematics of plants, eds. P. S. Soltis, D.E. Soltis, and J. J. Doyle. New York: Chapman & Hall.
ALTSCHUL, S. F., T. L. MADDEN, A. A. SCHAFFER, J. ZHANG, Z.ZHANG, W. MILLER, and D. J. LIPMAN. 1997. Gapped BLASTand PSI-BLAST: a new generation of protein database searchprograms. Nucleic Acids Research 25: 3389–3402.
BAKHUIZEN VAN DEN BRINK, R. C. 1943. A contribution to theknowledge of the Melastomataceae occurring in the MalayArchipelago especially in the Netherlands East Indies. Me-dedelingen van het Botanisch Museum en Herbarium van de Rijk-suniversiteit te Utrecht 91: 1–391.
BALDWIN, B. G., M. J. SANDERSON, J. M. PORTER, M. F. WOJCIE-CHOWSKI, C. S. CAMPBELL, and M. J. DONOGHUE. 1995. TheITS region of nuclear ribosomal DNA: a valuable source of
evidence on angiosperm phylogeny. Annals of the Missouri Bo-tanical Garden 82: 247–277.
BEUSEKOM-OSINGA, R. J. VAN and C. F. VAN BEUSEKOM. 1975. De-limitation and subdivision of the Crypteroniaceae (Myrtales).Blumea 22: 255–266.
BREMER, K. 1981. Seeds and embryos in Sri Lanka (Ceylonese)species of Memecylon, with notes on Spathandra (Melastoma-taceae). Nordic Journal of Botany 1: 62–65.
———. 1982. Lijndenia, a re-established paleotropical genus of theMelastomataceae—Memecyleae. Nordic Journal of Botany 2:121–124.
———. 1988. The limits of amino-acid sequence data in angio-sperm phylogenetic reconstruction. Evolution 42: 795–803.
BRUMMITT, R. K. and C. E. POWELL, eds. 1992. Authors of plantnames. Kew: Royal Botanic Gardens.
CHASE, M. W. and H. H. HILLS. 1991. Silica gel: an ideal materialfor field preservation of leaf samples for DNA studies. Taxon40: 215–220.
CLAUSING, G. and S. S. RENNER. 2001. Molecular phylogenetics ofMelastomataceae and Memecylaceae: implications for char-acter evolution. American Journal of Botany 88: 486–498.
COGNIAUX, C. A. 1891. Melastomaceae. Monographiae phaneroga-marum, vol. 7, ed. A. de Candolle. Paris: G. Masson.
CONTI, E., A. LITT, P. G. WILSON, S. A. GRAHAM, B. G. BRIGGS, L.A. S. JOHNSON, and K. J. SYTSMA. 1987. Interfamilial relation-ships in Myrtales: molecular phylogeny and patterns of mor-phological evolution. Systematic Botany 22: 629–647.
DAHLGREN, R. and R. F. THORNE. 1984. The order Myrtales: cir-cumscription, variation, and relationships. Annals of the Mis-souri Botanical Garden 71: 633–699.
FAVARGER, C. 1962. Nouvelles recherches cytologiques sur les Me-lastomatacees. Berichte der Schweizerischen Botanischen Gesell-schaft 72: 290–305.
FELSENSTEIN, J. 1978. Cases in which parsimony and compatibilitywill be positively misleading. Systematic Zoology 27: 401–410.
———. 1981. Evolutionary trees from DNA sequences: a maxi-mum likelihood approach. Journal of Molecular Evolution 17:368–376.
———. 1985. Confidence limits on phylogenies: an approach usingthe bootstrap. Evolution 39: 783–791.
FITCH, W. M. 1971. Toward defining the course of evolution: min-imum change for a specific tree topology. Systematic Zoology20: 406–416.
GRAHAM, S. W., P. A. REEVES, A. C. E. BURNS, and R. G. OLMSTEAD.2000. Microstructural changes in noncoding chloroplastDNA: interpretation, evolution, and utility of indels and in-versions in basal angiosperm phylogenetic inference. Inter-national Journal of Plant Sciences 161(6, supplement): S83–S96.
GRAYBEAL, A. 1998. Is it better to add taxa or characters to a dif-ficult phylogenetic problem? Systematic Biology 47: 9–17.
HASEGAWA, M., H. KISHINO, and T. YANO. 1985. Dating of thehuman-ape splitting by a molecular clock of mitochondrialDNA. Journal of Molecular Evolution 22: 160–174.
HENDY, M. D. and D. PENNY. 1989. A framework for the quanti-tative study of evolutionary trees. Systematic Zoology 38: 297–309.
HOLMGREN, P. K., N. H. HOLMGREN, and L. C. BARNETT. 1990.Index herbariorum. Part I: The herbaria of the world, ed. 8. Bronx:New York Botanical Garden.
HUELSENBECK, J. P. and B. RANNALA. 1997. Phylogenetic methodscome of age: testing hypotheses in an evolutionary context.Science 276: 227–232.
———, D. M. HILLIS, and R. JONES. 1996. Parametric bootstrap-ping in molecular phylogenetics: applications and perfor-mance. Pp. 19–45 in Molecular zoology: advances, strategies, andprotocols, eds. J. D. Ferraris and S. R. Palumbi. New York: Wi-ley-Liss.

120 [Volume 31SYSTEMATIC BOTANY
JACQUES-FELIX, H. 1977. La graine et l’embryon chez les Memecylon(Melastomatacees) africains. Adansonia, ser. 2, 17: 193–200.
———. 1978a. Les subdivisions du genre Memecylon (Melastoma-taceae) en Afrique. Adansonia, ser. 2, 17: 415–424.
———. 1978b. Les genres de Memecyleae (Melastomataceae) enAfrique, Madagascar et Mascareignes. Adansonia, ser. 2, 18:221–235.
———. 1984 [1985a]. Les Memecyleae (Melastomataceae) de Mad-agascar (1re partie). Bulletin du Museum national d’Histoire na-turelle, Paris, ser. 4, sect. B (Adansonia), 6: 383–451.
———. 1985b. Les Memecyleae (Melastomataceae) de Madagascar(2e partie). Bulletin du Museum national d’Histoire naturelle, Par-is, ser. 4, sect. B (Adansonia), 7: 3–58.
———. 1994 [1995]. Histoire des Melastomataceae d’Afrique. Bul-letin du Museum national d’Histoire naturelle, Paris, ser. 4, sect.B (Adansonia), 16: 235–311.
——— and J. A. MOUTON. 1980. Identification des Memecyleae(Melastomataceae) de l’Ouest-Africain d’apres leurs carac-teres vegetatifs. Bulletin du Museum national d’Histoire natu-relle, Paris, ser. 4, sect. B, 2(1): 3–19.
———, ———, and M. CHALOPIN. 1978. Nervation et types foli-ares chez les Memecylon (Melast.) africains. Adansonia, ser. 2,18: 67–81.
JEANMOUGIN, F., J. D. THOMPSON, M. GOUY, D. G. HIGGINS, and T.J. GIBSON. 1998. Multiple sequence alignment with Clustal X.Trends in Biochemical Sciences 23: 403–405.
JUKES, T. H. and C. R. CANTOR. 1969. Evolution of protein mole-cules. Pp. 21–132 in Mammalian protein metabolism, ed. H.Munro. New York: Academic Press.
KIMURA, M. 1980. A simple method for estimating evolutionaryrate of base substitutions through comparative studies of nu-cleotide sequences. Journal of Molecular Evolution 16: 111–120.
LANAVE, C., G. PREPARATA, C. SACCONE, and G. SERIO. 1984. Anew method for calculating evolutionary substitution rates.Journal of Molecular Evolution 20: 86–93.
MADDISON, W. P. and D. R. MADDISON. 2000. MacClade: analysisof phylogeny and character evolution, version 4.0. Sunder-land: Sinauer Associates.
MANJUNATH, S. and M. M. SACHS. 1997. Molecular characteriza-tion and promoter analysis of the maize cytosolic glyceral-dehyde 3-phosphate dehydrogenase gene family and its ex-pression during anoxia. Plant Molecular Biology 33: 97–112.
MARTIN, W., D. LYDIATE, H. BRINKMANN, G. FORKMANN, H. SAE-DLER, and R. CERFF. 1993. Molecular phylogenies in angio-sperm evolution. Molecular Biology and Evolution 10: 140–162.
MATHEWS, S. and M. J. DONOGHUE. The root of angiosperm phy-logeny inferred from duplicate phytochrome genes. Science286: 947–950.
MEENAKAMURI, R. and P. KURIACHAN. 1990. SOCGI plant chro-mosome number reports–X. Journal of Cytology and Genetics25: 321–322.
MORLEY, T. 1963. Votomita Aublet (Melastomataceae). Bulletin of theTorrey Botanical Club 90: 1–16.
———. 1976. Memecyleae (Melastomataceae). Flora NeotropicaMonograph 15: 1–295.
OLSEN, K. M. and B. A. SCHAAL. 1999. Evidence on the origin ofcassava: phylogeography of Manihot esculenta. Proceedings ofthe National Academy of Sciences USA 96: 5586–5591.
PERUSSE, J. R. and D. J. SCHOEN. 2004. Molecular evolution of theGapC gene family in Amsinckia spectabilis populations that dif-fer in outcrossing rate. Journal of Molecular Evolution 59: 427–436.
POSADA, D. and K. A. CRANDALL. 1998. MODELTEST: testing themodel of DNA substitution. Bioinformatics 14: 817–818.
QIU, Y.-L., J. LEE, F. BERNASCONI-QUADRONI, D. E. SOLTIS, P. S.SOLTIS, M. ZANIS, E. A. ZIMMER, Z. CHEN, V. SAVOLAINEN,and M. W. CHASE. 1999. The earliest angiosperms: evidence
from mitochondrial, plastid and nuclear genomes. Nature 410:404–407.
RAMBAUT, A. and N. C. GRASSLY. 1997. Seq-Gen: an applicationfor the Monte Carlo simulation of DNA sequence evolutionalong phylogenetic trees. Computer Applications in the Biosci-ences 13: 235–238.
RAO, T. A. and H. JACQUES-FELIX. 1978. Les types de sclerites fo-liaires et la classification des Memecylon africains. Adansonia,ser. 2, 18: 59–66.
———, K. BREMER, and T. R. B. NAIDU. 1983. Foliar sclereids inMemecylon and Lijndenia (Melastomataceae) from Borneo,Java, Malaya and Sumatra. Nordic Journal of Botany 3: 343–345.
RAVEN, P. H. 1975. The bases of angiosperm phylogeny: cytology.Annals of the Missouri Botanical Garden 62: 724–764.
RODRıGUEZ, F., J. L. OLIVER, A. MARIN, and J. R. MEDINA. 1990.The general stochastic model of nucleotide substitution. Jour-nal of Theoretical Biology 142: 485–501.
RUSSELL, D. A. and M. M. SACHS. 1989. Differential expression andsequence analysis of the maize glyceraldehyde 3-phosphatedehydrogenase gene family. Plant Cell 1: 793–803.
RUTSCHMANN, F., T. ERIKSSON, J. SCHONENBERGER, and E. CONTI.2004. Did Crypteroniaceae really disperse out of India? Mo-lecular dating evidence from rbcL, ndhF, and rpl16 intron se-quences. International Journal of Plant Sciences 165(4, supple-ment): S69–S83.
SANDERSON, M. J. 1998. Estimating rate and time in molecular phy-logenies: beyond the molecular clock? Pp. 242–264 in Molec-ular systematics of plants II: DNA sequencing, eds. D. E. Soltis,P. S. Soltis, and J. J. Doyle. Dordrecht: Kluwer Academic Pub-lishers.
——— and H. B. SHAFFER. 2002. Troubleshooting molecular phy-logenetic analyses. Annual Review of Ecology and Systematics33: 49–72.
SANG, T. 2002. Utility of low-copy nuclear gene sequences in plantphylogenetics. Critical Reviews in Biochemistry and MolecularBiology 37: 121–147.
SHAW, J., E. B. LICKEY, J. T. BECK, S. B. FARMER, W. LIU, J. MILLER,K. C. SIRIPUN, C. T. WINDER, E. E. SCHILLING, and R. L.SMALL. 2005. The tortoise and the hare II: relative utility of21 noncoding chloroplast DNA sequences for phylogeneticanalysis. American Journal of Botany 92: 142–166.
SHIMODAIRA, H. and M. HASEGAWA. 1999. Multiple comparisonsof log-likelihoods with applications to phylogenetic inference.Molecular Biology and Evolution 16: 1114–1116.
SIMMONS, M. P. and H. OCHOTERENA. 2000. Gaps as characters insequence-based phylogenetic analyses. Systematic Biology 49:369–381.
SMALL, R. L., R. C. CRONN, and J. F. WENDEL. 2004. Use of nucleargenes for phylogeny reconstruction in plants. Australian Sys-tematic Botany 17: 145–170.
SOLT, M. L. and J. J. WURDACK. 1980. Chromosome numbers inthe Melastomataceae. Phytologia 47: 199–220.
SOLTIS, D. E. and P. S. SOLTIS. 1998. Choosing an approach and anappropriate gene for phylogenetic analysis. Pp. 1–42 in Mo-lecular systematics of plants II: DNA sequencing, eds. D. E. Soltis,P. S. Soltis, and J. J. Doyle. Dordrecht: Kluwer Academic Pub-lishers.
STEEL, M., D. HUSON, and P. J. LOCKHART. 2000. Invariable sitesmodels and their use in phylogeny reconstruction. SystematicBiology 49: 225–232.
STONE, R. D. 2004. Phylogenetic systematics of Melastomataceae, sub-family Olisbeoideae, a species-rich and geographically widespreadgroup of tropical forest understory trees. Ph.D. dissertation, Uni-versity of California, Berkeley.
STRAND, A. E., J. LEEBENS-MACK and B. G. MILLIGAN. 1997. Nu-clear DNA-based markers for plant evolutionary biology. Mo-lecular Ecology 6: 113–118.
SUBRAMANYAM, K. 1942. Gametogenesis and embryogeny in a few

2006] 121STONE: MELASTOMATACEAE SUBFAM. OLISBEOIDEAE
members of the Melastomaceae. Journal of the Indian BotanicalSociety 21: 69–85.
SWOFFORD, D. L. 2002. PAUP*: Phylogenetic analysis using parsi-mony (*and other methods), version 4.0 beta 10. Sunderland:Sinauer Associates.
———, G. J. OLSEN, P. J. WADDELL, and D. M. HILLIS. 1996. Phy-logenetic inference. Pp. 407–514 in Molecular systematics, ed.2, eds. D. M. Hillis, C. Moritz, and B. K. Mable. Sunderland:Sinauer Associates.
WALL, D. P. 2002. Use of the nuclear gene glyceraldehyde 3-phos-phate dehydrogenase for phylogeny reconstruction of re-cently diverged lineages in Mitthyridium (Musci: Calymper-aceae). Molecular Phylogenetics and Evolution 25: 10–26.
WHEELER, W. C. 1990. Nucleic acid sequence phylogeny and ran-dom outgroups. Cladistics 6: 363–367.
WOLFE, K. H., W.-H. LI, and P. M. SHARP. 1987. Rates of nucleotidesubstitution vary greatly among plant mitochondrial, chlo-roplast, and nuclear DNAs. Proceedings of the National Academyof Sciences USA 84: 9054–9058.
YANG, Z. 1993. Maximum-likelihood estimation of phylogeny fromDNA sequences when substitution rates differ over sites. Mo-lecular Biology and Evolution 10: 1396–1401.
———. 1994. Maximum likelihood phylogenetic estimation fromDNA sequences with variable rates over sites: approximatemethods. Journal of Molecular Evolution 39: 306–314.
———. 1998. On the best evolutionary rate for phylogenetic anal-ysis. Systematic Biology 47: 125–133.
APPENDIX 1Voucher specimens and GenBank accession numbers for se-
quenced GapC isolates. Authors of taxon names follow Brummittand Powell (1992). Herbarium acronyms follow Holmgren et al.(1990). Specimens are deposited at CAS unless noted otherwise.Ingroup samples
Lijndenia barteri (Hook. f.) K. Bremer—Stone et al. 2533 (Cam-eroon). Clone 8.1 (871 bp): AY903376; clone 8.2 (871 bp): AY903377.Lijndenia cf. brenanii (A. Fern. & R. Fern.) Jacq.-Fel.—Stone et al.2438 (Tanzania). Clone 4.1 (871 bp): AY903378; clone 4.2 (870 bp):AY903379; clone 4.3 (871 bp): AY903380. Lijndenia danguyana (H.Perrier) Jacq.-Fel.—Stone et al. 2377 (Madagascar). Clone 2.2 (872bp): AY903381. Lijndenia procteri (A. Fern. & R. Fern.) Borhidi—Stone et al. 2440 (Tanzania). Clone 5.3 (871 bp): AY903382 (clone5.6 identical); clone 5.4 (870 bp): AY903383. Memecylon cf. baker-ianum Cogn.—Stone et al. 2374 (Madagascar). Clone 4.3 (843 bp):AY903384; clone 4.4 (843 bp): AY903385; clone 4.5 (843 bp):AY903386; clone 4.9 (843 bp): AY903387. Memecylon lateriflorum
(G. Don) Bremek.—Merello et al. 1352, MO (Ghana). Clone 1.6 (847bp): AY903388 (clone 1.7 identical); clone 1.8 (847 bp): AY903389.Memecylon roseum H. Perrier—Stone et al. 2370 (Madagascar).Clone 2.17 (844 bp): AY903390; clone 2.18 (844 bp): AY903391. Me-mecylon thouarsianum Naudin—Stone et al. 2371 (Madagascar).Clone 3.5 (843 bp): AY903392; clone 3.6 (844 bp): AY903393; clone3.7 (843 bp): AY903394. Mouriri dumetosa Cogn.—Petronelli & Bar-aloto s.n. (French Guiana, Paracou, plot 1, individual x857). Clone5.5 (867 bp): AY903395. Mouriri sagotiana Triana—Molino 2026,CAY (French Guiana). Clone 6.1 (870 bp): AY903396. Spathandrablakeoides (G. Don) Jacq.-Fel.—J. Stone et al. 3261, MO (Gabon).Clone 5.2 (848 bp): AY903397; clone 5.3 (848 bp): AY903398. Vo-tomita guianensis Aubl.—Petronelli & Baraloto s.n. (French Guiana,Paracou, plot 6c4, individual 659). Clone 3.1 (872 bp): AY903399.Warneckea fascicularis (Planch. ex Benth.) Jacq.-Fel. var. man-grovensis Jacq.-Fel.—Stone & Ghogue 2539 (Cameroon). Clone 2.1(874 bp): AY903400; clone 2.2 (876 bp): AY903401; clone 2.5 (875bp): AY903402. Warneckea madagascariensis Jacq.-Fel.—Stone et al.2395 (Madagascar). Clone 3.3 (878 bp): AY903403 (clone 3.5 iden-tical); clone 3.4 (878 bp): AY903404. Warneckea membranifolia(Hook. f.) Jacq.-Fel.—Living specimen at National Botanic Gardenof Belgium (probably from the same source as material voucheredby Laan 156 and Laan 259, WAG, cult. from seed collected in IvoryCoast). Clone 1.1 (876 bp): AY903405 (clone 1.2 identical); clone1.3 (876 bp): AY903406. Warneckea sansibarica (Taub.) Jacq.-Fel.—Stone et al. 2423 (Kenya). Clone 3.5 (861 bp): AY903407.—Stone etal. 2426 (Kenya). Clone 1.1 (861 bp): AY903408; clone 1.2 (861 bp):AY903409; clone 1.3 (861 bp): AY903410.Outgroup samples
Crypteronia paniculata Blume—Maxwell 01–156, CMU (Thai-land). Clone 2.3 (1030 bp): AY903411; clone 2.5 (1026 bp):AY903412; clone 2.7 (1030 bp): AY903413; clone 2.9 (1025 bp):AY903414. Heteropyxis natalensis Harv.—Stone 2368 (ex hort.,Univ. Calif. Davis Botanical Conservatory, from seed obtained inSouth Africa). Clone 1.2 (972 bp): AY903415; clone 1.4 (1048 bp):AY903416; clone 1.5 (1049 bp): AY903417 (clone 1.8 identical); clone1.6 (1048 bp): AY903418; clone 1.10 (1049 bp): AY903419. Pternan-dra coerulescens Jack—Clausing 175, MJG, UNIMAS (Malaysia: Sa-rawak). Clone 1.3 (973 bp): AY903420; clone 1.4 (973 bp):AY903421; clone 1.5 (973 bp): AY903422; clone 2.1 (764 bp):AY903423; clone 2.2 (764 bp): AY903424 (clone 2.3 identical); clone2.4 (764 bp): AY903425. Pternandra multiflora Cogn.—Clausing142, MJG, UNIMAS (Malaysia: Sarawak). Clone 3.1 (979 bp):AY903426; clone 3.3 (978 bp): AY903427 (clone 3.6 identical). Ti-bouchina urvilleana (DC.) Cogn.—Stone 2572 (ex hort., Berkeley,Calif.). Clone 3.1 (736 bp): AY903428 (clones 3.4 & 3.5 identical);clone 3.2 (736 bp): AY903429; clone 3.3 (735 bp): AY903430.