A hydroclimatic regionalization of central Mongolia as inferred from tree rings
Molecular Phylogenetics and Evolution 42 (2007) 287–297www.elsevier.com/locate/ympev
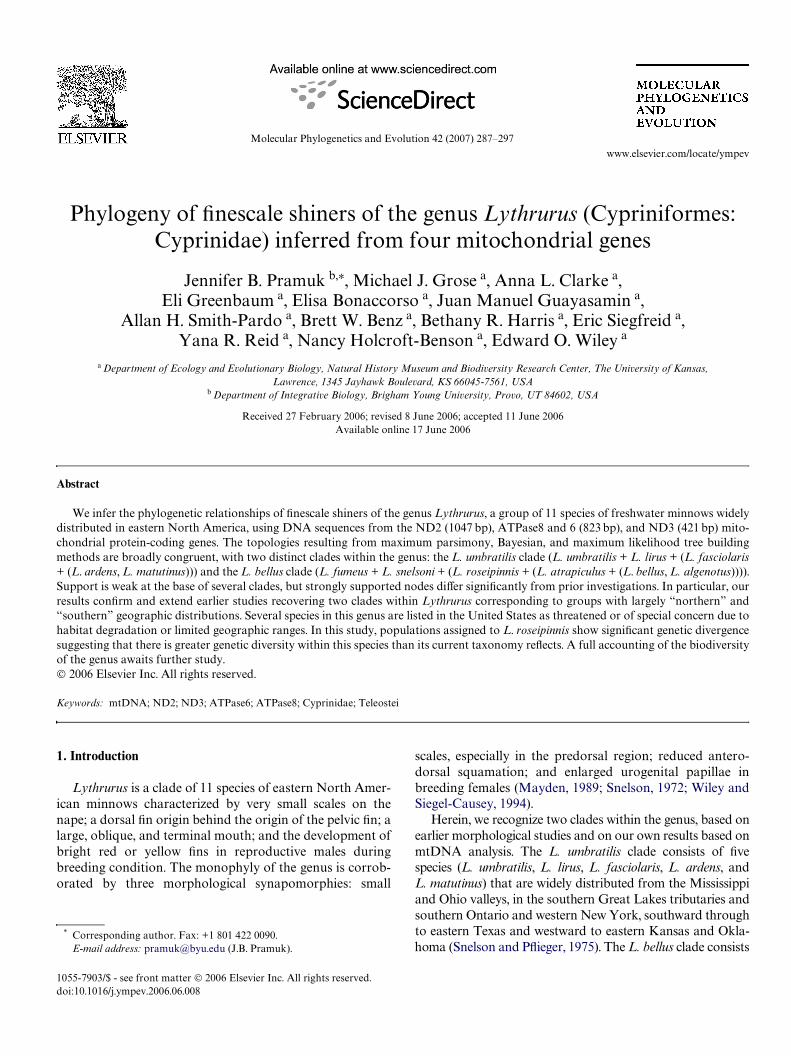
Phylogeny of Wnescale shiners of the genus Lythrurus (Cypriniformes: Cyprinidae) inferred from four mitochondrial genes
Jennifer B. Pramuk b,¤, Michael J. Grose a, Anna L. Clarke a, Eli Greenbaum a, Elisa Bonaccorso a, Juan Manuel Guayasamin a,
Allan H. Smith-Pardo a, Brett W. Benz a, Bethany R. Harris a, Eric Siegfreid a, Yana R. Reid a, Nancy Holcroft-Benson a, Edward O. Wiley a
a Department of Ecology and Evolutionary Biology, Natural History Museum and Biodiversity Research Center, The University of Kansas, Lawrence, 1345 Jayhawk Boulevard, KS 66045-7561, USA
b Department of Integrative Biology, Brigham Young University, Provo, UT 84602, USA
Received 27 February 2006; revised 8 June 2006; accepted 11 June 2006Available online 17 June 2006
Abstract
We infer the phylogenetic relationships of Wnescale shiners of the genus Lythrurus, a group of 11 species of freshwater minnows widelydistributed in eastern North America, using DNA sequences from the ND2 (1047 bp), ATPase8 and 6 (823 bp), and ND3 (421 bp) mito-chondrial protein-coding genes. The topologies resulting from maximum parsimony, Bayesian, and maximum likelihood tree buildingmethods are broadly congruent, with two distinct clades within the genus: the L. umbratilis clade (L. umbratilis + L. lirus + (L. fasciolaris+ (L. ardens, L. matutinus))) and the L. bellus clade (L. fumeus + L. snelsoni + (L. roseipinnis + (L. atrapiculus + (L. bellus, L. algenotus)))).Support is weak at the base of several clades, but strongly supported nodes diVer signiWcantly from prior investigations. In particular, ourresults conWrm and extend earlier studies recovering two clades within Lythrurus corresponding to groups with largely “northern” and“southern” geographic distributions. Several species in this genus are listed in the United States as threatened or of special concern due tohabitat degradation or limited geographic ranges. In this study, populations assigned to L. roseipinnis show signiWcant genetic divergencesuggesting that there is greater genetic diversity within this species than its current taxonomy reXects. A full accounting of the biodiversityof the genus awaits further study.© 2006 Elsevier Inc. All rights reserved.
Keywords: mtDNA; ND2; ND3; ATPase6; ATPase8; Cyprinidae; Teleostei
1. Introduction
Lythrurus is a clade of 11 species of eastern North Amer-ican minnows characterized by very small scales on thenape; a dorsal Wn origin behind the origin of the pelvic Wn; alarge, oblique, and terminal mouth; and the development ofbright red or yellow Wns in reproductive males duringbreeding condition. The monophyly of the genus is corrob-orated by three morphological synapomorphies: small
* Corresponding author. Fax: +1 801 422 0090.E-mail address: [email protected] (J.B. Pramuk).
1055-7903/$ - see front matter © 2006 Elsevier Inc. All rights reserved.doi:10.1016/j.ympev.2006.06.008
scales, especially in the predorsal region; reduced antero-dorsal squamation; and enlarged urogenital papillae inbreeding females (Mayden, 1989; Snelson, 1972; Wiley andSiegel-Causey, 1994).
Herein, we recognize two clades within the genus, based onearlier morphological studies and on our own results based onmtDNA analysis. The L. umbratilis clade consists of Wvespecies (L. umbratilis, L. lirus, L. fasciolaris, L. ardens, andL. matutinus) that are widely distributed from the Mississippiand Ohio valleys, in the southern Great Lakes tributaries andsouthern Ontario and western New York, southward throughto eastern Texas and westward to eastern Kansas and Okla-homa (Snelson and PXieger, 1975). The L. bellus clade consists

288 J.B. Pramuk et al. / Molecular Phylogenetics and Evolution 42 (2007) 287–297
of six species (L. fumeus, L. snelsoni, L. bellus, L. alegnotus, L.roseipinnis, and L. atrapiculus) with distributions centered inthe Mississippi River and northern Gulf Coast. The currentlyrecognized taxonomy of Lythrurus largely results from a revi-sion of the L. roseipinnis complex presented by Snelson(1972). Boschung and Mayden (2004) review more recent tax-onomic changes that have resulted in the 11 species now rec-ognized. A map illustrating generalized geographicdistributions of the 11 Lythrurus species is presented in Fig. 1.
Phylogenetic relationships of Lythrurus to otherNorth American minnows remain unclear. Mayden(1989) hypothesized that Lythrurus is the sister of a cladecomposed of the genera Cyprinella and Luxilus based onthree synapomorphies (large cephalic tubercles, submar-ginal tubercles on body scales, and a triangular palatine).Coburn and Cavender (1992) placed Pimephales andOpsopeodus in this clade, with Luxilus basal to Lythrurus.Molecular analyses corroborate a close relationshipbetween Pimphales and Opospoeodus (Simons et al., 2003)
Fig. 1. Map of the generalized geographic distribution of the 11 species ofLythrurus in eastern North America corresponding to clades with largelynorthern (A) and southern (B) distributions. [modiWed from Schmidt et al.(1998; Fig. 1)].
B
Southern Clade
A
Northern Clade
but not their close relationship to Lythrurus, Cyprinella,and Luxilus.
Until now, no single study of the relationships among allcurrently recognized species of Lythrurus has been accom-plished. Stein et al. (1985) used allozymes and distanceanalysis to study the L. roseipinnis group. Mayden (1989)included seven species in his morphological analysis andWiley and Siegel-Causey (1994) used a combination of allo-zymes and morphology in a phylogenetic analysis of thesame seven species. In their phylogenetic analysis of cyto-chrome-b sequence data, Schmidt et al. (1998) added anadditional species (L. snelsoni) not analyzed by Wiley andSiegel-Causey. As discussed herein, the only phylogeneticconclusion prior studies appear to agree on is the mono-phyly of the L. roseipinnis species group, composed ofL. alegnotus, L. atrapiculus, L. bellus, and L. roseipinnis.The primary goal of this study is to test previous hypothe-ses of relationships among species of Lythrurus using thefull complement of currently recognized species. In addi-tion, we take the opportunity to revisit the biogeography ofthe group and to suggest that an understanding of the bio-diversity of Lythrurus at the species level is still incomplete.
2. Materials and methods
2.1. Taxon sampling
Forty-one specimens representing all 11 species ofLythrurus and one specimen from each of two outgroupspecies, C. lutrensis and Pteronotropis signipinnis, were sam-pled. In the absence of strong molecular corroboration foreither the “basal” or “apical” position of Luxilus (Simonset al., 2003), C. lutrensis and P. signipinnis were selected asoutgroups based on the relationships recovered by Mayden(1989) and Coburn and Cavender (1992). Specimen locali-ties, tissue numbers, and GenBank accession numbers foreach sequenced gene region are listed in Table 1.
2.2. DNA extraction, PCR ampliWcation, and sequencing of mtDNA
Total genomic DNA was extracted from small amounts(»25 mg) of frozen or ethanol preserved tissues with aDneasy Tissue Kit® (Qiagen, Inc.) and visualized on 1%high melt agarose gels in TAE buVer. PCR was performedin 50 �l reactions containing 0.5 U of Taq polymerase(Fisher), »200 ng of genomic DNA, 10 pmol of eachprimer, 15 nmol of each dNTP, 50 nmol of MgCl2, andbuVer (Fisher). AmpliWcation followed published PCR con-ditions (Palumbi, 1996) and was performed on a BioRad(MyCycler) thermalcycler. AmpliWed products were puri-Wed with AMPure magnetic beads (Agencourt). Cyclesequencing reactions were completed with dye terminatorcycle sequencing (DTCS) quick start kit (Beckman Coul-ter), with minor modiWcations of the reaction conditions(4 �l kit instead of 8 �l). Sequencing reactions were puriWedwith CleanSEQ magnetic beads (Agencourt) and loaded

J.B. Pramuk et al. / Molecular Phylogenetics and Evolution 42 (2007) 287–297 289
Table 1Taxa of Lythrurus and outgroups used in this study, their associated locality data and voucher ID numbers, and GenBank accession numbers for each ofthe three mitochondrial gene fragments ND2, ATPase8 and 6, and ND3
Taxa Geographic location GenBank numbers
Voucher ID ND2 ATPase8 and 6
ND3
Outgroups:C. lutrensis Kansas River, below Bowersock Dam, Lawrence, KS T530, KU 27255 DQ306610 DQ306653 DQ306567P. signipinnis Perdido River, at Florida Route 112 on Alabama border T5775, KU 33937 DQ306611 DQ306654 DQ306568Ingroup taxa:L. alegnotus 5 Five Mile Creek at old bridge, just downstream of I-59/20 (Valley Creek),
ALUAIC 11055.01-1 DQ306630 DQ306673 DQ306587
L. alegnotus 6 Five Mile Creek at old bridge, just downstream of I-59/20 (Valley Creek), AL
UAIC 11055.01-2 DQ306631 DQ306674 DQ306588
L. alegnotus 7 Five Mile Creek at old bridge, just downstream of I-59/20 (Valley Creek), AL
UAIC 11055.01-3 DQ306632 DQ306675 DQ306589
L. alegnotus 8 Five Mile Creek at old bridge, just downstream of I-59/20 (Valley Creek), AL
UAIC 11055.01-4 DQ306633 DQ306676 DQ306590
L. alegnotus 9 Five Mile Creek at old bridge, just downstream of I-59/20 (Valley Creek), AL
UAIC 11055.01-5 DQ306634 DQ306677 DQ306591
L. ardens 1 Little R. at Dick Binns Rd. ca. 2 mi. SW of Garrett Crossing, VA UMSL 649.01-1 DQ306640 DQ306683 DQ306597L. ardens 2 Little R. at Dick Binns Rd. ca. 2 mi. SW of Garrett Crossing, VA UMSL 649.01-3 DQ306641 DQ306684 DQ306598L. ardens 3 Little R. at Dick Binns Rd. ca. 2 mi. SW of Garrett Crossing, VA UMSL 649.01-2 DQ306642 DQ306685 DQ306599L. ardens 4 Dan River at public access oV of NC Hwy 8/89, 2.3 mi N of Hanging
Rock, NCUAIC 12463-1 DQ306643 DQ306686 DQ306600
L. atrapiculus Panther Creek at US 84, west of Dothan, AL T5769 DQ306622 DQ306665 DQ306579L. atrapiculus Big Horse Creek, FL T5770 DQ306623 DQ306666 DQ306580L. atrapiculus Big Horse Creek at FL 2, 2.5 mi. E of junction of FL 2 and 189 T5771, KU 21896 DQ306624 DQ306667 DQ306581L. atrapiculus Boggy Branch of Sepulga River at Highway 31, AL T5773 DQ306625 DQ306668 DQ306582L. bellus Mill Creek at Route 82 just W of Tuscaloosa, AL T5744 DQ306626 DQ306669 DQ306583L. bellus Small Creek, N of Eutaw, 0.1 mi. N of junction of County Road 55 and
AL 43 on Ala. Rt. 43, ALT5745, KU 21871 DQ306627 DQ306670 DQ306584
L. bellus Oakmulgee Creek, at AL 14, NW of Selma, AL T5747 DQ306629 DQ306672 DQ306586L. bellus Small Creek, N of Eutaw, 0.1 mi. N of junction of County Road 55 and
AL 43 on Ala. Rt. 43, ALT5746, KU 21871 DQ306628 DQ306671 DQ306585
L. fasciolaris 13 Rockcastle River along KY Hwy 89, ca. 1.7 mi NE of KY Hwy 490, KY UAIC 9851.02-2 DQ306646 DQ306689 DQ306603L. fasciolaris 14 Rockcastle River along KY Hwy 89, ca. 1.7 mi NE of KY Hwy 490, KY UAIC 9851.02-1 DQ306647 DQ306690 DQ306604L. fasciolaris 15 Rockcastle River along KY Hwy 89, ca. 1.7 mi NE of KY Hwy 490, KY UAIC 9851.02-3 DQ306648 DQ306691 DQ306605L. fumeus Lick Creek at TN 144, TN T5754, KU 23984 DQ306612 DQ306655 DQ306569L. fumeus Lick Creek at TN 144, TN T5755, KU 23984 DQ306613 DQ306656 DQ306570L. lirus 1 Fourmile Creek at Co. Rd. 49, 1 mi W of Fourmile (Yellowleaf Creek), AL UAIC 14147.01-1 DQ306614 DQ306657 DQ306571L. lirus 2 Fourmile Creek at Co. Rd. 49, 1 mi W of Fourmile (Yellowleaf Creek), AL UAIC 14147.01-2 DQ306615 DQ306658 DQ306572L. lirus 3 Fourmile Creek at Co. Rd. 49, 1 mi W of Fourmile (Yellowleaf Creek), AL UAIC 14147.01-3 DQ306616 DQ306659 DQ306573L. lirus 4 Fourmile Creek at Co. Rd. 49, 1 mi W of Fourmile (Yellowleaf Creek), AL UAIC 14147.01-4 DQ306617 DQ306660 DQ306574L. lirus 5 Fourmile Creek at Co. Rd. 49, 1 mi W of Fourmile (Yellowleaf Creek), AL UAIC 14147.01-5 DQ306618 DQ306661 DQ306575L. matutinus 10 Tar River at Co. Rd. 1243/1003, 2.4 mi NE of Mitchiners Crossroads, NC UAIC 11003.03-5 DQ306644 DQ306687 DQ306601L. matutinus 12 Tar River at Co. Rd. 1243/1003, 2.4 mi NE of Mitchiners Crossroads, NC UAIC 11003.03-3 DQ306645 DQ306688 DQ306602L. roseipinnis Beasha Creek, 4 mi E Laurel Hill on Rt. 488, MS T5764, KU 22873 DQ306635 DQ306678 DQ306592L. roseipinnis Tributary to Brusky Creek, 6.7 miles West of Leakesville on Highway 57,
MST5767, KU 37856 DQ306638 DQ306681 DQ306595
L. roseipinnis Small creek Xowing into Little River in Claude D Kelly State Park oV Highway 21, AL
T5766, KU 37857 DQ306637 DQ306680 DQ306594
L. roseipinnis Little Creek, 1.5 mi. E of junction of US ? and LA 21 on LA 21, LA T5765, KU 37854 DQ306636 DQ306679 DQ306593L. roseipinnis Little Creek, 1.5 mi. E of junction of US ? and LA 21 on LA 21, LA T5774, KU 37854 DQ306639 DQ306682 DQ306596L. snelsoni 16 Mountain Fork River downstream of OK Hwy 4, 0.8 mi SE of Smithville,
OKUAIC 11045.02-4 DQ306649 DQ306692 DQ306606
L. snelsoni 17 Mountain Fork River downstream of OK Hwy 4, 0.8 mi SE of Smithville, OK
UAIC 11045.02-2 DQ306650 DQ306693 DQ306607
L. snelsoni 18 Mountain Fork River downstream of OK Hwy 4, 0.8 mi SE of Smithville, OK
UAIC 11045.02-5 DQ306651 DQ306694 DQ306608
L. snelsoni 19 Mountain Fork River downstream of OK Hwy 4, 0.8 mi SE of Smithville, OK
UAIC 11045.02-1 DQ306652 DQ306695 DQ306609
L. umbratilis West branch of Mill Creek, 7.6 mi. SW of Alma, KS T5739 DQ306619 DQ306662 DQ306576L. umbratilis West branch of Mill Creek, 7.6 mi. SW of Alma, KS T5740 DQ306620 DQ306663 DQ306577L. umbratilis West branch of Mill Creek, 7.6 mi. SW of Alma, KS T5741 DQ306621 DQ306664 DQ306578
290 J.B. Pramuk et al. / Molecular Phylogenetics and Evolution 42 (2007) 287–297
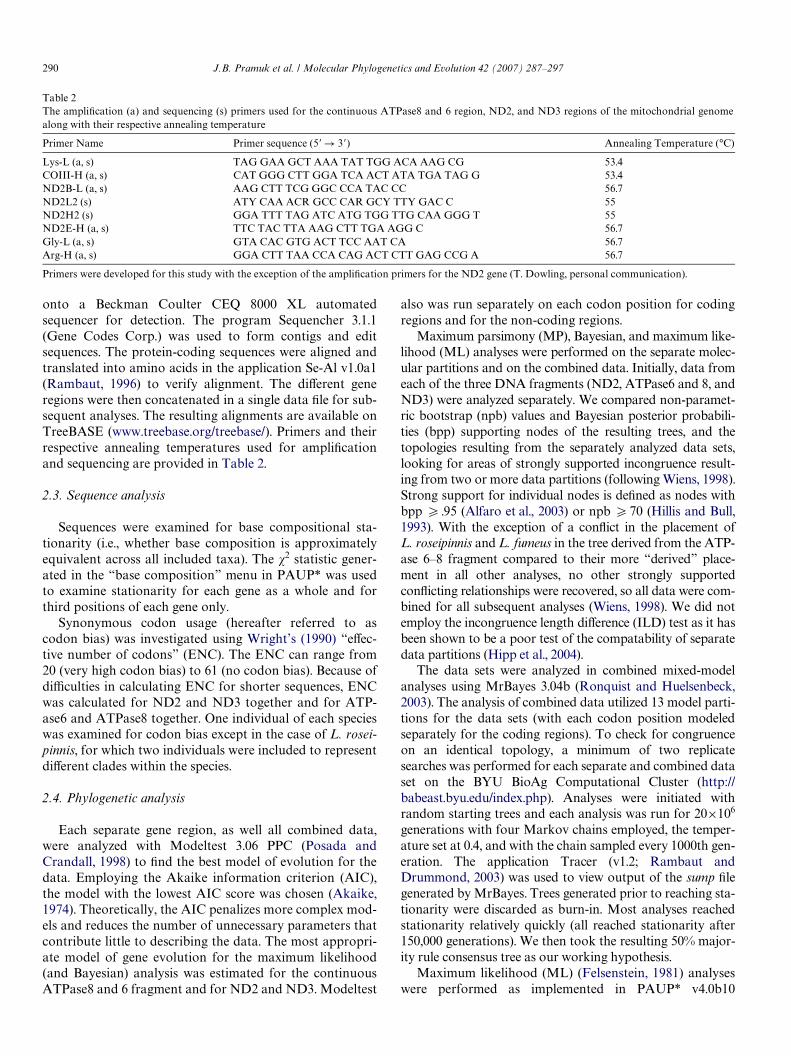
onto a Beckman Coulter CEQ 8000 XL automatedsequencer for detection. The program Sequencher 3.1.1(Gene Codes Corp.) was used to form contigs and editsequences. The protein-coding sequences were aligned andtranslated into amino acids in the application Se-Al v1.0a1(Rambaut, 1996) to verify alignment. The diVerent generegions were then concatenated in a single data Wle for sub-sequent analyses. The resulting alignments are available onTreeBASE (www.treebase.org/treebase/). Primers and theirrespective annealing temperatures used for ampliWcationand sequencing are provided in Table 2.
2.3. Sequence analysis
Sequences were examined for base compositional sta-tionarity (i.e., whether base composition is approximatelyequivalent across all included taxa). The �2 statistic gener-ated in the “base composition” menu in PAUP* was usedto examine stationarity for each gene as a whole and forthird positions of each gene only.
Synonymous codon usage (hereafter referred to ascodon bias) was investigated using Wright’s (1990) “eVec-tive number of codons” (ENC). The ENC can range from20 (very high codon bias) to 61 (no codon bias). Because ofdiYculties in calculating ENC for shorter sequences, ENCwas calculated for ND2 and ND3 together and for ATP-ase6 and ATPase8 together. One individual of each specieswas examined for codon bias except in the case of L. rosei-pinnis, for which two individuals were included to representdiVerent clades within the species.
2.4. Phylogenetic analysis
Each separate gene region, as well all combined data,were analyzed with Modeltest 3.06 PPC (Posada andCrandall, 1998) to Wnd the best model of evolution for thedata. Employing the Akaike information criterion (AIC),the model with the lowest AIC score was chosen (Akaike,1974). Theoretically, the AIC penalizes more complex mod-els and reduces the number of unnecessary parameters thatcontribute little to describing the data. The most appropri-ate model of gene evolution for the maximum likelihood(and Bayesian) analysis was estimated for the continuousATPase8 and 6 fragment and for ND2 and ND3. Modeltest
also was run separately on each codon position for codingregions and for the non-coding regions.
Maximum parsimony (MP), Bayesian, and maximum like-lihood (ML) analyses were performed on the separate molec-ular partitions and on the combined data. Initially, data fromeach of the three DNA fragments (ND2, ATPase6 and 8, andND3) were analyzed separately. We compared non-paramet-ric bootstrap (npb) values and Bayesian posterior probabili-ties (bpp) supporting nodes of the resulting trees, and thetopologies resulting from the separately analyzed data sets,looking for areas of strongly supported incongruence result-ing from two or more data partitions (following Wiens, 1998).Strong support for individual nodes is deWned as nodes withbpp 7 .95 (Alfaro et al., 2003) or npb 770 (Hillis and Bull,1993). With the exception of a conXict in the placement ofL. roseipinnis and L. fumeus in the tree derived from the ATP-ase 6–8 fragment compared to their more “derived” place-ment in all other analyses, no other strongly supportedconXicting relationships were recovered, so all data were com-bined for all subsequent analyses (Wiens, 1998). We did notemploy the incongruence length diVerence (ILD) test as it hasbeen shown to be a poor test of the compatability of separatedata partitions (Hipp et al., 2004).
The data sets were analyzed in combined mixed-modelanalyses using MrBayes 3.04b (Ronquist and Huelsenbeck,2003). The analysis of combined data utilized 13 model parti-tions for the data sets (with each codon position modeledseparately for the coding regions). To check for congruenceon an identical topology, a minimum of two replicatesearches was performed for each separate and combined dataset on the BYU BioAg Computational Cluster (http://babeast.byu.edu/index.php). Analyses were initiated withrandom starting trees and each analysis was run for 20£106
generations with four Markov chains employed, the temper-ature set at 0.4, and with the chain sampled every 1000th gen-eration. The application Tracer (v1.2; Rambaut andDrummond, 2003) was used to view output of the sump Wlegenerated by MrBayes. Trees generated prior to reaching sta-tionarity were discarded as burn-in. Most analyses reachedstationarity relatively quickly (all reached stationarity after150,000 generations). We then took the resulting 50% major-ity rule consensus tree as our working hypothesis.
Maximum likelihood (ML) (Felsenstein, 1981) analyseswere performed as implemented in PAUP* v4.0b10
Table 2The ampliWcation (a) and sequencing (s) primers used for the continuous ATPase8 and 6 region, ND2, and ND3 regions of the mitochondrial genomealong with their respective annealing temperature
Primers were developed for this study with the exception of the ampliWcation primers for the ND2 gene (T. Dowling, personal communication).
Primer Name Primer sequence (5� ! 3�) Annealing Temperature (°C)
Lys-L (a, s) TAG GAA GCT AAA TAT TGG ACA AAG CG 53.4COIII-H (a, s) CAT GGG CTT GGA TCA ACT ATA TGA TAG G 53.4ND2B-L (a, s) AAG CTT TCG GGC CCA TAC CC 56.7ND2L2 (s) ATY CAA ACR GCC CAR GCY TTY GAC C 55ND2H2 (s) GGA TTT TAG ATC ATG TGG TTG CAA GGG T 55ND2E-H (a, s) TTC TAC TTA AAG CTT TGA AGG C 56.7Gly-L (a, s) GTA CAC GTG ACT TCC AAT CA 56.7Arg-H (a, s) GGA CTT TAA CCA CAG ACT CTT GAG CCG A 56.7

J.B. Pramuk et al. / Molecular Phylogenetics and Evolution 42 (2007) 287–297 291
(SwoVord, 2002). Heuristic searches were performed with100 random sequence additions and TBR branch swapping.Nodal support was assessed with non-parametric bootstrap(Felsenstein, 1985) with 1000 bootstrap replicates, TBRbranch swapping, and 10 random addition replicates. Max-imum parsimony (MP) analyses were performed withPAUP* v.4.0b10 using a heuristic search with 10,000 ran-dom addition sequence replicates and TBR branch swap-ping. Nodal support for MP results was assessed throughnon-parametric bootstrap analysis with 1000 bootstrappseudoreplicates and one random taxon-addition replicate.
2.5. Hypothesis testing
Alternative phylogenetic hypotheses from the litera-ture were tested under both parsimony and likelihoodframeworks. For the parsimony Kishino and Hasegawa(K–H; Kishino and Hasegawa, 1989) test, we employed
PAUP* to search for diVerences in tree scores between allequally optimal trees resulting from constrained searcheswhich were then compared to overall optimal trees. Like-lihood topology tests were based on the Shimodaira andHasegawa (S–H; Shimodaira and Hasegawa, 1999) test asimplemented in PAUP*. Ten thousand replicates forevery topology test were performed, and the partial likeli-hoods for each site (RELL model) were resampled. It hasbeen suggested that the S–H test may be conservative inthat it may be prone to a certain type of bias so that thenumber of trees included in the conWdence set tends to bevery large as the number of trees compared increases(Goldman et al., 2000; Buckley, 2002); however, we agreewith these authors in that the S–H test is still safe toemploy when the number of possible trees is compara-tively small and a relatively large number of characters isincluded in the analysis. Tree searches were conductedwith constraints designed to match tree topologies for
Fig. 2. Maximum parsimony (K–H test) and maximum likelihood (S–H test) optimality criteria were employed to test the illustrated trees in relation toour data and topologies. (A) Parsimony consensus tree presented by Wiley and Siegel-Causey (1994) on the basis of allozyme and morphological data. (B)Phylogenetic tree of Schmidt et al. (1998) derived from ML and MP analysis of cytochrome-b data. (C) Hypothesis of the monophyly of the L. roseipinniscomplex. (D) Hypothesis of the monophyly of the L. ardens complex.
Table 3Major data partitions analyzed in this study, their characteristics resulting from MP analysis, and the appropriate models selected by Modeltest (Posadaand Crandall, 1998) which were employed in separate and combined partitions for Bayesian and ML data analyses
CI, consistency index (excluding uninformative characters); G, gamma; ML, maximum likelihood; MP, most parsimonious; RI, retention index; TL, treelength.
Partition (no. Taxa) No. characters (pars. inf.) No. MP trees TL CI RI ML model
ND2 (43) 1047 (352) 1 1020 0.5412 0.8644 GTR+I +GATPase8 (43) 165 (35) 32 89 0.6854 0.8911 GTR with equal rate variationATPase6 (43) 659 (158) 15 406 0.6059 0.8824 GTR+GND3 (43) 421 (98) 10 238 0.5672 0.8717 GTR with equal rate variationAll combined data (43) 2291 (641) 4 1764 0.5624 0.8683 Mixed model

292 J.B. Pramuk et al. / Molecular Phylogenetics and Evolution 42 (2007) 287–297
each hypothesis. Alternative topologies (e.g.,constraining monophyly of the roseipinnis complex) wereconstructed in TreeView PPC. The K–H and S–H testswere employed to investigate the following hypotheses:(1) the phylogenetic hypothesis of Wiley and Siegel-Cau-sey (1994) derived from allozyme and morphologicaldata (Fig. 2A); (2) the phylogenetic tree of Schmidt et al.(1998) inferred from analysis of the complete cyto-chrome-b gene (Fig. 2B); (3) monophyly of the roseipinniscomplex, consisting of L. alegnotus, L. atrapiculus, L. bel-lus, and L. roseipinnis (Fig. 2C); (4) monophyly of theL ardens complex (sensu Dimmick et al., 1996), consist-ing of L. ardens, L. fasciolaris, and L. matutinus(Fig. 2D).
3. Results
3.1. Molecules
A total of 2291 bp from four mitochondrial protein-coding genes were obtained: 1047 bp of ND2, 823 bp ofthe contiguous ATPase8 and 6, and 421 bp of ND3. ForML searches and Bayesian analysis of combined data, aGTR + I + � model incorporated the following ratematrix: A-C: 1.0000, A-G: 40.6957, A-T: 1.0000, C-G:1.0000, C-T: 10.1879, G-T: 1.0000. The shape parameterof the discrete gamma distribution was estimated to be1.0944 with the proportion of invariant sites equal to0.5022. Summary statistics of MP analyses for the sepa-
Fig. 3. Bayesian consensus tree resulting from analysis of 824 bp of combined ATPase6 and 8 data, with Bayesian posterior probabilities (multiplied by100) listed above nodes, and ML bootstrap and MP bootstrap values listed below nodes.
ATPase6 and 8
70
100
98
99
95100
25
100100
67
Pteronotropis T5775Cyprinella T530
Lythrurus fumeus T5754Lythrurus fumeus T5755
100
100
81
100
100
88/87/<50
100
100
100
100
100
1009995
100100
100100
6257
100100
100100
100100
100100
9898
99
99
Lythrurus roseipinnis T5764
Lythrurus roseipinnis T5767Lythrurus roseipinnis T5766
Lythrurus roseipinnis T5765Lythrurus roseipinnis T5774
Lythrurus fasciolaris 15Lythrurus fasciolaris 13
Lythrurus fasciolaris 14
Lythrurus ardens 1Lythrurus ardens 2Lythrurus ardens 3Lythrurus ardens 4
Lythrurus matutinus 10Lythrurus matutinus 12
Lythrurus lirus 1Lythrurus lirus 2Lythrurus lirus 3Lythrurus lirus 4Lythrurus lirus 5
Lythrurus umbratilis T5739Lythrurus umbratilis T5740Lythrurus umbratilis T5741
100
89/87<50
100
100
100
100
100
100
100100
7399
99100
100100
100100
100100
9995
Lythrurus alegnotus 5Lythrurus alegnotus 6Lythrurus alegnotus 7Lythrurus alegnotus 8Lythrurus alegnotus 9
Lythrurus bellus T5745Lythrurus bellus T5746Lythrurus bellus T5747
Lythrurus bellus T5744
Lythrurus snelsoni 16
Lythrurus snelsoni 18Lythrurus snelsoni 17
Lythrurus snelsoni 19
Lythrurus atrapiculus T5769Lythrurus atrapiculus T5770Lythrurus atrapiculus T5771
Lythrurus atrapiculus T5773<50
<50
<50
<50
0.005 substitutions/site

J.B. Pramuk et al. / Molecular Phylogenetics and Evolution 42 (2007) 287–297 293
rate and combined data sets and model selected by Mod-eltest for each gene are shown in Table 3. Basecomposition across all taxa is stationary for each gene,both as a whole and within third positions only. Codonbias did not appear evident based on the calculated ENCvalues. For the ND2 + ND3 data set, ENC ranged from44.8 in L. snelsoni to 56.6 in C. lutrensis, with all but twoindividuals having an ENC > 50. For the ATPase6+ATP-ase8 data set, ENC ranged from 46.9 in P. signipinnis to59.6 in L. alegnotus. For this data set, approximately halfof the sampled individuals had an ENC > 50. ResultingENC and �2 values are available from the authors uponrequest.
3.2. Phylogeny of Lythrurus
Maximum parsimony analysis of the combined dataresulted in four equally parsimonious trees of 1764 steps(Fig. 3; CID0.5624, HID0.4376, RID0.8683, andRCD0.4883). Table 3 summarizes the characteristics (e.g.,number of parsimony informative characters) for each geneanalyzed in this study. Results of model-based methods(Bayesian and ML analyses) are largely congruent with theMP analyses; however, for economy of space, only Bayesiantrees resulting from the ND2, ND3, the combined ATPase6and 8 fragment, and analysis of the combined data are pre-sented and discussed in depth. The ML and MP bootstrap
Fig. 4. Bayesian consensus tree resulting from analysis of 1047 bp of ND2 data only, with Bayesian posterior probabilities (multiplied by 100) listed abovenodes, and ML bootstrap and MP bootstrap values listed below nodes.
ND2 Data
100100100
55100100
100 99100
1009893
100100100
6756n/a
100100100
Lythrurus alegnotus 5
Pteronotropis T5775Cyprinella T530
Lythrurus alegnotus 6Lythrurus alegnotus 8Lythrurus alegnotus 9
Lythrurus alegnotus 7Lythrurus bellus T5744Lythrurus bellus T5747Lythrurus bellus T5745Lythrurus bellus T5746
Lythrurus roseipinnis T5764Lythrurus roseipinnis T5767Lythrurus roseipinnis T5766
Lythrurus roseipinnis T5765Lythrurus roseipinnis T5774
Lythrurus snelsoni 16Lythrurus snelsoni 18Lythrurus snelsoni 17Lythrurus snelsoni 19
Lythrurus fumeus T5754Lythrurus fumeus T5755
Lythrurus lirus 1Lythrurus lirus 2Lythrurus lirus 3Lythrurus lirus 4Lythrurus lirus 5
Lythrurus fasciolaris 14Lythrurus fasciolaris 15
Lythrurus fasciolaris 13
Lythrurus umbratilis T5739Lythrurus umbratilis T5740Lythrurus umbratilis T5741
Lythrurus ardens 2Lythrurus ardens 3
Lythrurus ardens 1Lythrurus ardens 4
Lythrurus matutinus 10Lythrurus matutinus 12
Lythrurus atrapiculus T5769Lythrurus atrapiculus T5770Lythrurus atrapiculus T5771
Lythrurus atrapiculus T5773
0.01 substitutions/site
100100 98
1008258
100100100
100 98100
100
100 99
100100100
100100 99
10059n/a
100100100
100100 n/a
1009993
100100100
100100100
100
100100100
100
94/92/n/a87/71/55
84/68/71
100100 98
100
100/100/93
95/100/n/a

294 J.B. Pramuk et al. / Molecular Phylogenetics and Evolution 42 (2007) 287–297
values of nodes that are congruent across methods are pro-vided in each of the Bayesian trees (Figs. 3–6). In trees result-ing from analyses of most separate genes (except ATPase 6–8)and from the combined data, two major subclades wererecovered. The monophyly of the L. bellus clade composed ofsix species (L. fumeus, L. snelsoni, L. roseipinnis, L. atrapiculus,L. bellus, and L. alegnotus) was well supported (bsD100).Additionally, the L. umbratilis clade consisting of Wve species(L. umbratilis, L. lirus, L. fasciolaris, L. ardens, and L. matuti-nus) was well supported (bsD100). Within the L. umbratilisgroup, L. umbratilis, L. fasciolaris, and L. lirus form a func-tional polytomy (e.g., bpp<.95) with the well-supportedL. ardens–L. matutinus species pair. Although L. fasciolaris
grouped with L. umbratilis and L. lirus rather than its formerconspeciWcs, its placement was not statistically robust. Noneof the methods or analyses of separate genes or combineddata satisfactorily resolved the basal relationships within theL. bellus clade. While the combined data support L. fumeus asthe sister to remaining members of the L. bellus, support forthis node is not signiWcant in some trees (e.g., results of ND2data only). In contrast, the tree resulting from the ATPase 6–8fragment places L. fumeus as sister to all other Lythrurus.Additionally, the traditionally recognized L. roseipinnis group,comprising L. alegnotus, L. atrapiculus, L. bellus, and L. rosei-pinnis, was not recovered with signiWcant support in any anal-ysis. We consider our tree resulting from combined data (i.e.,
Fig. 5. Bayesian consensus tree resulting from analysis of 421 bp of ND3 data only, with Bayesian posterior probabilities (multiplied by 100) listed abovenodes, and ML bootstrap and MP bootstrap values listed below nodes.
ND3 Data
Pteronotropis T5775Cyprinella T530
Lythrurus alegnotus 5Lythrurus alegnotus 6Lythrurus alegnotus 8Lythrurus alegnotus 9
Lythrurus alegnotus 7
Lythrurus bellus T5744Lythrurus bellus T5747Lythrurus bellus T5745
Lythrurus bellus T5746
Lythrurus roseipinnis T5764Lythrurus roseipinnis T5767Lythrurus roseipinnis T5766Lythrurus roseipinnis T5765Lythrurus roseipinnis T5774
Lythrurus snelsoni 16
Lythrurus snelsoni 18Lythrurus snelsoni 17
Lythrurus snelsoni 19
Lythrurus fumeus T5754Lythrurus fumeus T5755
Lythrurus fasciolaris 14Lythrurus fasciolaris 15
Lythrurus fasciolaris 13
Lythrurus umbratilis T5739Lythrurus umbratilis T5740Lythrurus umbratilis T5741
Lythrurus ardens 2Lythrurus ardens 3Lythrurus ardens 1Lythrurus ardens 4
Lythrurus matutinus 10Lythrurus matutinus 12
Lythrurus lirus 1Lythrurus lirus 2Lythrurus lirus 3Lythrurus lirus 4Lythrurus lirus 5
Lythrurus atrapiculus T5769Lythrurus atrapiculus T5770Lythrurus atrapiculus T5771
Lythrurus atrapiculus T5773
100100100
100100100
92
98
100
51/95/n/a
98
100
100
100
80/60
100
90
76
92
72/100
82
67/<50/n/a
95
9990
<50 91
9492
100100
100 99
100100
100100
100 97
8694
86
9899
n/a
n/an/a
n/a
84
0.005 substitutions/site
88/95/n/a
100/63/n/a
97
100
100 92
9986

J.B. Pramuk et al. / Molecular Phylogenetics and Evolution 42 (2007) 287–297 295
our “total” evidence hypothesis) as our preferred hypothesisof relationships and therefore, focus our following discussionon this tree (Fig. 6).
3.3. Constraint analyses
Using K–H and S–H tests, we tested the topology of Wileyand Siegel-Causey (Fig. 2A) inferred from morphological andallozyme data and the topology of Schmidt et al. (1998)resulting from analysis of cytochrome-b data (Fig. 2B) withour data using trees derived from MP and ML analyses. Wealso tested the hypotheses that the L. roseipinnis and L. ardenscomplexes are monophyletic (Fig. 2C and D). The K–H and
S–H tests found our topology to be signiWcantly better thanthe hypotheses of Wiley and Siegel-Causey (1994, Fig.2A))and Schmidt et al. (1998, Fig.2B)); S–H tests also rejected the
Table 4Likelihood (S–H) and MP (K–H) topology tests of previous hypotheses ofLythrurus relationships as illustrated in Fig. 2A–D
Tests indicated with an asterisk are signiWcant at a 0.05 level.
Hypothesis (from Fig. 2)
S–H � ¡ln L
P value K–H No. steps (steps shorter)
P value
A 255.469 0.0000* 1977 (213) <0.0001*
B 76.1507 0.0023* 3525 (1730) <0.0001*
C 47.3921 0.0428* 1764 (0) 1.000D 32.3038 0.1362 1764 (0) 1.000
Fig. 6. Bayesian consensus tree resulting from 2291 bp of combined ND2, ATPase8 and 6, and ND3 mitochondrial DNA data. The ML topology was nearlyidentical to the Bayesian topology. This analysis employed a mixed model, utilizing 13 partitions for each codon position as well as for non-coding regions of thefour genes. Bayesian posterior probabilities (multiplied by 100) are listed above nodes and ML bootstrap and MP bootstrap values listed below nodes.
Lythrurus alegnotus 5
Pteronotropis T5775
Cyprinella T5300.01 substitutions/site
Lythrurus alegnotus 6Lythrurus alegnotus 8Lythrurus alegnotus 9Lythrurus alegnotus 7Lythrurus bellus T5744Lythrurus bellus T5747Lythrurus bellus T5745Lythrurus bellus T5746
Lythrurus atrapiculus T5769Lythrurus atrapiculus T5770Lythrurus atrapiculus T5771
Lythrurus atrapiculus T5773
Lythrurus roseipinnis T5764Lythrurus roseipinnis T5767
Lythrurus roseipinnis T5766
Lythrurus roseipinnis T5765Lythrurus roseipinnis T5774
Lythrurus snelsoni 16Lythrurus snelsoni 18Lythrurus snelsoni 17Lythrurus snelsoni 19
Lythrurus fumeus T5754Lythrurus fumeus T5755
Lythrurus lirus 1Lythrurus lirus 2Lythrurus lirus 3Lythrurus lirus 4Lythrurus lirus 5
Lythrurus fasciolaris 14Lythrurus fasciolaris 15Lythrurus fasciolaris 13
Lythrurus umbratilis T5739Lythrurus umbratilis T5740Lythrurus umbratilis T5741
Lythrurus ardens 2Lythrurus ardens 3
Lythrurus ardens 1Lythrurus ardens 4
Lythrurus matutinus 10Lythrurus matutinus 12
64
100100
100100
100100
100100
100100
100100
100 69
57/75/n/a
100100
100100
100100
100100
100100
100 98
100100
100100
<50 n/a
100
100
100
100
Combined Data
100100
100
100
100
100
100
100
100/100/100
100/83/<50
100/98/<5098/80/<50
67/56/n/a
100100 100/100/
99
100/100/<50
100100100
100
100100
100
100100100
100
100
100
100/100/86
93/53/99
No
rth
ern
Cla
de,,
,,
Sou
ther
n C
lade
,,
,,

296 J.B. Pramuk et al. / Molecular Phylogenetics and Evolution 42 (2007) 287–297
monophyly of the L. roseipinnis complex. However, the K–Htest was unable to reject the monophyly of either the L. rosei-pinnis or L. ardens complexes (Table 4).
4. Discussion
4.1. Evolutionary and biogeographic implications
Our phylogenetic results diVer in many respects fromprevious analyses. The hypothesis that L. lirus and L. fum-eus are either basal (Wiley and Siegel-Causey, 1994) orunresolved (Mayden, 1989) relative to congeners is rejected;each is a member of one of the well-supported subclades.
Within the L. umbratilis clade, our results are broadlycongruent with Schmidt et al. (1998), given their taxon sam-pling. They analyzed only one (L. ardens s.s. from Virginia)of the three species recognized by Dimmick et al. (1996)that had previously been allocated to L. ardens s.l. (Snelson,1980). While our study does corroborate the monophylyL. ardens species trio (L. ardens, L. fasciolaris, L. matuti-nus), neither Schmidt et al. (1998) nor our study providesstrong corroboration for a sister group relationshipbetween L. lirus and the trio. Moreover, our study does notWnd strong support for a relationship between L. fasciolarisand the L. ardens–L. matutinus species pair. Indeed, withregard to the relationship of L. fasciolaris, our results areambiguous: MP weakly supports L. fasciolaris with itsformer conspeciWcs of the L. ardens group, while model-based methods weakly group L. fasciolaris with L. lirus.Our results do call attention to the distinctive nature ofthese species in terms of sequence divergence that reXectstheir distinctive breeding color diVerences (documented byDimmick et al., 1996) and to the existence of an AtlanticDrainage clade composed of L. ardens and L. matutinus.
Our combined data analyses agree with Schmidt et al.(1998) in recovering a monophyletic L. bellus clade. How-ever, our data reject their hypothesis that L. fumeus is amember of the L. roseipinnis species complex (L. alegnotus,L. atrapiculus, L. bellus, and L. roseipinnis) referring thisspecies as sister to the L. roseipinnis complex + L. snelsoni.Moreover, our data do not provide strong corroborationfor the monophyly of the L. roseipinnis species group, agroup long recognized as a distinctive clade (Mayden, 1989;Snelson, 1972; Stein et al., 1985). Interestingly, three mor-phological synapomorphies corroborate the monophyly ofthis clade to the exclusion of L. fumeus: (1) closely spacedarticulation points of the metapterygoid to the hyomandib-ular and symplectic versus widely spaced; (2) anterodorsalmetapterygoid Xange gracile versus robust; (3) ventral edgeof the posterior Xange of the ascending arm of the clei-thrum inclined upward versus horizontal (Wiley and Siegel-Causey, 1994). These characters suggest that additionalmolecular data may recover the group as monophyletic.
Our combined data support L. atrapiculus as sister to theL. bellus–L. alegnotus species pair, refuting the hypothesisof Wiley and Siegel-Causey (1994) stating that L. atrapiculusis the sister species of L. roseipinnis. Further, L. roseipinnis
samples in this study showed genetic divergence (4.9–5.3%divergent; uncorrected “p” distance) falling within theobserved range between currently recognized species (3–12% divergence). Interestingly, Snelson (1972) suggestedthat L. roseipinnis is a complex of at least two distinctivepopulations. The relatively simple vicariance hypothesis ofWiley and Mayden (1985) accounts for the distribution ofrecently evolved species of killiWshes (Ghedotti and Grose,1997; Wiley, 1977, 1985), minnows (Grose and Wiley, 2002;Wiley and Titus, 1992), and sand darters (Near et al., 2000;Shaw et al., 1995; Wiley and Hagen, 1997). However, thecomplex nature of L. roseipinnis coupled with vicariancewithin the Mobile Basin suggests a more complicated seriesof vicariance events for this clade, as yet unobserved inother groups of Wshes (Boschung and Mayden, 2004, reviewthe complexities of biogeographic patterns in the region).
4.2. Conservation issues
Unfortunately, populations of some species of Lythru-rus are declining in numbers as a result of habitat losslargely related to modern dredging practices and logging.For example, the US Endangered Species Act and/or theIUCN lists L. alegnotus, L. umbratilis, L. lirus, andL. snelsoni as threatened, endangered, or of special con-cern (e.g., Gimenez Dixon, 1996). An accurate assessmentof Lythrurus biodiversity will aid in making informedconservation decisions. Increasingly, molecular sequencedata and DNA barcoding techniques are being used to aidin delimiting cryptic species and have been applied todiverse groups of organisms ranging from vertebrates toinsects and plants (e.g., Hebert et al., 2004; Kress et al.,2005; Peppers and Bradley, 2000; Parra-Olea and Wake,2001). Our results indicate that all currently recognizedspecies of Lythrurus are distinct genetically. This studyalso reports unexpectedly high levels of DNA sequencevariation within populations referred to L. roseipinnissuggesting that additional, cryptic evolutionary speciesmay yet remain to be described in this lineage. Broaderpopulation sampling and additional molecular dataincluding nuclear markers will be required to assess thor-oughly the number of evolutionary species present in thisgeographically widespread clade of Wshes.
Acknowledgments
This study was performed as part of Molecular Sequenc-ing and Systematics, an upper-level course oVered throughthe Department of Ecology and Evolutionary Biology atKU. Partial support for this work was provided by anIMSD grant from the NIH Minority Opportunities inResearch Program (NIGMS; NIH 1 R25 GM 62232). Weespecially thank Drs. James Orr and Leonard Kristhalkafor inviting us to oVer this course and EEB and the Biodi-versity Research Center and Natural History Museum atKU for obtaining funding to provide necessary equipmentand to cover laboratory expenses.

J.B. Pramuk et al. / Molecular Phylogenetics and Evolution 42 (2007) 287–297 297
References
Alfaro, M.E., Zoller, S., Lutzoni, F., 2003. Bayes or bootstrap? A simula-tion study comparing the performance of Bayesian Markov chainMonte Carlo sampling and bootstrapping in assessing phylogeneticconWdence. Mol. Biol. Evol. 20, 255–266.
Akaike, H., 1974. A new look at the statistical model identiWcation. IEEETrans. on Autom. Contr. 19, 716–723.
Boschung, H., Mayden, R., 2004. Fishes of Alabama. Smithsonian Books.Washington D.C., p. 736.
Buckley, T.R., 2002. Model misspeciWcation and probabilistic test of topol-ogy: evidence from empirical data sets. Syst. Biol. 51, 509–523.
Coburn, M.M., Cavender, T.M., 1992. Interrelationships of North Ameri-can Wshes. In: Mayden, R.L. (Ed.), Systematics, Historical Ecology, andNorth American Freshwater Fishes. Stanford University Press, Stan-ford, CA, pp. 328–373.
Dimmick, W.W., Fiorino, K.L., Burr, B.M., 1996. Reevaluation of theLythrurus ardens (Cypriniformes: Cyprinidae) complex with recogni-tion of three evolutionary species. Copeia 1996, 813–823.
Felsenstein, J., 1981. Evolutionary trees from DNA sequences: A maxi-mum likelihood approach. J. Mol. Evol. 17, 368–376.
Felsenstein, J., 1985. ConWdence limits on phylogenies: an approach usingthe bootstrap. Evolution 39, 783–791.
Ghedotti, M.J., Grose, M.J., 1997. Phylogenetic relationships of the Fundu-lus nottii species group (Fundulidae, Cypinodontiformes) as inferredfrom the cytochrome b gene. Copeia 1997, 858–862.
Gimenez Dixon, M., 1996. Lythrurus snelsoni. IUCN 2004. 2004 IUCNRed List of Threatened Species (www.iucnredlist.org).
Goldman, N., Anderson, J.P., Rodrigo, A.G., 2000. Likelihood-based testsof topologies in phylogenetics. Syst. Biol. 49, 652–670.
Grose, M.J., Wiley, E.O., 2002. Phylogenetic relationships of the Hybop-sis amblops species group (Teleostei: Cyprinidae). Copeia 2002,1092–1097.
Hebert, P.D.N., Penton, E.H., Burns, J.M., Janzen, D.H., Hallwachs, W.,2004. Ten species in one: DNA barcoding reveals cryptic species in theneotropical skipper butterXy Astraptes fulgerator. Proc. Nat. Acad. Sci.USA 101, 14812–14817.
Hillis, D.M., Bull, J.J., 1993. An empirical test of bootstrapping as amethod for assessing conWdence in phylogenetic analysis. Syst. Biol. 42,182–192.
Hipp, A.L., Hall, J.C., Sytsma, K.J., 2004. Phylogenetic accuracy, congru-ence between data partitions, and performance of the ILD. Syst. Biol.53, 81–89.
Kishino, H., Hasegawa, M., 1989. Evolution of the maximum likelihoodestimate of the evolutionary tree topologies from DNA data, and thebranching order in Hominoidea. J. Mol. Evol. 29, 170–179.
Kress, J.W., Wurdack, K.J., Zimmer, E.A., Weigt, L.A., Janzen, D.H., 2005.Use of DNA barcodes to identify Xowering plants. Proc. Nat. Acad.Sci. USA 102, 8369–8374.
Mayden R.L., 1989. Phylogenetic studies of North American minnows,with emphasis on the genus Cyprinella (Teleostei: Cypriniformes). Mis-cellaneous Publications of the Museum of Natural History, Universityof Kansas 80, 1–189.
Near, T.J., PorterWeld, J.C., Page, L.M., 2000. Evolution of cytochrome band the molecular systematics of Ammocrypta (Percidae: Etheostomat-inae). Copeia 2000, 701–711.
Palumbi, S.R., 1996. PCR and molecular systematics. In: Hillis, D., Moritz,C., Mable, B. (Eds.), Molecular Systematics, 2nd ed. Sinauer Press, pp.205–247.
Parra-Olea, G., Wake, D.B., 2001. Extreme morphological and ecologicalhomoplasy in tropical salamanders. Proc. Nat. Acad. Sci. USA 98,7888–7891.
Peppers, L.L., Bradley, R.D., 2000. Cryptic species in Sigmodon hispidus:Evidence from DNA sequences. J. Mammal. 81, 332–343.
Posada, D., Crandall, K.A., 1998. Modeltest: Testing the model of DNAsubstitution. Bioinformatics 14, 817–818.
Rambaut, A., 1996. Se-Al: Sequence alignment editor. Available from:<http://evolve.zoo.ox.ac.uk/>.
Rambaut, A., Drummond, A., 2003. Tracer v1.2, Available from: <http://evolve.zoo.ox.ac.uk/>.
Ronquist, F., Huelsenbeck, J.P., 2003. MRBAYES 3: Bayesian phyloge-netic inference under mixed models. Bioinformatics 19, 1572–1574.
Schmidt, T.R., Bielawski, J.P., Gold, J.R., 1998. Molecular phylogeneticsand evolution of the cytochrome b gene in the cyprinid genus Lythru-rus (Actinopterygii: Cypriniformes). Copeia 1998, 22–24.
Shaw, K., Wiley, E.O., Titus, T.A., 1995. A phylogenetic analysis of theHybopsis amblops group. Occasional Papers of the Natural HistoryMuseum of the University of Kansas 172, 1–27.
Simons, A.M., Berendzen, P.B., Mayden, R.L., 2003. Molecular systematicsof North American phoxinin genera (Actinopterygii: Cyprinidae)inferred from mitochondrial 12S and 16S ribosomal RNA sequences.Zoolog. J. Linnean Soc. 139, 63–80.
Snelson Jr., F.F., 1972. Systematics of the subgenus Lythrurus, genusNotropis (Pisces: Cyprinidae). Bulletin of the Florida State Museum.Biol. Sci. 17, 1–92.
Snelson Jr., F.F., 1980. Systematic review of the cyprinid Wsh, Notropislirus. Copeia 1980, 323–334.
Snelson Jr, F.F., PXieger, W.L., 1975. Redescription of the redWn shiner,Notropis umbratilis, and its subspecies in the central Mississippi RiverBasin. Copeia 1975, 231–249.
Stein, D.W., Rogers, J.S., Cashner, R.C., 1985. Biochemical systematics oftheNotropis roseipinnis complex (Cyprinidae: subgenus Lythrurus).Copeia 1985, 154–163.
SwoVord, D.L., 2002. Phylogenetic Analysis Using Parsimony (PAUP),version 4.0b10. Computer program distributed by the Illinois NaturalHistory Survey. Champaign, Illinois.
Wiens, J.J., 1998. Combining data sets with diVerent phylogenetic histories.Syst. Biol. 47, 568–581.
Wiley, E.O., 1977. The phylogeny and systematics of the Fundulus nottiispecies group (Teleostei: Cyprinodontidae). Occasional Papers of theNatural History Museum of the University of Kansas 67, 1–31.
Wiley, E.O., Hagen, R.H., 1997. Mitochondrial DNA sequence variationamong the sand darters (Percidae: Teleostei). In: Kocher, T., Stepien,C. (Eds.), Molecular Evolution of Fishes. Academic Press, New York,pp. 75–96.
Wiley, E.O., Mayden, R.L., 1985. Species and speciation in phylogeneticsystematics, with examples from the North American Wsh fauna. Ann.Missouri Bot. Gardens 72, 596–635.
Wiley, E.O., Siegel-Causey, D., 1994. A phylogenetic analysis of theLythrurus roseipinnis species complex (Teleostei: Cyprinidae) withcomments on the relationships of other Lythrurus. Occasional Papersof the Natural History Museum of the University of Kansas 171, 1–20.
Wiley, E.O., Titus, T.A., 1992. Phylogenetic relationships among membersof the Hybopsis dorsalis species group (Teleostei: Cyprinidae). Occa-sional Papers of the Natural History Museum of the University ofKansas 219, 1–18.
Wright, F., 1990. The ‘eVective number of codons’ used in a gene. Gene 87,23–29.
Copyright © 2022 FDOKUMEN