Phylodynamics and Dispersal of HRSV Entails Its Permanence in the General Population in between...
11
Phylodynamics and Dispersal of HRSV Entails Its Permanence in the General Population in between Yearly Outbreaks in Children Hagit Katzov-Eckert 1 , Viviane F. Botosso 2 , Eurico Arruda Neto 3 , Paolo Marinho de Andrade Zanotto 1 *, and the VGND consortium 1 Laboratory of Molecular Evolution and Bioinformatics, Department of Microbiology, Biomedical Sciences Institute-ICB-II, University of Sa ˜o Paulo, Sa ˜o Paulo, Brazil, 2 Butantan Institute, Virology Branch, Butanta ˜, Sa ˜ o Paulo, Brazil, 3 Department of Cell Biology, School of Medicine of Ribeira ˜ o Preto, University of Sa ˜ o Paulo, Ribeira ˜o Preto, Sa ˜o Paulo, Brazil, and the VGDN Consortium Abstract Background: Human respiratory syncytial virus (HRSV) is one of the major etiologic agents of respiratory tract infections among children worldwide. Methodology/Principal Findings: Here through a comprehensive analysis of the two major HRSV groups A and B (n = 1983) which comprise of several genotypes, we present a complex pattern of population dynamics of HRSV over a time period of 50 years (1956–2006). Circulation pattern of HRSV revealed a series of expansions and fluctuations of co-circulating lineages with a predominance of HRSVA. Positively selected amino acid substitutions of the G glycoprotein occurred upon population growth of GB3 with a 60-nucleotide insertion (GB3 Insert), while other genotypes acquired substitutions upon both population growth and decrease, thus possibly reflecting a role for immune selected epitopes in linkage to the traced substitution sites that may have important relevance for vaccine design. Analysis evidenced the co-circulation and predominance of distinct HRSV genotypes in Brazil and suggested a year-round presence of the virus. In Brazil, GA2 and GA5 were the main culprits of HRSV outbreaks until recently, when the GB3 Insert became highly prevalent. Using Bayesian methods, we determined the dispersal patterns of genotypes through several inferred migratory routes. Conclusions/Significance: Genotypes spread across continents and between neighboring areas. Crucially, genotypes also remained at any given region for extended periods, independent of seasonal outbreaks possibly maintained by re-infecting the general population. Citation: Katzov-Eckert H, Botosso VF, Neto EA, Zanotto PMdA, the VGND consortium (2012) Phylodynamics and Dispersal of HRSV Entails Its Permanence in the General Population in between Yearly Outbreaks in Children. PLoS ONE 7(10): e41953. doi:10.1371/journal.pone.0041953 Editor: Paul J. Planet, Columbia University, United States of America Received May 4, 2011; Accepted June 29, 2012; Published October 15, 2012 Copyright: ß 2012 Katzov-Eckert et al. This is an open-access article distributed under the terms of the Creative Commons Attribution License, which permits unrestricted use, distribution, and reproduction in any medium, provided the original author and source are credited. Funding: This work is part of the Viral Genetic Diversity Program (VGDN), funded by FAPESP under project Nu 00/4205-6. The funders had no role in study design, data collection and analysis, decision to publish, or preparation of the manuscript. Competing Interests: The authors have declared that no competing interests exist. * E-mail: [email protected] Introduction Human respiratory syncytial virus (HRSV) causes serious respiratory tract infections in infants, elderly and immunocom- promised adults [1,2,3,4]. HRSV epidemics are associated with climate patterns and occur annually in late autumn and winter in temperate climates, and within the rainy season in tropical countries [5,6]. It is estimated that 64 million HRSV infections occur annually, resulting in 160,000 deaths (Initiative for Vaccine Research: respiratory syncytial virus, World Health Organization http://www.who.int/vaccine_research/diseases/ ari/en/index3.html, update September 2009). Children are susceptible to repeated HRSV infections and to developing severe disease [7,8]. In 2005, an estimated 33.8 million HRSV- associated acute lower-respiratory tract infections (ALRTI) occurred in children under five years of age; 3.4 million cases required hospital admission and 66,000–199,000 children died [9]. Reports on HRSV in developing countries have shown that HRSV-related mortality is higher than in industrialized countries [5,10]. In Brazil, 30–50% of outpatient consultations and more than 50% of hospitalizations are attributed to ALRTI [11]. Strikingly in Brazil, 10–15% of deaths of children under five years old were attributed to ALRTI, 80% of which were due to pneumonia, and 22–38% have been associated with HRSV infections [12,13,14,15,16,17]. HRSV is an enveloped non-segmented, non-recombinant in nature, negative RNA virus, classified within the Paramyxoviridae family [18,19,20]. Two major groups of HRSV have been described based on antigenic and genetic studies, HRSVA and HRSVB [21,22,23,24]. Both groups co-circulate in each epidemic period. Genomic characterization has further divided HRSVA and HRSVB into genotypes: GA1–GA7, and SAA1 [25,26], GB1–GB4, SAB1–SAB3 and GB3 with a 60-nucleotide insertion (GB3 Insert [25,26,27]. These genotypes can co-circulate in the same community, usually with a predominance of one or two PLOS ONE | www.plosone.org 1 October 2012 | Volume 7 | Issue 10 | e41953
-
Upload
independent -
Category
Documents
-
view
1 -
download
0
Transcript of Phylodynamics and Dispersal of HRSV Entails Its Permanence in the General Population in between...
Phylodynamics and Dispersal of HRSV Entails ItsPermanence in the General Population in betweenYearly Outbreaks in ChildrenHagit Katzov-Eckert1, Viviane F. Botosso2, Eurico Arruda Neto3, Paolo Marinho de Andrade Zanotto1*,
and the VGND consortium
1 Laboratory of Molecular Evolution and Bioinformatics, Department of Microbiology, Biomedical Sciences Institute-ICB-II, University of Sao Paulo, Sao Paulo, Brazil,
2 Butantan Institute, Virology Branch, Butanta, Sao Paulo, Brazil, 3 Department of Cell Biology, School of Medicine of Ribeirao Preto, University of Sao Paulo, Ribeirao Preto,
Sao Paulo, Brazil, and the VGDN Consortium
Abstract
Background: Human respiratory syncytial virus (HRSV) is one of the major etiologic agents of respiratory tract infectionsamong children worldwide.
Methodology/Principal Findings: Here through a comprehensive analysis of the two major HRSV groups A and B (n = 1983)which comprise of several genotypes, we present a complex pattern of population dynamics of HRSV over a time period of50 years (1956–2006). Circulation pattern of HRSV revealed a series of expansions and fluctuations of co-circulating lineageswith a predominance of HRSVA. Positively selected amino acid substitutions of the G glycoprotein occurred uponpopulation growth of GB3 with a 60-nucleotide insertion (GB3 Insert), while other genotypes acquired substitutions uponboth population growth and decrease, thus possibly reflecting a role for immune selected epitopes in linkage to the tracedsubstitution sites that may have important relevance for vaccine design. Analysis evidenced the co-circulation andpredominance of distinct HRSV genotypes in Brazil and suggested a year-round presence of the virus. In Brazil, GA2 and GA5were the main culprits of HRSV outbreaks until recently, when the GB3 Insert became highly prevalent. Using Bayesianmethods, we determined the dispersal patterns of genotypes through several inferred migratory routes.
Conclusions/Significance: Genotypes spread across continents and between neighboring areas. Crucially, genotypes alsoremained at any given region for extended periods, independent of seasonal outbreaks possibly maintained by re-infectingthe general population.
Citation: Katzov-Eckert H, Botosso VF, Neto EA, Zanotto PMdA, the VGND consortium (2012) Phylodynamics and Dispersal of HRSV Entails Its Permanence in theGeneral Population in between Yearly Outbreaks in Children. PLoS ONE 7(10): e41953. doi:10.1371/journal.pone.0041953
Editor: Paul J. Planet, Columbia University, United States of America
Received May 4, 2011; Accepted June 29, 2012; Published October 15, 2012
Copyright: � 2012 Katzov-Eckert et al. This is an open-access article distributed under the terms of the Creative Commons Attribution License, which permitsunrestricted use, distribution, and reproduction in any medium, provided the original author and source are credited.
Funding: This work is part of the Viral Genetic Diversity Program (VGDN), funded by FAPESP under project Nu 00/4205-6. The funders had no role in study design,data collection and analysis, decision to publish, or preparation of the manuscript.
Competing Interests: The authors have declared that no competing interests exist.
* E-mail: [email protected]
Introduction
Human respiratory syncytial virus (HRSV) causes serious
respiratory tract infections in infants, elderly and immunocom-
promised adults [1,2,3,4]. HRSV epidemics are associated with
climate patterns and occur annually in late autumn and winter
in temperate climates, and within the rainy season in tropical
countries [5,6]. It is estimated that 64 million HRSV infections
occur annually, resulting in 160,000 deaths (Initiative for
Vaccine Research: respiratory syncytial virus, World Health
Organization http://www.who.int/vaccine_research/diseases/
ari/en/index3.html, update September 2009). Children are
susceptible to repeated HRSV infections and to developing
severe disease [7,8]. In 2005, an estimated 33.8 million HRSV-
associated acute lower-respiratory tract infections (ALRTI)
occurred in children under five years of age; 3.4 million cases
required hospital admission and 66,000–199,000 children died
[9]. Reports on HRSV in developing countries have shown that
HRSV-related mortality is higher than in industrialized
countries [5,10].
In Brazil, 30–50% of outpatient consultations and more than
50% of hospitalizations are attributed to ALRTI [11]. Strikingly in
Brazil, 10–15% of deaths of children under five years old were
attributed to ALRTI, 80% of which were due to pneumonia, and
22–38% have been associated with HRSV infections
[12,13,14,15,16,17].
HRSV is an enveloped non-segmented, non-recombinant in
nature, negative RNA virus, classified within the Paramyxoviridae
family [18,19,20]. Two major groups of HRSV have been
described based on antigenic and genetic studies, HRSVA and
HRSVB [21,22,23,24]. Both groups co-circulate in each epidemic
period. Genomic characterization has further divided HRSVA
and HRSVB into genotypes: GA1–GA7, and SAA1 [25,26],
GB1–GB4, SAB1–SAB3 and GB3 with a 60-nucleotide insertion
(GB3 Insert [25,26,27]. These genotypes can co-circulate in the
same community, usually with a predominance of one or two
PLOS ONE | www.plosone.org 1 October 2012 | Volume 7 | Issue 10 | e41953
genotypes, which can shift over the years
[28,29,30,31,32,33,34,35,36,37,38,39]. The G glycoprotein is
one of the main antibody target responsible for neutralizing
immune responses to HRSV [22] and displays extensive hetero-
geneity between and within genotypes [40,41,42,43].
The G protein is a type II integral protein of 289 to 319 amino
acids, depending on the viral strain [44]. The attachment G
protein can be divided into an intracellular domain, a transmem-
brane domain, and an ectodomain. The ectodomain is comprised
of two hypervariable mucin-like regions (HVRs) which are
extensively glycolylated with both N- and O-linked sugars and
contain a high proportion of proline [45]. The HVRs are
separated by a highly conserved non-glycolylated region compris-
ing residues 151–190 which contains four cysteines held together
by disulfide bonds in a cysteine noose that assumed to represent a
receptor-binding site [46]. The HVRs are under positive selection
[47,48] and contain multiple epitopes that are recognized by both
murine monoclonal antibodies and human convalescent sera [49].
The variability between HRSV genotypes is one of the features
of HRSV infections that contribute to the ability of the virus to
infect people repeatedly and cause yearly outbreaks [50,51].
HRSV variants are under constant pressure from the human
immune response [52,53,54]. Possibly, human immunity influenc-
es HRSV evolution and selects which genotypes will predominate
in consecutive seasonal outbreaks [47]. To date there is no
effective vaccine available against the virus [55].
Based on the coalescent theory of Kingman (1982), intra-species
gene genealogies have been extensively used to infer various
demographic parameters for a diverse set of organisms [56],
allowing statistical inferences to be made on the time and mode of
evolution of a diverse set of organisms ranging from endogenous
[57] and exogenous viruses [58,59,60] up to complex metazoa
[61]. Notably, results obtained from the genealogies and
epidemiology of Dengue viruses showed almost precise agreements
between the dynamic patterns over time estimated, which suggest
that phylodynamics can recover equivalent information to that
obtained by the number of notified cases through time in an
outbreak [62]. To contribute to our understanding of HRSV,
particularly its dynamics and spatial patterning we performed an
evolutionary analysis on available HRSV genome sequences
sampled globally.
Results
Sequences of the variable region 2 of the G glycoprotein (G2)
gene of HRSVA (n = 1203 sampled globally between 1956 and
2005) and HRSVB (n = 780 sampled globally between 1960 and
2006) were used to classify sequences into distinct genotypes
consistent with previously assigned nomenclatures [48] (viral
genealogies available from the authors upon request). Bayesian
skyline plot (BSL) analyses were performed to reconstruct the past
population dynamics of HRSV (Figures 1 & 2), while also
portraying its evolutionary dynamics by examining the process of
amino acid replacements and changes in effective population size
(Ne.g) of genotypes over time (Figure 2).
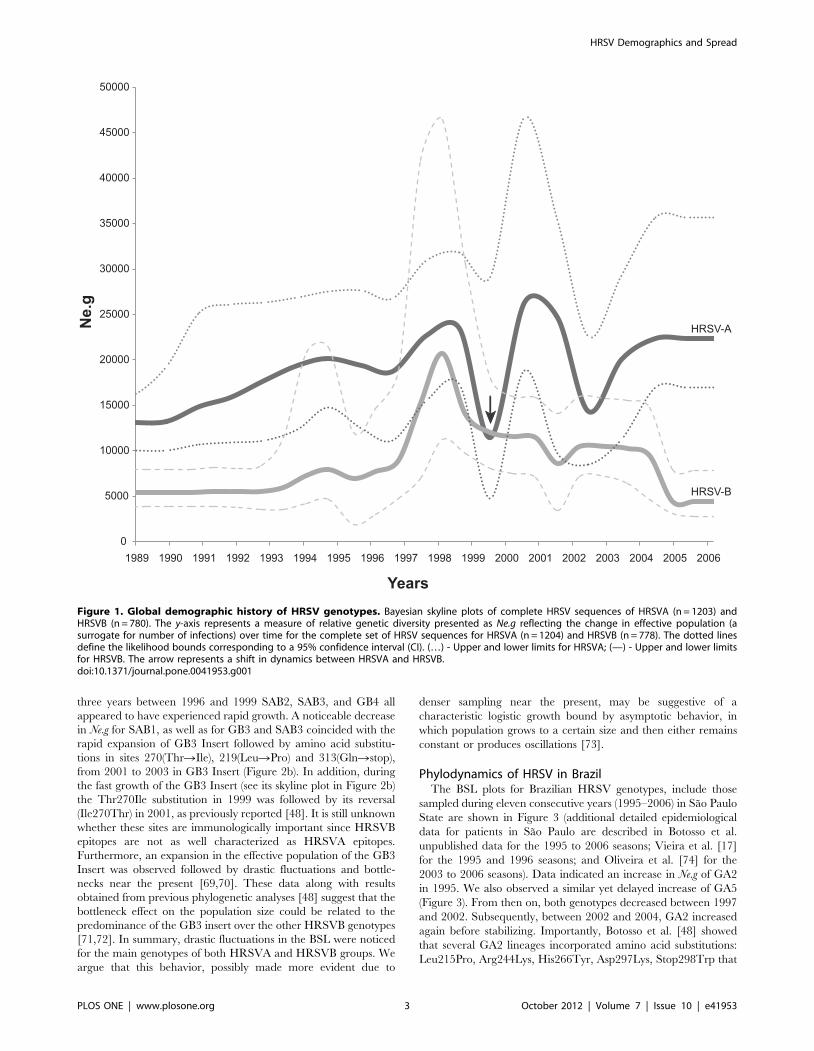
Phylodynamics of HRSVThe Bayesian skyline of global HRSV gene sequences showed a
predominance of HRSVA over HRSVB during the entire period
of the analysis, with the exception of 1999, when the two BSL plots
crossed one another (Figure 1). Initially, a steady demographic
expansion with slight fluctuations of both major HRSV groups
(HRSVA and HRSVB) was observed between the years 1990 and
1998, with a dramatic fluctuation between mid-1998 to 2000.
Sampling of HRSV steadily increased from 1980, and the majority
of samples were collected between 1996 and 2004 (for HRSVA)
and between 1996 and 2005 (for HRSVB) (mean = 1999; Figure
S1). In the years between 2000 and 2002, HRSVA had its highest
value of effective population (Ne.g), coinciding with HRSVB’s slow
decrease. Both HRSVA and HRSVB circulation fluctuated
between 1996 and 2005. Importantly, the circulation of HRSVA
was positively correlated with that of HRSVB before 1999, and
became negatively correlated thereafter (see vertical arrow in
Figure 1 and Figure S2). In addition, in very recent years the
circulation of HRSV groups A and B was positively correlated, yet
with a very low signal, corresponding to the flattening of the
skyline observed in the dynamics of HRSVA and HRSVB after
2005.
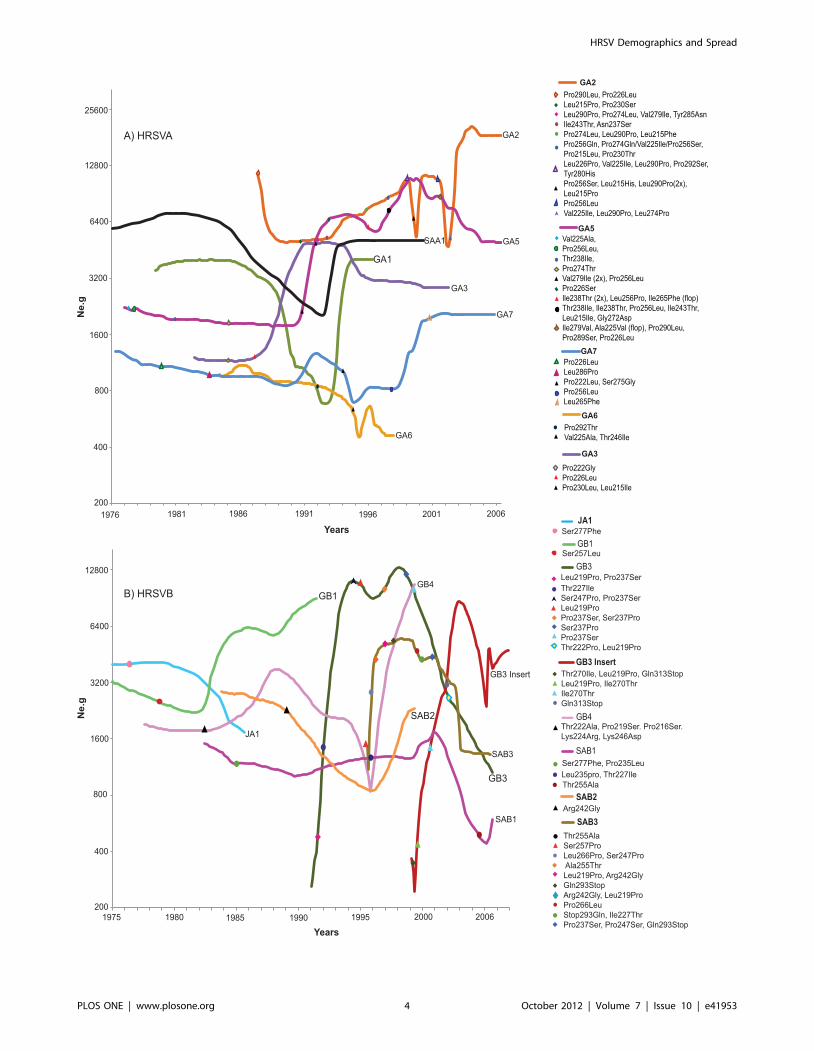
Phylodynamics of HRSVA genotypesGenotypes GA2 and GA5 appeared to have predominated
HRSVA outbreaks since the beginning of the 1990s (Figure 2). In
1991, an increase in the effective population (i.e. Ne.g) of GA5 was
observed modulating its circulation pattern with GA2. By 2002,
GA2 had the higher population growth rate (Figure 2a). These
results agree with reports showing GA2 and GA5 to be the most
prevalent HRSVA genotypes of contemporary times
[33,35,63,64,65,66]. Our previous analysis of positive substitution
sites for HRSVA indicated that population growth coincided with
an increase in the number of replacements of amino acids in the
G2 protein on sites described to be under positive selection
pressure for both genotypes (GA2, GA5; Figure 3a [48]). Notably,
immunologically important amino acid substitutions (Pro290Leu,
Pro274Leu, Val225Ile, Leu226Pro and Pro256Leu, or Ser or Gln
[42,67,68] were observed in GA2 upon its increase, as well as
several substitutions upon its decrease (Pro256Ser, Ile238Thr and
Leu256Pro) (Figure 2a). A substitution of Leu to Pro on site 274 in
1996, and a reversion of this site from Pro to Leu in 2002 on a
monophyletic lineage within GA2 (characteristic of a ‘flip-flop’
pattern [48]) corresponding to an increase in GA2 was also
observed. There were many ‘flip-flop’ substitutions in monophy-
letic lineages of GA5 especially upon its increase between 1995
and 1998 (Ile238Thr and Leu256Pro). A correlation between
amino acid replacements and dynamic changes for the minor
HRSVA genotypes was not evident. Furthermore, a flat BSL for
HRSVA genotypes between 1976 and 1985 was observed, possibly
indicative of stable dynamics and/or loss of cladogenetic signals
due to coalescence and loss of older lineages that were not
sampled. Lineages, GA1, GA3, GA6 and SAA1 appeared to have
been either vanished or stopped being sampled at different times.
Interestingly, several of the minor genotypes appeared to maintain
stable endemicity through time periods spanning across seasonal
outbreaks (GA3, SAA1, and GA7).
Phylodynamics of HRSVB genotypesHRSVB predominant genotypes replaced each other over time.
JA1 was followed by GB1 in the early 90s. From the mid-90s
onwards, the three main HRSVB genotypes circulating globally
were GB3, GB3 Insert, and SAB3 (Figure 2b). After 1991, GB3
expanded rapidly, reaching a peak in 1998 before decreasing
between 2001 and 2005. Similarly, SAB3 related to GB3 [26,48]
was first detected in 1995, grew rapidly until it reached a peak in
1998 and then began to fluctuate. Subsequently in 2002, SAB3
decreased sharply. Interestingly, fluctuations in both GB3 and
SAB3 were followed by several G2 glycoprotein amino acid
substitutions (Figure 2b). These substitutions have been previously
proposed to be under positive selection in both genotypes [48].
Demographic data inferred from the BSL plots showed that for
HRSV Demographics and Spread
PLOS ONE | www.plosone.org 2 October 2012 | Volume 7 | Issue 10 | e41953
three years between 1996 and 1999 SAB2, SAB3, and GB4 all
appeared to have experienced rapid growth. A noticeable decrease
in Ne.g for SAB1, as well as for GB3 and SAB3 coincided with the
rapid expansion of GB3 Insert followed by amino acid substitu-
tions in sites 270(ThrRIle), 219(LeuRPro) and 313(GlnRstop),
from 2001 to 2003 in GB3 Insert (Figure 2b). In addition, during
the fast growth of the GB3 Insert (see its skyline plot in Figure 2b)
the Thr270Ile substitution in 1999 was followed by its reversal
(Ile270Thr) in 2001, as previously reported [48]. It is still unknown
whether these sites are immunologically important since HRSVB
epitopes are not as well characterized as HRSVA epitopes.
Furthermore, an expansion in the effective population of the GB3
Insert was observed followed by drastic fluctuations and bottle-
necks near the present [69,70]. These data along with results
obtained from previous phylogenetic analyses [48] suggest that the
bottleneck effect on the population size could be related to the
predominance of the GB3 insert over the other HRSVB genotypes
[71,72]. In summary, drastic fluctuations in the BSL were noticed
for the main genotypes of both HRSVA and HRSVB groups. We
argue that this behavior, possibly made more evident due to
denser sampling near the present, may be suggestive of a
characteristic logistic growth bound by asymptotic behavior, in
which population grows to a certain size and then either remains
constant or produces oscillations [73].
Phylodynamics of HRSV in BrazilThe BSL plots for Brazilian HRSV genotypes, include those
sampled during eleven consecutive years (1995–2006) in Sao Paulo
State are shown in Figure 3 (additional detailed epidemiological
data for patients in Sao Paulo are described in Botosso et al.
unpublished data for the 1995 to 2006 seasons; Vieira et al. [17]
for the 1995 and 1996 seasons; and Oliveira et al. [74] for the
2003 to 2006 seasons). Data indicated an increase in Ne.g of GA2
in 1995. We also observed a similar yet delayed increase of GA5
(Figure 3). From then on, both genotypes decreased between 1997
and 2002. Subsequently, between 2002 and 2004, GA2 increased
again before stabilizing. Importantly, Botosso et al. [48] showed
that several GA2 lineages incorporated amino acid substitutions:
Leu215Pro, Arg244Lys, His266Tyr, Asp297Lys, Stop298Trp that
Figure 1. Global demographic history of HRSV genotypes. Bayesian skyline plots of complete HRSV sequences of HRSVA (n = 1203) andHRSVB (n = 780). The y-axis represents a measure of relative genetic diversity presented as Ne.g reflecting the change in effective population (asurrogate for number of infections) over time for the complete set of HRSV sequences for HRSVA (n = 1204) and HRSVB (n = 778). The dotted linesdefine the likelihood bounds corresponding to a 95% confidence interval (CI). (…) - Upper and lower limits for HRSVA; (—) - Upper and lower limitsfor HRSVB. The arrow represents a shift in dynamics between HRSVA and HRSVB.doi:10.1371/journal.pone.0041953.g001
HRSV Demographics and Spread
PLOS ONE | www.plosone.org 3 October 2012 | Volume 7 | Issue 10 | e41953
HRSV Demographics and Spread
PLOS ONE | www.plosone.org 4 October 2012 | Volume 7 | Issue 10 | e41953
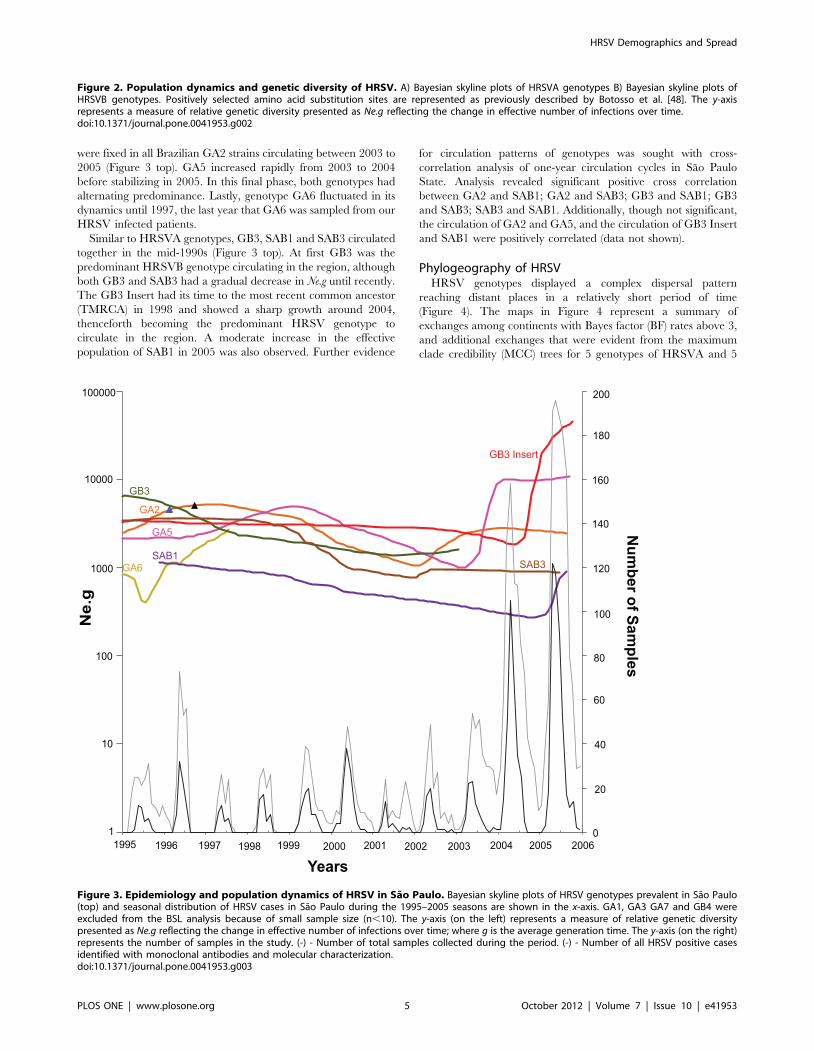
were fixed in all Brazilian GA2 strains circulating between 2003 to
2005 (Figure 3 top). GA5 increased rapidly from 2003 to 2004
before stabilizing in 2005. In this final phase, both genotypes had
alternating predominance. Lastly, genotype GA6 fluctuated in its
dynamics until 1997, the last year that GA6 was sampled from our
HRSV infected patients.
Similar to HRSVA genotypes, GB3, SAB1 and SAB3 circulated
together in the mid-1990s (Figure 3 top). At first GB3 was the
predominant HRSVB genotype circulating in the region, although
both GB3 and SAB3 had a gradual decrease in Ne.g until recently.
The GB3 Insert had its time to the most recent common ancestor
(TMRCA) in 1998 and showed a sharp growth around 2004,
thenceforth becoming the predominant HRSV genotype to
circulate in the region. A moderate increase in the effective
population of SAB1 in 2005 was also observed. Further evidence
for circulation patterns of genotypes was sought with cross-
correlation analysis of one-year circulation cycles in Sao Paulo
State. Analysis revealed significant positive cross correlation
between GA2 and SAB1; GA2 and SAB3; GB3 and SAB1; GB3
and SAB3; SAB3 and SAB1. Additionally, though not significant,
the circulation of GA2 and GA5, and the circulation of GB3 Insert
and SAB1 were positively correlated (data not shown).
Phylogeography of HRSVHRSV genotypes displayed a complex dispersal pattern
reaching distant places in a relatively short period of time
(Figure 4). The maps in Figure 4 represent a summary of
exchanges among continents with Bayes factor (BF) rates above 3,
and additional exchanges that were evident from the maximum
clade credibility (MCC) trees for 5 genotypes of HRSVA and 5
Figure 2. Population dynamics and genetic diversity of HRSV. A) Bayesian skyline plots of HRSVA genotypes B) Bayesian skyline plots ofHRSVB genotypes. Positively selected amino acid substitution sites are represented as previously described by Botosso et al. [48]. The y-axisrepresents a measure of relative genetic diversity presented as Ne.g reflecting the change in effective number of infections over time.doi:10.1371/journal.pone.0041953.g002
Figure 3. Epidemiology and population dynamics of HRSV in Sao Paulo. Bayesian skyline plots of HRSV genotypes prevalent in Sao Paulo(top) and seasonal distribution of HRSV cases in Sao Paulo during the 1995–2005 seasons are shown in the x-axis. GA1, GA3 GA7 and GB4 wereexcluded from the BSL analysis because of small sample size (n,10). The y-axis (on the left) represents a measure of relative genetic diversitypresented as Ne.g reflecting the change in effective number of infections over time; where g is the average generation time. The y-axis (on the right)represents the number of samples in the study. (-) - Number of total samples collected during the period. (-) - Number of all HRSV positive casesidentified with monoclonal antibodies and molecular characterization.doi:10.1371/journal.pone.0041953.g003
HRSV Demographics and Spread
PLOS ONE | www.plosone.org 5 October 2012 | Volume 7 | Issue 10 | e41953
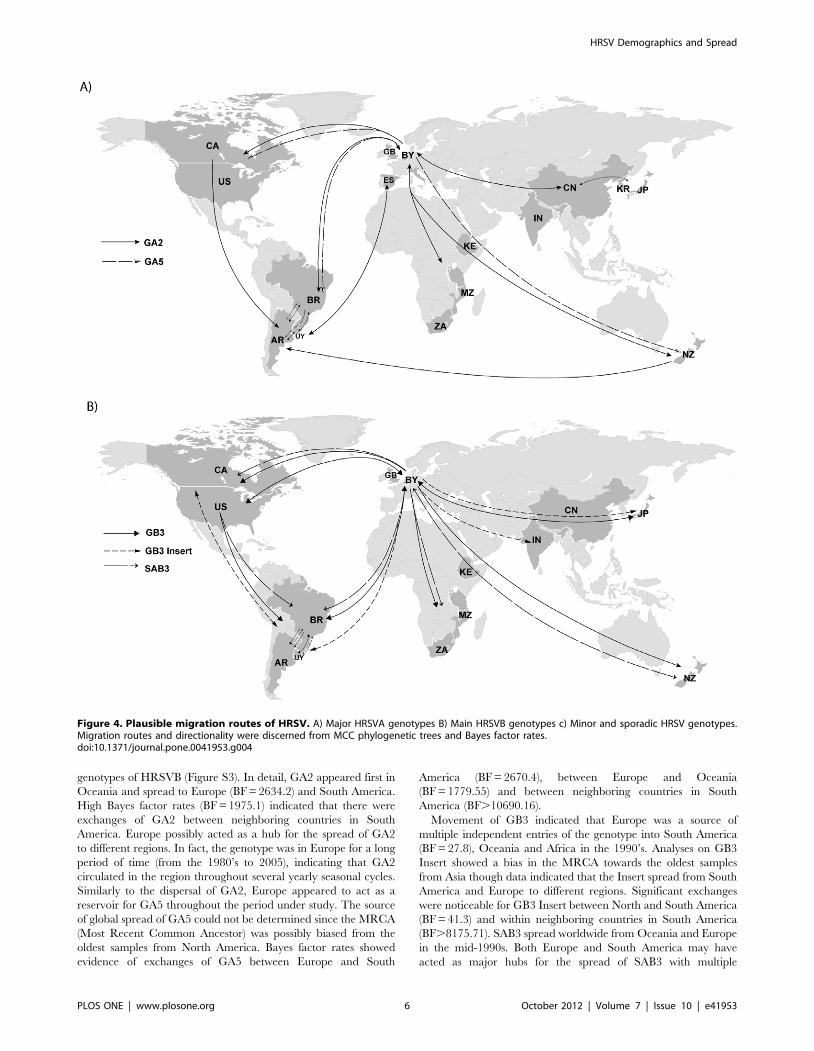
genotypes of HRSVB (Figure S3). In detail, GA2 appeared first in
Oceania and spread to Europe (BF = 2634.2) and South America.
High Bayes factor rates (BF = 1975.1) indicated that there were
exchanges of GA2 between neighboring countries in South
America. Europe possibly acted as a hub for the spread of GA2
to different regions. In fact, the genotype was in Europe for a long
period of time (from the 1980’s to 2005), indicating that GA2
circulated in the region throughout several yearly seasonal cycles.
Similarly to the dispersal of GA2, Europe appeared to act as a
reservoir for GA5 throughout the period under study. The source
of global spread of GA5 could not be determined since the MRCA
(Most Recent Common Ancestor) was possibly biased from the
oldest samples from North America. Bayes factor rates showed
evidence of exchanges of GA5 between Europe and South
America (BF = 2670.4), between Europe and Oceania
(BF = 1779.55) and between neighboring countries in South
America (BF.10690.16).
Movement of GB3 indicated that Europe was a source of
multiple independent entries of the genotype into South America
(BF = 27.8), Oceania and Africa in the 1990’s. Analyses on GB3
Insert showed a bias in the MRCA towards the oldest samples
from Asia though data indicated that the Insert spread from South
America and Europe to different regions. Significant exchanges
were noticeable for GB3 Insert between North and South America
(BF = 41.3) and within neighboring countries in South America
(BF.8175.71). SAB3 spread worldwide from Oceania and Europe
in the mid-1990s. Both Europe and South America may have
acted as major hubs for the spread of SAB3 with multiple
Figure 4. Plausible migration routes of HRSV. A) Major HRSVA genotypes B) Main HRSVB genotypes c) Minor and sporadic HRSV genotypes.Migration routes and directionality were discerned from MCC phylogenetic trees and Bayes factor rates.doi:10.1371/journal.pone.0041953.g004
HRSV Demographics and Spread
PLOS ONE | www.plosone.org 6 October 2012 | Volume 7 | Issue 10 | e41953
exchanges between the continents throughout the period under
study (BF = 18.86). The highest BF rate for SAB3 was identified
for exchanges between North and South America (BF = 165.2).
Even-though we had reduced number of sequences of the minor
(GA6, SAA1, SAB1, SAB2) and sporadic (GA7, GB4) genotypes,
which possibly caused the unveiled spread to have lower BF for
their rates, the adjacency patterns on the MCC trees revealed that
these genotypes were also introduced to most continents (Figure 4).
Discussion
The high rate of evolutionary change in HRSV may confer
selective advantage and facilitate re-infections of the virus.
Genotypes accumulating several mutations have been predicted
to be the precursors of new lineages due to antigenic drift for the
influenza virus [58,75]. Nevertheless, there is still a need to better
understand how the complex interactions among HRSV lineages
in its human host may affect its pattern of genotype replacement in
space and time. While trying to address some of these issues, this
study provides a large-scale phylogeographic analysis establishing
the divergence process and demographic history of HRSV
genotypes. Our analyses further showcased both the differences
in the relative genetic diversity and the patterns of co-circulation
between HRSV genotypes and revisited the associated genotype
replacement process [48].
The Phylodynamics of HRSVFrom the demographic history of HRSV (Figure 1) a ‘millennium
shift’ was observed whereby at the end of the 1990s there was an
apparent significant shift in cross-correlation between the overall
dynamics of HRSVA and HRSVB. Interestingly, at the same time
GA1, GA6 and SAB2 apparently disappeared, GB3 Insert globally
increased after 2001. It is worthwhile to consider that a lack of
sampling of any given HRSV genotype does not mean that the
lineage itself may have necessarily died out, since it may be
experiencing cryptic circulation in the regions that we examined,
or it may be still circulating in other localities that we did not
obtain samples from. Nonetheless, the dynamics profile of the GB3
Insert indicated a clear pattern of population growth concurrent
with amino acid replacements at positively selected codons of the
immunogenic G glycoprotein (as well as a significant change by
the addition of 20 amino acids to the variable region of the
protein). This pattern was not always the case for other HRSVB
genotypes (Figure 2). Particularly, we observed considerable amino
acid substitutions in GB3 and SAB3 under positive selection,
which appears to be at odds with the notion of immune escape,
since these two genotypes were subsequently replaced by the GB3
Insert (Figure 2b). These observations deserve some consideration.
There appears to be a consensus on the notion that replacements
coinciding with viral population expansions are selectively
advantageous and possibly associated with escape mutations
[75]. On the other hand, those positively selected substitutions
observed upon population reduction are no less interesting. We
argue that these positively selected substitutions may reflect the
complex role of immune reactive sites outside the sites we looked
upon at the variable G2 domain in the G glycoprotein, and that
they may also be under linkage with the substitution sites that we
traced, such as the major neutralizing antibody epitope that sits
between amino acid residues 150 and 170 at the cysteine noose
domain [76]. We further argue that this ‘linked selection’ effect
would depend on a large viral population [77] and the scarcity of
recombination events, which is precisely the case for nonsegmen-
ted negative-strand RNA viruses (Mononegavirales) in general, and
for HRSV in particular [20]. Under this scenario, the reductions
in Ne.g following amino acid replacements observed could reflect
the outcome of viral strain competition under human immune
surveillance. Apparently the ‘flip-flop’ reversals that we observed
may be only an example of a more general process. Recent studies
have shown that a cyclic arms race between viruses and mammal
hosts takes place under conditions where viruses are relatively
constrained. A ‘rock-paper-scissors game’ model remarkably
similar to the ‘flip-flop’ pattern we observe in HRSV has been
proposed, which explains the co-evolution of several genes, such
as, Nef, TRIM5 and Vif interacting with retroviral capsid of the
Simian immunodeficiency virus (SIV) and APOBECC3G inter-
acting with HIV and SIV [78].
In Brazil, the typical seasonal epidemic outbreak of HRSV with
the expected sharp yearly peaks (Figure 3, Botosso et al.
unpublished data, [17,74]), together with the estimated relative
population growth of genotypes (Figure 3) reflect the maintenance
of lineages in the population, as demonstrated in several hospital-
based longitudinal studies [5]. A similar pattern has also been
observed for the influenza virus in tropical regions [79,80,81].
Asymptomatic adults are most likely the source of the viral
reservoir that determines seasonal outbreaks in immunologically
naıve populations of children [82]. This inconspicuous group of
carriers may not only be a main HRSV reservoir, but also the
determining factor governing its long-term dynamics that does not
seem to be affected by the yearly cyclic outbreaks we observed
among children (Figure 3). Accordingly, we clearly observe a trend
in the gradual shifting of predominant genotypes in the
demographic history at a slower pace, sometimes taking several
years encompassing successive HRSV seasons (Figure 2). This
suggests that perhaps herd immunity to HRSV may have a
significant role in the shifting of the predominant genotypes
throughout successive epidemics [82,83].
HRSV spread in space and timeOur G2 gene genealogies suggested that the HRSV genotypes
we sampled were introduced from Europe into the Americas. The
pattern indicated a movement of genotypes from the Northern to
the Southern hemisphere, which agrees with the fact that the
majority of the human population resides in the Northern
hemisphere. Substantially more people engage in international
and transcontinental travel, which may explain why HRSV
appeared to have entered Asia via Europe and Oceania [83,84].
We also observed back and forth movement of genotypes between
Europe and Oceania, which has also been observed for other
respiratory viruses, such as influenza [85], possibly as a result of
stronger socio-economic ties within these regions [83,84,86].
There were numerous exchanges of genotypes within neighboring
countries in South America. Furthermore, HRSV dispersal
inferred across the gene genealogies showed that Oceania
appeared to be a geographic source for multiple genotypes
(GA6, GA7 SAA1, SAB1, SAB2 and SAB3). Interestingly, of those
genotypes GA6, SAB2 and SAA1 have not been sampled recently
(Figure 2). Given the dense sampling we had for Europe and South
America, we could see these localities acting as major hubs for the
worldwide spread of HRSV during extended periods. Another
potential bias may have been introduced by using different
sampling timeframes for the different continents. These sampling
biases that were instrumental in establishing the residence time of
genotypes in a given locality, could have also introduced biases on
the directionality of the recovered migratory events. Although there
is no clear route of HRSV migration, the dispersal of the virus
does fit well with the pattern of human movement along major
travelling routes (Figure 4, see also Figure S4 Google Earth
‘movies’ showing worldwide HRSV spread in time and space).
HRSV Demographics and Spread
PLOS ONE | www.plosone.org 7 October 2012 | Volume 7 | Issue 10 | e41953
Within genotypes, clusters of sequences sampled from the same
location were observed, but these clusters were interspersed with
those from other locations. This pattern suggests a geographic
genetic flow, whereby not only distinct genotypes endemically
persist in diverse parts of the world but also the movement of viral
lineages among locations [41,87,88]. Although this phylogenetic
pattern may be affected by inconsistent sampling through the
years, it may also indicate HRSV’s temporal strain replacement
occurring globally, which agrees with the observed changes in
their cyclical clinical prevalence. On the other hand, it is
important to stress that the span of GA2 and GA5 in particular
and of several other genotypes in space and time demonstrate
findings that HRSV may remain in a regional hub while being
continuously broadcasted elsewhere for a long period of time,
independently of the pattern of seasonal outbreaks.
Crucially, if the main component in HRSV transmission were
the observed seasonal outbreaks occurring among children we
could expect to observe random fluctuations between seasons in
the overall HRSV genotypes causing fast succession of genotypes
(i.e., clade replacement), possibly on a yearly basis [83,89].
Essentially, since our results indicate that HRSV subtypes remain
monophyletic at the same place for long periods of time, a
plausible explanation for these findings may be that the virus
remains in the general population since the virus has no other host.
We also show the introduction of new epidemic strains around the
globe which makes persistence, introduction and re-introduction
important mechanisms for HRSV maintenance. Accordingly,
simulation studies have shown that introduction of new infections
in a community may be necessary for the persistence of HRSV in
a population [90]. The transmission dynamics of HRSV is
complex and both asymptomatic carriers and influx of infections
allow for the maintenance and for the occurrence of epidemics in a
community. Eventhough we used all available data, a limiting
factor of our study is that sequences were only from a certain
number of locations with sparse and time-restricted sampling.
Nonetheless, the pattern of the underlying demographic history
unfolded by our coalescent-based analysis is one of slow dynamics
characterized by a series of slow sequential expansions and
fluctuations, evidencing the replacement of predominance among
lineages that have otherwise a long-term permanence (i.e.,
circulation) in the population.
Materials and Methods
Nucleotide sequencesPartial HRSV G gene sequences (from Brazil (n = 568) and
from elsewhere (n = 1415)) with known collection dates between
1956 and 2006 were used in this study. A comprehensive list of
groups of sequences analyzed along with Genbank accession
numbers, geographic origin and sample collection date are
provided in Table S1 and Table S2.
Respiratory samplesClinical samples from Brazil (n = 3695) were collected from
infants and young children from 1 week to 5 years of age,
hospitalized with acute lower respiratory tract infection (ALRTI)
in the state of Sao Paulo, Brazil over eleven consecutive HRSV
seasons from 1995 to 2006 (Botosso et al. unpublished data).
Description of sample typing methods and ALRTI patients has
been reported previously [14,48,74]. Partial HRSV G gene
amplification and sequencing were performed as described by
Botosso et al. [48].
Phylodynamics of HRSVDemographic dynamics based on HRSV gene genealogies (i.e.,
phylodynamics) were estimated from partial G gene sequences
(n = 1983) using the Bayesian Markov Chain Monte Carlo
(MCMC) method implemented in the BEAST, v1.5.4 package
(http://beast.bio.ed.ac.uk/ [91]. For phylodynamics studies the
temporal relationship among all sequences was established by
using sequences with known date of sampling of both HRSVA and
HRSVB in respect to the HRSVA Long strain sampled in 1956
[48]. Bayesian MCMC analyses were performed using a relaxed
molecular clock model (uncorrelated lognormal-distributed model
- UCLD), which allows for variation in the substitution rate
between monophyletic lineages. Analyses were independently
performed using the general time-reversible (GTR) nucleotide
substitution model, with a gamma-distributed among-site rate
variation with four rate categories. Bayesian MCMC analyses
were repeated using the constant size and exponential growth
models in order to investigate the degree to which dating estimates
are affected by the demographic model chosen. Each Bayesian
MCMC analysis was run for 50 million states and sampled every
10,000 states. Posterior probabilities were calculated with a burnin
of 2 million states and checked for convergence using the Tracer
v1.4 program (http://beast.bio.ed.ac.uk/Tracer) with uncertain-
ties depicted as 95% highest probability density (HPD) intervals.
Bayesian skyline plots (BSL), which depict estimates for the relative
viral genetic diversity (Ne.g) that relates to the relative change in the
effective number of infections through time, were estimated for all
HRSV genotypes. To measure the changes in growth rate (r) over
time estimates were obtained with BEAST, v1.5.4 [91] from the
best-fit demographic model for each genotype and analyzed over
the sampling period. Maximum clade credibility (MCC) trees for
HRSV genotypes were obtained by pooling five independent
MCMC runs, each of which sampled from 20 million chains after
a pre-burning period of 30 million chains, to ensure sampling from
a stationary MCMC (inspected with Tracer). Analyses of selective
pressures were performed by parsimonious reconstructions of the
positively selected sites along the phylogenetic trees of the G
protein of HRSVA and HRSVB using the ‘accelerated transfor-
mation’ (ACCTRAN) and the ‘delayed transformation’ (DEL-
TRAN) methods implemented in MacClade v4.07 (MacClade for
Mac OS X Rel. 4.07. 2005. Sunderland, MA: Sinauer Associates,
Inc.), as previously described by Botosso et al. [48].
Phylogeography of HRSVGeographical origin of each sample was coded as a set of
terminal unordered character states for each HRSV sequence,
represented as a single capital letter. Analysis was performed using
a standard continuous-time Markov chain (CTMC) model with
the Bayesian stochastic search variable selection (BSSVS) proce-
dure. The most parsimonious description of geographic spread
was obtained by MCMC sampling from the plausible set of trees
using BEAST v1.5.4 [91]. Entry dates of time stamped sequences
were estimated with 95% Highest Probability Density (HPD) in
the Tracer v1.4 program. Bayes factor (BF) analysis implemented
in BEAST v1.5.4 was used to identify rates between two locations.
During the discrete characters migration analyses, BF values above
3 were assumed to provide substantial strength, and BF above 30
to provide very strong evidence for migration events taking place.
Nevertheless, because sequences were time-stamped, providing
trees with dated nodes, information from the adjacency patterns in
the MCC trees was sought to obtain evidence for genotype
exchange from nodes with posterior probabilities near or above
90% (p>0.9), when rates of exchange among localities had BF
below 3. The FigTree v1.3.1 program (http://tree.bio.ed.ac.uk/
HRSV Demographics and Spread
PLOS ONE | www.plosone.org 8 October 2012 | Volume 7 | Issue 10 | e41953
software/figtree/) was used to visualize spatial and temporal
information, and the virtual globe software Google Earth (http://
earth.google.com).
Cross-correlation analysisTo estimate the degree to which HRSV types and genotypes are
correlated over time, we did a time series analysis. Data from the
Bayesian skyline consisting of Ne.g over time generated with
BEAST were synchronized by interpolation using polynomial
interpolation in Origin v6.1052 software (1991–2000, North-
ampton, MA: OriginLab Corporation) and transformed into
comparable time series. To establish whether a relationship exists
between pairs of synchronous series, we computed correlation
coefficients with in SPSS v. 11.0.4 (Chatfield 1975; SPSS for Mac
Rel. 11.0.4. 2005. Chicago: SPSS Inc.) over a range of time lags of
n = 365, n = 730, n = 999 days, that cover one up to three years,
corresponding to time spans between seasonal-spaced cycle to
minimize possible autocorrelation noise from data interpolation.
Supporting Information
Figure S1 Sampling of HRSV between the years 1956and 2005.
(EPS)
Figure S2 Cross-correlation analysis of HRSV. Cross-
correlation coefficient as a function of the lag number set as the
yearly cycle that HRSVA and HRSVB were displaced in time. A)
Between 1989 to October 1999. B) Between November 1999 to
2006. A lag of 365 was used to discern cross correlation of one-
year cycles between HRSV groups. Dotted lines (...) represent the
likelihood bounds corresponding to a 95% confidence interval.
(EPS)
Figure S3 Maximum clade credibility (MCC) phyloge-nies for HRSV genotypes. MCC phylogenies are based on
continents with branches colored according to the most probable
location state of their descendent nodes.
(TIF)
Figure S4 Google Earth ‘movies’ depicting inferenceresults on the movement of HRSV genotypes around theglobe. These files can be directly uploaded to the Google Earth
software (http://www.google.com/earth/index.html). For a global
view of the spread of all HRSV genotypes in time load all movies
at once. a)GA2 b)GA5 c)GB3 d) GB3 insert e)SAA1 f)SAB1
g)SAB3 h)GA6 i)GA7 j)GB4 k)SAB2.
(ZIP)
Table S1 GenBank accession numbers of sequencesused in this study.(DOC)
Table S2 Details of samples used in the study.(DOCX)
Acknowledgments
We would like to thank Eddie Holmes, Collin Russel, and Wladimir J.
Alonso and two anonymous referees for their constructive criticism and
suggestions.
Viral Genetic Diversity Network (VGDN) consortiummembers
Teresa Cristina Tavano Peret, Mirthes Ueda, Adriana Pasmanick,
Alfredo Elias Gilio, Andreia L. Leal, Angelica Cristina A. Campos, Claudia
T. P. Moraes, Carmem A. F. Oliveira, Claudio Schvartsman, Danielle
Bruna L. Oliveira, Edison Luiz Durigon, Eitan N. Berezin, Elisabeth
Cristina N. Tenorio, Flavia E. de Paula, Jose L. Proenca-Modena, Klaus E.
Stewien, Lourdes R. A.Vaz-de-Lima, Maria Candida O. Souza, Maria
Luisa Barbosa, Marisa A. Hong, Marisa A. Iwamoto, Maristela M.
Salgado, Neuza N. Sato, Osvaldo A. Sant’Anna, Priscila Comone, Rogerio
Pecchini, Sandra E. Vieira, Saulo D. Passos, Thereza S. Silva, Tokiko K.
Matsumoto. Lead author for the VGDN Consortium: Paolo Marinho de
Andrade Zanotto.
Author Contributions
Conceived and designed the experiments: VB HK-E EAN PMAZ.
Performed the experiments: VB HK-E EAN PMAZ. Analyzed the data:
VB HK-E PMAZ. Contributed reagents/materials/analysis tools: VB HK-
E EAN PMAZ. Wrote the paper: VB HK-E EAN PMAZ. VGDN
consortium generated most of the HRSV samples and sequences used in
this work.
References
1. Dowell SF, Anderson LJ, Gary HE Jr, Erdman DD, Plouffe JF, et al. (1996)Respiratory syncytial virus is an important cause of community-acquired lower
respiratory infection among hospitalized adults. The Journal of infectious
diseases 174: 456–462.
2. Falsey AR (2005) Respiratory syncytial virus infection in elderly and high-risk
adults. Experimental lung research 31 Suppl 1: 77.
3. Hall CB, Weinberg GA, Iwane MK, Blumkin AK, Edwards KM, et al. (2009)The burden of respiratory syncytial virus infection in young children. The New
England journal of medicine 360: 588–598.
4. Raboni SM, Nogueira MB, Tsuchiya LR, Takahashi GA, Pereira LA, et al.
(2003) Respiratory tract viral infections in bone marrow transplant patients.
Transplantation 76: 142–146.
5. Stensballe LG, Devasundaram JK, Simoes EA (2003) Respiratory syncytial virus
epidemics: the ups and downs of a seasonal virus. The Pediatric infectious
disease journal 22: S21–32.
6. Weber A, Weber M, Milligan P (2001) Modeling epidemics caused by
respiratory syncytial virus (RSV). Mathematical biosciences 172: 95–113.
7. Henderson FW, Collier AM, Clyde WA Jr, Denny FW (1979) Respiratory-syncytial-virus infections, reinfections and immunity. A prospective, longitudinal
study in young children. The New England journal of medicine 300: 530–534.
8. Tregoning JS, Schwarze J (2010) Respiratory viral infections in infants: causes,clinical symptoms, virology, and immunology. Clinical microbiology reviews 23:
74–98.
9. Nair H, Nokes DJ, Gessner BD, Dherani M, Madhi SA, et al. (2010) Globalburden of acute lower respiratory infections due to respiratory syncytial virus in
young children: a systematic review and meta-analysis. Lancet 375: 1545–1555.
10. Selwyn BJ (1990) The epidemiology of acute respiratory tract infection in youngchildren: comparison of findings from several developing countries. Coordinated
Data Group of BOSTID Researchers. Reviews of infectious diseases 12 Suppl 8:
S870–888.
11. Cardoso AM (2010) The persistence of acute respiratory infections as a Public
Health Problem. Cad Saude Publica 26: 2.
12. Calegari T, Queiroz DA, Yokosawa J, Silveira HL, Costa LF, et al. (2005)
Clinical-epidemiological evaluation of respiratory syncytial virus infection in
children attended in a public hospital in midwestern Brazil. The Brazilian
journal of infectious diseases : an official publication of the Brazilian Society of
Infectious Diseases 9: 156–161.
13. Moura FE, Blanc A, Frabasile S, Delfraro A, de Sierra MJ, et al. (2004) Genetic
diversity of respiratory syncytial virus isolated during an epidemic period from
children of northeastern Brazil. Journal of medical virology 74: 156–160.
14. Moura PO, Roberto AF, Hein N, Baldacci E, Vieira SE, et al. (2007) Molecular
epidemiology of human adenovirus isolated from children hospitalized with
acute respiratory infection in Sao Paulo, Brazil. Journal of medical virology 79:
174–181.
15. Nascimento JP, Siqueira MM, Sutmoller F, Krawczuk MM, de Farias V, et al.
(1991) Longitudinal study of acute respiratory diseases in Rio de Janeiro:
occurrence of respiratory viruses during four consecutive years. Revista do
Instituto de Medicina Tropical de Sao Paulo 33: 287–296.
16. Siqueira MM, Nascimento JP, Anderson LJ (1991) Antigenic characterization of
respiratory syncytial virus group A and B isolates in Rio de Janeiro, Brazil.
Journal of clinical microbiology 29: 557–559.
17. Vieira SE, Stewien KE, Queiroz DA, Durigon EL, Torok TJ, et al. (2001)
Clinical patterns and seasonal trends in respiratory syncytial virus hospitaliza-
tions in Sao Paulo, Brazil. Revista do Instituto de Medicina Tropical de Sao
Paulo 43: 125–131.
18. Collins PL, Crowe JEJ (2007) Respiratory syncytial virus and metapneumovirus.
In: Knipe DM, Griffin, D. E., Lamb, R. A., Martin, M.A., Roizman, B., Straus
S.E., editor. Fields Virology. 5th ed. Philadelphia: Lippincott Williams &
Wilkins. pp. 1601–1646.
HRSV Demographics and Spread
PLOS ONE | www.plosone.org 9 October 2012 | Volume 7 | Issue 10 | e41953
19. Fauquet C, Mayo MA, Maniloff J, Desselberger U, Ball LA (2005) The
Classification and Nomenclature of viruses: Eighth Report of the International
Committee on Taxonomy of Viruses. Viruses. Amsterdam, Boston, Heidelberg,
London, New York, Oxford, Paris, San Diego, San Francisco, Singapore,
Sydney, Tokyo: Elsevier Academic Press.
20. Spann KM, Collins PL, Teng MN (2003) Genetic recombination during
coinfection of two mutants of human respiratory syncytial virus. Journal of
virology 77: 11201–11211.
21. Sullender WM (2000) Respiratory syncytial virus genetic and antigenic diversity.
Clinical microbiology reviews 13: 1–15, table of contents.
22. Johnson PR, Spriggs MK, Olmsted RA, Collins PL (1987) The G glycoprotein
of human respiratory syncytial viruses of subgroups A and B: extensive sequence
divergence between antigenically related proteins. Proceedings of the National
Academy of Sciences of the United States of America 84: 5625–5629.
23. Mufson MA, Orvell C, Rafnar B, Norrby E (1985) Two distinct subtypes of
human respiratory syncytial virus. The Journal of general virology 66 (Pt 10):
2111–2124.
24. Anderson LJ, Hierholzer JC, Tsou C, Hendry RM, Fernie BF, et al. (1985)
Antigenic characterization of respiratory syncytial virus strains with monoclonal
antibodies. The Journal of infectious diseases 151: 626–633.
25. Peret TC, Hall CB, Schnabel KC, Golub JA, Anderson LJ (1998) Circulation
patterns of genetically distinct group A and B strains of human respiratory
syncytial virus in a community. The Journal of general virology 79 (Pt 9): 2221–
2229.
26. Venter M, Madhi SA, Tiemessen CT, Schoub BD (2001) Genetic diversity and
molecular epidemiology of respiratory syncytial virus over four consecutive
seasons in South Africa: identification of new subgroup A and B genotypes. The
Journal of general virology 82: 2117–2124.
27. Trento A, Galiano M, Videla C, Carballal G, Garcia-Barreno B, et al. (2003)
Major changes in the G protein of human respiratory syncytial virus isolates
introduced by a duplication of 60 nucleotides. The Journal of general virology
84: 3115–3120.
28. Arbiza J, Delfraro A, Frabasile S (2005) Molecular epidemiology of human
respiratory syncytial virus in Uruguay: 1985–2001–a review. Memorias do
Instituto Oswaldo Cruz 100: 221–230.
29. Cane PA, Pringle CR (1991) Respiratory syncytial virus heterogeneity during an
epidemic: analysis by limited nucleotide sequencing (SH gene) and restriction
mapping (N gene). The Journal of general virology 72 (Pt 2): 349–357.
30. Cane PA, Matthews DA, Pringle CR (1992) Analysis of relatedness of subgroup
A respiratory syncytial viruses isolated worldwide. Virus research 25: 15–22.
31. Cane PA, Matthews DA, Pringle CR (1994) Analysis of respiratory syncytial
virus strain variation in successive epidemics in one city. Journal of clinical
microbiology 32: 1–4.
32. Choi EH, Lee HJ (2000) Genetic diversity and molecular epidemiology of the G
protein of subgroups A and B of respiratory syncytial viruses isolated over 9
consecutive epidemics in Korea. The Journal of infectious diseases 181: 1547–
1556.
33. Frabasile S, Delfraro A, Facal L, Videla C, Galiano M, et al. (2003) Antigenic
and genetic variability of human respiratory syncytial viruses (group A) isolated
in Uruguay and Argentina: 1993–2001. Journal of medical virology 71: 305–
312.
34. Kamasaki H, Tsutsumi H, Seki K, Chiba S (2001) Genetic variability of
respiratory syncytial virus subgroup B strain isolated during the last 20 years
from the same region in Japan: existence of time-dependent linear genetic drifts.
Archives of virology 146: 457–466.
35. Reiche J, Schweiger B (2009) Genetic variability of group A human respiratory
syncytial virus strains circulating in Germany from 1998 to 2007. Journal of
clinical microbiology 47: 1800–1810.
36. Roca A, Loscertales MP, Quinto L, Perez-Brena P, Vaz N, et al. (2001) Genetic
variability among group A and B respiratory syncytial viruses in Mozambique:
identification of a new cluster of group B isolates. The Journal of general virology
82: 103–111.
37. Scott PD, Ochola R, Ngama M, Okiro EA, James Nokes D, et al. (2006)
Molecular analysis of respiratory syncytial virus reinfections in infants from
coastal Kenya. The Journal of infectious diseases 193: 59–67.
38. Seki K, Tsutsumi H, Ohsaki M, Kamasaki H, Chiba S (2001) Genetic variability
of respiratory syncytial virus subgroup a strain in 15 successive epidemics in one
city. Journal of medical virology 64: 374–380.
39. Zhang ZY, Du LN, Chen X, Zhao Y, Liu EM, et al. (2010) Genetic variability of
respiratory syncytial viruses (RSV) prevalent in Southwestern China from 2006
to 2009: emergence of subgroup B and A RSV as dominant strains. Journal of
clinical microbiology 48: 1201–1207.
40. Cane PA, Matthews DA, Pringle CR (1991) Identification of variable domains of
the attachment (G) protein of subgroup A respiratory syncytial viruses. The
Journal of general virology 72 (Pt 9): 2091–2096.
41. Garcia O, Martin M, Dopazo J, Arbiza J, Frabasile S, et al. (1994) Evolutionary
pattern of human respiratory syncytial virus (subgroup A): cocirculating lineages
and correlation of genetic and antigenic changes in the G glycoprotein. Journal
of virology 68: 5448–5459.
42. Martinez I, Dopazo J, Melero JA (1997) Antigenic structure of the human
respiratory syncytial virus G glycoprotein and relevance of hypermutation events
for the generation of antigenic variants. The Journal of general virology 78 (Pt
10): 2419–2429.
43. Zheng H, Storch GA, Zang C, Peret TC, Park CS, et al. (1999) Genetic
variability in envelope-associated protein genes of closely related group A strains
of respiratory syncytial virus. Virus research 59: 89–99.
44. Trento A, Viegas M, Galiano M, Videla C, Carballal G, et al. (2006) Natural
history of human respiratory syncytial virus inferred from phylogenetic analysis
of the attachment (G) glycoprotein with a 60-nucleotide duplication. Journal of
virology 80: 975–984.
45. Wertz GW, Collins PL, Huang Y, Gruber C, Levine S, et al. (1985) Nucleotide
sequence of the G protein gene of human respiratory syncytial virus reveals an
unusual type of viral membrane protein. Proceedings of the National Academy
of Sciences of the United States of America 82: 4075–4079.
46. Feldman SA, Hendry RM, Beeler JA (1999) Identification of a linear heparin
binding domain for human respiratory syncytial virus attachment glycoprotein
G. Journal of virology 73: 6610–6617.
47. Woelk CH, Holmes EC (2001) Variable immune-driven natural selection in the
attachment (G) glycoprotein of respiratory syncytial virus (RSV). Journal of
molecular evolution 52: 182–192.
48. Botosso VF, Zanotto PM, Ueda M, Arruda E, Gilio AE, et al. (2009) Positive
selection results in frequent reversible amino acid replacements in the G protein
gene of human respiratory syncytial virus. PLoS pathogens 5: e1000254.
49. Melero JA, Garcia-Barreno B, Martinez I, Pringle CR, Cane PA (1997)
Antigenic structure, evolution and immunobiology of human respiratory
syncytial virus attachment (G) protein. The Journal of general virology 78 (Pt
10): 2411–2418.
50. Hall CB, Walsh EE, Long CE, Schnabel KC (1991) Immunity to and frequency
of reinfection with respiratory syncytial virus. The Journal of infectious diseases
163: 693–698.
51. Parveen S, Broor S, Kapoor SK, Fowler K, Sullender WM (2006) Genetic
diversity among respiratory syncytial viruses that have caused repeated infections
in children from rural India. Journal of medical virology 78: 659–665.
52. Bueno SM, Gonzalez PA, Pacheco R, Leiva ED, Cautivo KM, et al. (2008) Host
immunity during RSV pathogenesis. International immunopharmacology 8:
1320–1329.
53. Murawski MR, Bowen GN, Cerny AM, Anderson LJ, Haynes LM, et al. (2009)
Respiratory syncytial virus activates innate immunity through Toll-like receptor
2. Journal of virology 83: 1492–1500.
54. Openshaw PJ, Tregoning JS (2005) Immune responses and disease enhancement
during respiratory syncytial virus infection. Clinical microbiology reviews 18:
541–555.
55. Girard MP, Cherian T, Pervikov Y, Kieny MP (2005) A review of vaccine
research and development: human acute respiratory infections. Vaccine 23:
5708–5724.
56. Page RDM, Holmes E.C. (1998) Molecular Evolution: A Phylogenetic
Approach. Oxford: Blackwell Science.
57. Romano CM, de Melo FL, Corsini MA, Holmes EC, Zanotto PM (2007)
Demographic histories of ERV-K in humans, chimpanzees and rhesus monkeys.
PLoS One 2: e1026.
58. Grenfell BT, Pybus OG, Gog JR, Wood JL, Daly JM, et al. (2004) Unifying the
epidemiological and evolutionary dynamics of pathogens. Science 303: 327–332.
59. Pybus OG, Rambaut A (2009) Evolutionary analysis of the dynamics of viral
infectious disease. Nature reviews Genetics 10: 540–550.
60. Zanotto PM, Gould EA, Gao GF, Harvey PH, Holmes EC (1996) Population
dynamics of flaviviruses revealed by molecular phylogenies. Proceedings of the
National Academy of Sciences of the United States of America 93: 548–553.
61. Campos PF, Willerslev E, Sher A, Orlando L, Axelsson E, et al. (2010) Ancient
DNA analyses exclude humans as the driving force behind late Pleistocene musk
ox (Ovibos moschatus) population dynamics. Proceedings of the National
Academy of Sciences of the United States of America 107: 5675–5680.
62. Mondini A, de Moraes Bronzoni RV, Nunes SH, Chiaravalloti Neto F, Massad
E, et al. (2009) Spatio-temporal tracking and phylodynamics of an urban dengue
3 outbreak in Sao Paulo, Brazil. PLoS neglected tropical diseases 3: e448.
63. Matheson JW, Rich FJ, Cohet C, Grimwood K, Huang QS, et al. (2006) Distinct
patterns of evolution between respiratory syncytial virus subgroups A and B from
New Zealand isolates collected over thirty-seven years. Journal of medical
virology 78: 1354–1364.
64. Ostlund MR, Lindell AT, Stenler S, Riedel HM, Wirgart BZ, et al. (2008)
Molecular epidemiology and genetic variability of respiratory syncytial virus
(RSV) in Stockholm, 2002–2003. Journal of medical virology 80: 159–167.
65. Shobugawa Y, Saito R, Sano Y, Zaraket H, Suzuki Y, et al. (2009) Emerging
genotypes of human respiratory syncytial virus subgroup A among patients in
Japan. Journal of clinical microbiology 47: 2475–2482.
66. Zlateva KT, Vijgen L, Dekeersmaeker N, Naranjo C, Van Ranst M (2007)
Subgroup prevalence and genotype circulation patterns of human respiratory
syncytial virus in Belgium during ten successive epidemic seasons. Journal of
clinical microbiology 45: 3022–3030.
67. Garcia-Barreno B, Portela A, Delgado T, Lopez JA, Melero JA (1990) Frame
shift mutations as a novel mechanism for the generation of neutralization
resistant mutants of human respiratory syncytial virus. The EMBO journal 9:
4181–4187.
68. Cane PA, Pringle CR (1995) Evolution of subgroup A respiratory syncytial virus:
evidence for progressive accumulation of amino acid changes in the attachment
protein. Journal of virology 69: 2918–2925.
HRSV Demographics and Spread
PLOS ONE | www.plosone.org 10 October 2012 | Volume 7 | Issue 10 | e41953
69. Amos W, Harwood J (1998) Factors affecting levels of genetic diversity in natural
populations. Philosophical transactions of the Royal Society of London Series B,
Biological sciences 353: 177–186.
70. Li H, Roossinck MJ (2004) Genetic bottlenecks reduce population variation in
an experimental RNA virus population. Journal of virology 78: 10582–10587.
71. Agrawal AS, Sarkar M, Ghosh S, Chawla-Sarkar M, Chakraborty N, et al.
(2009) Prevalence of respiratory syncytial virus group B genotype BA-IV strains
among children with acute respiratory tract infection in Kolkata, Eastern India.
Journal of clinical virology : the official publication of the Pan American Society
for Clinical Virology 45: 358–361.
72. Trento A, Casas I, Calderon A, Garcia-Garcia ML, Calvo C, et al. (2010) Ten
years of global evolution of the human respiratory syncytial virus BA genotype
with a 60-nucleotide duplication in the G protein gene. Journal of virology 84:
7500–7512.
73. Sole RG, B. (2000) Signs of Life: How Complexity Pervades Biology. New York:
Basic Books.
74. Oliveira DB, Durigon EL, Carvalho AC, Leal AL, Souza TS, et al. (2009)
Epidemiology and genetic variability of human metapneumovirus during a 4-
year-long study in Southeastern Brazil. Journal of medical virology 81: 915–921.
75. Bush RM, Bender CA, Subbarao K, Cox NJ, Fitch WM (1999) Predicting the
evolution of human influenza A. Science 286: 1921–1925.
76. Plotnicky-Gilquin H, Goetsch L, Huss T, Champion T, Beck A, et al. (1999)
Identification of multiple protective epitopes (protectopes) in the central
conserved domain of a prototype human respiratory syncytial virus G protein.
Journal of virology 73: 5637–5645.
77. Gillespie JH (2000) Genetic drift in an infinite population. The pseudohitchhik-
ing model. Genetics 155: 909–919.
78. Meyerson NR, Sawyer SL (2011) Two-stepping through time: mammals and
viruses. Trends in microbiology 19: 286–294.
79. Alonso WJ, Viboud C, Simonsen L, Hirano EW, Daufenbach LZ, et al. (2007)
Seasonality of influenza in Brazil: a traveling wave from the Amazon to the
subtropics. American Journal of Epidemiology 165: 1434–1442.
80. Viboud C, Alonso WJ, Simonsen L (2006) Influenza in tropical regions. PLoS
medicine 3: e89.81. Rambaut A, Pybus OG, Nelson MI, Viboud C, Taubenberger JK, et al. (2008)
The genomic and epidemiological dynamics of human influenza A virus. Nature
453: 615–619.82. White LJ, Waris M, Cane PA, Nokes DJ, Medley GF (2005) The transmission
dynamics of groups A and B human respiratory syncytial virus (hRSV) inEngland & Wales and Finland: seasonality and cross-protection. Epidemiology
and infection 133: 279–289.
83. Gushulak B, Funk M, Steffen R (2007) Global changes related to travelers’health. Journal of travel medicine 14: 205–208.
84. Breugelmans JG, Zucs P, Porten K, Broll S, Niedrig M, et al. (2004) SARStransmission and commercial aircraft. Emerging infectious diseases 10: 1502–
1503.85. Nelson MI, Simonsen L, Viboud C, Miller MA, Holmes EC (2007) Phylogenetic
analysis reveals the global migration of seasonal influenza A viruses. PLoS
pathogens 3: 1220–1228.86. Michalski A, Cheyne CM (2008) New Zealand and the EU: Approaches to
socio-economic change in a globalizing world.; Mayes DG, editor. Lewiston,NY: Edwin Mellen Press.
87. Gaunt ER, Jansen RR, Poovorawan Y, Templeton KE, Toms GL, et al. (2011)
Molecular epidemiology and evolution of human respiratory syncytial virus andhuman metapneumovirus. PLoS One 6: e17427.
88. Zlateva KT, Lemey P, Moes E, Vandamme AM, Van Ranst M (2005) Geneticvariability and molecular evolution of the human respiratory syncytial virus
subgroup B attachment G protein. Journal of virology 79: 9157–9167.89. Taylor CE, Morrow S, Scott M, Young B, Toms GL (1989) Comparative
virulence of respiratory syncytial virus subgroups A and B. Lancet 1: 777–778.
90. White LJ, Mandl JN, Gomes MG, Bodley-Tickell AT, Cane PA, et al. (2007)Understanding the transmission dynamics of respiratory syncytial virus using
multiple time series and nested models. Mathematical biosciences 209: 222–239.91. Drummond AJ, Rambaut A (2007) BEAST: Bayesian evolutionary analysis by
sampling trees. BMC evolutionary biology 7: 214.
HRSV Demographics and Spread
PLOS ONE | www.plosone.org 11 October 2012 | Volume 7 | Issue 10 | e41953