Large Melting-Point Hysteresis of Ge Nanocrystals Embedded in SiO2
57-
Photovoltaic Canopies: Thermodynamics to Achieve a
Sustainable Systems Approach to Mitigate the Urban Heat Island
Hysteresis Lag Effect.
Jay S. Golden, Director
Sustainable Materials and
Renewable Technologies Program
Arizona State University Main Campus
P.O. Box 873211 Tempe, Arizona 85287-3211
Phone / Fax: +1-(480) 965-4951 / (480) 965-8087 Email: [email protected]

57-
Abstract
At a time of greater attention to global climate change and increased costs of
energy, our planet is rapidly urbanizing and transitioning regions from the natural
rural vegetation to man-made urban engineered infrastructure. The anthropogenic-
induced change has manifested itself in microscale and mesoscale increases in
temperatures in comparison to adjacent rural regions which is known as the Urban
Heat Island effect ∆Τu-r (Oke, 1987, Brazel, 2003) and results in the increased need
electricity for mechanical cooling as well as various adverse environmental, social
and economic consequences for local and global communities (Golden, 2004).
Prior research has documented between 29% to 45% of the urban fabric is
comprised of paved surfaces to support mobility (Akbari et al. 1999). The increase of
paved surfaces as a function of thermodynamics alters the urban energy budget due to
changes in albedo, thermal mass as well as conduction, convection and
evapotranspiration. An emerging engineering option to reduce the significant role
that surface pavements play in adding to the urban heat island is to capitalize on the
capturing and shading of incident solar energy by means of utilization of photovoltaic
panels to provide covered parking for this large portion of the urban fabric.
Keywords: Multi-Junction Cells, Solar Energy, Hysteresis Lag, Pavements,
Thermodynamics, Band Gap, Urban Heat Island, Photovoltaics, Sustainable
Development. Total word count: 8,467 with references and figures.

57-
”The total energy of the universe is constant. The total entropy
of the universe strives to reach a maximum”
- Rudolf Clausius -
1. INTRODUCTION
The urban climate is influenced by terrain, anthropogenic heat, urban geometry, and
substantially by the engineered materials which comprise pavements and the built
environment. This research is focused on understanding the dynamics of
photovoltaics can serve as an improved mitigation strategy for the adverse temporal
influences of surface and parking pavements primarily realized in the urban heat
island hysteresis lag effect as compared to the more conventional urban forestry
option. Akbari et al. (1999) detailed that 39% of the area seen from above the urban
canopy (tree canopy) consisted of paved surfaces including roads, parking areas and
sidewalks. Similar evaluations of metropolitan areas of Salt Lake City, Utah,
Sacramento, California and Chicago, Illinois revealed the percentage of paved areas
ranged from 30% to 39% as seen above the canopy and 36% to 45% viewed under the
canopy layer.
Low albedo hot mix asphalt (HMA) surfaces comprise approximately 80% of all
paved surfaces of the urban fabric while concrete higher albedo materials represent
the majority of the remainder of the 20% and are primarily utilized for high volume
road networks. The materials and designs of these two types of paved surfaces vary
as does convective turbulence as a function of vehicle traffic volume and speed. As

57-
such, mitigative strategies and designs need to be developed accordingly to meet these
varied surfaces.
The urban energy budget is represented by Brazel & Quatrocchi (2004) modified from
Oke (1987) in which the energy budget is expressed in a simplified form as:
Q* + QF = QE + QH + ∆Qs + ∆Qa (1)
Where:
Q* = net all-wave radiation
= K* + * (net short and long wave radiation)
QF = anthropogenic heat emission (QFv + QFH +QFM)
QE = latent heat flux
QH = sensible heat flux
∆Qs = net heat storage in the city
∆Qa =net advection into or out of the city.
This research evaluated mitigation for surface pavements to reduce ∆Qs and the
hysteresis lag effect as presented in Figure #1.
<INSERT FIGURE #1>
A research regime was undertaken during the summer months of 2004 to evaluate
two mitigation strategies for the hysteresis lag effect of surface parking pavements in
the Phoenix, Arizona region. The 0.860F/decade warming rate for Phoenix is one of

57-
the highest in the world for a population of its size and can be compared to other cities
to highlight the effects of rapid urbanization in the region. For example, LA’s rate
was 0.80F/decade; SF, 0.20F/decade; Tucson, 0.60F/decade; Baltimore, 0.20F/decade;
Washington, 0.50F/decade; Shanghai, 0.20F/decade; and Tokyo, 0.60F/decade (Hansen
et al. 1999).
The first mitigation strategy examined was the utilization of urban forestry by which
canopy coverage provides shading of paved surfaces. The second mitigation strategy
evaluated was the utilization of engineered canopy covers including the utilization of
photovoltaic solar panels as a possible sustainable engineering mitigation option. The
research was undertaken to:
1. Quantify the diurnal surface and ambient temperature reductions with the
utilization of urban forestry.
2. Quantify the diurnal pavement surface, canopy surface and ambient
temperature reductions with the utilization of engineered parking canopies.
3. Evaluate the role of sky-view factor of urban forestry.
4. Evaluate the temporal impacts of utilizing photovoltaic panels as a mitigation
strategy.
5. Introduce the sustainable systems associated with the development of
photovoltaic canopies as a regional mitigation strategy to mitigate the urban
heat island effect.
2. CONVENTIONAL URBAN FORESTRY
Increasing the amount of urban vegetation decreases local ambient air temperatures
through shading and evapotranspiration. The U.S. Department of Agriculture Forest

57-
Service (1999, 2000) estimates that maximum mid-day air temperature reductions are
in the range of 0.07°F (-0.04°C) to 0.36°F (-0.2°C) for every one percent (+1%)
increase in the canopy cover.
Shading can play an important role in the lower canopy boundary of parking lots by
preventing solar radiation from coming in contact with, and being absorbed by,
engineered materials. Incident solar radiation reaches a tree's canopy, with some
percent utilized by the leaves for photosynthesis and with the remainder either
reflected back into the atmosphere or transmitted to the engineered surface below.
The latter quantity determines the tree's transmittance, which is typically 10% to 30%
in the summertime. A mature 40 foot tree with a crown of 30 feet can decrease air
temperature by transpiring as much as 40 gallons of water per day. Urban forestry
canopy coverage over paved surfaces has been evaluated as a sustainable systems
mitigation strategy for the Urban Heat Island effect by examining temporal,
hydrocarbon and stormwater impacts while potentially increasing pavement longevity
(Akbari et al. 1993; Asaeda et al. 1996; Scott et al. 1999; Xiao et al. 1998; McPherson
et al. 1999). Some municipalities within the United States have adopted parking lot
canopy coverage such as Sacramento, California which requires 50% canopy
coverage of the total parking lot area within 15 years of a projects development
(Sacramento City Ordinance 17.64.030).
To quantify the benefits of an urban forest canopy cover on engineered pavements,
research was undertaken at the Arizona State University Research Park located
approximately six miles to the south of the main campus in Tempe, Arizona. A
typical urban parking lot was chosen at the ASU – US Army Flexible Display Center.

57-
The pavements consisted of dense grade hot mix asphalt. The sampling location was
void of any influence from urban geometry shading beyond that of near by urban
forestry and the research area was made free from any anthropogenic heating sources.
The total research area measured 100m x 100m with a centered 15m x 15m area
monitored with the use of thermocouples. Temperatures were obtained within the hot
mix asphalt parking surface just below grade on 4 sides of a cement low level planter
box containing a South American mesquite (Figure #2), Argentine mesquite (Prosopis
alba).
<INSERT FIGURE #2 HERE>
Ambient temperatures were also obtained on the trunk of the tree at 2m and a
Campbell meteorological station was established adjacent to the research site
measuring solar radiance, wind, rain and diurnal temperatures every 10 minutes.
The tree measured approximately 25 feet in height and had a trunk diameter of 5 feet
and a canopy area of 20 feet diameter. The estimated instantaneous C assimilation
flux values average around 10 umol/m2/s. The growth of this species depends on
water availability and maintenance practices, but can reach height and spreads of 40'
and 50' respectively but an average life span has not been established for Phoenix as
the tree was introduced into the area less than 30 years ago. Variability includes poor
planting location, wind throw, poor nursery stock, soil born pathogens, etc. In situ
(the wilds of South American), the tree lives for hundreds of years. The cost of the
tree in Phoenix for a typical 24” box is under $200 and variable depending on whether
cutting or seed grown, whether it's a named cultivar or not.

57-
2.1 Diurnal Findings
Sensors were arranged in within a four quadrant array (Figure #3) approximately 2m
from the trunk of the tree in each navigational direction (north, south, east and west).
<INSERT FIGURE 3 HERE>
Each thermocouple sensor was covered by the canopy coverage of the tree. A control
thermocouple as placed in the same HMA paving material approximately 30 meters to
the south of the research canopy in an area fully exposed to solar influences (180°
Ψsky). Additionally, the fully exposed sensor was free from any urban geometry or
urban forestry influences.
2.2 Sky View Factor
Sky-view factor (Ψsky) is a dimensionless parameterization of the quantity of visible
sky at a location which is represented between zero and one. Ψsky will approach unity
in a perfectly flat and open terrain, unlike the urban region with various geometries of
the built environment that reduce Ψsky (Chapman et al. 2001; Oke, 1992). In the
urban region, Ψsky and 1- Ψsky give a measure of how much radiation will penetrate the
canopy and how much will be intercepted by the canopy. Ψsky is determined for a
specific point in space, i.e., it gives a measure of the open view to the sky to radiative
transport relative to a specific location with a range of zero to one. Zero means that
the sky is completely obstructed by canopy coverage or other geometry and all
outgoing longwave radiation (L↑) would be intercepted by the obstacles. A rating of

57-
one (1) indicates that the sky view is free of all obstacles and outgoing radiation
would radiate freely to the sky (Brown and Grimmond, 2001). The hysteresis lag
effect is impacted by Ψsky due to the limiting longwave radiation (L↑) by a canopy
trapping effect.
Solar irradiance is impacted by altitude which is the angle up from the horizon. Zero
degrees altitude means exactly on your local horizon, and 90 degrees is "straight up".
Azimuth is the angle along the horizon, with zero degrees corresponding to North,
and increasing in a clockwise fashion. Thus, 90 degrees is East, 180 degrees is South,
and 270 degrees is West. Using these two angles, one can describe the apparent
position of an object (such as the Sun at a given time).
The altitude and azimuth values are for the center of the apparent disk of the Sun. The
altitude values include the effect of standard atmospheric refraction when the object is
above the horizon. The azimuth values are computed with respect to true north (not
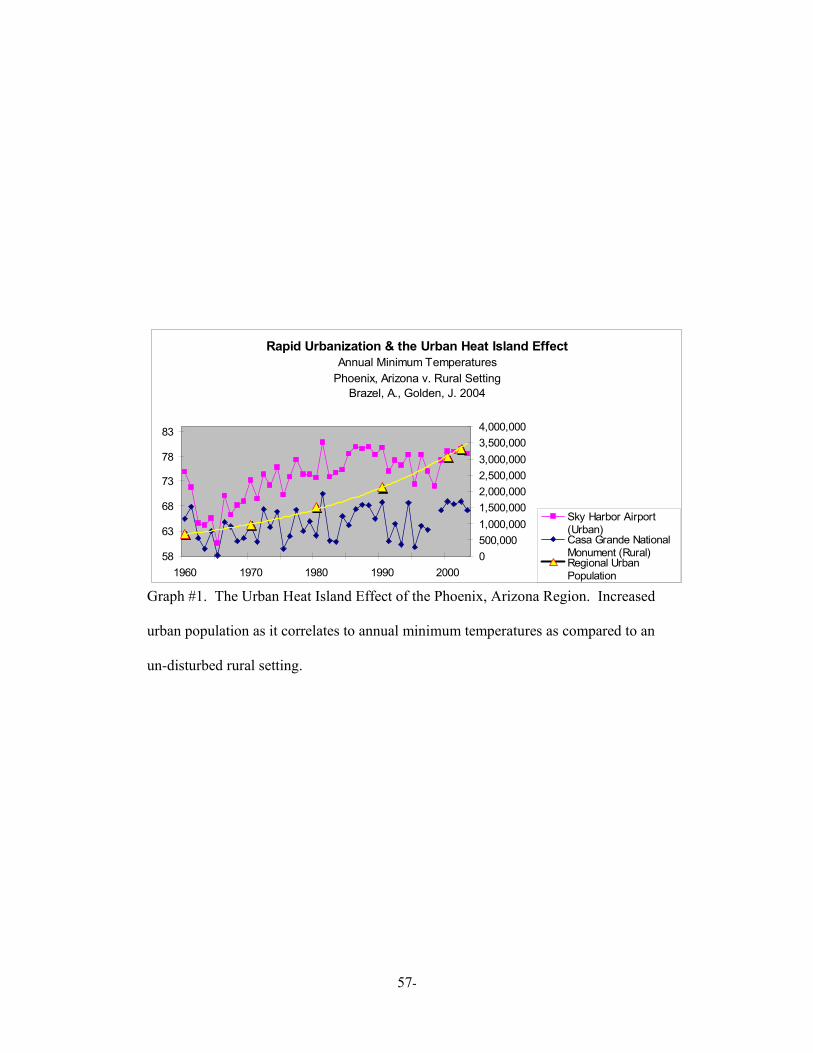
magnetic). Azimuth (vertical angle) determinations around the compass of the vertical
angle from the local flat surface to the tree overhang of the canopy for every 20
degrees of azimuth direction was obtained as was the sun’s azimuth/angle position in
the sky for each hour on the dates of the measurements of surface temperature. As
presented in Figure #4 & #5, the azimuth and altitude angles were estimated from the
flat horizon to edge of tree obstruction document where the sun passed within the tree
canopy perimeter in its path through the sky horizon.
<INSERT FIGURE #4 HERE>
<INSERT FIGURE #5 HERE>
57-
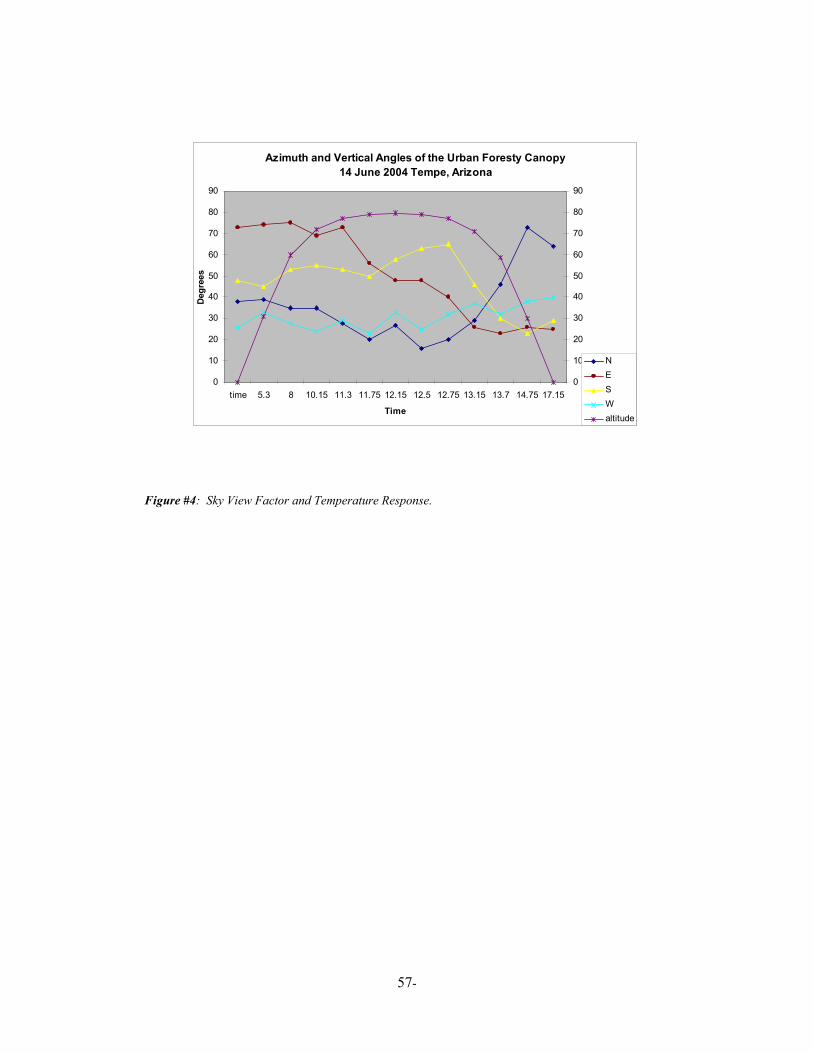
Field evaluations were conducted of the control site for which the diurnal timing
shows up well in the surface temperature responses. Altitude and azimuth combine
with the sky view factor to play a role in the ability of a thermal pocket such as the
pavements being evaluated to be impacted by solar irradiance.
Data from the month of June 2004 was utilized as it is highly representative of the
calm, clear diurnal cycles consistent with the most pronounced month of the urban
heat island effect. The results of the research shows:
1. The fully exposed non-shaded HMA pavement maintained the highest surface
temperature during the complete diurnal cycle with exception of the first cycle
heating which occurs 0800-1200 hours when pavements on the eastern side of
the tree canopy ran consistent with the fully exposed pavement. (note: slight
variations of surface pavements can be attributed to the installation of each
thermocouple and patching of the pavement after installation of the
thermocouples).
2. The eastern, western and southern surface temperatures increased both as a
function of solar radiance and solar altitude during the daytime.
3. Fully exposed surfaces had a higher rate of temperature increase, yet canopy
coverage did not significantly reduce the rate of cooling of pavements under a
tree versus fully exposed surface pavements.
<INSERT FIGURE #6 HERE>

57-
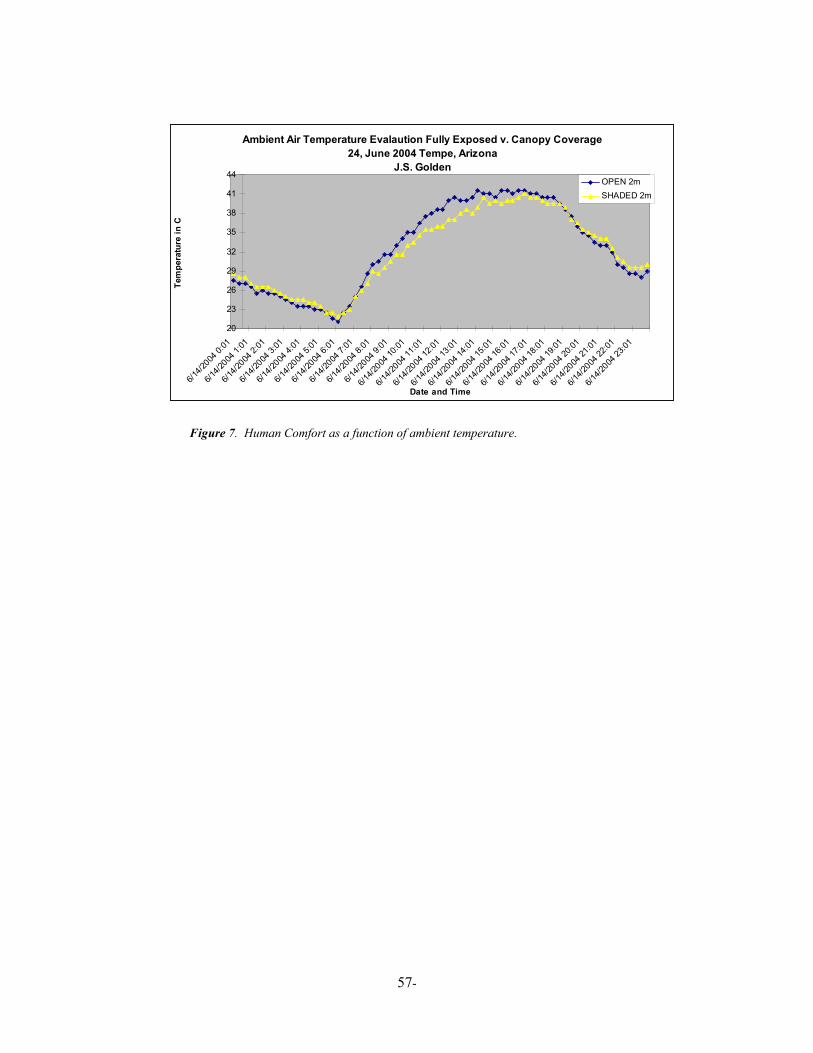
Of consideration in parking areas is the role of human comfort. This was examined
by evaluating ambient air temperatures at 2m height levels. The benefits of the
canopy effect are present during highest solar radiance when the shaded canopy
provided a -3.5° C benefit.
However, unlike pavement surface temperatures which retained a higher diurnal cycle
temperature as a function of the hysteresis lag effect, upon sunset, ambient
temperatures directly under the canopy coverage were higher on average by 1°C than
fully exposed ambient temperatures. This held consistent until surface heating in the
early morning hours (~0830 hours) as presented in Figure #7. The canopy effect of
longwave radiation can help explain the lower cooling rate than a similarly sampled
area with 180°Ψsky.
<INSERT FIGURE #7 HERE>
3. AN ALTERNATIVE SUSTAINABLE ENERGY MITIGATION
STRATEGY
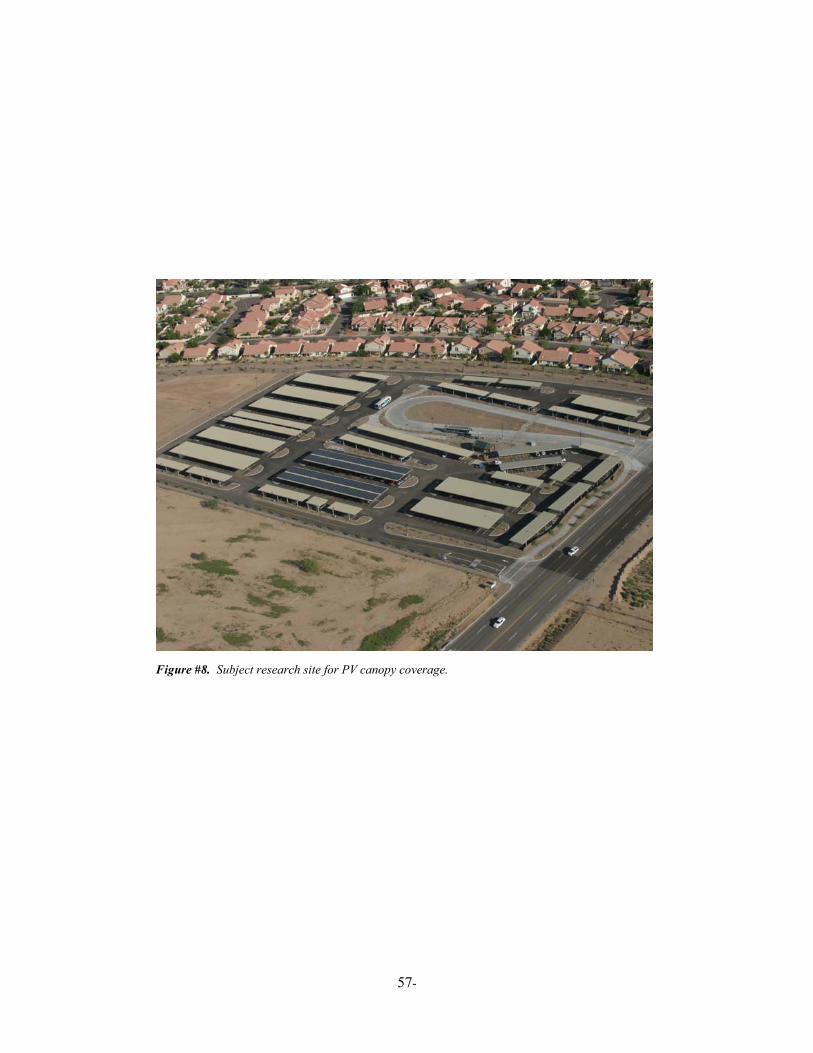
This phase of research was carried out at the City of Phoenix, Arizona-Pecos Road
Park and Ride Facility. The facility is utilized by residents of the Southeastern
portion of the City to park their personal vehicles and utilize public transportation for
areas of central city and throughout the region.
As seen in Figure #8, the facility which opened in 2003 accommodates 562-personal
vehicles with covered canopy parking. The Salt River Project (SRP), a regional
public utility joined with the city of Phoenix Transit Department in a $1 million

57-
project to install solar power panels on covered parking structures on top of two
existing sheet metal parking covers. The system is a fixed tilt flat system containing
768 modules of 165W each on two parking canopies. The array area for the
combined parking system is 11,000 ft2 which provides coverage for ~80 American
sized vehicles.
<INSERT FIGURE #8 HERE>
The main PV power system has a design rating of 127kW dc or 100kW ac which will
produce an annual output of ~ 178,000 kWh, enough to provide power to ~100 homes
annually in the utility service area (SRP, 2003).
3.1 Micro-Climate Variability
During the month of June 2004, research was conducted utilizing hand-held Infrared
Thermography, in-situ thermocouples and the establishment of a stationed
meteorological station. Thermocouple sensors consist of two dissimilar metals, joined
together at one end, which produce a small voltage at given temperatures. This
voltage is measured and interpreted by a thermocouple thermometer. Self contained
sensors that contain a battery, clock, temperature sensor and memory by Command
Center™ which have a sensor accuracy of ±1°C and a range of -10° to 85°C were
used. Each sensor can store 2,048 readings and can be set to sample at adjusted
intervals by easy to use computer software. Each sensor is 1/4” x 3/4” in diameter
with cable length typically of 12’. The sensors were programmed to obtain readings
at twenty minute intervals.
57-
One set of thermocouples was placed imbedded within the HMA pavement surface
fully exposed with 180°Ψsky. Additionally a second thermocouple was attached to a
vertical stake at 2m height above ground surface (ags). A second set of
thermocouples was placed at a “conventional” parking canopy area. This included
placement within the HMA pavement, at 2m ags, directly underneath the canopy top
and one just above the canopy top. A third set of thermocouples was placed at a
modified photovoltaic parking canopy cover.
Similar to the conventional canopy, thermocouples were placed within the HMA
pavement, at 2m ags, directly underneath the canopy top and one placed in the layer
between the conventional canopy top and the bottom of the photovoltaic panels. The
PV panels were approximately 4cm above the conventional panel. No thermocouple
was placed at the top of the PV panels as the readings would present the incident solar
absorption of the thermocouple and not the PV panel. The diurnal evaluations of the
PV panel temperature is most appropriately evaluated at the base of PV panels.
3.2 Surface Temperature Evaluations
Understanding the diurnal temperature variability of the pavement surfaces serves as a
first order indication of the ability to modify the hysteresis lag effect. The
temperature variability for the three locations as represented on 14 June 2004 indicate
that the fully exposed pavement receives and stores the greatest amount of energy
reaching maximum surface temperatures of 65.5°C (149.9°F) while the pavement
surfaces covered by the PV-conventional canopy tandem alignment reached the
lowest maximum surface temperature of 38.5°C (101.3°F).
57-
Ð∆ТExposed= surfaceТMax (65.5°C) - surfaceТMin (28.5°C) = 37°C (2)
Ð∆ТConv. Canopy= surfaceТMax (39.5°C) - surfaceТMin (27.5°C) = 11°C (3)
Ð∆ТPV Modified Canopy= surfaceТMax (38.5°C) - surfaceТMin (28.0°C) = 10.5°C (4)
Where: Ð∆Т = diurnal surface temperature delta
The thermographic evaluations provide a visualization of the surface temperature
variability.
3.3 Canopy Top Variability
The examination of photovoltaics as a mitigation tool for the urban heat island has
seen only limited research to date. Genchi et al. (2003) modeled large scale use of PV
panels in a large area of Tokyo. The research was focused on building roof tops.
They concluded the large-scale impact would be negligible but that energy
consumption for cooling may be reduced by up to 10% by the shading effect. This
research was interested in comparing the surface temperatures of the PV / canopy top
versus the surface temperatures of the exposed pavements and the nocturnal energy
storage and release. The urban heat island in many regions, including the greater
Phoenix, Arizona region is primarily a nocturnal event.
By reducing heat storage (Qs) there is the potential to mitigate the UHI at the micro
and meso scales. Diurnal analysis indicated that the HMA typical parking lot surface
maintained the highest surface temperatures throughout the diurnal cycle. The sheet
metal conventional parking canopy top heated more rapidly than the photovoltaic

57-
panels in pre-noon (1200 hours) where the PV panels then warmed up higher than the
sheet metal canopy. The HMA pavement had the greatest rate of temperature increase
of all three materials.
While post sundown and the influence of solar radiance the Photovoltaic panels had
the fastest rate of temperature decrease. The hysteresis lag of the surface pavements
Qs is evident in the slow rate of cooling (Figure #9).
<INSERT FIGURE #9 HERE>
3.4 Variability Influences
Wind speed during the 24 hour period of 14 June 2004 obtained from the adjacent
meteorological station averaged .86m/s with a high wind speed of 2.65 m/s sustained
for less than 15 minutes around 1415 hours. Solar irradiance initiated at 0515 hours
with the last recorded reading taken at 2000 hours. Maximum ambient air
temperature of 40.98°C (105.76°F).
This particular facility is utilized by commuters who arrive prior to 0700 hours and
leave their vehicle in place until post work (1700-1900 hours). No quantification of
the anthropogenic heat flux was measured as a result of the vehicle engines.
However, the flux is primarily generated during cool early morning hours for
durations of less than one-hour which would be negligible to the diurnal hysteresis lag
effect. The post work heat flux from vehicles is also minimized as vehicles are started
and removed quickly from the parking area. A higher volume parking lot such as

57-
those found in retail establishments would present higher fluxes primarily during peak
shopping hours.
4.0 URBAN FORESTRY v. PHOTOVOLTAIC CANOPY MITIGATION
A comparative analysis was conducted to understand the mitigation dynamics of
paved parking lot surface temperatures with an Urban Forestry canopy cover as
compared to the same surface material covered by a photovoltaic canopy coverage.
The evaluation period was for the diurnal cycle of 14 June 2004. The tree canopy
coverage area
Meteorological and engineered pavement data was utilized for the same date of 14
June 2004. The Arizona State University Research Park (Urban Forestry canopy
coverage) and the City of Phoenix Park and Ride lot (photovoltaic canopy coverage)
are approximately 7.2 miles in distance by road networks. Of interest was comparing
the Ð∆Тsurface achieved by both mitigation strategies. The resultant as presented in
Figure # 10, the HMA surface shaded by a PV canopy achieves a -55.8°F reduction in
comparison to the fully exposed HMA while the HMA surface mitigated by the urban
forestry achieves a maximum reduction of -43.2°F.
The maximum temperature reduction for the urban forestry canopy would have been
even lower if surface temperatures for the eastern shaded pavements were used as this
area had greater rate of heating. In part this variation of surface temperature
reductions between the two mitigation strategies can be explained due to the increased

57-
sky view factor (Ψs) of the urban forestry mitigation strategy during the influence of
solar irradiation. However, both covered HMA surfaces reach equilibrium at near
sunset thus undermining the positive influence of the urban forestry Ψs.
<INSERT FIGURE #10 HERE>
Ambient air temperatures between both covered HMA surfaces in comparison to their
adjacent fully exposed ambient air temperatures, both at 2m ags were obtained for the
same time period.
4.1 Utilizing the Laws of Thermodynamics to Benefit Urban Climate
Unlike a dry paved surface which primarily absorbs, stores and re-radiates solar gains
as long-wave radiation, a photovoltaic solar cell is a thermodynamic engine working
between two heat reservoirs T1 and T2:
The explanation is observed as
T1 - high temperature = the temperature of the Sun = 5762 K and
T2 - low temperature = the temperature of the Earth = 288 K.
Its electric current consists of two parts: the light current, strongly dependent on T1,
and the dark current, strongly dependent both on T2 and on material constants and
technology parameters. (De Vos A., 1992). The rules of thermodynamics state:
The first law of Thermodynamics:
∆U = Q-W (5)

57-
Where: ∆U is the change in internal energy, Q is the heat added to the system and W is
the work done by the system.
The second law of Thermodynamics, entropy. It is not possible for heat to flow from
a colder body to a warmer body without any work having been done to accomplish
this flow. Energy will not flow spontaneously from a low temperature object to a
higher temperature object.
The efficiencies of systems is a key component in energy utilization. This runs
counter to current philosophies of urban heat island mitigation which espouse
utilization of high albedo engineered components to reduce solar gains. However,
one of the primary goals in solar cell manufacturing is to reduce the reflective losses
at specific wavelengths. The monocrystalline and polycrystalline silicon
solar modules represent more than 80% of all the PV production market and they are
highly reliable. In these technologies, the reflective losses are reduced from about
30% to about 6% by using surface coating, called anti-reflective coating, of the solar
cells. By adjusting the thickness and material properties of these coatings and
increasing albedo the light-to-electrical efficiency may be reduced. Thin film
technologies such as amorphous silicon, Cadmium Telluride (CdTe) and Copper
Indium Diselenide (CIS) represent less than 20% of the market. The efficiency of
amorphous silicon is considerably lower (6-8%) than any other PV technologies. The
CIS and CdTe are emerging technologies and are being evaluated and demonstrated
for their reliability. The material and processing properties including band gap dictate
the amount of reflected light. Visually, CdTe has the lowest albedo, CIS next highest
albedo and Si with the highest albeo and a somewhat brown color.

57-
4.2 Solar Radiation Balance – Excess Heat or Energy Generator
The sun emits almost all of its energy in a range of wavelengths from about 2x10⁻⁷ to
4x10⁻⁶ meters. Most of this energy is in the visible light region. Each wavelength
corresponds to a frequency and energy: the shorter the wavelength, the higher the
frequency and the greater the energy, which is expressed in electron-volts, (or eV).
Red light is at the low-energy end of the visible spectrum and violet light is at the
high-energy end, where it has half again as much energy as red light. In the invisible
portions of the spectrum, radiation in the ultraviolet region (UV), which can burn the
skin, has more energy than that in the visible region.
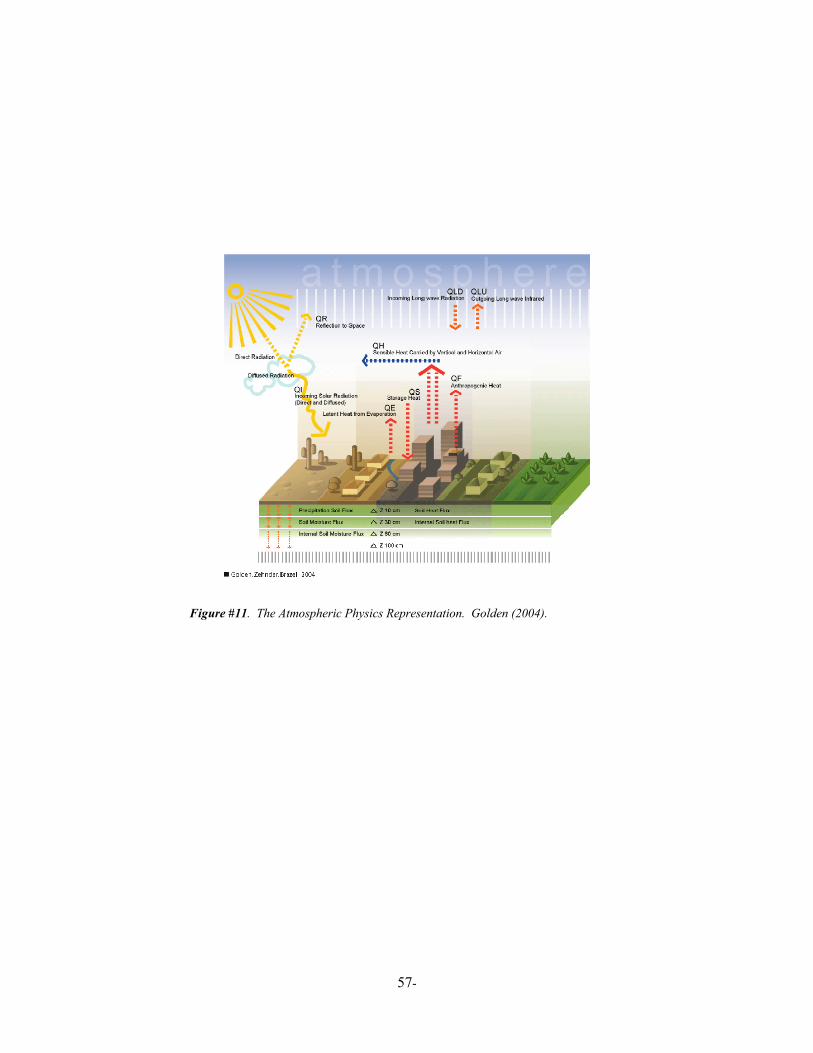
The sun is continually releasing an enormous amount of radiant energy into the solar
system (QI). The Earth receives a tiny fraction of this energy; yet, an average of 1367
watts (W) reaches each square meter (m2) of the outer edge of the Earth's atmosphere.
The atmosphere absorbs and reflects some of this radiation (QR), including most X-
rays and ultraviolet rays. Still, the amount of the sun's energy that reaches the surface
of the Earth every hour is greater than the total amount of energy that the world's
human population uses in a year.
<INSERT FIGURE #11 HERE>
Solar energy loss depends on the thickness of the atmosphere that the sun's energy
must pass through. The radiation that reaches sea level at high noon in a clear sky is
1000 W/m2 and is described as "air mass 1" (or AM1) radiation. As the sun moves
lower in the sky, the light passes through a greater thickness (or longer path) of air,

57-
losing more energy. Because the sun is overhead for only a short time, the air mass is
normally greater than one—that is, the available energy is less than 1000 W/m2.
The standard spectrum outside the Earth's atmosphere is called AM0, with no light
passing through the atmosphere. AM0 is typically used to predict the expected
performance of PV cells in space. The intensity of AM1.5D radiation is approximated
by reducing the AM0 spectrum by 28%, where 18% is absorbed and 10% is scattered.
The global spectrum is 10% greater than the direct spectrum. These calculations give
about 970 W/m2 for AM1.5G. However, the standard AM1.5G spectrum is
"normalized" to give 1000 W/m2, because of inherent variations in incident solar
radiation. Flat panel collectors can utilize both diffuse and direct light while solar
concentrating units can only utilize direct light.
AM1.5G (where G stands for "global" and includes both direct and diffuse radiation)
or AM1.5D (which includes direct radiation only). The number "1.5" indicates that
the length of the path of light through the atmosphere is 1.5 times that of the shorter
path when the sun is directly overhead.
<INSERT FIGURE 12 HERE>
Solar cells respond differently to the different wavelengths, or colors, of light (Figure
#12). For example, crystalline silicon can use the entire visible spectrum, plus some
part of the infrared spectrum. But energy in part of the infrared spectrum, as well as
longer-wavelength radiation, is too low to produce current flow (Figure #13). Higher-
energy radiation can produce current flow, but much of this energy is likewise not

57-
usable. In summary, light that is too high or low in energy is not usable by a cell to
produce electricity as it simply transforms into heat.
<INSERT FIGURE 13 HERE>
5.0 BANDGAP OF ENERGIES
The first silicon solar cells developed in the 1950s by researchers at Bell Laboratories
were not highly efficient but provided enough power to support electric appliances.
At first, the devices were used primarily by toy manufacturers to make solar-powered
miniature ships, radios, and other playthings.
Efficiency has been one of the reasons for the lack of greater utilization of
photovoltaics as a primary energy generation source. Efficiency is closely tied to the
engineered bandgap designs and capabilities. Bandgap energy is the amount of
energy required to dislodge an electron from its covalent bond and allow it to become
part of an electrical circuit. Vital to obtaining an efficient PV cell is to convert as
much sunlight as possible into electricity. Therefore, to free an electron, the energy of
a photon must be at least as great as the bandgap energy. However, photons with more
energy than the bandgap energy will expend that extra amount as heat when freeing
electrons. So, it's important for a PV cell to be "tuned"—through slight modifications
to the silicon's molecular structure-to optimize the photon energy. Charge cannot
flow in either a completely full or a completely empty band, but doping a
semiconductor provides extra electrons or positively charged "holes" that can carry a
current. Photons with just the right energy-the color of light that matches the bandgap-
create electron-hole pairs and let current flow across the junction between positively

57-
and negatively doped layers. Photons with too much energy are absorbed, but since
each creates just one electron-hole pair, the excess energy is wasted as heat.
Crystalline silicon has a bandgap energy of 1.1 electron-volts (eV). (An electron-volt
is equal to the energy gained by an electron when it passes through a potential of 1
volt in a vacuum.) The bandgap energies of other effective PV semiconductors range
from 1.0 to 1.6 eV. In this range, electrons can be freed without creating extra heat.
The photon energy of light varies according to the different wavelengths of the light.
The entire spectrum of sunlight, from infrared to ultraviolet, covers a range of about
0.5 eV to about 2.9 eV. For example, red light has energy of about 1.7 eV, and blue
light has an energy of about 2.7 eV.
Traditionally, most PV cells cannot use about 55% of the energy of sunlight, because
this energy is either below the bandgap of the material or carries excess energy.
Different PV materials have different energy band gaps. Photons with energy equal to
the band gap energy are absorbed to create free electrons. Photons with less energy
than the band gap energy pass through the material.
The photoelectric effect is the basic physical process by which a PV cell converts
sunlight into electricity. When light shines on a PV cell, it may be reflected, absorbed,
or pass right through. But only the absorbed light generates electricity as electrons
escape from their normal positions and become part of the electrical flow (current) in
an electrical circuit. The built in electrical field of the PV cell provides the voltage to
drive the current. This is accomplished by placing an "n-type" semiconductor with an
abundance of electrons, which have a negative electrical charge with a different layer

57-
of "p-type" semiconductor with an abundance of "holes," which have a positive
electrical charge. Sandwiching these together creates a p/n junction at their interface,
thereby creating an electric field. When n- and p-type silicon come into contact,
excess electrons move from the n-type side to the p-type side. The result is a buildup
of positive charge along the n-type side of the interface and a buildup of negative
charge along the p-type side. The electrical field causes the electrons to move from
the semiconductor toward the negative surface, where they become available to the
electrical circuit. At the same time, the holes move in the opposite direction, toward
the positive surface, where they await incoming electrons.
As an example using a Cadmium Telluride (CdTe) photovoltaic system, low energy
light (infrared <1.44 eV) is not useful for generating electricity but it can create heat
which will impact efficiency. An ideal photovoltaic cell in use for urban heat island
mitigation would be designed to either maximize all available solar energy or reflect
unused spectrums to allow for PV modules to be cooler and operate at a higher
efficiency while promoting a reduced urban heat island effect. Solar incidence of
exactly the bandgap (1.44 eV for CdTe) when absorbed by CdTe creates an electron-
hole pair that can be used to produce useful electricity. Higher energy light such as
UV to visible >1.44 eV generates electron-holes pairs but also generates heat. Thus,
roughly one third of the available solar radiation is too low of energy, one third is
converted to excess heat and one third can in principle be converted to electricity. As
not all of the photogenerated electrons can be collected and as collected electrons do

57-
not have all of their initial voltage, theoretical conversion efficiencies are less than
33%, e.g for CdTe the number is 28%.1
Thus the ideal module would absorb all radiation above the bandgap (energy > 1.44
eV) or about 2/3rd of the sun’s power and it would be visually black. Ideally the
module would also be an efficient IR reflector on the sunny side and an efficient IR
radiator on the back side (in order to keep the module cool). Additional cooling
benefits can be realized through convection (e.g. wind) and conduction.
5.1 Multijunction Cells – More Effective UHI Mitigation
A designed stop-gap method to maximize available energy is to use multiple different
cells, with more than one band gap and more than one junction, to generate a voltage
– Multijunction cells (also called "cascade" or "tandem" cells). Multijunction devices
can achieve a higher total conversion efficiency because they can convert more of the
energy spectrum of light to electricity. Researchers and engineers have developed
multijunction cells which are stacked as individual single-junction cells in descending
order of band gap.. The top cell captures the high-energy photons and passes the rest
of the photons on to be absorbed by lower-band-gap cells. The most abundant
volume of work has been in regards to gallium arsenide as one (or all) of the
component cells. Such cells have reached efficiencies of around 35% under
concentrated sunlight which is what would be required on a parking canopy design.
Other materials studied for multijunction devices have been amorphous silicon and
copper indium diselenide.
1 Developed from conversations with Dr. Govindasamy Tamizhmani of the Photovoltaic Testing Laboratory and with Dr. Peter Meyers, Chief Scientists for First Solar Inc.

57-
This stacking of materials of dissimilar band gaps makes it possible to broaden the
range of wavelengths absorbed by a semiconductor and boost the efficiency of a solar
cell above 35%. However, many times compounds of dissimilar materials, for
example, Si (1.1-eV band gap) and AlGaAs (1.7 eV), often resist being stacked
because of differences in their lattice parameters.
However, recent research by Yu et al. (2003) had identified that Indium nitride (InN)
has a very low band gap--around 0.7 eV which had been thought to be 2 eV. Indium
nitride can be alloyed relatively easily with GaN (3.4-eV band gap), and alloys of
various compositions of indium, gallium, and nitrogen can be stacked readily to form
multilayer (multijunction) materials thus engineers can develop new cells to cover the
entire spectrum (Jacoby, 2004) a more efficient means to convert solar irradiance that
theoretically can achieve power conversion efficiencies surpassing 50% (Yu et al.
2003) rather than relying of partial solar reflection or non-used thermal storage
(hysteresis lag). To date, the most efficient cells are two-junction cells with about 30
percent efficiency.
Researchers at Lawrence Berkeley National Laboratories are investigating the
potential for a multi-gap material which would be a single semiconductor with
multiple band gaps. Indium gallium nitride solar cells could be made with more than
two layers, perhaps a great many layers with only small differences in their bandgaps,
for solar cells approaching the maximum theoretical efficiencies of better than 70
percent. It remains to be seen if a p-type version of indium gallium nitride suitable
for solar cells can be made as parameters remain to be settled, like how far charge
carriers can travel in the material before being reabsorbed.

57-
6.0 SUSTAINABLE SYSTEM CONSIDERATIONS
6.1 Viability of Urban Forestry in Semi-Tropical Arid Regions
Urban forestry has been examined as a means to reduce the hysteresis lag and has
been shown to be effective. However, the mitigation proposal requires an
understanding of inter-related influences. One such influence is the urban climate
itself. As presented in Figure 14, Baker et al. (2004) examined the changing
dynamics of days cold stress vs. days heat stress from 1945 to 2003. Cold stress days
as indicated by the white diamond have significantly reduced while heat stress days
(those above 40°C) have increased. The broad and narrow leaf woody trees and
shrubs used are generally grouped under the category of urban forestry in the Phoenix
region. According to Baker et al. (2004) these species when exposed to supraoptimal,
sublethal temperatures above 40C experience the most negative impact on
photosynthesis (Farrar and Williams, 1991). Supraoptimal temperatures inhibit
photosynthesis by decreasing the efficiency of photosynthetic enzymes (Huxman et
al., 1998; Rokka et al., 2000; Crafts-Brandner and Salvucci, 2000) and increasing
photorespiration (Law and Crafts-Brandner, 1999; Jordon and Orgen, 1984).
Supraoptimal temperatures also increase growth and maintenance respiratory costs
(Van Iersel and Linstrom, 1999), lower water-use efficiency (Martin et al., 1995), and
the lower ET cooling potential of urban vegetation by stomatal inhibition of leaf
transpirational water loss (Martin and Stabler, 2002). Because many of the

57-
horticulture utilized in the region has been recently introduced, similar to the
population, these plants are not adapted to the regional climatics and the stress of the
increased heating days reduces evapotranspiration (Baker et al. 2004).
Celestian and Martin (2003) studied effects of parking lot location on size and
physiology of four regionally common landscape tree species in the Phoenix region
over a two year period. Parking lot trees must contend with a number of micro-
environmental stresses that might adversely affect their growth. In addition to
restricted rooting volumes and limited access to water and nutrients, some parking lot
trees are exposed to elevated rhizosphere and canopy air temperatures caused by
intense sunlight and the absorptive and reradiant properties of asphalt and concrete
surface covers (Kjelgren and Montague, 1998). Continuous exposure of trees,
especially those within parking lot landscaped medians, to these conditions might
adversely impact tree performance by either direct injury of tissues or by indirect
inhibition of physiological processes like nitrogen and carbon assimilation. In their
study, Celestian and Martin (2003) examined four common tree species; (1)
Brachychiton populneus, (bottle tree), (2) Fraxinus velutina Torr. (Arizona ash), (3)
Prosopis alba Griebach (South American mesquite), and (3) Ulmus parvifolia Jacq.
(Chinese elm). Bottle trees were located at two parking lots, Arizona ash at three
parking lots, South American mesquite at three parking lots, and Chinese elm at four
parking lots. At each parking lot, the researchers collected samples of rhizosphere
soil [15 to 30 cm (6 to 12 in) depth] from under the canopy drip line at both the
median and perimeter locations for analysis of soil chemical properties. Their
research revealed trees located within the landscaped medians were smaller than those

57-
within the landscaped areas along the parking lot perimeter, though the extent and
significance of this difference was species specific. The findings also supported prior
research that showed that elevated root zone temperatures similar to those that can
occur in soil in the vicinity of parking lot landscaped medians can inhibit leaf
photosynthesis and conductance of trees (Martin et al., 1995; Celestian and Martin,
2003). Additionally as presented in Figure # 14, the Urban Heat Island effect as
represented in the Phoenix, Arizona region has caused an increase in the re-occurring
heat stress days which can reduce the potential effectiveness of an urban forestry
mitigation strategy.
<INSERT FIGURE #14 HERE>
6.2 Water Resources – The Sustainable Energy Equation
Because of the increased stress, plant viability will require an additional consumption
rate of municipal water to initiate and maintain a meso-sclae urban forestry mitigation
strategy.
In the United States, thermoelectric power generation withdrawals more water than
any other form of water usage (Figure #15) including agricultural irrigation or
municipal water consumption. Water use in the United States (USGS, 2004). As
measured by freshwater withdrawals in 1985, averaged 15 million m3/s
(338 billion gal/day) (Carr et al. 1990). Four million m3/s (ninety-two billion gal/day),
or 27 percent of the water withdrawn, was consumed (e.g., by evaporation) and thus
was not directly returned to the body of water.

57-
<INSERT FIGURE # 15 HERE>
The primary use of water at power plants is for condensing steam, i.e., cooling steam
back to water. Water is also used to make up the high-pressure steam for rotating
turbines to generate electricity (Energy Foundation, 2003).
Water balance as a function of energy production has been estimated from 2.54 litres
(0.67 gallons) of water per kWh produced via a coal-fired power plant while a
natural-gas fired combined cycle power plant consumes 1.25 litres (0.33 gallons) of
waters per kWh produced (SWEEP 2002). The National Energy Technology
Laboratory operated by the United States Department of Energy estimates up to
94.64 litres (25 gallons) of water is required to produce 1kWh of electricity from a
coal plant (NETL, 2004).
A 1996 Industrial Water Survey and report (Sharff et al. 2002) gathered information
on the volume of water use, end uses, water treatment and cost of water in Canada for
industrial users. The survey was done under the federal Statistics Act under an
agreement between Statistics Canada and Environment Canada. The survey was
mailed out to about 6,100 industrial establishments from four sectors: manufacturing,
mineral extraction, thermal power, and hydro power. Their findings indicated that
production of one kilowatt-hour of electricity requires 140 litres (36.99 gallons) of
water for fossil fuel plants and 205 litres (54.16 gallons) for nuclear power plants.
Some of the water is converted to the steam which drives the generator producing the
electricity. Most of the water, however, is used for condenser cooling.

57-
The utilization of Photovoltaics however, as a renewable energy resource, requires
less than one gallon of water per kWh for both withdrawal and consumption (Energy
Foundation, 2003). Water usage is primarily incidental for the cleaning of the panels.
In regions such as the western United States experiencing a multi-year drought, water
rights and water resource management have gained significant importance and
attention by local and regional regulatory authorities.

57-

57-
7.0 DISCUSSION
This study was undertaken to evaluate sustainable mechanisms to mitigate the urban
heat island hysteresis lag effect of surface pavements. The findings identified
opportunities to utilize renewable energy sources to potentially mitigate urban heat
island pockets (micro-scale) which can be expanded in a meso-scale model such as
MM5 to evaluate at what scale of implementation the mitigation can serve to reduce
the meso-scale urban heat island effect within a region. The research area of Phoenix,
Arizona is experiencing its 7th straight year of drought conditions in an already arid
region. Conventional urban forestry campaigns to mitigate the hysteresis lag effect
will most certainly have an initial net increase in water use consumption within a
region as plants try to establish and over come elevated rhizosphere temperatures.
Conversely, the utilization of photovoltaics as a mitigation strategy can result in a
reduction of water usage by minimizing the need for water intensive thermoelectric
power generation sources to meet base energy needs as well as having the
compounded benefit of potentially reducing mechanical cooling needs by reducing the
hysteresis lag effect. Photovoltaics provide for an alternative source to meet the
increasing peak energy demand in the Phoenix region and unlike urban forestry, the
PV canopy coverage reaches maximum micro-scale attainment upon construction.
Further researcher is being undertaken to quantify the life cycle benefits of this
renewable energy mitigation scheme by quantifying a regional energy and water
balance and added opportunities that coupled techniques such as a combination of
permeable pavement materials and renewable technologies (Figure #16) can provide
for regions to meet the challenges of sustainability.
57-
Increased reductions of engineered canopy temperatures will be modeled by
computational fluid dynamics to identify optimal spacing between the upper layer of
the metal canopy to the bottom of the photovoltaic panels. As bandgap technologies
improve it will not only provide for a more beneficial cost-benefit based on upon solar
cell efficiencies but can improve the thermodynamic balances as they relate to the
urban heat island effect.

57-
REFERENCES
Akbari, H., Betz, S.E., Hanford, J.W., Kurn, D.M., Fishman, B.L., Taha, H.A. and
Bos, W. (1993) Monitoring Peak Power and Cooling Energy Savings of Shade Trees
and White Surfaces in the Sacramento Municipal Utility District (SMUD) Service
Area: Data Analysis, Simulations, and Results. Lawrence Berkeley Laboratory Report
34411, pp. 146.
Akbari, H., Rose, L. & Taha H. (1999). Characterizing the Fabric of the Urban
Environment: A case study of Sacramento, California. Lawrence Berkeley National
Laboratory, US Department of Energy. LBNL-44688.
Asaeda, T. Ca VT. & A. Wake. (1996). Heat storage of pavement and its effect on
the lower atmosphere. Atmospheric Environment 30: 413-427
Baker, Lawrence, A., Brazel, A.T., Westerfhoff, P. (2004). Environmental
consequences of rapid urbanization in warm, arid lands: case study of Phoenix,
Arizona (USA). Sustainable Cities 2004 – Sienna, Italy.
Brazel, A. & Quatrocchi, D. (2004). Urban Climatology. The Encyclopedia of World
Climates. John E. Oliver (ed). Kluwer Academic Publishers.
Brazel, A. (2003). Future climate in central Arizona: Heat and the role of
urbanization (Research Vignette No. 2). Tempe, AZ: Consortium for the Study of
Rapidly Urbanizing Regions – Arizona State University.
Brown, M. J., and Grimmond, S. (2001). Sky View Factor Measurements in
Downtown Salt Lake City-Data Report for the Urban DOE CBNP Urban Experiment.
Los Alamos National Laboratory. LA-UR-01-1424
Carr, J.E., Chase, E.B., Paulson, R.W., and Moody, D.W., (1990). National water
summary 1987--hydrologic events and water supply and use: U.S. Geological Survey
Water-Supply Paper 2350, p. 467-474.

57-
Celestian, S. & C. Martin. (2003). Leaf physiology of four landscape trees in response
to commercial parking lot location. Central Arizona Phoenix – Long Term Ecological
Research. NSF.
Chapman, L, Thornes JE and Bradley, AV (2001) Rapid determination of canyon
geometry parameters for use in surface radiation budgets, Theor. & App. Met., 69, 81-
89
Crafts-Brandner, S.J. and Salvucci, M.E. (2000) Rubisco activase constrains the
photosynthetic potential of leaves at high temperature and CO2. Proc. National
Academy of Sciences, USA 97, 13430–13435.
DeVoss, A (1992). Endoreversible thermodynamics of solar energy conversion.
Oxford University Press. ISBN 0 - 19 - 851392 - 5
Energy Foundation (2003). The Last Straw-Water Use by Power Plants in the Arid
West. In Association with the Hewlett Foundation a joint initiative of The John D.
and Catherine T. MacArthur Foundation, The McKnight Foundation, The Joyce
Mertz-Gilmore Foundation, The David and Lucile Packard Foundation and the Pew
Charitable Trusts.
Farrar, J.F. and Williams, M.L. (1991). The effects of increased atmospheric carbon
dioxide and temperature on carbon partitioning, source-sink relations and respiration.
Plant Cell and Environment 14, 819–830.
Genchi, Y., Ishisaki, M., Ohashi, Y., Takahashi, H. and A. Inaba (2003). Impacts of
Large-Scale Photovoltaic Panel Installation on the Heat Island Effect in Tokyo. Fifth
Conference on the Urban Climate
Golden, J. S. (2004). The Built Environment Induced Urban Heat Island Effect in
Rapidly Urbanizing Arid Regions – A Sustainable Urban Engineering Complexity.
Environmental Sciences – In Print.

57-
Hansen, J.W., Hodges, A. W., & Jones, J.W., (1999). ENSO influences on agriculture
in the southeastern US. J. Climate, 11, 404-411.
Huxman, T.E., Hamerlynck, E.P., Loik, M.E. and Smith, S.D. (1998) Gas exchange
and chlorophyll fluorescence responses of three south-western Yucca species to
elevated CO2 and high temperature. Plant Cell and Environment 21, 1275–1283.
Jacoby, M. (2004). Photovoltaic Cells: Power at a Price. Chemical and Engineering
News. June 21, 2004. Volume 82, Number 25 pp. 29-32 ISSN 0009-2347
Jordon, D.B. and Orgen,W.L. (1984) TheCO2/O2 specificity of ribulose 1,5-
bisphosphate carboxylase/oxygenase. Planta 161, 308–313.
Kjelgren R. & T. Montague. (1998). Urban tree transpiration over turf and asphalt
surfaces. Atmospheric Environment 32: 35-41
Law, R.D. and Crafts-Brandner, S.J. (1999) Inhibition and acclimation of
photosynthesis to heat stress is closely correlated with activation of ribulose-1,5-
bisphosphate carboxylase/oxygenase. Plant Physiology 120, 173–181.
Martin, C.A. and Stabler, L.B. (2002) Plant gas exchange and water status in urban
desert landscapes. Journal of Arid Environments, 51, 235–254.
Martin, C.A., Stutz, J.C., Kimball, B.A., Idso, S.B. and Akey, D.H. (1995) Growth
and topological changes of Citrus limon (L.) Burm. f. ‘Eureka’ in response to high
temperatures and elevated atmospheric carbon dioxide.
McPherson, E.Gl, Simpson, J.R., Peper, P. & Xiao, Q. (1999). Benefit-Cost Analysis
of Modesto’s Municipal Urban Forest. Journal of Arboriculture, 25(5):235-248.
National Energy Technology Laboratory – U.S. Department of Energy (2004). Water
and Energy: Addressing the Critical Link Between The Nation’s Water Resources
and Reliable and Secure Energy.

57-
Oke, T.R., (1987). Boundary layer climates (2nd ed.). London: Routledge.
Oke, T.R., (1992). Boundary layer climates (2nd ed.). London: Routledge
Rokka, A., Aro, E.M., Herrmann, R.G., Andersson, B. and Vener, A.V. (2000)
Dephosphorylation of photosystem II reaction center proteins in plant photosynthetic
membranes as an immediate response to abrupt elevation oftemperature. Plant
Physiology 123, 1525–1535.
Salt River Project (2003). http://www.srpnet.com/environment/solarparking.asp
Scharf, D., Burke, D., Villeneuve, M., Leigh, L. (2002). Industrial Water Use 1996.
Environmental Economics Branch, Environment Canada. Minister of Public Works
and Government Services Canada. Catalogue No. En40-669/2002E
ISBN 0-662-32682-2
Scott, K.I., Simpson, J.R., and E.G. McPherson. 1999. Effects of tree cover on
parking lot microclimate and vehicle emissions. Journal of Arboriculture 25(3): 129-
142. Online at http://wcufre.ucdavis.edu/effects_of_tree_cover_on_parking.htm
Southwest Energy Efficiency Project - SWEEP (2002). The New Mother Lode. The
Potential for More Efficient Electricity Use in the Southwest. Energy Foundation. In
Association with the Hewlett Foundation a joint initiative of The John D. and
Catherine T. MacArthur Foundation, The McKnight Foundation, The Joyce Mertz-
Gilmore Foundation, The David and Lucile Packard Foundation and the Pew
Charitable Trusts.
U.S. Department of Agriculture, National Agricultural Statistics Service, 1999,
Ranking of States and Counties: 1997 Census of Agriculture, vol. 2, subject series p.

57-
2, 110 p., accessed December 18, 2003, at
http://www.nass.usda.gov/census/census97/rankings/rankings.htm
U.S. Department of Agriculture, National Agricultural Statistics Service, 2000,
Drought and Fire Survey 2000, Montana's 2000 Drought/Fire Survey Results: press
release, accessed June 25, 2003, at
http://www.nass.usda.gov/mt/pressrls/misc/firesurv.htm
USGS (2004). Estimated Use of Water in the United States in 2000. Contributors
Hutson, S., Barber, N., Kenny, J., Linsey, K., Lumia, D., and Molly A. Maupin.
USGS Circular 1268, 15 figures, 14 tables (released March 2004, revised April 2004,
May 2004)
Van Iersel, M.W. and Linstrom, O.M. (1999) Temperature response of whole plant
CO2 exchange rates of three magnolia cultivars. J. American Society for Horticultural
Science 124, 277–282.
Xiao X, Melillo JM, Kicklighter DW, McGuire AD, Prinn RG, Wang C, Stone PH,
Sokolov A (1998) Transient climate change and net ecosystem production of the
terrestrial biosphere. Global Biogeochemical Cycles 12, 345-360.
Yu, K.M., Walukiewicz, W., Wu, J., Shan,W., Beeman, J., Scarpulla, M., Dubon, O.
and Becla, P. (2003). Dilluted II-VI Oxide Semiconductors with Multiple Band Gaps.
American Physical Society. Volume 91, Number 24.
57-
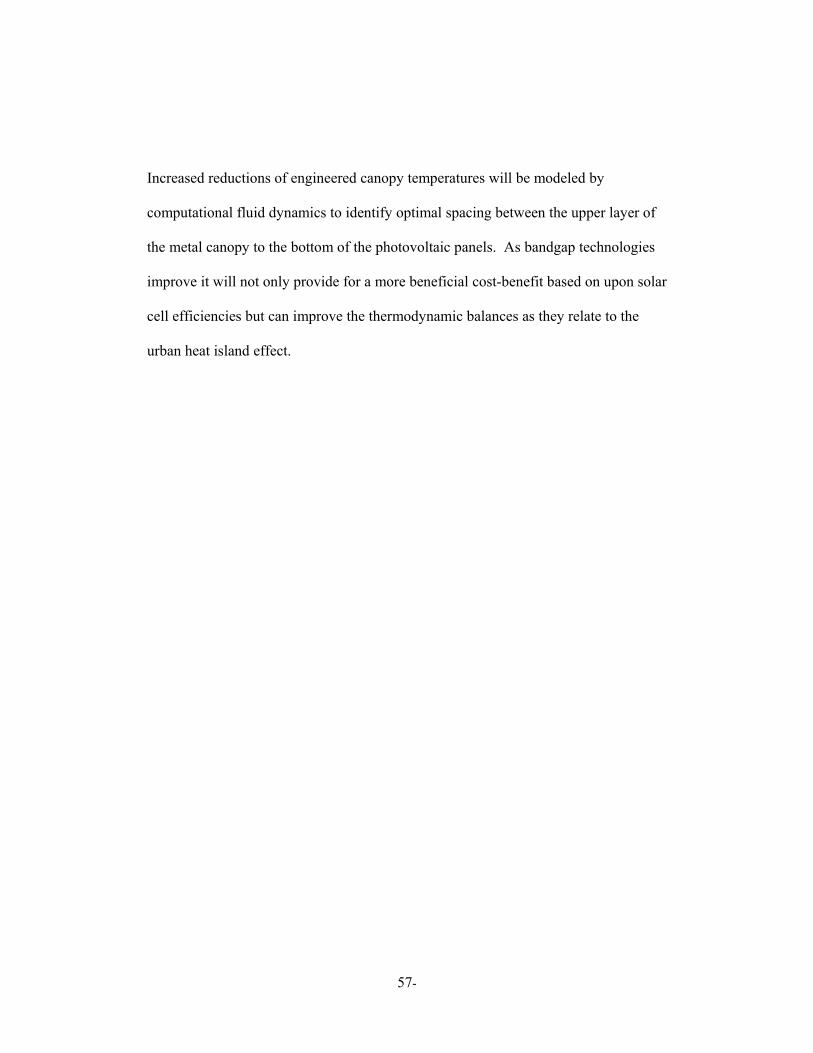
Graph #1. The Urban Heat Island Effect of the Phoenix, Arizona Region. Increased
urban population as it correlates to annual minimum temperatures as compared to an
un-disturbed rural setting.
Rapid Urbanization & the Urban Heat Island EffectAnnual Minimum Temperatures
Phoenix, Arizona v. Rural SettingBrazel, A., Golden, J. 2004
58
63
68
73
78
83
1960 1970 1980 1990 20000500,0001,000,0001,500,0002,000,0002,500,0003,000,0003,500,0004,000,000
Sky Harbor Airport(Urban) Casa Grande NationalMonument (Rural)Regional UrbanPopulation
(

57-
Figure #1. A representation of the urban heat island induced surface pavement hysteresis lag effect.

57-

57-
Figure 2. Controlled parking lot utilized for research of urban forestry mitigation.

57-
N↑
Figure 3. Urban forestry sampling plan. = thermocouples. Shading = canopy coverage * not to scale.
57-
Figure #4: Sky View Factor and Temperature Response.
Azimuth and Vertical Angles of the Urban Foresty Canopy 14 June 2004 Tempe, Arizona
0
10
20
30
40
50
60
70
80
90
time 5.3 8 10.15 11.3 11.75 12.15 12.5 12.75 13.15 13.7 14.75 17.15
Time
Deg
rees
0
10
20
30
40
50
60
70
80
90
NESWaltitude

57-
Figure #5. Sky-view factor as documented with fish-eye lens.
57-
Diurnal Pavement Surface Temperatures via Urban Forest Canopy Coverage Tempe, Arizona - 14 June 2004
J.S. Golden
24
29
34
39
44
49
54
59
64
6/14/2
004 0:
01
6/14/2
004 1:
01
6/14/2
004 2:
01
6/14/2
004 3:
01
6/14/2
004 4:
01
6/14/2
004 5:
01
6/14/2
004 6:
01
6/14/2
004 7:
01
6/14/2
004 8:
01
6/14/2
004 9:
01
6/14/2
004 10
:01
6/14/2
004 11
:01
6/14/2
004 12
:01
6/14/2
004 13
:01
6/14/2
004 14
:01
6/14/2
004 15
:01
6/14/2
004 16
:01
6/14/2
004 17
:01
6/14/2
004 18
:01
6/14/2
004 19
:01
6/14/2
004 20
:01
6/14/2
004 21
:01
6/14/2
004 22
:01
6/14/2
004 23
:01
Tem
pera
ture
in C
Fully ExposedPaved Surface
SHADED NORTHSURFACE
SHADED SOUTHSURFACE
SHADED W ESTSURFACE
SHADED EASTSURFACE
Figure #6. Reaction of surface pavement temperatures as a function of sky view factor.
57-
Ambient Air Temperature Evalaution Fully Exposed v. Canopy Coverage 24, June 2004 Tempe, Arizona
J.S. Golden
20
23
26
29
32
35
38
41
44
6/14/2
004 0:
01
6/14/2
004 1:
01
6/14/2
004 2:
01
6/14/2
004 3:
01
6/14/2
004 4:
01
6/14/2
004 5:
01
6/14/2
004 6:
01
6/14/2
004 7:
01
6/14/2
004 8:
01
6/14/2
004 9:
01
6/14/2
004 10
:01
6/14/2
004 11
:01
6/14/2
004 12
:01
6/14/2
004 13
:01
6/14/2
004 14
:01
6/14/2
004 15
:01
6/14/2
004 16
:01
6/14/2
004 17
:01
6/14/2
004 18
:01
6/14/2
004 19
:01
6/14/2
004 20
:01
6/14/2
004 21
:01
6/14/2
004 22
:01
6/14/2
004 23
:01
Date and Time
Tem
pera
ture
in C
OPEN 2mSHADED 2m
Figure 7. Human Comfort as a function of ambient temperature.
57-
Figure #8. Subject research site for PV canopy coverage.

57-
Diurnal Photovoltaic Panel Canopy Temperatures v. Surface Pavement Temperatures 14 June 2004 Phoenix, Arizona
J.S. Golden
152025303540455055606570
6/14/2
004 0:
01
6/14/2
004 1:
41
6/14/2
004 3:
21
6/14/2
004 5:
01
6/14/2
004 6:
41
6/14/2
004 8:
21
6/14/2
004 10
:01
6/14/2
004 11
:41
6/14/2
004 13
:21
6/14/2
004 15
:01
6/14/2
004 16
:41
6/14/2
004 18
:21
6/14/2
004 20
:01
6/14/2
004 21
:41
6/14/2
004 23
:21
Date and Time
Tem
pera
ture
in D
egre
e C
PV Panel UndersideFully Exposed Pavement Surface-No ShadeNon-PV Canopy Underside
Figure #9. Diurnal variance of surface temperatures utilizing PV canopy coverage.

57-
Ð?Т for Surface PavementsUrban Forestry Canopy vs. Mechanical Photovoltaic Canopy Coverage
14 June 2004 Phoenix, Arizona J.S. Golden
0
10
20
30
40
50
60
6/14/2
004 0:
01
6/14/2
004 1:
21
6/14/2
004 2:
41
6/14/2
004 4:
01
6/14/2
004 5:
21
6/14/2
004 6:
41
6/14/2
004 8:
01
6/14/2
004 9:
21
6/14/2
004 10
:41
6/14/2
004 12
:01
6/14/2
004 13
:21
6/14/2
004 14
:41
6/14/2
004 16
:01
6/14/2
004 17
:21
6/14/2
004 18
:41
6/14/2
004 20
:01
6/14/2
004 21
:21
6/14/2
004 22
:41
Date and Time
Ð?Т
Fully
Exp
osed
Pav
emen
t v. C
over
ed
Surf
ace
(Deg
ree
F co
oler
than
exp
osed
su
rfac
e)
PV CanopyCovered Surface
Urban ForestryCovered Surface
Figure #10. Graph of the surface pavement mitigation benefits between PV Canopy coverage and Urban Forestry Coverage.
57-
Figure #11. The Atmospheric Physics Representation. Golden (2004).

57-
Figure #12: Solar Energy Distribution. Lawrence Berkeley National Laboratory.

57-
Figure #13: Solar Radiation Wavelengths. Source: NASA.

57-
Figure #14 Hours of plant cold stress and heat stress per year at Sky Harbor, 1948-2000. Baker et al. 2003.

57-
Figure 15. Total United States water withdrawals by category, 2000. Source: U.S.G.S. 2000

57-
Figure #16. Sustainable Engineering Approaches to Mitigating Surface Pavement Hysteresis Lag Effect in Parking Lots.

57-
Copyright © 2022 FDOKUMEN