Spectral wave flow attenuation within submerged canopies: Implications for wave energy dissipation
Upload
independentCategory
view
2download
0
Available online at www.sciencedirect.com
www.elsevier.com/locate/gca
ScienceDirect
Geochimica et Cosmochimica Acta 144 (2014) 82–95
Isotopic characteristics of canopies in simulated leaf assemblages
Heather V. Graham a,⇑, Mark E. Patzkowsky a, Scott L. Wing b, Geoffrey G. Parker c,Marilyn L. Fogel d, Katherine H. Freeman a
a Department of Geosciences, The Pennsylvania State University, University Park, PA 16802, USAb Department of Paleobiology, Smithsonian Institution, NHB121, P.O. Box 37012, Washington, DC 20013, USA
c Forest Ecology Laboratory, Smithsonian Environmental Research Center, P.O. Box 28, Edgewater, MD 21037, USAd Department of Life and Environmental Sciences, University of California Merced, Merced, CA 95343, USA
Received 26 April 2013; accepted in revised form 27 August 2014; available online 6 September 2014
Abstract
The geologic history of closed-canopy forests is of great interest to paleoecologists and paleoclimatologists alike. Closedcanopies have pronounced effects on local, continental and global rainfall and temperature patterns. Although evidence forcanopy closure is difficult to reconstruct from the fossil record, the characteristic isotope gradients of the “canopy effect”could be preserved in leaves and proxy biomarkers. To assess this, we employed new carbon isotopic data for leaves collectedin diverse light environments within a deciduous, temperate forest (Maryland, USA) and for leaves from a perennially closedcanopy, moist tropical forest (Bosque Protector San Lorenzo, Panama). In the tropical forest, leaf carbon isotope valuesrange 10&, with higher d13Cleaf values occurring both in upper reaches of the canopy, and with higher light exposure andlower humidity. Leaf fractionation (Dleaf) varied negatively with height and light and positively with humidity. Vertical 13Cenrichment in leaves largely reflects changes in Dleaf, and does not trend with d13C of CO2 within the canopy. At the sitein Maryland, leaves express a more modest d13C range (�6&), with a clear trend that follows both light and leaf height. Usinga model we simulate leaf assemblage isotope patterns from canopy data binned by elevation. The re-sampling (bootstrap)model determined both the mean and range of carbon isotope values for simulated leaf assemblages ranging in size from10 to over 1000 leaves. For the tropical forest data, the canopy’s isotope range is captured with 50 or more randomly sampledleaves. Thus, with a sufficient number of fossil leaves it is possible to distinguish isotopic gradients in an ancient closed canopyforest from those in an open forest. For very large leaf assemblages, mean isotopic values approximate the d13C of carboncontributed by leaves to soil and are similar to observed d13Clitter values at forested sites within Panama, including the sitewhere leaves were sampled. The model predicts a persistent �1& difference in d13Clitter for the two sites which is consistentwith higher water availability in the tropical forests. This work provides a new framework for linking contemporary ecologicalobservations to the geochemical record using flux-weighted isotope data and lends insights to the effect of forest architectureon organic and isotopic records of ancient terrestrial ecosystems.� 2014 Elsevier Ltd. All rights reserved.
1. INTRODUCTION
Dense or “closed” forest canopies are of enormousclimatic and ecological significance. The extent of canopy
http://dx.doi.org/10.1016/j.gca.2014.08.032
0016-7037/� 2014 Elsevier Ltd. All rights reserved.
⇑ Corresponding author at: Planetary Environments Laboratory,NASA Goddard Space Flight Center, Greenbelt, MD 20771, USA.
E-mail address: [email protected] (H.V. Graham).
closure represents the area of a forest floor is covered byoverlying vegetation. A common definition of a closed can-opy is 40% or more of the floor surface covered by plantbiomass (FAO, 1999). Canopy closure affects surfacealbedo, atmospheric circulation, surface roughness, andhydrologic cycling, which can, in turn, influence terrestrialtemperature and rainfall redistribution (Bruenig, 1989;Bastable et al., 1993; van Dijk and Keenan, 2007; Boyce

H.V. Graham et al. / Geochimica et Cosmochimica Acta 144 (2014) 82–95 83
and Lee, 2010; Boyce et al., 2010). Closed canopies stabilizesoils, giving them enormous above- and below-ground car-bon storage potential. By preventing soil erosion and pro-moting soil moisture, canopy structure can affect soilcarbon and the carbon cycle – both on the local and globalscales (Grace et al., 1995; Buchmann et al., 1997; Koch,1998; Giambelluca, 2002). Dense forest canopies also hosta great variety of microhabitats into which much of thediversity of animal and plant life has specialized(Kohyama, 1993; Wilson, 1994; Ozanne et al., 2003), andthe proliferation of canopy habitats may have been impor-tant in the evolution of arboreal primates and our hominidancestors (Sussman, 2005).
The three-dimensional structure of a canopy – the height,density, distribution, and coverage of aerial biomass(Parker, 1995) – remains an elusive collection of traits todetect in the fossil record. Fossil assemblages seldom pre-serve branchless boles, or evidence of tree spacing or branchdensity associated with canopy density (Secord et al., 2008).While a few exceptional assemblages include large, fleshyfruits (an adaptation to dense canopy) (Tiffney, 1984;Eriksson et al., 2000; Bruun and Ten Brink, 2008; Friiset al., 2011) or in situ litter, logs, and stumps (Williamset al., 2003; DiMichele and Falcon-Lang, 2011), the mostcommon macroscopic plant fossils are leaves and leaf frag-ments (Ellis et al., 1999). Forest architecture is inferred fromleaf fossils by morphologic and taxonomic comparison toextant ecosystems (Upchurch and Wolfe, 1987; Winget al., 1991, 2000, 2009; Wilf, 2000; Johnson and Ellis, 2002).
The origin of the closed forest canopy is generally linkedwith the rise of angiosperms (Morley, 2000; Burnham andJohnson, 2004) but the emergence and evolution of closedcanopies are poorly understood. Indeed, even the timingof these first canopies is disputed (Upchurch and Wolfe,1987; Davis et al., 2005). It is difficult to determine fromthe fossil record the character of the canopied forest habitatsand how canopies responded to climate perturbations orother events (Boyce et al., 2010). Given the impact of forestson climate systems, there is great interest in identifying can-opy properties of ancient ecosystems. A proxy method thatcaptures carbon isotopic gradients could enable character-ization of ancient canopy closure (Ehleringer et al., 1986;Secord et al., 2008; Cerling et al., 2011). At present, how-ever, the specific imprint of forest architecture on isotopicand geochemical properties of preserved leaf fossils, bulkorganic matter or plant biomarkers, is not well known.
A long recognized indicator of canopy conditions, the“canopy effect”, is a decrease in d13C of leaves (hereaftercalled d13Cleaf) from the top of the canopy to the forest floor(Vogel, 1978). Gradients in light, humidity, and the concen-tration and carbon isotopic composition of atmosphericCO2 can all influence d13Cleaf (Aoki et al., 1978; Medinaand Minchin, 1980; Madigosky, 2004; Ometto et al.,2006). Higher carbon assimilation rates in the well-lit can-opy top cause leaves to draw down internal CO2 rapidly,thus lowering discrimination against 13C compared withleaves in the understory (Chazdon and Fetcher, 1984;Ehleringer et al., 1986; Zimmerman and Ehleringer, 1990;Hanba et al., 1997; Niinemets et al., 1999; Meir et al.,2002; Poorter et al., 2006; Niinemets, 2007). This is a major
cause of the canopy effect (Ellsworth and Reich, 1993;Baldocchi, 1994). In addition, lower humidity in the uppercanopy stimulates stomata closure to slow water loss. Asmaller stomata opening restricts the supply of CO2 tothe leaf, limiting the extent to which Rubisco (the primaryenzyme of carbon fixation in photosynthesis) prefers 12CO2
(Madhavan et al., 1991; Stewart et al., 1995; Brooks et al.,1997). Finally, CO2 lower in the canopy can be moredepleted in 13C compared to the atmosphere due to a higherproportion of respired CO2 (Vogel, 1978; Medina andMinchin, 1980; Sternberg et al., 1989; van der Merwe andMedina, 1989). Because air circulation is restricted by thedensity of biomass CO2 in closed forests commonly exhibits13C enrichment from the forest soil to the canopy top.
The canopy effect is potentially preserved as a large rangein the stable carbon isotope composition of individual leavesfrom a fossil assemblage (Arens et al., 2000; Beerling andRoyer, 2002; Fricke et al., 2007). Yet, data for leaves in livingclosed canopy forests, suggest that the canopy effect might beattenuated and difficult to detect in fossils. In tropical closed-canopy forests most leaf biomass occurs in the upper canopy.Well-lit leaves have higher photosynthetic rates and haveshorter life spans compared to more shaded leaves, althoughthis is not always observed (Parker et al., 1989; Wright andCannon, 2001; Santiago and Wright, 2007). Reich et al.(1991) found, on a global scale, an inverse logarithmic rela-tionship between leaf life span and net photosynthetic rate.The relationship between litter flux and sun exposure sug-gests leaves from the upper canopy strata are more likely tobe represented in fossil litter assemblages. Further, canopyleaves typically have lower mass and exposed to higher windsmaking them more likely to be removed, transported andpreserved within aqueous depositional environments(Dilcher, 1973; Spicer, 1980; Ferguson, 1985; Burnhamet al., 1992) thereby entering the fossil record.
Here, we seek to constrain how these taphonomic pres-sures – the factors that influence the transition of a livingorganism to a fossil – affect the isotopic expression in a fossilassemblage. We employed the isotopic and flux data forleaves of two modern forests with different degrees of clo-sure to characterize the isotopic compositions of leaf assem-blages of different sizes. We used data from: (1) a seasonallyclosed-canopy, mature deciduous temperate forest in coastalMaryland and (2) an old-growth, perennially closed-canopy,moist evergreen tropical forest in Panama. We used are-sampling (bootstrap) model that simulates leaf-litterassemblages in order to answer the following questions.
� How many leaves from a litter assemblage are necessaryto distinguish the isotopic gradient characteristics ofcanopy closure?� Are mean d13Cleaf values for a litter assemblage diagnos-
tic of a forest biome?� Can we predict the d13C values of cumulative litter, soil
organic matter, and organic carbon in sedimentaryarchives using litter flux and isotope patterns incanopies?
We determined the d13C range and mean for differentsized assemblages of leaves sampled from data for each

84 H.V. Graham et al. / Geochimica et Cosmochimica Acta 144 (2014) 82–95
forest. We re-sampled very high numbers of leaves in orderto estimate the isotopic composition of cumulative carbondelivered to soils as litter, and compared these results toavailable data from forest soils. Modeled leaf and soilorganic carbon isotope patterns in this study offer insightsto how forest structure can be derived from carbon isotopemeasurements of fossil leaves, as well as secondary material– such as teeth, hair, paleosol carbonates, or organic soilcarbon (van der Merwe and Medina, 1989; Koch, 1998;Secord et al., 2008; Levin et al., 2011).
Distinct climate and seasonal difference in the Panamaand Maryland, USA forests are reflected in their canopy iso-tope gradients. In the tropical forest of Panama, leaves areproduced throughout the year within a canopy that is bothextensively and persistently closed (Leigh, 1975; Lowmanand Wittman, 1996). In the temperate forest of Marylandleaves are produced during the spring when canopy condi-tions are relatively open (Korner and Basler, 2010).
2. METHODS
2.1. Collection sites
The Bosque Protector San Lorenzo forest preserve ofPanama (Fig. 1) is located at 9�170N, 79�380W. This ever-green, moist tropical terre firme forest is 130 m above sealevel and 4.4 km from the Caribbean coast. The site has atropical monsoonal climate (Koppen classification byFAO GeoNetwork). It receives, on average, 330 cm of rain-fall annually, and it has a mean annual temperature of26 �C. The 6-ha preserve contains more than 22,000 treesand 240 recorded species of trees and lianas. The canopyis co-dominated by Manilkara spp., and Brosimum utile.Calophyllum longifolium, and Aspidosperma cruenta occupymuch of the mid-canopy, and Virola sebifera occupies mid-canopy, understory, and gaps (CTFS; http://www.ctfs.si.edu/site/Sherman). This forest exhibits a strong, persistentlight gradient with less than 1% of available light (>99%light attenuation) reaching the forest floor. No logginghas occurred on this site for at least 200 years and it hasbeen an officially protected site for over a century.
In Maryland, the Smithsonian Environmental ResearchCenter (SERC) forest (38�530N, 76�330W) is located on theinner coastal plain of the Chesapeake Bay (Fig. 1). Meanannual temperature at the site is 13 �C with hot, humidsummers and short, cool winters. Average annual precipita-tion (MAP) in this area is 108 cm and the region is classifiedas a humid subtropical climate (Koppen classification byFAO GeoNetwork). This seasonally deciduous forest isdominated by Liriodendron tulipifera in the upper andmid-canopy, Fagus grandifolia in the lower mid-canopyand Carpinus caroliniana in the understory (Parker et al.,1989; Brown and Parker, 1994). Most foliage is producedduring spring leaf flush when the canopy is open (Brownand Parker, 1994), although canopy closure of >99% lightattenuation is reached at the height of the summer growingperiod. This site has been undisturbed for �150 years.
The Maryland and Panama leaf data sets represent dif-ferent moisture regimes (MAP = 108 cm versus 330 cm). In
addition, the two sites represent leaf populations producedduring different canopy closure conditions (open, closed).
2.2. Sampling methods and environmental measurements
In Panama, at the San Lorenzo forest, leaves were col-lected along a 47-m vertical transect using a canopy crane.The Smithsonian Tropical Research Institute (STRI) man-ages this crane which provides access to nearly the entirevertical forest structure in a 0.92 ha area. Bulk leaf sampleswere taken at 72 unique sampling sites, which were alsoevaluated to determine the percent available light duringthe time of maximum photosynthesis. Sites were notselected at random as the sampling goal was to collectleaves from the full range of light, humidity, and limb den-sity environments found in the canopy. Leaves were clippedfrom trees, stored in paper bags, and dried at 70 �C thesame day as collection. Atmospheric air samples were col-lected in 160 ml serum bottles from sites associated withleaf sampling. These bottles were allowed to equilibratewith atmosphere for 60–90 min, and then crimp-sealed withbutyl rubber gas-tight septa. All samples were acquired dur-ing a two-month time window, from January to Februaryof 2010.
The percent of available light in the Panama forest wasdetermined from 9 a.m. to 12 p.m., which is the portion ofthe day when the most photosynthesis occurs (Gouldenet al., 2004). Light measurements were made using datafrom multiple light meters and over a range of time scales.A LiCor LI200SB pyranometer installed on the crane wellabove the canopy collected mean, maximum, minimum,and total solar radiation at 15-min time intervals. A secondset of light measurements were made using a LiCor LI190quantum PAR (photosynthetically active radiation) sensor,recording 5 min averages, maxima, and minima at eachsampling site. Finally, a Spectrum Technologies Field Scouthand-held quantum PAR meter was utilized to characterizeleaf sites during collection. Light measurements wererepeated by all three devices throughout each day of thesampling expedition. Light data for the tropical forest aresummarized in Fig. 2A and C (see also SupplementalTable 1). Humidity and temperature measurements werecoordinated with light measurements using a Traceable dig-ital thermo-hygrometer.
At the SERC site in Maryland leaves were collected overa 40-m vertical transect using a mobile construction crane.Again, sampling was not random as sites were specificallychosen to capture the full range of light within this canopy.Leaf samples were taken at 81 unique sites, which werecharacterized for their light environment. Leaves wereclipped from trees, stored in paper bags and dried at70 �C within 8 h of collection. All samples were acquiredduring the summer of 2001. Available light was character-ized using digital hemispherical photography. PAR is calcu-lated from these images using measurements of cover anddirect, indirect, and total site factors. Light was binned intofive distinct categories of estimated environmental light, thecrown illumination index, using methods similar to thoseoutline in Keeling and Phillips (2007). Light data fromthe Maryland forest are summarized in Fig. 2B and D.
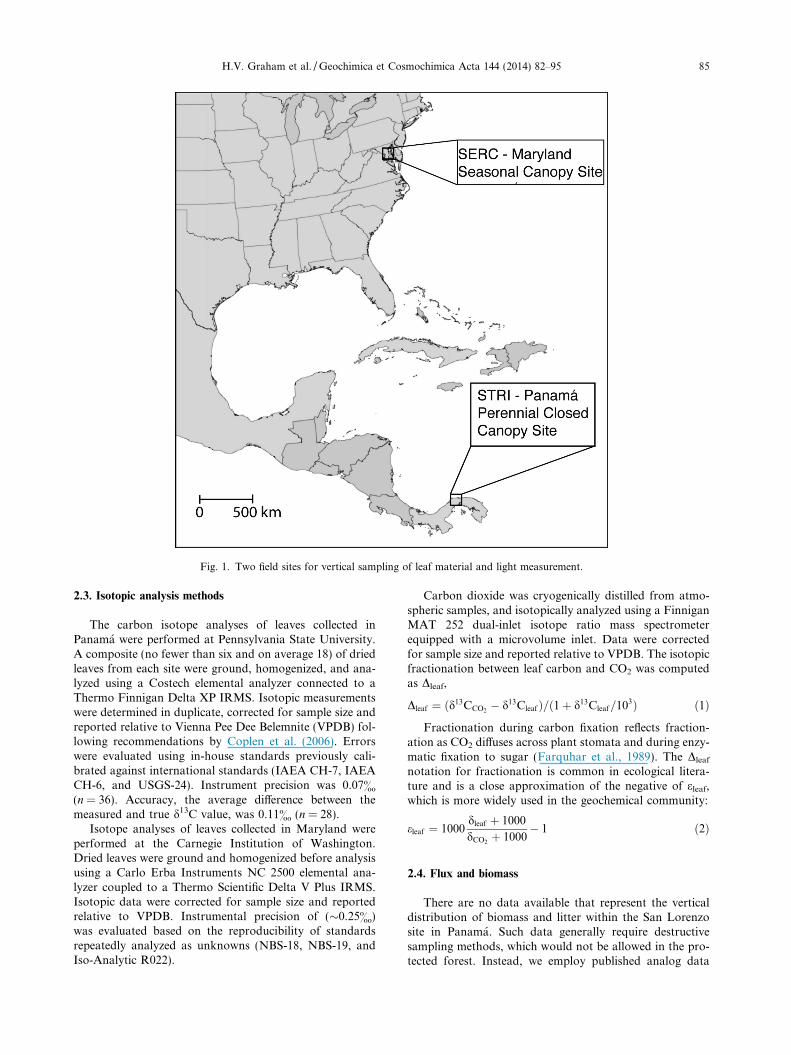
Fig. 1. Two field sites for vertical sampling of leaf material and light measurement.
H.V. Graham et al. / Geochimica et Cosmochimica Acta 144 (2014) 82–95 85
2.3. Isotopic analysis methods
The carbon isotope analyses of leaves collected inPanama were performed at Pennsylvania State University.A composite (no fewer than six and on average 18) of driedleaves from each site were ground, homogenized, and ana-lyzed using a Costech elemental analyzer connected to aThermo Finnigan Delta XP IRMS. Isotopic measurementswere determined in duplicate, corrected for sample size andreported relative to Vienna Pee Dee Belemnite (VPDB) fol-lowing recommendations by Coplen et al. (2006). Errorswere evaluated using in-house standards previously cali-brated against international standards (IAEA CH-7, IAEACH-6, and USGS-24). Instrument precision was 0.07&
(n = 36). Accuracy, the average difference between themeasured and true d13C value, was 0.11& (n = 28).
Isotope analyses of leaves collected in Maryland wereperformed at the Carnegie Institution of Washington.Dried leaves were ground and homogenized before analysisusing a Carlo Erba Instruments NC 2500 elemental ana-lyzer coupled to a Thermo Scientific Delta V Plus IRMS.Isotopic data were corrected for sample size and reportedrelative to VPDB. Instrumental precision of (�0.25&)was evaluated based on the reproducibility of standardsrepeatedly analyzed as unknowns (NBS-18, NBS-19, andIso-Analytic R022).
Carbon dioxide was cryogenically distilled from atmo-spheric samples, and isotopically analyzed using a FinniganMAT 252 dual-inlet isotope ratio mass spectrometerequipped with a microvolume inlet. Data were correctedfor sample size and reported relative to VPDB. The isotopicfractionation between leaf carbon and CO2 was computedas Dleaf,
Dleaf ¼ ðd13CCO2� d13CleafÞ=ð1þ d13Cleaf=103Þ ð1Þ
Fractionation during carbon fixation reflects fraction-ation as CO2 diffuses across plant stomata and during enzy-matic fixation to sugar (Farquhar et al., 1989). The Dleaf
notation for fractionation is common in ecological litera-ture and is a close approximation of the negative of eleaf,which is more widely used in the geochemical community:
eleaf ¼ 1000dleaf þ 1000
dCO2þ 1000
� 1 ð2Þ
2.4. Flux and biomass
There are no data available that represent the verticaldistribution of biomass and litter within the San Lorenzosite in Panama. Such data generally require destructivesampling methods, which would not be allowed in the pro-tected forest. Instead, we employ published analog data

Fig. 2. Light measurements and foliar d13C for both tropical and temperate canopy leaf sampling sites. Light at the Panama site (A) light isexpressed as a percentage of available light whereas light at the Maryland site (B) is binned in order of increasing irradiance as determined byhemispheric photography. Symbols denote the five different genera collected at each site. Tropical canopy foliage (C) spans a �10& range ind13C that correlates with percentage of available light. d13C of temperate canopy leaves (D) also trend with available light but express only a�6& range.
86 H.V. Graham et al. / Geochimica et Cosmochimica Acta 144 (2014) 82–95
from the Pasoh forest (Osada et al., 2001) to estimate stand-ing biomass and annual leaf flux in a closed-canopy tropicalforest. The Pasoh Forest Reserve in Malaysia (2�590N,102�18’) is a well-studied site and widely used for inferringand comparing properties of lowland tropical rainforests(Manokaran and LaFrankie, 1990; Wills and Condit,1990; Condit et al., 1996, 1999; Wright et al., 2005). ThePasoh forest is similar to the San Lorenzo forest. Theyare both moist, evergreen, tropical forests and have similarcanopy and stand structures (Manokaran and LaFrankie,1990). The Pasoh forest is dominated by Dipterocarpaceae,but has a high diversity among the lower abundance taxa.Shorea spp. dominates the upper canopy, whereas Xero-
spermum noronhianeae and Dacryodes spp. are prominentin the mid-canopy. Biomass refers to the total mass (tons)of leaf material per area (hectare) on the trees at the heightof the growing season. Vertically resolved flux data areevaluated as the mass of leaf litter per year and per areaderived from within each one-meter height interval. Theauthors estimated forest biomass using equations thatrelate leaf biomass to diameter and height of bole. Theseequations were derived from destructive sampling at a rep-
resentative site and then extrapolated to the rest of thestand. Leaf fall flux was estimated by relating leaf life spanat a particular height to the biomass at that height (Osadaet al., 2001).
While the two tropical closed-canopy forests used forbiomass and flux data (Pasoh Forest; Osada et al., 2001)and for isotopic data (San Lorenzo; this study) are popu-lated by different taxa, the stand structures are very similar(Manokaran and LaFrankie, 1990; Condit et al., 1996). Thedata set for the Pasoh forest has sufficient vertical resolu-tion to be compared to our data from Panama and fromthe temperate Maryland forest at SERC (Parker et al.,1989). Biomass and flux data for the SERC forest wereoriginally published in Parker et al. (1989); leaf samplingand isotopic analyses are more recent.
2.5. Bootstrap analysis
Leaf fluxes and d13Cleaf values were incorporated into aresampling model using the ‘R’ statistical package (RDevelopment Core Team, 2008). All isotope data were bin-ned in five-meter increments vertically, with nine height

H.V. Graham et al. / Geochimica et Cosmochimica Acta 144 (2014) 82–95 87
bins for the San Lorenzo forest and seven for the SERCforest. The model performed a bootstrap analysis of binnedflux and isotope data for both forests.
The height-binned data were sampled with replacementby the model algorithm. The resampling model selected a‘leaf’ from vertical data bins (of height x) with the likeli-hood (L) for each bin determined by its relative contribu-tion to the total flux.
L ¼ Ubinx=UR allbins ð3Þ
Each selected ‘leaf’ was assigned a d13C value randomlyselected from the data for that height bin (data are tabu-lated in the supplementary material). The model repeatedsampling and assignment for y number of times, where y
is the assemblage size – the number of ‘leaves’ sampled in
silico. This process of assemblage collection is repeated2000 times resulting in 2000 simulated collection scenarios.
The mean d13Cleaf value for each assemblage of y leaves(d13Cy-mean) was calculated and recorded by the modelyielding 2000 d13Cy-mean values. The model also calculatedthe isotopic range for leaves (Dy) in each assemblage withina collection scenario. The range is the difference betweenthe highest and lowest d13Cleaf values: Dy = d13Cy-max
� d13Cy-min. The highest 50 and lowest 50 of the d13Cy-mean
values were removed from the data set, and subsequentanalyses employed the remaining 95% of the data, approx-imately two standard deviations, for a collection scenario.
3. RESULTS
3.1. Light and height measurements
Fig. 2A and B summarizes vertical light data for bothforest types and both show how light increased with heightin the canopy. Fig. 2A also shows a wide diversity of lightenvironments were available to leaves in the dense mid-canopy in Panama. The Maryland forest light data fallsinto three distinct light regions (0–15 m, 15–25 m, and 25–35 m, see Fig. 2B) divided by the bimodal biomass distribu-tion divided between dense understory and mid-canopy.
3.2. Leaf carbon isotope data
d13Cleaf values were more enriched in the leaves from theMaryland forest (Fig. 2D) and more depleted d13Cleaf val-ues were observed in leaves from the Panama forest(Fig. 2C). Both forests exhibit a vertical isotope gradient(i.e., the canopy effect) with greater height in the canopy(see Fig. 3C and F) as well with light (Fig. 2C and D).13Cleaf values are lowest near the ground, in the in thepoorly lit portion of the forest, and trend toward highervalues in the well-lit upper canopy. The magnitude andcharacter of this gradient differs between the sites. TheMaryland forest has a range of 5.8& (Fig. 3F). ThePanama forest (Fig. 3C) d13Cleaf values have a wider range(9.6&) and have a less well-behaved trend than values inthe Maryland forest. This wider range is due in part tothe highly 13C-depleted leaves (�36.5&) observed in under-story samples collected less than 5 m above the forest floor.Isotopic variability with height is likely linked to highly
variable growth conditions, particularly in the upper andmid-canopy (i.e., 20–30 m above the forest floor), whereavailable light ranged between 10% and 90% and d13Cleaf
values ranged over 6& (see Supplemental Table 1).
4. DISCUSSION
4.1. Light properties and the d13C canopy effect at San
Lorenzo
4.1.1. Intra-canopy light trends and the d13C canopy effect
The canopy effect is commonly attributed to 13C-depleted CO2 that collects at the base of a forest as a resultof microbial respiration in the soil (Vogel, 1978; Medinaand Minchin, 1980; van der Merwe and Medina, 1989).This attribution is derived from atmospheric samplingexperiments in forests that find an overall depletion innighttime 13CCO2
when photosynthesis ceases but microbialrespiration continues (see Pataki et al., 2003). Diurnal gasisotope data are not available for our sites, but sampledatmospheric gases in a subset of leaf sampling sites in themid-canopy of the San Lorenzo forest represent the charac-ter of d13CCO2
with height, humidity, and with light (as ameasure of canopy density and atmospheric mixing) atthe time when photosynthetic activity is highest (before12 pm; Goulden et al., 2004) (Fig. 4A and C). Our datashow no significant correlation between d13CCO2
and lightor height (R2 = 0.21; p = 0.10 and R2 = 0.13; p = 0.23;respectively) (Fig. 4A and C). This suggests that the atmo-sphere was well mixed at mid-day.
By pairing CO2 isotope data and d13Cleaf values at a sub-set of leaf sampling sites we calculate Dleaf. This subset ofleaf samples includes Aspidosperma, Brosimum, Calophyl-
lum and Virola. Dleaf is plotted in Fig. 4B and D relativeto leaf height and available light. Dleaf, as defined byFarquhar et al. (1989) (Eq. (1)) describes the fractionationof carbon isotopes by a leaf during the uptake and fixationof CO2. Greater Dleaf values are observed in leaves withhigher stomatal conductance. Stomatal conductance ishigher where the difference between the vapor pressure ofwater within the leaf versus that in the air (i.e., vapor pres-sure deficit or VPD) is small (Madhavan et al., 1991).Higher Dleaf values are also expected under low light, whichreduces rates of photosynthesis and carbon fixation. Ourdata revealed decreased fractionation (smaller Dleaf values)at both higher light availability and with higher leaf eleva-tion (Fig. 4B and D). Regression analysis of the data showsthat there is a significant relationship between Dleaf valuesand light, but not height (R2 = 0.39; p = 0.02 andR2 = 0.20; p = 0.13; respectively).
4.1.2. Intra-canopy humidity trends and the d13C canopy
effect
VPD is low when conditions are humid, as is common in atropical rainforest so higher stomatal conductance andgreater Dleaf values are expected (see Fig. 5). Higher relativehumidity under a dense forest canopy could result in increasedfractionation and larger Dleaf values. The effects of humidityand light on photosynthesis tend to co-vary and are highlyvariable, and it is difficult to separate the relative importance

Fig. 3. Seasonal canopy standing biomass (A), annual leaf flux (B), and d13Cleaf data (C) for 5 m vertical bins from Maryland site. Tropicalcanopy biomass (D) and annual leaf flux data (E) are from Pasoh Reserve in Malaysia (Osada et al., 2001). Tropical canopy d13Cleaf (F) forPanama site. Isotope ranges are expressed as box-and-whisker plots representing the median as well as lower and upper quartiles.
88 H.V. Graham et al. / Geochimica et Cosmochimica Acta 144 (2014) 82–95
of their influence within the small mid-section of the canopy(Fig. 5A and B). Relative humidity did not correlate witheither d13CCO2
or Dleaf values in the small mid-canopy sub-sampling (R2 = 0.05; p = 0.42 and R2 = 0.01; p = 0.70;respectively) nor did relative humidity correlate with lightor height (R2 = 0.04; p = 0.12 and R2 = 0.05; p = 0.09;respectively). Sampling from the full height of the forest (for-est floor to the canopy top) did reveal a weak but significantcorrelation between relative humidity and both light andheight measurements (see Fig. 5) (R2 = 0.20; p < 0.05 andR2 = 0.40; p < 0.05; respectively). This correlation is depen-dent on the very humid conditions in the deep understoryand does not exist if these values or omitted.
4.1.3. A stepped regression model to de-convolve
environmental influences on Dleaf
A stepped regression model was used to test the relativeeffects of light and humidity on carbon isotope fraction-ation at the leaf. This model uses the subset of leaf datafor which d13CCO2
measurements were also made. Thismodel indicated that light is more strongly associated withthe Dleaf trend (R2 = 0.39; p = 0.02). Adding the relativehumidity data only marginally improved the predictive abil-ity of this model (R2 = 0.41; p = 0.06). These results suggestthat light level exerts a greater influence on Dleaf values thanrelative humidity. The lowest d13Cleaf values found in thelower regions of the canopy primarily reflect slow photo-synthetic rates due to the deep shade, and that increasedstomatal conductance associated with higher humiditywas a secondary factor.
Correlation between light and the carbon isotope com-position of CO2 could potentially reflect photosynthetic
carbon assimilation patterns that ultimately affect theatmosphere.
The results of a stepped regression model that evaluatedthe influence of light and humidity on d13CCO2
values werenot statistically significant. This suggests other factors notincluded in this analysis (such as respiration) likely accountfor variations in the d13CCO2
within the canopy. Alternately,light varies little throughout the year in this equatorial loca-tion whereas humidity and d13CCO2
may be more variablesuch that measurements made in a shorter time period areless representative of the long-term average.
4.1.4. Canopy isotope gradients in biomass and litter flux
Fig. 3 illustrates biomass allocation, annual litter carbonflux and carbon isotope compositions for the two forests.The Maryland forest exhibits a bimodal biomass distribu-tion with thick understory and upper canopy layers(Fig. 3A; Parker et al., 1989). By comparison, the tropicalforest data (Fig. 3D; Osada et al., 2001) place most biomassin the upper canopy and very little is located in the under-story below 5 m. Many studies (Lowman and Wittman,1996; Leigh, 1999) have confirmed that low-latitudeclosed-canopy forests have greater leaf biomass fluxamounts than temperate canopy forests (Fig. 3E). The leafflux amount for the Maryland forest (382.66 g/m2; Fig. 3B)differs only slightly from the standing biomass estimate(Fig. 3A) because the trees in this forest are annually decid-uous and herbivory is low at this site (Parker et al., 1989).Biomass flux in the tropical forest (829 g/m2; Fig. 3E) illus-trates the shorter lifespan and rapid turnover of leaves inthe upper canopy (Osada et al., 2001). Decreased leaf lifespan in the upper canopy is associated with higher light

Fig. 4. d13Cair of isolated atmospheric CO2 from the Panama site as related to height within the canopy (A), % light availability (B), andrelative humidity (C). Carbon isotope discrimination (Dleaf) values is calculated from d13Cair and d13Cleaf measured at each sampling site andrelated to canopy height (D), % light availability (E), and relative humidity (F).
H.V. Graham et al. / Geochimica et Cosmochimica Acta 144 (2014) 82–95 89
levels and very high rates of photosynthesis while leaves inthe humid understory have much longer lifespans and oftendo not senesce on an annual basis (Reich et al., 1991).
Leaves in the Panama forest (especially in the mid-canopybin between 20 and 30 m) exhibit a wider range of d13C values(Fig. 3F) when compared with leaves from the Maryland for-est (Fig. 3C). d13Cleaf values for both sampling sites exhibitthe increased enrichment with height that is generallydescribed as the “canopy effect”, but the relationshipbetween height and d13C leaf is weaker in the Panama forest(R2 = 0.54) compared to the Maryland forest (R2 = 0.77).This suggests the Maryland forest experienced greater atmo-spheric mixing or more even light conditions during the timeof spring leaf flush, when most atmosphere-derived carbon
biomass is added to leaves (Comstock and Ehleringer,1992; Polgar and Primack, 2011).
4.2. Resampling model outcomes
4.2.1. How many leaves from a litter assemblage are
necessary to distinguish the isotopic gradient characteristics
of canopy closure?
The understory produces a low flux of leaves to deposi-tional environments in tropical forests, including the SanLorenzo site in Panama (see Fig. 3E). As a result, a rela-tively large number of leaves must be sampled to ensureunderstory leaves are included. As these leaves carry thelowest carbon isotope composition characteristic of the

Fig. 5. Relative humidity as related to height within the Panamasite canopy (A) and % light availability (as a measure of canopyopenness) (B). Relative humidity is highest in understory but highlyvariable throughout the mid- and upper canopy.
Fig. 6. Isotopic ranges (Dy) returned by 2000 iterations of theresampling model for the discrete sample size (y) specified. Boxplots show the median, maximum, minimum, and upper and lowerquartiles generated by the model. As sample sizes increasesexpressed range reaches an effective plateau for larger sample sizesand the median changes very little.
90 H.V. Graham et al. / Geochimica et Cosmochimica Acta 144 (2014) 82–95
canopy isotope gradient, our aim was to determine the min-imum sample size needed to ensure a high probability ofcapturing the isotopic range diagnostic of canopy closure.Based on the availability of leaves from paleoflora of inter-est (compiled in Wing et al., 2009), we simulated assem-blages of y = 10, 25, 50, 100, and 250 leaves.
The mean isotopic range of leaves (Dy) for all 2000 iter-ations was determined for each of collection scenario. Dy
values for collections of y 6 50 overlap considerablybetween the two forests. For larger values of y, Dy consis-tently differs by �1& between forest types (Fig. 6). For50 < y > 100, the Dy values increased with increasing sam-ple size. Ranges for the two forests also increasinglydiverged to the point where there was no overlap in Dy val-ues when y > 100.
Overall, our modeling results indicates that it is possibleto capture a diagnostic isotope range from a random sam-pling of at least y > 50 leaves and even confidently whenmore leaves were sampled. The percentage of simulated col-lection assemblages from the tropical data set that includedat least one understory leaf (i.e., a leaf from the lowest bin)was found to be 5.5% for y = 10, 14.9% for y = 25, 28.8%for y = 50, 49.9% for y = 100 and 84.6% y P 250. Thesesample sizes are manageable for many paleofloral assem-blages. Further, the odds increase for finding understoryleaves increase when leaf selection is based on morphologicmetrics of light environment (e.g., size, vein density stoma-tal index, etc.) of whole leaves from well-described families
(Upchurch and Wolfe, 1987; Kubiske et al., 1996; Richards,1996; Boyce, 2008; Dillen et al., 2008).
4.2.2. Are mean d13Cleaf values for a litter assemblage
diagnostic of a forest biome?
The mean carbon isotope compositions of simulatedleaf-litter assemblages (d13Cy-mean) consistently reflect thedominance of upper canopy biomass in all leaf collectionsfor which y > 50. As expected for smaller sample popula-tions, when y < 50, d13Cy-mean values vary considerably(Fig. 7).
For all leaf collection scenarios (y = 10 to 1000),d13Cy-mean values for the tropical forest were consistently1& lower than for the temperate forest (Fig. 7). This obser-vation is not due to the input of the highly 13C-depleted,shade leaves. Indeed, d13Cy-mean values for the two forestsdiffered by 1&, even for very small sample sizes (y = 10),where only 5.5% of simulated assemblages included at leastone understory leaf. A similar difference of 1& was alsoobserved for assemblages with large sample sizes(y = 1000), which always included at least one understoryleaf and included up to 5.1% percent understory leaves.
The canopy between 20 and 30 m contributes 55% ofleaf flux (Osada et al., 2001) and dominates the simulatedleaf assemblages (Fig. 3E). This region experiences highlyvariable conditions that range from open gaps to highlydense foliage (Brokaw, 1982), and yields a wide range ofd13Cleaf values (Fig. 2C) with a mean value of �30& anda standard deviation approaching 4&. Further, observedd13Cleaf values for the canopy top in the tropical forestare 1–2& lower than for the leaves at the very top of thetemperate forest (Fig. 3C and F). This is consistent withhigh humidity and greater fractionation (Dleaf) observedglobally for tropical rainforest biomes (Diefendorf et al.,2010). Foliage in the mid-canopy at the Panama site hasDleaf values that range from 18& to 26&, consistent withoverall high, but variable, intra-canopy humidity (Fig. 5;Diefendorf et al., 2010). The small range of d13Cleaf values

Fig. 7. Curves bound the range of foliar d13Cy-mean returned bymodel for both canopy types. d13Cy-mean for small sample sizes (y)can vary widely in response to rare isotope values but large samplesizes approach a mean that represents the more probable foliarcarbon isotope input for leaves in litter assemblages.
Fig. 8. Predicted d13Clitter returned by resampling as well as forfour litterfall collection sites and six soil samples from a transect ofPanamanian forest that includes the study site from this study.Values depicted are the mean and standard error for computationaland observational measurements.
H.V. Graham et al. / Geochimica et Cosmochimica Acta 144 (2014) 82–95 91
and overall lower Dleaf values in the Maryland forest indi-cate greater air mixing and overall lower humidity in thetemperate canopy, respectively (Stewart et al., 1995;Diefendorf et al., 2010).
4.2.3. Can we predict the d13C values of cumulative litter, soil
organic matter, and organic carbon in sedimentary archives
using litter flux and isotope patterns in canopies?
A simulated collection of many thousands of leaves rep-resents accumulated leaf litter integrated over time, pro-vided to soil and, ultimately, to sedimentary organiccarbon stores. High numbers of leaves (y P 1000) convergeat d13Cy-mean values that are characteristic of the two datasets, reflecting both climate and the architectural differencesbetween the forest types (Diefendorf et al., 2010).
Santiago (2003) reported carbon isotopic data for litterand mineral-soil organic carbon in and near the San Lore-nzo preserve. For 16 sites, d13Clitter values ranged from�30.5& to �28.4&: for 24 samples collected at four loca-tions, d13Csoil (A-horizon) values ranged from �27.5& to�26.3&. The average value for litter samples(�29.7 ± 1&) is indistinguishable from the predicted value�29.3 ± 0.3& based on our d13Cleaf data (y = 1000; Fig. 8).
In a compilation of published d13Cleaf, d13Clitter, andd13Csoil data, Bowling et al. (2008) suggest variability inthe degree of decomposition in the litter collection (Wynnand Bird, 2005; Wynn et al., 2006; Wynn, 2007) but thisresult could also be biased by small numbers of leaves insome litter samplings (Nadelhoffer and Fry, 1988). Further,Bowling et al. (2008) found d13Csoil values were up to 4.5&
higher than d13Cleaf. The isotopic difference between litterand soil carbon in tropical forests determined by Santiago(2003) was +2.8&, within the range found by Bowlinget al. (2008). Bowling et al. (2008) included only sun leaves,which are generally more enriched in 13C (Ehleringer et al.,1986; see Figs. 2 and 3 of this study), and a large compo-nent of leaf flux (Fig. 3E). Nevertheless, the upper 10 mof canopy accounts for slightly less than half (�45%) of
total biomass flux and does not represent mid-canopyleaves, which provide the majority of carbon to forest litter.A full accounting of canopy inputs must be considered inany estimation of soil carbon arising from leaf material.Our bootstrap analysis estimated d13Clitter that wasweighted by flux and integrated leaf litter from the entireheight of a forest. Such an approach potentially providesa more accurate way to estimate the d13C signatures con-tributed by leaves to soil organic carbon, and couldimprove studies seeking to understand the offset betweenlitter and mineral soil (A-horizon) organic carbon. Soilorganic carbon signatures reflect both an integrated accu-mulation of carbon inputs as well the consequences of theirdegradation.
Santiago (2003) collected litter and mineral soil horizonsin Panama from sites with a wide range in annual precipi-tation (1800–3500 mm/yr) (Fig. 8). We would expect litterfrom drier areas to have been produced with reduced car-bon isotope discrimination (Nadelhoffer and Fry, 1988;Diefendorf et al., 2010). We estimate that Santiago’s(2003) litter sampling likely included fewer than 500 leaves,and certainly many fewer than the thousands of leaves ourmodel uses to generate an expected d13Clitter. Further, theSantiago (2003) litter collection included woody debris,frass, and other floral and reproductive organs not includedin the modeled litter value. The wide range of measuredd13Clitter values potentially reflects contributions from plantcomponents with different chemical and isotopic propertiesthan leaves. In general, across forest types from the tropicalto the temperate ecosystems, leaves account for 50–60% oflitterfall (Odum, 1970; Jordan and Uhl, 1978; Parker et al.,1989; Leigh, 1999; Santiago, 2003). The remaining litterfallcomes largely from wood, a material that is �3& enrichedwith respect to leaf material (Grocke, 2002).
92 H.V. Graham et al. / Geochimica et Cosmochimica Acta 144 (2014) 82–95
Most studies of soil organic carbon fail to recognizethe contribution of carbon from roots. Yet, some authorssuggest root carbon is equal to, or even greater than, theamount of carbon derived from leaves (Fahey et al.,2005; Rasse et al., 2005). Further study is necessary todetermine the relative input of root carbon comparedto leaves and woody biomass and the preservation mech-anisms for these different carbon pools (Ehleringer et al.,2000).
4.3. From leaves to soil organic carbon
Soil organic matter is a complex mixture of inputsfrom many sources and it is subject to significant chemi-cal change during decomposition. Plant biochemical com-ponents (e.g., leaf lipids, lignin, etc.), which preserve ongeological timescales, are also subject to the influence offlux and isotopic gradients associated with canopy cover-age. Canopy structure in forests generates a range of lightand humidity conditions that are reflected in the isotopiccomposition of leaves, which transmit this heterogeneityto soils as litter flux. Our approach, which considersthe height-resolved biomass flux as well as isotopiccomposition, offers a framework for understanding theinfluence of canopy on leaf molecular constituents,provided their abundances are characterized by canopyposition. For example, lipid abundance distribution aswell as isotopic fractionation differ between sun andshade leaves (Collister et al., 1994; Lockheart et al.,1997; Diefendorf et al., 2011).
The modeling approach outlined in this study can beapplied to other forests to predict the isotopic compositionof the carbon in soils that arises from foliar material. Leafcarbon isotope composition is also affected by taxanomiccomposition (see symbols for Fig. 2C and D), regional pre-cipitation regimes (Diefendorf et al., 2010), and canopycoverage (Ehleringer et al., 2000; Cerling et al., 2011). Spa-tial changes in moisture, plant composition and canopy(which generally co-vary) can be captured in soil organiccarbon (SOC) at the level of landscape patches (i.e., paleo-ecotones; Nadelhoffer and Fry, 1988; Mariotti andPeterschmitt, 1994; McClaren and McPherson, 1995;Bilings, 2006; Cerling et al., 2011; Magill et al., 2013).
Diagenetic enrichment of 13C in soil organic carbon israpid (sub-decadal: Bird et al., 1995; Wynn, 2007) and thetemporal resolution of the isotopic composition is drivenby the amount of organic input as well as the mobilityof the organic matter (McClaren and McPherson, 1995;Boutton et al., 1999; see Wynn, 2007). Not only is ourunderstanding of soil carbon diagenesis confounded bythe many environmental factors that affect diagenesis butit is also hampered by an incomplete understanding ofinitial organic inputs. The computational approach illus-trated with the Panama and Maryland forest data canpotentially improve characterization of diagenetic frac-tionation by providing a better estimate of the initialorganic matter based on both biotic (plant type) and phys-ical (moisture, canopy structure, litter flux) factors in aforest.
5. CONCLUSIONS
Our collection efforts produced a unique dataset com-bining d13Cleaf, d13CCO2
, and humidity measurements withinthe context of canopy elevation and available light for fivemajor genera of a tropical closed-canopy forest in Panama.By combining these data with biomass flux measurementsfor an analogous closed canopy forest, we evaluated the iso-topic expression within the forest and for simulated leafassemblages. These results for samples from Panama, werecompared to those for a similarly sampled deciduous, tem-perate forest in Maryland. The range of d13Cleaf values isparticular to each and reflects canopy type (open, Marylandforest = �6&; closed, Panama forest = �10&). Our simu-lated leaf collections predicted isotopic range for leafassemblages for each forest, and these exhibited with asfew as P 50 randomly sampled leaves. For very largesimulated collections from both forests, a distinct 1& differ-ence in the integrated foliar 13C content between foreststypes was evident. This difference has been observed in pre-vious studies at leaf, biome, and global scales and oftenassociated with moisture conditions. The lower d13Cleaf
and larger Dleaf values at the Panama site relative to thosefrom the Maryland site are consistent with differences inrainfall and humidity data for the two biomes. Despitethe importance of humidity differences between the temper-ate and tropical sites, within the canopy of the Panamaforest, Dleaf values were most strongly influenced by lightintensity, and somewhat less influenced by humidity.
Foliar material can account for over half the carbon fluxto soils and has an important influence on the componentsand isotopic character of soil organic carbon. Soil organiccarbon, which can be preserved on very long time-scales,is subject to diagenetic influences that impact d13C valuesin ways that are not fully understood. Modeling efforts,such as this study, can aid our understanding of these effectsby providing constraints on the d13C values of leaf litter inthe context of forest canopy structure and the resulting dif-ferences in environmental drivers such as light, humidity,and source atmospheric CO2.
APPENDIX A. SUPPLEMENTARY DATA
Supplementary data associated with this article can befound, in the online version, at http://dx.doi.org/10.1016/j.gca.2014.08.032.
REFERENCES
Aoki M., Yabuki K. and Kohyama H. (1978) Micro-meteorologyof Pasoh forest. Malayan Nat. J. 30, 149–159.
Arens N. C., Jahren A. H. and Amundson R. (2000) Can C3 plantsfaithfully record the carbon isotopic composition of atmo-spheric carbon dioxide?. Paleobiology 26 137–164.
Baldocchi D. D. (1994) A comparative study of mass and energyexchange over a closed (wheat) and an open (corn) canopy: I.The partitioning of available energy into latent and sensibleheat exchange. Agric. Forest Meteorol. 67, 191–220.
Bastable H. G., Shuttleworth J., Dallarosa R. L. G., Fisch G. andNobre C. A. (1993) Observations of climate, albedo, and

H.V. Graham et al. / Geochimica et Cosmochimica Acta 144 (2014) 82–95 93
surface radiation over cleared and undisturbed Amazonianforest. Int. J. Climatol. 13, 783–796.
Beerling D. J. and Royer D. L. (2002) Fossil plants as indicators ofthe Phanerozoic global carbon cycle. Annu. Rev. Earth Planet.
Sci. 30, 527–556.Bilings S. A. (2006) Changes in stable isotopic signatures of soil
nitrogen and carbon during forty years of forest development.Oecologia 148, 325–333.
Bird M. I., Summons R. E., Gagan M. K., Roksandic Z., DowlingL., Head J., Keith Fifield L., Cresswell R. G. and Johnson D. P.(1995) Terrestrial vegetation change inferred from n-alkaned13C analysis in the marine environment. Geochim. Cosmochim.
Acta 59, 2853–2857.Boutton T. W., Archer S. R. and Midwood A. J. (1999) Stable
isotopes in ecosystem science. Structure, function, and dynam-ics of a subtropical savanna. Rapid Commun. Mass Spectrom.
13, 1263–1277.Bowling D. R., Pataki D. E. and Randerson J. T. (2008) Carbon
isotopes in terrestrial ecosystem pools and CO2 fluxes. New
Phytol. 178, 24–40.Boyce C. K. (2008) The fossil record of plant physiology and
development – What leaves can tell us. Paleont. Soc. Papers 14,133–146.
Boyce C. K. and Lee J.-E. (2010) An exceptional role for floweringplant physiology in the expansion of tropical rainforests andbiodiversity. Proc. R. Soc. London, Ser. B 277, 3437–3443.
Boyce C. K., Lee J.-E., Field T. S., Brodribb T. J. and ZwienieckiM. A. (2010) Angiosperms helped put the rain in the rainfor-ests: the impact of plant physiological evolution on tropicalbiodiversity. Ann. MO Botanical Garden 97, 527–540.
Brokaw N. V. L. (1982) The definition of treefall gap and its effecton measures of forest dynamics. Biotropica 11, 158–160.
Brooks J. R., Flanagan L. B., Varney G. T. and Ehleringer J. R.(1997) Vertical gradients in photosynthetic gas exchangecharacteristics and refixation of respired CO2 within borealforest canopies. Tree Physiol. 17, 1–12.
Brown M. J. and Parker G. G. (1994) Canopy light transmittancein a chronosequence of mixed-species deciduous forests. Can. J.
Forestry Res. 24, 1694–1703.Bruenig E. F. (1989) Ecosystems of the World. In Ecotoxicology
and Climate (eds. P. Bourdeau, J. A. Haines, W. Klein and C.R. K. Murti). John Wiley & Sons, Chichester, UK, pp. 29–40.
Bruun H. H. and Ten Brink D. J. (2008) Recruitment advantage oflarge seeds is greater in shaded habitats. Ecoscience 15, 498–507.
Buchmann N., Kao W.-Y. and Ehleringer J. (1997) Influence ofstand structure on carbon-13 of vegetation, soils, and canopyair within deciduous and evergreen forest in Utah, UnitedStates. Oecologia 110, 109–119.
Burnham R. J. and Johnson K. R. (2004) South Americanpalaeobotany and the origins of neotropical rainforests. Proc.
R. Soc. London, Ser. B 359, 1595–1610.Burnham R. J., Wing S. L. and Parker G. G. (1992) The reflection
of deciduous forest communities in leaf litter: implications forautochthonous litter assemblages from the fossil record.Paleobiology 18, 30–49.
Cerling T. E., Wynn J. G., Andaje S. A., Bird M. I., Kimutai KorirD., Levin N. E., Mace W., Macharia A. N., Quade J. andRemien C. H. (2011) Woody cover and hominin environmentsin the past 6 million years. Nature 476, 51–56.
Chazdon R. L. and Fetcher N. (1984) Photosynthetic lightenvironments in a lowland tropical rain forest in Costa Rica.J. Ecol. 72, 553–564.
Collister J. W., Rieley G., Stern B., Eglinton G. and Fry B. (1994)Compound-specific d13C analyses of leaf lipids from plants withdiffering carbon dioxide metabolisms. Org. Geochem. 21, 619–627.
Comstock J. P. and Ehleringer J. R. (1992) Plant adaptation in theGreat Basin and Colorado Plateau. Great Bas. Nat. 52, 192–215.
Condit R. G., Hubbell S. P., LaFrankie J. V., Sukumar R.,Manokaran N., Foster R. B. and Ashton P. S. (1996) Species-area and species-individual relationships for tropical trees – acomparison of three 50-ha plots. J. Ecol. 84, 549–562.
Condit R. G., Ashton P. S., Manokaran N., LaFrankie J. V.,Hubbell S. P. and Foster R. B. (1999) Dynamics of the forestcommunities at Pasoh and Barro Colorado: comparing two 50ha-plots. Philos. Trans. R. Soc. London, Ser. B 354, 1739–1748.
Coplen T. B., Brand W. A., Gehre M., Groning M., Meijer H. A.J., Toman B. and Verkouteren R. M. (2006) New guidelines ford13C measurements. Anal. Chem. 78, 2439–2441.
Davis C. C., Webb C. O., Wurdack K. J., Jaramillo C. A. andDonoghue M. J. (2005) Explosive radiation of Malpighialessupports a mid-Cretaceous origin of modern tropical rainforests. Am. Naturalist 165, E36–E65.
Diefendorf A. F., Mueller K. E., Wing S. L., Koch P. L. andFreeman K. H. (2010) Global patterns in leaf 13C discrimina-tion and implications for studies of past and future climate.Proc. Natl. Acad. Sci. U.S.A. 107, 5738–5743.
Diefendorf A. F., Freeman K. H., Wing S. L. and Graham H. V.(2011) Production of n- alkyl lipids in living plants andimplications for the geologic past. Geochim. Cosmochim. Acta
75, 7472–7485.Dilcher D. L. (1973) A paleoclimatic interpretation of the Eocene
floras of Southeastern North America. In Vegetation and
Vegetational History of Northern Latin America (ed. A. Gra-ham). Elsevier Pub. Co., Amsterdam, pp. 39–59.
Dillen S. Y., Marron N., Koch B. and Ceulemans R. (2008)Genetic variation of stomatal traits and carbon isotopediscrimination in two hybrid poplar families (Populus deltoides
‘S9-2 � P. nigra ‘Ghoy’ and P. deltoides ‘S9-2 � P. trichocarpa
‘V24’). Ann Botany 102, 399–407.Dimichele W. A. and Falcon-Lang H. J. (2011) Pennsylvanian
‘fossil forests’ in growth position (T-0 assemblages); origin,taphonomic bias and palaeoecological insights. J. Geol. Soc.
168, 585–605.Ehleringer J. R., Field C. B., Lin Z. and Kuo C. (1986) Leaf carbon
isotope and mineral composition in subtropical plants alongirradiance cline. Oecologia 70, 520–526.
Ehleringer J. R., Buchmann N. and Flanagan L. B. (2000) Carbonisotope ratios in belowground carbon cycle processes. Ecol.
Appl. 10, 412–422.Ellis B., Johnson K. R. and Dunn R. E. (1999) Evidence for an in
situ early Paleocene rainforest from Castle Rock, Colorado.Rocky Mountain Geol. 38, 73–100.
Ellsworth D. S. and Reich P. B. (1993) Canopy structure andvertical patterns of photosynthesis and related leaf traits in adeciduous forest. Oecologia 96, 169–178.
Eriksson O., Friis E. M. and Lofgren P. (2000) Seed size, fruit size,and dispersal systems in angiosperms from the early Cretaceousto the late Tertiary. Am. Naturalist 156, 47–58.
Fahey T., Siccama T., Driscoll C., Likens G., Campbell J., JohnsonC., Battles J., Aber J., Cole J., Fisk M., Groffman P., HamburgS., Holmes R., Schwarz P. and Yanai R. (2005) The biogeo-chemistry of carbon at Hubbard Brook. Biogeochemistry 75,109–176.
FAO (1999) State of the World’s Forests. Food and AgricultureOrganization of the United Nations, Rome.
Farquhar G. D., Ehleringer J. R. and Hubick K. T. (1989) Carbonisotope discrimination and photosynthesis. Ann. Rev. Physiol.
Plant Molec. Biol. 40, 503–537.Ferguson D. K. (1985) The origin of leaf assemblages - New light
on an old problem. Rev. Palaeobot. Palynol. 46, 117–188.

94 H.V. Graham et al. / Geochimica et Cosmochimica Acta 144 (2014) 82–95
Fricke H., Ellis B., Johnson K. R. and Jahren A. H. (2007) Carbonisotope characterization of the closed canopy (?) Castle Rockrainforest. Geol. Soc. Am. Ann. Meeting, Denver, CO. #6–10(abstr.).
Friis E. M., Crane P. R. and Pedersen K. R. (2011) Early Flowers
and Angiosperm Evolution. Cambridge University Press, Cam-bridge, UK.
Giambelluca T. W. (2002) Hydrology of altered tropical forest.Hydrol. Processes 16, 1665–1669.
Goulden M. L., Miller S. D., da Rocha H. R., Menton M. C., deFreitas H. C., de Silva Figueira A. M. and Dias de Sousa C. A.(2004) Diel and seasonal patterns of tropical forest CO2
exchange. Ecol. Appl. 14, S42–S54.Grace J., Lloyd J., McIntyre J., Miranda A. C., Meir P., Miranda
H. S., Nobre C. A., Moncrieff J., Massheder J., Yadvinder M.,Wright I. and Gash J. (1995) Carbon dioxide uptake by anundisturbed tropical rain forest in southwest Amazonia, 1992–1993. Science 11, 778–780.
Grocke D. R. (2002) The carbon isotope composition of ancientCO2 based on higher-plant organic matter. Philos. Trans. R.
Soc. London, Ser. A 360, 633–658.Hanba Y. T. S., Lei T. T., Koike T. and Wada E. (1997) Variations
in leaf d13C along a vertical profile of irradiance in a temperateJapanese forest. Oecologia 110, 253–261.
Johnson K. R. and Ellis B. (2002) A tropical rainforest in Colorado1.4 million years after the Cretaceous-Tertiary boundary.Science 296, 2379–2383.
Jordan C. F. and Uhl C. (1978) Biomass of a terra firme forest ofthe Amazon Basin. Ecol. Plant. 13, 387–400.
Keeling H. C. and Phillips O. L. (2007) The global relationshipbetween forest productivity and biomass. Global Ecol. Biogeogr.
16, 618–631.Koch P. L. (1998) Isotopic reconstruction of past continental
environments. Annu. Rev. Earth Planet. Sci. 26, 573–613.Kohyama T. (1993) Size-structured tree populations in gap-
dynamic forest; the forest architecture hypothesis for the stablecoexistence of species. J. Ecol. 81, 131–143.
Korner C. and Basler D. (2010) Phenology under global warming.Science 327, 1461–1462.
Kubiske M. E., Abrams M. D. and Mostoller S. A. (1996) Stomataland nonstomatal limitations of photosynthesis in relation to thedrought and shade tolerance of tree species in open andunderstory environments. Trees Struct. Funct. 11, 76–82.
Leigh E. G. (1975) Structure and climate in tropical rain forest.Annu. Rev. Ecol. Systematics 6, 67–86.
Leigh E. G. (1999) Tropical Forest Ecology: A View from Barro
Colorado Island. Oxford University Press, New York.Levin N. E., Brown F. H., Behrensmeyer A. K., Bobe R. and
Cerling T. E. (2011) Paleosol carbonates from the Omo Group:isotopic records of local and regional environmental change inEast Africa. Palaeogeogr. Palaeoclimatol. Palaeoecol. 307, 75–89.
Lockheart M. J., Van Bergen P. F. and Evershed R. P. (1997)Variations in the stable carbon isotope compositions ofindividual lipids from the leaves of modern angiosperms:implications for the study of higher land plant-derived sedi-mentary organic matter. Org. Geochem. 26, 137–153.
Lowman M. D. and Wittman P. K. (1996) Forest canopies:methods, hypotheses and future directions. Annu. Rev. Ecol.
Systematic 27, 55–81.Madhavan S., Treichel I. and O’Leary M. H. (1991) Effect of
relative humidity on carbon isotope fractionation in plants.Botany Acta 104, 292–294.
Madigosky S. R. (2004) Tropical microclimate consideration. InForest Canopies (eds. M. D. Lowman and H. B. Rinker).Elsevier Academic Press, Burlington, MA, pp. 24–48.
Magill C. R., Ashley G. M. and Freeman K. H. (2013) Water,plants, and early human habitats in eastern Africa. Proc. Natl.
Acad. Sci. U.S.A. 110, 1175–1180.Manokaran N. and LaFrankie J. V. (1990) Stand structure of
Pasoh Forest Reserve, a lowland rain forest in peninsularMalaysia. J. Tropical Forest Sci. 3, 14–24.
Mariotti A. and Peterschmitt E. (1994) Forest savanna ecotonedynamics in India as revealed by carbon isotope ratios of soilorganic matter. Oecologia 4, 475–480.
McClaren M. P. and McPherson G. R. (1995) Can soil organiccarbon isotopes be used to describe grass-tree dynamics at asavanna-grassland ecotone and within the savanna? J. Veg. Sci.
6, 857–862.Medina E. and Minchin P. (1980) Stratification of d13C values of
leaves in Amazonian rain forests. Oecologia 45, 377–378.Meir P., Kruijt B., Broadmeadow M., Barbosa E., Kull O.,
Carswell F., Nobre A. and Jarvis P. G. (2002) Acclimation ofphotosynthetic capacity to irradiance in tree canopies inrelation to leaf nitrogen concentration and leaf mass per unitarea. Plant Cell Environ. 25, 343–357.
Morley R. J. (2000) Origin and Evolution of Tropical Rain Forests.John Wiley & Sons, Chichester, UK.
Nadelhoffer K. J. and Fry B. (1988) Controls on natural nitrogen-15 and carbon-13 abundances in forest soil organic matter. Soil
Sci. Soc. Am. J. 52, 1633–1640.Niinemets U. (2007) Photosynthesis and resource distribution
through plant canopies. Plant Cell Environ. 30, 1052–1071.Niinemets U., Kull O. and Tenhunen J. D. (1999) Variability in leaf
morphology and chemical composition as a function of canopylight environment in coexisting deciduous trees. Int. J. Plant
Sci. 160, 837–848.Odum H. T. (1970) Summary: an emerging view of the ecological
system at El Verde. In A Tropical Rain Forest (eds. H. T. Odumand R. Pigeon). Division of Technical Information, U.S.Atomic Energy Commission, Washington, D.C., pp. I191–I289.
Ometto J. P. H. B., Ehleringer J. R., Domingues T. F., Berry J. A.,Ishida F. Y., Mazzi E., Higuchi N., Flanagan L. B., Nardoto G.B. and Martinelli L. A. (2006) The stable carbon and nitrogenisotopic composition of vegetation in tropical forests of theAmazon Basin, Brazil. Biogeochemistry 79, 251–274.
Osada N., Takeda H., Furukawa A. and Awang M. (2001) Leafdynamics and maintenance of tree crowns in a Malaysian rainforest stand. J. Ecol. 89, 774–782.
Ozanne C. M. P., Anhuf D., Boulter S. L., Keller M. and KitchingR. L. (2003) Biodiversity meets the atmosphere: global view offorest canopies. Science 301, 183–187.
Parker G. G. (1995) Structure and microclimate of forest canopies.In Forest Canopies (eds. M. D. Lowman and N. M. Nadkarni).Academic Press Inc., London, UK, pp. 73–106.
Parker G. G., O’Neill J. P. and Higman D. (1989) Vertical profileand canopy organization in a mixed deciduous forest. Vegatatio
85, 1–11.Pataki D. E., Ehleringer J. R., Flanagan L. B., Yakir D., Bowling
D. R., Still C. J., Buchmann N., Kaplan J. O. and Berry J. A.(2003) The application and interpretation of Keeling plots interrestrial carbon cycle research. Global Biogeochem. Cycles 17,1022–1029.
Polgar C. A. and Primack R. B. (2011) Leaf-out phenology oftemperate woody plants: from trees to ecosystems. New Phytol.
191, 926–941.Poorter H., Pepin S., Rijkers T., de Jong Y., Evans J. R. and
Korner C. (2006) Construction costs, chemical composition andpayback time of high- and low-irradiance leaves. J. Exp. Botany
57, 355–371.R Development Core Team (2008) R: A language and environment
for statistical computing. R Foundation for Statistical

H.V. Graham et al. / Geochimica et Cosmochimica Acta 144 (2014) 82–95 95
Computing, Vienna, Austria. ISBN 3-9000051-07-0, URLhttp://www.R-project.org.
Rasse D. P., Rumpel C. and Dignac M. F. (2005) Is soil carbonmostly root carbon? Mechanisms for a specific stabilisation.Plant Soil 269, 341–356.
Reich P. B., Uhl C., Walters M. B. and Ellsworth D. S. (1991) Leaflifespan as a determinant of leaf structure and function among23 Amazonian tree species. Oecologia 86, 16–24.
Richards P. W. (1996) The Tropical Rain Forest: An Ecological
Study, 2nd ed. Cambridge University Press, Cambridge, UK.Santiago L. S. (2003) Leaf traits of canopy trees on a precipitation
gradient in Panama: Integrating plant physiological ecologyand ecosystem science. Ph.D. thesis, University of Florida.
Santiago L. S. and Wright S. J. (2007) Leaf functional traits oftropical forest plants in relation to growth form. Funct. Ecol.
21, 19–27.Secord R., Wing S. L. and Chew A. (2008) Stable isotopes in early
Eocene mammals as indicators of forest canopy structure andresource partitioning. Paleobiology 34, 282–300.
Spicer R. A. (1980) The importance of depositional sorting to thebiostratigraphy of fossil plants. In Biostratigraphy of Fossil
Plants in Successional and Paleoecological Analyses (eds. D. L.Dilcher and T. N. Taylor). Hutchinson & Ross Inc., Strouds-burg, PA, pp. 171–183.
Sternberg L. D. L., Mulkey S. S. and Wright S. J. (1989) Ecologicalinterpretation of leaf carbon isotope ratios: influence of respiredcarbon dioxide. Ecology 70, 1317–1324.
Stewart G. R., Turnbull M. H., Schmidt S. and Erskine P. D.(1995) 13C natural abundance in plant communities along arainfall gradient: a biological integrator of water availability.Aust. J. Plant Physiol. 22, 51–55.
Sussman R. W. (2005) Primate origins and the evolution ofangiosperms. Am. J. Primatol. 23, 209–223.
Tiffney B. H. (1984) Seed size dispersal syndromes, and the rise ofthe angiosperms: evidence and hypothesis. Ann. MO Botanical
Garden 71, 551–576.Upchurch G. R. and Wolfe J. A. (1987) Mid-Cretaceous to early
Eocene vegetation and climate: evidence from fossil leaves andwoods. In The Origins of Angiosperms and their Biological
Consequences (eds. E. M. Friis, W. G. Chaloner and P. R.Crane). Cambridge University Press, Cambridge, UK, pp. 75–105.
van der Merwe N. J. and Medina E. (1989) Photosynthesis and13C/12C ratios in Amazonian rain forests. Geochim. Cosmochim.
Acta 53, 1091–1094.van Dijk A. I. J. M. and Keenan R. J. (2007) Planted forests and
water in perspective. Forest Ecol. Manage. 251, 1–9.Vogel J. C. (1978) Recycling of carbon in a forest environment.
Oecol. Plant. 13, 89–94.
Wilf P. (2000) Late Paleocene-early Eocene climate changes insouthwester Wyoming: paleobotanical analysis. Geol. Soc. Am.
Bull. 112, 292–307.Williams C. J., Johnson A. H., LePage B. A., Yann D. R. and
Sweda T. (2003) Reconstruction of Tertiary Metasequoia
forests. II. Structure, biomass, and productivity of Eocenefloodplain forests in the Canadian Arctic. Paleobiology 29, 271–292.
Wills C. and Condit R. (1990) Similar non-random processesmaintain diversity in two tropical rainforests. Proc. R. Soc.
London, Ser. B 266, 1445–1452.Wilson E. O. (1994) Naturalist. Island Press, Washington, DC.Wing S. L., Bown T. M. and Obradovich J. D. (1991) Early Eocene
biotic and climatic change in interior western North America.Geology 19, 1189–1192.
Wing S. L., Bao H. M. and Koch P. L. (2000) An early Eocene coolperiod? Evidence for continental cooling during the warmestpart of the Cenozoic. In Warm Climates in Earth History (eds.B. T. Huber, K. MacLeod and S. L. Wing). CambridgeUniversity Press, Cambridge, UK, pp. 197–237.
Wing S. L., Herrera F., Jaramillo C. A., Gomez-Navarro C., WilfP. and Labandeira C. C. (2009) Late Paleocene fossils from theCerrejon Formation, Colombia, are the earliest record ofNeotropical rainforest. Proc. Natl. Acad. Sci. U.S.A 106,18627–18632.
Wright I. J. and Cannon K. (2001) Relationships between leaflifespan and structural defenses in a low nutrient, sclerophyllflora. Funct. Ecol. 15, 351–359.
Wright S. J., Jaramillo M. A., Pavon J., Condit R., Hubbell P. B.and Foster R. B. (2005) Reproductive size thresholds in tropicaltrees: variation among individuals, species and forests. J. Trop.
Ecol. 21, 307–315.Wynn J. G. (2007) Carbon isotope fractionation during decompo-
sition of organic matter in soils and paleosols: implications forpaleoecological interpretations of paleosols. Palaeogeogr. Pal-
aeoclimatol. Palaeoecol. 251, 437–448.Wynn J. G. and Bird M. I. (2005) Rayleigh distillation and the
depth profile of 13C/12C ratios in soil organic carbon from twosoils in Iron Range National Park, Far North Queensland,Australia. Geochim. Cosmochim. Acta 69, 1961–1973.
Wynn J. G., Bird M. I., Vellen L., Grand-Clement E., Carter J. andBerry S. L. (2006) Continental scale measurements of the soilorganic carbon pool with climatic, edaphic, and biotic controls.Global Biogeochem. Cycles 20, GB1007, 1010.1029/2005GB002576.
Zimmerman J. K. and Ehleringer J. R. (1990) Carbon isotoperatios are correlated with irradiance levels in the Panamanianorchid Catasetum viridiflavum. Oecologia 83, 247–249.
Associate editor: Richard Pancost
Copyright © 2022 FDOKUMEN