Phosphorus Chemical Shifts in a Nucleic Acid Backbone from Combined Molecular Dynamics and Density...
10
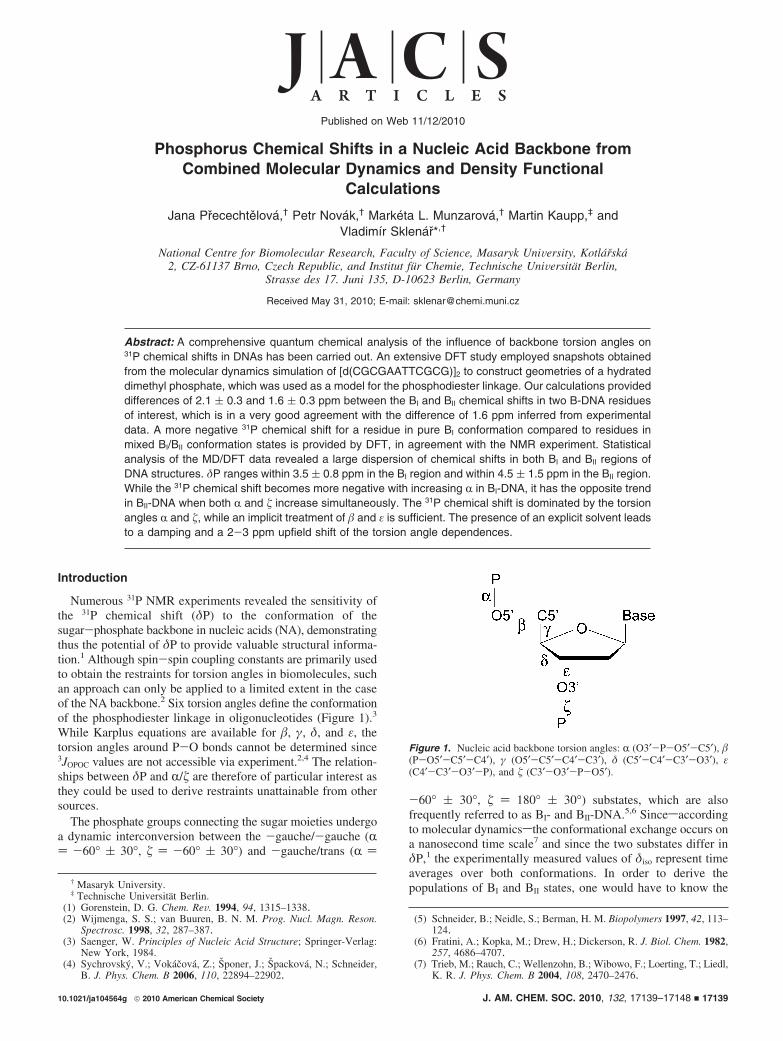
Phosphorus Chemical Shifts in a Nucleic Acid Backbone from Combined Molecular Dynamics and Density Functional Calculations JanaPrˇecechte ˇlova ´, † Petr Nova ´k, † Marke ´ta L. Munzarova ´, † Martin Kaupp, ‡ and Vladimı ´r Sklena ´ rˇ* ,† National Centre for Biomolecular Research, Faculty of Science, Masaryk UniVersity, Kotla ´r ˇska ´ 2, CZ-61137 Brno, Czech Republic, and Institut fu ¨r Chemie, Technische UniVersita ¨t Berlin, Strasse des 17. Juni 135, D-10623 Berlin, Germany Received May 31, 2010; E-mail: [email protected] Abstract: A comprehensive quantum chemical analysis of the influence of backbone torsion angles on 31 P chemical shifts in DNAs has been carried out. An extensive DFT study employed snapshots obtained from the molecular dynamics simulation of [d(CGCGAATTCGCG)] 2 to construct geometries of a hydrated dimethyl phosphate, which was used as a model for the phosphodiester linkage. Our calculations provided differences of 2.1 ( 0.3 and 1.6 ( 0.3 ppm between the B I and B II chemical shifts in two B-DNA residues of interest, which is in a very good agreement with the difference of 1.6 ppm inferred from experimental data. A more negative 31 P chemical shift for a residue in pure B I conformation compared to residues in mixed B I /B II conformation states is provided by DFT, in agreement with the NMR experiment. Statistical analysis of the MD/DFT data revealed a large dispersion of chemical shifts in both B I and B II regions of DNA structures. δP ranges within 3.5 ( 0.8 ppm in the B I region and within 4.5 ( 1.5 ppm in the B II region. While the 31 P chemical shift becomes more negative with increasing R in B I -DNA, it has the opposite trend in B II -DNA when both R and increase simultaneously. The 31 P chemical shift is dominated by the torsion angles R and , while an implicit treatment of and ε is sufficient. The presence of an explicit solvent leads to a damping and a 2-3 ppm upfield shift of the torsion angle dependences. Introduction Numerous 31 P NMR experiments revealed the sensitivity of the 31 P chemical shift (δP) to the conformation of the sugar-phosphate backbone in nucleic acids (NA), demonstrating thus the potential of δP to provide valuable structural informa- tion. 1 Although spin-spin coupling constants are primarily used to obtain the restraints for torsion angles in biomolecules, such an approach can only be applied to a limited extent in the case of the NA backbone. 2 Six torsion angles define the conformation of the phosphodiester linkage in oligonucleotides (Figure 1). 3 While Karplus equations are available for , γ, δ, and ε, the torsion angles around P-O bonds cannot be determined since 3 J OPOC values are not accessible via experiment. 2,4 The relation- ships between δP and R/ are therefore of particular interest as they could be used to derive restraints unattainable from other sources. The phosphate groups connecting the sugar moieties undergo a dynamic interconversion between the -gauche/-gauche (R )-60° ( 30°, )-60° ( 30°) and -gauche/trans (R) -60° ( 30°, ) 180° ( 30°) substates, which are also frequently referred to as B I - and B II -DNA. 5,6 Sincesaccording to molecular dynamicssthe conformational exchange occurs on a nanosecond time scale 7 and since the two substates differ in δP, 1 the experimentally measured values of δ iso represent time averages over both conformations. In order to derive the populations of B I and B II states, one would have to know the † Masaryk University. ‡ Technische Universita ¨t Berlin. (1) Gorenstein, D. G. Chem. ReV. 1994, 94, 1315–1338. (2) Wijmenga, S. S.; van Buuren, B. N. M. Prog. Nucl. Magn. Reson. Spectrosc. 1998, 32, 287–387. (3) Saenger, W. Principles of Nucleic Acid Structure; Springer-Verlag: New York, 1984. (4) Sychrovsky ´, V.; Voka ´c ˇova ´, Z.; S ˇ poner, J.; S ˇ packova ´, N.; Schneider, B. J. Phys. Chem. B 2006, 110, 22894–22902. (5) Schneider, B.; Neidle, S.; Berman, H. M. Biopolymers 1997, 42, 113– 124. (6) Fratini, A.; Kopka, M.; Drew, H.; Dickerson, R. J. Biol. Chem. 1982, 257, 4686–4707. (7) Trieb, M.; Rauch, C.; Wellenzohn, B.; Wibowo, F.; Loerting, T.; Liedl, K. R. J. Phys. Chem. B 2004, 108, 2470–2476. Figure 1. Nucleic acid backbone torsion angles: R (O3′-P-O5′-C5′), (P-O5′-C5′-C4′), γ (O5′-C5′-C4′-C3′), δ (C5′-C4′-C3′-O3′), ε (C4′-C3′-O3′-P), and (C3′-O3′-P-O5′). Published on Web 11/12/2010 10.1021/ja104564g 2010 American Chemical Society J. AM. CHEM. SOC. 2010, 132, 17139–17148 9 17139
-
Upload
independent -
Category
Documents
-
view
8 -
download
0
Transcript of Phosphorus Chemical Shifts in a Nucleic Acid Backbone from Combined Molecular Dynamics and Density...
Phosphorus Chemical Shifts in a Nucleic Acid Backbone fromCombined Molecular Dynamics and Density Functional
Calculations
Jana Precechtelova,† Petr Novak,† Marketa L. Munzarova,† Martin Kaupp,‡ andVladimır Sklenar*,†
National Centre for Biomolecular Research, Faculty of Science, Masaryk UniVersity, Kotlarska2, CZ-61137 Brno, Czech Republic, and Institut fur Chemie, Technische UniVersitat Berlin,
Strasse des 17. Juni 135, D-10623 Berlin, Germany
Received May 31, 2010; E-mail: [email protected]
Abstract: A comprehensive quantum chemical analysis of the influence of backbone torsion angles on31P chemical shifts in DNAs has been carried out. An extensive DFT study employed snapshots obtainedfrom the molecular dynamics simulation of [d(CGCGAATTCGCG)]2 to construct geometries of a hydrateddimethyl phosphate, which was used as a model for the phosphodiester linkage. Our calculations provideddifferences of 2.1 ( 0.3 and 1.6 ( 0.3 ppm between the BI and BII chemical shifts in two B-DNA residuesof interest, which is in a very good agreement with the difference of 1.6 ppm inferred from experimentaldata. A more negative 31P chemical shift for a residue in pure BI conformation compared to residues inmixed BI/BII conformation states is provided by DFT, in agreement with the NMR experiment. Statisticalanalysis of the MD/DFT data revealed a large dispersion of chemical shifts in both BI and BII regions ofDNA structures. δP ranges within 3.5 ( 0.8 ppm in the BI region and within 4.5 ( 1.5 ppm in the BII region.While the 31P chemical shift becomes more negative with increasing R in BI-DNA, it has the opposite trendin BII-DNA when both R and � increase simultaneously. The 31P chemical shift is dominated by the torsionangles R and �, while an implicit treatment of � and ε is sufficient. The presence of an explicit solvent leadsto a damping and a 2-3 ppm upfield shift of the torsion angle dependences.
Introduction
Numerous 31P NMR experiments revealed the sensitivity ofthe 31P chemical shift (δP) to the conformation of thesugar-phosphate backbone in nucleic acids (NA), demonstratingthus the potential of δP to provide valuable structural informa-tion.1 Although spin-spin coupling constants are primarily usedto obtain the restraints for torsion angles in biomolecules, suchan approach can only be applied to a limited extent in the caseof the NA backbone.2 Six torsion angles define the conformationof the phosphodiester linkage in oligonucleotides (Figure 1).3
While Karplus equations are available for �, γ, δ, and ε, thetorsion angles around P-O bonds cannot be determined since3JOPOC values are not accessible via experiment.2,4 The relation-ships between δP and R/� are therefore of particular interest asthey could be used to derive restraints unattainable from othersources.
The phosphate groups connecting the sugar moieties undergoa dynamic interconversion between the -gauche/-gauche (R) -60° ( 30°, � ) -60° ( 30°) and -gauche/trans (R )
-60° ( 30°, � ) 180° ( 30°) substates, which are alsofrequently referred to as BI- and BII-DNA.5,6 Sincesaccordingto molecular dynamicssthe conformational exchange occurs ona nanosecond time scale7 and since the two substates differ inδP,1 the experimentally measured values of δiso represent timeaverages over both conformations. In order to derive thepopulations of BI and BII states, one would have to know the
† Masaryk University.‡ Technische Universitat Berlin.
(1) Gorenstein, D. G. Chem. ReV. 1994, 94, 1315–1338.(2) Wijmenga, S. S.; van Buuren, B. N. M. Prog. Nucl. Magn. Reson.
Spectrosc. 1998, 32, 287–387.(3) Saenger, W. Principles of Nucleic Acid Structure; Springer-Verlag:
New York, 1984.(4) Sychrovsky, V.; Vokacova, Z.; Sponer, J.; Spackova, N.; Schneider,
B. J. Phys. Chem. B 2006, 110, 22894–22902.
(5) Schneider, B.; Neidle, S.; Berman, H. M. Biopolymers 1997, 42, 113–124.
(6) Fratini, A.; Kopka, M.; Drew, H.; Dickerson, R. J. Biol. Chem. 1982,257, 4686–4707.
(7) Trieb, M.; Rauch, C.; Wellenzohn, B.; Wibowo, F.; Loerting, T.; Liedl,K. R. J. Phys. Chem. B 2004, 108, 2470–2476.
Figure 1. Nucleic acid backbone torsion angles: R (O3′-P-O5′-C5′), �(P-O5′-C5′-C4′), γ (O5′-C5′-C4′-C3′), δ (C5′-C4′-C3′-O3′), ε(C4′-C3′-O3′-P), and � (C3′-O3′-P-O5′).
Published on Web 11/12/2010
10.1021/ja104564g 2010 American Chemical Society J. AM. CHEM. SOC. 2010, 132, 17139–17148 9 17139
chemical shift difference ∆δII,I ) δiso,II - δiso,I, where δiso,I andδiso,II are 31P chemical shifts of BI- and BII-DNA, respectively.The value of ∆δII,I cannot be obtained from experimentalmeasurements of B-DNA duplexes due to the aforementionedBITBII transitions nor from measurements of small compoundsdue to the absence of rigid -gauche/trans mononucleotides.Therefore, ∆δII,I has to be approximated by the value (1)obtained for other NA types, (2) estimated on the basis ofexperimental evidence, or (3) obtained from theoretical calcula-tions. Gorenstein used JH3′-P coupling constants, average valuesof ε, and a plot correlating δP with both ε and JH3′-P to estimateBI and BII chemical shifts and to determine experimental ∆δII,I
to be 1.6 ppm.1
Quantum chemical methods are well suited to examine thedependence of δP on backbone torsion angles and thus also toevaluate ∆δII,I. The first theoretical account of phosphoruschemical shielding in phosphates was published by Gorensteinand Kar in 1975.8 In their semiempirical approach, the authorsestablished a linear correlation between CNDO/2 phosphoruselectron densities and experimental chemical shifts. The cor-relation was then used to compute chemical shifts for variousconformations of dimethyl phosphate (DMP), resulting in achemical shielding-torsional angle contour map. Due to thelimited structural data used for defining the linear correlation,the map was considered as containing mainly qualitativeinformation. In particular, from the comparison of the 31Pchemical shift for an average -gauche/-gauche (gg) state withR ) -60°, � )-60° (-1 to -2 ppm) and an average -gauche/trans (gt) state with R ) -60°, � ) 180° (-12 ppm), it wasconcluded that a more negative shift corresponds to more opened(gt) conformations.
In 1979, the first nonempirical calculation was done by Pradoet al., who applied ab initio CHF method to study thegauche-gauche and gauche-trans conformations of DMP.9 Theauthors concluded that the conformational change between ggand gt forms is accompanied by a bond length and bond anglevariation that influences δP more than the change in the torsionangles themselves. Since the approach adopted (calculations onX-ray structures) did not allow a more natural, concertedtreatment of torsion angle, bond angle, and bond length changes,only a rough estimate of 4-6 ppm difference between the ggand gt conformations was made. When bond angle and bondlength variations were ignored, a gg vs gt difference of 1.5 ppmwas obtained, but the value was considered much too small bythe authors.
In 1984, using the same method, Giessner-Prettre et al.analyzed δP in terms of PO ester and CO torsion angles.10 Itwas concluded that both of these conformational parameterssubstantially contribute to the value of δP. The largest chemicalshielding was obtained when the methyl groups were staggeredwith respect to the PO bond, whereas the smallest shieldingresulted from an eclipsed arrangement. The important influenceof the CO torsion angles is further discussed in a 1987 reviewby Giessner-Prettre and Pullman.11 A simplified view that onlythe PO torsion angles dominantly influence the 31P chemicalshifts was presented in a 1994 review by Gorenstein.1 In this
work, the 1.5 ppm gg vs gt difference, computed but distrustedby Prado in 1979,9 was presented as the more reliable of possibleBI/BII differences in δP because of its closeness to theexperimental value of 1.6 ppm unknown at the time of thepublication by Prado et al. This agreement was probably ratherfortuitous, since only the gg conformation subjected to thequantum chemical calculations adopted the structural parametersfrom X-ray, while the gt conformation was obtained by a simplerotation around one bond without adjusting the bond lengthsand angles accordingly.9
In the absence of further quantum-chemical studies, thereclearly remain several open questions that prevent δP from beingused for the structure determination of DNAs. (1) Which ofthe theoretical BI/BII differences is relevant to experiment? (2)Are the PO torsion angles in nucleic acids (when coupled withthe corresponding change in the local geometry) dominant for31P chemical shifts? (3) How large is the spread of δP due tovariations in � and ε? These and other questions are addressedin the present work.
Apart from quantum-chemical studies, the 31P chemicalshift-structure relationships have been studied by analyzingNMR and X-ray data. In particular, linear correlations have beenobserved between the 31P chemical shifts and three recurrentinternucleotide distances as well as between these distances andthe difference of ε and �.12 The empirical correlations alreadyproved useful in deriving distance restraints for NMR structurecalculations.13 As such, they represent a crucial step in exploring31P chemical shielding-structure relationships and offer a viewcomplementary to the work presented here.
We have recently used density functional theory (DFT) tostudy the influence of both torsion angles and explicit solventon isotropic 31P chemical shifts in DNAs and RNAs.14,15
Clusters of DMP with six water molecules were employed tomodel the backbone phosphate groups and their first solvationshell. NMR calculations were performed with two types ofgeometry-optimized clusters, differing in the arrangements ofthe six water molecules around the phosphate anionic oxygens.The values of ∆δII,I obtained for the two static models amountedto 5.9 and 3.8 ppm. This considerably overestimates the 1.6ppm derived for DNAs by Gorenstein.1 Moreover, close energiesof DMP-water clusters indicated that the system could switchbetween the two and/or other arrangements of water moleculesin solution.
The static approach used previously suffers from a simplifiedsolvent description, an inclusion of both realistic and unrealistictorsion angle combinations, and the lack of backbone dynamics.These limitations of the static model can be overcome bycombining quantum chemical calculations with moleculardynamics (MD). The approach has been successfully used tocalculate EPR16-24 as well as NMR parameters.25 While forNMR of small molecules, ab initio MD could be employed,26-30
(8) Gorenstein, D. G.; Kar, D. Biochem. Biophys. Res. Commun. 1975,65, 1073–1080.
(9) Prado, F. R.; Giessner-Prettre, C.; Pullman, B.; Daudey, J. P. J. Am.Chem. Soc. 1979, 101, 1737–1742.
(10) Giessner-Prettre, C.; Pullman, B.; Prado, F. R.; Cheng, D. M.; Iuorno,V.; Ts’o, P. O. P. Biopolymers 1984, 23, 377–388.
(11) Giessner-Prettre, C.; Pullman, B. Q. ReV. Biophys. 1987, 20, 113–172.
(12) Heddi, B.; Foloppe, N.; Bouchemal, N.; Hantz, E.; Hartmann, B. J. Am.Chem. Soc. 2006, 128, 9170–9177.
(13) Abi-Ghanem, J.; Heddi, B.; Foloppe, N.; Hartmann, B. Nucleic AcidsRes. 2010, 38, e18.
(14) Precechtelova, J.; Munzarova, M. L.; Novak, P.; Sklenar, V. J. Phys.Chem. B 2007, 111, 2658–2667.
(15) Precechtelova, J.; Padrta, P.; Munzarova, M. L.; Sklenar, V. J. Phys.Chem. B 2008, 112, 3470–3478.
(16) Houriez, C.; Ferre, N.; Masella, M.; Siri, D. J. Chem. Phys. 2008,128, 244504.
(17) Pavone, M.; Benzi, C.; De Angelis, F.; Barone, V. Chem. Phys. Lett.2004, 395, 120–126.
(18) Pavone, M.; Cimino, P.; De Angelis, F.; Barone, V. J. Am. Chem.Soc. 2006, 128, 4338–4347.
17140 J. AM. CHEM. SOC. 9 VOL. 132, NO. 48, 2010
A R T I C L E S Precechtelova et al.
in the case of larger systems such as protein models, classicalMD was the method of choice.31-36
In this work, we combine MD with static DFT calculationsto address the following points. First, we examine the depen-dence of δP on the backbone torsion angles R and � usingconformational averaging to select realistic torsion anglecombinations. Second, we investigate how the instantaneoussolute-solvent interactions present in solution affect the trendsin δP due to changes in R and �. Third, we use the averagingof chemical shifts over the MD trajectory to determine thedifference in δP of BI and BII conformations. Finally, wecompare the results of the MD/DFT study with experiment aswell as with the results obtained for static models. Our systemof choice is a canonical B-DNA with the sequence [d(CGC-GAATTCGCG)]2, the Drew-Dickerson dodecamer (DD), thestructure of which has been studied extensively by both X-rayand NMR.37,38 To the best of our knowledge, this work is thefirst application of the MD/DFT approach to DNAs.
Methods and Computational Details
MD Simulation. Classical MD simulation of DD has beencarried out in explicit solvent using Amber 7.0 program suite,39
starting from the NMR structure 1NAJ.37 The system was neutral-ized using Na+ ions distributed using the Xleap module of Amberand defined by the force field parm99.40 The same parameters wereused for additional Na+ and Cl- ions added to 150 mM concentra-tion. A periodically repeating truncated octahedron water box ofsize 61 × 61 × 61 Å containing 5501 water molecules has been
employed. Constant pressure conditions (1 atm) and constanttemperature (300 K) maintained using the Berendsen weak-couplingtechnique41 with a time constant of 5.0 ps were used. The simulationutilized particle mesh Ewald summation42 with a 9 Å cutoff fornonbonding interactions and an integration step of 2 fs. Followinga 150-ps system equilibration, we performed a 24.0-ns MD run(consisting of 1-ns parts) with the recently implemented parmbsc043
force field. The latter is recommended to avoid a too-frequentpresence of artificial R/γ transitions found in the simulations withthe older parm99 force field.44
We employ classical MD (instead of the quantum MD) becauseof the size of the system studied. While classical force fields cansuffer from inaccuracies due to the neglect of charge transfer, theparmbsc0 force field employed in our work provides results thatare in a very good agreement with experiment in terms ofconformation and flexibility.45 We refer to recent studies coveringa broad range of oligomeric sequences of B-DNA (as well as variousRNAs, triplex DNA, and Z-DNA)43 and to a detailed analysis of amicrosecond simulation of the DD oligomer.46
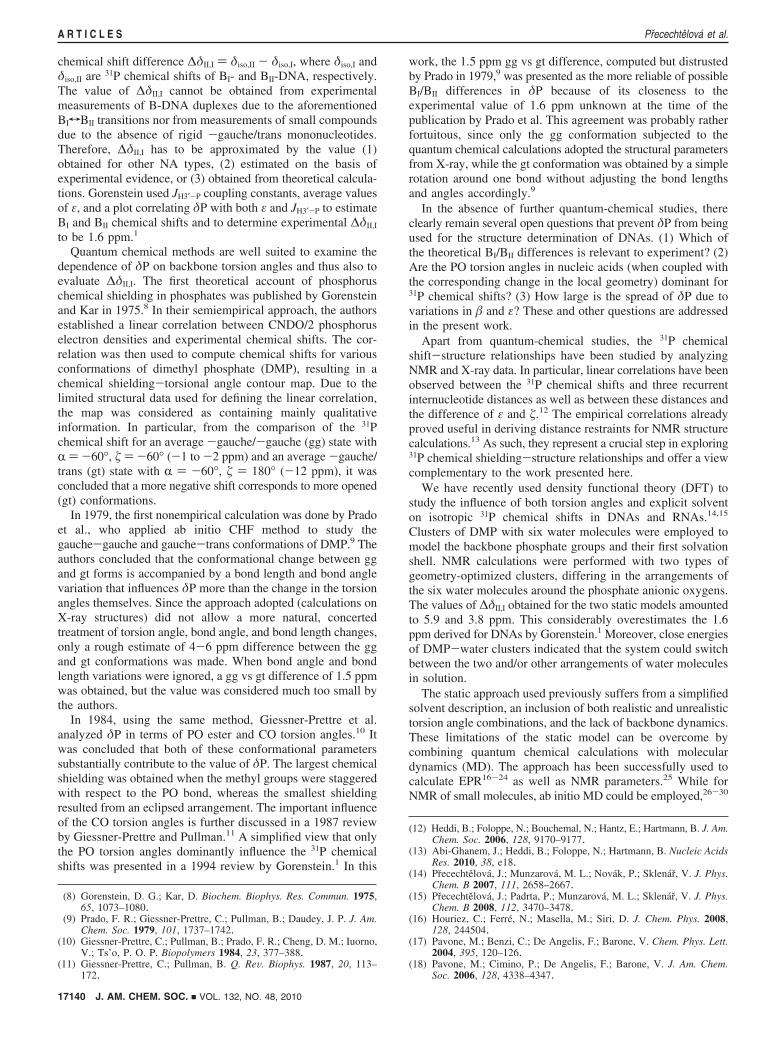
Molecular Geometries. MD snapshots have been extracted fromthe entire length of the 24-ns trajectory with a 4-ps time step. Clustermodels consisting of DMP and explicit water molecules (Figure2) were constructed from the G4pA5, C9pG10, and T7pT8 stepsof DD, which will from now on be abbreviated as residues G4,C9, and T7, respectively. The reasons for the selection will be givenin the Discussion. A total of 6000 geometries were obtained for allresidues studied except C9, for which the region between ∼16 000and ∼17 400 ps was excluded because of an R/γ switch. The clustermodels were cut out from the MD frames, saturating broken bondswith a H-atom bonded to a C-atom with a C-H bond length of1.09 Å. The clusters included only those water molecules directlyhydrogen-bonded to phosphate anionic oxygens. No water mol-ecules hydrogen-bonded to O3′ and O5′ have been considered sinceX-ray structures revealed that ester oxygens are only responsiblefor ∼15% of all phosphate-water contacts.47 The following criteria
(19) Brancato, G.; Rega, N.; Barone, V. J. Am. Chem. Soc. 2007, 129,15380–15390.
(20) Pauwels, E.; Verstraelen, T.; De Cooman, H.; Van Speybroeck, V.;Waroquier, M. J. Phys. Chem. B 2008, 112, 7618–7630.
(21) Asher, J. R.; Doltsinis, N. L.; Kaupp, M. J. Am. Chem. Soc. 2004,126, 9854–9861.
(22) Asher, J. R.; Doltsinis, N. L.; Kaupp, M. Magn. Reson. Chem. 2005,43, S237–S247.
(23) Asher, J. R.; Kaupp, M. ChemPhysChem 2007, 8, 69–79.(24) Asher, J. R.; Kaupp, M. Theor. Chem. Acc. 2008, 119, 477–487.(25) Searles, D. J.; Huber, H. Molecular Dynamics and NMR Parameter
Calculations. In Calculation of NMR and EPR Parameters: Principlesand Applications; Kaupp, M., Buhl, M., Malkin, V. G., Eds.; Wiley-WCH: Weinheim, 2004; pp 175-189.
(26) Pennanen, T. S.; Vaara, J.; Lantto, P.; Sillanpaa, A. J.; Laasonen, K.;Jokisaari, J. J. Am. Chem. Soc. 2004, 126, 11093–11102.
(27) Pennanen, T. S.; Lantto, P.; Sillanpaa, A. J.; Vaara, J. J. Phys. Chem.A 2007, 111, 182–192.
(28) Ramalho, T. C.; da Cunha, E. F. F.; de Alencastro, R. B. J. Phys.-Condens. Matter 2004, 16, 6159–6170.
(29) Dracınsky, M.; Kaminsky, J.; Bour, P. J. Phys. Chem. B 2009, 113,14698–14707.
(30) Dracınsky, M.; Bour, P. J. Chem. Theory Comput. 2010, 6, 288–299.(31) Woolf, T. B.; Malkin, V. G.; Malkina, O. L.; Salahub, D. R.; Roux,
B. Chem. Phys. Lett. 1995, 239, 186–194.(32) Scheurer, C.; Skrynnikov, N. R.; Lienin, S. F.; Straus, S. K.;
Bruschweiler, R.; Ernst, R. R. J. Am. Chem. Soc. 1999, 121, 4242–4251.
(33) Case, D. A.; Scheurer, C.; Bruschweiler, R. J. Am. Chem. Soc. 2000,122, 10390–10397.
(34) Markwick, P. R. L.; Sprangers, R.; Sattler, M. J. Am. Chem. Soc. 2003,125, 644–645.
(35) Markwick, P. R. L.; Sprangers, R.; Sattler, M. J. Am. Chem. Soc. 2003,125, 6337.
(36) Markwick, P. R. L.; Sattler, M. J. Am. Chem. Soc. 2004, 126, 11424–11425.
(37) Wu, Z.; Delaglio, F.; Tjandra, N.; Zhurkin, V. B.; Bax, A. J. Biomol.NMR 2003, 26, 297–315.
(38) Drew, H. R.; Wing, R. M.; Takano, T.; Broka, C.; Tanaka, S.; Itakura,K.; Dickerson, R. E. Proc. Natl. Acad. Sci. U.S.A. 1981, 78, 2179–2183.
(39) Case, D. A.; et al. AMBER 7; University of California: San Francisco,2002.
(40) Cheatham, T., III; Cieplak, P.; Kollman, P. J. Biomol. Struct. Dyn.1999, 16, 845–862.
(41) Berendsen, H. J. C.; Postma, J. P. M.; van Gunsteren, W. F.; DiNola,A.; Haak, J. R. J. Chem. Phys. 1984, 81, 3684–3690.
(42) Darden, T.; York, D.; Pedersen, L. J. Chem. Phys. 1993, 98, 10089–10092.
(43) Perez, A.; Marchan, I.; Svozil, D.; Sponer, J.; Cheatham, T. E., III;Laughton, C. A.; Orozco, M. Biophys. J. 2007, 92, 3817–3829.
(44) Varnai, P.; Djuranovic, D.; Lavery, R.; Hartmann, B. Nucleic AcidsRes. 2002, 30, 5398–5406.
(45) Lavery, R.; et al. Nucleic Acids Res. 2010, 38, 299–313.(46) Perez, A.; Luque, F. J.; Orozco, M. J. Am. Chem. Soc. 2007, 129,
14739–14745.(47) Schneider, B.; Patel, K.; Berman, H. M. Biophys. J. 1998, 75, 2422–
2434.
Figure 2. Cluster model composed of dimethyl phosphate and watermolecules of the first solvation shell hydrogen-bonded to the anionicphosphate oxygens.
J. AM. CHEM. SOC. 9 VOL. 132, NO. 48, 2010 17141
31P Chemical Shifts in a Nucleic Acid Backbone A R T I C L E S
were imposed to determine the presence of a hydrogen bond:R(PO · · ·Hw) e 2.25 Å and ∠(PO · · ·H-Ow) g 135°. For acomparison, we have also carried out calculations for DMP strippedof the coordinated water molecules. The geometries of the modelsextracted from the MD snapshots were used for NMR calculationswithout performing any structure optimization. Sodium ions werenot included in the model. While in principle the effect ofcounterions on the 31P chemical shift can be large in the case ofions directly coordinated to phosphates,48 the Na+ ions only interactwith the phosphate group through a water molecule.49,50 Theirexpected effect on δP is thus largely indirect51,52 and is alreadyincluded in the MD structures.
Chemical Shift Calculations. Chemical shifts for the modelsconstructed from the MD snapshots have been obtained at the DFTlevel, applying the gradient-corrected BP86 functional53,54 andlocally dense basis sets:55 IGLO-III basis sets56 for the phosphorusand oxygen atoms in DMP, and Gaussian-type DZVP orbital basissets57 for the methyl groups in the DMP and water molecules. TheRI-DFT approximation58 employed in the wave function calculationpart additionally required the use of TZVP and DZVP auxiliarybasis sets59-61 for density fitting. The systematic errors introducedby the use of locally dense basis sets instead of IGLO-III arenegligible and generally smaller than the systematic errors in δiso
resulting from the RI approximation, which amount to ∼0.5 ppmaccording to test calculations. The converged Kohn-Sham mo-lecular orbitals have been obtained in Turbomole5.662-64 uponimposing the following SCF convergence criteria: 1.10-8 au forenergy and 1.10-7 au for density.
Kohn-Sham orbitals obtained at the computational levelsdescribed above were transferred by Turbomole-to-Mag and Gauss-ian-to-Mag interface routines65 to the property module MAG ofthe ReSpect code.66 Chemical shift calculations in MAG employedsum-over-states density functional perturbation theory with theIGLO choice of the gauge origin (SOS-DFPT-IGLO).67 Molecular
orbitals were localized by the method of Boys,68 and the LOC1correction for the energy denominators was used.67 The chemicalshifts were referenced to 85% H3PO4 using PH3 as a secondarystandard following the method suggested by van Wullen,69
where X is the phosphorus atom in the model system of interestand 266.1 ppm is the difference between the absolute experimentalchemical shieldings of PH3 (594.5 ppm) and 85% H3PO4 (328.4ppm) at 300 K.70 The chemical shielding σ(PH3,calc) is 576.0 ppmat the BP86/IGLO-III level. The use of a secondary standard for31P has become a frequent method of choice, as the theoreticalchemical shielding for 85% H3PO4 is hard to obtain.71
Results and Discussion
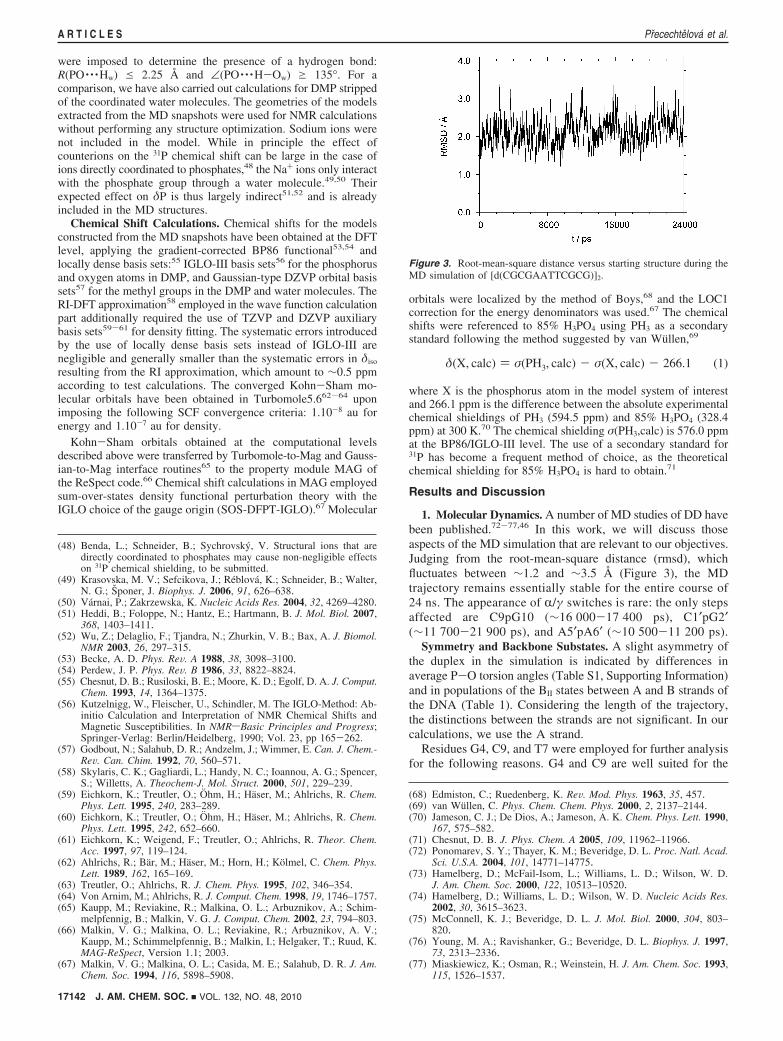
1. Molecular Dynamics. A number of MD studies of DD havebeen published.72-77,46 In this work, we will discuss thoseaspects of the MD simulation that are relevant to our objectives.Judging from the root-mean-square distance (rmsd), whichfluctuates between ∼1.2 and ∼3.5 Å (Figure 3), the MDtrajectory remains essentially stable for the entire course of24 ns. The appearance of R/γ switches is rare: the only stepsaffected are C9pG10 (∼16 000-17 400 ps), C1′pG2′(∼11 700-21 900 ps), and A5′pA6′ (∼10 500-11 200 ps).
Symmetry and Backbone Substates. A slight asymmetry ofthe duplex in the simulation is indicated by differences inaverage P-O torsion angles (Table S1, Supporting Information)and in populations of the BII states between A and B strands ofthe DNA (Table 1). Considering the length of the trajectory,the distinctions between the strands are not significant. In ourcalculations, we use the A strand.
Residues G4, C9, and T7 were employed for further analysisfor the following reasons. G4 and C9 are well suited for the
(48) Benda, L.; Schneider, B.; Sychrovsky, V. Structural ions that aredirectly coordinated to phosphates may cause non-negligible effectson 31P chemical shielding, to be submitted.
(49) Krasovska, M. V.; Sefcikova, J.; Reblova, K.; Schneider, B.; Walter,N. G.; Sponer, J. Biophys. J. 2006, 91, 626–638.
(50) Varnai, P.; Zakrzewska, K. Nucleic Acids Res. 2004, 32, 4269–4280.(51) Heddi, B.; Foloppe, N.; Hantz, E.; Hartmann, B. J. Mol. Biol. 2007,
368, 1403–1411.(52) Wu, Z.; Delaglio, F.; Tjandra, N.; Zhurkin, V. B.; Bax, A. J. Biomol.
NMR 2003, 26, 297–315.(53) Becke, A. D. Phys. ReV. A 1988, 38, 3098–3100.(54) Perdew, J. P. Phys. ReV. B 1986, 33, 8822–8824.(55) Chesnut, D. B.; Rusiloski, B. E.; Moore, K. D.; Egolf, D. A. J. Comput.
Chem. 1993, 14, 1364–1375.(56) Kutzelnigg, W., Fleischer, U., Schindler, M. The IGLO-Method: Ab-
initio Calculation and Interpretation of NMR Chemical Shifts andMagnetic Susceptibilities. In NMRsBasic Principles and Progress;Springer-Verlag: Berlin/Heidelberg, 1990; Vol. 23, pp 165-262.
(57) Godbout, N.; Salahub, D. R.; Andzelm, J.; Wimmer, E. Can. J. Chem.-ReV. Can. Chim. 1992, 70, 560–571.
(58) Skylaris, C. K.; Gagliardi, L.; Handy, N. C.; Ioannou, A. G.; Spencer,S.; Willetts, A. Theochem-J. Mol. Struct. 2000, 501, 229–239.
(59) Eichkorn, K.; Treutler, O.; Ohm, H.; Haser, M.; Ahlrichs, R. Chem.Phys. Lett. 1995, 240, 283–289.
(60) Eichkorn, K.; Treutler, O.; Ohm, H.; Haser, M.; Ahlrichs, R. Chem.Phys. Lett. 1995, 242, 652–660.
(61) Eichkorn, K.; Weigend, F.; Treutler, O.; Ahlrichs, R. Theor. Chem.Acc. 1997, 97, 119–124.
(62) Ahlrichs, R.; Bar, M.; Haser, M.; Horn, H.; Kolmel, C. Chem. Phys.Lett. 1989, 162, 165–169.
(63) Treutler, O.; Ahlrichs, R. J. Chem. Phys. 1995, 102, 346–354.(64) Von Arnim, M.; Ahlrichs, R. J. Comput. Chem. 1998, 19, 1746–1757.(65) Kaupp, M.; Reviakine, R.; Malkina, O. L.; Arbuznikov, A.; Schim-
melpfennig, B.; Malkin, V. G. J. Comput. Chem. 2002, 23, 794–803.(66) Malkin, V. G.; Malkina, O. L.; Reviakine, R.; Arbuznikov, A. V.;
Kaupp, M.; Schimmelpfennig, B.; Malkin, I.; Helgaker, T.; Ruud, K.MAG-ReSpect, Version 1.1; 2003.
(67) Malkin, V. G.; Malkina, O. L.; Casida, M. E.; Salahub, D. R. J. Am.Chem. Soc. 1994, 116, 5898–5908.
(68) Edmiston, C.; Ruedenberg, K. ReV. Mod. Phys. 1963, 35, 457.(69) van Wullen, C. Phys. Chem. Chem. Phys. 2000, 2, 2137–2144.(70) Jameson, C. J.; De Dios, A.; Jameson, A. K. Chem. Phys. Lett. 1990,
167, 575–582.(71) Chesnut, D. B. J. Phys. Chem. A 2005, 109, 11962–11966.(72) Ponomarev, S. Y.; Thayer, K. M.; Beveridge, D. L. Proc. Natl. Acad.
Sci. U.S.A. 2004, 101, 14771–14775.(73) Hamelberg, D.; McFail-Isom, L.; Williams, L. D.; Wilson, W. D.
J. Am. Chem. Soc. 2000, 122, 10513–10520.(74) Hamelberg, D.; Williams, L. D.; Wilson, W. D. Nucleic Acids Res.
2002, 30, 3615–3623.(75) McConnell, K. J.; Beveridge, D. L. J. Mol. Biol. 2000, 304, 803–
820.(76) Young, M. A.; Ravishanker, G.; Beveridge, D. L. Biophys. J. 1997,
73, 2313–2336.(77) Miaskiewicz, K.; Osman, R.; Weinstein, H. J. Am. Chem. Soc. 1993,
115, 1526–1537.
Figure 3. Root-mean-square distance versus starting structure during theMD simulation of [d(CGCGAATTCGCG)]2.
δ(X, calc) ) σ(PH3, calc) - σ(X, calc) - 266.1 (1)
17142 J. AM. CHEM. SOC. 9 VOL. 132, NO. 48, 2010
A R T I C L E S Precechtelova et al.
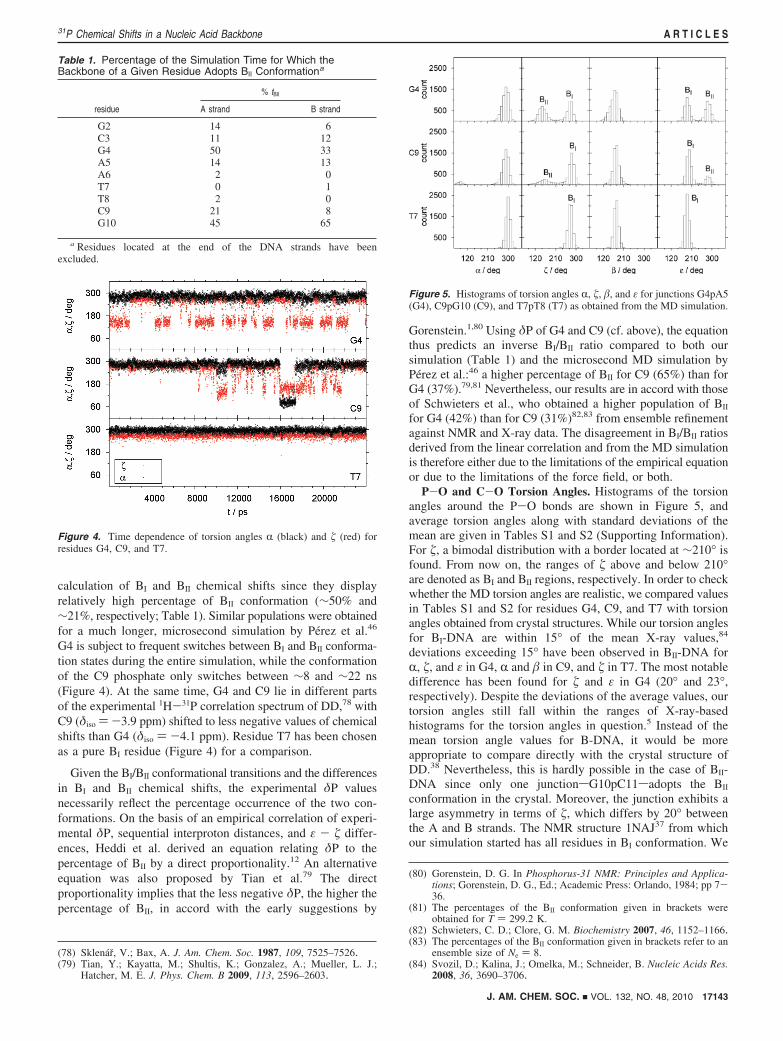
calculation of BI and BII chemical shifts since they displayrelatively high percentage of BII conformation (∼50% and∼21%, respectively; Table 1). Similar populations were obtainedfor a much longer, microsecond simulation by Perez et al.46
G4 is subject to frequent switches between BI and BII conforma-tion states during the entire simulation, while the conformationof the C9 phosphate only switches between ∼8 and ∼22 ns(Figure 4). At the same time, G4 and C9 lie in different partsof the experimental 1H-31P correlation spectrum of DD,78 withC9 (δiso )-3.9 ppm) shifted to less negative values of chemicalshifts than G4 (δiso ) -4.1 ppm). Residue T7 has been chosenas a pure BI residue (Figure 4) for a comparison.
Given the BI/BII conformational transitions and the differencesin BI and BII chemical shifts, the experimental δP valuesnecessarily reflect the percentage occurrence of the two con-formations. On the basis of an empirical correlation of experi-mental δP, sequential interproton distances, and ε - � differ-ences, Heddi et al. derived an equation relating δP to thepercentage of BII by a direct proportionality.12 An alternativeequation was also proposed by Tian et al.79 The directproportionality implies that the less negative δP, the higher thepercentage of BII, in accord with the early suggestions by
Gorenstein.1,80 Using δP of G4 and C9 (cf. above), the equationthus predicts an inverse BI/BII ratio compared to both oursimulation (Table 1) and the microsecond MD simulation byPerez et al.:46 a higher percentage of BII for C9 (65%) than forG4 (37%).79,81 Nevertheless, our results are in accord with thoseof Schwieters et al., who obtained a higher population of BII
for G4 (42%) than for C9 (31%)82,83 from ensemble refinementagainst NMR and X-ray data. The disagreement in BI/BII ratiosderived from the linear correlation and from the MD simulationis therefore either due to the limitations of the empirical equationor due to the limitations of the force field, or both.
P-O and C-O Torsion Angles. Histograms of the torsionangles around the P-O bonds are shown in Figure 5, andaverage torsion angles along with standard deviations of themean are given in Tables S1 and S2 (Supporting Information).For �, a bimodal distribution with a border located at ∼210° isfound. From now on, the ranges of � above and below 210°are denoted as BI and BII regions, respectively. In order to checkwhether the MD torsion angles are realistic, we compared valuesin Tables S1 and S2 for residues G4, C9, and T7 with torsionangles obtained from crystal structures. While our torsion anglesfor BI-DNA are within 15° of the mean X-ray values,84
deviations exceeding 15° have been observed in BII-DNA forR, �, and ε in G4, R and � in C9, and � in T7. The most notabledifference has been found for � and ε in G4 (20° and 23°,respectively). Despite the deviations of the average values, ourtorsion angles still fall within the ranges of X-ray-basedhistograms for the torsion angles in question.5 Instead of themean torsion angle values for B-DNA, it would be moreappropriate to compare directly with the crystal structure ofDD.38 Nevertheless, this is hardly possible in the case of BII-DNA since only one junctionsG10pC11sadopts the BII
conformation in the crystal. Moreover, the junction exhibits alarge asymmetry in terms of �, which differs by 20° betweenthe A and B strands. The NMR structure 1NAJ37 from whichour simulation started has all residues in BI conformation. We
(78) Sklenar, V.; Bax, A. J. Am. Chem. Soc. 1987, 109, 7525–7526.(79) Tian, Y.; Kayatta, M.; Shultis, K.; Gonzalez, A.; Mueller, L. J.;
Hatcher, M. E. J. Phys. Chem. B 2009, 113, 2596–2603.
(80) Gorenstein, D. G. In Phosphorus-31 NMR: Principles and Applica-tions; Gorenstein, D. G., Ed.; Academic Press: Orlando, 1984; pp 7-36.
(81) The percentages of the BII conformation given in brackets wereobtained for T ) 299.2 K.
(82) Schwieters, C. D.; Clore, G. M. Biochemistry 2007, 46, 1152–1166.(83) The percentages of the BII conformation given in brackets refer to an
ensemble size of Ne ) 8.(84) Svozil, D.; Kalina, J.; Omelka, M.; Schneider, B. Nucleic Acids Res.
2008, 36, 3690–3706.
Table 1. Percentage of the Simulation Time for Which theBackbone of a Given Residue Adopts BII Conformationa
% tBII
residue A strand B strand
G2 14 6C3 11 12G4 50 33A5 14 13A6 2 0T7 0 1T8 2 0C9 21 8G10 45 65
a Residues located at the end of the DNA strands have beenexcluded.
Figure 4. Time dependence of torsion angles R (black) and � (red) forresidues G4, C9, and T7.
Figure 5. Histograms of torsion angles R, �, �, and ε for junctions G4pA5(G4), C9pG10 (C9), and T7pT8 (T7) as obtained from the MD simulation.
J. AM. CHEM. SOC. 9 VOL. 132, NO. 48, 2010 17143
31P Chemical Shifts in a Nucleic Acid Backbone A R T I C L E S
therefore conclude by summarizing that our torsion angles forBI agree well with the X-ray data, whereas those for BII maybe slightly biased by the force field. However, the validationof MD torsion angles against the crystal structure is hamperedby the absence of the relevant information for the BII conforma-tion in DD.
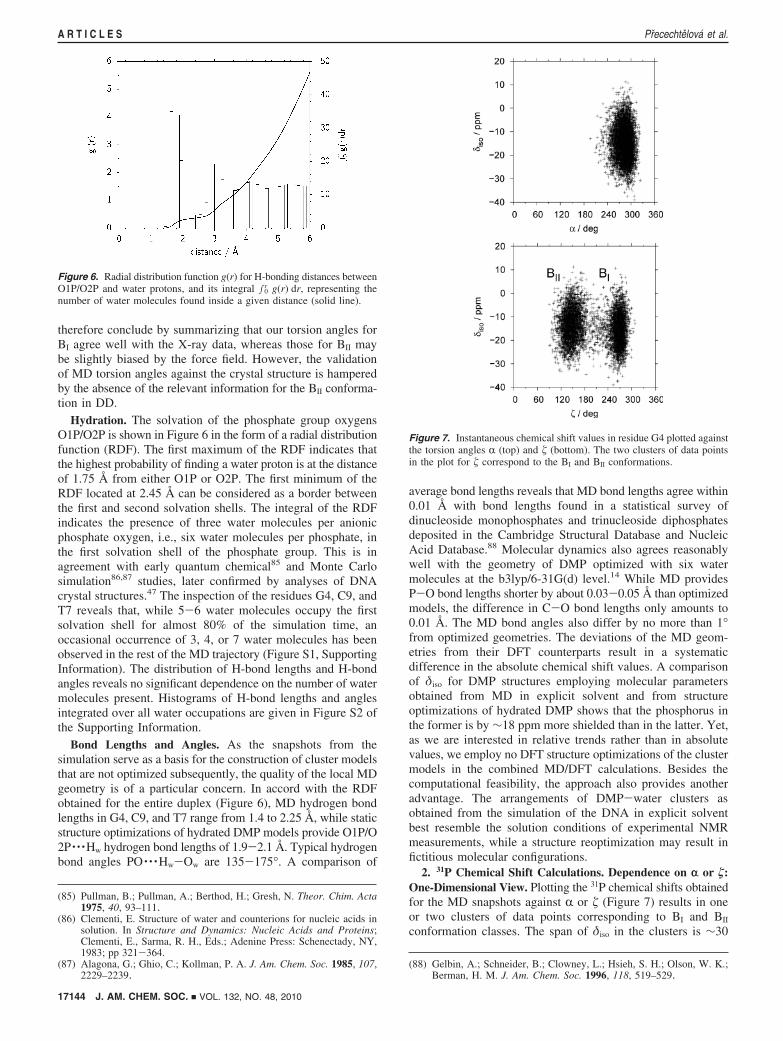
Hydration. The solvation of the phosphate group oxygensO1P/O2P is shown in Figure 6 in the form of a radial distributionfunction (RDF). The first maximum of the RDF indicates thatthe highest probability of finding a water proton is at the distanceof 1.75 Å from either O1P or O2P. The first minimum of theRDF located at 2.45 Å can be considered as a border betweenthe first and second solvation shells. The integral of the RDFindicates the presence of three water molecules per anionicphosphate oxygen, i.e., six water molecules per phosphate, inthe first solvation shell of the phosphate group. This is inagreement with early quantum chemical85 and Monte Carlosimulation86,87 studies, later confirmed by analyses of DNAcrystal structures.47 The inspection of the residues G4, C9, andT7 reveals that, while 5-6 water molecules occupy the firstsolvation shell for almost 80% of the simulation time, anoccasional occurrence of 3, 4, or 7 water molecules has beenobserved in the rest of the MD trajectory (Figure S1, SupportingInformation). The distribution of H-bond lengths and H-bondangles reveals no significant dependence on the number of watermolecules present. Histograms of H-bond lengths and anglesintegrated over all water occupations are given in Figure S2 ofthe Supporting Information.
Bond Lengths and Angles. As the snapshots from thesimulation serve as a basis for the construction of cluster modelsthat are not optimized subsequently, the quality of the local MDgeometry is of a particular concern. In accord with the RDFobtained for the entire duplex (Figure 6), MD hydrogen bondlengths in G4, C9, and T7 range from 1.4 to 2.25 Å, while staticstructure optimizations of hydrated DMP models provide O1P/O2P · · ·Hw hydrogen bond lengths of 1.9-2.1 Å. Typical hydrogenbond angles PO · · ·Hw-Ow are 135-175°. A comparison of
average bond lengths reveals that MD bond lengths agree within0.01 Å with bond lengths found in a statistical survey ofdinucleoside monophosphates and trinucleoside diphosphatesdeposited in the Cambridge Structural Database and NucleicAcid Database.88 Molecular dynamics also agrees reasonablywell with the geometry of DMP optimized with six watermolecules at the b3lyp/6-31G(d) level.14 While MD providesP-O bond lengths shorter by about 0.03-0.05 Å than optimizedmodels, the difference in C-O bond lengths only amounts to0.01 Å. The MD bond angles also differ by no more than 1°from optimized geometries. The deviations of the MD geom-etries from their DFT counterparts result in a systematicdifference in the absolute chemical shift values. A comparisonof δiso for DMP structures employing molecular parametersobtained from MD in explicit solvent and from structureoptimizations of hydrated DMP shows that the phosphorus inthe former is by ∼18 ppm more shielded than in the latter. Yet,as we are interested in relative trends rather than in absolutevalues, we employ no DFT structure optimizations of the clustermodels in the combined MD/DFT calculations. Besides thecomputational feasibility, the approach also provides anotheradvantage. The arrangements of DMP-water clusters asobtained from the simulation of the DNA in explicit solventbest resemble the solution conditions of experimental NMRmeasurements, while a structure reoptimization may result infictitious molecular configurations.
2. 31P Chemical Shift Calculations. Dependence on r or �:One-Dimensional View. Plotting the 31P chemical shifts obtainedfor the MD snapshots against R or � (Figure 7) results in oneor two clusters of data points corresponding to BI and BII
conformation classes. The span of δiso in the clusters is ∼30
(85) Pullman, B.; Pullman, A.; Berthod, H.; Gresh, N. Theor. Chim. Acta1975, 40, 93–111.
(86) Clementi, E. Structure of water and counterions for nucleic acids insolution. In Structure and Dynamics: Nucleic Acids and Proteins;Clementi, E., Sarma, R. H., Eds.; Adenine Press: Schenectady, NY,1983; pp 321-364.
(87) Alagona, G.; Ghio, C.; Kollman, P. A. J. Am. Chem. Soc. 1985, 107,2229–2239.
(88) Gelbin, A.; Schneider, B.; Clowney, L.; Hsieh, S. H.; Olson, W. K.;Berman, H. M. J. Am. Chem. Soc. 1996, 118, 519–529.
Figure 6. Radial distribution function g(r) for H-bonding distances betweenO1P/O2P and water protons, and its integral ∫0
r g(r) dr, representing thenumber of water molecules found inside a given distance (solid line).
Figure 7. Instantaneous chemical shift values in residue G4 plotted againstthe torsion angles R (top) and � (bottom). The two clusters of data pointsin the plot for � correspond to the BI and BII conformations.
17144 J. AM. CHEM. SOC. 9 VOL. 132, NO. 48, 2010
A R T I C L E S Precechtelova et al.
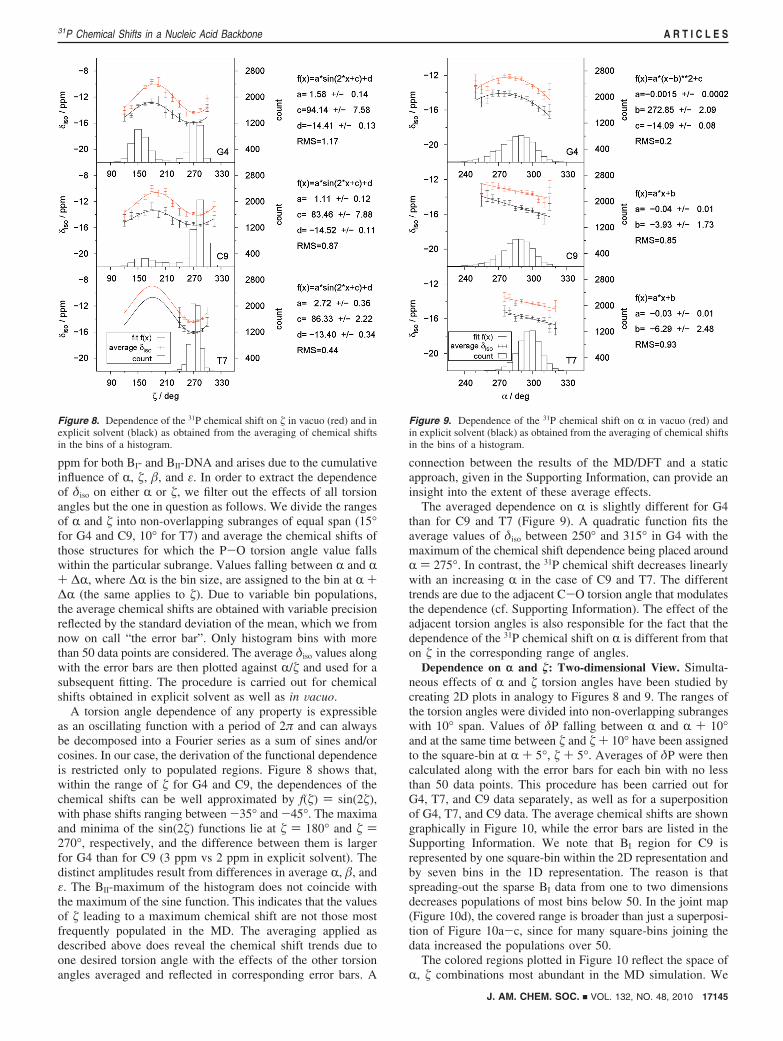
ppm for both BI- and BII-DNA and arises due to the cumulativeinfluence of R, �, �, and ε. In order to extract the dependenceof δiso on either R or �, we filter out the effects of all torsionangles but the one in question as follows. We divide the rangesof R and � into non-overlapping subranges of equal span (15°for G4 and C9, 10° for T7) and average the chemical shifts ofthose structures for which the P-O torsion angle value fallswithin the particular subrange. Values falling between R and R+ ∆R, where ∆R is the bin size, are assigned to the bin at R +∆R (the same applies to �). Due to variable bin populations,the average chemical shifts are obtained with variable precisionreflected by the standard deviation of the mean, which we fromnow on call “the error bar”. Only histogram bins with morethan 50 data points are considered. The average δiso values alongwith the error bars are then plotted against R/� and used for asubsequent fitting. The procedure is carried out for chemicalshifts obtained in explicit solvent as well as in Vacuo.
A torsion angle dependence of any property is expressibleas an oscillating function with a period of 2π and can alwaysbe decomposed into a Fourier series as a sum of sines and/orcosines. In our case, the derivation of the functional dependenceis restricted only to populated regions. Figure 8 shows that,within the range of � for G4 and C9, the dependences of thechemical shifts can be well approximated by f(�) ) sin(2�),with phase shifts ranging between -35° and -45°. The maximaand minima of the sin(2�) functions lie at � ) 180° and � )270°, respectively, and the difference between them is largerfor G4 than for C9 (3 ppm vs 2 ppm in explicit solvent). Thedistinct amplitudes result from differences in average R, �, andε. The BII-maximum of the histogram does not coincide withthe maximum of the sine function. This indicates that the valuesof � leading to a maximum chemical shift are not those mostfrequently populated in the MD. The averaging applied asdescribed above does reveal the chemical shift trends due toone desired torsion angle with the effects of the other torsionangles averaged and reflected in corresponding error bars. A
connection between the results of the MD/DFT and a staticapproach, given in the Supporting Information, can provide aninsight into the extent of these average effects.
The averaged dependence on R is slightly different for G4than for C9 and T7 (Figure 9). A quadratic function fits theaverage values of δiso between 250° and 315° in G4 with themaximum of the chemical shift dependence being placed aroundR ) 275°. In contrast, the 31P chemical shift decreases linearlywith an increasing R in the case of C9 and T7. The differenttrends are due to the adjacent C-O torsion angle that modulatesthe dependence (cf. Supporting Information). The effect of theadjacent torsion angles is also responsible for the fact that thedependence of the 31P chemical shift on R is different from thaton � in the corresponding range of angles.
Dependence on r and �: Two-dimensional View. Simulta-neous effects of R and � torsion angles have been studied bycreating 2D plots in analogy to Figures 8 and 9. The ranges ofthe torsion angles were divided into non-overlapping subrangeswith 10° span. Values of δP falling between R and R + 10°and at the same time between � and � + 10° have been assignedto the square-bin at R + 5°, � + 5°. Averages of δP were thencalculated along with the error bars for each bin with no lessthan 50 data points. This procedure has been carried out forG4, T7, and C9 data separately, as well as for a superpositionof G4, T7, and C9 data. The average chemical shifts are showngraphically in Figure 10, while the error bars are listed in theSupporting Information. We note that BI region for C9 isrepresented by one square-bin within the 2D representation andby seven bins in the 1D representation. The reason is thatspreading-out the sparse BI data from one to two dimensionsdecreases populations of most bins below 50. In the joint map(Figure 10d), the covered range is broader than just a superposi-tion of Figure 10a-c, since for many square-bins joining thedata increased the populations over 50.
The colored regions plotted in Figure 10 reflect the space ofR, � combinations most abundant in the MD simulation. We
Figure 8. Dependence of the 31P chemical shift on � in vacuo (red) and inexplicit solvent (black) as obtained from the averaging of chemical shiftsin the bins of a histogram.
Figure 9. Dependence of the 31P chemical shift on R in vacuo (red) andin explicit solvent (black) as obtained from the averaging of chemical shiftsin the bins of a histogram.
J. AM. CHEM. SOC. 9 VOL. 132, NO. 48, 2010 17145
31P Chemical Shifts in a Nucleic Acid Backbone A R T I C L E S
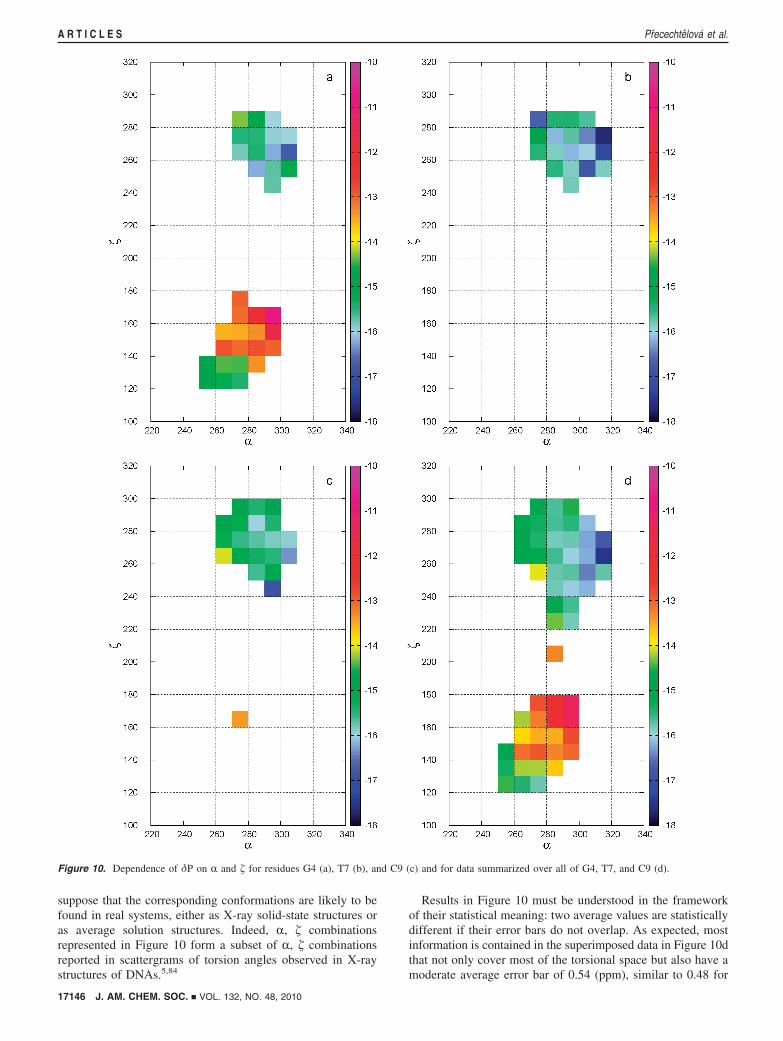
suppose that the corresponding conformations are likely to befound in real systems, either as X-ray solid-state structures oras average solution structures. Indeed, R, � combinationsrepresented in Figure 10 form a subset of R, � combinationsreported in scattergrams of torsion angles observed in X-raystructures of DNAs.5,84
Results in Figure 10 must be understood in the frameworkof their statistical meaning: two average values are statisticallydifferent if their error bars do not overlap. As expected, mostinformation is contained in the superimposed data in Figure 10dthat not only cover most of the torsional space but also have amoderate average error bar of 0.54 (ppm), similar to 0.48 for
Figure 10. Dependence of δP on R and � for residues G4 (a), T7 (b), and C9 (c) and for data summarized over all of G4, T7, and C9 (d).
17146 J. AM. CHEM. SOC. 9 VOL. 132, NO. 48, 2010
A R T I C L E S Precechtelova et al.
T7, and smaller than 0.61 for both G4 and C9. Comparing thecolor distributions, data for G4, T7, and C9 are similar in thatthe most negative chemical shifts are obtained for high valuesof R. However, some of the T7 data are shifted toward morenegative values (as found also in the 1D fits, compare withFigure 9). This systematic shift can be a reflection of a changein � and/or ε distribution, which is narrower for T7 than forG4 and C9 (Figure 5). We can thus trace again the perspectiveof dominating R, � and modulating �, ε.
Figure 10 (along with the average δP and the error bars inthe Supporting Information) reveals that the least negativechemical shift predicted by our calculations is -11.3 ( 0.9 ppm,and it is obtained for BII structures with combinations of thehighest R with the highest � (R between 290° and 300°, �between 170° and 180°). Starting from this δP value, thechemical shift in the BII region of Figure 10d decreasesapproximately along the diagonal to -15.8 ( 0.8 ppm. Incontrast, the least negative BI value of δP is -14.0 ( 0.7 ppmfor low R (270-280°) and moderate � (250-260°) combina-tions. δP in the BI region then decreases with increasing R,leading to the most negative chemical shift of -17.5 ( 0.5 ppmfor BI structures with high R (310-320°) and moderate �(260-270°). We thus obtain the range of 3.5 ( 0.8 ppm in theBI region and the range of 4.5 ( 1.5 ppm in the BII region, andan overall range of 6.2 ( 1.0 ppm in the BI + BII region.
Dependence on � and ε. The effect of � and ε on the 31Pchemical shift determined for a 360° rotation around a C-Obond is large (up to ∼3 ppm), yet smaller than that of R and �(∼14 ppm, cf. Figure S3 in the Supporting Information). Thisis in a qualitative agreement with the early results by Giessner-Prettre et al.10 In contrast to the free rotation, the torsion anglesin the MD simulation are confined to boundaries inherent tothe flexibility of the B-DNA. In such a case, the effect of � andε within the averaging approach is less than or equal to theerror bar for a given square bin, since the error bar accountsfor the variations of δP introduced by (1) all possible changesin � and ε, (2) bin-size changes in R and �, and (3) othernumerical noise. The error bars for the map in Figure 10ddecrease with increasing bin populations, ranging from 0.9 (binpopulations close to 50) through 0.5 (populations around 200)to 0.2 (populations higher than 1000, numerical noise mini-mized). Therefore, the error bar for highly populated bins (0.2ppm) is close to the average �, ε effect for a bin of 10° width,which is a small number compared to the ∼6 ppm range of δPdue to variations in R and �. This suggests that an explicittreatment of R and � is essential, while � and ε can be accountedfor implicitly through the “correct choice” of their values forgiven R and �.
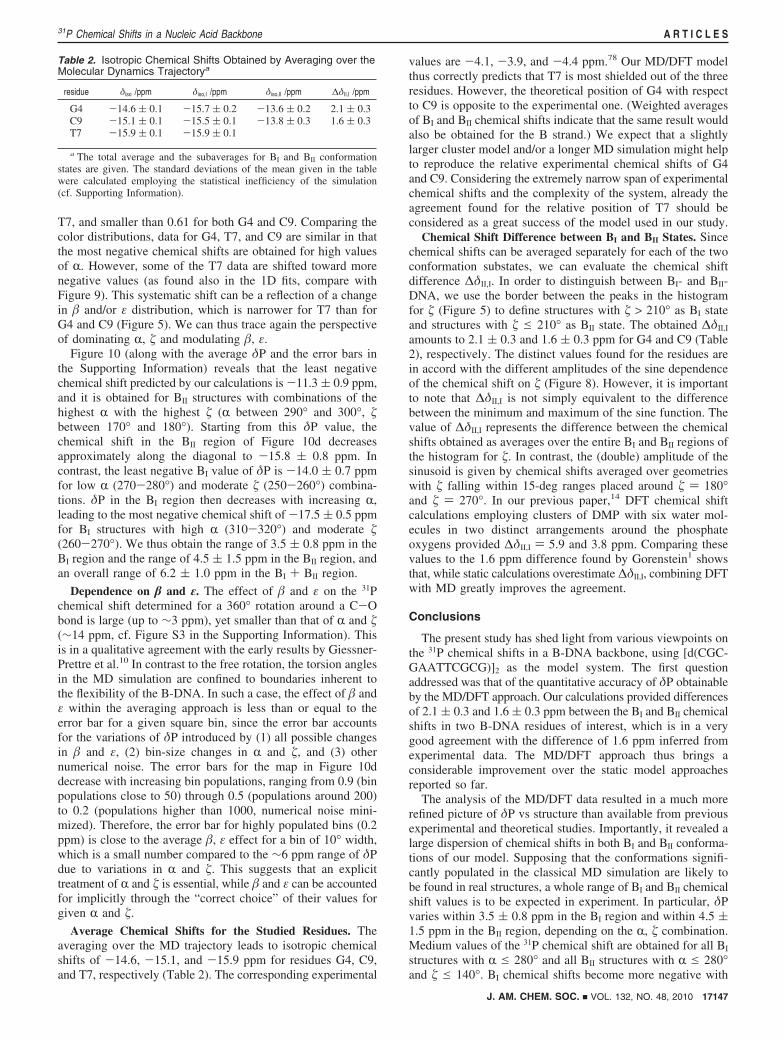
Average Chemical Shifts for the Studied Residues. Theaveraging over the MD trajectory leads to isotropic chemicalshifts of -14.6, -15.1, and -15.9 ppm for residues G4, C9,and T7, respectively (Table 2). The corresponding experimental
values are -4.1, -3.9, and -4.4 ppm.78 Our MD/DFT modelthus correctly predicts that T7 is most shielded out of the threeresidues. However, the theoretical position of G4 with respectto C9 is opposite to the experimental one. (Weighted averagesof BI and BII chemical shifts indicate that the same result wouldalso be obtained for the B strand.) We expect that a slightlylarger cluster model and/or a longer MD simulation might helpto reproduce the relative experimental chemical shifts of G4and C9. Considering the extremely narrow span of experimentalchemical shifts and the complexity of the system, already theagreement found for the relative position of T7 should beconsidered as a great success of the model used in our study.
Chemical Shift Difference between BI and BII States. Sincechemical shifts can be averaged separately for each of the twoconformation substates, we can evaluate the chemical shiftdifference ∆δII,I. In order to distinguish between BI- and BII-DNA, we use the border between the peaks in the histogramfor � (Figure 5) to define structures with � > 210° as BI stateand structures with � e 210° as BII state. The obtained ∆δII,I
amounts to 2.1 ( 0.3 and 1.6 ( 0.3 ppm for G4 and C9 (Table2), respectively. The distinct values found for the residues arein accord with the different amplitudes of the sine dependenceof the chemical shift on � (Figure 8). However, it is importantto note that ∆δII,I is not simply equivalent to the differencebetween the minimum and maximum of the sine function. Thevalue of ∆δII,I represents the difference between the chemicalshifts obtained as averages over the entire BI and BII regions ofthe histogram for �. In contrast, the (double) amplitude of thesinusoid is given by chemical shifts averaged over geometrieswith � falling within 15-deg ranges placed around � ) 180°and � ) 270°. In our previous paper,14 DFT chemical shiftcalculations employing clusters of DMP with six water mol-ecules in two distinct arrangements around the phosphateoxygens provided ∆δII,I ) 5.9 and 3.8 ppm. Comparing thesevalues to the 1.6 ppm difference found by Gorenstein1 showsthat, while static calculations overestimate ∆δII,I, combining DFTwith MD greatly improves the agreement.
Conclusions
The present study has shed light from various viewpoints onthe 31P chemical shifts in a B-DNA backbone, using [d(CGC-GAATTCGCG)]2 as the model system. The first questionaddressed was that of the quantitative accuracy of δP obtainableby the MD/DFT approach. Our calculations provided differencesof 2.1 ( 0.3 and 1.6 ( 0.3 ppm between the BI and BII chemicalshifts in two B-DNA residues of interest, which is in a verygood agreement with the difference of 1.6 ppm inferred fromexperimental data. The MD/DFT approach thus brings aconsiderable improvement over the static model approachesreported so far.
The analysis of the MD/DFT data resulted in a much morerefined picture of δP vs structure than available from previousexperimental and theoretical studies. Importantly, it revealed alarge dispersion of chemical shifts in both BI and BII conforma-tions of our model. Supposing that the conformations signifi-cantly populated in the classical MD simulation are likely tobe found in real structures, a whole range of BI and BII chemicalshift values is to be expected in experiment. In particular, δPvaries within 3.5 ( 0.8 ppm in the BI region and within 4.5 (1.5 ppm in the BII region, depending on the R, � combination.Medium values of the 31P chemical shift are obtained for all BI
structures with R e 280° and all BII structures with R e 280°and � e 140°. BI chemical shifts become more negative with
Table 2. Isotropic Chemical Shifts Obtained by Averaging over theMolecular Dynamics Trajectorya
residue δiso /ppm δiso,I /ppm δiso,II /ppm ∆δII,I /ppm
G4 -14.6 ( 0.1 -15.7 ( 0.2 -13.6 ( 0.2 2.1 ( 0.3C9 -15.1 ( 0.1 -15.5 ( 0.1 -13.8 ( 0.3 1.6 ( 0.3T7 -15.9 ( 0.1 -15.9 ( 0.1
a The total average and the subaverages for BI and BII conformationstates are given. The standard deviations of the mean given in the tablewere calculated employing the statistical inefficiency of the simulation(cf. Supporting Information).
J. AM. CHEM. SOC. 9 VOL. 132, NO. 48, 2010 17147
31P Chemical Shifts in a Nucleic Acid Backbone A R T I C L E S

increasing R, while BII chemical shifts become less negativewith increasing R and �.
Our results indicate that the R, �-based interpretation of 31Pchemical shifts in a DNA backbone, disputed in the literature,is indeed possible. An implicit treatment of � and ε is sufficient.However, the discussion of δP should definitely not be over-simplified to a pure BI/BII ratio perspective that completely omitsthe important dependence on the particular R and � combination,which characterizes the opening of the backbone.
Looking at the R and � angles individually, well-defined(sinusoidal and polynomial) dependences have been established.These dependences are modulated by the adjacent C-O torsionangles � and ε. The presence of explicit solvent leads to adamping and an upfield shift of the torsion angle dependencesby 2-3 ppm with respect to their gas-phase counterparts.
Acknowledgment. The authors thank Juha Vaara (Universityof Oulu), Roman Martonak (Comenius University Bratislava), JirıSponer (Academy of Sciences of the Czech Republic), PetrKulhanek, Pavel Kaderavek, and Dominik Munzar (all MasarykUniversity) for helpful discussions. This work was supported bythe Grants MSM0021622413 to M.M. and LC06030 to V.S. fromthe Ministry of Education, Youth and Sports of the Czech Republic,
and by the Grant No. IAA500040903 from the Grant Agency ofthe Academy of Sciences of the Czech Republic to J.P. DeutscherAkademischer Austausch Dienst (DAAD) is acknowledged for thescholarship awarded to J.P. for her research stay at the Universityof Wurzburg, Germany. The access to the MetaCentrum super-computing facilities provided under the research intentMSM6383917201 is highly appreciated.
Supporting Information Available: Average P-O and C-Otorsion angles as obtained from the MD simulation; plot ofH-bonding configurations at anionic phosphate oxygens O1Pand O2P; histograms of H-bond lengths and angles for the watermolecules hydrogen-bonded to O1P and O2P; comparison of31P chemical shift trends obtained from the MD/DFT and a staticapproach; further discussion of solvent effects; calculation ofstatistical errors; average 31P chemical shifts (and the standarddeviations of the mean) for R, � combinations used in Figure10; complete ref 39. This material is available free of chargevia the Internet at http://pubs.acs.org. The structures employedfor chemical shift calculations are available upon request fromthe authors.
JA104564G
17148 J. AM. CHEM. SOC. 9 VOL. 132, NO. 48, 2010
A R T I C L E S Precechtelova et al.