Philippine Food and Nutrition Security Atlas
57
Philippine Food and Nutrition Security Atlas March 2012
-
Upload
khangminh22 -
Category
Documents
-
view
5 -
download
0
Transcript of Philippine Food and Nutrition Security Atlas

Philippine Food and Nutrition Security Atlas
March 2012

Philippines Food and Nutrition Security Atlas, March 2012
2
Philippine Food and Nutrition Security Atlas 2012
N
Philippine Food and Nutrition Security Atlas
This document is prepared by Carleneth Fernandez-San Valentin and Juanito G. Berja, Jr., with
overall guidance from Dipayan Bhattacharyya, World Food Programme, Philippines
This document has not undergone the review accorded to official World Food Programme
(WFP) publications. The findings, interpretations, and conclusions expressed herein are those
of the authors and do not necessarily reflect the views of WFP or the National Government
Agencies who made the secondary data available for analysis.
The World Food Programme does not guarantee the accuracy of the data included in this word.
The boundaries, colors, denominations, and other information shown on any map in this work
do not imply any judgment on the part of WFP concerning the legal status of any territory or the
endorsement or acceptance of such boundaries.
Rights and Permissions
The publication is copyrighted. Copying and/or transmitting portions or all of this work without
permission may be a violation of applicable law.
Cover Pictures: © WFP/Philipp Herzog/Philippines
© WFP/Carleneth Fernandez-San Valentin/Philippines

Philippines Food and Nutrition Security Atlas, March 2012
3
Philippine Food and Nutrition Security Atlas 2012
Table of Contents
FOREWORD ............................................................................................................................. 5
Chapter 1 - Introduction ............................................................................................................7
1.1 Background .................................................................................................................7
1.2 Food and Nutrition Security: A Multi-dimensional Phenomena .............................. 8
Food Availability ................................................................................................................ 9
Food Access ....................................................................................................................... 9
Food Utilization ................................................................................................................. 9
Nutrition Security .............................................................................................................. 9
Vulnerability ...................................................................................................................... 9
1.3 Selected Indicators for the Food and Nutrition Security Atlas .................................10
Chapter 2 - Food Availability ................................................................................................... 14
2.1 Crop Production ........................................................................................................ 14
Rice ................................................................................................................................... 14
Corn .................................................................................................................................. 16
Cassava ............................................................................................................................. 16
Sweet Potato (Kamote) ..................................................................................................... 16
2.2 Livestock Production................................................................................................. 18
2.3 Fisheries ................................................................................................................... 20
2.4 Food Prices ............................................................................................................... 20
2.5 Food Availability Disconnect ................................................................................... 20
Chapter 3 - Economic Access to Food .................................................................................... 24
3.1 Household Poverty and Food Insecurity ....................................................................... 24
3.2 Food Expenditure .......................................................................................................... 24
3.3 Education ...................................................................................................................... 27
3.4 Employment and Income Sources ................................................................................ 27
3.5 Migration and Remittances ........................................................................................... 28
3.6 Access to Roads ............................................................................................................. 28
Chapter 4 - Food Consumption and Utilization ...................................................................... 31
4.1 Food Consumption Patterns ........................................................................................... 31

Philippines Food and Nutrition Security Atlas, March 2012
4
Philippine Food and Nutrition Security Atlas 2012
4.2 Nutritional Status .......................................................................................................... 32
4.3 Health ............................................................................................................................ 32
Child Health..................................................................................................................... 32
Maternal Health .............................................................................................................. 33
Water, Sanitation and Hygiene ....................................................................................... 33
Health Facilities ............................................................................................................... 33
Chapter 5 - Vulnerability ......................................................................................................... 41
5.1 Natural Disasters in the Philippines ............................................................................... 41
Typhoons .......................................................................................................................... 41
Volcanic Activity ............................................................................................................... 41
Floods and Landslides ...................................................................................................... 41
5.2 Forest Cover .................................................................................................................. 46
5.3 Impact of Climate Change to the Philippines ............................................................... 46
5.4 Insurgencies and Armed Conflict .................................................................................. 46
Chapter 6 - Priority Areas for Action ......................................................................................... 1
6.1 Malnutrition and Poverty .............................................................................................. 49
6.2 Conflict and Poverty ...................................................................................................... 49
6.3 Floods and Poverty ........................................................................................................ 50
References ............................................................................................................................... 56

Philippines Food and Nutrition Security Atlas, March 2012
5
Philippine Food and Nutrition Security Atlas 2012
List of Maps
MAP 1. ADMINISTRATIVE MAP OF THE PHILIPPINES .................................................................... 2
MAP 2. POPULATION MAP OF THE PHILIPPINES, 2007 ................................................................ 3
MAP 3. RICE PRODUCTION IN THE PHILIPPINES, 2011................................................................. 5
MAP 4. CORN PRODUCTINO IN THE PHILIPPINES, 2011 ................................................................7
MAP 5. LIVESTOCK AND POULTRY PRODUCTION IN THE PHILIPPINES, 2010 ................................ 9
MAP 6. FISHERIES PRODUCTION IN THE PHILIPPINES, 2010 ..................................................... 22
MAP 7. AVERAGE PRICE OF MILLED RICE IN THE PHILIPPINES, 2011 ......................................... 23
MAP 8. POVERTY INCIDENCE AND NUMBER OF POOR IN THE PHILIPPINES, 2011 ....................... 25
MAP 9. PROPORTION OF HOUSEHOLD SPENDING ON FOOD IN THE PHILIPPINES, 2009 ............. 26
MAP 10. PROPORTION OF OVERSEAS FILIPINO WORKERS (OFWS) BY REGION OF ORIGIN, 2011….29
MAP 11. LENGTH OF PRIMARY ROADS IN THE PHILIPPINES, 2006 ............................................. 30
MAP 12. NUTRITIONAL STATUS OF CHILDREN 0-5 YEARS OLD IN THE PHILIPPINES................... 34
MAP 13. PERCENTAGE OF UNDERWEIGHT CHILDREN UNDER 5 IN THE PHILIPPINES, 2008 ....... 35
MAP 14. PERCENTAGE OF UNDERHEIGHT CHILDREN UNDER 5 IN THE PHILIPPINES, 2008 ....... 36
MAP 15. PERCENTAGE OF THIN/WASTED CHILDREN UNDER 5 IN THE PHILIPPINES, 2008 ........ 37
MAP 16. PERCENTAGE OF CHILDREN WITH LOW BIRTH WEIGHT (LBW) IN THE PHILIPPINES, 2008
......................................................................................................................................... 38
MAP 17. PERCENTAGE OF HOUSEHOLDS WITH ACCESS TO CLEAN DRINKING WATERK, 2008 .... 39
MAP 18. NUMBER OF BARANGAY HEALTH STATIONS, PERSONNEL AND EXPENDITURES, 2008 .. 40
MAP 19. LOCATION OF THE PHILIPPINES IN THE PACIFIC RING OF FIRE .................................... 42
MAP 20. STORM TRACKS IN THE PHILIPPINES, 1999-2011 ........................................................ 43
MAP 21. LOCATION OF VOLCANOES IN THE PHILIPPINES ........................................................... 44
MAP 22. AREAS PRONE TO LANDSLIDE IN THE PHILIPPINES ...................................................... 45
MAP 23. FOREST COVER IN THE PHILIPPINES, 2003 ................................................................. 47
MAP 24. CONFLICT AFFECTED AREAS IN THE PHILIPPINES ....................................................... 48
MAP 25. PHILIPPINE POVERTY INCIDENCE WITH UNDERWEIGHT............................................... 51
MAP 26. PHILIPPINE POVERTY INCIDENCE WITH UNDERHEIGHT .............................................. 52
MAP 27. PHILIPPINE POVERTY INCIDENCE WITH THINNESS ...................................................... 53
MAP 28. CONFLICT AFFECTED AREAS WITH POVERTY INCIDENCE ............................................. 54
MAP 29. FLOOD-PRONE AREAS WITH POVERTY INCIDENCE ...................................................... 55

Philippines Food and Nutrition Security Atlas, March 2012
6
Philippine Food and Nutrition Security Atlas 2012
FOREWORD
The World Food Programme (WFP)-Philippines has witnessed the strong commitment of the
Government of the Philippines in halving extreme poverty from 33.1 percent to 16.6 percent by
2015. While there have been a few setbacks, there are strong indications that this goal could still
be achieved through the various convergence initiatives undertaken by the National
Government Agencies and stakeholders.
WFP is closely working with the Government of the Philippines through the Department of
Social Welfare and Development (DSWD) to help strengthen government programmes and
projects that target the most vulnerable population. As our contribution in building the
Philippines Food and Nutrition Surveillance System, the Philippine Food and Nutrition Security
Atlas (PFNSA) was drafted using the secondary data that are made available and accessible by
National Government Agencies.
The PFNSA was built around the indicators that are used by the Government of the Philippines.
It provides a political and physical map of initial analysis of trends and the most recent available
data of selected determinants of food security. WFP deems to contribute in building the
geographical database of selected food security indicators. We hope that the PFNSA would help
policy makers, national government agencies, local government units and various stakeholders
in developing appropriate interventions for the most vulnerable groups.
We are thankful for the invaluable support of the Federal German Government through World
Food Programme (WFP) Head Quarters and the National Government Agencies in the
completion of the PFNSA.
STEPHEN L. ANDERSON Representative and Country Director World Food Programme, Philippines

Philippines Food and Nutrition Security Atlas, March 2012
7
Philippine Food and Nutrition Security Atlas 2012
Chapter 1 - Introduction
1.1 Background
The Philippines has an estimated 95.8 million population spread across the 17 regions. The
archipelagic nature of the country makes it susceptible to various natural disasters. However,
there is now a strong recognition and awareness that climate change and the destruction of
natural resources bring to the fore an even grave problem that needs immediate and integrated
action from the Government and multilateral agencies.
Economic growth in the country in 2011 was slow and erratic. The most recent estimates of
poverty would show that little, if any, improvements in certain regions of the country happened
over the past 7 years. Poor and very poor access to food remains far higher in rural households.
Nutritional problems in the country are marked by undernutrition and overnutrition existing
alongside one another. However, national surveys on selected nutrition and health indicators
show that undernutrition is a more serious concern. Both adults and children suffer the
consequences of energy deficits and nutrient deficiency disorders. Much still needs to be done
to provide access to health services and to effect behavior change and instill health seeking
behavior among various age groups.
The Philippine Food and Nutrition Security Atlas (PFNSA) provides a political and physical map
of an initial analysis of trends and the most recent available data of selected determinants of
food security and malnutrition, including food production and imports, economic access to food,
food consumption and utilization and relevant social parameters. The PFNSA indicators
provided a picture of the national, regional and provincial situation. PFNSA is built around the
indicators used by the National Government. It is deemed that this would contribute in
building the geographical database targeted to help policy makers, national government
agencies, local government units, non-government organizations, researchers, and interest
groups in planning, deciding on the most appropriate intervention and allocating the finite
resources to where the most vulnerable are.

Philippines Food and Nutrition Security Atlas, March 2012
8
Philippine Food and Nutrition Security Atlas 2012
1.2 Food and Nutrition Security: A Multi-dimensional Phenomena
Food security was defined in the 2006 World Food Summit, “as a state at which all people, at all
times, have physical and economic access to sufficient, safe and nutritious food to meet their
dietary needs and food preferences for an active and healthy life” (WFP, 2009). It is built on
three pillars: food availability, food access and food utilization (Figure 1.1). How each pillar
would be viewed in terms of its importance would depend on the level of aggregation and
indicators being analyzed. The pillars cannot be viewed separately as the integration between
the three is too tight and determining the fine line which separates one from the other is
difficult.
Figure 1. Food and Nutrition Security Conceptual Framework (WFP, 2009)
When analyzed at the national level, while national production is of great interest, it is also
important to examine the country’s capacity to access food from the global market. While at the
household level, a different set of indicators would provide a much sensitive measure of
availability, access and utilization. The impact of socioeconomic, cultural and gender
inequalities on food security are more pronounced at the individual level for food consumption
is not solely determined by having food on the plate.

Philippines Food and Nutrition Security Atlas, March 2012
9
Philippine Food and Nutrition Security Atlas 2012
Food Availability
Food availability is the “physical presence of food in the area of concern through all forms of
domestic production, commercial imports and food aid (WFP, 2009).” Determinants of food
security include: production, trade, stocks, and transfers. These could be aggregated at the
regional, national, district or community level.
Food Access
Food access is primarily about a household’s ability to acquire adequate amounts of food,
through one or a combination of own home production and stocks, purchases, barter, gifts,
borrowing and food aid.
Food Utilization
In food utilization, the households’ use of food to which they have access and an individual’s
ability to absorb and metabolize the nutrients comes into play. Food preparation, feeding
practices, intra-household distribution of food, nutritional and health status of individuals
within the household are assessed in combination.
Nutrition Security
Apart from food security, the inclusion of indicators of utilization emphasizes that nutrition
security is equally important or more than a food security concern. Nutrition security is a
situation in which all individuals and households are food-secure, have good access to
preventive and curative health care, and undertake healthy and sustainable care practices (WFP,
2009).
Vulnerability
Vulnerability is defined as exposure to risk and the lack of ability to cope with its consequences.
The vulnerability of households and communities depends largely on their ability to cope with
exposure to risks associated with shocks such as flood, drought, crop blight or infestation,
economic fluctuation and conflict. The asset base and livelihood of a households or communities
largely determine their ability to cope.

Philippines Food and Nutrition Security Atlas, March 2012
10
Philippine Food and Nutrition Security Atlas 2012
1.3 Selected Indicators for the Food and Nutrition Security Atlas
Indicator Definition/Computation Data Source
Food Availability
Crop production Rice, corn, cassava and sweet potato production at the national, regional and provincial levels
Bureau of Agricultural Statistics, 2012
Livestock and fisheries production
Water buffalo, cattle, hog, goat, poultry and fish production at the national, regional and provincial levels
Bureau of Agricultural Statistics, 2010
Food prices Retail price of regular milled rice at the national, regional and provincial levels
Bureau of Agricultural Statistics, 2012
Economic Access to Food
Poverty Incidence Refers to the proportion of families (or population) with per capita income less than the per capita poverty threshold to the total number of families (population).
National Statistics Coordination Board, 2009
Food Threshold The cost of the food required to satisfy nutritional requirements for economically necessary and socially desirable physical activities.
National Statistics Coordination Board, 2009
Subsistence Poverty Incidence
Refers to the proportion of families (or population) per capita income less than the per capita food threshold to the total number of families (population).
National Statistics Coordination Board, 2009
Poverty Threshold The minimum income required to meet the food requirements and other non-food basic needs.
National Statistics Coordination Board, 2009
Total Food Expenditure
Actual food consumption of the family during the past week of the interview
National Statistics Coordination Board, 2009
Cohort Survival Rate
Proportion of enrollees at the beginning of grade and year level who reach the final grade or year level at the end of the required number of years of study.
Department of Education
Basic Literacy Rate The percentage of the population who can read and write and understand simple messages in any language or dialect.
Department of Education
Labor Force Participation Rate
Total number of persons in the labor force/total population 15y/o and over x 100%
National Statistics Office, 2010
Employment Rate
Include all those who, during the reference period
are 15 years old and over as of their last birthday
and are reported either:
At work. Those who do any work even for
National Statistics Office, 2010

Philippines Food and Nutrition Security Atlas, March 2012
11
Philippine Food and Nutrition Security Atlas 2012
one hour during the reference period for pay
or profit, or work without pay on the farm or
business enterprise operated by a member of
the same household related by blood,
marriage or adoption; or
With a job but not at work. Those who
have a job or business but are not at work
because of temporary illness/injury, vacation
or other reasons. Likewise, persons who
expect to report for work or to start operation
of a farm or business enterprise within two
weeks from the date of the enumerator’s visit,
are considered employed.
Total number of employed persons/total number of persons in the labor force x 100%
Unemployment Rate Include persons 15 years and above who are without work and are currently available for work and seeking work, or are not seeking work due to the belief that there is no work, but sought work within the past six months. Total number of unemployed persons/total number of persons in the labor force x 100%
National Statistics Office, 2010
Food Consumption and Utilization
Underweight
For children less than 5 years, weight-for-age less than -2SD of the WHO Child Growth Standards.
Food and Nutrition Research Institute, 2008
Stunting
Height-for-age less than -2 SD of the WHO Child Growth Standards
Food and Nutrition Research Institute, 2008
Wasting
Weight-for-height greater than +2 SD of the WHO Child Growth Standards
Food and Nutrition Research Institute, 2008
Low birth weight
Percentage of liveborn infants that weigh less than 2500 g
National Statistics Office, 2009
Under-five mortality rate
Probability of dying between birth and exactly five years of age expressed per 1,000 live births.
National Statistics Office, 2009
Infant mortality rate
Probability of dying between birth and exactly one year of age expressed per 1,000 live births.
National Statistics Office, 2009
Access to safe source of water supply
Percentage of households who have access to tap water, protected wells/boreholes, or protected spring water.
National Statistics Office, 2010
Vulnerability
Natural disasters Typhoons and volcanic activities from 1999-2011. Virola, 2008

Philippines Food and Nutrition Security Atlas, March 2012
12
Philippine Food and Nutrition Security Atlas 2012
Map 1. Administrative Map of the Philippines

Philippines Food and Nutrition Security Atlas, March 2012
13
Philippine Food and Nutrition Security Atlas 2012
Map 2. Population Map of the Philippines, 2007

Philippines Food and Nutrition Security Atlas, March 2012
14
Philippine Food and Nutrition Security Atlas 2012
Chapter 2 - Food Availability
Food availability is assessed based on the basic concept of the amount of food which is available
at national and local level, through domestic agricultural production, and through consideration
of commercial imports. Many factors can influence the availability of food. These include the
national policy framework related to food production, the quality of markets and commodity
flows.
There are also determinants related to agricultural production which include access to land,
productive inputs and financing/credit. Storage and post-harvest processes as well as agro-
processing and climate-related effects are also important factors. Agricultural production is an
important factor in food security, as it indirectly addresses undernutrition, through increasing
food availability and by improving livelihoods and incomes of the poor, thereby increasing their
capacity to feed themselves.
2.1 Crop Production
Government expenditure on agriculture amounted to Php 89.2 M or 5.79 percent of the total
national spending in 2010. Even with the low investment on agriculture, the sector has a total
contribution of 17 percent to the economy’s aggregate GDP.
Rice
Rice is the principal food crop with a production level of 15.772 million metric tons for 2010 and
a share of 19 percent to GDP for agriculture. Total rice production increased by 5.47 percent
(16.684 million metric tons) in 2011. Luzon remains to be the biggest producer of rice at 57.01
percent of the country’s total production.
The 2011 data of the Bureau of Agricultural Statistics shows that at the regional level, Central
Luzon, Western Visayas, Cagayan Valley, Ilocos Region and SOCCSKSARGEN remains to have
the largest contribution in the total country production. The provinces of Nueva Ecija (Central
Luzon), Iloilo (Western Visayas) and Isabela (Cagayan Valley) contributed the greatest bulk in
rice production.

Philippines Food and Nutrition Security Atlas, March 2012
15
Philippine Food and Nutrition Security Atlas 2012
Map 3. Rice Production in the Philippines, 2011

Philippines Food and Nutrition Security Atlas, March 2012
16
Philippine Food and Nutrition Security Atlas 2012
Corn
Corn is the second largest food crop in the country and a staple food of about 20 percent of the
Filipino population. Total corn production for 2010, accounts to 6.376 million metric tons of
production for 2010 and a contribution to GDP for agriculture of 5 percent. In 2011, total corn
yield (white and yellow grain) increased by 8.53 percent (6.971 million metric tons). Corn is
mainly produced in Mindanao with total contribution of 52.31 percent to the total country
production.
Regional data shows that the top 6 producers of white corn are ARMM, Northern Mindanao,
SOCCSKSARGEN, Central Visayas, Davao Region, and Zamboanga Peninsula. Farmers in these
areas prefer white corn production over yellow corn primarily because of the higher selling price
of white corn. While for yellow corn, the largest producers are Cagayan Valley,
SOCCSKSARGEN, Northern Mindanao, Ilocos Region, and Western Visayas.
All provinces are engaged in white corn production which is sold either for consumption or raw
material for animal feeds. Farmers continue to grow yellow corn in all of the provinces except in
the provinces of Marinduque, Dinagat Islands, Basilan, Sulu and Tawi-tawi.
Cassava
Lanao del Sur, Bukidnon, Basilan, Sulu and Misamis Oriental are the top producers of cassava in
the country in 2010. The combined yield of these provinces was 1.31 million metric tons or 62.4
percent of the total production in 2010 of 2.10 million metric tons.
Sweet Potato (Kamote)
The country produced 541,265 metric tons of sweet potatoes in 2010. At the regional level,
Eastern Visayas, Bicol Region, CARAGA, Western Visayas, and Central Visayas are the leading
producers of sweet potato. Of the 80 provinces, Leyte is the leading producer of sweet potato in
the country (61,896 metric tons).
Philippines Food and Nutrition Security Atlas, March 2012
17
Philippine Food and Nutrition Security Atlas 2012
Map 4. Corn Productino in the Philippines, 2011

Philippines Food and Nutrition Security Atlas, March 2012
18
Philippine Food and Nutrition Security Atlas 2012
2.2 Livestock Production
In 2010, the livestock subsector accounted for 15.97 percent of the total agricultural output and
poultry subsector contributed 13.17 percent. Livestock and poultry production are valued at Php
41,974,740 and Php 49,378,520, respectively.
Backyard farms account for 99.6 percent of the total water buffalo inventory of 3.13 million.
Regions which have the highest contribution in production, both backyard and commercial,
include Western Visayas (10.27 percent), Eastern Visayas (10.22 percent), Cagayan Valley (9.51
percent), Bicol Region (8.21 percent) and SOCCSKSARGEN (8.06 percent).
Cattle inventory, for 2010, was 2,546,919 with a large proportion mainly from backyard farming
(BAS, 2011). Ilocos region remains as the top producer to cattle in the country, contributing
11.49 percent to the total cattle industry.
Hog industry is continuing to grow. The total inventory was 12,709,205 with 67.5 percent and
32.5 percent contribution from backyard and commercial farming, respectively (BAS, 2011).
The largest commercial farms are in Central Luzon. These farms have a total contribution of
34.16 percent to the total hog production. While for backyard farming, Western Visayas is the
top contributor (14.39 percent).
Total goat production in 2010 estimated at 3.94 million. This was 7.12 percent lower than the
2009 inventory of 4.22 million. Backyard farms remains to be the main (98.42 percent) goat
raisers in the country. Western Visays, Central Visayas, Ilocos Region, Davao Region and
Central Luzon are the top goat producing regions in the country.
Chicken production in 2010 (161,220,000) is lower by 3.72 percent than the 2009 production
inventory. About 47 percent of the total chicken production is free-range chicken mostly raised
in backyard farms (BAS, 2011). This can be attributed to the increase in demand for organic
products. Commercial farms primarily raise broilers and layers which account for 35 percent
and 18 percent of the total inventory, respectively. A large proportion of free-range chicken are
raised in Western Visayas with a share of 17.27 percent to the annual total inventory.
Central Luzon has the biggest share (28.86 percent) in the commercial production of broilers
and CALABARZON for layers (39.22 percent). Total egg production for 2010 is 193,629 metric
tons, a 5.37 percent increased from the previous year’s level. This was attributed to the increase
in layer inventory in the top producing regions. Duck inventory was at 10.07 million in 2010,
with total contribution of 74 percent from backyard farms and 26 percent from commercial
farms. Main contribution in total inventory was from Central Luzon (BAS, 2011). Egg
production was 18,510 metric tons.

Philippines Food and Nutrition Security Atlas, March 2012
19
Philippine Food and Nutrition Security Atlas 2012
Map 5. Livestock and Poultry Production in the Philippines, 2010

Philippines Food and Nutrition Security Atlas, March 2012
20
Philippine Food and Nutrition Security Atlas 2012
2.3 Fisheries
Main fish production in the country is an unloading from three main sectors which includes:
aquaculture, municipal and commercial fishing. In 2011, the total fish volume produced
reached 4.98 million metric tons (BAS, 2011). The biggest unloading was coming from the
aquaculture sector (2.61 million metric tons), followed by municipal (1.33 million metric tons)
and commercial (1.04 million metric tons) sectors.
The biggest share in aquaculture was coming from ARMM, MIMAROPA and Zamboanga
Peninsula. Municipal fisheries have a contribution of 26-30 percent in the total fish production
of the country. Of this total production, 44 percent was from Luzon, 32 percent from Mindanao
and 24 percent from Visayas. During the first quarter of 2011 a drop in production was observed
from the municipal fisheries. This was due to the flooding in most of the provinces brought
about by monsoon rains and the oil price hikes which limited the operations of the fisherfolks.
2.4 Food Prices
Rice have been subjected to the greatest volatility with rice price inflation reaching 29.1 percent
in 2008 and sharply dropped to 7.5 and 1.1 in 2009 and 2010, respectively. The price index for
rice showed a similar trend.
Looking at the historical price of rice, over the longer term, it remains at a much higher level at
the end of 2011 than at pre-crisis levels. Retail price of regular milled rice ranges from Php
28.25 to Php 35.15 across the provinces in the country. The highest reported retail prices of
regular milled rice are in Mountain Provinces, Camiguin and Lanao del Norte. This continues to
pose additional challenges to poor households that have been coping with the income shocks
associated with the earlier food, fuel and economic crises.
2.5 Food Availability Disconnect
Domestic agricultural production and imports from world markets are the main sources of food
in the country. Local agricultural production can meet the demands of domestic consumption,
however rice production remains insufficient. Agricultural activities account for roughly 33
percent of all economic activities therefore almost all regions produce agricultural products.
However, some regions are producing more than other regions. In the case of NCR, it is highly
dependent on food supplies coming from other regions.
Limited access to credit and financing and limited irrigation infrastructure coupled with issues
on climate change, natural and man-made disasters and environmental degradation are the
major challenges that farmers have to contend with. Market mechanisms are also seen as

Philippines Food and Nutrition Security Atlas, March 2012
21
Philippine Food and Nutrition Security Atlas 2012
disrupting food availability in the country. Price volatility makes both producers and consumers
increasingly susceptible to poverty. It also has major long-term impacts on nutritional status
and livelihood development.
The current government’s intervention to market procedures is in the form food subsidies and
implementation of reinvigorated feeding programmes. However, due to insufficiencies in
carrying out the programme, the intended effect of the intervention has not been realized.
However, given the seriousness of the present administration to work towards food self-
sufficiency beginning 2013 and the potential of the local agriculture to produce food and meet
local demands.

Philippines Food and Nutrition Security Atlas, March 2012
22
Philippine Food and Nutrition Security Atlas 2012
Map 6. Fisheries Production in the Philippines, 2010

Philippines Food and Nutrition Security Atlas, March 2012
23
Philippine Food and Nutrition Security Atlas 2012
Map 7. Average Price of Milled Rice in the Philippines, 2011

Philippines Food and Nutrition Security Atlas, March 2012
24
Philippine Food and Nutrition Security Atlas 2012
Chapter 3 - Economic Access to Food
3.1 Household Poverty and Food Insecurity
Poverty is a multi-dimensional concept and to a large extent the national and regional estimates
of poverty in the Philippines are derived from its income dimension. Estimates show that 9 out
of the 15 provinces with the highest incidence of poverty are in Mindanao. Income-based
measures show that the greatest poverty incidences are in CARAGA (47.8 percent), ARMM (45.9
percent), Bicol (45.1 percent) and Zamboanga Peninsula (43.1 percent) (NSO, 2009).
For subsistence incidence of poverty, CARAGA (25.3 percent), Zamboanga Peninsula (23.5
percent), Northern Mindanao (20.7 percent) and Eastern Visayas (19 percent) are the provinces
with the highest reported rates. The three regions with the least poverty and subsistence
incidence are in Luzon, these being NCR, Central Luzon and Cagayan Valley.
3.2 Food Expenditure
The proportion of a household's total expenditures on food is a useful measure of food access
and also as a measure of vulnerability to future food insecurity. Households that spend high
proportions of their incomes on food (e.g. 70 percent or more) are vulnerable because if their
income is reduced, for example owing to, natural disaster, disease onset, or price hikes, they will
have limited reserve in meeting their food needs. From a conceptual standpoint, the food access
measure derived from household expenditure surveys is a good indicator of food insecurity.
Of all the regions, ARMM has by far the highest proportion of families (84.5 percent) spending
more than 50 percent of total expenditure on food. There are five other regions where more than
two-thirds of families spend more than half of total expenditure on food, these being
Zamboanga Peninsula 72.7 percent, CARAGA 69.6 percent, Bicol 68.6 percent,
SOCCSKSARGEN 68.3 percent and Eastern Visayas 66.9 percent. There are only four regions
where less than half of families spend more than 50 percent of total expenditure on food and
these could be assumed to have the best overall food access, these being NCR 30.6 percent,
CALABARZON 45.7 percent, CAR 46.9 percent and Central Luzon 47.7 percent.

Philippines Food and Nutrition Security Atlas, March 2012
25
Philippine Food and Nutrition Security Atlas 2012
Map 8. Poverty Incidence and Number of Poor in the Philippines, 2011

Philippines Food and Nutrition Security Atlas, March 2012
26
Philippine Food and Nutrition Security Atlas 2012
Map 9. Proportion of Household Spending on Food in the Philippines, 2009

Philippines Food and Nutrition Security Atlas, March 2012
27
Philippine Food and Nutrition Security Atlas 2012
3.3 Education
The regional pattern of education indicators shows some disparity across the country. The
cohort survival rates in elementary schools in SY 2008-09 fared badly in all regions in
Mindanao with the worst being in ARMM at 40.75 percent despite having high net enrolment
rate for elementary level. Cohort survival rates in the six best performing regions were above 80
percent and these were mainly in Luzon; NCR 87.51 percent, Ilocos Region 86.7 percent,
CALABARZON 83.77 percent, Central Luzon 83.02 percent, Cagayan Valley 81.58 percent, and
Central Visayas 81.39 percent.
National Capital Region (NCR) and Region I (Ilocos Region) has the highest basic literacy rate,
99.2 percent and 98.2 percent, respectively, higher than the national average of 95.6 percent
(TESDA, 2011). ARMM has the lowest reported basic literacy rate of 81.5 percent.
3.4 Employment and Income Sources
Labor force participation rate increased by 0.77 percentage points from 64.1 percent in 2010 to
64.6 percent in 2011 (NSO, 2011). An increase in employment rate (93 percent) and a
consequent decrease in unemployment (7 percent) were reported for 2011. When disaggregated
according to sex, the employment rate is 93.1 percent among women and 92.4 percent for men.
Underemployment affects 19.3 percent of all workers in the country.
NCR has the lowest employment rate (88.5 percent) and highest unemployment rates (11.5
percent) when compared with other regions (NSO, 2011). This is a clear indication of rural-
urban migration that is widely happening in the country as a livelihood strategy.
ARMM ranks third in terms of employment rate (96.1 percent) as shown in the 2010 data of the
National Statistics Office. Unemployment rate was estimated at 3.9 percent. Despite the
intermittent armed-conflict in ARMM and lack of investments in the industry and service sector,
the high employment rate in ARMM was attributed to the significant increase of job
opportunities in the agricultural and fisheries sectors and an expansion in finance loans.

Philippines Food and Nutrition Security Atlas, March 2012
28
Philippine Food and Nutrition Security Atlas 2012
3.5 Migration and Remittances
The number of Overseas Filipino Workers (OFWs) was estimated at 2.043 million in 2010
(NSO, 2010). OFWs with existing contracts to work abroad are 94.9 percent of the total OFWs.
There are less women working aboard (47.7 percent) than men (52.3 percent). Majority of the
OFWs belong to the 25-29 y/o group (25 percent). Thirty two percent of these OFWs are
laborers and unskilled workers and 15.1 percent are employed as service workers and shop and
market sales workers. The total remittance for 2010 was estimated at 141.2 billion pesos.
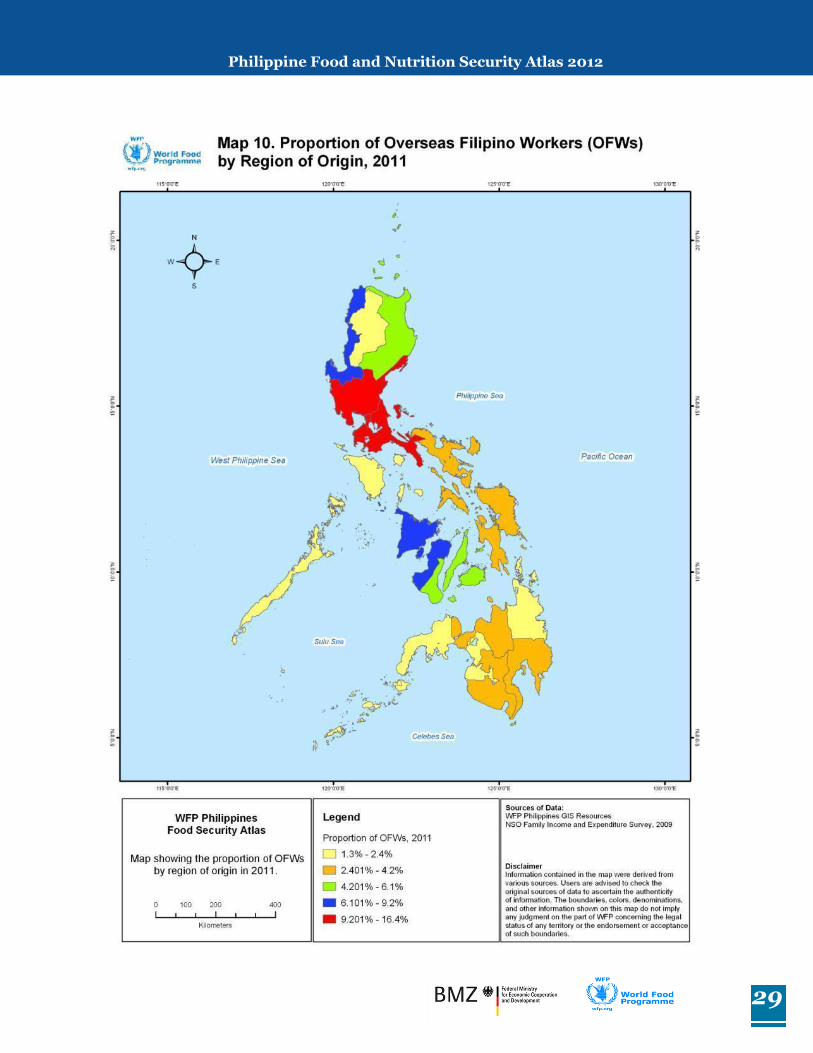
The largest proportion of OFWs originated from CALABARZON (16 percent) followed by
Central Luzon (14.4 percent) and NCR (13.8 percent). Saudi Arabia and United Arab Emirates
were reported as the preferred destination of work with 22.1 percent and 15.1 percent OFWs,
respectively. Less than 2 percent of the labor force in CARAGA, MIMAROPA and CAR seek
employment abroad.
3.6 Access to Roads
Roads are important means for food and services to become available and be accessible to
people. In the Philippines, the roads are classified as national (i.e., primary, secondary) and
local roads (i.e., provincial, municipal, and barangay). Primary roads are arteries that connect
major cities (with a population of at least 100,000 people as of year 2000) while secondary
roads connects cities to primary roads, major ports and ferry terminals, airports, tourist service
centers and provincial capitals within the same region.
As of 2000, the total length of primary roads (5,872 kilometers) and secondary roads (12,557)
runs a total of 18, 429 kilometers. The length of local roads equals 10,117 kilometers. Most of
the primary and secondary road networks are located in urbanized areas such as the National
Capital Region, Central Luzon and CALABARZON.
Philippines Food and Nutrition Security Atlas, March 2012
29
Philippine Food and Nutrition Security Atlas 2012
Map 10. Proportion of Overseas Filipino Workers (OFWs) by Region of Origin, 2011

Philippines Food and Nutrition Security Atlas, March 2012
30
Philippine Food and Nutrition Security Atlas 2012
Map 11. Length of Primary Roads in the Philippines, 2006

Philippines Food and Nutrition Security Atlas, March 2012
31
Philippine Food and Nutrition Security Atlas 2012
Chapter 4 - Food Consumption and Utilization
4.1 Food Consumption Patterns
A typical Filipino diet is a combination of rice, fish and vegetables that is equivalent to 861
grams of food in raw or purchased form. The 2008 estimate is 2.9 percent (886 grams) lower
than the 2003 value (FNRI, 2008). Among households, rice, sugar and coconut oil are the most
commonly consumed food items. Mean one-day per capita consumption of rice is 307 grams.
Fish and fish products account for some 12.8 percent of dietary intake (110 grams) and
vegetables (12.8 percent) are also consumed in the same amount. Meat products and poultry
account for around 9.6 percent of the typical one-day diet and fruits contribute some 6.3
percent. The rest of the major food groups were each consumed in amounts less than 5 percent
of the average diet; sugar (17 grams) and oil/fats (15 grams) each contributes around 2 percent.
There is a variation in the consumption of rice, with ARMM region having the highest relative
mean daily per capita rice consumption (372g), followed by Western Visayas (367g), and CAR
(362g). There is an insignificant amount of corn in the diet in 11 of the 17 regions. Central
Visayas has the highest average consumption of corn at 81g per capita per day and the lowest
consumption of rice at 272g, as corn is also a regional staple food. Other regions that take corn
in significant proportion as staple food in addition to rice are Zamboanga Peninsula and
Northern Mindanao.
When evaluated against the Recommended Energy and Nutrient Intakes for Filipinos (RENI),
only 33.1 percent households have an energy intake of 100 percent (1867 kcal). About 57
percent of these households are able to meet the estimated average requirement (EAR) for
protein and less than 20 percent for iron, calcium and riboflavin. This would mean that for the
country to reach its MDG target of eradicating extreme poverty and hunger, an annual reduction
of 5 percent in the proportion of energy-deficient households must be reached until 2015.
Across the regions, Western Visayas has the lowest reported mean one-day per capita energy
consumption followed by Northern Mindanao and ARMM. For vitamin A (retinol equivalent),
calcium and riboflavin estimated values were lowest in ARMM.
In 2010, the total available rice for utilization per capita is 308.93 gram per day or 112.76
kilograms per year. Per capita availability of corn is 44.3 grams per day. Root crops are often
consumed as an alternative to rice and corn. Cassava availability for utilization is estimated at
6.25 grams/day/capita and 14.93 grams/day/capita for sweet potato.

Philippines Food and Nutrition Security Atlas, March 2012
32
Philippine Food and Nutrition Security Atlas 2012
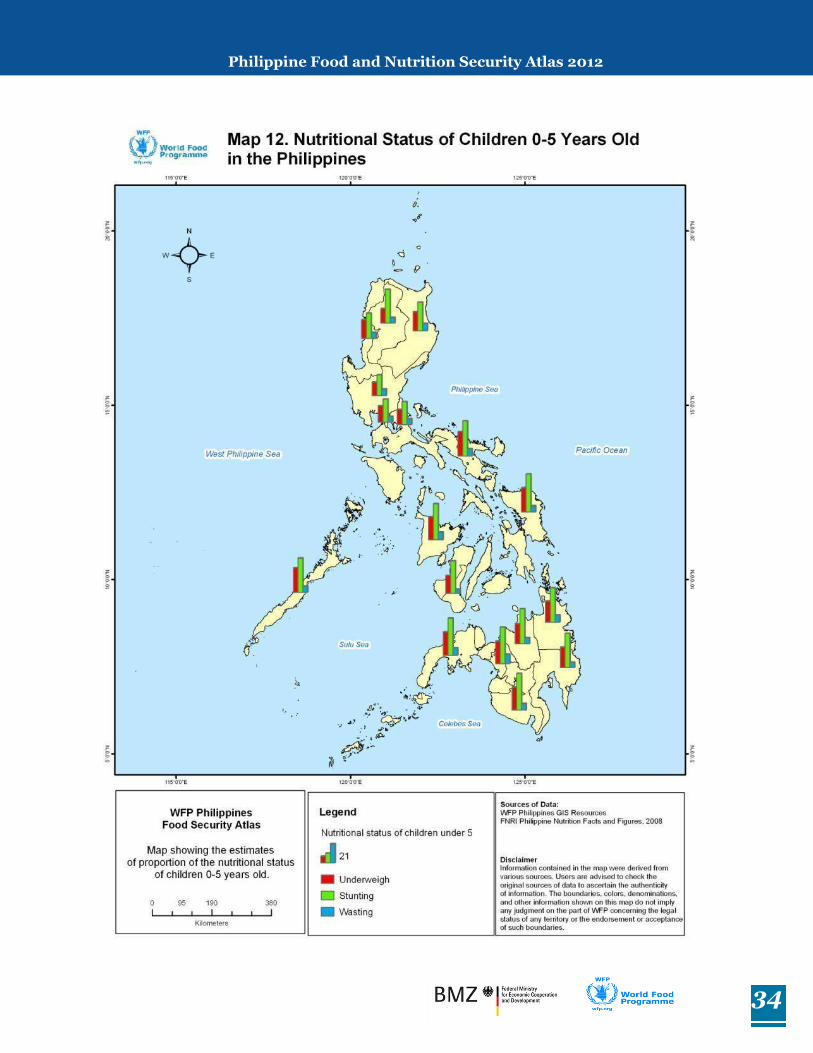
4.2 Nutritional Status
Using the WHO cut-off values to establish levels of public health significance, regional data
show that underweight is of high public health significance in 12 of the 17 regions. When ranked
according to magnitude, MIMAROPA (26.6 percent), Bicol (26.4 percent) and Eastern Visayas
(26.4 percent) are the top three regions (FNRI, 2008).
When viewed at the provincial level, the magnitude and severity of underweight prevalence were
found to be very high in 9 of the 80 provinces. Three of these provinces are in Eastern Visayas
[Biliran (37.3 percent), Northern Samar (31.8 percent), and Western Samar (30.1 percent)], two
in Zamboanga Peninsula [Zamboanga Sibugay (31.1 percent) and Zamboanga del Norte (30
percent)], and the rest in Bicol (Masbate, 32.5 percent), MIMAROPA (Romblon, 30.6 percent),
Western Visayas (Antique, 30.8 percent), and SOCCSKSARGEN (Sultan Kudarat, 30.5 percent).
Chronic malnutrition as a result of primary or secondary causes is often measured using the
height-for-age index. Stunting among 0-5-year old children is 32.3 percent with 10.2 percent
considered severely stunted. Based on the WHO cut-offs for public health significance, a very
high magnitude of stunting was observed in Eastern Visayas (41.1 percent) and Zamboanga
Peninsula (40.3 percent). High and medium magnitudes of stunting were reported in 11 and 4
regions, respectively. Three provinces with very high magnitudes of stunting were found in
Luzon (Romblon, Masbate and Sorsogon), four in Visayas (Antique, Biliran, Northern Samar
and Western Samar) and eight in Mindanao (Zamboanga del Norte, Zamboanga Sibugay,
Bukidnon, Lanao del Norte, Davao Oriental, Sarangani, Sultan Kudarat and Agusan del Sur).
Weight-for-height is a sensitive index of current nutritional status as a consequence of a recent
and severe process, pathological or not, that led to a significant weight loss (WHO, 1995). Seven
out of 100 children in the country are thin/wasted. Serious magnitude of thinness/wasting
among children 0-5-year old was reported in ARMM. The prevalence levels in all of the regions
except for Central Visayas were classified as poor based on the WHO cut-offs.
4.3 Health
Child Health
Low birth weight has short- and long-term health consequences. Low birth weight is a major
determinant of mortality, morbidity, disability and possible long-term impact on health
outcomes later in adult life. At the national level, low birth weight was estimated at 20 percent
with a range of 0.3 percent-22.6 percent across the 80 provinces.
Under-five mortality rate is used as an indicator of the level of child health and overall
development in countries. In 2008, infant mortality rate (between birth and first birthday) was
25 per 1000 live births and most of these deaths occur during the first month of life (16 per

Philippines Food and Nutrition Security Atlas, March 2012
33
Philippine Food and Nutrition Security Atlas 2012
1000). The top three leading causes of infant mortality are bacterial sepsis, respiratory distress
and pneumonia. Under-5 mortality rate (between birth and fifth birthday) is 34 per 1000 live
births. ARMM has the highest reported infant and under-5 mortality rate, 56 per 1000 live
births and 94 per 1000 live births, respectively.
Maternal Health
More pregnant women (91 percent) are receiving antenatal care from a skilled provider. In the
vast majority of regions, at least 90 percent of women received antenatal care from a health
professional; however, in ARMM only 47 percent seek. Ninety three percent of women in CAR
and SOCCSKSARGEN received antenatal care. Most births still occur at home (56 percent) and
this is more common in the rural areas (70 percent) with about 36 percent assisted by
traditional birth attendant (NSO, 2009).
Maternal mortality ratio (MMR) is at 162 per 100,000 live births. The Philippines will not likely
meet the MDG target of reducing maternal mortality ratio to 53 per 100,000 live births by 2015.
Water, Sanitation and Hygiene
Unsafe water and poor sanitation have serious consequences to households. Health systems are
overwhelmed and national economies suffer. Access to safe drinking water and proper
sanitation is indispensable to sustainable development.
Majority (84 percent) of the Filipino families had access to safe source of water supply (NSO,
2010). However, some 16 percent of families still rely on unprotected wells, developed and
undeveloped springs, river streams, ponds, lakes or dams, rainwater, and tanker trucks or
peddlers for water. Only four regions in the country have over 90 percent of families with access
to safe water: Central Luzon (96 percent), Cagayan Valley (93 percent), Ilocos (93 percent) and
National Capital Region (92 percent). In contrast, only 49 percent of families in ARMM have
access to safe water.
Health Facilities
Health facilities in the communities are vital in the promotion of sound behavior and the
prevention and treatment of diseases. Only 18 percent of the 80 provinces in the country have a
Barangay Health Station (BHS) to population ratio of 1:3,000. At the provincial level, there is
wide variation on per capita expenditure on health, nutrition and population control.
Philippines Food and Nutrition Security Atlas, March 2012
34
Philippine Food and Nutrition Security Atlas 2012
Map 12. Nutritional Status of Children 0-5 Years Old in the Philippines

Philippines Food and Nutrition Security Atlas, March 2012
35
Philippine Food and Nutrition Security Atlas 2012
Map 13. Percentage of Underweight Children Under 5 in the Philippines, 2008

Philippines Food and Nutrition Security Atlas, March 2012
36
Philippine Food and Nutrition Security Atlas 2012
Map 14. Percentage of Underheight Children Under 5 in the Philippines, 2008

Philippines Food and Nutrition Security Atlas, March 2012
37
Philippine Food and Nutrition Security Atlas 2012
Map 15. Percentage of Thin/Wasted Children Under 5 in the Philippines, 2008

Philippines Food and Nutrition Security Atlas, March 2012
38
Philippine Food and Nutrition Security Atlas 2012
Map 16. Percentage of Children with Low Birth Weight (LBW) in the Philippines, 2008

Philippines Food and Nutrition Security Atlas, March 2012
39
Philippine Food and Nutrition Security Atlas 2012
Map 17. Percentage of Households with Access to Clean Drinking Waterk, 2008

Philippines Food and Nutrition Security Atlas, March 2012
40
Philippine Food and Nutrition Security Atlas 2012
Map 18. Number of Barangay Health Stations, Personnel and Expenditures, 2008

Philippines Food and Nutrition Security Atlas, March 2012
41
Philippine Food and Nutrition Security Atlas 2012
Chapter 5 - Vulnerability
5.1 Natural Disasters in the Philippines
The geographical location of the country makes if prone to disasters. The impact of natural
disasters, together with the level of poverty in the country, jeopardizes food security. On the
average, 20 tropical cyclones visit the country every year with the strongest typhoons hitting the
country during the last quarter of the year.
Many of the destructive earthquakes that hit the Philippines have magnitudes of 5 or higher,
resulting in death and destruction to properties.
Typhoons
Typhoons are tropical cyclones that have winds of at least 119 kilometers per hour (kph). On the
average, 20 tropical cyclones visit the country every year. Of these, eight to nine typhoons make
landfall (Virola, 2008).
Generally, typhoons passed through the areas of Luzon and Visayas, sidestepping the Mindanao
region. Storm tracks generated from the Pacific Disaster Center (PDC) show that from 1999 to
2009, not a single typhoon passed through Mindanao. On the other hand, the Bicol region
experienced the most number of typhoons from 1946 to 2006. The municipality of Virac in the
province of Catanduanes was the most visited by strongest typhoons (Virola, 2008).
Volcanic Activity
Volcanic activities include such events as eruption of volcanoes, flows of lahar and in some
cases, earthquakes. In the Philippines, there is great potential for volcanic activity since the
country has over 200 volcanoes, 22 of which are classified as active and 21 as potentially active.
Floods and Landslides
Provinces highly susceptible to flooding include: Pampanga, Nueva Ecija, Pangasinan, Tarlac,
Maguindanao, Bulacan, Metro Manila, North Cotabato, Oriental Mindoro and Ilocos Norte.
Areas highly prone to landslides are the provinces of Benguet, Mountain Province, Nueva
Vizcaya, Kalinga-Apayao, Southern Leyte, Abra, Marinduque, Cebu, Catanduanes and Ifugao

Philippines Food and Nutrition Security Atlas, March 2012
42
Philippine Food and Nutrition Security Atlas 2012
Map 19. Location of the Philippines in the Pacific Ring of Fire

Philippines Food and Nutrition Security Atlas, March 2012
43
Philippine Food and Nutrition Security Atlas 2012
Map 20. Storm Tracks in the Philippines, 1999-2011

Philippines Food and Nutrition Security Atlas, March 2012
44
Philippine Food and Nutrition Security Atlas 2012
Map 21. Location of Volcanoes in the Philippines

Philippines Food and Nutrition Security Atlas, March 2012
45
Philippine Food and Nutrition Security Atlas 2012
Map 22. Areas Prone to Landslide in the Philippines

Philippines Food and Nutrition Security Atlas, March 2012
46
Philippine Food and Nutrition Security Atlas 2012
5.2 Forest Cover
Available statistics on Philippine forest cover shows that the term generally refers to all forest
vegetation including mangroves and plantations. In 2003, more than 7 million hectares were
still covered with forest vegetations. Mangroves covered 247,362 hectares while plantation
account for 329, 578 hectares. The total forest cover, therefore account for about 26 percent of
the 30 million total land area of the country.
The amount of forest cover in the country is not enough to meet sustainable needs, including
food security. What forests that we have in the country are inadequate to address the present
needs of a sustainable landscape and this is exacerbated by climate change.
5.3 Impact of Climate Change to the Philippines
Natural disasters in the Philippines highlight the impact of climate change in the country. And
the picture that is emerging is not bright. The number of typhoons coming into the country is
increasing from an average of 27 typhoons (2000-2003) to 39 typhoons (2004-2007). The
number of destructive typhoons is growing and occurring beyond the usual June to September
seasons (Virola, 2008).
Likewise, storm tracks are changing. In December 16, 2011, tropical storm Sendong
(international name Washi) passed through northern Mindanao, a region long-considered to be
outside the typhoon-belt of the country. Still, there seem to be a growing unevenness of
available water to different parts of the country. Some regions of the Philippines are now
experiencing below normal rainfall.
The unpredictability of these natural events is putting unnecessary stresses on the coping
mechanisms of many regions in the country.
5.4 Insurgencies and Armed Conflict
The Philippines is home to one of Asia’s longest running insurgencies. The government is
battling armed groups associated with the Communist Party of the Philippines/New People’s
Army/National Democratic Front of the Philippines (CPP/NPA/NDFP), the Moro Islamic
Liberation Front (MILF), and the Abu Sayyaf Group (ASG). The MILF is mostly located in
Mindanao while the CPP/NPA/NDFP are found in many rural areas in the country. ASG on the
other hand is a terrorist organization mostly found in the provinces of Sulu, Tawi-Tawi, Basilan
and western Mindanao. In spite of the intermittent clashes between government forces and
armed groups, the government is in the process of pursuing peace talks with MILF,
CPP/NPA/NDFP and the CPP-NPA-breakaway group Rebolusyonaryong Partido ng
Manggagawa Pilipinas-Revolutionary Proletarian Army-Alex Boncayao Brigade (RPMP-RPA-
ABB). In the past, the Philippine government has forged peace agreements with the Moro
National Liberation Front (MNLF) and the Cordillera People Liberation Army (CPLA). The lack
of comprehensive resolution to the insurgencies and armed conflict in different parts of the
country is badly affecting the food security of many regions in the country.

Philippines Food and Nutrition Security Atlas, March 2012
47
Philippine Food and Nutrition Security Atlas 2012
Map 23. Forest Cover in the Philippines, 2003

Philippines Food and Nutrition Security Atlas, March 2012
48
Philippine Food and Nutrition Security Atlas 2012
Map 24. Conflict Affected Areas in the Philippines

Philippines Food and Nutrition Security Atlas, March 2012
49
Philippine Food and Nutrition Security Atlas 2012
Chapter 6 - Priority Areas for Action
6.1 Malnutrition and Poverty
It has been widely accepted that malnutrition is caused by household food insecurity and is a
consequences of poverty. Broadening our view on the link between malnutrition and poverty
would lead our focus to the fact that malnutrition is a contributory factor to poverty and
underdevelopment. With the role of food and nutrition security in the alleviation of poverty
greatly emphasized, addressing these issues would require concerted and simultaneous actions
instead of dealing with these problems separately.
Using the latest National Nutrition Surveys results on underweight, stunting and wasting among
children 0-5-year old overlaid with geographic and regional level poverty incidence shows that
the highest rates for all three indexes are found in regions with the highest poverty incidence.
Poverty incidence is defined in the country as the proportion of families or population with per
capita income less than the per capita poverty threshold to the total number of families or
population.
The situation in Bicol Region, ARMM and Eastern Visayas, on the basis of weight-for-age index
and poverty incidence, is the worst when compared with other regions of the country. Low
height-for-age or stunting, used as a measure of chronic malnutrition, when combined with
figures on poverty incidence shows that the top three most affected regions are ARMM, Eastern
Visayas, and Bicol Region. Serious magnitude of wasting/thinness when analyzed against
poverty incidence was observed in ARMM, Northern Mindanao, and Bicol Region.
Clearly, malnutrition and poverty in these regions, particularly in ARMM, Bicol Region and
Eastern Visayas, indicates that focus and new approaches are necessary to examine other
underlying factors and address the vicious cycle between malnutrition and poverty.
6.2 Conflict and Poverty
Armed-conflict and insurgencies has contributed to the instability and relatively higher
incidence of poverty in certain regions of the country. Historical accounts show that the conflict
between the government and groups such as the Communist Party of the Philippines/New
People’s Army/National Democratic Front of the Philippines (CPP/NPA/NDFP) and Moro
Islamic Liberation Front (MILF) have lasted for decades. The presence of MILF particularly in
ARMM, Northern Mindanao and Bicol Region has placed these regions at a disadvantage in

Philippines Food and Nutrition Security Atlas, March 2012
50
Philippine Food and Nutrition Security Atlas 2012
terms putting poverty at a halt and ensuring that the families have better access to good source
of livelihood and other basic services.
The link between poverty was critically examined by Gooodhand (2001). The impact of conflict
is more severe than other external shocks because of deliberate destruction of livelihood and it
may also reverse pre-existing power relations. Displaced populations are found to be living
under the most difficult form of socioeconomic exclusion and deprivation (Goodhand, 2001).
Most of the people in affected areas often struggle to find work, are less likely to work in the
post-conflict period and exhibit lower productivity levels than those that stayed behind. This
was observed among the families in Mindanao who were witnesses to the fighting and
negotiations to over four major cycles of conflict since 1997.
6.3 Floods and Poverty
The Philippines is considered one of the most vulnerable places in the world. Due to its
geographical location the country is prone to many disasters. The combination of the country’s
geography, population density and poverty incidence makes the population vulnerable to floods.
While normal flooding is beneficial for agriculture and fisheries. The short-term negative effects
of catastrophic floods in the country are strong in the immediate aftermath of floods. In 2011,
typhoon Washi (Sending) brought damage to properties which amounted to 1.38 billion and a
record high of 1,257 casualties in Visayas (Regions VI, VII) and Mindanao (Regions (IX, X, XI,
CARAGA and ARMM).
The government started to focus its attention in linking flood risk management with poverty
reduction and urban and regional planning. Areas identified by the government as highly
susceptible to flooding are the NCR, Central Luzon, Ilocos Region, ARMM and MIMAROPA.
Households in these areas are also exposed to extremely high vulnerability. Targeting
households in these regions may mitigate future risks to flooding.

Philippines Food and Nutrition Security Atlas, March 2012
51
Philippine Food and Nutrition Security Atlas 2012
Map 25. Philippine Poverty Incidence with Underweight

Philippines Food and Nutrition Security Atlas, March 2012
52
Philippine Food and Nutrition Security Atlas 2012
Map 26. Philippine Poverty Incidence with Underheight

Philippines Food and Nutrition Security Atlas, March 2012
53
Philippine Food and Nutrition Security Atlas 2012
Map 27. Philippine Poverty Incidence with Thinness

Philippines Food and Nutrition Security Atlas, March 2012
54
Philippine Food and Nutrition Security Atlas 2012
Map 28. Conflict Affected Areas with Poverty Incidence

Philippines Food and Nutrition Security Atlas, March 2012
55
Philippine Food and Nutrition Security Atlas 2012
Map 29. Flood-Prone Areas with Poverty Incidence

Philippines Food and Nutrition Security Atlas, March 2012
56
Philippine Food and Nutrition Security Atlas 2012
References Bureau of Agricultural Statistics, Department of Agriculture. Carabao industry performance report (carabeef
and dairy). January-June 2011. Quezon City: Bureau of Agricultural Statistics. 2011
Bureau of Agricultural Statistics, Department of Agriculture. Cattle industry performance report (beef and
dairy). January-June 2011. Quezon City: Bureau of Agricultural Statistics. 2011
Bureau of Agricultural Statistics, Department of Agriculture. Swine industry performance report. January-
June 2011. Quezon City: Bureau of Agricultural Statistics. 2011
Bureau of Agricultural Statistics, Department of Agriculture. Goat industry performance report. January-June
2011. Quezon City: Bureau of Agricultural Statistics. 2011
Bureau of Agricultural Statistics, Department of Agriculture. Chicken industry performance report. January-
June 2011. Quezon City: Bureau of Agricultural Statistics. 2011
Bureau of Agricultural Statistics, Department of Agriculture. Duck industry performance report. January-June
2011. Quezon City: Bureau of Agricultural Statistics. 2011
Bureau of Agricultural Statistics, Department of Agriculture. Fisheries Situationer. January-December 2011.
Quezon City: Bureau of Agricultural Statistics. 2011
Food and Nutrition Research Institute.7th National Nutrition Survey. Taguig City: Food and Nutrition Research
Institute- Department of Science and Technology. 2008.
Goodhand J. Violent conflict, poverty and chronic poverty. CPRC Working Paper 6. Chronic Poverty Research
Center, 2001.
National Statistics Office. 2009 Family Income and Expenditure Survey.
National Statistics Office. Annual labor and employment estimates for 2010 and 2011. Internet:
www.census.gov.ph
National Statistics Office. 2010 Survey on Overseas Filipinos. http://www.census.gov.ph/
National Statistics Office (Philippines) and ICF Macro. Philippines National Demographic and Health Survey
2008: key findings. Calverton, Maryland, USA: NSO and ICF Macro. 2009.
National Statistics Office. Characteristics of Poor Families in the Philippines (Findings from the 2008 annual
poverty indicators survey).Special release no. 503. 2010. Internet:
www.census.gov.ph/data/sectordata/ap2008tx.html
Virola RA. Statistically Speaking: Some things you better know about the typhoons in the Philippines! 2008.
Internet: http://www.nscb.gov.ph/headlines/StatsSpeak/2008/081408_rav_typhoons.asp
World Food Programme, Food Security Analysis Service. Comprehensive food security and vulnerability
analysis guidelines. 1st Edition. Italy: United Nations World Food Programme. 2009
World Health Organization (WHO).Physical Status: the use and interpretation of anthropometry. Switzerland:
World Health Organization. 1995.

Philippines Food and Nutrition Security Atlas, March 2012
57
Philippine Food and Nutrition Security Atlas 2012
World Food Programme - Philippines
5th Floor, G. C. Corporate Plaza
150 Legazpi Street, Legaspi Village, Makati City, 1229
Tel: + 63-2-7502561
Fax: + 63-2-7502562
e-mail: [email protected]
Website: http://www.wfp.org/countries/philipines