Phase equilibrium and thermodynamic study of the iron ...
79
Scholars' Mine Scholars' Mine Masters Theses Student Theses and Dissertations 1971 Phase equilibrium and thermodynamic study of the iron-copper- Phase equilibrium and thermodynamic study of the iron-copper- carbon system carbon system Krishna Parameswaran Follow this and additional works at: https://scholarsmine.mst.edu/masters_theses Part of the Metallurgy Commons Department: Department: Recommended Citation Recommended Citation Parameswaran, Krishna, "Phase equilibrium and thermodynamic study of the iron-copper-carbon system" (1971). Masters Theses. 7220. https://scholarsmine.mst.edu/masters_theses/7220 This thesis is brought to you by Scholars' Mine, a service of the Missouri S&T Library and Learning Resources. This work is protected by U. S. Copyright Law. Unauthorized use including reproduction for redistribution requires the permission of the copyright holder. For more information, please contact [email protected].
-
Upload
khangminh22 -
Category
Documents
-
view
0 -
download
0
Transcript of Phase equilibrium and thermodynamic study of the iron ...

Scholars' Mine Scholars' Mine
Masters Theses Student Theses and Dissertations
1971
Phase equilibrium and thermodynamic study of the iron-copper-Phase equilibrium and thermodynamic study of the iron-copper-
carbon system carbon system
Krishna Parameswaran
Follow this and additional works at: https://scholarsmine.mst.edu/masters_theses
Part of the Metallurgy Commons
Department: Department:
Recommended Citation Recommended Citation Parameswaran, Krishna, "Phase equilibrium and thermodynamic study of the iron-copper-carbon system" (1971). Masters Theses. 7220. https://scholarsmine.mst.edu/masters_theses/7220
This thesis is brought to you by Scholars' Mine, a service of the Missouri S&T Library and Learning Resources. This work is protected by U. S. Copyright Law. Unauthorized use including reproduction for redistribution requires the permission of the copyright holder. For more information, please contact [email protected].
PHASE EQUILIBRIUM AND THERMODYNAMIC /.' ·--· ~ ·-'~•.7
STUDY OF THE IRON-COPPER-CARBON SYSTEM
BY
KRISHNA PARAMESWARAN, 1946-
A THESIS
Presented to the Faculty of the Graduate School of the
UNIVERSITY OF MISSOURI-ROLLA
In Partial Fulfillment of the Requirements for the Degree
MASTER OF SCIENCE IN METALLURGICAL ENGINEERING
1971
Approved by
---6,...:.-£2-=-_rz_~-~<Advisor>
T2537 78 pages c.l

ii
ABSTRACT
Gas carburization experiments were conducted at 950°C in order to
study the phase relations and to determine the activity of carbon in
the iron-rich corner of the iron-copper-carbon system. The solubility
of graphite in eq~ilibrium with iron-copper alloys was determined at 0 0 0
950 , 1000 , and 1050 c. The results of gas carburization and graphite
solubility experi~ents at 950°C were used in constructing an isothermal
section of the iron-rich end of the iron-copper-carbon phase diagram,
on which are superimposed carbon isoactivity lines. Graphite solubil
ity data at 1000° and 1050°C were used to construct similar diagrams
without the isoactivity lines.
The effect of carbon content on the solidus temperature of an
alloy initially containing 90% copper and 10% iron was studied by gas
carburization and graphite equilibration techniques. The effect of
copper on the rate of carburization was determined in a semi-quantita
tive way.
The results are discussed in terms of application to heat treat
ment of copper bearing steels and to the liquid phase sintering of
iron-copper-carbon powder metallurgy parts.
ACKNOWLEDGEMENTS
The author gratefully acknowledges the invaluable guidance of
his advisor Dr. A.E. Morris during the entire project. He would
like to thank the International Copper Research Association for the
financial support.
iii
TABLE OF CONTENTS
ABSTRACT •••••••••
ACKNOWLEDGEMENTS.
LIST OF FIGURES.
LIST OF TABLES ••
... . ... ....
I. INTRODUCTION ••
II. REVIEW OF LITERATURE ••• . ......
III.
IV.
A.
B.
c. D.
Phase Diagrams •••
1. Iron-Copper System.
2. Copper-Carbon System.
3. Iron-Carbon System •••
4. Iron-Copper-Carbon System ••
Physical Metallurgical Considerations ••.••••••.
1. Effect of Copper on Transformation Temperatures.
2. Microstructure •••••••••.••.••••.
Thermodynamics of Related Systems •••
Copper in Steel and Cast Iron.
E. Copper in Powder Metallurgy.
EXPERIMENTAL PROCEDURE.
A.
B.
c. D.
E.
F.
G.
H.
General . ........... .
Furnaces and Temperature Control ••
Temperature Measurements ••
Atmosphere Control ••
Starting Materials •.
Alloy Preparation .••••..•••••.
Gas Carburization Experiments.
Graphite Solubility Experiments.
I. Solidus Temperature Determination ••
EXPERIMENTAL RESULTS AND DISCUSSION.
A.
B.
Presentation .••.••••.•
Discussion of Results.
1. Gas Carburization and Graphite Solubility.
2.
3.
Solidus Temperature Determination .•.
Kinetics of Carburization •.••••••••.
iv
Page
ii
. iii
vi
. viii
1
3
3
3
5
6
6
6
6
10
10
11
12
16
16
16
19
19
23
24
24
25
27
28
28
42
42
45
45
c. Suggestions for Further Work ................•.......•. 46
v. SUMMAR):' AND
v
Page
48 CONCLUSIONS • •..• , •••.••• , ............. , • • · • · ..... .
B IBL IOGRA.PHY • ••••••••.••••••••.••. I ••••••••••••••••••••••••••••••••• 49
53 VITA . ...•..•....•................................•.•.•...•..........
APPENDICES • ••••••••••••••.••••• - •.••• IIIJ .......... , •••••••••••••••••••• 54
I. CALCULATION OF ATMOSPHERES WITH A SPECIFIC 0
ACTIVITY OF CARBON AT 950 C •••••••••••• , •• ,................ 55 0
A. Gurry's Diagram at 950 C and 1 Atm Pressure •••••••••••• 55
B. Source of Data for the Calculations •••••••••••••••••••• 57
II. STARTING MATERIALS AND LIST OF ALLOYS PREPARED ••••••••••••• 59
III. WEIGHING PROCEDURE AND SOURCES OF ERRORS IN
THERMOGRAVIMETRY. • • • • • • • • • • • • • • • • • • • • • • • • • • • • • • • • • • • • • • • • • • 60
IV. SUMUARY OF EXPERIMENTAL RESULTS,. • • • • • • • • • • • • • • • • • • • • • • • • • • 62
A. Gas Carburization Experiments. • • • • • • • • • • • • • • • • • • • • . • • • • 62
B. Graphite Solubility Experiments •••••••••••••••••••.•••• 67
C. Solidus Temperature Determination....... • • • • • • • • • • • • • • • 68
D. Rate of Carburization.............. • • • • • • • • • • • • • • • • • • • • 68
E. Activity Coefficients for Carbon... • • • • • • • • • • • • • • • • • • • • 69
vi
LIST OF FIGURES
Figure Page
1. The Iron-Copper Phase Diagram. • • • . • • • . • • • . . • • . . . . . . • . • . • • • • . . . 4
2. The Iron-Copper-Carbon System - Composition of Conjugate
Liquids at Liquidus Temper a tures. . • . . • • • . . . . . • . • • . . . • . • . • . . . . . 7
3. The Iron-Copper-Carbon System - Lower Limit of the Austenite
Field. . . . . . . . . . . . . . . . . . . . . . . . . . . . . . . . . . . . . . . . . . . . . . . . . . . . . . . . . 8
4(a) Effect of Copper on Allotropic Temperatures for a 0.5%
Carbon Steel.................................................. 9
4(b) Effect of Copper on M Temperature for a 0.5% Carbon Steel •••• 9 s
5. Effect of Copper on Carbon Pickup During Sintering ••••.•••..•• 14
6. Schematic Diagram of the Apparatus for Gas Carburization
Experiments. . . . . . . . . . . . . . . . . . . . . . . . . . . . . . . . . . . . . . . . . . . . . . . . . . . 17
7. Schematic Diagram of the Apparatus for Graphite Solubility
Experiments. . . . . . . . . . . . . . . . . . . . . . . . . . . . . . . . . . . . . . . . . . . . . . . . . . . 18
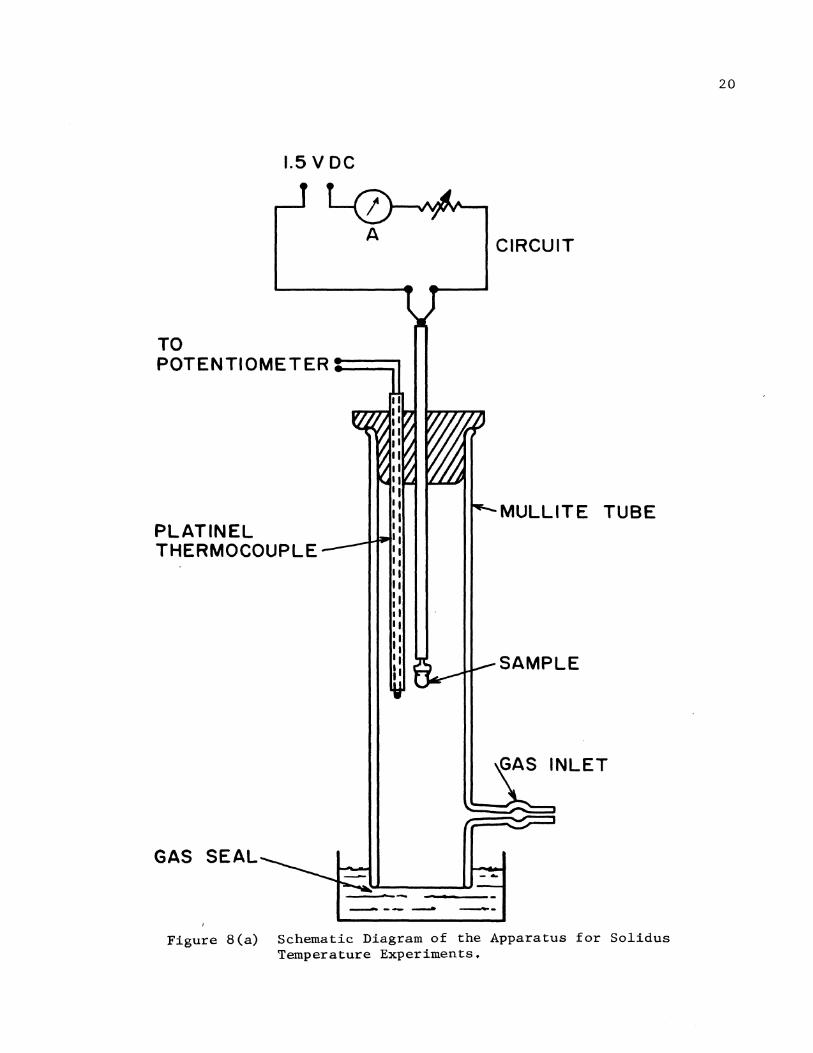
8(a) Schematic Diagram of the Apparatus for Solidus Temperature
Experiments (Gas Carburization)............................... 20
8(b) Schematic Diagram of the Apparatus for Solidus Temperature
Experiments (Equilibrium with Graphite) ..••.•••...•••••.•.••.• 21
9. The Carbon-Oxygen-Hydrogen System at 950°C and 1 Atm Pressure. 22
lO(a) Activity of Carbon vs % Carbon at 950°C for a 0.3% Copper
Alloy ......................................................... 29
lO(b) Activity of Carbon vs% Carbon at 950°C for a 0.7% Copper
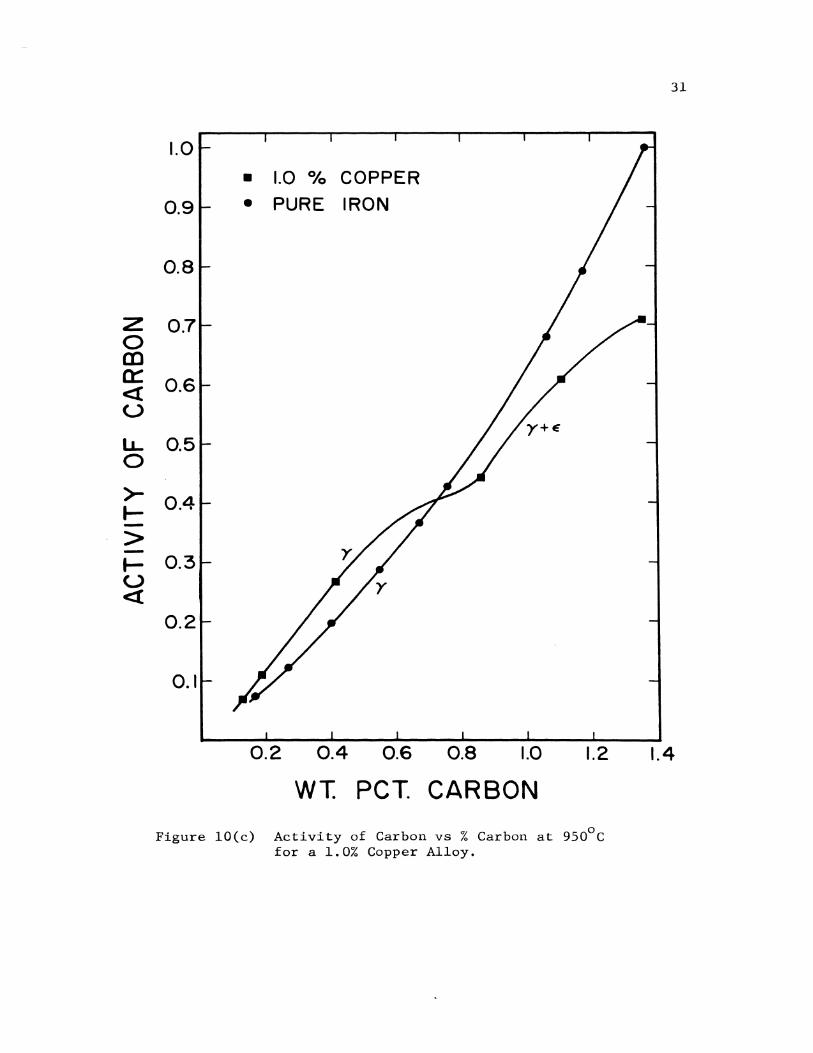
Alloy......................................................... 30 lO(c) Activity of Carbon vs % Carbon at 950°C for a 1.0% Copper
Alloy. . . . . . . . . . . . . . . . . . . . . . . . . . . . . . . . . . . . . . . . . . . . . . . . . . . . . . . . . 31
lO(d) Activity of Carbon vs % Carbon at 950°C for a 1.3% Copper
Alloy. . . . . . . . . . . . . . . . . . . . . . . . . . . . . . . . . . . . . . . . . . . . . . . . . . . . . . . . . 32
lO(e) Activity of Carbon vs % Carbon at 950°C for a 2.5% Copper
Alloy. . . . . . . . . . . . . . . . . . . . . . . . . . . . . . . . . . . . . . . . . . . . . . . . . . . . . . . . . 33
lO(f) Activity of Carbon vs % Carbon at 950°C for a 3.0% Copper
Alloy......................................................... 34
lO(g) Activity of Carbon vs % Carbon at 950°C for a 3.5% Copper
Alloy. . . . . . . . . . . . . . . . . . . . . . . . . . . . . . . . . . . . . . . . . . . . . . . . . . . . . . . . . 35
11. Isothermal Section of the Iron-Rich End of the Iron-Copper-
Carbon Phase Diagram.......................................... 36

vii
Page
12. The Effect of Temperature on the Extent of the Austenite
Field. . . . . . . . . . . . . . . . . . . . . . . . . . . . . . . . . . . . . . . . . . . . . . . . . . . . . . . . . . 38
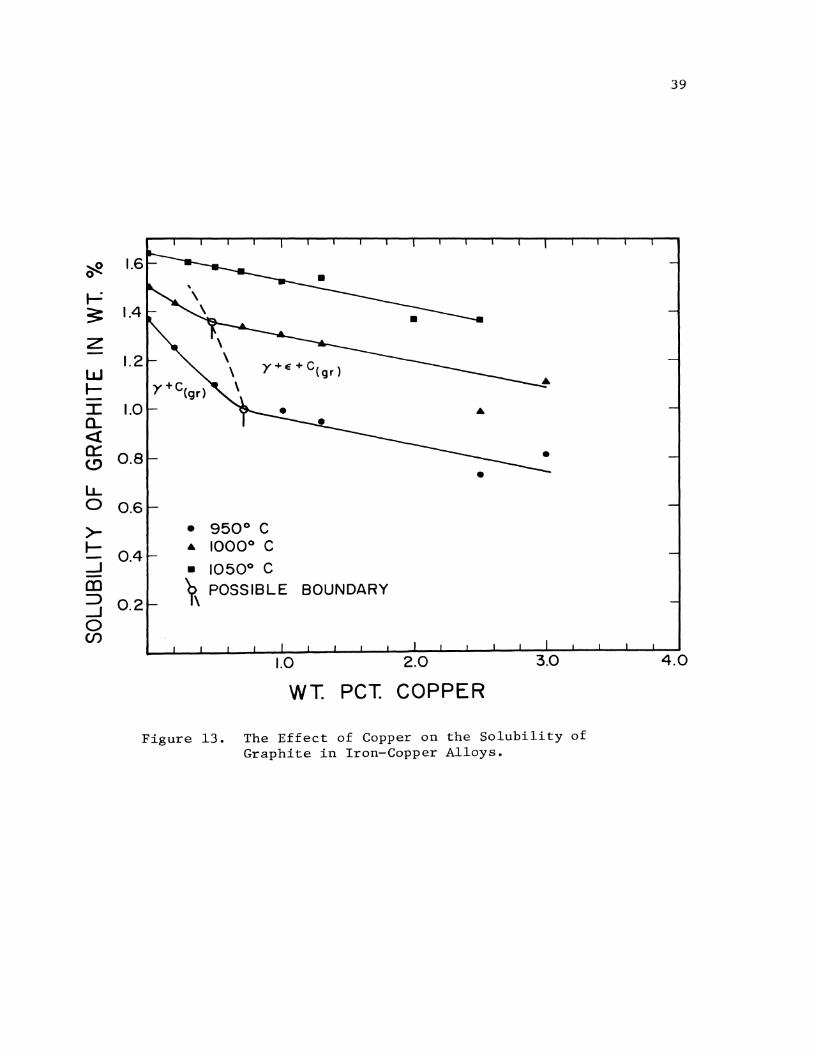
13. The Effect of Copper on the Solubility of Graphite in
Iron-Copper Alloys. . . . . . . . . . . . . . . . . . . . . . . . . . . . . . . . . . . . . . . . . . . . . 39
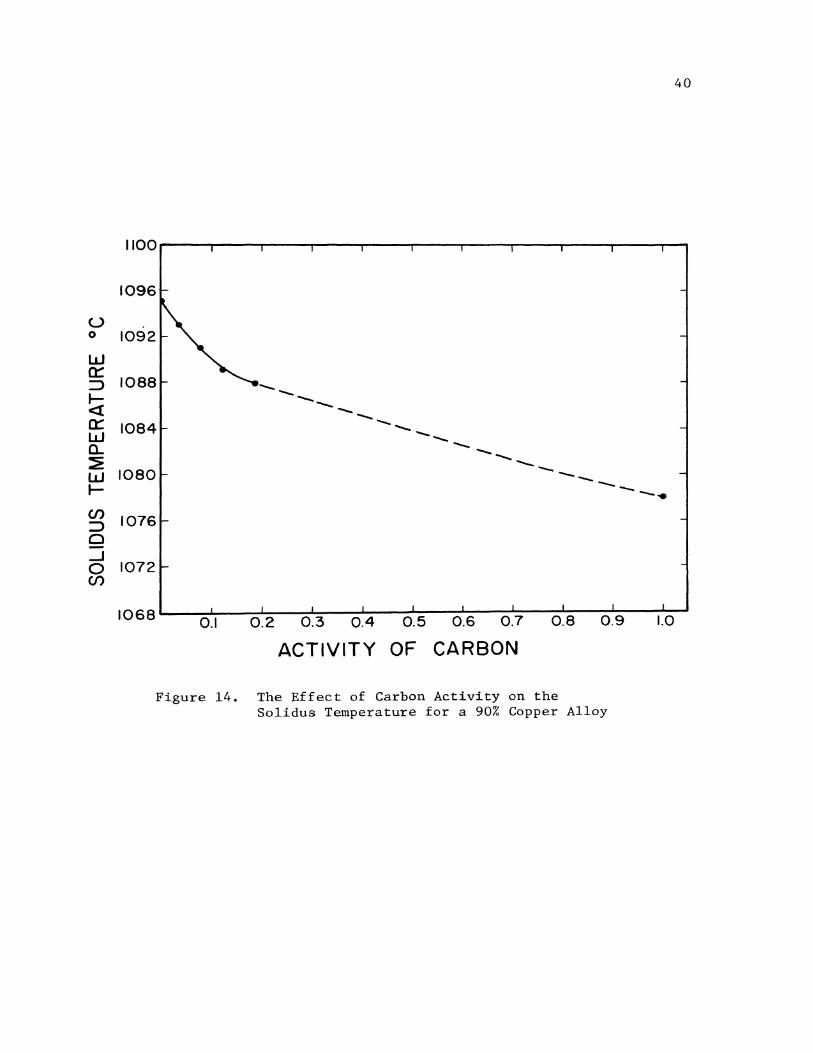
14. The Effect of Carbon Activity on the Solidus Temperature
for a 90% Copper Alloy. • . • . • . • . • . • • • • • • • . • • • • • • . • . • . . • . . • . • • . • • 40
15. The Effect of Copper Content of the Alloy on Time to Reach
the Equilibrium Carbon Content During Gas Carburization .•.••••• 41
16. The Effect of Copper on the Activity Coefficient of Carbon •.••. 44
viii
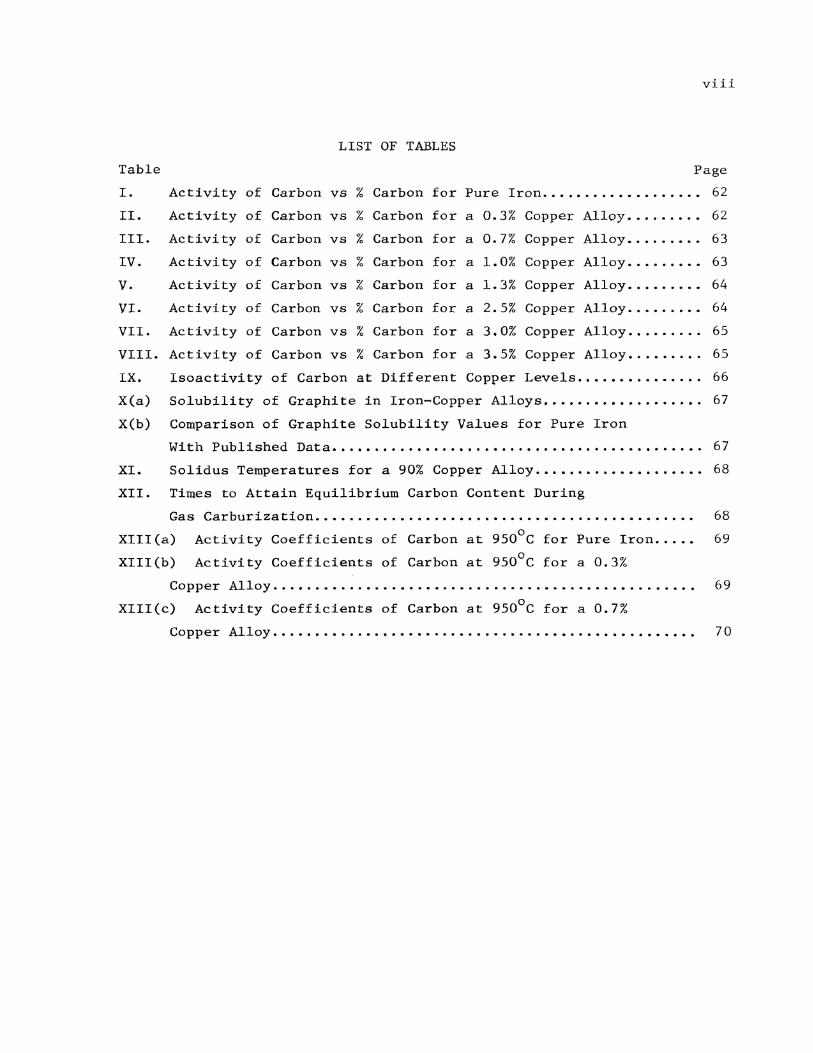
LIST OF TABLES
Table Page
I. 62
II. 62
III. 63
IV. 63
v. 64
VI. 64
VII. 65
VIII. 65
IX. 66
X(a) Solubility of Graphite in Iron-Copper Alloys .•••...•••••.....•. 67
X(b) Comparison of Graphite Solubility Values for Pure Iron
With Published Data. • . • • . • . . • • • • . . • • . . . . • . . . • • • • . . . . . • • • • . . . . . . 6 7
XI. Solidus Temperatures for a 90% Copper Alloy ...••.......•...•... 68
XII. Times to Attain Equilibrium Carbon Content During
Gas Carburiza tion. . . . . . . . . . . . . . . . . . . . . . . . . . . . . . . . . . . . . . . . . . . . . 68
XIII (a)
XIII(b)
Activity Coefficients of Carbon at 950°C for Pure Iron •..••
Activity Coefficients of Carbon at 950°C for a 0.3%
69
Copper Alloy. . . . . . . . . . . . . . . . . . . . . . . . . . . . . . . . . . . . . . . . . . . . . . . . . . 6 9
XIII(c) Activity Coefficients of Carbon at 950°C for a 0.7%
Copper Alloy. . . . . . . . . . . . . . . . . . . . . . . . . . . . . . . . . . . . . . . . . . . . . . . . . . 7 0
1
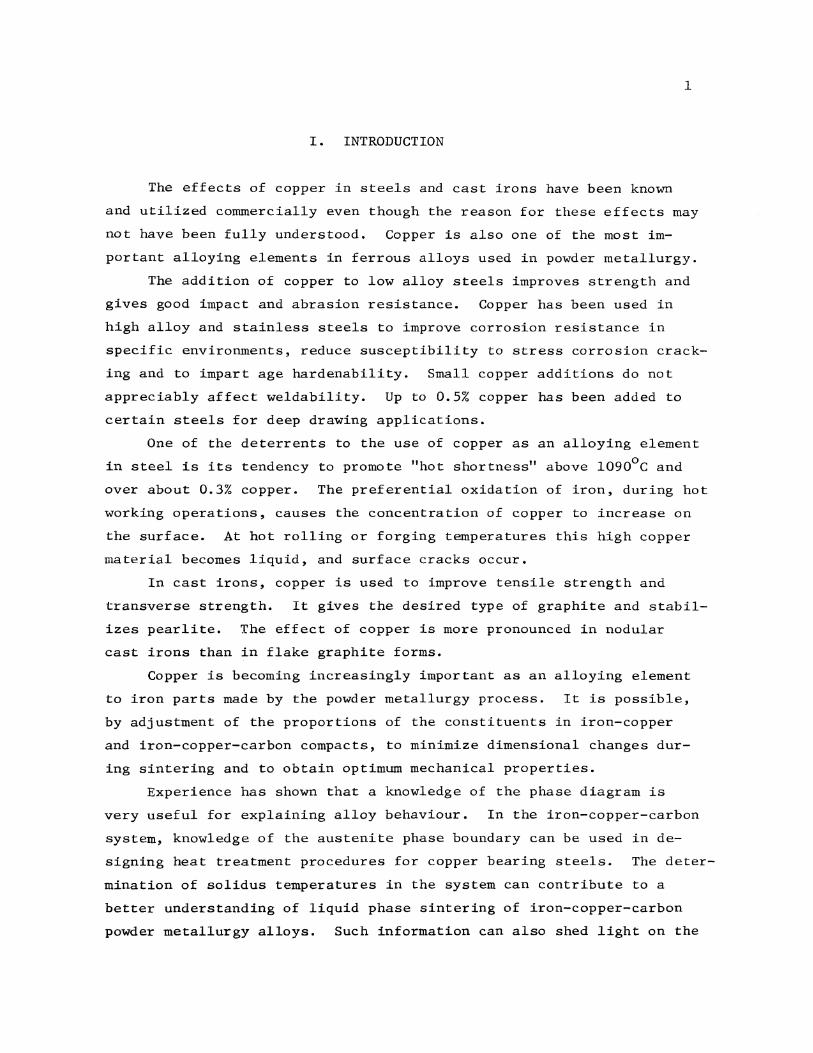
I. INTRODUCTION
The effects of copper in steels and cast irons have been known
and utilized commercially even though the reason for these effects may
not have been fully understood. Copper is also one of the most im
portant alloying elements in ferrous alloys used in powder metallurgy.
The addition of copper to low alloy steels improves strength and
gives good impact and abrasion resistance. Copper has been used in
high alloy and stainless steels to improve corrosion resistance in
specific environments, reduce susceptibility to stress corrosion crack
ing and to impart age hardenability. Small copper additions do not
appreciably affect weldability. Up to 0.5% copper has been added to
certain steels for deep drawing applications.
One of the deterrents to the use of copper as an alloying element
in steel is its tendency to promote "hot shortness" above 1090°C and
over about 0.3% copper. The preferential oxidation of iron, during hot
working operations, causes the concentration of copper to increase on
the surface. At hot rolling or forging temperatures this high copper
material becomes liquid, and surface cracks occur.
In cast irons, copper is used to improve tensile strength and
transverse strength. It gives the desired type of graphite and stabil
izes pearlite. The effect of copper is more pronounced in nodular
cast irons than in flake graphite forms.
Copper is becoming increasingly important as an alloying element
to iron parts made by the powder metallurgy process. It is possible,
by adjustment of the proportions of the constituents in iron-copper
and iron-copper-carbon compacts, to minimize dimensional changes dur
ing sintering and to obtain optimum mechanical properties.
Experience has shown that a knowledge of the phase diagram is
very useful for explaining alloy behaviour. In the iron-copper-carbon
system, knowledge of the austenite phase boundary can be used in de
signing heat treatment procedures for copper bearing steels. The deter
mination of solidus temperatures in the system can contribute to a
better understanding of liquid phase sintering of iron-copper-carbon
powder metallurgy alloys. Such information can also shed light on the
temperature and composition ranges where "hot shortness" occurs in
steels containing copper.
2
In the present investigation, the iron-rich end of the iron
copper-carbon phase diagram was studied at 950°C by gas carburization
experiments. The solubility of graphite in iron-copper alloys was 0 0 0 determined at 950 , 1000 , and 1050 C and the solidus temperature
was determined for a 90% copper-iron alloy.

3
II. REVIEW OF LITERATURE
Much has been published about the use of copper in ferrous alloys,
particularly in terms of phase transformations and heat treatment pro
cedures for copper bearing steels. Hot shortness in copper contain
ing steels and the problem of copper accumulation in steel scrap has
been discussed in the literature. The effect of copper on the pro
perties of cast irons has also been extensively studied. Despite the
importance and use of copper in ferrous systems, there is still,
however, no complete phase diagram for the iron-copper-carbon system.
A bibliography1 entitled "Copper in Steel" was published by
the British Iron and Steel Research Association and covers work done
during the period 1951-1963. Another bibliography2 to be published
by INCRA, covers the period 1964 to 1970, plus some important earlier
work, and contains references on copper in iron, steels and related
systems.
The literature has been reviewed in the following section under
the headings of: (A) Phase Diagrams, (B) Physical Metallurgical
Considerations, (C) Thermodynamics of Related Systems, (D) Copper
as an Alloying Element in Steel and Cast Irons, and (E) The Use of
Copper in Powder Metallurgy.
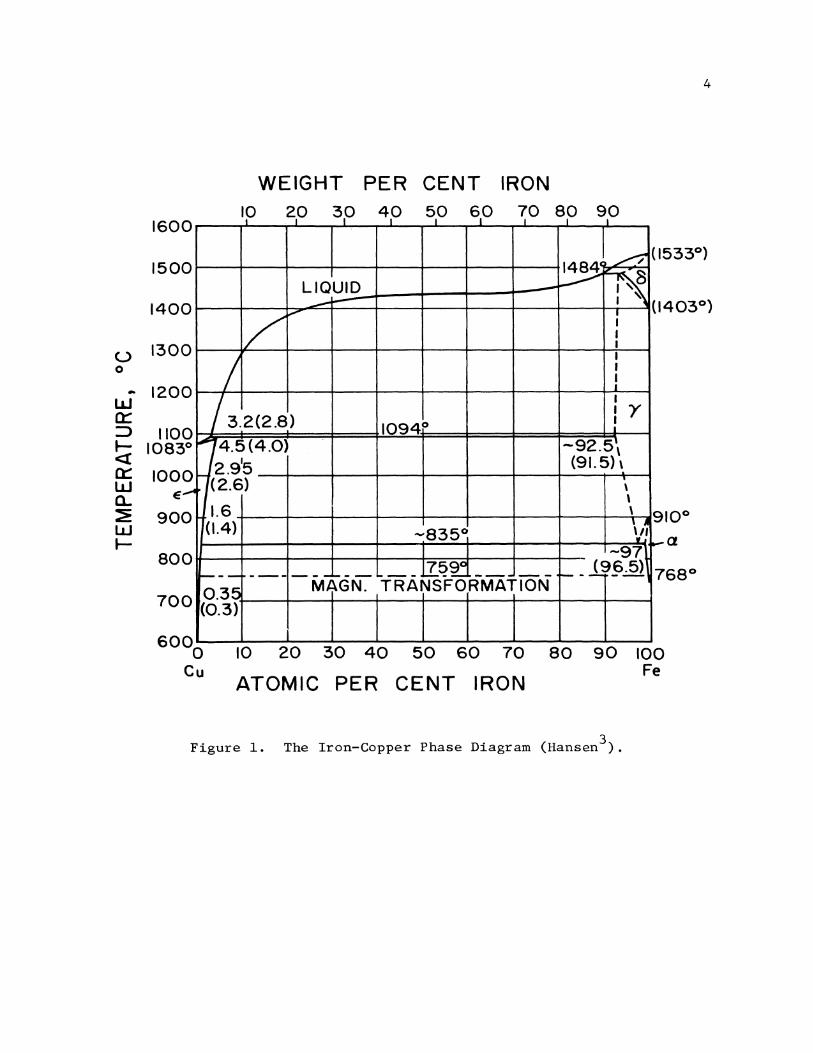
A. Phase Diagrams
1. Iron-Copper System
The iron-copper phase diagram, taken from Hansen, 3 is presented
in Figure 1. Hansen3 also gives a thorough review of the work done
on the system up to 1957. A review of more recent work, up to 1963
was done by Elliott~ The most recent version of the phase diagram
is presented by Hultgren et a1, 5 but their diagram is essentially the
same as presented in Hansen. 3 The stable solid phases that exist in
this system are: delta o, austenite y, ferrite a, and epsilon E.
One of the points of great controversy in earlier work was the
existence of a wide miscibility gap in the liquid state. It was be
lieved that liquid segregation occured in iron-copper alloys. However, 6 on the basis of later, more careful work, by Maddocks and Claussen,
it was found that with the use of relatively pure iron and copper no
160 0
150 0
1400
(.) 1300 0
.. 120 w 0
0:: :::>
~ 0:: w a.. ~ w 1-
110 1083
0 0
100 0 E ~
90 0
80 0
70 0
WEIGHT PER CENT IRON 10 20 30 40 50 60 70 80 90
I I I I I I I I I
~ (I 1484 cf~ LIQUID -~ _.. - I ~
(I
i/ ,..
I I I
j I I
~
I I •Y 3.2(2.8) 1094° :
I'" 4.5 (4.0) -92.5\
r-/2.915 (91. 5) \ (2.6) \
\ 1.6 \ 9
(1.4) -835° \A w -97
J.l:_59Cl r-- j_9~.5) 1---~--- - MAGN. .. TRANSFoRMATION 7
0.35 (0.3)
10 20 30 40 50 60 70
ATOMIC PER CENT IRON
80 90 100 Fe
Figure 1. The Iron-Copper Phase Diagram (Hansen3 ).
4

miscibility gap existed. Liquid segregation was apparently promoted
by the presence of impurities such as carbon and silicon.
5
The presently accepted value for the peritectic temperature
involving the delta phase is 1484°C. The peritectic temperature in
volving austenite phase is taken as 1094°C, The reported temperatures
for the eutectoid reaction y = a + E, differ widely. Hansen3 takes
a value of 835 + 15°C. A similar uncertainty exists for the eutectoid
composition; Hansen3 reports it to lie between 2.5-3.5%* copper.
The solubility limits of copper in austenite and ferrite phases
were determined by Speich et a1. 7 They determined the interdiffusion
coefficients for copper in austenite and ferrite from concentration
penetration curves obtained by electron microprobe analysis. They
calculated the solubility limits for copper in the austenite (tempera-a o o o
ture range 929 -1020 C) and ferrite (temperature range 699 -859 C)
phases, by extrapolation of the diffusion data. The solubility limits
were represented as equations obtained by least square analysis and
are given below:
yFe: log C(% Cu)
aFe: log C(% Cu)
=- 2574 + 2.716 T
= - 4~00 + 4.335
where T is in °K. The austenite solubilities of Speich et al. are
(1)
(2)
3 lower than the values reported by Hansen. An extrapolation of their
austenite solubility data gave a eutectoid composition of 2.6% copper.
This is in good agreement with the value of 2.8% copper, which they
obtained by a thermodynamic treatment.
2. Copper-Carbon System
The solubility of carbon in copper is exceedingly small. Hansen3
reports the following solubility values: 0.0001% carbon at 1100°C,
0.00015% carbon at 1300°C, 0.0005% carbon at 1500°C and 0.003% carbon
at 1700°C.
* % in this work, refers to weight percent.
6
3. Iron-Carbon System
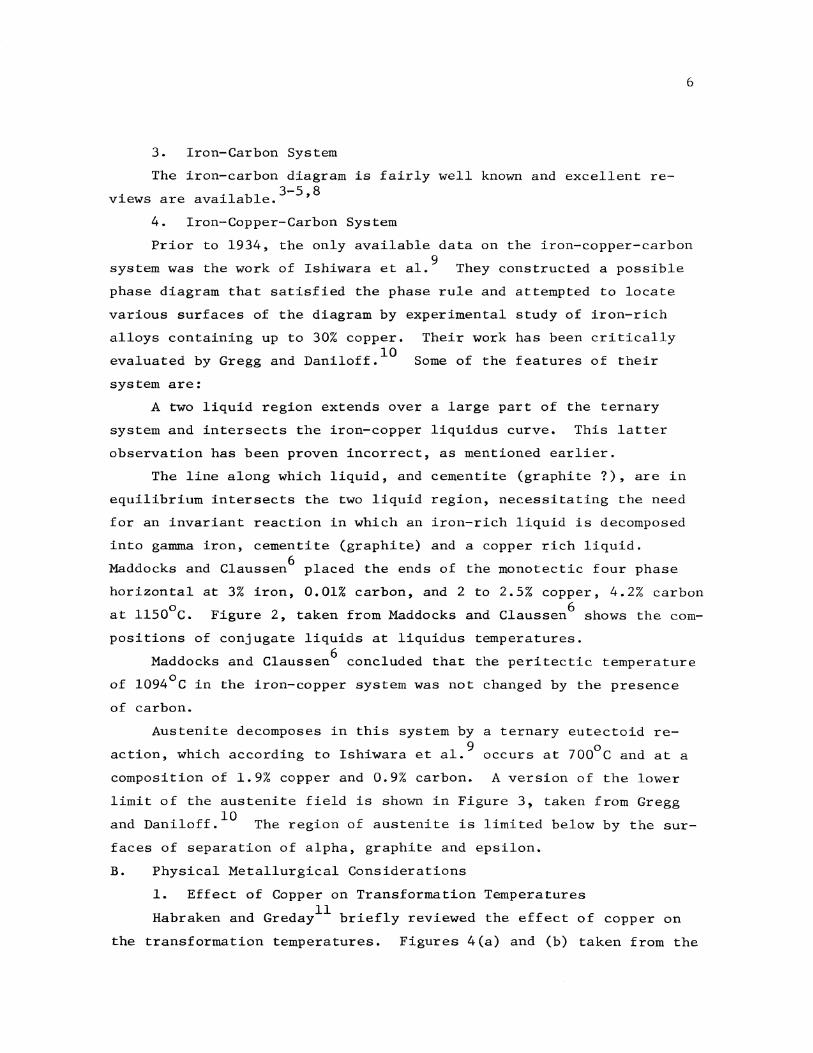
The iron-carbon diagram is fairly well known and excellent re-. .1 bl 3-5,8 v1ews are ava1 a e.
4. Iron-Copper-Carbon System
Prior to 1934, the only available data on the iron-copper-carbon
system was the work of Ishiwara et al. 9 They constructed a possible
phase diagram that satisfied the phase rule and attempted to locate
various surfaces of the diagram by experimental study of iron-rich
alloys containing up to 30% copper. Their work has been critically
evaluated by Gregg and Daniloff. 10 Some of the features of their
system are:
A two liquid region extends over a large part of the ternary
system and intersects the iron-copper liquidus curve. This latter
observation has been proven incorrect, as mentioned earlier.
The line along which liquid, and cementite (graphite?), are in
equilibrium intersects the two liquid region, necessitating the need
for an invariant reaction in which an iron-rich liquid is decomposed
into gamma iron, cementite (graphite) and a copper rich liquid.
Maddocks and Claussen6 placed the ends of the monotectic four phase
horizontal at 3% iron, 0.01% carbon, and 2 to 2.5% copper, 4.2% carbon
at 1150°C. Figure 2, taken from Maddocks and Claussen6 shows the com
positions of conjugate liquids at liquidus temperatures.
Maddocks and Claussen6 concluded that the peritectic temperature
of 1094°C in the iron-copper system was not changed by the presence
of carbon.
Austenite decomposes in this system by a ternary eutectoid re
action, which according to Ishiwara et al. 9 occurs at 700°C and at a
composition of 1.9% copper and 0.9% carbon. A version of the lower
limit of the austenite field is shown in Figure 3, taken from Gregg
and Daniloff. 10 The region of austenite is limited below by the sur
faces of separation of alpha, graphite and epsilon.
B. Physical Metallurgical Considerations
1. Effect of Copper on Transformation Temperatures
Habraken and Greday11 briefly reviewed the effect of copper on
the transformation temperatures. Figures 4(a) and (b) taken from the

u.f QOO\t__L_:~-+--\--t--t= ~ QQ\\
~
I
cr:: uJ 0.. ~ uJ t-
I
(.) 0
Figure 2. The Iron-Copper-Carbon System - Composition of Conjugate Liquids at Liquidus Temperatures
(Maddocks and Claussen6).
7
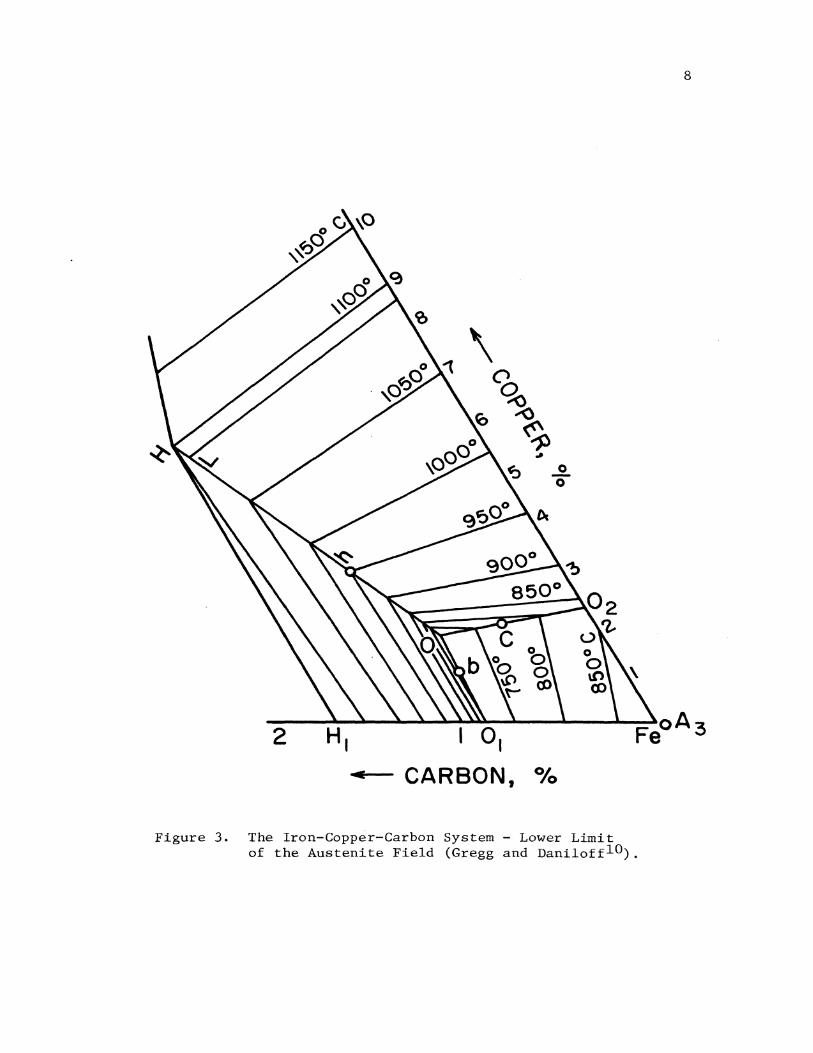
Figure 3.
2
0 0
I 0 1
CARBON, 0/o
The Iron-Copper-Carbon System - Lower Limit of the Austenite Field (Gregg and DanilofflO).
8

-u 0 -
<l
9
-101------
® -20r-------~---------r--------4---~~~
0
0
~ -5
-10
-15
-20
0
@
0.5 1.0
COPPER
• ~ -. ~
0.5 1.0
COPPER (0/o)
1.5 2.0
"• ~~ ~
1.5 2.0
figure 4(a) Effect of Copper on Allotropic Temperatures 11 for a 0.5% Carbon Steel (Habraken and Greday ).
Figure 4(b) Effect of Copper on M Temperature for a 0.5% Carbon Ste~l (Habraken and Greday11).

10
work represents the effect of copper on the lowering of the allotropic
and M temperatures for a 0.5% carbon steel. They have also reviewed s
work done on continuous transformation diagrams of copper-containing
steels. They report that copper retards the transformation of austen
ite more or less equally at all temperatures and that it increases the
resistance to softening during tempering.
2. Microstructure
Lund and Lawson12 examined the microstructure of quenched 4.8%
and 7.5% copper, iron-copper alloys by X ray diffraction, optical,
and electron microscopy. The 7.5% copper alloy showed epsilon phase
along the austenite grain boundaries and was believed to be proeutectoid
in origin. They found that the austenite phase in the iron-copper
system transforms to produce massive martensite of the same composi
tion as the parent phase and that the transformation is accompanied
by shear.
C. Thermodynamics of Related Systems
The activity of carbon in austenite13- 16 and in molten iron17 •18
has been determined by a number of investigators, generally by equili
bration with co-co2 mixtures. The most recent work is by Ban-Ya et
a1. 13 ~n which new data on the activity of carbon in austenite in the 0 0
temperature range 900 -1400 C was obtained. They derived the follow-
ing equation for the activity of carbon in austenite as a function
of temperature, with graphite as the standard state for carbon:
log a c
3770 3860 y c -- + 2. 72 log T - 10.525 + ---=-T T + log z
c (3)
o Yc where T is in K, y is the atom ratio of carbon to iron, and z
. . .19 c . c 1-y Chr1st1n1 determ1ned the activity of iron in the iron-copper c
0 0 system at 1050 to 1300 C, by a solid electrolyte technique. The
activity of copper was calculated by a Gibbs-Duhem integration. Dem
chalk20 determined the activity of iron and copper in iron-copper aus
tenite in the temperature range 1300°-1466°C, by bringing discs of
iron-copper solid solutions in contact with liquid silver-copper alloys
of known copper activity. The copper content in the iron-copper alloys
was determined by microprobe analysis and in silver-copper alloys by
11
atomic absorption spectrophotometry. He also determined the effect of
carbon on the activity of copper at 1300°C. His equation for the 0
activity coefficient of copper Ycu' at 1300 C, is given below:
ln y Cu 3.558- 32.75 XCu + 27.00 XC
XCu' XC are mole fractions of copper and carbon.
(4)
The published data on the activity of carbon in alloyed austenite 21
has been reviewed by Chipman and Brush. The Henrian activity coeffi-
cient at 1000°C was expressed in terms of interaction parameters among
the solute elements. Yoshida and Sano22 found a slight decrease in
the activity of carbon with copper addition in the temperature range
850-950°C. Chipman and Brush, in noting the work of Yoshida and Sano,
mention a lack of quantitative data for establishing interaction para
meters for copper-carbon austenite.
D. Copper in Steel and Cast Iron
A recent review of the effects of copper in steels is given by 11
Habraken and Greday. They cited three advantages of copper addition
to steels: improved mechanical properties, increased wear resistance,
and improved corrosion resistance. The most widely used copper bear
ing steels contain between 0.2-0.6% copper. The best known copper con
taining steels are high strength low alloy grades, that had higher
yield strength than ordinary steels while the ductility remained com
parable. The strengthening was due to solid solution hardening.
Copper substantially raises the atmospheric corrosion resistance
of steel. Moss23 mentions that 1-5% copper has been added to high
alloy and stainless steels to improve corrosion resistance in specific
environments and reduce susceptibility of austenitic stainless steels
to stress corrosion cracking. 11
Habraken and Greday mention the development of a rimmed steel
containing 0.2-0.5% copper to replace more expensive aluminum-killed
steel for deep drawing applications. They note that the presence
of copper in limited amounts did not appreciably affect weldability.
They have mentioned the use of copper steels for architectural appli
cations. Corrosion resistant low alloy steel was used in the
12
unpainted condition as structural material; on weathering, a somewhat
pleasant rust color was obtained that was esthetically acceptable.
Two test structures in the U.S. built with Cor-Ten (U.S. Steel grade
containing 0.25-0.40% copper and 0.04% max. phosphorous) as the
main structural material after six years weathered to a uniform
rust color with no localized corrosion. Copper in conjunction with
phosphorous enhances the corrosion resistance of the steel.
One of the problems associated with copper bearing steel scrap
is that such scrap used in steel making contributes copper to the
finished steel, since copper is not removed during steel making. The
severity of the problem varies, depending on the use of the finished
steel and source of the scrap. Other sources of copper come from
scrap automobiles.
The effect of copper in cast irons has been investigated exten-
. 1 M 23 . h . . "1 h d s1ve y. ass ment1ons t e 1mprovement 1n tens1 e strengt an
transverse strength by copper additions to cast irons. He notes that
copper stabilizes pearlite and that the effect of copper was more
pronounced in nodular than in flake graphite forms. Corsetti and 24
Valota note that copper was found to improve hardenability, machin-
ability and promote graphitization.
E. Copper in Powder Metallurgy
Bockstiegel25 has studied the nature and causes of volume changes
in the sintering of iron-copper and iron-copper-carbon powder com
pacts. He indicated the possibility of obtaining optimum mechanical
properties by skillful adjustment of the constituents and careful
control of the sintering conditions. He observed excessive swelling
of iron-copper compacts if the sintering was done above 1083°C or at
a lower temperature for longer times. He attributes the phenomena
to the solution of copper in austenite, since he observed the volume
increase to be proportional to the copper content of the compact up
to the solubility limit. In iron-copper-carbon compacts, he observed
less swelling, and attributed the phenomena to the possible presence
of an iron-rich ternary liquid phase.
Shoji and Yamada26 have studied the effects of sintering and
carburizing times on the carburizing behaviour of sintered iron-copper

and iron-nickel compacts. Copper did not exhibit an accelerating
effect on sintering as did nickel. Shorter carburizing times were
found adequate for iron-copper compacts, compared with iron-nickel
compacts. The case hardness was lower for the iron-copper compacts.
They attributed the above observations to the greater porosity of
iron-copper compacts. The toughness of quenched iron-copper compacts
decreased markedly beyond 3% copper. 27
In a later investigation Shoji et al. determined the effect
13
of copper on the activity of carbon in austenite from experiments
involving gas carburization of iron and iron-copper powders. The
results indicate a slight decrease in the carbon content with copper
addition at a fixed carbon activity. However, the data presented
appears to be very limited. Shoji and ~amada28 discussed the possibil
ity of carbon control using denatured propane gas as a furnace atmos
phere in the sintering of iron and iron-copper powders.
Sorokin29 studied the effect of copper and graphite on the pro
perties of sintered iron-based alloys. He found a copper-rich phase
only in alloys with 10-15% copper, as inclusions along the bound
aries of pearlite colonies. Copper addition improved tensile strength
and did not appreciably affect elongation.
Sorokin30 also mentions earlier work on the subject of carburiz
ing during sintering of iron-copper compacts. He cites an earlier
work where a compact containing 2.7% copper absorbed 50% less carbon
than pure iron, during carburization at 930°C for 8 hours. Sorokin's
result is presented in Figure 5.
Sorokin also studied the effects of copper in improving the sinter
ing characteristics of stainless steel powders and in increasing the
strength of compacts. 31
32 Domsa reported that the addition of copper to iron-graphite
compacts restricted cementite formation. One of the difficulties
in producing iron-graphite parts was the occurrence of cementite after
normal sintering. For carbon contents less than 3%, it could be avoid
ed by shorter sintering times and step sintering methods. For higher
carbon contents an alloying element like copper was found to restrict
cementite formation. He attributed this behaviour to the effect of

cfl. 0.8
Figure 5.
14
SINTERING TIME: 90 MINUTES
4 8 12 16
COPPER IN CHARGE, o/o
Effect of Copper on Carbon Pickup During Sintering (Sorokin30).
900° C
950° c
15
copper in restricting the diffusion of carbon in iron.
Crosby et a1. 33 substituted cement copper for commercial copper
in a 7% copper 1% carbon - iron powder metallurgy alloy. The
subs~itute alloy showed lower strength properties; this was attributed
to poor sinterability.
16
III. EXPERIMENTAL PROCEDURE
A. General
In order to determine the limit of the austenite phase field
at 950°C, gas carburization experiments were conducted. Iron-copper
compacts were equilibrated with gas mixtures of fixed carbon activities.
The reaction was monitored by weight gain measurements utilizing a
Cahn electrobalance.
The solubility of graphite in various iron-copper alloys up
to 6% copper, was determined at 950°, 1000° and 1050°C in a horizon
tal tube furnace. Wet hydrogen (dew point 25°C) was passed over
samples surrounded by powdered graphite.
The solidus temperature was determined as a function of the activ
ity of carbon up to graphite saturation, for a 90% copper-iron
alloy.
B. Furnaces and Temperature Control
Three furnaces were used in this investigation. A "wire wound"
horizontal furnace was used for preparing homogeneous iron-copper
samples. A "wire wound" vertical tube furnace was used for carburiz
ing and weight gain experiments. A silicon carbide resistance-heated
furnace with a vertical tube was used for determination of the solid-
us temperature.
For the gas carburization experiments, a Marshall furnace with
38 mm bore and 35 ems heated length was used. A vertical mullite
tube 32 mm ID and 76 ems long was used as the reaction chamber. At
the lower end of the mullite tube a side arm was attached which served
as inlet for the gas. The lower end of the tube was corked; above
the cork was a set of mullite baffles, which acted as a gas mixer and
radiation shield. The tube was covered at the top with a pyrex plate
containing two holes; one for a thermocouple and the other for a fused
silica suspension rod. Figure 6 shows a sketch of the apparatus used.
A Marshall furnace of 38 mm bore and 35 ems heated length was
used both for the preparation of iron-copper alloys and for graphite
solubility experiments. A horizontal fused silica tube, 22 mm ID and
92 ems long was used as the reaction chamber. Figure 7 shows a sketch

17
TO TO PAN POTENTIOMETER J::::=:::::::;, OF ELECTROBALANCE
MULLITE TUBE r;::::::= CON TROLLING PLATINEL THERMOCOUPLE PLATINEL
THERMOCOUPLE ----"~
(TO CONTROL UNIT}
• •
FURNACE
SAMPLE
GAS INLET
Figure 6. Schematic Diagram of the Apparatus for Gas Carburization Experiments.

SAMPLE HOLDER
.... ~ ·-·-·
BOAT CONTAINING SAMPLES PACKED WITH GRAPHITE POWDER
CRUCIBLE PACKED WITH GRAPHITE POWDER
• •
Figure 7. Schematic Diagram of the Apparatus for Graphite Solubility Experiments.
BAFFLE
GAS INLET
FURNACE
1-' 00

of the apparatus.
The solidus temperature was determined in a silicon carbide re
sistance heated furnace. A vertical mullite tube, 16 mm ID and lOZ
19
ems long was used. At the lower end o£ the tube, a side arm was attach
ed for gas inlet. The lower end of the tube was made tight by a
water seal and the upper end covered by a tight-fitting refractory
cap. Figures 8(a) and (b) schematically represent the apparatus
used in this experiment.
Each furnace temperature was controlled by a Barber Colman Z7Z P
Capacitrol temperature control unit with a Platinel II thermocouple,
which regulated the temperature to + Z°C.
C. Temperature Measurements
A Platinel II thermocouple was used for temperature measurement.
A similar Platinel thermocouple, calibrated by the National Bureau
of Standards at 900°, 1000°, and 1100°C was used for calibration purposes.
In most of the runs a fixed furnace temperature was needed. The
furnace temperature was set using the controller setting and checked
by the calibrating thermocouple. The working thermocouple was used for
temperature measurement before each run initially and later on after
alternate runs. This was found satisfactory, as the temperature re
mained essentially constant. Periodic checks of the furnace tempera
ture were made with the calibrating thermocouple.
The temperatures measured and controlled as described above were
estimated to be reproducible to ± 5°C, except as noted later in cer
tain runs to determine the solidus temperature. In this experiment,
the temperature was estimated to be correct to + Z°C.
D. Atmosphere Control
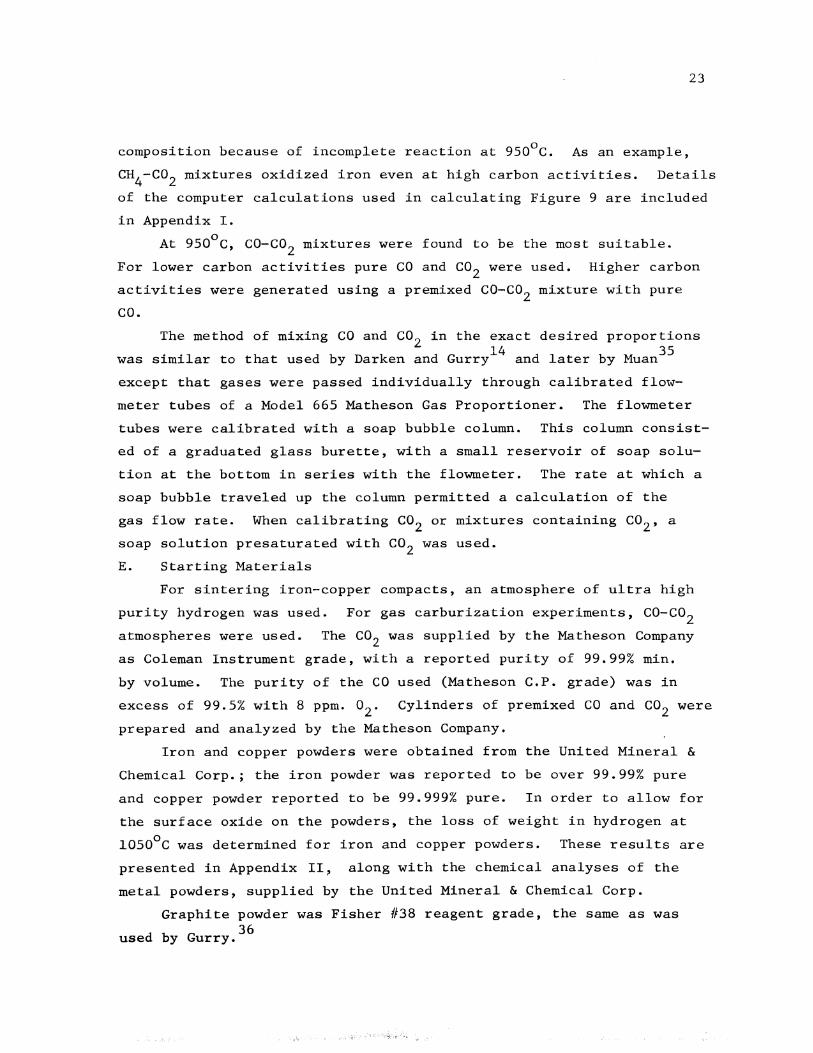
Thermodynamic calculations were made to determine the relation
ship between gas composition and carbon activity at a given temperature,
for the carbon-oxygen-hydrogen system. The results were plotted similar 34 to the diagrammatic method of representation devised by Gurry and
are presented in Figure 9. Many of the possible gas mixtures were
eliminated from the standpoint of difficulty in mixing or control
ing. Some of the binary and ternary gas mixtures indicated to be
suitable from Figure 9 were found not to give the equilibrium gas
1.5 V DC
A
TO POTENTIOMETER :::::=::1
PLATINEL THERMOCOUPLE
GAS SEAL
__.. -- - -----
CIRCUIT
MULLITE TUBE
SAMPLE
Figure 8(a) Schematic Diagram of the Apparatus for Solidus Temperature Experiments.
20

TO POTENTIOMETER =~ r;::::::::: TO CIRCUIT
PLATINEL THERMOCOUPLE
GRAPHITE ROD ASSEMBLY-------;~
MULL ITE TUBE
SAMPLE
GRAPHITE CRUCIBLE
~~ ~ -- -- -· =- -~-::
Figure 8(b) Schematic Diagram of the Apparatus for Solidus Temperature Experiments (Equilibrium with Graphite).
21

0
Figure 9.
I I ICI>
:! c; 0 0 0
0 0 I~ 1.,0 ,~
I I I
C02 I '-
H
0
0 /co
D 5.15% C02 (C0z!H2 )
• 91.35% C02 (C02 /CO) .& 20.90% C02 (C02 /CO) • 5.12% C02 (C02 /CO)
0 CH 3 COOH .t:. C2 H 50H o CH 3 0H
22
-- CARBON ISOACTIVITY LINES
--- Feo.947 -Fe
CIS-c
0 The Carbon-Oxygen-Hydrogen System at 950 C and 1 Atm Pressure.
23
composition because of incomplete reaction at 950°C. As an example,
CH4-co2 mixtures oxidized iron even at high carbon activities. Details
of the computer calculations used in calculating Figure 9 are included
in Appendix I.
At 950°C, CO-C02 mixtures were found to be the most suitable.
For lower carbon activities pure CO and co2 were used. Higher carbon
activities were generated using a premixed CO-co2 mixture with pure
co.
The method of mixing CO and co2 in the exact desired proportions 14 35
was similar to that used by Darken and Gurry and later by Muan
except that gases were passed individually through calibrated flow
meter tubes of a Model 665 Matheson Gas Proportioner. The flowmeter
tubes were calibrated with a soap bubble column. This column consist
ed of a graduated glass burette, with a small reservoir of soap solu
tion at the bottom in series with the flowmeter. The rate at which a
soap bubble traveled up the column permitted a calculation of the
gas flow rate. When calibrating co2 or mixtures containing co2 , a
soap solution presaturated with co2 was used.
E. Starting Materials
For sintering iron-copper compacts, an atmosphere of ultra high
purity hydrogen was used. For gas carburization experiments, CO-C02
atmospheres were used. The co2 was supplied by the Matheson Company
as Coleman Instrument grade, with a reported purity of 99.99% min.
by volume. The purity of the CO used (Matheson C.P. grade) was in
excess of 99.5% with 8 ppm. 02 . Cylinders of premixed CO and co2 were
prepared and analyzed by the Matheson Company.
Iron and copper powders were obtained from the United Mineral &
Chemical Corp.; the iron powder was reported to be over 99.99% pure
and copper powder reported to be 99.999% pure. In order to allow for
the surface oxide on the powders, the loss of weight in hydrogen at
1050°C was determined for iron and copper powders. These results are
presented in Appendix II~ along with the chemical analyses of the
metal powders, supplied by the United Mineral & Chemical Corp.
Graphite powder was Fisher #38 reagent grade, the same as was 36
used by Gurry.
24
F. Alloy Preparation
Alloys up to 10% Cu were made by a powder metallurgy technique. A
list of the alloys prepared is presented in Appendix II.
Iron and copper powders were weighed out on an analytical balance
and thoroughly mixed in a smooth glass mortar. This mixture was com
pacted into cylindrical pellets 12 mm dia. and 12 mm high. The com
pacts were sintered in hydrogen for 24 hours at 1050°C and quickly
cooled in the hydrogen. The sintered pellets were cold pressed to
half their height between flat die plates and then reannealed in evacu
ated fused silica capsules at 1050°C for a minimum of 24 hours. The
samples were quenched by cracking the capsules open under water. This
processing procedure gave fairly homogeneous alloys as verified by
an electron microprobe scan. Optical microscopy verified the absence
of free copper.
The quenched samples were cold rolled into sheet 0.5 mm thick.
The surface was cleaned by sanding with emery paper followed by
ultrasonic cleaning in acetone. Samples were cut from the sheet
as pieces of average size 12 mm x 12 mm and were ultrasonically clean
ed in acetone before each run.
G. Gas Carburization Experiments
These experiments involved the study of equilibrium of the
following reaction: C02 + £ = 2CO (where £ refers to carbon dis-
solved in austenite). Such a technique has been used quite extensive
ly to measure carbon activities in the binary Fe-C as well as ternary 12-18
Fe-C-X systems. The experimental technique has been discussed
in detail. 14 •15
Iron-copper compacts were equilibrated with CO-C02 gas mixtures
of known carbon activities, at 9S0°C. The weight gain of the sample
was continuously measured with a Cahn electrobalance, Constant
sample weight was the criterion for assurance that equilibrium
had been attained. Weight changes of 0.01% for a 1 gm sample could
be measured. Pure iron samples were run periodically to calibrate
the various gas mixtures for their carbon activity.

The apparatus used in these experiments is shown in Figure 6.
The sample was suspended from a hooked fused silica suspension rod
through a hole in the sample. The sample was held at the top of the
furnace for 10 minutes, after insertion into the furnace, while the
air was flushed from the tube with a mixture of CO and co2 • The
sample was then lowered by the fused silica suspension rod to the
hot zone. The upper end of the fused silica rod was then attached
to a hook on the left pan of the electrobalance. The weight gain
of the sample measured by the electrobalance was displayed on a
chart recorder. A more detailed account of the weighing procedure
is included in Appendix III.
25
The sample was first held in a CO-C02 atmosphere of low carbon
activity, until the sample weight became constant. The carbon activity
was then increased in a stepwise fashion and the weight gain after every
activity change was noted. Initially the carbon activity of the mix
ture was calculated from gas ratios and equilibrium constant data.
These were in agreement with the activities to within+ 0.02 calcula
ted on the basis of the weight gain of a pure iron sample and the
activity-composition relations for carbon in Fe-C alloys established
by Ban-Ya et a1. 13 On account of the above observation, in later ex
periments the carbon potential of the gas was established by the
weight gain for a pure iron sample. This method was judged to be a
more accurate way of determining the carbon potential of the gas
mixture as the absolute value was not as important as comparison
between the weight gain of the Fe-Cu alloy and pure iron. Such a
method also took care of changes in buoyancy as a function of gas
composition since the buoyancy was expected to be the same for the
alloy as for pure iron.
A number of data points were checked by decarburization by lower
ing from a higher carbon activity to a lower one. The weight became
constant to within 0.1 mg of the original weight.
H. Graphite Solubility Experiments 36 The experimental technique used was similar to that of Gurry
for the determination of graphite solubility in gamma iron and later
by Fray and Chipman37 for graphite solubility in Fe-Co and Fe-Ni alloys.

Gurry saturated his samples at temperature in a hydrogen-toluene at
mosphere in equilibrium with graphite, at a flow rate of less than
26
40 cc./min. Fray and Chipman used hydrogen saturated with isopropyl
alcohol at room temperature. In this investigation, graphite solubil-o 0 0
ity was determined at 950 , 1000 and 1050 C by saturation of samples
with an atmosphere of wet hydrogen (dew point about 25°C) in equilibrium
with graphite. The purpose of water-vapour was to generate CO and co2
along with methane, and thus to speed up the reaction rate. Water
vapour was preferred over hydrocarbons or other organic liquids, be
cause there is a lesser possibility of intermediate decomposition
products giving a carbon activity greater than one.
A sketch of the apparatus is shown in Figure 7. A sample of
pure iron and a number of iron-copper alloys were weighed on the
electrobalance, and then packed in fine graphite powder in the center
of a nickel boat 6.3 em long. The boat was pushed in and out of the
furnace by an iron wire.
The boat with the samples was placed in the cold zone of the
furnace whjle it was flushed with nitrogen. The nitrogen was then
replaced by hydrogen and the tube flushed for 10 mins. before pushing
the boat into the hot zone. The position of the samples was confined
to a zone having a temperature profile not less than 2°C below the
maximum temperature of the furnace. In order to minimize carbon con
sumption, the hydrogen flow rate was kept at less than 8 cc./min.
After equilibration times of 24, 48, 72, 96, 120 and 144 hours, the
boat was pulled to the cold end and the samples removed, cleaned and
weighed on the electrobalance. The experiment was continued till
the samples attained constant weight. The cleaning procedure for the
samples consisted of brushing to remove the adhering graphite follow
ed by ultrasonic cleaning in acetone.
The weight gain of the pure iron sample compared well with publish
ed data13 , 36 and served as a check on the accuracy of the method. A
comparison of the results of the present work with published data
is presented in Table X(b) in Appendix IV.
27
I. Solidus Temperature Determination
The solidus temperature was determined for a 90% Cu-Fe alloy,
as a function of the carbon activity. The presence of liquid, formed
as the sample was heated in a carburizing atmosphere, was detected
by the loss of strength of the sample suspended between two hooks.
The equipment used in this experiment is shown in Figure 8(a)
The furnace was flushed with a gas mixture of fixed carbon activity,
while the sample was held at the top of the furnace. The sample was
then lowered to a position where the temperature was accurately known 0 0
by a previous calibration experiment (temperature range 1050 -1100 C),
Initially the sample was held at 1050°C for 3 hours. Next it was
lowered to positions where the temperature varied from 1060° to 1100°C
and at each position it was held for 20 minutes. At the solidus temper
ature, a liquid phase formed, and the sample no longer supported its
own weight. As the sample dropped from the hooks, at the solidus temper
ature a circuit was broken and gave a clear indication of melting.
The thermal decomposition of gas mixtures high in CO in the furnace
tube below the sample made it impossible to generate carbon activities
greater than 0.2, with CO-C02 mixtures. This problem of the thermal
decomposition of high CO mixtures at temperatures above 1000°C was
discussed by Phelps38 and Ban-Ya et a1. 13 In order to obtain the
solidus temperature in equilibrium with graphite a modified technique
was used. The apparatus used is illustrated schematically in
Figure 8(b). A CO-C02 mixture containing 5.72% co2 was allowed to come
to equilibrium with a graphite assembly before it passed over the sam
ple, which was in turn surrounded by a perforated graphite crucible
containing graphite powder.

28
IV. EXPERIMENTAL RESULTS AND DISCUSSION
The experimental results are presented in two forms: a tabular
form in Appendix IV and in the form of graphs and diagrams in the
following sections. The experiments were designed to determine the
limits of the austenite field of the iron~copper-carbon system at
950°C and the extent of graphite solubility in iron-copper alloys
as a function of temperature, Additional experiments were conducted
to study the effect of carbon on the solidus temperature. The effect
of copper on the carburization rate was also observed.
A. Presentation of Results
The experimental results are presented in tabular form in
Appendix IV. The results of gas carburization experiments are present
ed in Tables I through VIII. Figures lO(a) through (g) summarize
the same data in the form of graphs of carbon activity vs. % carbon.
The activity-composition curve for pure iron is superimposed on each
of these graphs to permit a ready comparison of a specific iron-copper
alloy with pure iron. Table IX is a presentation of carbon isoactivity
data derived from Figures lO(a) through (g). 0 0
The results of graphite solubility experiments at 950 , 1000 ,
and 1050°C are presented in Table X(a). The results at 950°C, in
conjunction with isoactivity data from gas carburization experiments,
were used in constructing the 950°C isothermal section of the iron
rich end of the iron-copper-carbon phase diagram (Figure 11). The
y/y + £ phase boundary indicated by a dashed line is a possible
boundary based on apparent "breaks" in the activity-composition curves
as discussed later.
In order to determine accurately the y/y + £ phase boundary, sev
eral iron-copper-carbon alloys were quenched in water from the carbur
izing temperature of 950°C, after a holding period of 24 hours. A
metallographic examination at 1000 X showed massive martensite with
no visible precipitate of epsilon before or after etching. Apparent
ly, the time required to achieve a precipitate, visible at 1000 X,
is in excess of 24 hours at 950°C.

z 0 ([) 0::: <( (.)
LL 0
>-I--> -I-u <(
1.0
• 0.3 °/o COPPER 0.9 • PURE IRON
0.8
0.7
0.6
0.5
0.4
0.3
0.2
0.1
0.2 0.4 1.2
WT PCT CARBON
Figure lO(a) Activity of Carbon vs % Carbon at 950°C for a 0.3% Copper Alloy.
29
1.4

z 0 OJ 0:: <( u LL 0
>-t--> -t-u <(
1.0
• 0.7 °/o COPPER
0.9 • PURE IRON
0.8
0.7
0.6
0.5
0.4
0.3
0.2
0.1
0.2 0.4 0.6 0.8 1.0 1.2
WT. PCT. CARBON
Figure lO(b) Activity of Carbon vs % Carbon at 950°C for a 0.7% Copper Alloy.
30
1.4
z 0 ([)
0::: <( u LL 0
>-I--> I-u <(
1.0
• 1.0 °/o COPPER
0.9 • PURE IRON
0.8
0.6
0.5
0.4
0.3
0.2 0.4 0.6 0.8 1.0 1.2
WT. PCT CARBON
Figure lO(c) Activity of Carbon vs % Carbon at 950°C for a 1.0% Copper Alloy.
31
1.4

z 0 a:l a:: <( u lJ... 0
>-.,_ -> -.,_ u <(
1.0 • 1.3 °/o COPPER
0.9 • PURE IRON
0.8
0.7
0.6
0.5
0.4
0.3
0.2
0.1
0.2 0.4 0.6 0.8 1.0 1.2
WT. PCT CARBON Figure lO(d) Activity of Carbon vs % Carbon at 950°C for
a 1.3% Copper Alloy.
32
1.4

z 0 (]) a: <( u LL. 0
>-~ -> -1-u <(
• 2.5 °/o COPPER • PURE IRON
0.4
0.3
0.2
0.2 0.4 0.6 0.8 1.2
WT. PCT. CARBON Figure lO(e) Activity of Carbon vs % Carbon at 950°C
for a 2.5% Copper Alloy.
33
1.4

z 0 CD 0:: <( u LL 0
>-t--> t-u <(
• 3.0 °/o COPPER
0.9 • PURE IRON
0.8
0.7
0.6
0.5 .... .... -I
0.4 I I
I I
0.3 I I
0.2
0.1
0.2 0.4 0.6 0.8 1.0
WT. PCT CARBON
Figure lO(f) Activity of Carbon vs % Carbon at 950°C for a 3.0% Copper Alloy.
34
1.4

z 0 m a:: <( u LJ.. 0
>-I--> -I-u <(
• 3.5 °/o COPPER • PURE IRON
0.4
0.3
0.2
0.1
0.2 0.4 0.6 1.0 1.2
WT. PCT. CARBON
Figure lO(g) Activity of Carbon vs % Carbon at 950°C for a 3.5% Copper Alloy.
35
1.4

-- ISOACTIVITY LINES --- POSSIBLE PHASE
BOUNDARIES 950° c
y + E + C(gr)
y + C(gr)
2.0
WT. PCT CARBON
3.0
Figure 11. Isothermal Section of the Iron-Rich End of the Iron-Copper-Carbon Phase Diagram.
36
4.0

The solubility of copper in iron-copper austenite was taken
from the work of Speich et al. 7 The solubility of co~per, obtained
by solving their equation is given in the table below;
Solubility of Copper in Austenite*
Temperature 0 c
950
1000
1050
Solubility % Cu
4.086
4.943
6.172
* From Equation 1, p. 5
Figure 12 shows the extent of the stable austenite field based
on graphite solubility measurements. As indicated earlier the
y/y + £ phase boundary at 950°C was based on apparent "breaks" in
isoactivity curves. At 1000°C and 1050°C 1 this boundary was taken
37
as a line joining the break in the graphite solubility curve and the
y/y + £ boundary points in the iron-copper system. The effect of copper 0 0 0
content on graphite solubility at 950 , 1000 , and 1050 C is present-
ed in Figu:re 13.
The results of the solidus determination for an iron-copper alloy
containing 90% copper initially are presented in Table XI. Figure 14
is a graphical representation of the same data. The effect of carbon
activity, up to 0.2, was obtained by a gas carburization technique and
is indicated in Figure 14 by a bold line. This line is extended as
a dashed line to meet the point representing the solidus temperature
in equilibrium with graphite. The solidus temperature in this work
is the temperature at which the first liquid forms, and is the copper-6
rich peritectic temperature referred to by Maddocks and Claussen.
Table XII contains the time for various alloys (up to 1.3% copper) 0
to reach the equilibrium carbon content at 950 C. Figure 15 graphical-
ly represents this data. The time given represents the time for a

38
-- GRAPHITE SOLUBILITY --- POSSIBLE PHASE
0 eo· I I
o I (I)· I
\ I \ I \ I \ I \ I \ I \ \ \ ~
2.0
WT. PCT. CARBON
BOUNDARIES • 950 oc .. 1000 °C • 1050 °C
3.0
Figure 12. The Effect of Temperature on the Extent of the Austenite Field.
4.0
~
t-= 3: z l.J.J ...._ :r: CL <( a:: (!)
LL 0
>-...._ _J
CD ::> _J 0 en
0.6
0.4
• 950° c 4 1000° c • 1050° c " POSSIBLE BOUNDARY
2.0
WT. PCT. COPPER
Figure 13. The Effect of Copper on the Solubility of Graphite in Iron-Copper Alloys.
39
4.0
(.) 0
w a:: ::::> I-<( a:: w a.. ~ w I-
en ::::> 0 _J 0 en
1100
1096
1092
1088
1084
-----------1080
--..._ -----1076
1072
1068 0.1 0.7 0.8 0.9
ACTIVITY OF CARBON
Figure 14. The Effect of Carbon Activity on the Solidus Temperature for a 90% Copper Alloy
40
-..
1.0

(/)
a:: ::::> 0 I
z
w ~ f-
z 0 -f<( 0::: (I)
.....1 -::::> 0 w
7
6
5
4
3
2
0.2 0.4 0.6
TEMPERATURE 950° C
CARBON ACTIVITY 0.08
0.8 1.0 1.2 1.4
WT. PCT. COPPER
Figure 15. The Effect of Copper Content of the Alloy on Time to Reach the Equilibrium Carbon Content During Gas Carburization.
41
1.6

sample containing no carbon to come to equilibrium with a gas whose
carbon activity was 0.08. A similar time could not be read directly
from the weight gain data for higher carbon levels because the time
to reach equilibrium could be compared only if the initial and final
activity was the same. This generally was not the case.
B. Discussion of Results
1. Gas Carburization and Graphite Solubility
Copper and carbon are both soluble in austenite but they are
practically insoluble in each other. Hence, it was expected that,
in a ternary alloy, each would have a significant influence on the
solubility of the other.
Gas carburization and graphite solubility experiments covered
the range from low carbon activities to graphite saturation, for
iron-copper alloys up to 6 pet. copper. The gas carburization re
sults were plotted in the form of activity-composition curves for
carbon. In the single phase region, a smooth curve was expected,
with a change in slope or a "break'' as the second phase precipitated.
42
39 Work on the Ti-0-H system by Hepworth and Schuhmann contains hydrogen
solubility plots, which show a discontinuity or "break" corresponding
to a transition from aTi to aTi + STi. In the present work, the exact
position of the break is not clear for the number of runs made. A
larger number of points need to be determined in the vicinity of the
break to accurately determine the position of the break.
The results of gas carburization experiments show that, in
general, the addition of copper increases the activity of carbon.*
This effect of copper is in agreement with Sorokin's observation30
of a decrease in carbon content with copper addition during sintering
of iron-copper compacts in a carburizing medium at 950°C. (see
Figure 5, p. 14) He cites an earlier work in which the addition of
* The alloy containing 1% copper exhibited an anomalous behaviour above a carbon activity of about 0.4 where a lowering of carbon activity was observed with covper addition.

43
2.7% copper reduced the carbon absorbtion by 50%. 27 Shoji et al.
also report a slight decrease in the carbon content with copper
addition, at 930°C and a tixed carbon activity (their pure iron
sample picked up 0.85% carbon), Since their data is so fragmentary~
a qualitative agreement with the present work is all that can be noted.
The present result is in apparent disagreement with the work of
Yoshida and Sano. 22 They noted a slight decrease in carbon activity
by copper addition in the temperature range 850°-950°C. Chipman and
Brush21 indicate a lack of quantitative data for establishing interac
tion parameters for the activity of carbon in copper-alloyed austenite.
The calculated values of the activity coefficient of carbon in
austenite at 950°C, for copper contents up to 0.7% are presented in
Table XIII and graphically in Figure 16. Graphite was taken as
the standard state for carbon. The activity coefficient was defined
as follows:
f = a I (%C) c c (5)
It was not possible to carry out a similar calculation for higher
copper contents, as too few points were available in the single phase
field. As seen from Figure 16, copper increased the activity coeffic
ient of carbon in austenite.
Graphite solubility decreased with the addition of copper at all
three temperatures. This behaviour seems to confirm the results of
gas carburization experiments where the solubility of carbon in iron
copper alloys at high carbon activities was less than that for pure
iron. The effect of copper is similar to that of nickel, cobalt and
silicon. 37 The graphite solubility values for high copper alloys were
lower than the corresponding values obtained by extrapolation of the
gas carburization data to an activity of carbon of one. The reason for
this must await further work. The effect of copper on the graphite
solubility is more pronounced at 950°C than at 1050°C (Figure 13).
The knowledge of the austenite fields in the form of isothermal
diagrams, such as Figures 11 and 12, can be utilized by the heat treat
er in selecting heat treatment conditions for copper bearing steels.
This may involve selecting an austenitizing temperature for a hardening
operation or a normalizing operation.

(.) ...... 0 0
44
TEMPERATURE 950°C
• 0.7 °/o COPPER • 0.3 °/o COPPER • PURE IRON
-0.3
-0.2
-0.1
0.2 0.4 0.6 0.8 1.0 1.2 1.4
WT. PCT. CARBON
Figure 16. The Effect of Copper on the Activity Coefficient of Carbon.
1.6
45
2. Solidus Temperature Determination
The temperature referred to in the present investigation as the
"solidus temperature" is the copper~rich peritectic temperature deter-6
mined by Maddocks and Claussen by thermal analysis. Copper melts at 0
1083 C; however, for Fe-Cu alloys containing more than about 5% iron,
the lowest temperature at which a liquid forms is 1094°c. 3 It was
of interest to determine if this temperature could be lowered by
carbon addition.
As mentioned earlier carbon activities up to 0.2 were obtained by
gas carburization, and an activity of one was obtained by equilibrium
with graphite. A lowering of the peritectic temperature was observed,
with the temperature dropping from 1095°C in the binary iron-copper
system to 1078°C in equilibrium with graphite. Maddocks and Claussen6
state that the peritectic temperature does not change due to the pre
sence of carbon. Their data does show an appreciable lowering, however,
in two alloys investigated. The temperatures were measured accurately
in this experiment so that it seems that the lowering was real and
not due to fluctuation in temperature. The solidus temperature in the
iron-copper system was determined as 1095°C, which agrees well with 0 3 the reported value of 1094 C.
In the present work, phases occurring after melting were not
identified. A more accurate determination with greater emphasis on
the assurance of attainment of equilibrium, and identification of the
phases after melting should yield a better insight in understanding
liquid phase sintering and the volume changes occurring in the sinter
ing of iron-copper-carbon alloys. Such determinations can also give
information on temperatures and compositions at which "hot shortness"
would occur in steels.
3. Kinetics of Carburization
Although the present investigation was concerned mostly with the
thermodynamics and phase relations of the system, certain observations
were made on the rate of carburization from weight gain vs. time data.
As mentioned earlier, the experimental technique permitted a contin
uous measurement of the weight gain as the sample came to equilibrium
with the gas.
46
The e~~ect of copper is to shorten the time required to reach
equilibrium carbon content at 950°C trom a gas having a carbon activity
of 0.08, for samples containing initially no carbon. A similar
effect was observed during carburization at higher activities of
carbon but no quantitative results could be obtained because exactly
identical carbon activities were not maintained for different alloys.
This observation compares with the remark of Shoji and Yamada26 where
a shorter carburizing time was found for sintered iron-copper alloyed
powders in comparison to nickel alloyed powders.
C. Suggestions for Further Work
On the basis of this investigation certain areas seems particular
ly interesting for further work:
For the temperatures investigated, additional data points should
be obtained around the vicinity o;f the "break", in order to accurately
fix the position of the "break". Longer equilibration times or examina
tion of carburized specimens by electron microscopy would accurately
locate the y/y + E phase boundary. The solubility of graphite in high
copper alloys needs to be redetermined with longer equilibration times,
in order to resolve the discrepancy between graphite solubility and gas
carburization data.
The ternary austenite field needs to be investigated at other tem
peratures, both higher and lower than investigated here. This would
involve determination of both isothermal sections and carbon activities.
Of particular importance would be the composition of austenite up to
the solidus temperature. Equilibrium times needed to render precipitat
ed epsilon phase detectable metallographically should be determined.
This would permit an accurate determination of the y/y + E phase bound
ary.
With a larger number of data points for the activity of carbon in
the single phase field, a ternary Gibbs~Duhem integration can be per-. 40
formed us~ng Schuhmann's method to determine the activities of copper
and iron in austenite. The complete thermodynamic properties of iron
copper-carbon austenite could then be determined.
The peritectic temperature at the copper-rich end needs to be
determined to establish the effect of carbon. Emphasis must be made
on the assured attainment of equilibrium, and on the identification
of the phases after melting.
Maddocks and Claussen6 reported the raising of the iron-carbon
eutectic by the presence of copper. The composition of the liquid
47
and austenite phase at this temperature would be useful in understand
ing the behaviour of copper in cast irons.
The kinetics of carburization of sintered iron-copper compacts
and of carburizing during sintering needs further work. As part of
such an investigation it would be of interest to determine the carbon
profile across sintered compacts, to assist in the design of process
es for designing powder metallurgy parts.

V. SUMMARY AND CONCLUSIONS
The 950°C isothermal section of the iron-rich end of the iron
copper-carbon phase diagram was constructed, based on the results
48
of gas carburization experiments in conjunction with graphite solubil
ity results. Isoactivity lines for carbon are superimposed on the
diagram. The effect of copper was to increase the activity of carbon
and decrease its solubility. Graphite solubility experiments at 950°,
1000°, and 1050°C showed that the graphite solubility was lowered by
copper addition. The effect of copper was more pronounced at the
lower temperature.
For copper rich alloys, a lowering of the solidus temperature
was observed with increasing carbon contents. A value of 1078° was
obtained in equilibrium with graphite. Copper was also shown to in
crease the rate of carburization.
The application of the results of this work has been mentioned
and suggestions for further work have been made.

49
BIBLIOGRAPHY
1 "L. t t f " • 1 era ure re erences on Copper in Steel, 1951-63, British Iron and Steel Research Association, 1964, pp. 20.
2. K. Parameswaran and A.E. Morris, "Bibliography on Copper in Iron, Steel and Related Systems," 1964-70, International Copper Research Association (to be published).
3. Max Hansen, "Constitution of Binary Alloys," McGraw-Hill Book Company, Inc., New York, 1958, pp. 353-365, 580-582.
4. Rodney Elliott, "Constitution of Binary Alloys - 1st Supplement," McGraw-Hill Book Company, Inc., New York, 1965, pp. 212-213, 372-373.
5. Ralph Hultgren, Raymond L, Orr, and Kenneth K. Kelley, "Supplement to Selected Values of Thermodynamic Properties of Metals and Alloys," University of California, Berkeley, California, June 1968.
6. W.R. Maddocks and G.E. Claussen, Iron Steel Institute (London), Special Report No. 14, 1936, pp. 97-117. (Data from above redrawn in Metals Handbook, 1948 Edition, American Society for Metals, Metals Park, Ohio, p. 1250).
7. G.R. Speich, J.A. Gula and R.M. Fisher, "Diffusivity and Solubility Limit of Copper in Alpha and Gannna It:on, The Electron Microprobe," John Wiley and Sons Inc., New York, 1966 7 pp. 525-542.
8. Francis A. Shunk, "Constitution of Binary Alloys- 2nd Supplement," McGraw-Hill Book Company, Inc., New York, 1969, pp. 143-144.
9. T. Ishiwara, T. Yonekura and T. Ishigaki, "On The Ternary Diagram of the System Iron, Carbon, and Copper, 11 Sci. Rep. , Sendai, ser. 1, 1926, Vol. 15, pp. 81-114.
10. J.L. Gregg and B.N. Daniloff, "The Alloys of Iron and Copper," McGraw-Hill Book Company, Inc., New York, 1934, pp. 7-53.
11. L. Habraken and T. Greday, "Copper in Carbon and Low Alloy Steels," Metalen, 1966, Vol. 40, No. 8, pp. 262-273.
12. J.A. Lund and A.M. Lawson, "Massive Martensite Reaction in Eutectoid Iron-Copper Alloys," Trans. Met. Soc. AIME, April 1966, Vol. 235, pp. 581-583.
13. Shiro Ban-Ya, John F. Elliott, and John Chipman, "Thermodynamics of Austenitic Iron-Copper Alloys," Trans. Met. Soc. AIME, May 1970, Vol. 1, pp. 1313-1320,
14. L.S. Darken and R.W. Gurry, ''The System Iron-Oxygen II. Equilibria and Thermodynamics of Liquid Oxide and Other Phases,'' J. Am. Chem. Soc., 1946, Vol. 68, pp. 798-816.
50
15. R.P. Smith, "Equilibrium of Iron-Carbon Alloys with Mixtures of CO-C02 and CH4-H2 ," J. Am. Chem. Soc. 1946, Vol. 68, pp. 1163-1175.
16. Shiro Ban-Ya, John F. Elliott and John Chipman, "Activity of Carbon in Fe~c Alloys at 1150°C," Trans. Met. Soc. AIME, 1969, Vol. 245, 1199-1206.
17. Toshisada Mori, Kimio Fujimura, Hiraoki Okajima, and Akio Yamauchi, ''E;(:fects of: Chromium, Copper and Tin on Carbon Activity of High Carbon Liquid Steel," Tetsu-to-Hagane, 1968, Vol. 54, No. 4, pp. 321-329.
18. L.A. Shvartsman and I.A. Tomilin, "Activity of Carbon in Molten Iron," Doklady Akad. Nauk SSSR, 1968, Vol. 179, No. 5, pp. 1159-1162.
19. Theodore P. Christini, "Determination of Iron Activities in Solid Iron-Copper Alloys by Use of a Solid Electrolyte Technique," Ph.D. Thesis, The Pennsylvania State University, 1970.
20. John Joseph Demchalk, "Residual Elements in Scrap Iron - An Equilibrium Study of the Residual Element Copper," Ph.D. Thesis, The Pennsylvania State University, 1970.
21. John Chipman and Edwin F. Brush, "The Activity of Carbon in Alloyed 0
Austenite at 1000 C," Trans. Met. Soc. AIME, January 1968, Vol. 242, pp. 35-41.
22. T. Yoshida and K. Sano, Mem. Fac. Eng., Nagoya University, 1953, Vol. 5, pp. 96-99.
23. Alan Moss, "Copper as an Alloy in Steel and Cast Iron," Australasian Engg., 1967, pp. 33-34, 36.
24. C. Corsetti and N. Valota, "Cast Irons Containing Copper," Fond. Ital., Vol. 15, No. 10, pp. 343-352.
25. G. Bockstiegel, "Nature and Causes of Volume Changes in the Sintering of Iron-Copper and Iron-Copper-Graphite Powder Compacts," Translated from Stahl Und Eisen, 1959, Vol. 17, pp. 1187-1196.
26. K. Shoji and S. Yamada, "Gas Carburizing and Quenching of Sintered Ferrous Materials, 11 Translated from Tetsu-to-Hagane, 1968, Vol. 54, No. 4, pp. 410-415.
27. K. Shoji, H. Mitani and S. Yamada, "Gas Carburizing of Iron and Iron-Copper Powders," Translated from Tetsu-to-Hagane, 1969, Vol. 55, p. S233.
28. K. Shoji and S. Yamada, "Controlled Atmospheres in Furances for the Sintering of Iron Powder Products," Translated from Tetsuto-Hagane, 1963, Vol. 49, No. 10, pp. 1507-1508.

29. V.K. Sorokin, "Effect of Copper and Graphite on :Properties of Sintered Iron-Base Alloys," Translated from :Metalloveden;i.e I Term. Obrabotka Metallov, December 1960~ pp. 42-43.
51
30. V.K. Sorokin, "Effects of Copper on Carbon Absorbtion in Sintering Iron Copper Alloys," Translated from Metallovedenie I. Term. Obrabotka Metallov, October 1959, pp. 61-62.
31. V. K. Sorokin 7 "Effect of Small Additions of Copper on the Sintering of Stainless Steel (Powders)," Translated from Izvest. VuzChern. Met., 1966, Vol, 9, No. 11, pp. 127-128.
32. A. Domsa, "Effect of Copper on the Performance of Bearings of Sintered Iron-Graphite Powders," Translated from Neue Hutte, March 1964, Vol. 9, pp. 186-188.
33. Robert L. Crosby, D.H. Desy, and Robert M. Doerr, "Use of Cement Copper in an Iron-Copper-Carbon Powder Metallurgy Alloy," Report of Investigations No. 7348, U.S. Bureau of Mines, February 1970, pp. 14.
34. R.W. Gurry, "Composition of Atmospheres Inert to Heated Carbon Steels," Trans. AIME., Journal of Metals, April 1950, Vol. 188, pp. 671-687.
35. A. Muan, "Phase Equilibria in the System FeO-Fe2o3-Si02 ," Trans. AIME, 1955, Vol. 203, pp. 965-976.
36. R.W. Gurry, "The Solubility of Carbon as Graphite in Ganuna Iron," Trans. AIME, 1942, Vol. 150, pp. 147-156.
37. Derek J. Fray and John Chipman, ''The Solubility of Graphite in Iron-Nickel and Iron-Cobalt Alloys at 1000°C, Trans. Met. Soc. AIME, May 1969, Vol. 245, pp. 1143-1144.
38. W.C. Phelps Jr., "Thermodynamics of the Iron-Carbon-Silicon System," Ph.D. Thesis, Purdue University, 1960.
39. M.T. Hepworth and R. Schuhmann, Jr., "Thermodynamic Properties of Titanium-Hydrogen-Oxygen Alloys," Trans. Met. Soc. AIME, October 1962, Vol. 224, pp. 928-935.
40. R. Schuhmann, Jr., "Application of Gibbs-Duhem Equations to Ternary Systems," Acta Metallurgia, May 1955, Vol. 3, pp. 219-226.
41. R. Littlewood, "Thermodynamics of the Interaction of Atmospheres with Alloy Steels," Jour. of the Iron and Steel Institute, February 1964, Vol. 202, pp. 143-146.

52
42. Richard A. Robie and David R. Waldbaum~ "Thermodynamic Properties o~ Minerals and Related Substances at 298.15°K and One Atmosphere Pressure and at Higher Temperatures~" Geological Survey Bulletin 1259, Washington, 1968, p. 80, 100, 101~ 109, 114.
43. W.B.A. Sharp and D. Mortimer, "Accurate Thermogravimetry in Flowing Gases,'' Jour. of Sci. Inst., 1968, Vol. 1, ser. 2, pp. 843-846.

VITA
Krishna Parameswaran was born March 3, 1946 in Madras, India.
He received his primary and secondary education in Bombay, India.
He received a Bachelor of Technology Degree in Metallurgical
Engineering from the Indian Institute of Technology, Bombay, India
53
in August 1968. He entered the University of Missouri-Rolla in
January 1969 for a Master of Science Degree in Metallurgical Engineer
ing.
He is a student member of the American Society of Metals and
the Metallurgical Society of AIME.

54
APPENDICES

APPENDLX I
CALCULATION OF ATMOSPHERES WITH A SPECIFIC ACTIVITY OF CARBON AT 950°C
55
A. Gurry's Diagram at 950°C and 1 Atm Pressure 34
In Gurry's diagramatic method of representation~ the equilibrium
compositions are represented by atomic fractions of the constituents of
the gas phase. The principal advantage of Gurry's method, is that the
entire range of composition can be covered in a single diagram. Atomic
fractions can be easily correlated with the room temperature analysis.
A representation involving atomic fractions is independent of tempera
ture in contrast with equilibrium compositions in terms of molecular
species in a gas mixture, which change with temperature. The only
aspect not covered by such a representation is the molecular constitu
tion of the equilibrated gas.
Endothermic atmospheres used in carburizing are composed of CO,
C0 2 , CH4 , H2 , H20 and N2 • The atmosphere is in equilibrium with a
steel (comprised of Fe and C). Such a system is a five component
system. If there is a single condensed phase, such as austenite, in
equilibrium with the atmosphere then the degrees of freedom as given
by the phase rule is 5. A set of 3 independent reactions chosen are:
2CO (6)
(7)
(8)
Two degrees of freedom remain after the temperature, total pressure
and carbon activity are fixed. In the present calculations, nitrogen
free atmospheres were considered. Hence, by choosing the CO content
of the atmosphere arbitrarily, the composition of the rest of the gas
phase was fixed by chemical equilibrium.
(9)
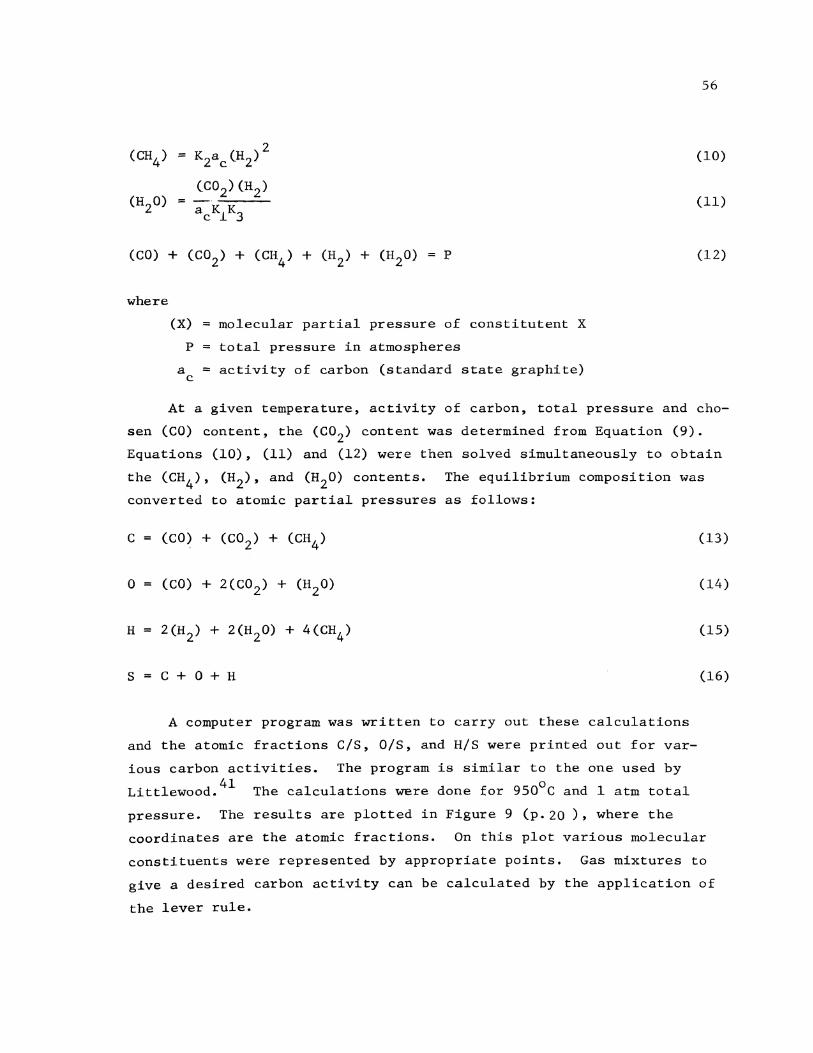
(CH4) 2 :::: Kzac (Hz)
(H20) (C02) (H2)
::::
acK1K3
(CO) + (C02) + (CH4 ) + (H2) + (H20) p
where
(X) = molecular partial pressure of constitutent X
P = total pressure in atmospheres
a = activity of carbon (standard state graphite) c
56
(10)
(11)
(12)
At a given temperature, activity of carbon, total pressure and cho
sen (CO) content, the (C02) content was determined from Equation (9).
Equations (10), (11) and (12) were then solved simultaneously to obtain
the (cH4), (H2), and (H20) contents. The equilibrium composition was
converted to atomic partial pressures as follows:
(13)
(14)
H (15)
s C + 0 + H (16)
A computer program was written to carry out these calculations
and the atomic fractions C/S, 0/S, and H/S were printed out for var
ious carbon activities. The program is similar to the one used by
Littlewood. 41 The calculations were done for 950°C and 1 atm total
pressure. The results are plotted in Figure 9 (p.ZO ), where the
coordinates are the atomic fractions. On this plot various molecular
constituents were represented by appropriate points. Gas mixtures to
give a desired carbon activity can be calculated by the application of
the lever rule.

57
The atomic fractions representing conditions where iron is in equilib
rium with wustite at 950°C were calculated using equilibrium constant 42 data from Robie and Waldbaum. The results are superimposed on the
diagram as a dashed line. Gas mixtures lying to the left of this line
tend to oxidize iron.
B. Source of Data for the Calculations
The thermodynamic data used for the calculations was obtained from
a recent compilation. 42 Log K values for the formation of CO, co2 , 0 0 0 CH4 and H20 at 1100 K, 1300 K, and 1500 K were used to calculate the
constants A, B, and C for the formula:
Log K = A + B + CT eq T
where T is °K
A
co 5738
co2 20592
H2 12843
CH4 4639
B
4.843
0.115
-2.673
-5.563
c
-1.22 X 10⁻⁴
-0.30 X 10⁻⁴
-1.09 X 10⁻⁴
-0.91 X 10⁻⁴
From this data Log K for the three reactions of interest (Equations
(6), (7) and (8) are:
Log Kl - 91i6 + 9.572 - 2.14 X l0-4T
Log K2 4639 5.563 - 0.91 l0-4T = --- X
T
Log K3 2011 2.055 + 2.01 l0-4T = --- X
T
(17)
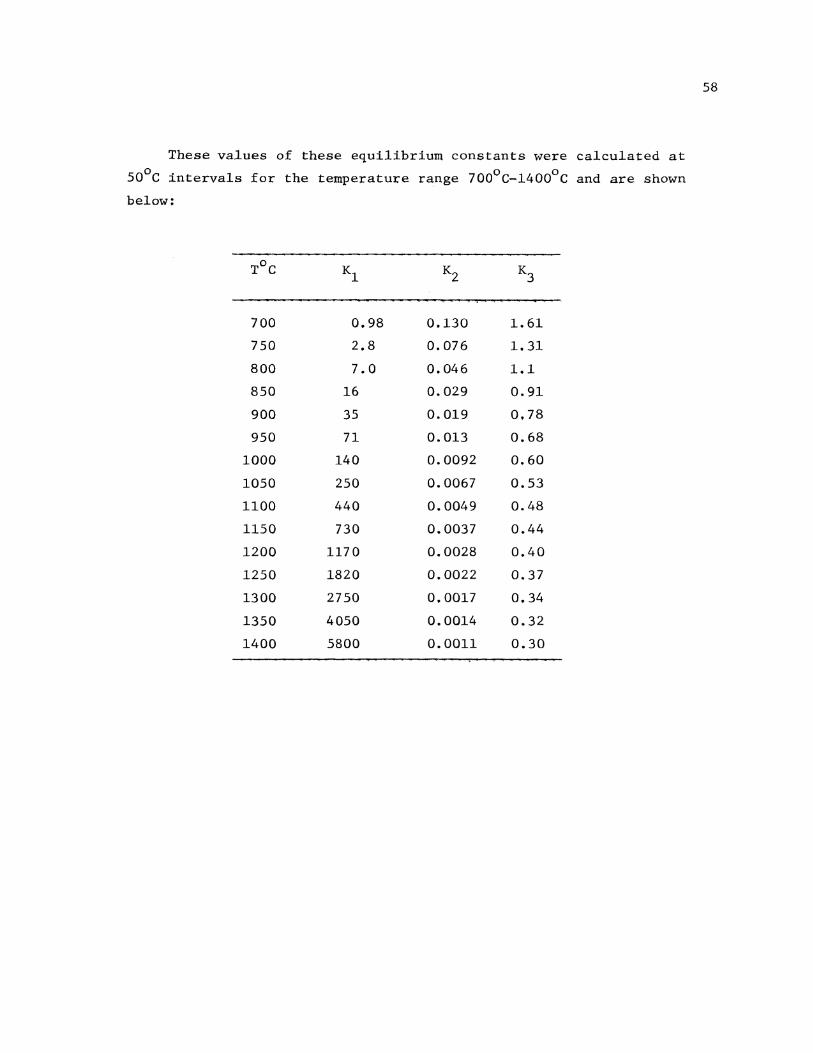
These values of these equilibrium constants were calculated at
50°C intervals for the temperature range 700°C-1400°C and are shown
below:
T°C Kl K2 K3
700 0.98 0.130 1.61
750 2.8 0.076 1. 31
800 7.0 0.046 1.1
850 16 0.029 0.91
900 35 0.019 o. 78
950 71 0.013 0.68
1000 140 0.0092 0.60
1050 250 0.0067 0.53
1100 440 0.0049 0.48
1150 730 0.0037 0.44
1200 1170 0.0028 0.40
1250 1820 0.0022 0.37
1300 2750 0.0017 0.34
1350 4050 0.0014 0.32
1400 5800 0.0011 0.30
58

APPENDIX II
STARTING MATERIALS AND LIST OF ALLOYS PREPARED
The chemical analysis of the metal powders as supplied by the
United Mineral & Chemical Corp. is given below:
59
Iron powder, Grade I Iron Sponge, -325 mesh, Reported purity 99.99% min.
Spectrographic analysis:
Copper powder, -325 mesh,
Spectrographic analysis:
Graphite powder, Acheson
Cu
lppm.
max.
Reported
Cd
lppm.
max.
Mg Mn Si
lppm. 3ppm. 2ppm.
purity 99.999% min.
Cr Mn Si
lppm. lppm. lppm.
max. max. max.
No. 38 grade.
Ag Fe
lppm. lppm.
max.
In order to account for the surface oxide on metal powders a loss
of weight in hydrogen at 1050°C was determined and is reported below:
Batch 1
Iron powder 1.150%, Copper powder 0.188%
Batch 2
Iron powder 1.365%, Copper powder 0.266%
Alloys having the following % Cu were prepared:
0.0, 0.1, 0.2, 0.3, 0.5, 0.7, 1.0, 1.3, 1.6, 2.0, 2.5, 3.0, 3.5, 4.0,
4.5, 5.0, 6.0, 7.0, 8.0, 9.0, 10.0, 90.0. Alloys underlined were used
in one or more of the experiments, the others kept for future use.
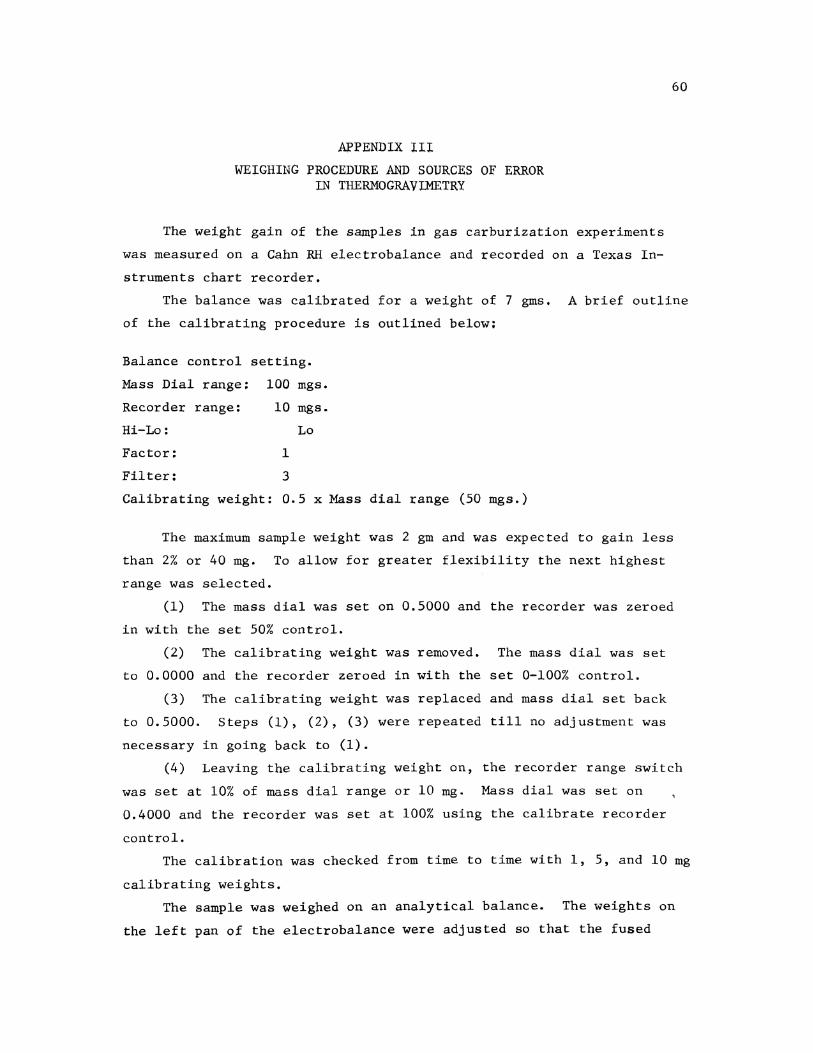
,AJ;JPENDIX lU
WEIGHING PROCEDURE AND SOUR.CES OF ERROR IN THERMOGRAVJMETR.Y
The weight gain of the samples in gas carburization experiments
was measured on a Cahn RH electrobalance and recorded on a Texas In
struments chart recorder.
60
The balance was calibrated for a weight of 7 gms. A brief outline
of the calibrating procedure is outlined below:
Balance control setting.
Mass Dial range: 100 mgs.
Recorder range: 10 mgs.
Hi-Lo: Lo
Factor: 1
Filter: 3
Calibrating weight: 0.5 x Mass dial range (50 mgs.)
The maximum sample weight was 2 gm and was expected to gain less
than 2% or 40 mg. To allow for greater flexibility the next highest
range was selected.
(1) The mass dial was set on 0.5000 and the recorder was zeroed
in with the set 50% control.
(2) The calibrating weight was removed. The mass dial was set
to 0.0000 and the recorder zeroed in with the set 0-100% control.
(3) The calibrating weight was replaced and mass dial set back
to 0.5000. Steps (1), (2), (3) were repeated till no adjustment was
necessary in going back to (1).
(4) Leaving the calibrating weight on, the recorder range switch
was set at 10% of mass dial range or 10 mg. Mass dial was set on
0.4000 and the recorder was set at 100% using the calibrate recorder
control.
The calibration was checked from time to time with 1, 5, and 10 mg
calibrating weights.
The sample was weighed on an analytical balance. The weights on
the left pan of the electrobalance were adjusted so that the fused
61
silica rod suspension assembly and the sample would weigh within the
calibrated range. The weight of the sample at any time was the sum of
the mass dial reading and the recorder reading.
The precision in measurement was 0.01%.
The usual sources of error in thermogravimetry discussed by Sharp
d . 43 an Mort~mer are:
(1) Heating of the balance from furnace heat. Only the lower part 0
of the hangdown tube was heated to about 10 C above room temperature.
Also, since most of the runs were isothermal, error from balance heating
was not significant.
(2) Electrostatic effects due to charges on glass components.
(3) Bouyancy errors.
(4) Gas turbulence.
In these experiments, the technique was to compare the weight gain
of an alloy with pure iron. Bouyancy errors were assumed to be of the
same magnitude for iron as for iron-copper alloys. The random noise
on the chart was within ! 0.1 mg with no sharp changes; so that it was
assumed that errors due to electrostatic and gas turbulence effects
were not significant.

62
APJ?ENDI.X IV
SUMMARY OF EXPERIMENTAL RESULTS
A. Gas Carburization Experiments
The results of gas carburization experiments at 950°C are present
ed in Tables I through VIII. The carbon content was determined from
the weight gain measurements on the electrobalance.
Table I Activity of Carbon vs % Carbon for Pure Iron
Activity of Carbon a c
0.08
0.12
0.20
0.29
0.37
0.43
0.68
o. 79
1. 00
Wt. % Carbon % c
0.17
0.27
0.40
0.55
0.67
0.76
1.07
1.18
1.37
Table II Activity of Carbon vs % Carbon for 0.3% Cu Alloy
Activity of Carbon a
c
0.08
0.16
0.33
0.44
0.61
0.69
Wt. % Carbon % c
0.04
0.26
0.48
0.66
0.90
0.96

Table III Activity of Carbon vs% Carbon for 0.7% Cu Alloy
Activity of Carbon a
c
0.07
0.17
0.30
0.40
0.61
0.69
0.92
Wt. % Carbon % c
0.03
0.21
0.41
0.56
0.87
0.96
1.25
Table IV Ac ti vi ty of Carbon vs % Carbon for 1. 0% Cu Alloy
Activity of Carbon a c
0.07
0.11
0.27
0.44
0.61
0.71
Wt. % Carbon % c
0.13
0.18
0.41
0.86
1.11.
1.36
63
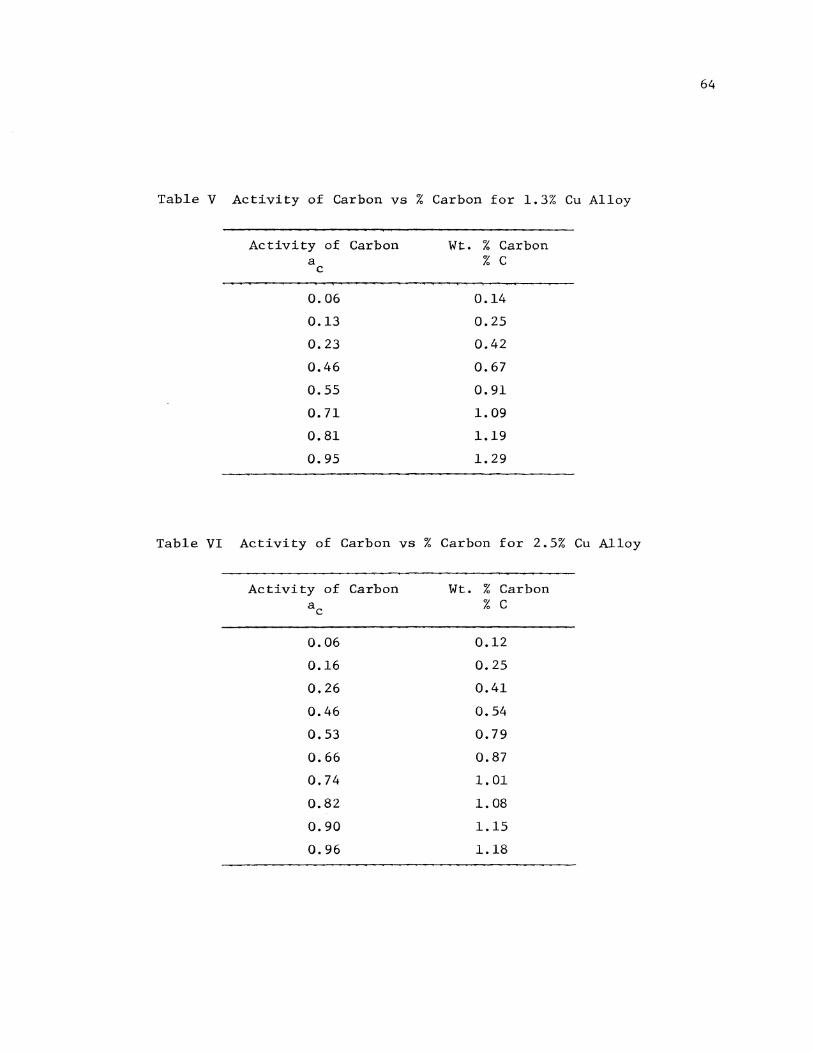
Table V Activity of Carbon vs % Carbon for 1.3% Cu Alloy
Activity of Carbon a
c
0.06
0.13
0.23
0.46
0.55
0.71
0.81
0.95
Wt. % Carbon % c
0.14
0.25
0.42
0.67
0.91
1.09
1.19
l. 29
Table VI Activity of Carbon vs % Carbon for 2.5% Cu Alloy
Activity of Carbon ac
0.06
0.16
0.26
0.46
0.53
0.66
0.74
0.82
0.90
0.96
Wt. % Carbon % c
0.12
0.25
0.41
0.54
o. 79
0.87
1.01
1.08
1.15
1.18
64

Table VII Activity of Carbon vs% Carbon for 3.0% Cu Alloy
Activity of Carbon a c
0.07
0.11
0.25
0.49
0.56
0.71
0.84
Wt. % Carbon % c
0.11
0.18
0.38
0.66
0.80
0.94
1.07
Table VIII Activity of Carbon vs % Carbon for 3.5% Cu Alloy
Activity of Carbon a c
0.06
0.15
0.21
0.25
0.35
0.53
0.64
0.82
0.94
Wt. % Carbon % c
0.12
0.29
0.37
0.47
0.54
o. 79
0.94
1.14
1.14
65
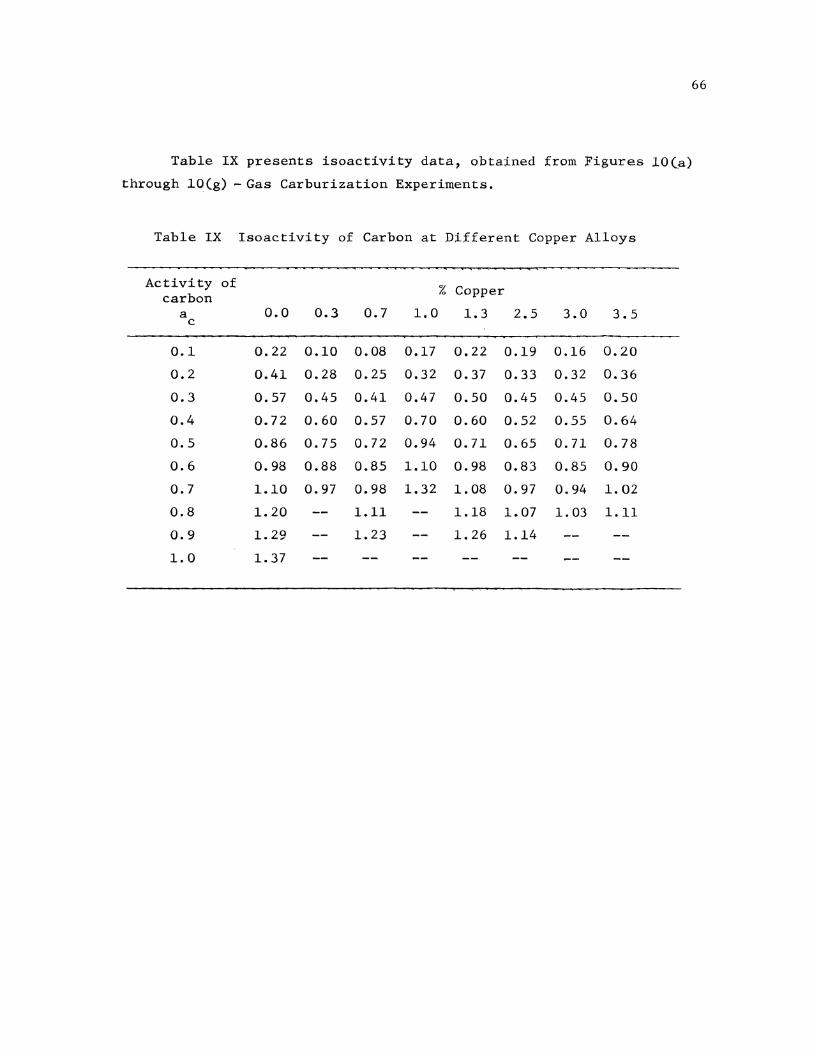
66
Table IX presents isoactivity data, obtained ;(rom ;Figures 10 (a)
through lO(g) -Gas Carburization Experiments.
Table IX Isoactivity of Carbon at Di;fferent Copper Alloys
Activity of % Copper carbon a 0.0 0.3 0.7
c 1.0 1.3 2.5 3.0 3.5
0.1 0.22 0.10 0.08 0.17 0.22 0.19 0.16 0.20
0.2 0.41 0.28 0.25 0.32 0.37 0.33 0.32 0.36
0.3 0.57 0.45 0.41 0.47 0.50 0.45 0.45 0.50
0.4 0. 72 0.60 0.57 o. 70 0.60 0.52 0.55 0.64
0.5 0.86 0.75 0.72 0.94 o. 71 0.65 0.71 0.78
0.6 0.98 0.88 0.85 1.10 0.98 0.83 0.85 0.90
0.7 1.10 0.97 0.98 1.32 1.08 0.97 0.94 1. 02
0.8 1.20 1.11 1.18 1.07 1. 03 1.11
0.9 1.29 1.23 1.26 1.14
1.0 1. 37

67
B. Graphite Solubility Experiments
Table X(a) summarizes the results of graphite solubility experi
ments. Table X(b) gives a comparison of these results of this work for
pure iron with published data.
*
Table X(a) Solubility of Graphite in Iron-Copper Alloys
Alloy Graphite Solubility (% C) Content Temperature
% Cu 950°C l000°c 1050°C
0.0 1.32 1.51 1.65
0.2 1. 25 1.45 1. 57
0.3 1.60
0.5 1.10 1.37 1.58
0.7 1. 00 1.35 1. 56
1.0 0.99 1.32 1.52
1.3 0.95 1.27 1.54
2.0 1.37
2.5 0. 72 0.99
3.0 0.81 1.12 1.36
6.0 0.76 0.86
Table X(b) Comparison of Graphite Solubility Values for Pure Iron with Published Data
950
1000
1050
This Work
1. 32
1.51
1.65
36 Gurry*
1.37
1.53
1. 69
F & Ch . 37 ray ~pman
1. 5 + o. 02
Ban-Ya et al.+13
1. 37
1.56
1. 71
By interpolation and extrapolation of experimental data at 957° and 1104°C of 1.39 and 1.86% resp.
+ Obtained by solving equation 3 at temperature and a =1.0. c

C. Solidus Tempe~ature Determination
The results oe solidus temperature determination are presented
in Table XI
Table XI Solidus Temperatures for a 90% Copper Alloy
Activity of Carbon Temperature a oc (:t 20) c
0.00 1095
0.04 1093
0.08 1091
0.12 1089
0,19 1088
1.00 1078
D. Rate of Carburization
Table XII gives the time required to attain equilibrium for some
iron-copper alloys for gas carburization at an activity of carbon of
0.08. These values were obtained from weight gain profiles in gas
carburization experiments.
Table XII Times to Attain Equilibrium Carbon Content During Gas Carburization
Alloy Content
% Cu
0.0
0.3
0.7
1.0
1.3
Time to Attain equilibrium,
in hrs.
7.25
4.50
4.00
3.25
1.50
68

69
E. Activity Coefficients for Carbon
The standard state in these calculations was chosen as graphite.
The activity coefficient was defined as f ~a /(%C). c c
Table XIII (a) 0 Activity Coefficients of Carbon at 950 c,
for :Pure Iron
Wt. % Carbon Log f c
0.17 -0.347
0.27 -0.337
0.40 ~0.398
0.55 -0.283
0.67 -0.260
o. 76 -0.247
1. 07 -0.196
1.18 -0.174
1. 37 -0.137
Table XIII(b) Activity Coefficients of Carbon at 950°C for a 0.3% Cu Alloy
Wt. % Carbon Log f c
0.26 -0.206
0.48 -0.159
0.66 -0.173
0.90 -0.167
0.96 -0.144

Table XIII(c) Activity Coe~ficients £or Carbon at 950°C for a 0.7% Cu Alloy
Wt. % Carbon Log f c
0.21 -0.090
0.41 -0.136
0.56 -0.148
0.87 -0.155
0.96 -0.148
70


![Erratum to “Thermodynamic equilibrium conditions for mass varying particle structures”[Phys. Lett. B 684 (2010) 96]](https://static.fdokumen.com/doc/165x107/634093fc874853545a0976bc/erratum-to-thermodynamic-equilibrium-conditions-for-mass-varying-particle-structuresphys.jpg)