PETRO-KING OILFIELD SERVICES LIMITED 百勤油田服務 ...
56
– 1 – Hong Kong Exchanges and Clearing Limited and The Stock Exchange of Hong Kong Limited take no responsibility for the contents of this announcement, make no representation as to its accuracy or completeness and expressly disclaim any liability whatsoever for any loss howsoever arising from or in reliance upon the whole or any part of the contents of this announcement. PETRO-KING OILFIELD SERVICES LIMITED 百勤油田服務有限公司 (Incorporated in the British Virgin Islands with limited liability) (Stock Code: 2178) ANNOUNCEMENT OF ANNUAL RESULTS FOR THE YEAR ENDED 31 DECEMBER 2018 The board (the “Board”) of directors (the “Directors”) of Petro-king Oilfield Services Limited (the “ Company ”) hereby presents the annual results of the Company and its subsidiaries (collectively referred to as the “Group”, “we” or “our”) for the year ended 31 December 2018 (the “Year” or “2018”). OVERVIEW The Group’s revenue and loss for the Year were approximately HK$258.9 million (2017: HK$287.8 million) and HK$624.1 million (2017: HK$181.1 million), respectively. Basic loss per share for the Year was HK36.1 cents (2017: HK10.4 cents). The Board has resolved not to recommend the payment of any final dividend for the Year (2017: Nil). During the Year, the Group continued to engage in the provision of oilfield and gas field technology services covering various stages in the life of oilfields and gas fields including drilling, well completion and production enhancement as well as trading and manufacturing of oilfield and gas fields related products.
-
Upload
khangminh22 -
Category
Documents
-
view
1 -
download
0
Transcript of PETRO-KING OILFIELD SERVICES LIMITED 百勤油田服務 ...

– 1 –
Hong Kong Exchanges and Clearing Limited and The Stock Exchange of Hong Kong Limited
take no responsibility for the contents of this announcement, make no representation as to
its accuracy or completeness and expressly disclaim any liability whatsoever for any loss
howsoever arising from or in reliance upon the whole or any part of the contents of this
announcement.
PETRO-KING OILFIELD SERVICES LIMITED百勤油田服務有限公司
(Incorporated in the British Virgin Islands with limited liability)
(Stock Code: 2178)
ANNOUNCEMENT OF ANNUAL RESULTS FOR THE YEAR ENDED 31 DECEMBER 2018
The board (the “Board”) of directors (the “Directors”) of Petro-king Oilfield Services Limited
(the “Company”) hereby presents the annual results of the Company and its subsidiaries
(collectively referred to as the “Group”, “we” or “our”) for the year ended 31 December 2018
(the “Year” or “2018”).
OVERVIEW
The Group’s revenue and loss for the Year were approximately HK$258.9 million (2017:
HK$287.8 million) and HK$624.1 million (2017: HK$181.1 million), respectively. Basic loss
per share for the Year was HK36.1 cents (2017: HK10.4 cents). The Board has resolved not to
recommend the payment of any final dividend for the Year (2017: Nil).
During the Year, the Group continued to engage in the provision of oilfield and gas field
technology services covering various stages in the life of oilfields and gas fields including
drilling, well completion and production enhancement as well as trading and manufacturing of
oilfield and gas fields related products.

– 2 –
During the Year, the Group’s revenue decreased by approximately 10.0% from approximately
HK$287.8 million in 2017 to approximately HK$258.9 million in 2018. Such decrease in
revenue was mainly due to the decrease in income from sales of well completion and drilling
tools to the Middle East and the China markets, while partly offset by the increase in income
from the provision of fracturing services in the China market. The decrease in sales of well
completion tools also contributed to the decrease in revenue from the Middle East geographical
market. During the Year, the Group has provided more fracturing services to certain national
oil companies in China, which resulted in an increase in revenue in the production enhancement
services and contributed to the increase in revenue from the China geographical market.
During the Year, operating loss has increased by approximately 335.8% to approximately
HK$602.7 million (2017: HK$138.3 million) which was mainly due to an increase in net
impairment loss on financial asset of approximately HK$160 million, an increase in write-off
of inventories of approximately HK$56.2 million, an increase in provision for impairment of
goodwill of approximately HK$209.7 million and an increase in write-off of property, plant and
equipment of approximately HK$61.8 million.
During the Year, net finance costs of the Group has decreased by approximately 54.0%
to approximately HK$20.5 million (2017: HK$44.5 million). Such decrease was mainly
attributable to the absence of finance costs relating to the discounting of certain trade and other
receivables (2017: HK$24.7 million).
GEOGRAPHICAL MARKET ANALYSIS
Set out below is the breakdown of revenue by geographical area:
2018 2017
Approximate
percentage
change
Approximate percentage of total revenue
in 2018
Approximate
percentage of
total revenue
in 2017
(HK$ million) (HK$ million) (%) (%) (%)
China market 182.5 153.3 19.0% 70.5% 53.3%
Overseas market 76.4 134.5 -43.2% 29.5% 46.7%
Total 258.9 287.8 -10.0% 100% 100%
– 3 –
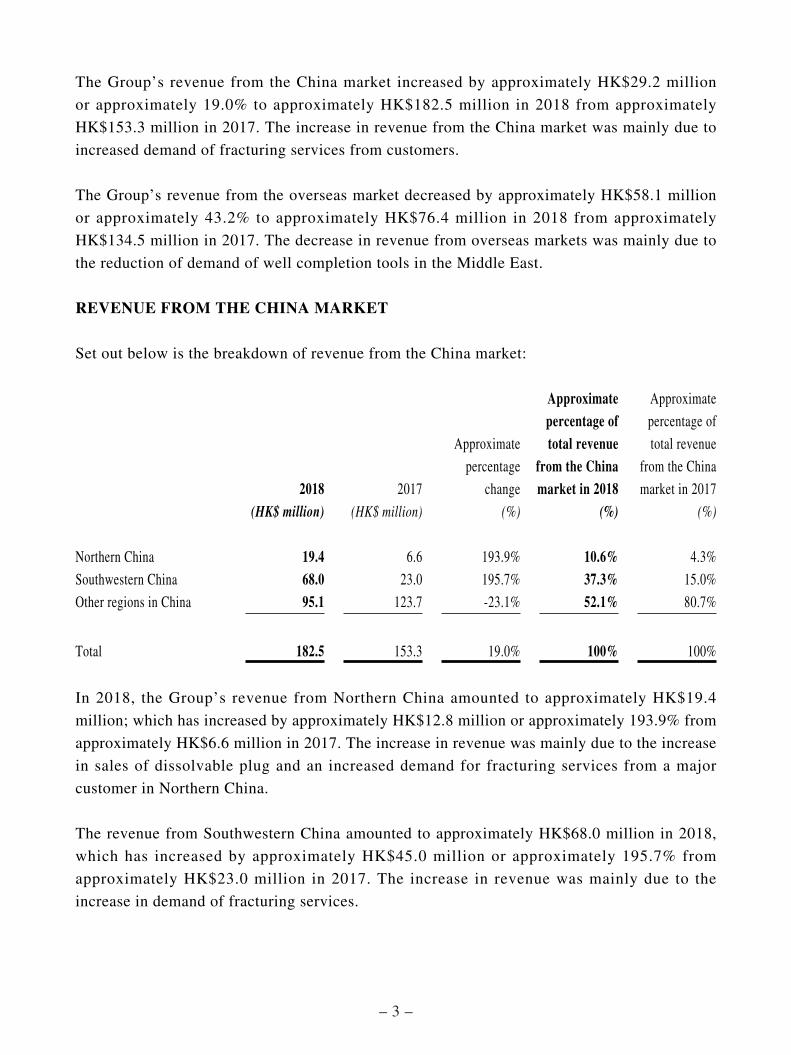
The Group’s revenue from the China market increased by approximately HK$29.2 million
or approximately 19.0% to approximately HK$182.5 million in 2018 from approximately
HK$153.3 million in 2017. The increase in revenue from the China market was mainly due to
increased demand of fracturing services from customers.
The Group’s revenue from the overseas market decreased by approximately HK$58.1 million
or approximately 43.2% to approximately HK$76.4 million in 2018 from approximately
HK$134.5 million in 2017. The decrease in revenue from overseas markets was mainly due to
the reduction of demand of well completion tools in the Middle East.
REVENUE FROM THE CHINA MARKET
Set out below is the breakdown of revenue from the China market:
2018 2017
Approximate
percentage
change
Approximate percentage of total revenue
from the China market in 2018
Approximate
percentage of
total revenue
from the China
market in 2017
(HK$ million) (HK$ million) (%) (%) (%)
Northern China 19.4 6.6 193.9% 10.6% 4.3%
Southwestern China 68.0 23.0 195.7% 37.3% 15.0%
Other regions in China 95.1 123.7 -23.1% 52.1% 80.7%
Total 182.5 153.3 19.0% 100% 100%
In 2018, the Group’s revenue from Northern China amounted to approximately HK$19.4
million; which has increased by approximately HK$12.8 million or approximately 193.9% from
approximately HK$6.6 million in 2017. The increase in revenue was mainly due to the increase
in sales of dissolvable plug and an increased demand for fracturing services from a major
customer in Northern China.
The revenue from Southwestern China amounted to approximately HK$68.0 million in 2018,
which has increased by approximately HK$45.0 million or approximately 195.7% from
approximately HK$23.0 million in 2017. The increase in revenue was mainly due to the
increase in demand of fracturing services.
– 4 –
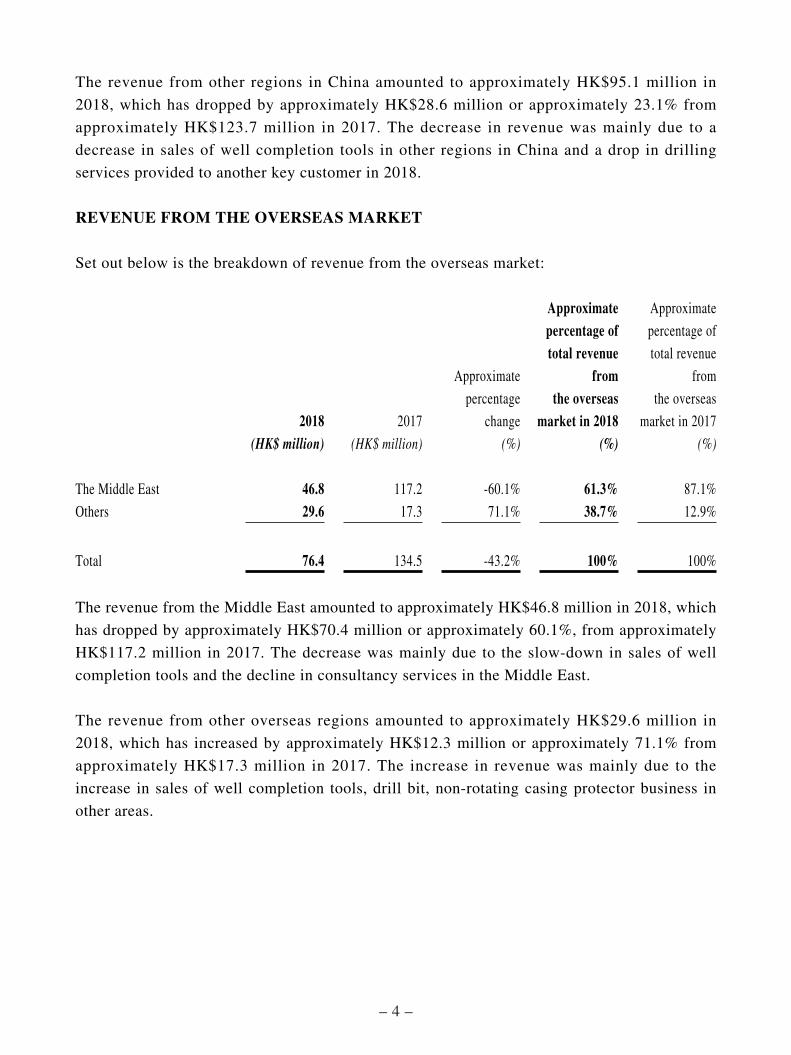
The revenue from other regions in China amounted to approximately HK$95.1 million in
2018, which has dropped by approximately HK$28.6 million or approximately 23.1% from
approximately HK$123.7 million in 2017. The decrease in revenue was mainly due to a
decrease in sales of well completion tools in other regions in China and a drop in drilling
services provided to another key customer in 2018.
REVENUE FROM THE OVERSEAS MARKET
Set out below is the breakdown of revenue from the overseas market:
2018 2017
Approximate
percentage
change
Approximate percentage of total revenue
from the overseas
market in 2018
Approximate
percentage of
total revenue
from
the overseas
market in 2017
(HK$ million) (HK$ million) (%) (%) (%)
The Middle East 46.8 117.2 -60.1% 61.3% 87.1%
Others 29.6 17.3 71.1% 38.7% 12.9%
Total 76.4 134.5 -43.2% 100% 100%
The revenue from the Middle East amounted to approximately HK$46.8 million in 2018, which
has dropped by approximately HK$70.4 million or approximately 60.1%, from approximately
HK$117.2 million in 2017. The decrease was mainly due to the slow-down in sales of well
completion tools and the decline in consultancy services in the Middle East.
The revenue from other overseas regions amounted to approximately HK$29.6 million in
2018, which has increased by approximately HK$12.3 million or approximately 71.1% from
approximately HK$17.3 million in 2017. The increase in revenue was mainly due to the
increase in sales of well completion tools, drill bit, non-rotating casing protector business in
other areas.

– 5 –
OPERATING SEGMENT ANALYSIS
Set out below is the breakdown of revenue by operating segment:
2018 2017
Approximate
percentage
change
Approximate percentage of total revenue
in 2018
Approximate
percentage of
total revenue
in 2017
(HK$ million) (HK$ million) (%) (%) (%)
Oilfield project tools and
services 226.8 243.6 -6.9% 87.6% 84.6%
Consultancy services 32.1 44.2 -27.4% 12.4% 15.4%
Total 258.9 287.8 -10.0% 100% 100%
In 2018, the Group’s revenue from oilfield project tools and services amounted to
approximately HK$226.8 million, which has decreased by approximately HK$16.8 million or
approximately 6.9% from approximately HK$243.6 million in 2017. The decrease was mainly
due to the decline in well completion tools sales revenue from the Middle East, the drilling
service paused with a key customer in 2018, net off the revenue increase in fracturing projects.
The Group’s revenue from consultancy services amounted to approximately HK$32.1 million
in 2018, which has decreased by approximately HK$12.1 million or approximately 27.4%,
from approximately HK$44.2 million in 2017. The revenue decreased mainly because of the
completion of certain consultancy services in 2017.
– 6 –
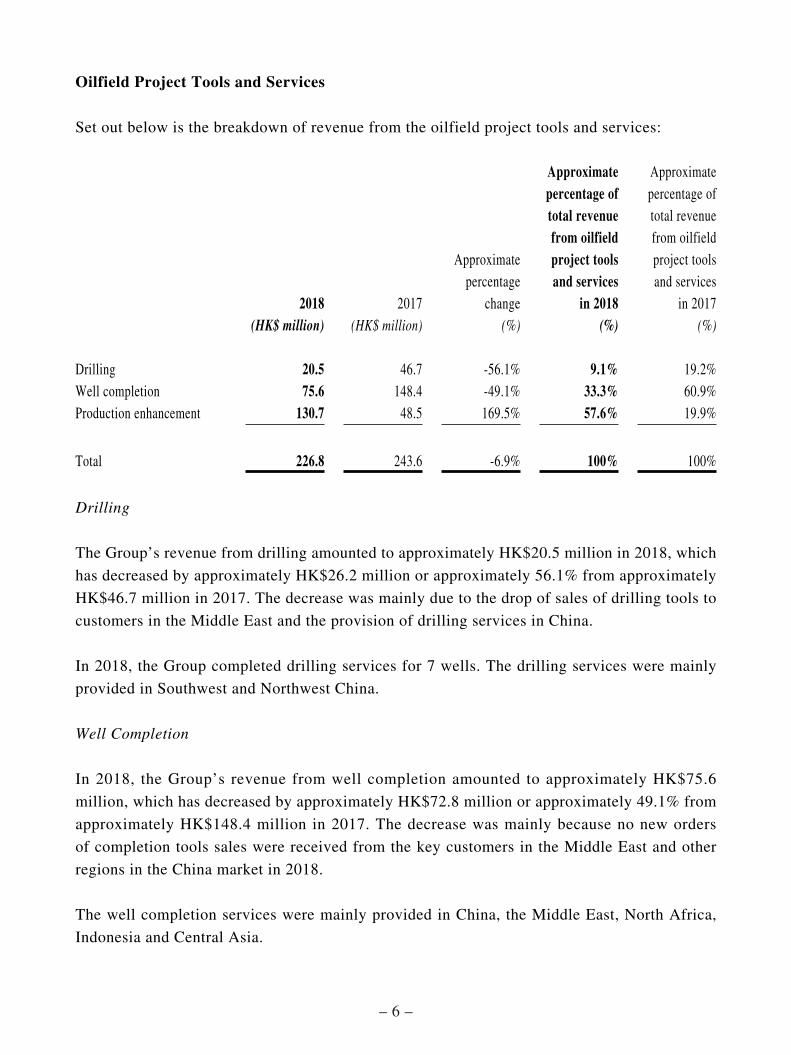
Oilfield Project Tools and Services
Set out below is the breakdown of revenue from the oilfield project tools and services:
2018 2017
Approximate percentage
change
Approximate percentage of total revenue from oilfield project tools and services
in 2018
Approximate percentage of total revenue from oilfield project tools and services
in 2017(HK$ million) (HK$ million) (%) (%) (%)
Drilling 20.5 46.7 -56.1% 9.1% 19.2%Well completion 75.6 148.4 -49.1% 33.3% 60.9%Production enhancement 130.7 48.5 169.5% 57.6% 19.9%
Total 226.8 243.6 -6.9% 100% 100%
Drilling
The Group’s revenue from drilling amounted to approximately HK$20.5 million in 2018, which
has decreased by approximately HK$26.2 million or approximately 56.1% from approximately
HK$46.7 million in 2017. The decrease was mainly due to the drop of sales of drilling tools to
customers in the Middle East and the provision of drilling services in China.
In 2018, the Group completed drilling services for 7 wells. The drilling services were mainly
provided in Southwest and Northwest China.
Well Completion
In 2018, the Group’s revenue from well completion amounted to approximately HK$75.6
million, which has decreased by approximately HK$72.8 million or approximately 49.1% from
approximately HK$148.4 million in 2017. The decrease was mainly because no new orders
of completion tools sales were received from the key customers in the Middle East and other
regions in the China market in 2018.
The well completion services were mainly provided in China, the Middle East, North Africa,
Indonesia and Central Asia.

– 7 –
Production Enhancement
In 2018, the Group’s revenue from production enhancement amounted to approximately
HK$130.7 million, which has increased by approximately HK$82.2 million or approximately
169.5% from approximately HK$48.5 million in 2017. The increase was mainly due to the
increase of fracturing projects in the China market.
In 2018, the Group provided production enhancement services for 119 wells in the China
market.
CUSTOMER ANALYSIS
Customer 2018 2017
Approximate
percentage
change
Approximate percentage of total revenue
in 2018
Approximate
percentage of
total revenue
in 2017
(HK$ million) (HK$ million) (%) (%) (%)
Customer 1 87.0 28.6 204.2% 33.6% 9.9%
Customer 2 33.5 74.8 -55.2% 12.9% 26.0%
Customer 3 33.0 21.1 56.4% 12.7% 7.3%
Customer 4 21.5 21.6 -0.5% 8.3% 7.5%
Customer 5 8.7 – N/A 3.4% 0.0%
Customer 6 8.4 74.0 -88.6% 3.3% 25.7%
Customer 7 8.1 – N/A 3.1% 0.0%
Customer 8 6.4 4.8 33.3% 2.5% 1.7%
Other customers 52.3 62.9 -16.9% 20.2% 21.9%
Total 258.9 287.8 -10% 100% 100%
The revenue from customer 1 amounted to approximately HK$87.0 million in 2018, which
has increased by approximately HK$58.4 million or approximately 204.2% from HK$28.6
million in 2017. Such revenue from this customer was mainly attributable to the increased
demand in fracturing services in southwestern China. The revenue from customer 2 amounted
to approximately HK$33.5 million in 2018, which has decreased by approximately HK$41.3
million or approximately 55.2% from approximately HK$74.8 million in 2017. This decrease
was mainly due to the drop in sales of well completion tools in the China market. The revenue
from customer 3 amounted to approximately HK$33.0 million in 2018, which has increased
by approximately HK$11.9 million or approximately 56.4% from approximately HK$21.1

– 8 –
million in 2017. Such increase was mainly attributable to an increased demand of production
enhancement services in the Northern China market. The revenue from customer 4 amounted
to approximately HK$21.5 million in 2018, which has decreased by approximately HK$0.1
million or approximately 0.5% from approximately HK$21.6 million in 2017. The revenue
from customer 5 amounted to approximately HK$8.7 million in 2018 (2017: Nil), which was
attributable to the Group’s sales of well completion tools in the China market. The revenue
from customer 6 amounted to approximately HK$8.4 million in 2018, which has decreased
by approximately HK$65.6 million or approximately 88.6% from HK$74.0 million in 2017.
This decrease was mainly due to the drop in sales of well completion tools in the Middle
East. Revenue from Customer 7 amounted to approximately HK$8.1 million in 2018 (2017:
Nil), which was generated from the provision of certain consultancy service in the Middle
East. Revenue from Customer 8 amounted to approximately HK$6.4 million in 2018, which
has increased by approximately HK$1.6 million or approximately 33.3% from approximately
HK$4.8 million in 2017, This increase was mainly attributable to the sales of well completion
tools in other markets. The revenue from other customers amounted to approximately HK$52.3
million in 2018, which has dropped by approximately HK$10.6 million or approximately 16.9%
from approximately HK$62.9 million in 2017.
HUMAN RESOURCES
The Group believes that our people are the most valuable assets to our business. We
have implemented human resources policies and procedures that detail requirements on
compensation dismissal, recruitment, promotion, working hours, equal opportunity and other
benefits and welfare. We support employees’ growth and strive to secure our core expertise
through training and development. To equip our frontline staff with the right skillset and
knowledge, we arranged for a series of training courses that cover technical update of drilling
and completion technology, blast management, control at wells and environment management.
We also worked with external organisations such as unions and consultants to provide training
for the specific needs of the operations. The Group has arranged 49 trainings, more than
9,500 hours in total and 260 employees attended these training programs in 2018. Besides, the
company implemented new talents selection system to expand the promotion channel for staff
in order to realise a win-win situation for both the Company and employees.
To cope with the development trend of the industry, the Group streamlined the organisation
structure and the cost structure of all service lines as well as the supporting departments. The
Company paid high attention to talent introduction and has recruited some international experts
who are good at market developing as well. The total headcount was 340 employees as at 31
December 2018, remained nearly flat as compared to that of 334 employees as at 31 December
2017.
– 9 –
In order to keep the Group’s human resources policies and procedures abreast with the
industry development, the Group reviewed its human resources management system and made
certain transformation aiming at a long-term development of the Group’s engineer talents
and implemented a new performance based compensation system in 2018 encouraging staff
ownership and team spirit.
RESEARCH AND DEVELOPMENT
As a high-end integrated oilfield services provider, the Group attaches great importance to
technology, and prides itself on introducing innovative products and services in various oilfield
service lines, such as directional drilling, multistage fracturing, down-hole completion, surface
facilities for safety and flow control, drilling fluids and fracturing liquid. In 2018, the Group
continued to seek advancement in technology and introduced new products to the market,
including the following:
• Successfully designed and tested second generation of 51/2” dissolvable bridge plug,
which has been applied in the Group’s production enhancement project in the second half
of 2018. This kind of tool can substantially shorten the operation time and in turn save
operation cost for multistage perforation fracturing operations.
• Successfully designed and tested a new 41/2” tubing retrievable safety valve which can
withstand working pressure of 20,000 Psi. This kind of tool can be used in wells with
extra-high pressure and high temperatures. Most of the safety valve suppliers in the
market can only provide safety valve that can withstand working pressure of up to 10,000
Psi.
• Successfully designed and tested 41/2” and big bore dissolvable bridge plug, which has
been applied in the Group’s production enhancement project in the second half of 2018.
This kind of tool can substantially shorten the operation time and in turn save operation
cost for multistage perforation fracturing operations.
• Continued to focus on the development and testing of 31/2” big bore dissolvable bridge
plug to meet the demand of the China and overseas markets.
The Group pays great attention to the registration of patents and always encourages employees
to apply for patents. As at 31 December 2018, the Group had 20 utility model patents and 9
innovation patents and was applying for 4 utility model patents and 15 innovation patents.

– 10 –
During the Year, the Group has been granted the API Certificate for Specification for
Completion Accessories and the V0 Validation Level Certificate by the American Petroleum
Institute. These certificates are accreditation of the Group’s product quality and high
production standards. The granting of such certificates will expand the Group’s customer
base and enable the Group to supply products to customers with stringent product quality
requirements.
In 2019, the Group will continue to focus on the research and development of down-hole
completion tools and technologies, as well as certain specific high-end drilling tools and
technologies, including 95/8” 5,000 Psi electric submersible pump packer, 7” 5,000 Psi electric
submersible pump packer, 41/2” slimline tubing retrievable safety valve. In order to maintain
its leading position in the high-end oilfield service sector, the Group will continue its effort in
developing oilfield service tools and technologies through in-house research and development
and through cooperation with oilfield service technology companies.
OUTLOOK
International crude oil price has been quite volatile during 2018. The Brent crude oil price
started at approximately US$66/barrel at the beginning of the Year, topping at approximately
US$87/barrel in October 2018 and dropped to approximately US$53/barrel at the end of
2018. Brent crude oil price has rebound to approximately US$67/barrel as at the date of this
announcement. Notwithstanding the fluctuation in International crude oil price throughout the
Year, the average monthly Brent crude oil price has increased from approximately US$56/
barrel in 2017 to approximately US$71/barrel in 2018.
With the continual stabilisation in international crude oil price and China’s national policy
to secure national energy safety and to encourage shale gas consumption for environmental
protection, owners of shale gas fields in the PRC (mostly major national oil companies) have
started to accelerate their construction plans for their shale gas projects and such accelerating
trend has become more obvious since the fourth quarter of 2018. During the Year, the Group
has acquired additional fracturing equipment which will enable the Group to participate
in large-scale shale gas projects to enhance the Group’s revenue and profit. The Group’s
fracturing equipment is now under full utilisation. We believe the increasing demand for
fracturing services from the construction of shale gas fields will continue in 2019 and will
enhance the profitability of our Group’s production enhancement business segment in 2019.

– 11 –
As a result of the continual stabilisation in international crude oil price, there are also increasing
demands for the Group’s well completion tools and production enhancement tools from both
domestic and overseas markets which shall enhance the Group’s revenue and profitability in
2019. For overseas market, the Group will continue to explore market opportunities in the
Middle East, African and South American regions.
Looking ahead to 2019, we will continue to put efforts into the marketing and promotion of
the Group’s oilfield services, tools and technologies so as to increase our market penetration.
In addition, the Group will continue to focus on the advancement of its oilfield service
technologies and tools in order to further enhance our capability to provide high-end oilfield
services in the China and overseas markets. In addition, the Group will continue to explore
other investment opportunities that have earning potentials to expand its existing operations
and to diversify its business. With the committed efforts of our staff and management, we are
confident and optimistic on the prospects of the Group.
– 12 –
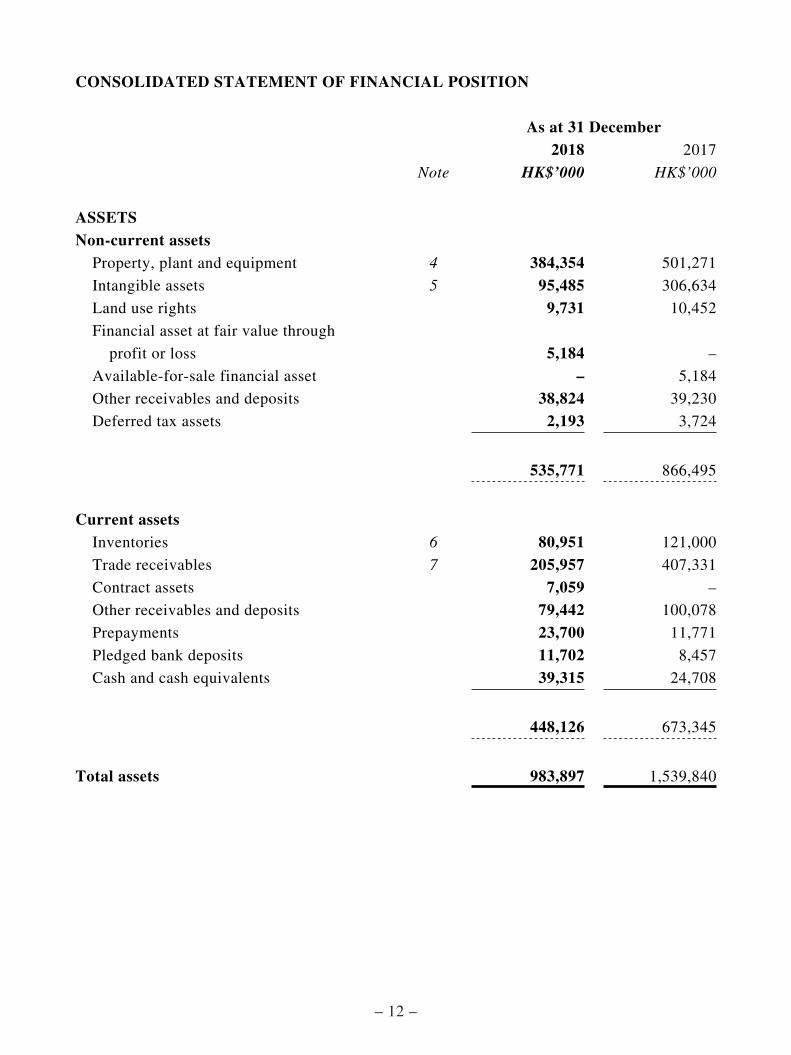
CONSOLIDATED STATEMENT OF FINANCIAL POSITION
As at 31 December2018 2017
Note HK$’000 HK$’000
ASSETSNon-current assets
Property, plant and equipment 4 384,354 501,271
Intangible assets 5 95,485 306,634
Land use rights 9,731 10,452
Financial asset at fair value through
profit or loss 5,184 –
Available-for-sale financial asset – 5,184
Other receivables and deposits 38,824 39,230
Deferred tax assets 2,193 3,724
535,771 866,495
Current assetsInventories 6 80,951 121,000
Trade receivables 7 205,957 407,331
Contract assets 7,059 –
Other receivables and deposits 79,442 100,078
Prepayments 23,700 11,771
Pledged bank deposits 11,702 8,457
Cash and cash equivalents 39,315 24,708
448,126 673,345
Total assets 983,897 1,539,840
– 13 –
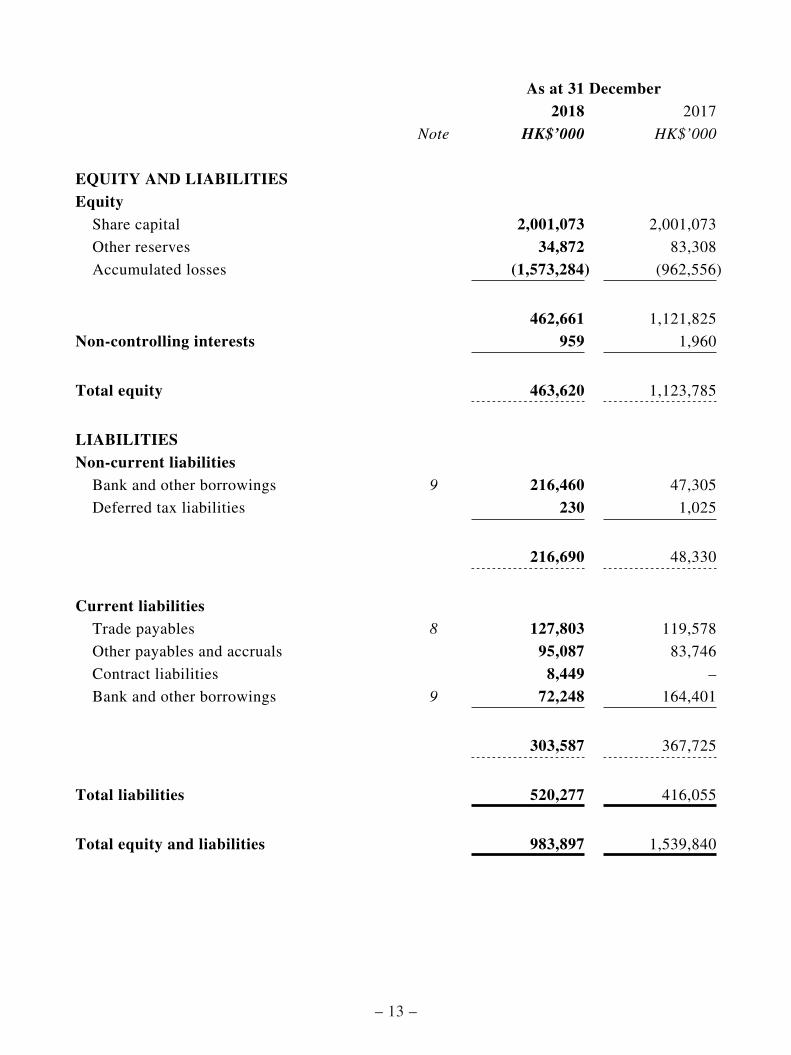
As at 31 December2018 2017
Note HK$’000 HK$’000
EQUITY AND LIABILITIESEquity
Share capital 2,001,073 2,001,073
Other reserves 34,872 83,308
Accumulated losses (1,573,284) (962,556)
462,661 1,121,825
Non-controlling interests 959 1,960
Total equity 463,620 1,123,785
LIABILITIESNon-current liabilities
Bank and other borrowings 9 216,460 47,305
Deferred tax liabilities 230 1,025
216,690 48,330
Current liabilitiesTrade payables 8 127,803 119,578
Other payables and accruals 95,087 83,746
Contract liabilities 8,449 –
Bank and other borrowings 9 72,248 164,401
303,587 367,725
Total liabilities 520,277 416,055
Total equity and liabilities 983,897 1,539,840

– 14 –
CONSOLIDATED STATEMENT OF COMPREHENSIVE INCOME
Year ended 31 December2018 2017
Note HK$’000 HK$’000
Revenue 3 258,932 287,848Other income 1,685 2,012
Operating costsMaterial costs (110,029) (128,740)Depreciation of property, plant and equipment 4 (72,220) (80,778)Amortisation of intangible assets
and land use rights (887) (1,662)Operating lease rental (6,413) (6,849)Employee benefit expenses (101,363) (105,058)Distribution expenses (4,088) (5,118)Technical service fees (18,117) (13,209)Research and development expenses (13,198) (15,396)Entertainment and marketing expenses (10,440) (7,790)Other expenses 10 (44,928) (35,026)Net impairment loss on financial assets (160,023) –Provision for impairment of trade
and other receivables, net 7 – (3,072)Provision for inventories losses 6 – (21,126)Write-off of inventories 6 (56,230) –Provision for impairment of goodwill 5 (209,732) –Write-off of property, plant and equipment 4 (62,097) (313)Other gains/(losses), net 11 6,467 (4,055)
Operating loss (602,681) (138,332)
Finance income 12 93 82Finance costs 12 (20,564) (44,593)
Finance costs, net (20,471) (44,511)
Loss before income tax (623,152) (182,843)Income tax (expense)/credit 13 (919) 1,701
Loss for the year (624,071) (181,142)
Other comprehensive (loss)/income
Items that may be reclassified to profit or loss:Change in fair value of an available-for-sale
financial asset – (2,237)Exchange differences on translation of foreign
operations (33,864) 58,946
Other comprehensive (loss)/income for the year, net of tax (33,864) 56,709
Total comprehensive loss for the year (657,935) (124,433)

– 15 –
Year ended 31 December2018 2017
Note HK$’000 HK$’000
Loss for the year attributable to:Owners of the Company (623,070) (180,262)Non-controlling interests (1,001) (880)
(624,071) (181,142)
Total comprehensive loss for the year attributable to:
Owners of the Company (656,934) (123,553)Non-controlling interests (1,001) (880)
(657,935) (124,433)
Loss per share attributable to owners of the Company during the year 14
Basic loss per share (HK cents) (36.1) (10.4)
Diluted loss per share (HK cents) (36.1) (10.4)

– 16 –
NOTES TO THE CONSOLIDATED FINANCIAL INFORMATION
1 GENERAL INFORMATION
Petro-king Oilfield Services Limited (the “Company”) was incorporated in the British Virgin Islands on 7
September 2007 as an exempted company with limited liability. The address of the Company’s registered
office is at Commerce House, Wickhams Cay 1, P.O. Box 3140, Road Town, Tortola, British Virgin Islands
(“B.V.I.”).
The Company is an investment holding company and its subsidiaries (together the “Group”) are principally
engaged in the provision of oilfield technology and oilfield services covering various stages in the life of an
oilfield including drilling, well completion and production enhancement with ancillary activities in trading
and manufacturing of oilfield services related products.
The Company has its primary listing on the Main Board of The Stock Exchange of Hong Kong Limited on
6 March 2013.
These consolidated financial information are presented in Hong Kong dollars (“HK$”), unless otherwise
stated.
2 SUMMARY OF SIGNIFICANT ACCOUNTING POLICIES
This note provides a list of the significant accounting policies adopted in the preparation of these
consolidated financial information. These policies have been consistently applied to all the years presented,
unless otherwise stated.
2.1 Basis of preparation
The consolidated financial information of the Company have been prepared in accordance with
all applicable International Financial Reporting Standards (“IFRSs”). The consolidated financial
information have been prepared under the historical cost convention, as modified by the revaluation
of financial asset at fair value through profit or loss, which is carried at fair value.
The preparation of consolidated financial information in conformity with IFRSs requires the use of
certain critical accounting estimates. It also requires management to exercise its judgement in the
process of applying the Group’s accounting policies.
– 17 –
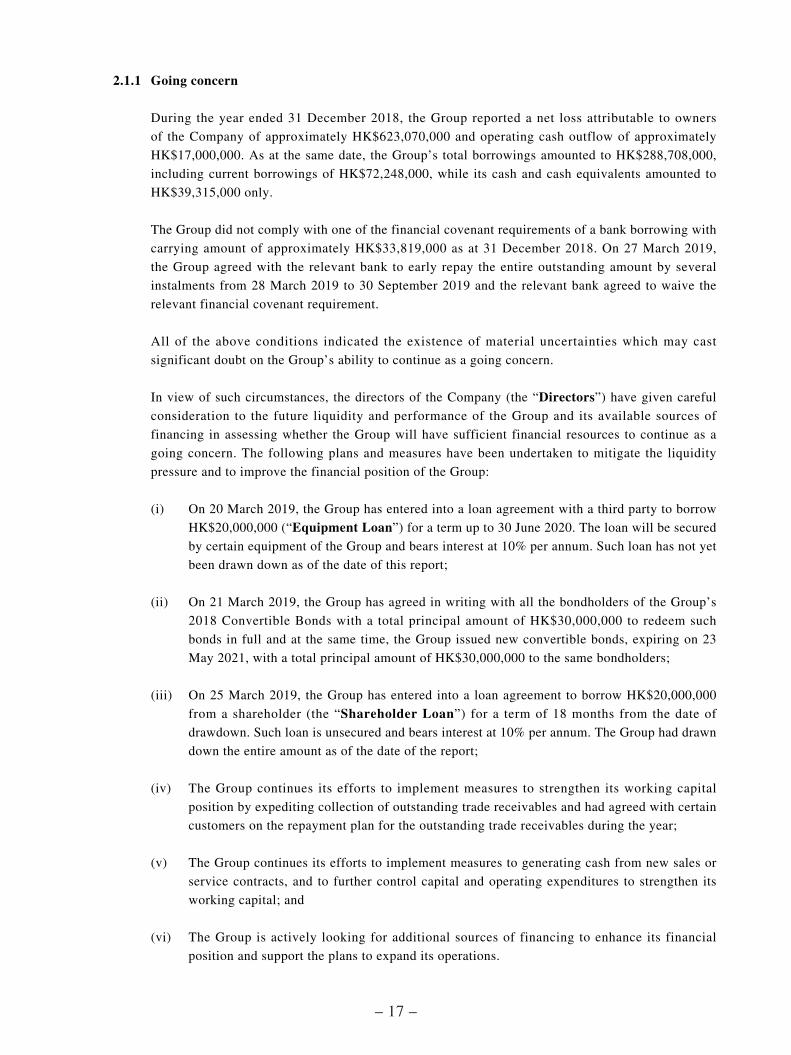
2.1.1 Going concern
During the year ended 31 December 2018, the Group reported a net loss attributable to owners
of the Company of approximately HK$623,070,000 and operating cash outflow of approximately
HK$17,000,000. As at the same date, the Group’s total borrowings amounted to HK$288,708,000,
including current borrowings of HK$72,248,000, while its cash and cash equivalents amounted to
HK$39,315,000 only.
The Group did not comply with one of the financial covenant requirements of a bank borrowing with
carrying amount of approximately HK$33,819,000 as at 31 December 2018. On 27 March 2019,
the Group agreed with the relevant bank to early repay the entire outstanding amount by several
instalments from 28 March 2019 to 30 September 2019 and the relevant bank agreed to waive the
relevant financial covenant requirement.
All of the above conditions indicated the existence of material uncertainties which may cast
significant doubt on the Group’s ability to continue as a going concern.
In view of such circumstances, the directors of the Company (the “Directors”) have given careful
consideration to the future liquidity and performance of the Group and its available sources of
financing in assessing whether the Group will have sufficient financial resources to continue as a
going concern. The following plans and measures have been undertaken to mitigate the liquidity
pressure and to improve the financial position of the Group:
(i) On 20 March 2019, the Group has entered into a loan agreement with a third party to borrow
HK$20,000,000 (“Equipment Loan”) for a term up to 30 June 2020. The loan will be secured
by certain equipment of the Group and bears interest at 10% per annum. Such loan has not yet
been drawn down as of the date of this report;
(ii) On 21 March 2019, the Group has agreed in writing with all the bondholders of the Group’s
2018 Convertible Bonds with a total principal amount of HK$30,000,000 to redeem such
bonds in full and at the same time, the Group issued new convertible bonds, expiring on 23
May 2021, with a total principal amount of HK$30,000,000 to the same bondholders;
(iii) On 25 March 2019, the Group has entered into a loan agreement to borrow HK$20,000,000
from a shareholder (the “Shareholder Loan”) for a term of 18 months from the date of
drawdown. Such loan is unsecured and bears interest at 10% per annum. The Group had drawn
down the entire amount as of the date of the report;
(iv) The Group continues its efforts to implement measures to strengthen its working capital
position by expediting collection of outstanding trade receivables and had agreed with certain
customers on the repayment plan for the outstanding trade receivables during the year;
(v) The Group continues its efforts to implement measures to generating cash from new sales or
service contracts, and to further control capital and operating expenditures to strengthen its
working capital; and
(vi) The Group is actively looking for additional sources of financing to enhance its financial
position and support the plans to expand its operations.

– 18 –
The Directors have reviewed the Group’s cash flow projections prepared by management, which
cover a period of twelve months from 31 December 2018. In the opinion of the Directors, in light of
the above, taking into account the anticipated cash flows to be generated from the Group’s operations
as well as the above plans and measures, the Group will have sufficient working capital to meet
its financial obligations as and when they fall due in the coming twelve months from 31 December
2018. Accordingly, the Directors consider that it is appropriate to prepare the consolidated financial
information on a going concern basis.
Notwithstanding the above, material uncertainty exist as to whether the Group is able to achieve its
plans and measures described above. Whether the Group will be able to continue as a going concern
would depend upon the Group’s ability to generate adequate financing and operating cash flows
through:
(i) successful draw down of the Equipment Loan as and when needed;
(ii) successful implementation of measures to accelerate the collection of outstanding trade
receivables and the other financial assets at amortised cost and successful collection of the
trade receivables according to the relevant agreed repayment plan;
(iii) successful implementation of the measures to improve sales, control costs, contain capital
expenditures so as to strengthen its working capital position;
(iv) on-going compliance with the covenants of the Group’s bank and other borrowings to ensure
these borrowings would not become payable prior to their respective original maturity dates;
and
(v) successful raising of additional new sources of financing as and when needed.
Should the Group be unable to achieve the above plans and measures such that it would not be
operate as a going concern, adjustments would have to be made to reduce the carrying values of the
Group’s assets to their recoverable amounts, to provide for financial liabilities which might arise,
and to reclassify non-current assets and non-current liabilities as current assets and current liabilities,
respectively. The effect of these adjustments has not been reflected in the consolidated financial
information.
– 19 –
2.1.2 Changes in accounting policies and disclosures
(a) New and amended standards adopted by the Group
The Group has applied the following standards and amendments for the first time for their
annual reporting period commencing 1 January 2018:
IAS 40 (Amendment) Transfers of Investment Property
IFRS 2 (Amendment) Classification and Measurement of Share-Based Payment
Transactions
IFRS 4 (Amendment) Applying IFRS 9 Financial Instruments with IFRS 4
Insurance Contracts
IFRS 9 Financial Instruments
IFRS 15 Revenue from Contracts with Customers
IFRS 15 (Amendment) Clarifications to IFRS 15
IFRIC-Int 22 Foreign Currency Transactions and Advance Consideration
Annual Improvements Project
(Amendment)
Annual Improvements 2014 – 2016 Cycle
The Group had to change its accounting policies following the adoption of IFRS 9 and IFRS
15 which are disclosed in Note 2.2. The adoption of other new and amended standards did not
have any material impact on the current period or any prior period.
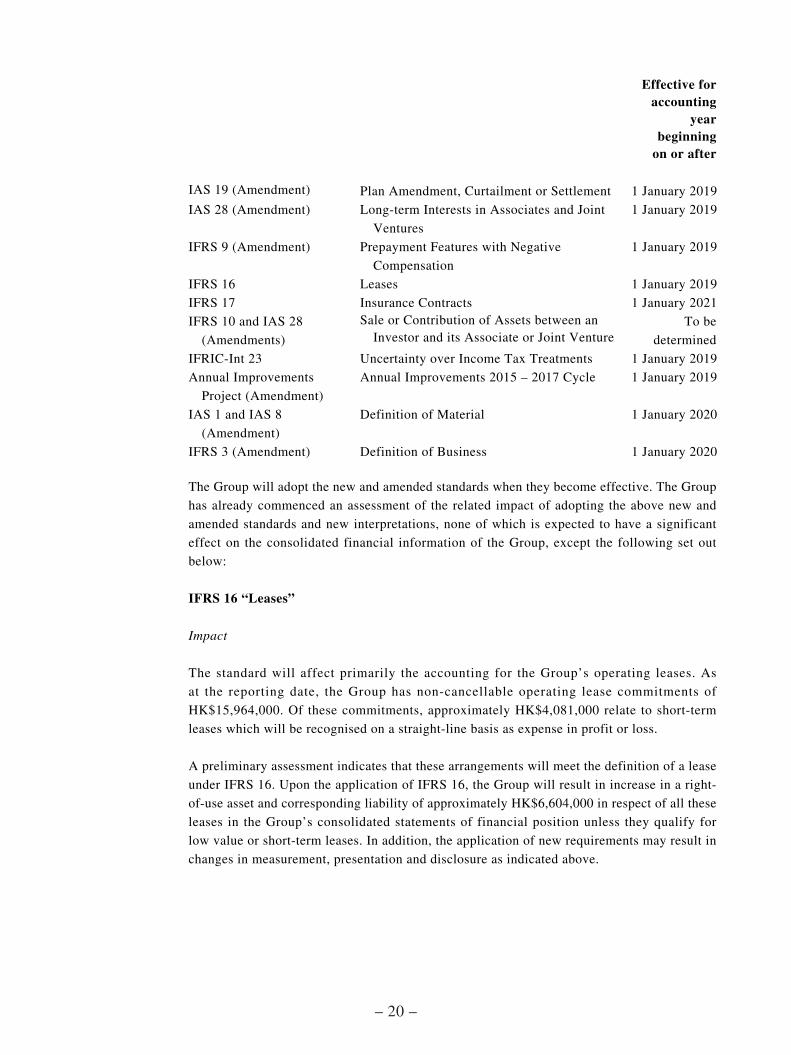
(b) New and amended standards and interpretations not yet adopted by the Group
The following new and amended standards and new interpretations have been issued but
are not effective for the financial year beginning on 1 January 2018 and have not been early
adopted by the Group.
– 20 –
Effective for accounting
year beginning
on or after
IAS 19 (Amendment) Plan Amendment, Curtailment or Settlement 1 January 2019
IAS 28 (Amendment) Long-term Interests in Associates and Joint
Ventures
1 January 2019
IFRS 9 (Amendment) Prepayment Features with Negative
Compensation
1 January 2019
IFRS 16 Leases 1 January 2019
IFRS 17 Insurance Contracts 1 January 2021
IFRS 10 and IAS 28
(Amendments)
Sale or Contribution of Assets between an Investor and its Associate or Joint Venture
To be
determined
IFRIC-Int 23 Uncertainty over Income Tax Treatments 1 January 2019
Annual Improvements
Project (Amendment)
Annual Improvements 2015 – 2017 Cycle 1 January 2019
IAS 1 and IAS 8
(Amendment)
Definition of Material 1 January 2020
IFRS 3 (Amendment) Definition of Business 1 January 2020
The Group will adopt the new and amended standards when they become effective. The Group
has already commenced an assessment of the related impact of adopting the above new and
amended standards and new interpretations, none of which is expected to have a significant
effect on the consolidated financial information of the Group, except the following set out
below:
IFRS 16 “Leases”
Impact
The standard will affect primarily the accounting for the Group’s operating leases. As
at the reporting date, the Group has non-cancellable operating lease commitments of
HK$15,964,000. Of these commitments, approximately HK$4,081,000 relate to short-term
leases which will be recognised on a straight-line basis as expense in profit or loss.
A preliminary assessment indicates that these arrangements will meet the definition of a lease
under IFRS 16. Upon the application of IFRS 16, the Group will result in increase in a right-
of-use asset and corresponding liability of approximately HK$6,604,000 in respect of all these
leases in the Group’s consolidated statements of financial position unless they qualify for
low value or short-term leases. In addition, the application of new requirements may result in
changes in measurement, presentation and disclosure as indicated above.

– 21 –
The Directors expected that, such changes would increase the consolidated asset and liabilities
of the Group, but would not result in a significant impact to the consolidated statements of
comprehensive income. Operating cash flows will increase and financing cash flows will
decrease by approximately HK$810,000 in 2019 as repayment of the principal portion of the
lease liabilities will be classified as cash flows from financing activities.
Date of adoption by the Group
The Group will apply the standard from its mandatory adoption date of 1 January 2019. The
Group intends to apply the simplified transition approach and will not restate comparative
amounts for the year prior to first adoption. Right-of-use assets will be measured at the amount
of the lease liability on the adoption (adjusted for any prepaid or accrued lease expenses).
There are no other standards that are not yet effective and that would be expected to have
a material impact on the entity in the current or future reporting periods and on foreseeable
future transactions.
2.2 Changes in accounting policies and disclosures
This note explains the impact of the adoption of IFRS 9 and IFRS 15 on the Group’s consolidated
financial information.
(a) Impact on financial information
IFRS 9 was generally adopted without restating comparative information with the exception
of certain aspects of hedge accounting. The reclassifications and the adjustments arising from
the new impairment rules are therefore not reflected in the consolidated balance sheet as at 31
December 2017, but are recognised in the opening of the consolidated statement of financial
position on 1 January 2018.
The following tables show the adjustments recognised for each individual line item. Line
items that were not affected by the changes have not been included. As a result, the sub-totals
and totals disclosed cannot be recalculated from the numbers provided. The adjustments are
explained in more detail by standard below.

– 22 –
31 December 2017
As originally presented IFRS 9 IFRS 15
1 January 2018
RestatedBalance sheet (extract) HK$’000 HK$’000 HK$’000 HK$’000
Non-current assetsFinancial asset at fair value
through profit or loss
(“FVTPL”) – 5,184 – 5,184
Available-for-sale financial
asset (“AFS”) 5,184 (5,184) – –
5,184 – – 5,184
Current assetsTrade receivables 407,331 (12,503) – 394,828
Contract assets – – 274 274
Other receivables, deposits
and prepayments 111,849 (1,654) – 110,195
519,180 (14,157) 274 505,297
Contract liabilitiesOther payables and accruals 3,733 – (3,733) –
Contract liabilities – – 3,733 3,733
3,733 – – 3,733
EquityOther reserves 83,308 2,237 – 85,545
Accumulated losses (962,556) (16,394) 274 (978,676)
(879,248) (14,157) 274 (893,131)
(b) IFRS 9 “Financial Instruments”
IFRS 9 replaces the provisions of IAS 39 that relate to the recognition, classification
and measurement of financial assets and financial liabilities, derecognition of financial
instruments, impairment of financial assets and hedge accounting.
The adoption of IFRS 9 “Financial Instruments” from 1 January 2018 resulted in changes in
accounting policies.

– 23 –
The total impact on the Group’s accumulated losses as at 1 January 2018 is as follows:
AuditedNote HK$’000
Closing accumulated losses as at 31 December 2017– IAS 39/IAS 18 (962,556)
Reclassification of financial asset (i) (2,237)
Increase in provision for impairment on trade and other receivables (ii) (14,157)
Opening accumulated losses as at 1 January 2018– IFRS 9 (before restatement for IFRS 15) (978,950)
(i) Classification and measurement
On 1 January 2018 (the date of initial application of IFRS 9), the Group’s management
has assessed which business models apply to the financial assets held by the Group and
has classified its financial instruments into the appropriate IFRS 9 categories. The main
effects resulting from this reclassification are as follows:
Measurement Category under IAS 39
Measurement Category
under IFRS 9
Financial assets
Trade receivables Amortised cost Amortised cost
Other receivables and deposits Amortised cost Amortised cost
Pledged bank deposits Amortised cost Amortised cost
Cash and cash equivalents Amortised cost Amortised cost
Available-for-sale financial asset
(“AFS”)/Financial assets at
fair value through profit or loss
(“FVTPL”)
Fair value through
other comprehensive
income
Fair value through
profit or loss
Financial liabilitiesTrade payables Amortised cost Amortised cost
Other payables and accruals Amortised cost Amortised cost
Bank and other borrowings Amortised cost Amortised cost
– 24 –
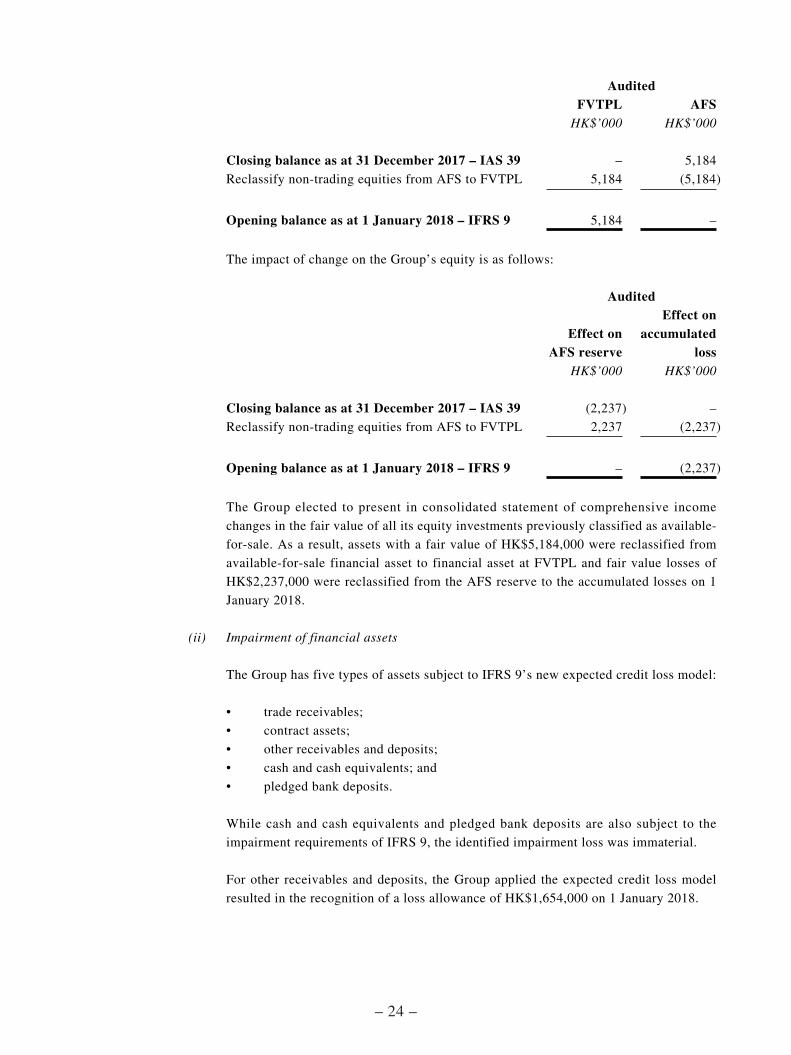
AuditedFVTPL AFS
HK$’000 HK$’000
Closing balance as at 31 December 2017 – IAS 39 – 5,184
Reclassify non-trading equities from AFS to FVTPL 5,184 (5,184)
Opening balance as at 1 January 2018 – IFRS 9 5,184 –
The impact of change on the Group’s equity is as follows:
Audited
Effect on AFS reserve
Effect on accumulated
lossHK$’000 HK$’000
Closing balance as at 31 December 2017 – IAS 39 (2,237) –
Reclassify non-trading equities from AFS to FVTPL 2,237 (2,237)
Opening balance as at 1 January 2018 – IFRS 9 – (2,237)
The Group elected to present in consolidated statement of comprehensive income
changes in the fair value of all its equity investments previously classified as available-
for-sale. As a result, assets with a fair value of HK$5,184,000 were reclassified from
available-for-sale financial asset to financial asset at FVTPL and fair value losses of
HK$2,237,000 were reclassified from the AFS reserve to the accumulated losses on 1
January 2018.
(ii) Impairment of financial assets
The Group has five types of assets subject to IFRS 9’s new expected credit loss model:
• trade receivables;
• contract assets;
• other receivables and deposits;
• cash and cash equivalents; and
• pledged bank deposits.
While cash and cash equivalents and pledged bank deposits are also subject to the
impairment requirements of IFRS 9, the identified impairment loss was immaterial.
For other receivables and deposits, the Group applied the expected credit loss model
resulted in the recognition of a loss allowance of HK$1,654,000 on 1 January 2018.
– 25 –
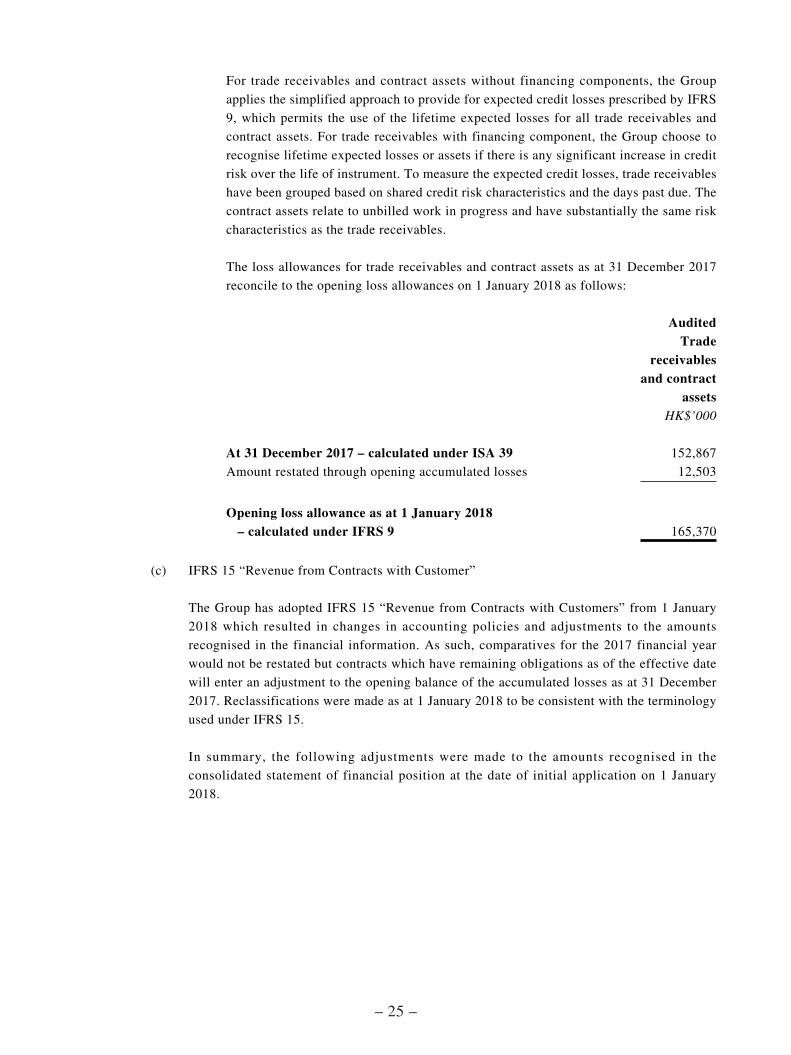
For trade receivables and contract assets without financing components, the Group
applies the simplified approach to provide for expected credit losses prescribed by IFRS
9, which permits the use of the lifetime expected losses for all trade receivables and
contract assets. For trade receivables with financing component, the Group choose to
recognise lifetime expected losses or assets if there is any significant increase in credit
risk over the life of instrument. To measure the expected credit losses, trade receivables
have been grouped based on shared credit risk characteristics and the days past due. The
contract assets relate to unbilled work in progress and have substantially the same risk
characteristics as the trade receivables.
The loss allowances for trade receivables and contract assets as at 31 December 2017
reconcile to the opening loss allowances on 1 January 2018 as follows:
AuditedTrade
receivables and contract
assetsHK$’000
At 31 December 2017 – calculated under ISA 39 152,867
Amount restated through opening accumulated losses 12,503
Opening loss allowance as at 1 January 2018 – calculated under IFRS 9 165,370
(c) IFRS 15 “Revenue from Contracts with Customer”
The Group has adopted IFRS 15 “Revenue from Contracts with Customers” from 1 January
2018 which resulted in changes in accounting policies and adjustments to the amounts
recognised in the financial information. As such, comparatives for the 2017 financial year
would not be restated but contracts which have remaining obligations as of the effective date
will enter an adjustment to the opening balance of the accumulated losses as at 31 December
2017. Reclassifications were made as at 1 January 2018 to be consistent with the terminology
used under IFRS 15.
In summary, the following adjustments were made to the amounts recognised in the
consolidated statement of financial position at the date of initial application on 1 January
2018.
– 26 –
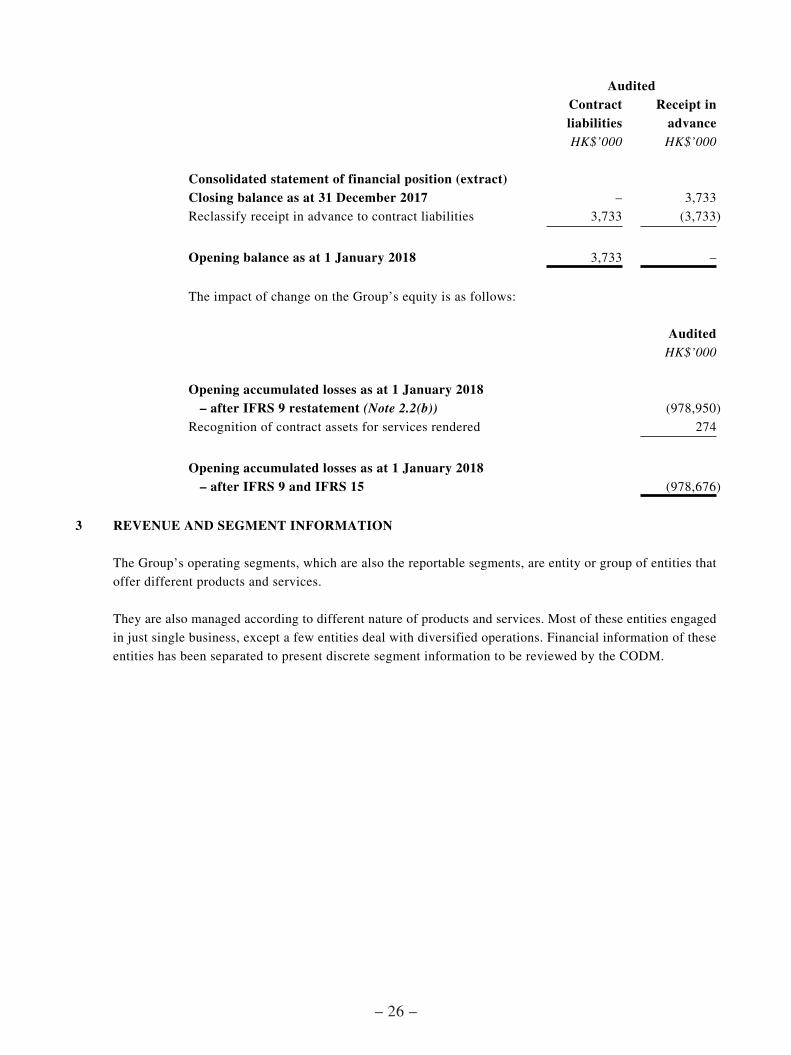
AuditedContract liabilities
Receipt in advance
HK$’000 HK$’000
Consolidated statement of financial position (extract)Closing balance as at 31 December 2017 – 3,733
Reclassify receipt in advance to contract liabilities 3,733 (3,733)
Opening balance as at 1 January 2018 3,733 –
The impact of change on the Group’s equity is as follows:
AuditedHK$’000
Opening accumulated losses as at 1 January 2018 – after IFRS 9 restatement (Note 2.2(b)) (978,950)
Recognition of contract assets for services rendered 274
Opening accumulated losses as at 1 January 2018 – after IFRS 9 and IFRS 15 (978,676)
3 REVENUE AND SEGMENT INFORMATION
The Group’s operating segments, which are also the reportable segments, are entity or group of entities that
offer different products and services.
They are also managed according to different nature of products and services. Most of these entities engaged
in just single business, except a few entities deal with diversified operations. Financial information of these
entities has been separated to present discrete segment information to be reviewed by the CODM.
– 27 –
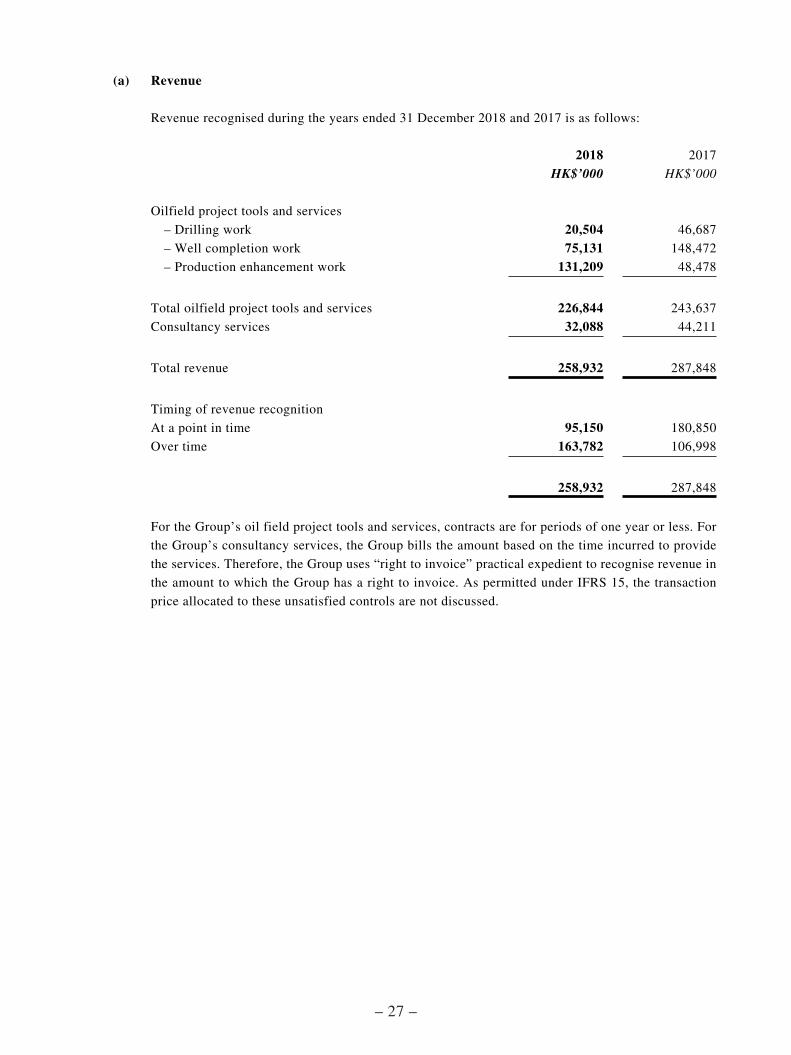
(a) Revenue
Revenue recognised during the years ended 31 December 2018 and 2017 is as follows:
2018 2017
HK$’000 HK$’000
Oilfield project tools and services
– Drilling work 20,504 46,687
– Well completion work 75,131 148,472
– Production enhancement work 131,209 48,478
Total oilfield project tools and services 226,844 243,637
Consultancy services 32,088 44,211
Total revenue 258,932 287,848
Timing of revenue recognition
At a point in time 95,150 180,850
Over time 163,782 106,998
258,932 287,848
For the Group’s oil field project tools and services, contracts are for periods of one year or less. For
the Group’s consultancy services, the Group bills the amount based on the time incurred to provide
the services. Therefore, the Group uses “right to invoice” practical expedient to recognise revenue in
the amount to which the Group has a right to invoice. As permitted under IFRS 15, the transaction
price allocated to these unsatisfied controls are not discussed.
– 28 –
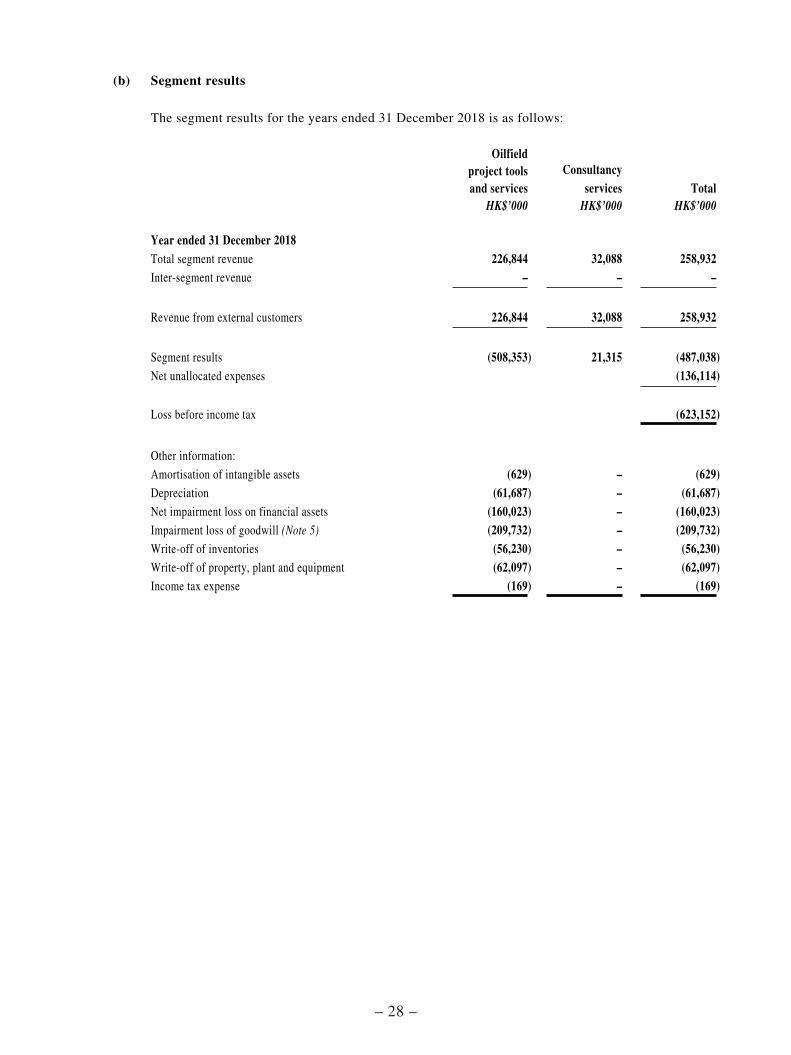
(b) Segment results
The segment results for the years ended 31 December 2018 is as follows:
Oilfield project tools and services
Consultancy services Total
HK$’000 HK$’000 HK$’000
Year ended 31 December 2018Total segment revenue 226,844 32,088 258,932Inter-segment revenue – – –
Revenue from external customers 226,844 32,088 258,932
Segment results (508,353) 21,315 (487,038)Net unallocated expenses (136,114)
Loss before income tax (623,152)
Other information:
Amortisation of intangible assets (629) – (629)Depreciation (61,687) – (61,687)Net impairment loss on financial assets (160,023) – (160,023)Impairment loss of goodwill (Note 5) (209,732) – (209,732)Write-off of inventories (56,230) – (56,230)Write-off of property, plant and equipment (62,097) – (62,097)Income tax expense (169) – (169)

– 29 –
The segment results for the years ended 31 December 2017 is as follows:
Oilfield project tools and services
Consultancy services Total
HK$’000 HK$’000 HK$’000
Year ended 31 December 2017Total segment revenue 243,637 44,211 287,848
Inter-segment revenue – – –
Revenue from external customers 243,637 44,211 287,848
Segment results (69,343) 26,665 (42,678)
Net unallocated expenses (140,165)
Loss before income tax (182,843)
Other information:
Amortisation of intangible assets (1,369) – (1,369)
Depreciation (69,621) – (69,621)
Provision for impairment of trade receivables, net (Note 7) (3,072) – (3,072)
Provision for inventories losses (21,126) – (21,126)
Income tax expense (249) – (249)
The measurement of profit and loss and assets of the operating segments are the same as those
described in the summary of significant accounting policies. The CODM evaluates the performance
of the reportable segments based on a measure of revenue and revenue less all directly attributable
costs.
– 30 –
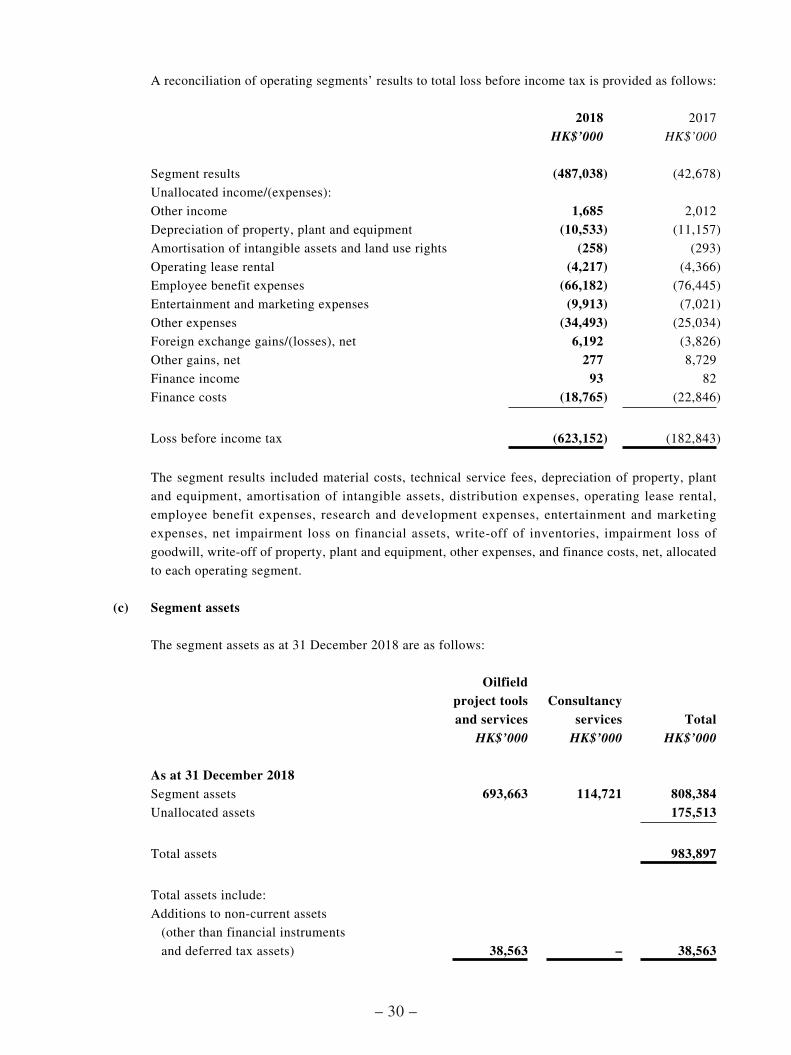
A reconciliation of operating segments’ results to total loss before income tax is provided as follows:
2018 2017
HK$’000 HK$’000
Segment results (487,038) (42,678)
Unallocated income/(expenses):
Other income 1,685 2,012
Depreciation of property, plant and equipment (10,533) (11,157)
Amortisation of intangible assets and land use rights (258) (293)
Operating lease rental (4,217) (4,366)
Employee benefit expenses (66,182) (76,445)
Entertainment and marketing expenses (9,913) (7,021)
Other expenses (34,493) (25,034)
Foreign exchange gains/(losses), net 6,192 (3,826)
Other gains, net 277 8,729
Finance income 93 82
Finance costs (18,765) (22,846)
Loss before income tax (623,152) (182,843)
The segment results included material costs, technical service fees, depreciation of property, plant
and equipment, amortisation of intangible assets, distribution expenses, operating lease rental,
employee benefit expenses, research and development expenses, entertainment and marketing
expenses, net impairment loss on financial assets, write-off of inventories, impairment loss of
goodwill, write-off of property, plant and equipment, other expenses, and finance costs, net, allocated
to each operating segment.
(c) Segment assets
The segment assets as at 31 December 2018 are as follows:
Oilfield project tools and services
Consultancy services Total
HK$’000 HK$’000 HK$’000
As at 31 December 2018Segment assets 693,663 114,721 808,384Unallocated assets 175,513
Total assets 983,897
Total assets include:
Additions to non-current assets
(other than financial instruments
and deferred tax assets) 38,563 – 38,563
– 31 –
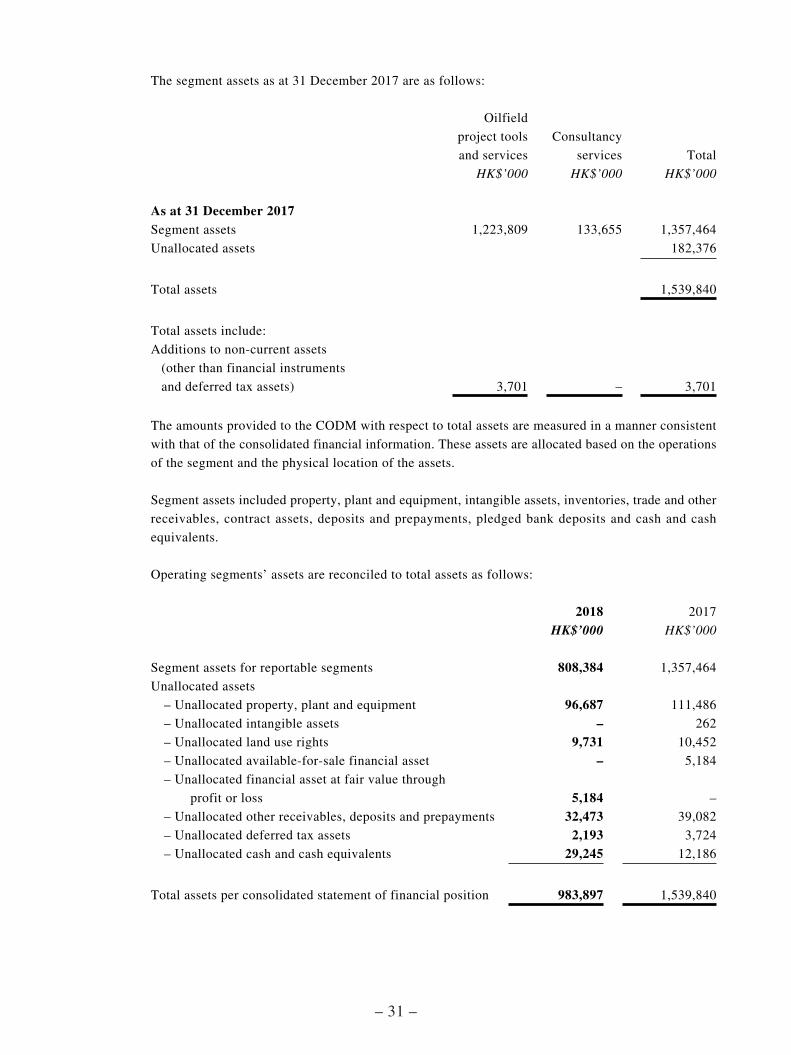
The segment assets as at 31 December 2017 are as follows:
Oilfield
project tools
and services
Consultancy
services Total
HK$’000 HK$’000 HK$’000
As at 31 December 2017Segment assets 1,223,809 133,655 1,357,464
Unallocated assets 182,376
Total assets 1,539,840
Total assets include:
Additions to non-current assets
(other than financial instruments
and deferred tax assets) 3,701 – 3,701
The amounts provided to the CODM with respect to total assets are measured in a manner consistent
with that of the consolidated financial information. These assets are allocated based on the operations
of the segment and the physical location of the assets.
Segment assets included property, plant and equipment, intangible assets, inventories, trade and other
receivables, contract assets, deposits and prepayments, pledged bank deposits and cash and cash
equivalents.
Operating segments’ assets are reconciled to total assets as follows:
2018 2017
HK$’000 HK$’000
Segment assets for reportable segments 808,384 1,357,464
Unallocated assets
– Unallocated property, plant and equipment 96,687 111,486
– Unallocated intangible assets – 262
– Unallocated land use rights 9,731 10,452
– Unallocated available-for-sale financial asset – 5,184
– Unallocated financial asset at fair value through
profit or loss 5,184 –
– Unallocated other receivables, deposits and prepayments 32,473 39,082
– Unallocated deferred tax assets 2,193 3,724
– Unallocated cash and cash equivalents 29,245 12,186
Total assets per consolidated statement of financial position 983,897 1,539,840

– 32 –
(d) Geographical information
The following table shows revenue generated from segment of oilfield project tools and services by
geographical area according to location of the customers and revenue generated from segment of
consultancy services by geographical area according to location of the customers’ oilfields:
2018 2017
HK$’000 HK$’000
The PRC 182,501 153,303
The Middle East 46,788 117,242
Others 29,643 17,303
258,932 287,848
The following table shows the non-current assets other than financial instruments and deferred tax
assets by geographical segment according to the location where the assets are located:
2018 2017
HK$’000 HK$’000
The PRC 417,062 692,659
The Middle East 60,835 109,345
Singapore 50,497 55,525
Others – 58
528,394 857,587
(e) Information about major customers
Revenues from customers contributing 10% or more of the total revenue of the Group are as follows:
2018 2017
HK$’000 HK$’000
Customer A 87,010 28,568
Customer B 33,520 74,801
Customer C 33,019 *
Customer D * 73,991
* represents the amount of revenue from such customer which is less than 10% of the total
revenue of that year.
All the customers contributing 10% or more of the total revenue of the Group are from the oilfield
project tools and services segment.
– 33 –
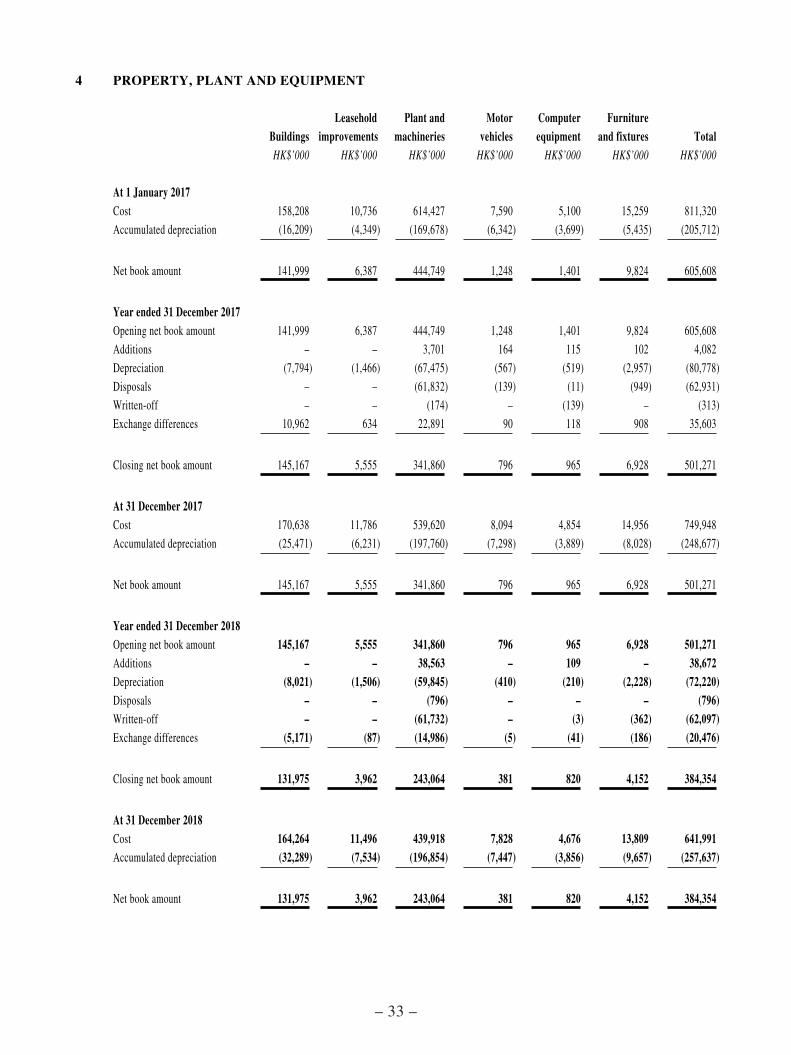
4 PROPERTY, PLANT AND EQUIPMENT
BuildingsLeasehold
improvementsPlant and
machineriesMotor
vehiclesComputer equipment
Furniture and fixtures Total
HK$’000 HK$’000 HK$’000 HK$’000 HK$’000 HK$’000 HK$’000
At 1 January 2017Cost 158,208 10,736 614,427 7,590 5,100 15,259 811,320
Accumulated depreciation (16,209) (4,349) (169,678) (6,342) (3,699) (5,435) (205,712)
Net book amount 141,999 6,387 444,749 1,248 1,401 9,824 605,608
Year ended 31 December 2017Opening net book amount 141,999 6,387 444,749 1,248 1,401 9,824 605,608
Additions – – 3,701 164 115 102 4,082
Depreciation (7,794) (1,466) (67,475) (567) (519) (2,957) (80,778)
Disposals – – (61,832) (139) (11) (949) (62,931)
Written-off – – (174) – (139) – (313)
Exchange differences 10,962 634 22,891 90 118 908 35,603
Closing net book amount 145,167 5,555 341,860 796 965 6,928 501,271
At 31 December 2017Cost 170,638 11,786 539,620 8,094 4,854 14,956 749,948
Accumulated depreciation (25,471) (6,231) (197,760) (7,298) (3,889) (8,028) (248,677)
Net book amount 145,167 5,555 341,860 796 965 6,928 501,271
Year ended 31 December 2018Opening net book amount 145,167 5,555 341,860 796 965 6,928 501,271Additions – – 38,563 – 109 – 38,672Depreciation (8,021) (1,506) (59,845) (410) (210) (2,228) (72,220)Disposals – – (796) – – – (796)Written-off – – (61,732) – (3) (362) (62,097)Exchange differences (5,171) (87) (14,986) (5) (41) (186) (20,476)
Closing net book amount 131,975 3,962 243,064 381 820 4,152 384,354
At 31 December 2018Cost 164,264 11,496 439,918 7,828 4,676 13,809 641,991Accumulated depreciation (32,289) (7,534) (196,854) (7,447) (3,856) (9,657) (257,637)
Net book amount 131,975 3,962 243,064 381 820 4,152 384,354
– 34 –
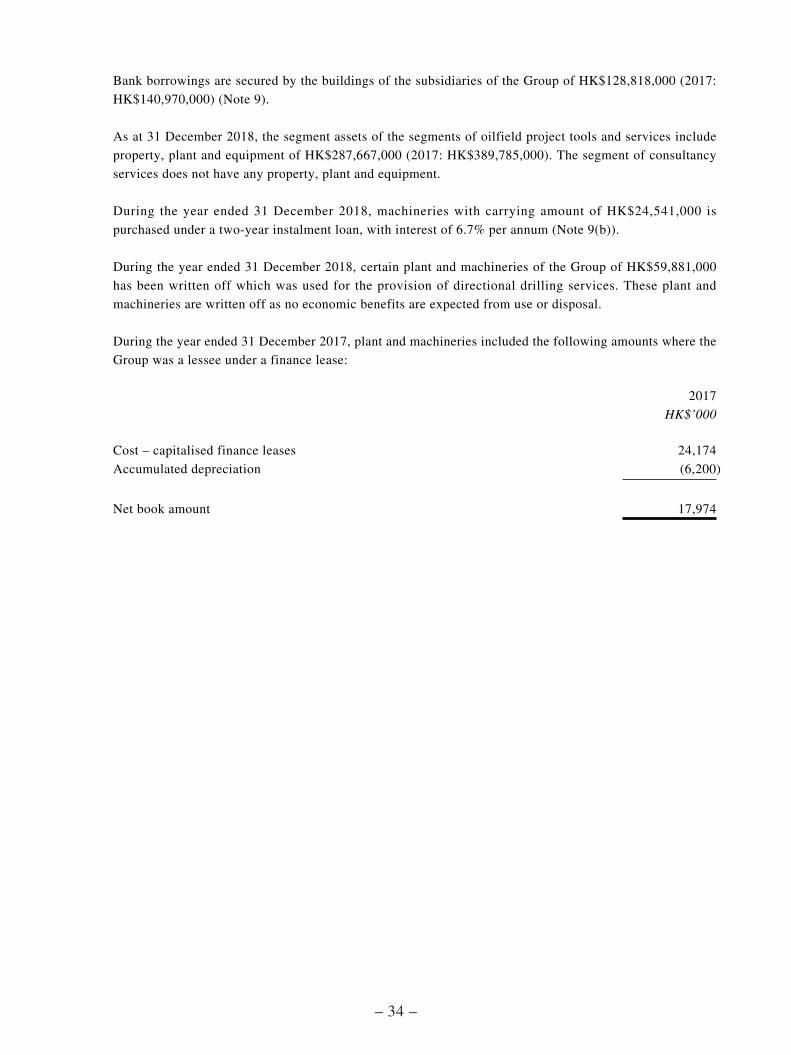
Bank borrowings are secured by the buildings of the subsidiaries of the Group of HK$128,818,000 (2017:
HK$140,970,000) (Note 9).
As at 31 December 2018, the segment assets of the segments of oilfield project tools and services include
property, plant and equipment of HK$287,667,000 (2017: HK$389,785,000). The segment of consultancy
services does not have any property, plant and equipment.
During the year ended 31 December 2018, machineries with carrying amount of HK$24,541,000 is
purchased under a two-year instalment loan, with interest of 6.7% per annum (Note 9(b)).
During the year ended 31 December 2018, certain plant and machineries of the Group of HK$59,881,000
has been written off which was used for the provision of directional drilling services. These plant and
machineries are written off as no economic benefits are expected from use or disposal.
During the year ended 31 December 2017, plant and machineries included the following amounts where the
Group was a lessee under a finance lease:
2017
HK$’000
Cost – capitalised finance leases 24,174
Accumulated depreciation (6,200)
Net book amount 17,974

– 35 –
5 INTANGIBLE ASSETS
GoodwillComputer
software TotalHK$’000 HK$’000 HK$’000
At 1 January 2017Cost 520,687 8,210 528,897
Accumulated amortisation and impairment (218,341) (6,121) (224,462)
Net book amount 302,346 2,089 304,435
Year ended 31 December 2017Opening net book amount 302,346 2,089 304,435
Amortisation – (1,438) (1,438)
Exchange differences 3,595 42 3,637
Closing net book amount 305,941 693 306,634
At 31 December 2017Cost 520,687 8,343 529,030
Accumulated amortisation and impairment (214,746) (7,650) (222,396)
Net book amount 305,941 693 306,634
At 1 January 2018Cost 520,687 8,343 529,030
Accumulated amortisation and impairment (214,746) (7,650) (222,396)
Net book amount 305,941 693 306,634
Year ended 31 December 2018Opening net book amount 305,941 693 306,634Amortisation – (658) (658)Impairment (209,732) – (209,732)Exchange differences (753) (6) (759)
Closing net book amount 95,456 29 95,485
At 31 December 2018Cost 519,934 8,261 528,195Accumulated amortisation and impairment (424,478) (8,232) (432,710)
Net book amount 95,456 29 95,485
– 36 –
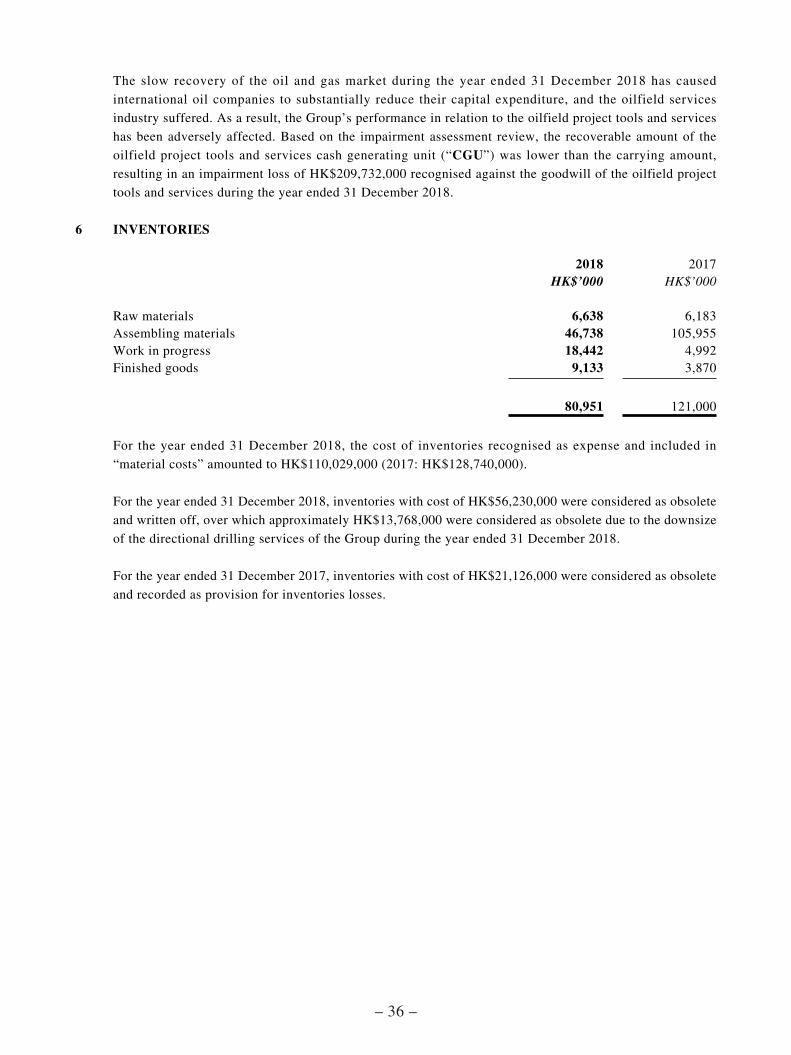
The slow recovery of the oil and gas market during the year ended 31 December 2018 has caused
international oil companies to substantially reduce their capital expenditure, and the oilfield services
industry suffered. As a result, the Group’s performance in relation to the oilfield project tools and services
has been adversely affected. Based on the impairment assessment review, the recoverable amount of the
oilfield project tools and services cash generating unit (“CGU”) was lower than the carrying amount,
resulting in an impairment loss of HK$209,732,000 recognised against the goodwill of the oilfield project
tools and services during the year ended 31 December 2018.
6 INVENTORIES
2018 2017HK$’000 HK$’000
Raw materials 6,638 6,183Assembling materials 46,738 105,955Work in progress 18,442 4,992Finished goods 9,133 3,870
80,951 121,000
For the year ended 31 December 2018, the cost of inventories recognised as expense and included in
“material costs” amounted to HK$110,029,000 (2017: HK$128,740,000).
For the year ended 31 December 2018, inventories with cost of HK$56,230,000 were considered as obsolete
and written off, over which approximately HK$13,768,000 were considered as obsolete due to the downsize
of the directional drilling services of the Group during the year ended 31 December 2018.
For the year ended 31 December 2017, inventories with cost of HK$21,126,000 were considered as obsolete
and recorded as provision for inventories losses.
– 37 –
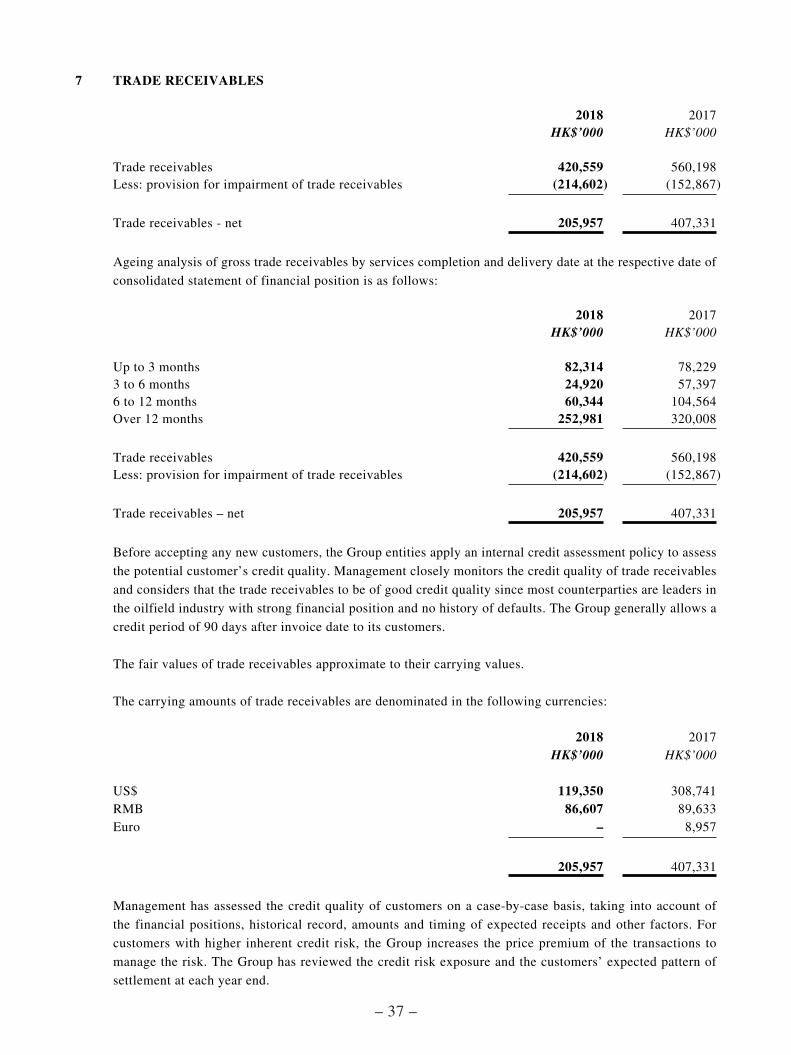
7 TRADE RECEIVABLES
2018 2017HK$’000 HK$’000
Trade receivables 420,559 560,198Less: provision for impairment of trade receivables (214,602) (152,867)
Trade receivables - net 205,957 407,331
Ageing analysis of gross trade receivables by services completion and delivery date at the respective date of
consolidated statement of financial position is as follows:
2018 2017HK$’000 HK$’000
Up to 3 months 82,314 78,2293 to 6 months 24,920 57,3976 to 12 months 60,344 104,564Over 12 months 252,981 320,008
Trade receivables 420,559 560,198Less: provision for impairment of trade receivables (214,602) (152,867)
Trade receivables – net 205,957 407,331
Before accepting any new customers, the Group entities apply an internal credit assessment policy to assess
the potential customer’s credit quality. Management closely monitors the credit quality of trade receivables
and considers that the trade receivables to be of good credit quality since most counterparties are leaders in
the oilfield industry with strong financial position and no history of defaults. The Group generally allows a
credit period of 90 days after invoice date to its customers.
The fair values of trade receivables approximate to their carrying values.
The carrying amounts of trade receivables are denominated in the following currencies:
2018 2017HK$’000 HK$’000
US$ 119,350 308,741RMB 86,607 89,633Euro – 8,957
205,957 407,331
Management has assessed the credit quality of customers on a case-by-case basis, taking into account of
the financial positions, historical record, amounts and timing of expected receipts and other factors. For
customers with higher inherent credit risk, the Group increases the price premium of the transactions to
manage the risk. The Group has reviewed the credit risk exposure and the customers’ expected pattern of
settlement at each year end.
– 38 –
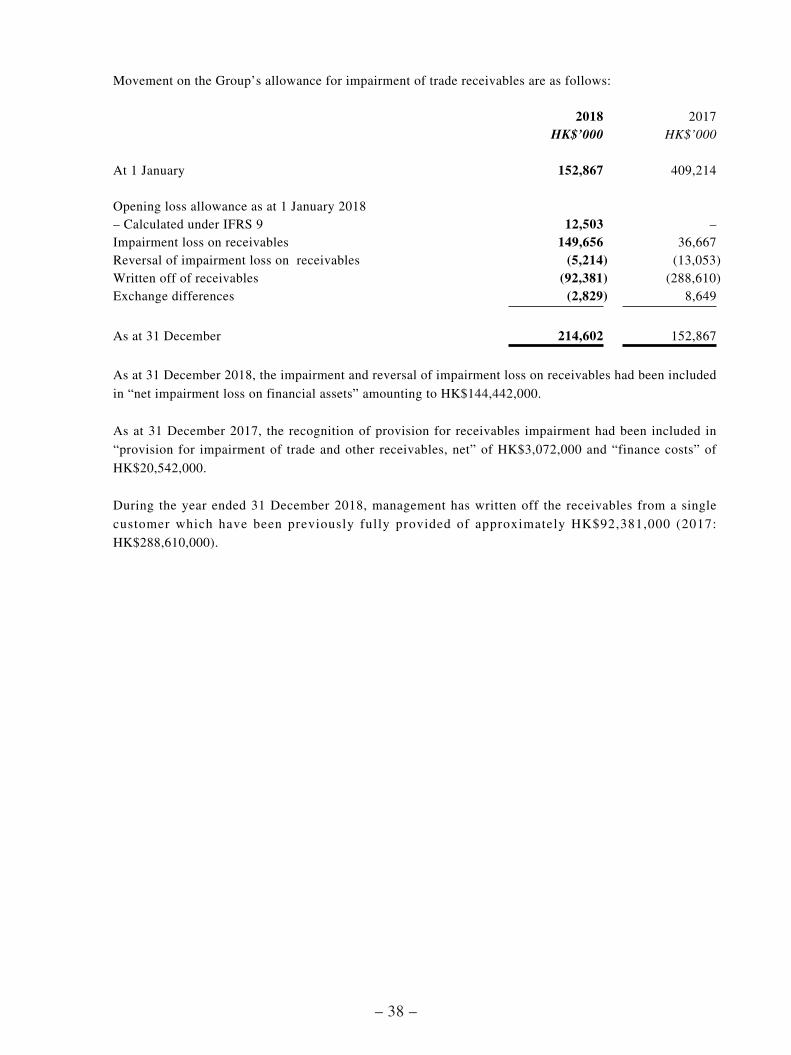
Movement on the Group’s allowance for impairment of trade receivables are as follows:
2018 2017HK$’000 HK$’000
At 1 January 152,867 409,214
Opening loss allowance as at 1 January 2018– Calculated under IFRS 9 12,503 –Impairment loss on receivables 149,656 36,667Reversal of impairment loss on receivables (5,214) (13,053)Written off of receivables (92,381) (288,610)Exchange differences (2,829) 8,649
As at 31 December 214,602 152,867
As at 31 December 2018, the impairment and reversal of impairment loss on receivables had been included
in “net impairment loss on financial assets” amounting to HK$144,442,000.
As at 31 December 2017, the recognition of provision for receivables impairment had been included in
“provision for impairment of trade and other receivables, net” of HK$3,072,000 and “finance costs” of
HK$20,542,000.
During the year ended 31 December 2018, management has written off the receivables from a single
customer which have been previously fully provided of approximately HK$92,381,000 (2017:
HK$288,610,000).
– 39 –
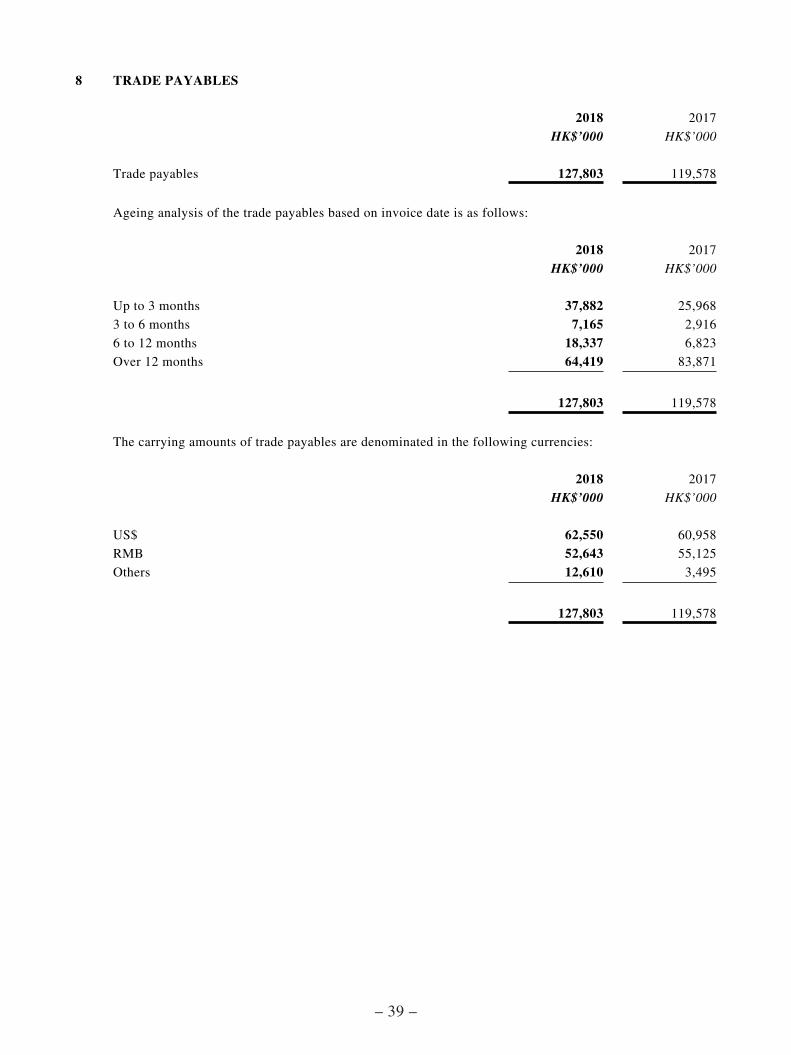
8 TRADE PAYABLES
2018 2017
HK$’000 HK$’000
Trade payables 127,803 119,578
Ageing analysis of the trade payables based on invoice date is as follows:
2018 2017
HK$’000 HK$’000
Up to 3 months 37,882 25,968
3 to 6 months 7,165 2,916
6 to 12 months 18,337 6,823
Over 12 months 64,419 83,871
127,803 119,578
The carrying amounts of trade payables are denominated in the following currencies:
2018 2017
HK$’000 HK$’000
US$ 62,550 60,958
RMB 52,643 55,125
Others 12,610 3,495
127,803 119,578
– 40 –
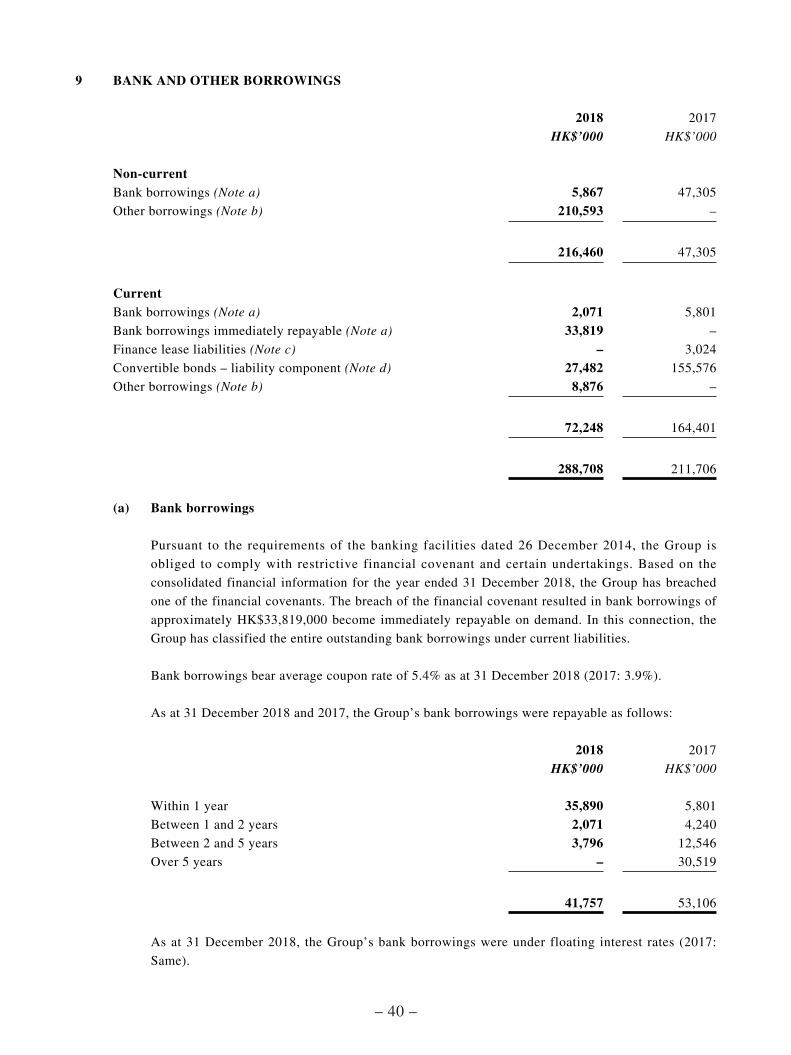
9 BANK AND OTHER BORROWINGS
2018 2017
HK$’000 HK$’000
Non-currentBank borrowings (Note a) 5,867 47,305
Other borrowings (Note b) 210,593 –
216,460 47,305
CurrentBank borrowings (Note a) 2,071 5,801
Bank borrowings immediately repayable (Note a) 33,819 –
Finance lease liabilities (Note c) – 3,024
Convertible bonds – liability component (Note d) 27,482 155,576
Other borrowings (Note b) 8,876 –
72,248 164,401
288,708 211,706
(a) Bank borrowings
Pursuant to the requirements of the banking facilities dated 26 December 2014, the Group is
obliged to comply with restrictive financial covenant and certain undertakings. Based on the
consolidated financial information for the year ended 31 December 2018, the Group has breached
one of the financial covenants. The breach of the financial covenant resulted in bank borrowings of
approximately HK$33,819,000 become immediately repayable on demand. In this connection, the
Group has classified the entire outstanding bank borrowings under current liabilities.
Bank borrowings bear average coupon rate of 5.4% as at 31 December 2018 (2017: 3.9%).
As at 31 December 2018 and 2017, the Group’s bank borrowings were repayable as follows:
2018 2017
HK$’000 HK$’000
Within 1 year 35,890 5,801
Between 1 and 2 years 2,071 4,240
Between 2 and 5 years 3,796 12,546
Over 5 years – 30,519
41,757 53,106
As at 31 December 2018, the Group’s bank borrowings were under floating interest rates (2017:
Same).

– 41 –
The exposure of the Group’s bank borrowings to interest rate changes and the contractual repricing
dates at the end of the reporting period are as follows:
2018 2017
HK$’000 HK$’000
6 months or less – 1,620
Over 6 months 41,757 51,486
41,757 53,106
The carrying amounts of bank borrowings approximate to their fair values.
The carrying amounts of the Group’s bank borrowings are denominated in the following currencies:
2018 2017
HK$’000 HK$’000
US$ – 1,620
RMB 7,938 10,512
SGD 33,819 40,974
41,757 53,106
The Group’s bank borrowings were all secured (2017: Same).
As at 31 December 2018 and 2017, banking facilities of approximately HK$42,000,000 (2017:
HK$53,000,000) were granted by banks to the subsidiaries of the Group, all of which have been
utilised during the year. The facilities are secured by:
(a) corporate guarantee given by the Company and its subsidiary;
(b) personal guarantee by directors of subsidiary of the Group; and
(c) buildings of the Group (Note 4).
(b) Other borrowings
As at 31 December 2018, other borrowings of the Group include:
(i) bondholders loans agreed with certain bondholders of HK$51,000,000 with a maturity date of
28 September 2020 that bear interest at 10% per annum.
(ii) a two-year borrowing with a principal amount of HK$140,000,000, bearing interest at 5.5%
per annum. HK$30,000,000 of the principal will mature in April 2020 and the remaining will
mature in July 2020.
– 42 –
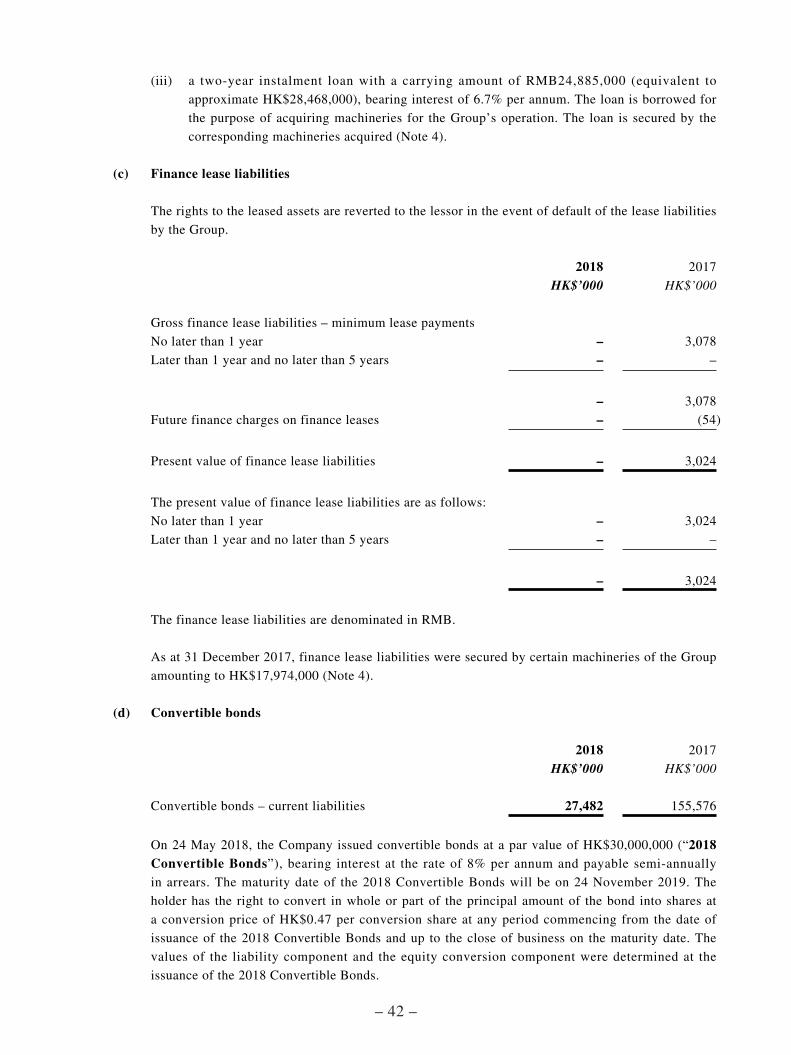
(iii) a two-year instalment loan with a carrying amount of RMB24,885,000 (equivalent to
approximate HK$28,468,000), bearing interest of 6.7% per annum. The loan is borrowed for
the purpose of acquiring machineries for the Group’s operation. The loan is secured by the
corresponding machineries acquired (Note 4).
(c) Finance lease liabilities
The rights to the leased assets are reverted to the lessor in the event of default of the lease liabilities
by the Group.
2018 2017
HK$’000 HK$’000
Gross finance lease liabilities – minimum lease payments
No later than 1 year – 3,078
Later than 1 year and no later than 5 years – –
– 3,078
Future finance charges on finance leases – (54)
Present value of finance lease liabilities – 3,024
The present value of finance lease liabilities are as follows:
No later than 1 year – 3,024
Later than 1 year and no later than 5 years – –
– 3,024
The finance lease liabilities are denominated in RMB.
As at 31 December 2017, finance lease liabilities were secured by certain machineries of the Group
amounting to HK$17,974,000 (Note 4).
(d) Convertible bonds
2018 2017
HK$’000 HK$’000
Convertible bonds – current liabilities 27,482 155,576
On 24 May 2018, the Company issued convertible bonds at a par value of HK$30,000,000 (“2018 Convertible Bonds”), bearing interest at the rate of 8% per annum and payable semi-annually
in arrears. The maturity date of the 2018 Convertible Bonds will be on 24 November 2019. The
holder has the right to convert in whole or part of the principal amount of the bond into shares at
a conversion price of HK$0.47 per conversion share at any period commencing from the date of
issuance of the 2018 Convertible Bonds and up to the close of business on the maturity date. The
values of the liability component and the equity conversion component were determined at the
issuance of the 2018 Convertible Bonds.

– 43 –
The fair value of the liability component was calculated using a discounted cash flow approach. The
key unobservable input of the valuation is the discount rate adopted of 18.6% which is based on
market interest rates for a number of comparable convertible bonds denominated in US$ and certain
parameters specific to the Group’s liquidity risk. The equity component is recognised initially as the
difference between the net proceeds from the bonds and the fair value of the liability component and
is included in other reserves in equity. Subsequently, the liability component is carried at amortised
cost.
The 2018 Convertible Bonds is calculated as follows:
HK$’000
Proceeds of 2018 Convertible Bonds 30,000
Transaction costs (500)
Net proceeds of convertible bonds issued on 24 May 2018 29,500
Equity component (3,715)
Liability component at initial recognition 25,785
Movements in convertible bonds are analysed as follows:
2018 2017
HK$’000 HK$’000
Opening amount 155,576 145,100
Issuance of 2018 Convertible Bonds 25,785 –
Settlement of 2014 Convertible Bonds (99,570) –
Conversion to bondholder loans (62,000) –
Interest expenses (Note 12) 8,938 18,327
Interest paid (1,247) (7,851)
Closing amount 27,482 155,576
– 44 –
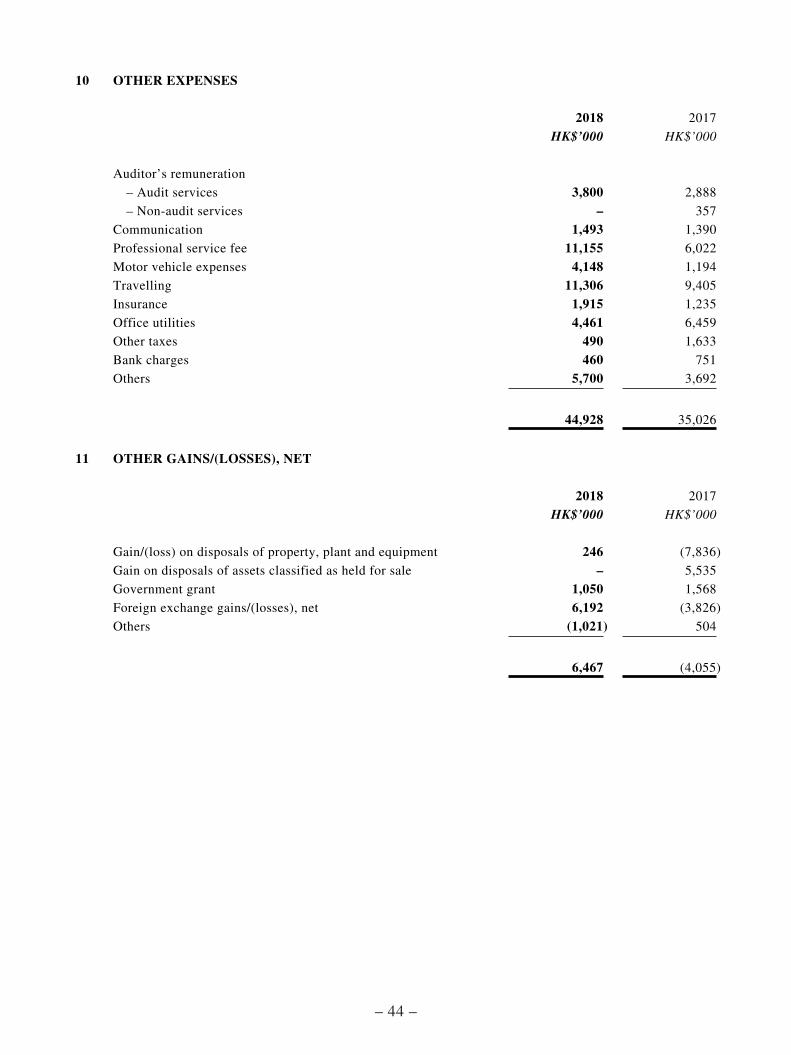
10 OTHER EXPENSES
2018 2017
HK$’000 HK$’000
Auditor’s remuneration
– Audit services 3,800 2,888
– Non-audit services – 357
Communication 1,493 1,390
Professional service fee 11,155 6,022
Motor vehicle expenses 4,148 1,194
Travelling 11,306 9,405
Insurance 1,915 1,235
Office utilities 4,461 6,459
Other taxes 490 1,633
Bank charges 460 751
Others 5,700 3,692
44,928 35,026
11 OTHER GAINS/(LOSSES), NET
2018 2017
HK$’000 HK$’000
Gain/(loss) on disposals of property, plant and equipment 246 (7,836)
Gain on disposals of assets classified as held for sale – 5,535
Government grant 1,050 1,568
Foreign exchange gains/(losses), net 6,192 (3,826)
Others (1,021) 504
6,467 (4,055)
– 45 –
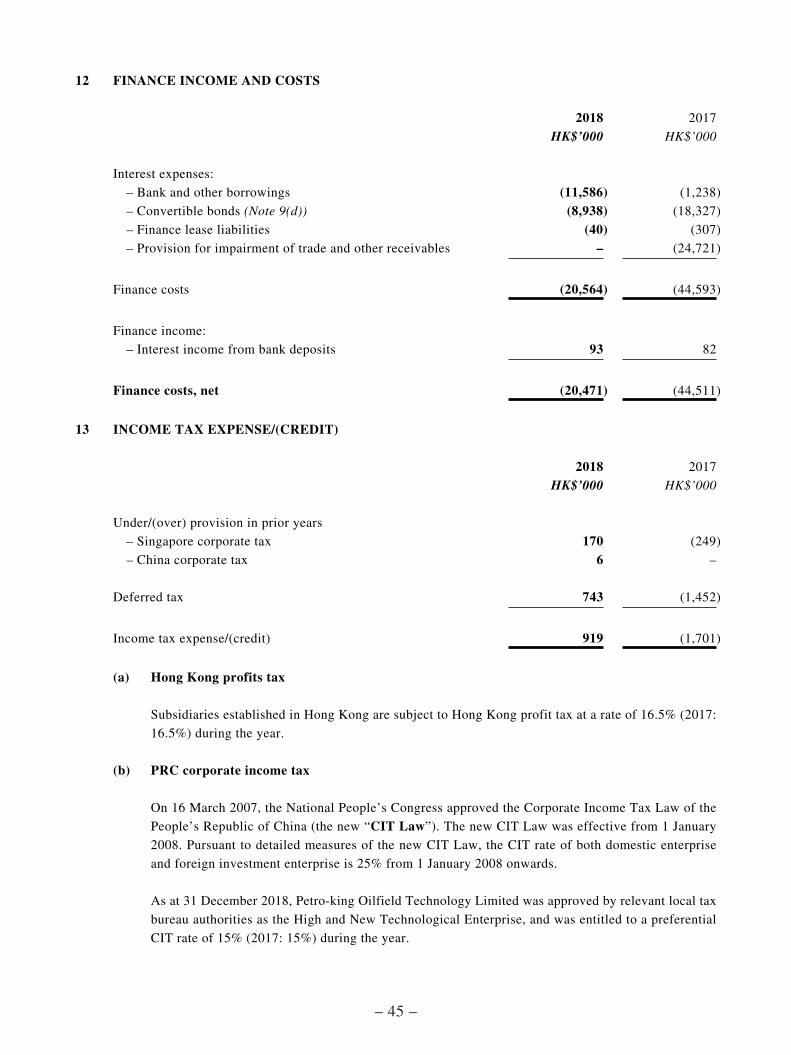
12 FINANCE INCOME AND COSTS
2018 2017
HK$’000 HK$’000
Interest expenses:
– Bank and other borrowings (11,586) (1,238)
– Convertible bonds (Note 9(d)) (8,938) (18,327)
– Finance lease liabilities (40) (307)
– Provision for impairment of trade and other receivables – (24,721)
Finance costs (20,564) (44,593)
Finance income:
– Interest income from bank deposits 93 82
Finance costs, net (20,471) (44,511)
13 INCOME TAX EXPENSE/(CREDIT)
2018 2017
HK$’000 HK$’000
Under/(over) provision in prior years
– Singapore corporate tax 170 (249)
– China corporate tax 6 –
Deferred tax 743 (1,452)
Income tax expense/(credit) 919 (1,701)
(a) Hong Kong profits tax
Subsidiaries established in Hong Kong are subject to Hong Kong profit tax at a rate of 16.5% (2017:
16.5%) during the year.
(b) PRC corporate income tax
On 16 March 2007, the National People’s Congress approved the Corporate Income Tax Law of the
People’s Republic of China (the new “CIT Law”). The new CIT Law was effective from 1 January
2008. Pursuant to detailed measures of the new CIT Law, the CIT rate of both domestic enterprise
and foreign investment enterprise is 25% from 1 January 2008 onwards.
As at 31 December 2018, Petro-king Oilfield Technology Limited was approved by relevant local tax
bureau authorities as the High and New Technological Enterprise, and was entitled to a preferential
CIT rate of 15% (2017: 15%) during the year.

– 46 –
The High and New Technological Enterprise qualification is subjected to be renewed every three
years. Companies are required to meet certain criteria such as qualified research and development
expenses reaching a designated percentage of total revenue, employing certain number of scientific
technology and research and development personnel and having certain percentage of income from
sale of new/high technology products etc..
(c) Singapore corporate tax
Subsidiaries established in Singapore are subject to Singapore corporate tax at a rate of 17% for the
year ended 31 December 2018 (2017: 17%).
The tax on the Group’s loss before tax differs from the theoretical amount that would arise using the
domestic tax rates applicable to profit or loss of the Group entities as follows:
2018 2017
HK$’000 HK$’000
Loss before income tax (623,152) (182,843)
Tax calculated at domestic tax rates applicable to profit/loss
in the respective entities (50,289) (17,408)
– Under/(over) provision for prior years 176 (249)
– Income not subject to tax (641) (628)
– Expenses not deductible for tax purposes 40,830 16,853
– Reversal of withholding tax on undistributed profits of
a subsidiary established in the PRC (788) (5,362)
– Tax losses for which no deferred tax assets was
recognised 11,631 5,093
Income tax expense/(credit) 919 (1,701)
The weighted average applicable tax rate was 8% (2017: 10%). The decrease is primarily due to
changes in the profitability of the group companies in the respective jurisdictions.
14 LOSS PER SHARE
2018 2017
Loss attributable to owners of the Company (HK$’000) (623,070) (180,262)
Weighted average number of ordinary shares in issue
(Number of shares in thousand) 1,726,674 1,726,674
Basic loss per share (HK cents) (36.1) (10.4)
Diluted loss per share (HK cents) (36.1) (10.4)
– 47 –
Basic loss per share is calculated by dividing the loss attributable to owners of the Company by the weighted
average number of ordinary shares issued during the year.
Diluted loss per share is calculated by adjusting the weighted average number of ordinary shares
outstanding to assume conversion of all dilutive potential ordinary shares. Potential ordinary shares are
dilutive when, and only when, their conversion to ordinary shares would increase loss per share.
Diluted loss per share for the year ended 31 December 2018 was the same as basic loss per share since all
potential ordinary shares are anti-dilutive (2017: Same) as both the conversion of potential ordinary shares
in relation to the share options and the conversion of convertible bonds have an anti-dilutive effect to the
basic loss per share.
15 DIVIDEND
The board of directors of the Company does not recommend the payment of final dividend for the year
ended 31 December 2018 (2017: Nil).
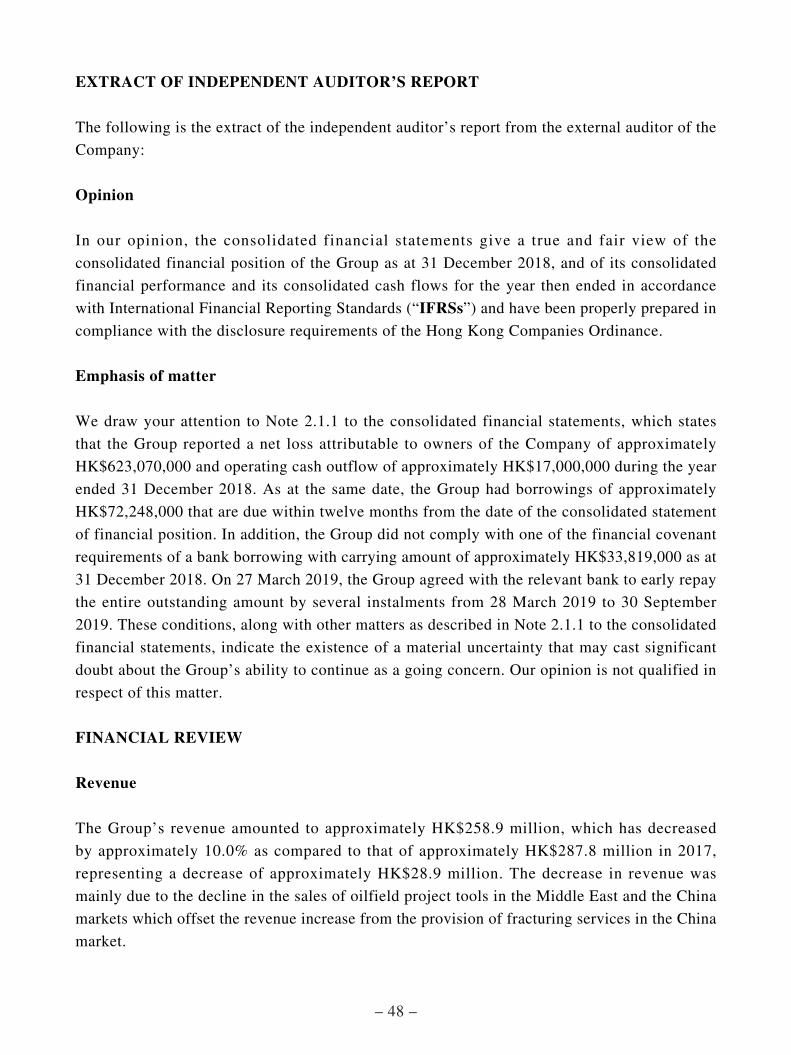
– 48 –
EXTRACT OF INDEPENDENT AUDITOR’S REPORT
The following is the extract of the independent auditor’s report from the external auditor of the
Company:
Opinion
In our opinion, the consolidated financial statements give a true and fair view of the
consolidated financial position of the Group as at 31 December 2018, and of its consolidated
financial performance and its consolidated cash flows for the year then ended in accordance
with International Financial Reporting Standards (“IFRSs”) and have been properly prepared in
compliance with the disclosure requirements of the Hong Kong Companies Ordinance.
Emphasis of matter
We draw your attention to Note 2.1.1 to the consolidated financial statements, which states
that the Group reported a net loss attributable to owners of the Company of approximately
HK$623,070,000 and operating cash outflow of approximately HK$17,000,000 during the year
ended 31 December 2018. As at the same date, the Group had borrowings of approximately
HK$72,248,000 that are due within twelve months from the date of the consolidated statement
of financial position. In addition, the Group did not comply with one of the financial covenant
requirements of a bank borrowing with carrying amount of approximately HK$33,819,000 as at
31 December 2018. On 27 March 2019, the Group agreed with the relevant bank to early repay
the entire outstanding amount by several instalments from 28 March 2019 to 30 September
2019. These conditions, along with other matters as described in Note 2.1.1 to the consolidated
financial statements, indicate the existence of a material uncertainty that may cast significant
doubt about the Group’s ability to continue as a going concern. Our opinion is not qualified in
respect of this matter.
FINANCIAL REVIEW
Revenue
The Group’s revenue amounted to approximately HK$258.9 million, which has decreased
by approximately 10.0% as compared to that of approximately HK$287.8 million in 2017,
representing a decrease of approximately HK$28.9 million. The decrease in revenue was
mainly due to the decline in the sales of oilfield project tools in the Middle East and the China
markets which offset the revenue increase from the provision of fracturing services in the China
market.

– 49 –
Material Costs
During the year, the Group’s material costs were approximately HK$110.0 million, which has
decreased by approximately HK$18.7 million or approximately 14.5% as compared to that of
approximately HK$128.7 million in 2017. Material Costs representing approximately 42.5% of
the revenue in 2018, which was lower than that of 44.7% in 2017. As the Group generated more
revenue from the provision of fracturing services in 2018 which utilise fewer materials than
other projects, overall material costs as a percentage of revenue decreased in 2018.
Depreciation of Property, Plant and Equipment
During the year, the depreciation of property, plant and equipment amounted to approximately
HK$72.2 million, which has decreased by approximately HK$8.6 million or approximately
10.6% as compared to that of approximately HK$80.8 million in 2017, primarily resulted from
the write-off of certain service equipment in 2018.
Employee Benefit Expenses
During the year, the Group’s employee benefit expenses were approximately HK$101.4
million, which has dropped by approximately HK$3.7 million or approximately 3.5% as
compared to that of approximately HK$105.1 million in 2017. The decrease in employee
benefit expenses mainly resulted from the optimisation of staff structure and the strengthening
of cost control in the harsh market environment.
Distribution Expenses
During the year, the Group’s distribution expenses amounted to approximately HK$4.1
million, which has decreased by approximately HK$1.0 million or approximately 19.6% from
approximately HK$5.1 million in 2017. The decrease in distribution expenses was mainly due
to the decline in the sales of oilfield project tools in 2018.
Technical Service Fees
During the year, the Group’s technical service fees amounted to approximately HK$18.1
million, which has increased by approximately HK$4.9 million or approximately 37.1% from
approximately HK$13.2 million in 2017. The increase in technical service fees was mainly due
to the procurement of high-quality technical support service to improve service quality in the
China market.

– 50 –
Net Impairment Loss on Financial Assets/Provision for Impairment of Trade and Other Receivables, Net
During the year, net impairment loss on financial assets amounted to approximately HK$160.0
million, which has increased by approximately HK$156.9 million from approximately HK$3.1
million in 2017. Net impairment loss on financial assets in 2018 was mainly relating to certain
customers in the Middle East and the China market.
Write-off of Inventories
During the year, the write-off of inventories amounted to approximately HK$56.2 million,
(2017: Nil). Such increase in write-off of inventories was resulted from the increased quantity
of obsolete inventories during 2018.
Provision for impairment of Goodwill
During the year, the Group’s provision for impairment of goodwill amounted to approximately
HK$209.7 million (2017: Nil), mainly because the Group’s performance in relation to the
oilfield project tools and services has been adversely affected by the long term low oil price and
the economics and industry downturn.
Write-off of property, plant and equipment
During the year, write-off of property, plant and equipment amounted to approximately
HK$62.1 million (2017: HK$313,000). The write-off of property, plant and equipment was due
to the damage of certain drilling service equipment during 2018.
Other Expenses
During the year, the Group’s other expenses were approximately HK$44.9 million, which
has increased by approximately HK$9.9 million or approximately 28.3% from approximately
HK$35.0 million in 2017, mainly attributable to the increase in professional service fee and
motor vehicle expenses in relation to the provision of fracturing services in the China market.
Operating Loss
As a result of the foregoing, the Group’s operating loss in 2018 amounted to approximately
HK$602.7 million, which has increased by approximately HK$464.4 million as compared to
that of approximately HK$138.3 million in 2017.
– 51 –
Net Financing Costs
During the year, the Group’s net financing costs amounted to approximately HK$20.5
million, which has decreased by approximately HK$24.0 million or approximately 53.9% as
compared to that of approximately HK$44.5 million in 2017. Such decrease in 2018 was mainly
attributable to the decrease in finance costs relating to the discounting of certain trade and other
receivables of approximately HK$24.7 million in 2017.
Loss for the Year
As a result of the foregoing, the Group’s loss for the year amounted to approximately HK$624.1
million, which has increased by approximately HK$443.0 million or approximately 244.6% as
compared to that of approximately HK$181.1 million in 2017.
Loss Attributable to Owners of the Company
As a result of the foregoing, the Group’s loss attributable to owners of the Company in 2018
was approximately HK$623.1 million, which has increased by approximately HK$442.8
million or approximately 245.6% as compared to that of approximately HK$180.3 million in
2017.
Property, Plant and Equipment
Property, plant and equipment mainly include items such as buildings, plant and machinery,
motor vehicles, furniture, office equipment, computers, fixtures and fittings. As at 31 December
2018, the Group’s property, plant and equipment amounted to approximately HK$384.4
million, which has decreased by approximately HK$116.9 million or approximately 23.3%
from approximately HK$501.3 million as at 31 December 2017. The decrease was primarily
due to the depreciation of the property, plant and equipment and the write-of of certain drilling
equipment in 2018.
Intangible Assets
As at 31 December 2018, the Group’s intangible assets amounted to approximately HK$95.5
million, representing a decrease of approximately HK$211.1 million or approximately 68.9%
from approximately HK$306.6 million as at 31 December 2017. The decrease was mainly due
to a provision for impairment of goodwill of approximately HK$209.7 million, which has been
recognised against the goodwill of the oilfield project tools and services segment.
– 52 –
Inventories
As at 31 December 2018, the Group’s inventories amounted to approximately HK$81.0 million,
representing a drop of approximately HK$40.0 million or approximately 33.1% as compared to
that of approximately HK$121.0 million as at 31 December 2017. The average turnover days
of inventories decreased from approximately 414 days in 2017 to approximately 335 days in
2018. The decrease of inventories turnover days was mainly due to the increase in written off of
inventories in 2018.
Trade Receivables
As at 31 December 2018, the Group’s trade receivables amounted to approximately HK$206.0
million, representing a decrease of approximately HK$201.3 million or approximately 49.4%
as compared to that of approximately HK$407.3 million as at 31 December 2017. The average
turnover days of trade receivables were approximately 432 days in 2018, representing a
decrease of approximately 81 days as compared to that of approximately 513 days in 2017. The
decrease in turnover days of trade receivables was mainly due to the provision for impairment
of trade receivables during 2018 and the improvements in trade receivables settlement from
customers in the China market.
Trade Payables
As at 31 December 2018, the Group’s trade payables were approximately HK$127.8 million,
which has increased by approximately HK$8.2 million or approximately 6.9% as compared to
that of approximately HK$119.6 million as at 31 December 2017. The average turnover days
of trade payables decreased from approximately 378 days in 2017 to approximately 352 days in
2018, representing a decrease of approximately 26 days. The decrease in turnover days of trade
payables was mainly due to the quicker payments to the suppliers in 2018.
Liquidity and Capital Resources
The Group’s objectives for capital management are to safeguard the Group’s ability to continue
as a going concern in order to maintain an optimal capital structure and reduce the cost of
capital, while maximising the return to shareholders through improving the debt and equity
balance.
– 53 –
As at 31 December 2018, the Group’s cash and cash equivalents amounted to approximately
HK$39.3 million, representing an increase of approximately HK$14.6 million as compared to
that of approximately HK$24.7 million as at 31 December 2017. The cash and cash equivalents
were mainly held in HK$, RMB and US$.
As at 31 December 2018, the Group’s bank facilities of approximately HK$42.0 million (31
December 2017: HK$53 million) were granted by banks to the subsidiaries of the Group, of
which all have been utilised by the subsidiaries.
Gearing ratio
As at 31 December 2018, the Group’s gearing ratio (calculated as net debt divided by total
capital) was approximately 33.9% (31 December 2017: 13.7%). Net debt is calculated as total
borrowings (including “current and non-current bank and other borrowings” as shown in the
consolidated financial information) less total cash (including “pledged bank deposits” and
“cash and cash equivalents” as shown in the consolidated financial information). Total capital
is calculated as “equity” as shown in the consolidated financial information plus net debt.
Foreign Exchange Risk
The Group operates in various countries and is exposed to foreign exchange risk arising from
various currency exposures, primarily with respect to the US$ and RMB. Foreign exchange
risk mainly arises from trade and other receivables, cash and cash equivalents, trade and other
payables, intra-group balance and bank borrowings in foreign currencies.
Contractual Obligations
The Group leases various offices, warehouses and a land in Singapore under non-cancellable
operating lease agreements. The lease terms are between 1 and 28 years, and the majority
of lease agreements are renewable at the end of the lease period at market rate. The Group’s
commitment under operating leases amounted to approximately HK$16.0 million as at 31
December 2018 (2017: HK$19.6 million).
Off-balance Sheet Arrangements
As at 31 December 2018, the Group did not have any off-balance sheet arrangements (31
December 2017: Nil).
– 54 –
CLOSURE OF REGISTER OF MEMBERS
The register of members of the Company will be closed from 3 June 2019 to 6 June 2019, both
dates inclusive, during which period no share transfers will be registered. In order to determine
the identity of the shareholders of the Company entitled to attend and vote at the forthcoming
annual general meeting of the Company, all transfers of shares accompanied by the relevant
share certificates must be lodged with the Company’s branch share registrar in Hong Kong,
Computershare Hong Kong Investor Services Limited, at its office situated at Shops 1712-1716,
17th Floor, Hopewell Centre, 183 Queen’s Road East, Wanchai, Hong Kong for registration not
later than 4:30 p.m. on 31 May 2019.
CORPORATE GOVERNANCE
The Company is committed to maintaining high standards of corporate governance and has
steered its development and protected the interests of its shareholders in an enlightened and
open manner.
The Board comprises two executive Directors, two non-executive Directors and three
independent non-executive Directors. The Board has adopted the code provisions of the
Corporate Governance Code (“Code Provision(s)”) set out in Appendix 14 to the Rules
Governing the Listing of Securities (“Listing Rules”) on the Stock Exchange. During the
reporting period, the Company has compiled with the Code Provisions, save for the deviation
discussed below.
Under Code Provision A.6.7, independent non-executive Directors and other non-executive
Directors should attend general meetings and develop a balanced understanding of the views
of shareholders. Mr. Xin Junhe and Mr. Tong Hin Wor, being independent non-executive
Directors, and Ms. Ma Hua, being a non-executive Director, could not attend the annual general
meeting of the Company held on 28 June 2018 because of their respective other business
commitments; aiming for compliance with this Code Provision, the Company will continue
to furnish all Directors with appropriate information on all general meetings and take all
reasonable measures to arrange the schedule in such a cautious way to enable all Directors to
attend the general meetings as far as possible.
The Company was not able to timely comply with the financial reporting provisions under the
Listing Rules in (i) announcing the annual results for the financial year ended 31 December
2017; and (ii) publishing the annual report for the year ended 31 December 2017. Such delay
has constituted non-compliance with Rules 13.46(2)(a), 13.49(1) and 13.49(2) of the Listing
Rules. The Company had published its annual results announcement and annual report for the
financial year ended 31 December 2017 on 10 May 2018 and 24 May 2018, respectively.
– 55 –
DIRECTORS’ SECURITIES TRANSACTIONS
The Directors have adopted the Model Code for Securities Transactions by Directors of
Listed Issuers (the “Model Code”) as set out in Appendix 10 of the Listing Rules as the
code of conduct for carrying out transactions in the Company’s securities by the Directors.
After specific enquiry with the Directors, the Company confirms that all Directors have fully
complied with the required standard of dealings as set out in the Model Code during the
reporting period.
PURCHASE, SALE OR REDEMPTION OF THE COMPANY’S LISTED SECURITIES
For the year ended 31 December 2018, neither the Company nor any of its subsidiaries has
purchased, sold or redeemed any of the Company’s listed securities.
EVENTS AFTER BALANCE SHEET DATE
(1) On 31 January 2019, the Group entered into a sales and purchase agreement with a third
party in relation to the purchase of a unit of hydraulic fracturing truck at a consideration
of RMB7,500,000 (equivalent to approximately HK$8,776,000). Further details of this
purchase were disclosed in the Company’s announcement dated 31 January 2019.
(ii) On 20 March 2019, the Group has entered into a loan agreement with a third party to
borrow HK$20,000,000 (“Equipment Loan”) for a term up to 30 June 2020. The loan
will be secured by certain equipment of the Group and bears interest at 10% per annum.
Such loan has not yet been drawn down as of the date of this announcement.
(iii) On 21 March 2019, the Group has agreed in writing with all the bondholders of the
Group’s 2018 Convertible Bonds with a total principal amount of HK$30,000,000
to redeem such bonds in full and at the same time, the Group issued new convertible
bonds, expiring on 23 May 2021, with a total principal amount of HK$30,000,000 to the
same bondholders. Further details of this transaction were disclosed in the Company’s
announcement dated 21 March 2019.
(iv) On 25 March 2019, the Group has entered into a loan agreement to borrow
HK$20,000,000 from a shareholder (the “Shareholder Loan”) for a term of 18 months
from the date of drawdown. Such loan is unsecured and bears interest at 10% per annum.
The Group had drawn down the entire amount as of the date of this announcement.

– 56 –
REVIEW OF PRELIMINARY ANNOUNCEMENT
The figures in respect of this preliminary announcement of the Group’s results for the year
ended 31 December 2018 have been agreed by the Group’s auditor, PricewaterhouseCoopers,
to the amounts set out in the Group’s consolidated financial statements for the year. The
work performed by PricewaterhouseCoopers in this respect did not constitute an assurance
engagement in accordance with Hong Kong Standards on Auditing, Hong Kong Standards
on Review Engagements or Hong Kong Standards on Assurance Engagements issued by the
Hong Kong Institute of Certified Public Accountants and consequently no assurance has been
expressed by PricewaterhouseCoopers on the preliminary announcement.
AUDIT COMMITTEE
Pursuant to the requirements of the Code Provisions and the Listing Rules, the Company has
established an audit committee (the “Audit Committee”) which composes of three independent
non-executive Directors, namely Mr. Leung Lin Cheong (Chairman of the Audit Committee),
Mr. Xin Junhe and Mr. Tong Hin Wor. The consolidated financial statements for the Year have
been reviewed by the Audit Committee.
By Order of the Board
PETRO-KING OILFIELD SERVICES LIMITEDWang Jinlong
Chairman
Hong Kong, 27 March 2019
As at the date of this announcement, the executive Directors are Mr. Wang Jinlong and
Mr. Zhao Jindong; the non-executive Directors are Mr. Lee Tommy and Ms. Ma Hua; and
the independent non-executive Directors are Mr. Leung Lin Cheong, Mr. Tong Hin Wor and
Mr. Xin Junhe.