PETITION ER'S - IURC Online Services Portal
74
Petitioner's Exhibit No. 1 Cause No. 37366-GCA 151 CEI South Page 1 of 10 SOUTHERN INDIANA GAS AND ELECTRIC COMPANY d/b/a CENTERPOINT ENERGY INDIANA SOUTH (CEI SOUTH) IURC PETITION ER'S IURC CAUSE NO. 37366-GCA151 ik!'JW: .... ;;zzL DIRECT TESTIMONY OF KA TIE J. TIEKEN DIRECTOR, REGULA TORY AND RATES SPONSORING PETITIONER'S EXHIBIT NO. 1, ATTACHMENTS KJT-1 THROUGH KJT-4 I Ri,O
-
Upload
khangminh22 -
Category
Documents
-
view
1 -
download
0
Transcript of PETITION ER'S - IURC Online Services Portal

Petitioner's Exhibit No. 1 Cause No. 37366-GCA 151
CEI South Page 1 of 10
SOUTHERN INDIANA GAS AND ELECTRIC COMPANY
d/b/a CENTERPOINT ENERGY INDIANA SOUTH
(CEI SOUTH)
IURC PETITION ER'S
IURC CAUSE NO. 37366-GCA151 ik!'JW:....;;zzL ~
DIRECT TESTIMONY
OF
KA TIE J. TIEKEN
DIRECTOR, REGULA TORY AND RATES
SPONSORING PETITIONER'S EXHIBIT NO. 1,
ATTACHMENTS KJT-1 THROUGH KJT-4
I Ri,O

1 I.
2
3 Q.
4 A.
5
6
7
8 Q.
9 A.
10
11
12
13
14 Q.
15 A.
16
17
18
19
20 Q.
21 A.
22
23
24 Q.
25 A.
26
27
28
29
30
31 Q.
32
Petitioner's Exhibit No. 1 Cause No. 37366-GCA 151
CEI South Page 2 of 10
DIRECT TESTIMONY OF KA TIE J. TIEKEN
INTRODUCTION
Please state your name and business address.
Katie J. Tieken
211 NW Riverside Drive
Evansville, Indiana 47708
By whom are you employed?
I am employed by Vectren Corporation, a wholly-owned subsidiary of CenterPoint Energy,
Inc. ("CenterPoint"). Southern Indiana Gas and Electric Company d/b/a CenterPoint
Energy Indiana South ("Petitioner", "CEI South" or "the Company") is an indirect subsidiary
of CenterPoint.
What position do you hold with Petitioner GEi South?
I am Director, Regulatory and Rates for CenterPoint, the ultimate parent company of CEI
South. I hold the same position with two other utility subsidiaries of CenterPoint- Indiana
Gas Company, Inc. d/b/a CenterPoint Energy Indiana North ("CEI North") and Vectren
Energy Delivery of Ohio, Inc. d/b/a CenterPoint Energy Ohio ("CEOH").
Please describe your educational background.
I am a 2001 graduate of the University of Evansville with a Bachelor of Science degree in
Business Administration with double majors in finance and mathematics.
Please describe your professional experience.
From 2002 to 2007, I was employed by EG&G Technical Services as a financial analyst and
contract administrator. Since October 2007, I have been employed with CenterPoint Energy
in various regulatory capacities. In 2015, I was named Manager, Rates. In February 2019,
I was named to Manager, Regulatory and Rates. I was named to my current position in April
2021.
What are your present duties and responsibilities as Director, Regulatory and
Rates?

1 A.
2
3
4
5
6
7 Q.
8 A.
9
10
11
12
13
14
15
16
17
18 Q.
19 A.
20
21
22
23
24
25
26 Q.
27 A.
28
29
30
31
32
Petitioner's Exhibit No. 1 Cause No. 37366-GCA151
GEi South Page 3 of 10
I am responsible for the Indiana and Ohio regulatory and rate matters of the regulated
utilities within CenterPoint in proceedings before the Indiana and Ohio utility regulatory
commissions. I also have responsibility for the implementation of all regulatory initiatives
of CEI South (and other utility subsidiaries in Indiana and Ohio), as well as the preparation
of regulatory and rates exhibits submitted in various regulatory proceedings.
Have you ever testified before any state regulatory commission?
Yes. I have testified before the Indiana Utility Regulatory Commission ("IURC" or
"Commission") on behalf of CEI South in its Gas Cost Adjustment ("GCA"), Cause No.
37366, beginning in GCA 147. I have also testified on behalf of GEi South in its Fuel
Adjustment Clause ("FAG"), Cause No. 38708, beginning in FAC126, in Cause No. 43354
(MISO Cost and Revenue Adjustment ("MCRA"), beginning in MCRA23 and in Cause No.
43406 (Reliability Cost and Revenue Adjustment ("RCRA"), RCRA 18. In addition, I have
testified on behalf of GEi North in its GCA proceeding Cause No. 37394, beginning in GCA
147. Most recently, I have testified on behalf of GEi South in its general gas base rate case
proceeding, Cause No. 45447 and GEi North Cause No. 45468.
What is the purpose of your testimony in this proceeding?
My testimony addresses: 1) GEi South's request for approval of changes in its GCAs for
the period August, September, and October 2021 ("the GCA period"), 2) GEi South's
request for authority to "flex" these GCAs up and down, consistent with the Order in Cause
No. 44374 that was approved by the Commission on August 27, 2014, and 3) GEi South's
proposal to recover variances resulting from the February 2021 Winter Storm Uri which are
included in the reconciliation of this GCA proceeding.
Are you sponsoring any attachments?
Yes, I am sponsoring the following attachments in this proceeding:
• Petitioner's Exhibit No. 1, Attachment KJT-1: Appendix A, GCA tariff sheet
• Petitioner's Exhibit No. 1, Attachment KJT-2: GCA calculation Schedules 1 through
14 as proposed under the Company's alternative recovery method
• Petitioner's Exhibit No. 1, Attachment KJT-3: GCA calculation Schedules 1 through
14 under the traditional recovery method

1
2
3
4 Q.
5 A.
6
7
8 II.
9
10
11 Q.
12 A.
13
14
15
16
17 Q.
18 A.
19
20
21
22
23
24
25
26
27
28
29
Petitioner's Exhibit No. 1 Cause No. 37366-GCA 151
CEI South Page 4 of 10
• Petitioner's Exhibit No. 1, Attachment KJT-4: Supporting calculation of CEI South's
proposed alternative approach
Were your testimony and attachments prepared by you or under your supervision?
Yes, they were.
PETITIONER'S EXHIBIT N0.1 ATTACHMENTS: TARIFF SHEET AND GCA
SCHEDULES
Please describe Attachment KJT-1.
Attachment KJT-1 contains Appendix A, the tariff sheet setting forth the estimated GCAs
proposed to be effective for the GCA period. The Company plans to update the entire Tariff
for Gas Service with the new assumed business name 1 within the Compliance Filing in its
pending general gas rate case, Cause No. 45447.
Please describe Attachment KJT-2 and Attachment KJT-3.
Both Attachment KJT-2 and Attachment KJT-3 contain GCA calculation Schedules 1
through 14, including the sales forecast for the twelve months ending July 2022.
Attachment KJT-2 reflects the quarterly GCA under the Company's alternative recovery
method as described in greater detail below.
Attachment KJT-3 reflects the quarterly GCA as calculated in accordance with the
Commission's Order in Cause No. 44374, where monthly variances are recovered over a
twelve-month period through a per-therm charge incorporated into the GCA factors
("Traditional GCA Recovery").
1 As of January 25, 2001, Southern Indiana Gas and Electric Company d/b/a Vectren Energy Delivery of Indiana, Inc. (formerly known as "Vectren South") operates under a new assumed business name Southern Indiana Gas and Electric Company d/b/a CenterPoint Energy Indiana South ("CEI South")

1 Ill.
2
3 Q.
Petitioner's Exhibit No. 1 Cause No. 37366-GCA 151
CEI South Page 5 of 10
MONTHLY UPDATES TO GAS COST ESTIMATES FOR MARKET PURCHASES
Has CEI South estimated prices for its projected market purchases for the GCA
4 period?
5 A.
6
Yes. CEI South's estimates August, September, and October 2021 are based on current
New York Mercantile Exchange ("NYMEX") prices for these months. Estimated market
7 purchases have been priced at NYMEX prices on a day no more than six (6) business
8 days prior to the filing of the revised GCA schedules included in this quarterly GCA filing.
9 This estimated price is referred to as the "initial market price".
10
11 Q.
12
13 A.
What is CEI South's proposal to reflect changes in the market price of gas via a
pricing and monthly flex adjustment to its estimated GCA?
CEI South will file a monthly flex (the "flex") each month to adjust the GCA for the
14 subsequent month. The flex will follow the Commission's Order for Cause No. 44374 and
15 will be filed no less than three (3) days before the beginning of each calendar month during
16 the GCA period. Market purchases in the flex will be priced at NYMEX prices on a day no
17 more than six (6) business days prior to the beginning of said calendar month. In each
18 flex, changes to the initial market price will be limited to a maximum adjustment (up or
19 down) of $1.00 from the initial market price.
20
21 Q.
22
23 A.
24
25
26 IV.
27
28 Q.
29
30 A.
31
Does this flex methodology proposal differ from that in effect in Cause No. 37366-
GCA 150?
No.
RECONCILIATION OF PRIOR PERIOD GAS COST VARIANCES
Does the applied-for GCA reflect the reconciliation of gas costs recovery and gas
costs incurred for a previous period?
Yes. The applied-for GCA reflects the reconciliation of gas cost recovery and gas cost
incurred for the months of December 2020, January 2021 and February 2021 (the
32 "Reconciliation Period").
33
1
2
Q.
3 A.
4
5
6
7
8 Q.
9
10 A.
11
12
13
14 Q.
15
16 A.
17
Petitioner's Exhibit No. 1 Cause No. 37366-GCA 151
CEI South Page 6 of 10
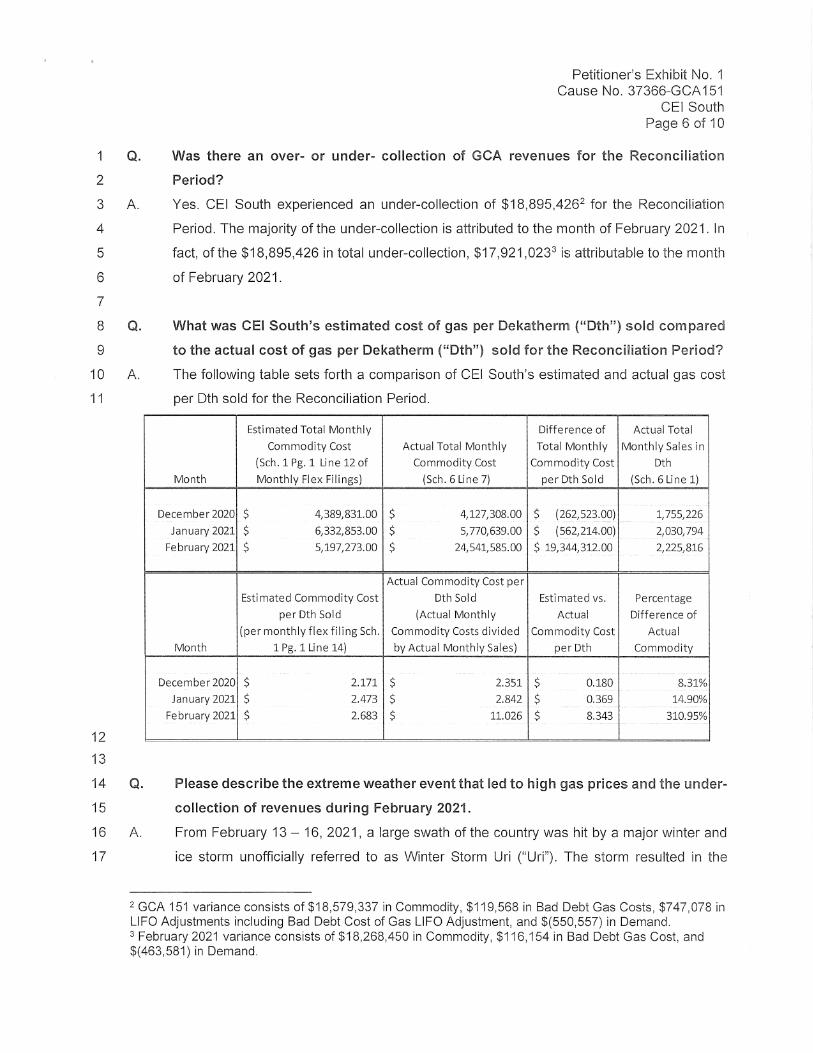
Was there an over- or under- collection of GCA revenues for the Reconciliation
Period?
Yes. CEI South experienced an under-collection of $18,895,4262 for the Reconciliation
Period. The majority of the under-collection is attributed to the month of February 2021. In
fact, of the $18,895,426 in total under-collection, $17,921,0233 is attributable to the month
of February 2021.
What was CEI South's estimated cost of gas per Oekatherm ("0th") sold compared
to the actual cost of gas per Oekatherm ("0th") sold for the Reconciliation Period?
The following table sets forth a comparison of CEI South's estimated and actual gas cost
per Dth sold for the Reconciliation Period.
Estimated Total Monthly Difference of Actual Total
Commodity Cost Actual Total Monthly Total Monthly Monthly Sales in
(Sch. 1 Pg. 1 Line 12 of Commodity Cost Commodity Cost 0th
Month Monthly Flex Filings) (Sch. 6 Line 7) per 0th Sold (Sch. 6 Line 1)
.
December 2020 $ 4,389,831.00 $ 4,127,308.00 $ (262,523.QQ) , •... 1,755,226
January 2021 $ 6,332,853.00 $ 5,770,639.00 $ (5§2,214.00) 2,030,794 .....
February 2021 $ 5,197,273.00 $ 24,541,585.00 $ 19,344,312.00 2,225,816
Actual Commodity Cost per
Estimated Commodity Cost Dth Sold Estimated vs. Percentage
per 0th Sold (Actual Monthly Actual Difference of
(per monthly flex filing Sch. Commodity Costs divided Commodity Cost Actual
Month 1 Pg. 1 Line 14) by Actual Monthly Sales) per Dth Commodity
December 2020 $ 2.171 $ 2.351 $ 0.180 8.31%
January 2021 $ 2.473 $ 2.842 $ 0.369 14.90%
February 2021 $ 2.683 $ 11.026 $ 8.343 310.95% ...... ... ------
Please describe the extreme weather event that led to high gas prices and the under
collection of revenues during February 2021.
From February 13 - 16, 2021, a large swath of the country was hit by a major winter and
ice storm unofficially referred to as Winter Storm Uri ("Uri"). The storm resulted in the
2 GCA 151 variance consists of$18,579,337 in Commodity, $119,568 in Bad Debt Gas Costs, $747,078 in LIFO Adjustments including Bad Debt Cost of Gas LIFO Adjustment, and $(550,557) in Demand. 3 February 2021 variance consists of $18,268,450 in Commodity, $116,154 in Bad Debt Gas Cost, and $(463,581) in Demand.

1
2
3
4
5
6
7
8
9
10
11
12
13
14
15
16
Petitioner's Exhibit No. 1 Cause No. 37366-GCA 151
CEI South Page 7 of 10
issuance of winter weather alerts by the National Weather Service and blackouts for
millions of people in the United States. Uri contributed to a severe cold wave that affected
most of North America.
A combination of significant disruptions in natural gas supply combined with a sharp rise in
natural gas demand - all due to the arctic cold temperatures across much of the country -
led to an extraordinary increase in natural gas spot market prices, as discussed by
Petitioner's Witness Grizzle. Though natural gas prices have since stabilized, CE! South
incurred approximately $19. 7 million in costs to purchase necessary gas supplies for its
CE! South customers between February 12 and February 22, 2021 (the "February Market
Event"). The February Market Event affected not just CenterPoint4, but utilities across the
country. It was the culmination of unprecedented circumstances that resulted in high spot
market prices for natural gas across the country. On February 12, 2021, gas daily spot
prices surged to all-time record highs as freezing temperatures impacted nearly every
state.
17 Q. How are monthly variances between the forecasted price of gas and the actual prices
of gas typically recovered as part of CE! South's GCA process? 18
19 A. In accordance with the Commission's Order in Cause No. 44374, monthly variances are
recovered over a twelve-month period through a per-therm charge incorporated into the
GCA factors ("Traditional GCA Recovery").
20
21
22
23
24
Q. What is CEI South's proposal in this GCA to recover the variances for February
2021?
25 A. CE! South is proposing an alternative approach to recover the February 2021 variance
over 12 months, which is similar to the alternative approach the Commission recently
approved for Northern Indiana Public Service Company ("NIPSCO") in Cause No. 43629
GCA 585 . Fifty percent of the February 2021 variances (commodity, bad debt gas costs,
and demand) will be recovered evenly over the 12-month period August 2021 through July
26
27
28
29
4 Reference to CenterPoint indicates not only CEI South, but also other jurisdictions served within CenterPoint's service territory. 5 The Commission approved "the 12-month alternative reconciliation process NIPSCO proposed under which the variance created during February 2021 will be split evenly between a fixed and a variable calculation" (In re N. Ind. Public Service Co, Cause No. 43629 at 11 (IURC 5/26/21)).

1
2
3
4
5 Q.
6
7 A.
8
9
10
11
12
13
14
15
16
17
18
19
20
21
22 Q.
23 A.
24
25
26
27
28
29
30
31 Q.
32
33
Petitioner's Exhibit No. 1 Cause No. 37366-GCA151
CEI South Page 8 of 10
2022. The remaining fifty percent of the variance will be recovered using a volumetric
allocation over the same 12-month period. The supporting calculation of CEI South's
proposed alternative approach is included as Petitioner's Exhibit No. 1, Attachment KJT-4.
Why is CEI South proposing this alternative approach to recovery of the February
2021 gas costs?
Winter Storm Uri was an extraordinary event that occurred at a time when Hoosiers were
already experiencing economic hardships resulting from the COVI D-19 pandemic.
Petitioner's Witness Grizzle explained that prices at delivery points to Indiana increased
dramatically to as much as $65.60 per dekatherm for Rockies Express Pipeline, Zone 3,
on February 13-16, in comparison to the February weighted average cost of gas of $3.17
per dekatherm included in the GCA 149 flex filing. As I stated earlier, the result of Winter
Storm Uri was a net under-collection of $18,895,426 for the Reconciliation Period. The
February 2021 portion of this under-collection was $17,921,023. Recovering the February
2021 under-collection through the approved per-therm charge results in an increased
impact on customers during the winter heating season when their gas usage is the highest.
Accordingly, CEI South has been considering alternate methods to mitigate this rate impact
and considers this 50/50 approach to be in the customer's best interests. By spreading 50
percent of the February 2021 variance evenly over the 12-month period, it mitigates the
costs the customer will experience in the winter heating season.
Did CEI South consider any other alternatives?
Yes. CEI South considered the Traditional GCA Recovery and also an extended recovery
period beyond the typical 12-month period. The Traditional GCA Recovery would lead to a
an increase in customers' bills during the winter heating season. An extended recovery
period beyond the typical 12-month period is inconsistent with Ind. Code § 8-1-2-
42(g)(3)(D) and Commission findings related to that statute. Additionally, an extended
recovery period presents multiple factors that have the potential to negatively impact
customers. The Company decided to request approval of the alternative approach.
Please further describe why an extended recovery period beyond the typical 12-
month period is inconsistent with Ind. Code § 8-1-2-42(g)(3)(D) and Commission
findings related to that statute.

1
2
3
4 5 6 7 8 9
10
11
12
13
14
15
A.
16 Q.
17
18 A.
19
20
21
22
23
24
25
26
27
28
29
30 Q.
31 A.
32
Petitioner's Exhibit No. 1 Cause No. 37366-GCA151
CEI South Page 9 of 10
Ind. Code § 8-1-2-42(g)(3)(D) states that the Commission must find the following before
granting a gas utility the requested gas cost charge:
The utility's estimate of its prospective average gas costs for each future recovery period is reasonable and gives effect to: (i) the actual gas costs experienced by the utility during the latest recovery period for which actual gas costs are available; and (ii) the actual gas costs recovered by the adjustment of the same recovery period. ( emphasis added).
The Commission affirmed this linkage in its most recent review of the GCA practices. In re
IURC's Investigation into Existing Gas Cost Adjustment Procedures and Schedules,
Cause No. 44374 (approved August 27, 2014). In responding to a request for annual filings
for small gas utilities, the Commission held that "[v]ariances created during an annual filing
will take longer to be recovered from/returned to customers." Id. at 20.
Please describe the factors that an extended recovery period will present that have
the potential to negatively impact customers.
An extended recovery period presents three main factors that have the potential to
negatively impact customers:
1. An extended recovery period would likely span across, and lead to increased customer
rates for, two winter heating seasons.
2. With customer turnover during the extended recovery period, customers new to the
system (who did not use the gas purchased in February 2021) would still be paying
the increased rates.
3. If an extended recovery period were approved, the Commission should authorize the
Company to recover associated carrying costs for financing gas costs over a long
period. Such carrying costs 6 would further increase rates for customers.
Under CEI South's alternative proposal, how will customers be impacted?
The chart below compares the bill impacts of average residential customer using 658
therms per year under the Traditional GCA Recovery, as well as the "alternative" 50/50
6 Estimated carrying costs on the extended recovery period (months 13-24) are approximately $800,000 using the most recently approved weighted average cost of capital of 6.28% from Cause No. 44429-TDSIC 13.

1
2
3
4
5
6
7
8
9
10
11
$30.00
$25.00
$20.00
$15.00
$10.00
$5.C(l
V.
Q.
A.
$-
Petitioner's Exhibit No. 'I Cause No. 37366-GCA 151
GEi South Page 10 of 10
approach. As shown in the chart below, the alternative 50/50 proposed approach will result
in slightly higher collections in the summer months, when natural gas usage is lower, but
will lessen the impact of the increase during the winter heating season, when natural gas
usage is highest. The alternative 50/50 proposed approach is in the customers' best
interest.
February 2021 Variances Average Residential Bill Impact
$26.48
$6.33 $5.75
$3-02
$1.95
Aug-21 Sep-21 Oct-21 Nov-21 Dec-21 Ja.n-22 Feb-22 Mar-22
>:·.Traditional GCA Reco\i'e1y =Alternative 50/50 Approach
CONCLUSION
Does this conclude your direct testimony?
Yes, it does.
$5.75 $5.60
$1.95 $1.89
Apr-22 fvlay-22 Jun-22 Jul-22

STATE OF INDIANA
) SS:
COUNTY OF VANDERBURGH }
The undersigned, Katie J. Tiel<:en, being duly sworn, under penalty of perjury affirms that the
foregoing Direct Testimony in Cause No. 37366-GCA151 is true to the best of her knowledge,
infor111ation and belief.
' I \\ ,/ \\ \\
~r ?it \ {~tl j~<} __ ~
K~tie J. Tleken(J
Cause No. 37366-GCA151
Petitioner's Exhibit No. Attachment KJT-2
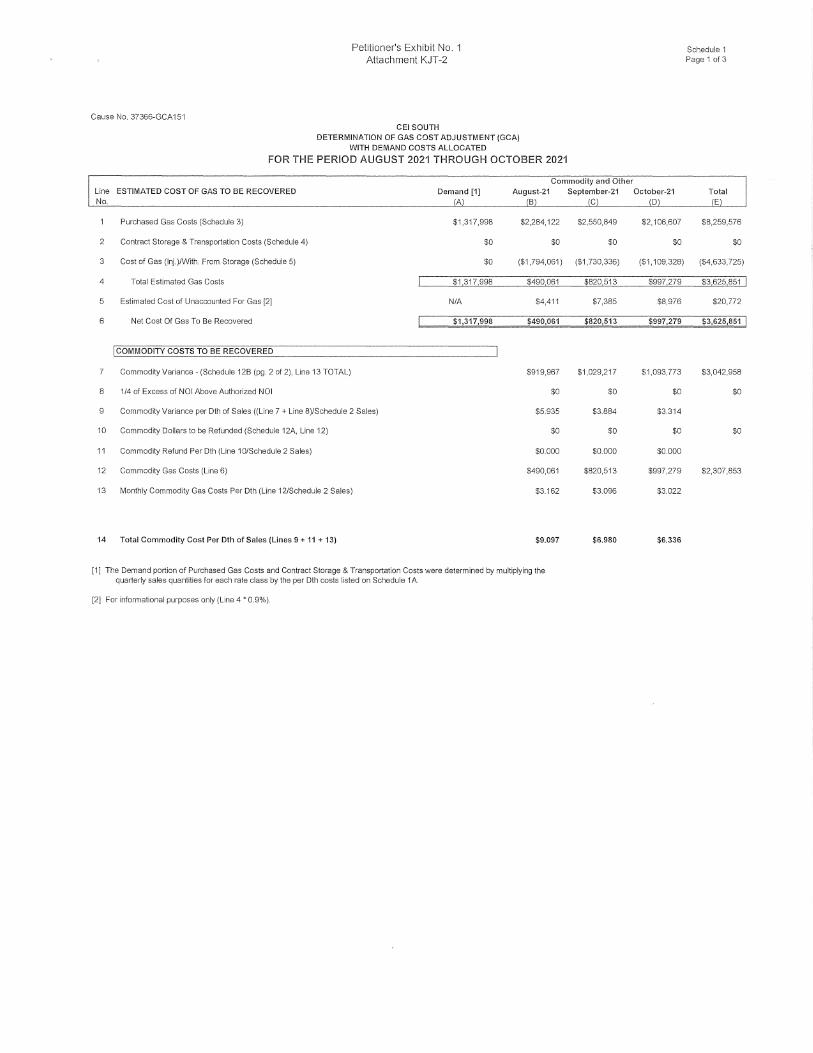
GEi SOUTH DETERMINJ.\TION OF GAS COST ADJUSTMENT (GCA)
WITH DEMAND COSTS ALLOCATED
FOR THE PERIOD AUGUST 2021 THROUGH OCTOBER 2021
Commodity and Other Line ESTIMATED COST OF GAS TO BE RECOVERED No.
Purchased Gas Costs (Schedule 3)
2 Contract Storage & Transportation Costs (Schedule 4)
3 Cost of Gas (lnj.)/With. From Storage (Schedule 5)
4 Total Estimated Gas Costs
5 Estimated Cost of Unaccounted For Gas [2]
6 Net Cost Of Gas To Be Recovered
I COMMODITY COSTS TO BE RECOVERED
7 CommodityVariance-(Schedule 12B (pg. 2 of2), Line 13 TOTAL)
8 1/4 of Excess of NOi Above Authorized NOi
9 Commodity Variance per Dth of Sales ((Line 7 + Line BJ/Schedule 2 Sales)
10 Commodity Dollars to be Refunded (Schedule 12A, Line 12)
11 Commodity Refund Per 0th (Line 10/Schedule 2 Sales)
12 Commodity Gas Costs (Line 6)
13 Monthly Commodity Gas Costs Per Dth (Line 12/Schedule 2 Sales)
14 Total Commodity Cost Per Dth of Sales (Lines 9 + 11 + 13)
Demand [1] August-21 A B
$1,317,998 $2,284,122
$0 $0
$0 ($1,794,061)
$1 317,998 $490,061
N/A $4,411
$1,317,998 $490,061
$919,967
$0
$5.935
$0
$0.000
$490,061
$3.162
$9.097
[1] The Demand portion of Purchased Gas Costs and Contract Storage & Transportation Costs were determined by multiplying the quarterly sales quantities for each rate class by the per 0th costs listed on Schedule 1A
[2] For informational purposes only (Line 4 • 0.9%).
September-21 C
$2,550,849
$0
($1,730,336)
$820 513
$7,385
$820,513
$1,029,217
$0
$3.884
$0
$0.000
$820,513
$3.096
$6.980
October-21 D
$2,106,607
$0
($1,109,328)
$997,279
$8,976
$997,279
$1,093,773
$0
$3.314
$0
$0.000
$997,279
$3.022
$6.336
Schedule 1 Page 1 of3
$8,259,576
$0
($4,633,725)
$3,625,851 1
$20,772
$3,625,851
$3,042,958
$0
$0
$2,307,853

Cause No. 37366-GCA151
Petitioner's Exhibit No. 1 Attachment KJT-2
CEI SOUTH DETERi\/liNATiON OF GAS COST ADJUSTMENT (GCA)
Line (A) No. DEMAND RELATED COSTS TO BE RECOVERED Total
15 Demand Cost Variance (Schedule 12B (pg 1 of 2), Line 13 Total ($87,980)
16 Demand Variance Per Dth (Line 15 / Schedule 2 Sales) ($0.117)
17 TOTAL Current Demand Costs Per 0th (Schedule 1A, Line 3)
18 TOTAL Demand Costs Recovered Per Dth of Sales (Line 16 + Line 17)
IBAD DEBT GAS COSTS TO BE RECOVERED August-21
19 Total Commodity and Demand Costs $762,428
20 Bad Debt Gas Costs (Line 19 * 0.65%) $4,956
21 Bad Debt Cost Component per Dth (Line 20/Sch. 2 Sales) $0.032
IGCA DERIVATION August-21
22 Total GCA Charges (Lines 14 + 18 + 21) 22a Rate 110/120/129 $10.769
GAS COST ADJUSTMENT MODIFIED FOR 23 UTILITY RECEIPTS TAX -- $/DTH 23a Rate 110/120/129 with IURT (Line 23a / .9853) $10.930
*IURT Rate Effective 1/1/21 is .9853
(B) Rate 110/120/129
$1.757
$1.640
September-21
$1,286,180
$8,360
$0.032
September-21
$8.652
$8.781
Schedule 1 Page 2 of 3
October-21
$1,577,243
$10,252
$0.031
October-21
$8.007
$8.126

Cause No. 37366-GCA 151
Petitioner's Exhibit f\Jo. 1 Attachment l<JT-2
CEI SOUTH DETERMINATION OF GAS COST ADJUSTMENT (GCA)
FOR THE PERIOD AUGUST 2021 THROUGH OCTOBER 2021 ($/Dth)
Line No. Description Aug-21 Sep-21 24 Schedule 3 - Purchases 760,740 852,120
25 Schedule 5 - Storage (604,500) (585,000)
26 Total Gas Available for Sales 156,240 267,120
27 UAFG Percentage - 0.9% 0.9% 0.9%
28 UAFG Volumes 1,406 2,404
29 Average Commodity Price (Line 6 --;- Line 26) $ 3.137 $ 3.072
30 UAFG Costs [1] $ 4,411 $ 7,385
31 Schedule 2 Sales 155,000 265,000
32 UAFG Component (Line 30 + Line 31) [2] $ 0.028 $ 0.028
[1] Equals amount shown on Sch. 1, P1, LS. [2] For informational purposes only.
$
$
$
Schedule 1 Page 3 of 3
Oct-21 712,390
(379,750)
332,640
0.9%
2,994
2.998
8,976
330,000
0.027
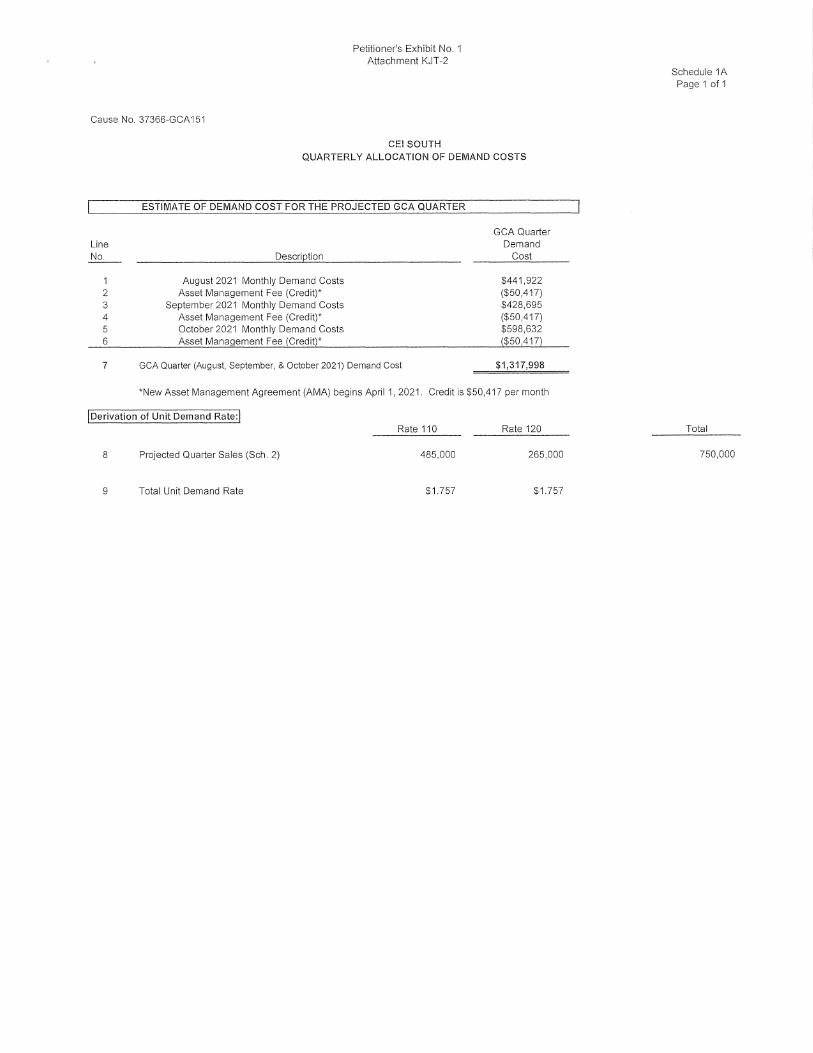
Petitioner's Exhibit No. Attachment f<JT-2
Cause No. 37366-GCA151
CE! SOUTH QUARTERLY ALLOCATION OF DEMAND COSTS
Line No.
1 2 3 4 5 6
7
ESTIMATE OF DEMAf\lD COST FOR THE PROJECTED GCA QUARTER
Description
August 2021 Monthly Demand Costs Asset Management Fee (Credit)*
September 2021 Monthly Demand Costs Asset Management Fee (Credit)* October 2021 Monthly Demand Costs Asset Management Fee (Credit)*
GCA Quarter (August, September, & October 2021) Demand Cost
GCA Quarter Demand
Cost
$441,922 ($50,417) $428,695 ($50,417) $598,632 ($50,417)
$1,317,998
*New Asset Management Agreement (AMA) begins April 1, 2021. Credit is $50,417 per month
!Derivation of Unit Demand Rate:! Rate 110 Rate 120
8 Projected Quarter Sales (Sch. 2) 485,000 265,000
9 Total Unit Demand Rate $1757 $1.757
Schedule 1A Page 1 of 1
Total
750,000

Peiitioner's Exhibit No. 1 Attachment KJT-2
Schedule 2 Page 1 of 1
Cause No. 37366-GCA151 CEI SOUTH
ESTIMATED SALES FOR THE TWELVE MONTHS ENDING JULY 2022
SUBJECT TO GCA
Sales Sales Sales Demand I\Jot Subject Subject
Month/ Year Forecast To GCA To GCA Rate 110 Rate 120
Aug-21 155,000 155,000 100,000 55,000
Sep-21 265,000 265,000 170,000 95,000
Oct-21 330,000 330,000 215,000 115,000
Subtotal 750,000 0 750,000 485,000 26s,ooo I
Nov-21 945,000 945,000 610,000 335,000
Dec-21 1,865,000 1,865,000 1,200,000 665,000
Jan-22 2,450,000 2,450,000 1,580,000 870,000
Subtotal 5,260,000 0 5,260,000 3,390,000 1,s10,ooo I
Feb-22 1,950,000 1,950,000 1,260,000 690,000
Mar-22 1,315,000 1,315,000 850,000 465,000
Apr-22 620,000 620,000 400,000 220,000
Subtotal 3,885,000 0 3,885,000 2,510,000 1,31s,ooo I
May-22 310,000 310,000 200,000 110,000
Jun-22 155,000 155,000 100,000 55,000
Jul-22 160,000 160,000 100,000 60,000
Subtotal 625,000 0 625,000 400,000 22s,ooo I Total 10,520,000 0 10,520,000 6,785,000 3,73s,ooo I
QUARTERLY PERCENTAGES BY RATE CLASS OF SALES SUBJECT TO GCA
Rate Rate Quarter Total Rate 11 O Rate 120
August 2021 - October 2021 7.129% 7.148% 7.095%
November 2021 - January 2022 50.000% 49.963% 50.067%
February 2022 - April 2022 36.930% 36.993% 36.814%
May 2022 - July 2022 5.941% 5.896% 6.024%
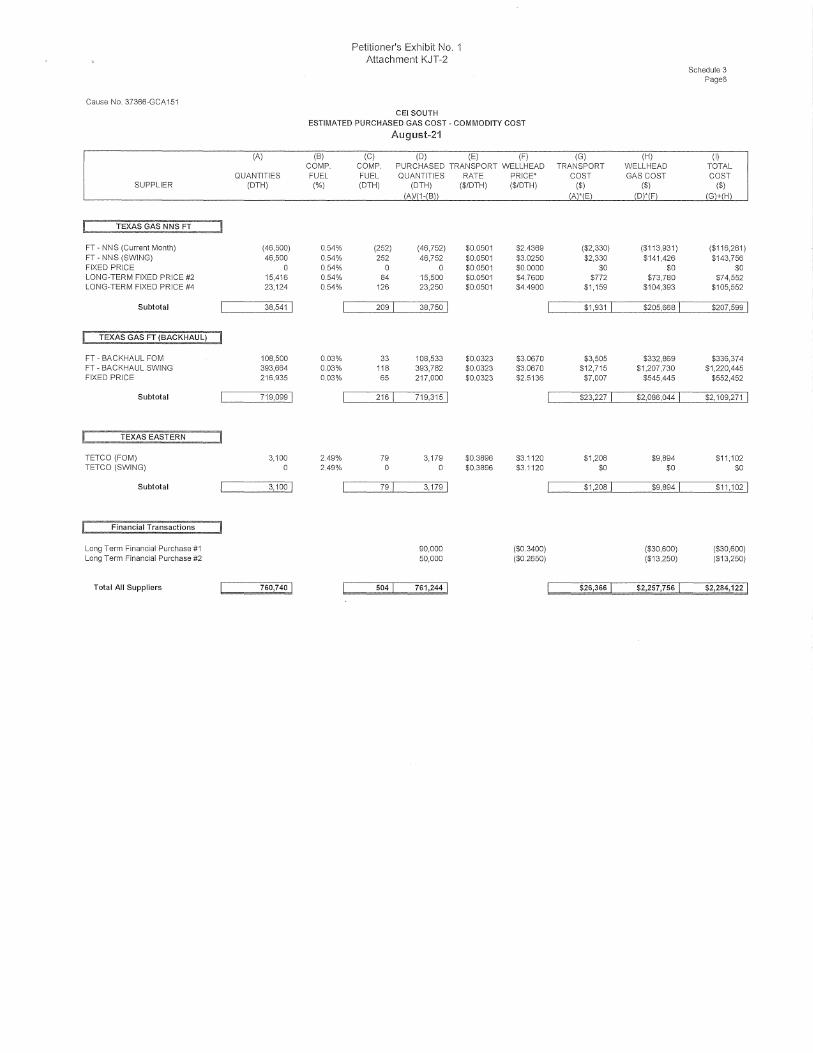
Petitioner's Exhibit No. Attachment KJT-2
Schedule 3 Page6
Cause No. 37366-GCA151
GEi SOUTH ESTIMATED PURCHASED GAS COST - COMMODITY COST
August-21
(A) (B) (C) (D) (E) (F) (G) (H) (I) COMP. COMP. PURCHASED TRANSPORT WELLHEAD TRANSPORT WELLHEAD TOTAL
QUANTITIES FUEL FUEL QUANTITIES RATE PRICE' COST GAS COST COST SUPPLIER (DTH) (%) (DTH) (0TH) ($/DTH) ($/DTH) ($) ($) ($)
(Al/(1-rB)l (Al'(El rDl"(Fl (Gl+(Hl
[ TEXAS GAS NNS FT
FT - NNS (Current Month) (46,500) 0.54% (252) (46,752) $0 0501 $2.4369 ($2,330) ($113,931) ($116,261) FT - NNS (SWING) 46,500 0.54% 252 46,752 $0.0501 $3.0250 $2,330 $141,426 $143,756 FIXED PRICE 0 0.54% 0 0 $0.0501 $0.0000 $0 $0 $0 LONG-TERM FIXED PRICE #2 15,416 0.54% 84 15,500 $0.0501 $4.7600 $772 $73,780 $74,552 LONG-TERM FIXED PRICE #4 23.124 0.54% 126 23,250 $0.0501 $4.4900 $1,159 $104,393 $105,552
Subtotal 38,541 1 209 1 38,750 1 $1,931 1 $205,668 1 $207,599 1
TEXAS GAS FT (BACKHAUL) J FT - BACKHAUL FOM 108,500 0.03% 33 108,533 $0.0323 $3.0670 $3,505 $332,869 $336,374 FT - BACKHAUL SWING 393,664 0.03% 118 393,782 $0.0323 $3.0670 $12,715 $1,207,730 $1,220,445 FIXED PRICE 216,935 0.03% 65 217,000 $0.0323 $2.5136 $7,007 $545,445 $552,452
Subtotal 719,099 1 216 1 719,315 1 $23,227 1 $2,□86,044 1 $2,109,271 1
TEXAS EASTERN
TETCO (FOM) 3,100 2.49% 79 3,179 $0.3896 $3.1120 $1,208 $9,894 $11,102 TETCO (SWING) 0 2.49% 0 0 $0.3896 $3.1120 $0 $0 $0
Subtotal 3,100 1 79 1 3,179 I $1,208 I $9,894 1 $11,102 I
Financial Transactions
Long Term Financial Purchase #1 90,000 ($0.3400) ($30,600) ($30,600) Long Term Financial Purchase #2 50,000 ($0.2650) ($13,250) ($13,250)
Total All Suppliers 760,74□ I 5□4 I 761,244 I $26,366 1 $2,2s7,7ss I $2,2s4, 122 I

Petitioner's Exhibit No. Attachment KJT-2
Schedule 3 Page1
Cause No. 37366-GCA 151 CEI SOUTH
ESTIMATED PURCHASED GAS COST - COMMODITY COST
September-21
(A) (B) (C) (D) (E) (F) (G) (H) (I) COMP. COMP. PURCHASED TRANSPORT WELLHEAD TRANSPORT WELLHEAD TOTAL
QUANTITIES FUEL FUEL QUANTITIES RATE PRICE' COST GAS COST COST SUPPLIER (DTH) (%) (DTH) (DTH) ($/DTH) ($/DTH) ($) ($) ($)
(A\/(1-(B)) (Al'(El (D)'(Fl (G\+(H\
TEXAS GAS NNS FT
FT - NNS (Current Month) (45,000) 0.54% (244) (45,244) $0 0501 $2.4369 ($2.255) ($110,255) ($112,510) FT - NNS (SWING) 110,000 0.54% 597 110,597 $0.0501 $2.9960 $5,511 $331,349 $336,860 FIXED PRICE 0 0.54% 0 0 $0.0501 $0.0000 $0 $0 $0 LONG-TERM FIXED PRICE #2 14,919 0.54% 81 15,000 $0.0501 $4.7600 $747 $71,400 $72,147 LONG-TERM FIXED PRICE #4 22,379 0.54% 122 22,500 $0.0501 $4.4900 $1,121 $101,025 $102,146
Subtotal 102,298 I 555 I 102,853 I $5,124 I $393,519 1 $398,643 I
TEXAS GAS FT (BACKHAUL)
FT - BACKHAUL FOM 105,000 0.03% 32 105,032 $0.0323 $3.0380 $3,392 $319,086 $322,478 FT - BACKHAUL SWING 431,885 0.03% 130 432,015 $0.0323 $3.0380 $13,950 $1,312,460 $1,326,410 FIXED PRICE 209,937 0.03% 63 210,000 $0.0323 $2.5136 $6,781 $527,850 $534,631
Subtotal 746,822 I 224 I 747,046 I $24,123 I $2,159,396 1 $2,183,519 I 24,894
TEXAS EASTERN
TETCO (FOM) 3,000 2.49% 77 3,077 $0.3896 $3.0580 $1,169 $9,408 $10,577 TETCO (SWING) 0 2.49% 0 0 $0.3896 $3.0580 $0 $0 $0
Subtotal 3,ooo 1 77 I 3,077 I $1,169 I $9,408 1 $10,577 I
Financial Transactions
Long Term Financial Purchase #1 90,000 ($0.3260) ($29,340) ($29,340) Long Term Financial Purchase #2 50,000 ($0.2510) ($12,550) ($12,550)
Total All Suppliers 852,120 I 856 1 852,9761 $30,416 I $2,520,433 I $2,550,8491

Cause No. 37366-GCA 151
(A)
QUANTITIES SUPPLIER (DTH)
TEXAS GAS NNS FT --:1 FT - NNS (Current Month) (31,000) FT - NNS (SWING) 74,000 FIXED PRICE 0 LONG-TERM FIXED PRICE #2 15,416 LONG-TERM FIXED PRICE #4 23,124
Subtotal 81.s41 1
[ TEXAS GAS FT (BACKHAUL)
FT - BACKHAUL FOM 108,500 FT - BACKHAUL SWING 302,314 FIXED PRICE 216,935
Subtotal 627,749 I
TEXAS EASTERN
TETCO (FOM) 3,100 TETCO (SWING) 0
Subtotal 3,1001
Financial Transactions
Long Term Financial Purchase #1 Long Term Financial Purchase #2
Total All Suppliers 112,3so I
Petitioner's Exhibit No. Attachment KJT-2
GEi SOUTH
ESTIMATED PURCHASED GAS COST- COMMODITY COST
October-21
(B) (C) (D) (E) (F)
COMP COMP. PURCHASED TRANSPORT WELLHEAD FUEL FUEL QUANTITIES RATE PRICE'
(%) (DTH) (DTH) ($/DTH) ($/DTH) (A\/(1-(B\l
0.54% (168) (31,168) $0.0501 $2.4369 0.54% 402 74,402 $0.0501 $3.0090 0.54% 0 0 $0.0501 $0.0000
0.54% 84 15,500 $0.0501 $4.7600
0.54% 126 23,250 $0.0501 $4.4900
443 I 81,984 I
0.03% 33 108,533 $0.0323 $3.0270 0.03% 91 302,405 $0.0323 $3.0270 0.03% 65 217.000 $0.0323 $2 5136
188 I 627,937 I
2.49% 79 3,179 $0.3896 $3.0570
2.49% $0.3896 $3.0570
79 I 3,179 I
90,000 ($0.3420) 50,000 ($0.2670)
1101 113,1001
(G) (H) TRANSPORT WELLHEAD
COST GAS COST ($) ($)
(A\"(E\ (D)'(F)
($1,553) ($75,953) $3,707 $223,876
$0 $0 $772 $73,780
$1,159 $104,393
$4,085 I $326,096 I
$3,505 $328,528 $9,765 $915,379 $7,007 $545,445
$20,277 I $1,789,352 I
$1,208 $9,719 $0 $0
$1,208 I $9,719 I
($30,780) ($13,350)
$2s,s10 I $2,081,0371
Schedule 3 Page1
(I) TOTAL COST
($) (G\+(H\
($77,506) $227,583
$0 $74,552
$105,552
$33□.181 1
$332,033 $925,144 $552,452
$1,809,629 I
$10.927 $0
$10,927 I
($30,780) ($13,350)
$2,106,6071

Cause No. 37366-GCA15·1
NYMEX Close Date:
NYMEX - August $ NYMEX - September $
NYMEX - October $
Purchase Price
August-21 $ September-21 $
October-21 $
6/21/2021
TGT NNS
3.215 3.201 3.217
Swing/FOM
3 025 2.996 3 009
TGT BH Swing/FOM
$ 3.067 $ 3 038 $ 3.027
Petitioner's Exhibit No. Attachment KJT-2
GEi South For the Period August 2021 - October 2021
Purchase Price Workpaper
Current Basis Differential:
TGT NNS Basis - August $ (0.190) $
Basis - September $ (0.205) $
Basis - October $ (0.208) $
TETCO Swing/FOM
$ 3.112 $ 3.058 $ 3.057
TGT BH (0.148) $ (0.163) $ (0.190) $
TETCO (0.103) (0.143) (0.160)

Petitioner's Exhibit No. 1 Attachment KJT-2
CEISOUTH Cause No. 37366-GCA 151 FOR THE PERIOD AUGUST 2021 THROUGH OCTOBER 2021 Sch. 3WACOG
WEIGHTED AVERAGE COST OF GAS Workpaper
August 2021 September 2021 October 2021 Total Cause No. 37366-GCA151 Average
Volume Price Extension Volume Price Extension Volume Price Extension Volum~ Price Extension
LONG-TERM FINANCIAL PURCHASE #1 90,000 $ (0.3400) $ (30,600) 90,000 S (0.3260) $ (29,340) 90,000 S (0.3420) S (30,780) 270,000 $ (0.3360) $ (90,720) LONG-TERM FINANCIAL PURCHASE #2 50,000 $ (0.2650) $ (13,250) 50,000 S (0.2510) S (12,550) 50,000 $ (0.2670) S (13,350) 150,000 $ (0.2610) S (39,150)
LONG-TERM FIXED PRICE #2 15,500 $ 4.7600 $ 73,780 15,000 $ 4.7600 $ 71,400 15,500 $ 4.7600 $ 73,780 46,000 $ 4.7600 $ 218,960 LONG-TERM FIXED PRICE #4 23,250 $ 4.4900 $ 104,393 22,500 $ 4.4900 $ 101,025 23,250 $ 4.4900 $ 104,393 69,000 $ 4.4900 $ 309,810 LONG-TERM FIXED WACOG 38,750 $ 3.4664 $ 134,323 37,500 $ 3.4809 $ 130,535 38,750 $ 3.4592 $ 134,043 115,000 $ 3.4687 $ 398,900
SHORT-TERM FIXED TGT 217,000 $ 2.5136 $ 545,445 210,000 $ 2.5136 $ 527,850 217,000 $ 2.5136 $ 545,445 644,000 $ 2.5136 $ 1,618,740 SHORT-TERIVI FIXED WACOG 217,000 $ 2.5136 $ 545,445 210,000 $ 2.5136 $ 527,850 217,000 $ 2.5136 $ 545,445 644,000 $ 2.5136 $ 1,618,740
FIRST OF THE MONTH INDEX - TGT 108,533 S 3.0670 $ 332,869 105,032 $ 3.0380 $ 319,086 108.533 $ 3.0270 $ 328,528 322,097 $ 3.0441 $ 980,483 FIRST OF THE MONTH INDEX -TETCO 3,179 $ 3.1120 $ 9,894 3,077 $ 3.0580 $ 9,408 3,179 $ 3.0570 s 9,719 9,435 $ 3.0759 $ 29,021
FIRST OF THE MONTH WACOG 111,712 $ 3,0683 $ 342,763 108,108 $ 3,0386 $ 328,494 111,712 $ 3,0279 $ 338,247 331,532 $ 3.0450 $ 1,009,504
DAILY SWING INDEX - TGT 46,752 $ 3.0250 $ 141,426 110,597 $ 2.9960 $ 331,349 74,402 $ 3.0090 $ 223,876 231,751 s 3.0060 $ 696,650 DAILY SWING INDEX-TGT BH 393,782 S 3,0670 $ 1,207,730 432,015 $ 3.0380 $ 1,312,460 302,405 $ 3.0270 $ 915,379 1,128,201 $ 3.0452 $ 3,435,569 DAILY SWING INDEX - TETCO $ 3.1120 $ $ 3.0580 $ $ 3.0570 $ $ $
DAILY SWING WA COG 440,535 $ 3.0625 $ 1,349,156 542,612 $ 3.0294 $ 1,643,809 376,807 $ 3.0234 $ 1,139,255 1,359,953 $ 3,0385 $ 4,132,220
COMPANY STORAGE (604,500) $ 2.9678 $ (1,794,061) (585,000) $ 2.9578 $ (1,730,336) (379,750) $ 2.9212 $ (1,109,328) (1,569,250) $ 2.9528 $ (4,633,726) NNS - TEXAS GAS STORAGE (46,752) $ 2.4369 $ (113,931) (45,244) $ 2.4369 $ (110,255) (31,168) $ 2.4369 $ (75,953) (123,164) S 2.4369 $ (300,139)
STORAGE WACOG (651,252) $ 2.9297 $ (1,907,992) (630,244) $ 2.9204 $ (1,840,591) (410,918) $ 2.8845 $ (1,185,281) (1,692,414) $ 2.9153 $ (4,933,865)
LONG-TERM FIXED WACOG 38,750 $ 3.4664 $ 134,323 37,500 $ 3.4809 $ 130,535 38,750 $ 3.4592 $ 134,043 115,000 $ 3.4687 $ 398,900 SHORT-TERM FIXED WACOG 217,000 $ 2.5136 $ 545,445 210,000 $ 2.5136 $ 527,850 217,000 $ 2.5136 $ 545,445 644,000 $ 2.5136 $ 1,618,740
FIRST OF THE IVIONTH WACOG 111,712 $ 3,0683 $ 342,763 108,108 $ 3,0386 $ 328,494 111,712 $ 3,0279 $ 338,247 331,532 $ 3.0450 $ 1,009,504 DAILY SWING WACOG 440,535 $ 3.0625 $ 1,349,156 542,612 $ 3.0294 $ 1,643,809 376,807 $ 3.0234 $ 1,139,255 1,359,953 $ 3.0385 $ 4,132,220
STORAGE WACOG (651,252) $ 2,9297 $ (1,907,992) (630,244) $ 2,9204 $ (1,840,591) (410,918) $ 2,8845 $ (1,185,281) (1,692,414) $ 2.9153 $ (4,933,865)
TOTAL WEIGHTED AVERAGE COST OF GAS 156,744 $ 2,9583 $ 463,694 267,976 $ 2,9484 $ 790,097 333,350 $ 2.9150 $ 971,708 758,070 $ 2,9357 $ 2,225,498
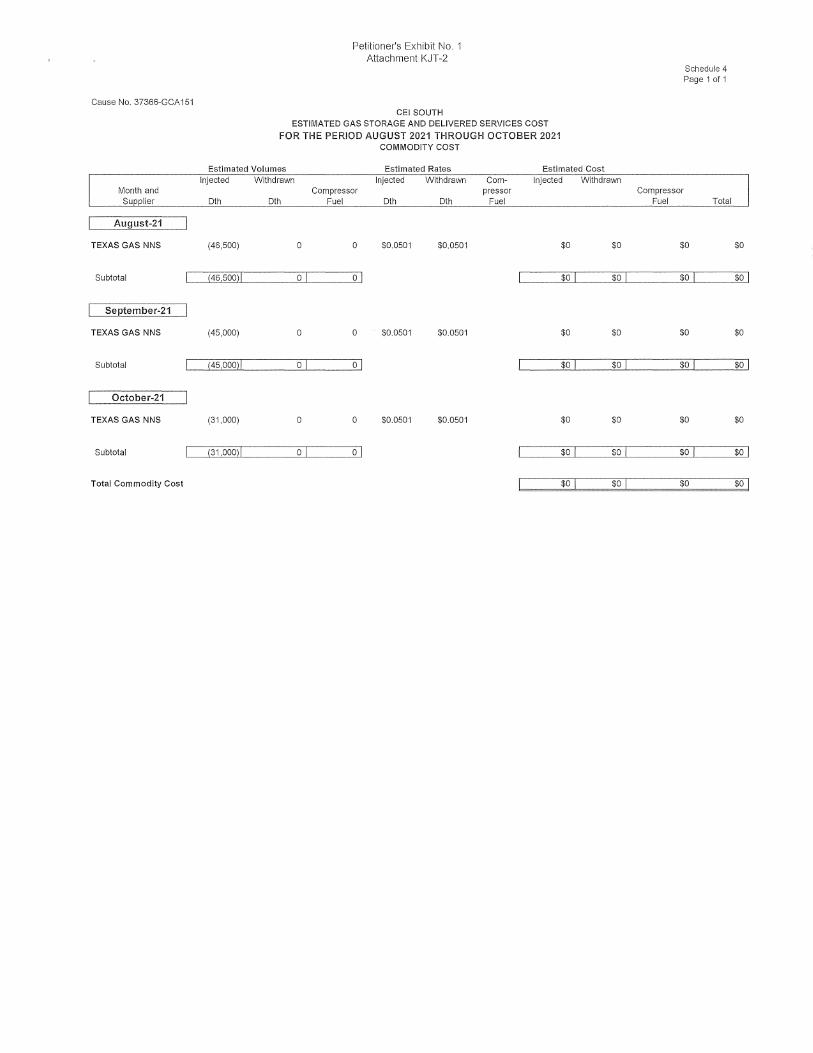
Petitioner's Exhibit No. Attachment KJT-2
Schedule 4 Page 1 of 1
Cause No. 37366-GCA151 CE\ SOUTH
ESTIMATED GAS STORAGE AND DELIVERED SERVICES COST
FOR THE PERIOD AUGUST 2021 THROUGH OCTOBER 2021 COMMODITY COST
Estimated Volumes Estimated Rates Estimated Cost Injected Withdrawn Injected Withdrawn Com- Injected Withdrawn
Month and Compressor pressor Compressor Su lier 0th 0th Fuel 0th Dth Fuel Fuel Total
August-21
TEXAS GAS NNS (46,500) 0 0 $0.0501 $0.0501 $0 $0 $0 $0
Subtotal (46,500)1 O[ 01 $0 1 $0 1 $0 1 $0 1
September-21
TEXAS GAS NNS (45,000) 0 0 $0.0501 $0.0501 $0 $0 $0 $0
Subtotal (45,000)[ 01 01 $0 1 $0 1 $0 1 $0 1
October-21
TEXAS GAS NNS (31,000) 0 0 $0.0501 $0.0501 $0 $0 $0 $0
Subtotal (31,000)[ 01 01 $0 1 $0 1 $0 1 $0 1
Total Commodity Cost $0 I $0 I $0 $0 I

Petitioner's Exhibit No.
Attachment KJT-2 Scl1edule 5 Page 1 of 1
Cause No. 37366-GCA 151 GEi SOUTH
ESTIMATED COST OF GAS INJECTED AND WITHDRAWN FROM STORAGE AND DELIVERED SERVICES
FOR THE PERIOD AUGUST 2021 THROUGH OCTOBER 202·1
Estimated Changes in Storage Month and Injected Withdrawn Net Estimated Gas Rates Cost of Gas
Type of Stora e Dth Dth Dth Demand Commodit Demand Commodit Net
August-21
Company (604,500) 0 (604,500) $2.968 $0 ($1,794,061) ($1,794,061)
(604,500)1 01 (604,500)1 $0 I ($1,794,061)1 ($1,794,061)1
September-21
Company (585,000) 0 (585,000) $2.958 $0 ($1,730,336) ($1,730,336)
rs8s,oooi 1 01 (585,000)1 $0 I ($1,730,336) 1 ($1,730,336)1
October-21
Company (379,750) 0 (379,750) $2.921 $0 ($1,109,328) ($1,109,328)
(379,750)1 o I (379,r5oJ 1 $0 I ($1,109,328)1 ($1, 1 o9,32sJ I
Grand Total (1,569,250) 1 01 (1,569,250) I $0 I ($4,633,725)! ($4,633,725) I

1 l~i ; I ~;i
~im ~1 ;;;

Financial Close Month Mar-21
Cause No. 37366-GCA151
Line No.
(1)
GAS COST RECOVERED
Sales - Dth
Petitioner's Exhibit No. 1 Attachment KJT-2
VECTREN SOUTH CAL CU LA TION OF ACTUAL GAS COST VARIAN CE
December 2020
Rate Rate Class 110 Class 120
1,210,904 544,243
II m
Rate Class 129
79
Ill
Schedule 6 Page 1 of 3
Total
1,755,226
III (2) GCA (without IURT) from GCAl 48
(a) Demand Cost Component (Sch 1, Line 18) (b) Commodity Cost Component (Sch 1, Line 14)
$0.304 $0.304 $0.304 } II $2.171 $2.171 $2.171
..---i$"'2""'.4""75,,,_----;.,$2,....4.,.,,7""5 ___ $.,...2.""'47""5""'1
(3)
(c) Total
Cost of Gas Recovered (without IURD (a) Demand Costs (Line 1 * Line 2a) (b) Commodity Costs Recovered (Line 1 * Line 2b) (c) Total Gas Costs Recovered
GAS COST TO BE RECOVERED
(4) Actual Demand Costs Incurred (Sch 7 Line 4c) (a) Purchased Gas Cost Demand (b) Storage Demand (c) Total
(5) Demand Variance from GCA148,(Sch 12B (pg 1 of 2), Line 13b)
(6) Total Demand Costs to be Recovered (Line 4c + Line 5)
(7) Actual Commodity Cost Incurred (Sch 7, Line 5)
(8) Commondity Variance from GCA148,(Sch 12B (pg 2 of 2), Line 13b)
(9) Commodity Refunds From GCA148(Sch 12A, Ll2b)
(10) Total Commodity Costs Incurred (Line 7 + Line 8 +Line 9)
DETERMINATION OF THE GAS COST VARIANCES
(11) Gas Cost Variance Representing (Over)/Under Recovery (a) Total Demand Variance (Over)/Under Recovery (Line 6 - Line 3a)
$368,115 $2,628,872 $2,996,987
(b) Total Commodity Variance (Over)/Under Recovery (Line 10 - Line 3b)
(c) Total Gas Cost Variance (Line lla + Line llb)
(12) % of (Over)/Under Recovery to Costs (Line llc / (Line 4c + Line 7))
$165,450 $1,181,551 $1,347,001
$24 $172 $196
• • II
$533,589 $3,810,595 $4,344,184 I
$577,045 0
$577,045
($39,558)
$537,487
$4,127,308
($331,118)
$0
$3,796,190
$3,898
($14,405)
($10,507)!
-0.22%

Financial Close Month Mar-21
Cause No. 37366-GCAlSl
Petitioner's Exhibit No. Attachment f<JT-2
VECTREN SOUTH CAlCULATIOI\I OF ACTUAL GAS COST VARIANCE
Line No.
(1)
(2)
(3)
(4)
(5)
(6)
(7)
(8)
(9)
(10)
(11)
(12)
January 2021
GAS COST RECOVERED
Sales - Dth
GCA (without IURT) from GCAl 48 (a) Demand Cost Component (Sch 1, Line 18) (b) Commodity Cost Component (Sch 1, Line 14) (c) Total
Cost of Gas Recovered (without IURT) (a) Demand Costs (Line 1 * Line 2a) (b) Commodity Costs Recovered (Line 1 * Line 2b) (c) Total Gas Costs Recovered
GAS COST TO BE RECOVERED
Actual Demand Costs Incurred (Sch 7 Line 4c) (a) Purchased Gas Cost Demand (b) Storage Demand (c) Total
Demand Variance from GCA148,(Sch 12B (pg 1 of 2), Line 13c)
Total Demand Costs to be Recovered (Line 4c + Line 5)
Actual Commodity Cost Incurred (Sch 7, Line 5)
Commondity Variance from GCA148,(Sch 12B (pg 2 of 2), Line 13c)
Commodity Refunds From GCA148(Sch 12A, L12c)
Total Commodity Costs Incurred (Line 7 + Line 8 +Line 9)
DETERMINATION OF THE GAS COST VARIANCES
Gas Cost Variance Representing (Over)/Under Recovery (a) Total Demand Variance (Over)/Under Recovery (Line 6 - Line 3a)
Rate Rate Class 110 Class 120
1,395,282
$0.304 $2.473 $2.777
$424,166 $3,450,533 $3,874,699
$0.304 $2.473 $2.777
$193,143 $1,571,196 $1,764,339
(b) Total Commodity Variance (Over)/Under Recovery (Line 10 - Line 3b)
(c) Total Gas Cost Variance (Line lla + Line llb)
% of (Over)/Under Recovery to Costs (Line llc / (Line 4c + Line 7))
Rate Class 129
172
$0.304 } $2.473
$2.777 I
$52 $425 $477
Schedule 6 Page 2 of 3
$617,361 $5,022,154 -
$5,639,515 1
$577,045 0
$577,045
($50,558)
$526,487
$5,770,639
($423,193)
$0
$5,347,446
($90,874)
$325,292
$234,418 1
3.69%

Financial Close Month March 2021
Petitioner's Exhibit No. Attachment KJT-2
Cause No. 37366-GCA151 VECTREN SOUTH
Line No.
(1)
GAS COST RECOVERED
Sales - Dth
CALCULATION OF ACTUAL GAS COST VARIANCE
Febrna.-y 2021
Rate Rate Class 110 Class 120
(2) GCA (without IURT) from GCAl 49 (a) Demand Cost Component (Sch 1, Line 18) (b) Commodity Cost Component (Sch 1, Line 14) (c) Total
(3) Cost of Gas Recovered (without IURT)
(4)
(5)
(6)
(7)
(8)
(9)
(10)
(11)
(a) Demand Costs (Line 1 * Line 2a) (b) Commodity Costs Recovered (Line 1 * Line 2b) (c) Total Gas Costs Recovered
GAS COST TO BE RECOVERED
Actual Demand Costs Incurred (Sch 7 Line 4c) (a) Purchased Gas Cost Demand (b) Storage Demand (c) Total
Demand Variance from GCA149,(Sch 12B (pg 1 of 2), Line 13a)
Total Demand Costs to be Recovered (Line 4c + Line 5)
Actual Commodity Cost Incurred (Sch 7, Line 5)
Commondity Variance from GCA149,(Sch 12B (pg 2 of 2), Line 13a)
Commodity Refunds From GCA149(Sch 12A, L12a)
Total Commodity Costs Incurred (Line 7 + Line 8 +Line 9)
DETERMINATION OF THE GAS COST VARIANCES
Gas Cost Variance Representing (Over)/Under Recovery (a) Total Demand Variance (Over)/Under Recovery (Line 6 - Line 3a)
$0.420 $2.683 $3.103
$645,762 $4,125,190 $4,770,952
(b) Total Commodity Variance (Over)/Under Recovery (Line 10 - Line 3b)
(c) Total Gas Cost Variance (Line lla + Line llb)
(12) % of (Over)/Under Recovery to Costs (Line llc / (Line 4c + Line 7))
$0.420 $2.683 $3,103
$289,045 $1,846,446 $2,135,491
Rate Class 129
85
$0.420 -I $2.683 f $3.103 1
$36 $227 $263
Schedule 6 Page 3 of 3
$934,843 $5,971,863 $6,906,106 1
$519,306 0
$519,306
($48,044)
$471,262
$24,541,585
($301,272)
$0
$24,240,313
($463,581)
$18,268,450
$17,8□4,869 1

Cause No. 37366-GCAlSl
Petitioner's Exhibit No. 1 Attachment KJT-2
VECTREN SOUTH DETERMINATION OF ACTUAL GAS COST
For The Period December 2020 Through February 2021
Line Fiifrii l!Mi FiW-11
No. December 2020 Janua)J'. 2021 Februa)J'. 2021 (1) Purchased Gas Cost (Schedule 8): II
(a) Demand Costs (Sch. 8, Page 2, Col.H) II $577,045 • $577,045 a $519,306
(b) Commodity & Other Costs (Sch. 8, Page 1 Col. M) $2,963,971 $2,966,804 $22,812,905
(2) Total Purchased Gas Cost (Lla + lb) $;3 S!J;l Ql§ $3 5!J;3Jl!l:2 Ji23 332,Zll
(3) Cost of Gas (Injected Into) / Withdrawn From Storage (Schedule 10)
(a) Demand (Sch. 10, Col. L) $0 $0 $0 (b) Commodity (Sch. 10, Col. G) 1,163,337 2,803,835 1,728,680 (c) Total Cost of Storage Activity (L3a + L3b) $1163 337 $2,8Q3 835 $1 728 68Q
Net Cost of Gas Totals: (4) Demand II • a (a) Purchased Gas Cost (L la) $577,045 $577,045 $519,306
(b) Storage Demand (L 3a) Q. Q. Q. (c) Total Demand (L4a + 4b) $577,045 $577,045 $519,306
(5) Commodity (Line Nos. lb + 3b) $4,127,308 $5,770,639 $24,541,585
(6) Net (Line Nos. 4c + 5) :t;!l,7Q4,~ $6,fil.68!! $;25,Qfill,a2,1
Schedule 7 Page 1 of 1
TOTAL
$1,673,395
$28,743,680
$3Q!!JZQZS
$0 5,695,852
$5 695 852
$1,673,395 1Q
$1,673,395
$34,439,532
$36,112,227

Cause No. 37366-GCAlSl Petitioner's 'liXtritliM~oow Schedule 8
NOM~l\1-m!mlf{l.f-ji.i\fES - COMMODITY Page 1 of 2
Tied Out w/ JE 01.00351 Purchased Gas JE I lilm■ December 2020
Col (A) to (E) Col(F)/(M) Col (H) to (L) Net MMBTU By Pieeline Total Commodity Purchases By Pieeline Total Transport
Line Purchased Rate Invoiced/ Quantities Total No. ~ TGT MGT TETCO ANR Other /MMBTU) /$/MMBTU} TGT MGT TETCO ANR Other Cost Received Billing
(A) (B) (C) (D) (E) (F) (G) (H) (I) (J) (K) (L) (M) (N) (0)
l EXELON - PURCHASED GAS 980,394 0 6,283 0 0 986,677 $2.6346 $2,583,168 $0 $16,370 $0 $0 $2,599,538 996,8901 $2.599.538 2 ASSET MANAGER - DELIV SERV VAR 0 0 0 0 0 0 $0.0000 $37,071 $0 $2,445 $0 $0 $39,517 0 $39,517 Sum of A 3 BP CANADA 0 0 0 0 0 0 $0.0000 $0 $0 $0 $0 $0 $0 0 $0 1,035,573
4 BoA/ MERRILL LYNCH 38,750 0 0 0 0 38,750 $4.5980 $178,173 $0 $0 $0 $0 $178,173 38,683 $178,173 5 GAS HEDGING 0 0 0 0 0 0 $0.0000 $0 $0 $0 $0 $ 810 $810 0 $810 6 TGT-NNS 55,335 0 0 0 0 55,335 $2.3640 $ 130,812 $0 $0 $0 $0 $130,812 55,335 $130,812 7 STORAGE VARIBLE COSTS WITH/ (INJ: 0 0 0 0 0 0 $0.0000 $0 $0 $0 $0 $ 3,007 $3,007 0 $3,007 8 CASH-OUT END USERS 0 0 0 0 9,434 9,434 ($0.4155) $0 $0 $0 $0 $ (3,920) ($3,920) 9,434 ($3,920) 9 TEXAS GAS CASH OUTS 0 0 0 0 0 0 $0.0000 $0 $0 $0 $0 $0 $0 ~r $0
10 MGT CASH OUTS 0 0 0 0 0 0 $0.0000 $0 $1,589 $0 $0 $0 $1,589 $1,589 11 TETCO CASH-OUTS 0 0 0 0 0 0 $0.0000 $0 $0 $14,446 $0 $0 $14,446 $14,446 12 LOCAL PRODUCTION 0 0 0 0 0 0 $0.0000 $0 $0 $0 $0 $0 $0 0 $0
MONTHLY SUBTOTAL I • I F,963,971 I 1,100,342 I R963,971 I■ 2.694
Tied Out w/ JE 01.0035, Purchased Gas JE I 11111-11 January 2021
Col (A) to (E) Col(F)/(M) Col (H) to (L) Net MM BTU By Pipeline Total Commodity Purchases By Pipeline Total Transport
Line Purchased Rate Invoiced/ Quantities Total No. Supplier TGT MGT TETCO ANR Other (MMBTU} /$/MMBTUl TGT MGT TETCO ANR Other Cost Received Billing
(A) (B) (C) (D) (E) (F) (G) (H) (I) (J) (K) (L) (M) (N) (0)
l EXELON - PURCHASED GAS 991,721 0 3,708 0 0 995,429 $2.6874 $2,666,675 $0 $8,469 $0 $0 $2,675,145 1,016,5141 $2,675,145 2 ASSET MANAGER - DELIV SERV VAR 0 0 0 0 0 0 $0.0000 $37,751 $0 $1,443 $0 $0 $39,194 D $39,194 Sum of B 3 BP CANADA 0 0 0 0 0 0 $0.0000 $0 $0 $0 $0 $0 $0 0 $0 1,055,200
4 BoA I MERRILL LYNCH 38,750 0 0 0 0 38,750 $4.5980 $178,173 $0 $0 $0 $0 $178,173 38,686 $178,173 5 GAS HEDGING 0 0 0 0 0 o $0,0000 $0 $0 $0 $0 $ 60,870.00 $60,870 o $60,870 6 TGT-NNS 8,768 0 0 0 0 8,768 $2.5610 $22,455 $0 $0 $0 $0 $22,455 8,768 $22,455 7 STORAGE VARIBLE COSTS WITH/ (INJ: 0 0 0 0 0 0 $0.D000 $0 $0 $0 $0 $483 $483 0 $483 8 CASH-OUT END USERS 0 0 0 0 (6,768) (6,768) $6.6174 $0 $0 $0 $0 ($44,787) ($44,787) (6,768) ($44,787) 9 TEXAS GAS CASH OUTS 0 0 0 0 D 0 $0.0000 $0 $0 $0 $0 $0 $0 ~er $0
10 MGT CASH OUTS 0 0 0 0 0 0 $0.0000 $0 $0 $0 $0 $0 $0 $0 11 TETCO CASH-OUTS 0 0 0 0 0 0 $0.0000 $0 $0 $35,271 $0 $0 $35,271 $35,271 12 LOCAL PRODUCTION 0 0 0 0 0 0 $0.0000 $0 $0 $0 $0 $0 $0 0 $0
MONTHLY SUBTOTAL I 1,036,179 111 I $2,966,so4 I 1,057,200 I $2,966,804 Ill 2,806
Tied Out w/ JE 01.0035, Purchased Gas JE 1 lil1!-II February 2021
Col (A) to (El Col(F)/(M) Col (H) to (L) Net MM BTU By Pieeline Total Commodity Purchases By Pieeline Total Transport
Line Purchased Rate Invoiced/ Quantities Total No, Supplier TGT MGT TETCO ANR Other fMMBTUl /$/MM BTU) TGT MGT TETCO ANR Other Cost Received Billing
(A) (B) (C) (D) (E) (F) (G) (H) (I) (J) (K) (L) (M) (N) (0) (E) (Fl
l EXELON - PURCHASED GAS 1,027,480 195,095 14,714 158,500 0 1,395,789 $15.7776 $ 12,403,577 $5,409,869 $ 73,027 $4,135,783 $ $22,022,256 1,432,180122.022.256 2 ASSET MANAGER - DELIV SERV VAR 0 0 0 0 0 0 $0.0000 $ 33,416 $ $ 5,733 $0 $ $39,149 0 $39,149 3 BP CANADA 0 0 0 0 0 0 $0,0000 $ $ $ $0 $ $0 0 $0 4 BoA / MERRILL LYNCH 34,690 0 0 0 0 34,690 $4.5966 $ 159,454 $ $ $0 $ $159,454 34,621 $159,454 5 GAS HEDGING D 0 0 0 0 0 $0,0000 $ $ $ $0 $ 19,850 $19,850 0 $19,850 6 TGT-NNS 71,571 0 0 0 0 71,571 $2.7640 $ 197,822 $ $ $0 $ $197,822 71,571 $197,822 Sum of C 7 STORAGE VARIBLE COSTS WITH/ (INJ: o 0 0 D 0 o $0.0000 $ $ $ $0 $ 7,192 $7,192 o $7,192 1,466,801
8 CASH-OUT END USERS 0 0 0 0 64,606 64,606 $5.8520 $ $ $ $0 $ 378,069 $378,069 64,6061 $378,069 9 TEXAS GAS CASH OUTS 0 0 0 0 0 0 $0.0000 $ $ $ $0 $ $0 0 .,c. $0
10 MGT CASH OUTS 0 0 0 0 0 0 $0.0000 $ $ (2,284) $ $0 $ ($2,284) 0 ($2,284) 11 TETCO CASH-OUTS 0 0 0 0 0 0 $0.D000 $ $ $ (8,603) $0 $ ($8,603) 0 ($8,603) 12 LOCAL PRODUCTION 0 0 0 0 0 0 $0.0000 $ $ $ $0 $ $0 0 $0
MONTHLY SUBTOTAL I 1,566,656 1 11 I $22,s12,905 I 1,6oz,97s I F2,s12,905 ■
QUARTERLY TOTAL I 3,693,031 I I t28,743,6so I 3,760,520 I '!28,743,680 I 7.644

cause No. 37366-GCA151 Petitioner's ilooTit.titi~oon, Schedules
~fufilfr™Nf ~~ES - DEMAND Page 2 of 2 00-Jan-00
26,876,059.62 26,876,060
December 2020
Tied Outw/ JE 01,0035, Purchased Gas JE I Miifrii Line Total ..N9,, DEMAND TGT MGT TETCO Other Billing
(A) (B) (E) (F) (H)
l ASSET MANAGER $ 572,059 $ $ 6,085 $ $578,144 2 ASSET MANAGER - UTIUZATION FEE $ $ $ ($25,000) ($25,000) 3 ASSET MANAGER - TGT NNS OVERRUN $ $ $ $0 $0 4 ASSET MANAGER - VALUE SHARING CREDIT $ $ $ $0 $0 5 ASSET MANAGER - PIPEUNE VARIABLE COSTS $ $ $ $0 $0 6 OHIO VALLEY HUB $ $ $ $ 23,901 $23,901
TOTALf $577,04 ••
January 2021
I Tied Out w/ JE 01,0035, Purchased Gas JE iliili-11 Line Total
..N9,, DEMAND !fil .Mfil illQQ other Billing (A) (B) (E) (F) (HJ
l ASSET MANAGER $572,059 $0 $6,085 $0 $578,144 2 ASSET MANAGER - UTILIZATION FEE $0 $0 $0 ($25,000) ($25,000) 3 ASSET MANAGER - TGT NNS OVERRUN $0 $0 $0 $0 $0 4 ASSET MANAGER - VALUE SHARING CREDIT $0 $0 $0 $0 $0 5 ASSET MANAGER - PIPELINE VARIABLE COSTS $0 $0 $0 $0 $0 6 OHIO VALLEY HUB $0 $0 $0 $23,901 $23,901
TOTALf $577,04-■
February 2021
I Tied Out w/ JE 01.0035, Purchased Gas JE I 11111-11 Line Total
..N9,, DEMAND TGT MGT illQQ Other Billing (A) (B) (E) (F) (HJ
l ASSET MANAGER $516,698 $0 $6,020 $0 $522,718 2 ASSET MANAGER - UTIUZATION FEE $0 $0 $0 $ (25,000) ($25,000) 3 ASSET MANAGER - TGT NNS OVERRUN $0 $0 $0 $0 $0 4 ASSET MANAGER - VALUE SHARING CREDIT $0 $0 $0 $0 $0 5 ASSET MANAGER - PIPEUNE VARIABLE COSTS $0 $0 $0 $0 $0 6 OHIO VALLEY HUB $0 $0 $0 $21,588 $21,588
TOTALf $519,3061111

Cause No. 37366-GCA151 Pl;it. '~msth WACOG DETAILS Deeember-20 e 191¥rfilb 8s OF GAS DETAILS Page 1 r,.f 1
Attachr.mHl!b!!i • .ETs-lruppLEMENT
December 2020 Janua!}:'. 2021 February 2021 Total GCA 151 Line Average No. Supplier Volume Price Extension Volume Price Extension Volume Price Extension Volume Price Extenslor{
TGT AREA: FIXED - SHORT TERM EXELON 325,500 $ 3,0548 $ 994,325 325,500 $ 3,0548 $ 994,325 294,000 $ 3,0548 $ 898,100 945,000 $ 3.0548 $ 2,886,750 INDEXED - FIRST OF MONTH EXELON $ $ $ $ $ $ $ $ DELIVERED EXELON 9,000 $ 2.8500 $ 25,650 $ $ 151,334 $ 26.2133 $ 3,966,962 160,334 $ 24.9018 $ 3,992,612
4 INDEXED - DAILY EXELON 645,894 $ 2.4202 $ 1,563,193 666,221 $ 2.5102 $ 1,672,350 582,146 $ 12.9495 $ 7,538,516 1,894,261 $ 5.6877 $ 10,774,059
5 INDEXED - MIXED TGT Cash-Outs $ $ $ $ $ $ $ $ 6 FIXED - LONG TERM BP Canada $ $ $ $ $ $ $ $ 7 FIXED - LONG TERM BoA / Merrill Lych 38,750 $ 4.5980 $ 178,173 38,750 $ 4.5980 $ 178,173 34,690 $ 4.5966 $ 159,454 112,190 $ 4.5976 $ 515,799
OTHER Asset Manager Supplier Reservation Cost $ $ $ $ $ $ $ $
OTHER Asset Manager Delivery Service Variables $ $ 37,071 $ $ 37,751 $ $ 33,416 $ $ 108,238 10 TOTAL COMMODITY 1,019,144 $ 2.7458 $ 2,798,412 1,030,471 $ 2.7974 $ 2,882,599 1,062,170 $ 11.8592 $ 12,596,447 3,111,785 $ 5,8736 $ 18,277,458
11 DEMAND $ $ 572,059 $ $ 572,059 $ $ 516,698 $ $ 1,660,815
12 TOTALPEPL 1,019,144 $ 3.3072 $ 3.370,470 1,030,471 $ 3.3525 $ 3,454,657 1,062,170 $ 12.3456 $ 13,113,145 3,111,785 $ 6.4073 $ 19,938,273
ANRAREA: 13 DELIVERED EXELON $ $ $ $ 158,500 $ 26.0933 $ 4,135,783 158,500 $ 26.0933 $ 4,135,783
MGT AREA: 14 DELIVERED EXELON $ $ $ $ 195,095 $ 27.7294 $ 5,409,869 195,095 $ 27.7294 $ 5,409,869 15 INDEXED - MIXED MGT Cash-Outs $ $ 1,589 $ $ $ $ (2,284) $ $ (695) 16 OTHER Asset Manager Supplier Reservation Cost $ $ $ $ $ $ $ $ 17 OTHER Asset Manager Delivery Service Variables $ $ $ $ $ $ $ $
18 TOTAL COMMODITY $ $ 1,589 $ $ 353,595 $ 26.9895 $ 9,543,368 353,595 $ 26,9940 $ 9,544,956
19 DEMAND $ $ $ $ $ $ $ $
20 TOTALANR $ $ 1,589 $ $ 353,595 $ 26.9895 $ 9,543,368 353,595 $ 26,9940 $ 9,544,956
TGT NNS AREA: 21 FIXED - SHORT TERM EXELON $ $ $ $ $ $ 22 INDEXED - FIRST OF MONTH EXELON $ $ $ $ $ $ 23 INDEXED - DAILY EXELON $ $ $ $ $ $ $
24 STORAGE TGT No~Notice Storage 55,335 $ 2.3640 $ 130,812 8,768 $ 2.5610 $ 22,455 71,571 $ 2,7640 $ 197,822 135,674 $ 2.5877 $ 351,089 25 STORAGE Asset Manager Delivery Service Variables $ $ 3,007 $ $ 483 $ $ 7,192 $ $ 10,682 26 TOTAL COMMODITY 55,335 $ 2.4183 $ 133,819 8,768 $ 2.6161 $ 22,938 71,571 $ 2.8645 $ 205,014 135,674 $ 2.6665 $ 361,771
27 DEMAND $ $ $ $ $ $ $ $
28 TOTALTGT 55,335 $ 2.4183 $ 133,819 8,768 $ 2.6161 $ 22,938 71,571 $ 2.8645 $ 205,014 135,674 $ 2.6665 $ 361,771
TETCO AREA: 29 FIXED - SHORT TERM $ $ $ $ $ $ $ $ 30 INDEXED - FIRST OF MONTH EXELON Invoice (Gas Cost Summary tab) 3,193 $ 2.7700 $ 8,845 3,193 $ 2.2700 $ 7,248 2,884 $ 2.6400 $ 7,614 9,270 $ 2.5573 $ 23,706 31 INDEXED - DAILY Asset Manager 3,090 $ 2.4354 $ 7,525 515 $ 2.3710 $ 1,221 11,830 $ 5,5294 $ 65,413 15,435 $ 4.8046 $ 74,159 32 INDEXED - MIXED TETCO Cash-Outs $ $ 14,446 $ $ 35,271 $ $ (8,603) $ $ 41,114 33 OTHER Asset Manager Suppller Reservation Cost $ $ $ $ $ $ 34 OTHER Asset Manager Delivery Service Varlables $ $ 2,445 $ $ 1,443 $ $ 5,733 $ $ 9,622 35 TOT AL COMMODITY 6,283 $ 5.2938 $ 33,261 3,708 $ 12.1855 $ 45,184 14,714 $ 4.7680 $ 70,157 24,705 $ 6.0150 $ 148,601
36 DEMAND $ $ 6,085 $ $ 6,085 $ $ 6,020 $ $ 18,190
37 TOTAL TETCO 6,283 $ 6.2623 $ 39,346 3,708 $ 13,8265 $ 51,269 14,714 $ 5.1772 $ 76,177 24,705 $ 6.7513 $ 166,792
MISCELLANEOUS: 38 FIXED - SHORT TERM $ $ $ $ $ $ $ $ 39 INDEXED - MIXED Transportation Customer Cash Outs 9,434 $ (0.4155) $ (3,920) (6,768) $ 6,6174 $ (44,787) 64,606 $ 5,8520 $ 378,069 67,271 $ 4.8960 $ 329,362 40 INDEXED - MIXED Gas Hedging $ $ 810 $ $ 60,870 $ $ $ $ 61,680
41 OTHER Local Production $ $ $ $ $ $ 19,850 $ $ 19,850
42 TOTAL COMMODITY 9,434 $ (0,3296) $ (3,110) (6,768) $ (2.3763) $ 16,083 64,606 $ B.1592 $ 397,919 67,271 $ 6.1080 $ 410,892
43 DEMAND $ $ (1,099) $ $ (1,099) $ $ (3,412) $ $ (5,610)
44 TOTAL MISCELLANEOUS 9,434 $ (0.4461) $ (4,209) (6,768) $ (2.2139) $ 14,984 64,606 $ 6.1064 $ 394,507 67,271 $ 6.0246 $ 405,282
TOTAL COMPANY: 45 FIXED - SHORT TERM 325,500 $ 3.0548 $ 994,325 325,500.00 $ 3.0548 $ 994,325 294,000 $ 3.0548 $ 898,100 945,000 $ 3.0548 $ 2,886,750 46 FIXED - LONG TERM 38,750 $ 4.5980 $ 178,173 38,750.00 $ 4.5980 $ 178,173 34,690 $ 4.5966 $ 159,454 112,190 $ 4.5976 $ 515,799 47 INDEXED - DAILY 648,984 $ 2.4203 $ 1,570,718 666,736.00 $ 2,5101 $ 1,673,571 593,976 $ 12.8017 $ 7,603,928 1,909,696 $ 5.6806 $ 10,848,218 48 INDEXED - FIRST OF MONTH 3,193 $ 2.7700 $ 8,845 3,193.00 $ 2.2700 $ 7,248 2,884 $ 2.6400 $ 7,614 9,270 $ 2,5573 $ 23,706
49 INDEXED - MIXED 9,434 $ 1.3701 $ 12,925 (6,768.09) $ (7.5877) $ 51,354 64,606 $ 5,6834 $ 367,182 67,271 $ 6.4138 $ 431,461 50 DELIVERED 9,000 $ 2.8500 $ 25,650 $ $ 504,929 $ 26,7614 $ 13,512,613 513,929 $ 26.3427 $ 13,538,263 51 STORAGE 55,335 $ 2.4183 $ 133,819 8,768.00 $ 2.6161 $ 22,938 71,571 $ 2,8645 $ 205,D14 135,674 $ 2.6665 $ 361,771 52 OTHER $
2.7~88 ii 39,517 $ 2.8632 ii 39,194 $ ii 58,999 $ $ 137,710
53 TOTAL COMMODITY 1,090,196 $ 2,963,971 1,036,179 $ 2,966,804 1,566,656 $ 14.5615 22,812,905 3,693,030 $ 7.7832 $ 28,743,679
55 TOTAL DEMAND $ $ 577,045 $ $ 577,045 $ $ 519,306 $ $ 1,673,395
56 TOTAL COMPANY 111,090,196 $ 3.2481 11 3,541,016 111,036,179 $ 3.4201 11 3,543,848 a 1.566.656 s 14.8930 11 23,332,211 3,693,030 $ 8.2363 $ 30,417,075 0 $ 0 $ (0) (0) $ (0)
$ $ $

Cause No. 37366-GCA151
Financial Close Month Mar-21
Petitioner's Exhibit No. 1 Attachment KJT-2
VECTREN SOUTH ACTUAL COST OF GAS INJECTED INTO AND WITHDRAWN FROM STORAGE
For The Period December 2020 Through February 2021
Actual Changes in Storage Rates Actual Gas Cost
(Injected) Withdrawn
Month illb. illb. (Column A) (B)
December 2020
Company 24,865 579,152
Free Gas 1,138 580,290
January 2021
Company 8,448 1,009,278
February 2021
Company 40,484 550,720
Total 73,797 2,140,288
Net (Injection) Withdrawal
Dth (C)
604,011 I 1,138
605,155 -1,011,126 I m 591,204 I ,:s,
2,214,oss 1
Injected & Withdrawn
Demand (D)
Commodity (E)
$0.0000 1 $1.9260 I I Summer Strip Pricing
$0.0000 I $2.7550 I I Summer Strip Pricing
$0.0000 I $2.9240 I I Summer Strip Pricing
(Injected) & Withdrawn
~ (F)
$0
$0
$0
$0
~ (G)
$1,163,337 1m
$2,803,8351m
$1,728,680 ,m $s,69s,ss2 I
Schedule 10 Page 1 of 1

Petitioner's Exhibit No. 1 Attachment KJT-2
Cause No. 37366-GCA151 VECTREN SOUTH Schedule 11 DETERMINATION OF UNACCOUNTED FOR GAS
For The Period December 2020 Through February 2021
Line {A) {B) {C) {D) No. December 2020 January 2021 February 2021 TOTAL
{1) Total Dth of Purchased Gas Delivered 1,100,342 1,057.200 1,602,978 3,760,520
{2) Total Dth of Transport Gas Delivered by Pipeline
{a) Cash Outs (9,434) 6,768 (64,606) (67,271) {b) Customer Transp. Deliveries 2,623,218 2.273,308 2,075,603 6,972,129 {c) Total Transported Gas Delivered (Line 2a + Line 2t 2,613,784 2,280,076 2,010,997 6,904,858
{3) Total Dth of Gas (Injected Into)/ Withdrawn From Storage
{a) From Storage (Schedule 10 Col. C) 605,155 1,017,726 591,204 2,214,085 {b) Third Party Storage Activity (7,874) 1.671 6,882 679 {c) Total Dth of Gas (Injected Into) / Withdrawn 597,281 1,019,397 598,086 2,214.764
from Storage
{4) Total Dth of Local Production Gas Delivered Q Q Q Q
{5) Total Dth of Other Gas Injected Into/Withdrawn From System
{a) Gas Loss - Facilities Damage Rpt. 0 0 0 Q {b) Gas Usage Not Billed Due to NONR (34) (70) (104) .C2.QID {c) Total Dth of Other Gas (Injected Into) / Withdrawr 00 .(ZQ). (104) (208)
from Storage
{6) Total Dth of Gas Available (L 1 + L 2c + L 3c + L 4 + L 5) 4.311.373 4.356.603 4,211.957 12,879,934
{7) Total Dth of Gas Sold 1,755,226 2,030,794 2,225,816 6,011,836 (Sch. 6 Line 1)
{8) Total Dth of Gas Transported to Customers
{a) Rate Class 125 46,268 50,896 43,773 140,937 (b) Rate Class 145 196,851 209,239 244,397 650.487 {c) Rate Class 160 472,614 492,153 480,678 1,445,445 {d) Rate Class 170 1,872,340 1,580,091 1,200,242 4,652,673 {e) Total Dth of Gas Transported to Customers 2,588,073 2,332,379 1,969,090 6,889,542
{9) Total Dth of Gas Delivered to Customers (Line 7 + Line Se) 4.343.299 4.363.173 4.194.906 12.901.378
{10) Unaccounted For Gas {a) Total Dth of Unaccounted For Gas
(Line 6 - Line 9) (31.926) (6,570) 17,052 (21.444)
{11) Percentage of Unaccounted for Gas (Line 10(a) / Line 6) -0,70% -0.20% 0.40% -0,20%
lll~C!I lll~m■ 11m~1 Line (6) Tied Out w/ JE 01.0037, Unbilled JE, Sch 1
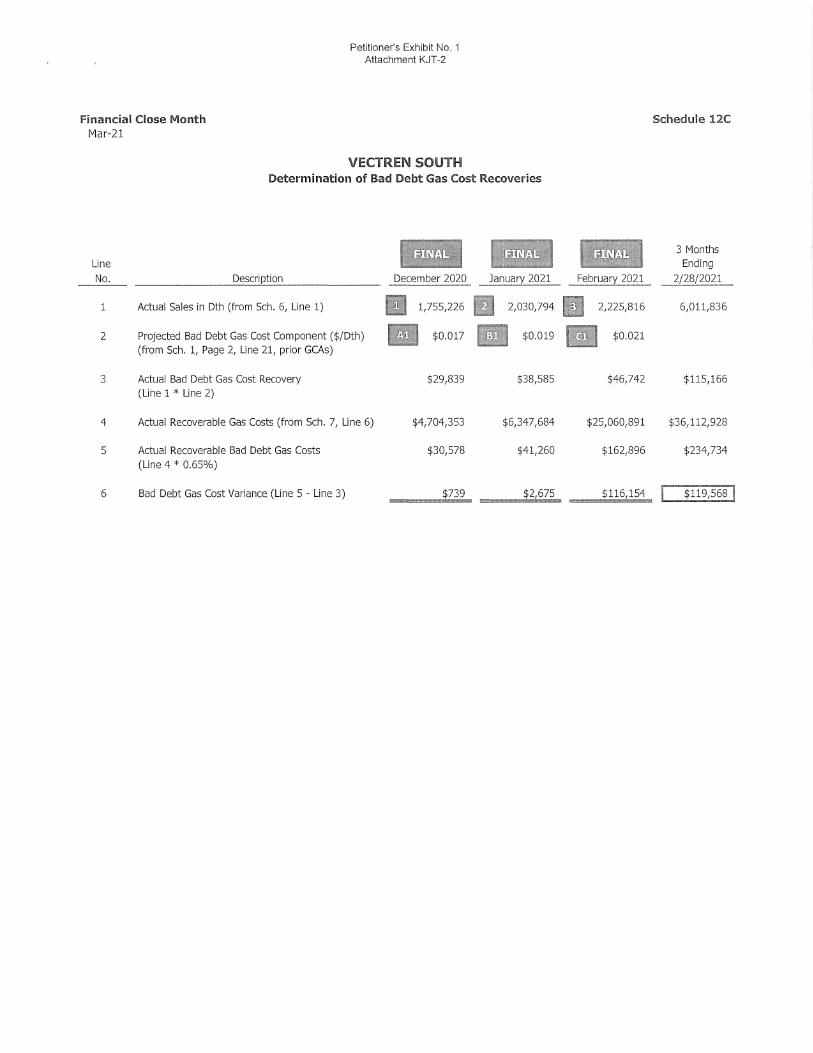
Financial Close Month Mar-21
Petitioner's Exhibit No. 1 Attachment KJT-2
VECTREN SOUTH Determination of Bad Debt Gas Cost Recoveries
Line ii!Mii -;um, No. DescriEtion December 2020 January 2021
1 Actual Sales in Dth (from Sch. 6, Line 1) II 1,755,226 II 2,030,794
2 Projected Bad Debt Gas Cost Component ($/Dth) II $0.017 Ill $0.019 (from Sch. 1, Page 2, Line 21, prior GCAs)
3 Actual Bad Debt Gas Cost Recovery $29,839 $38,585 (Line 1 * Line 2)
4 Actual Recoverable Gas Costs (from Sch. 7, Line 6) $4,704,353 $6,347,684
5 Actual Recoverable Bad Debt Gas Costs $30,578 $41,260 (Line 4 * 0.65%)
6 Bad Debt Gas Cost Variance (Line 5 - Line 3) $739 $2,675
Schedule 12C
NIUMI 3 Months Ending
February 2021 2/28/2021
II 2,225,816 6,011,836
Ill $0.021
$46,742 $115,166
$25,060,891 $36,112,928
$162,896 $234,734
$116,154 $119,5681

Petitioner's Exhibit No. 1 Attachment KJT-2
Cause No. 37366-GCA151
Line No.
1
2
3
4
5
6
7
8
9
10
11
12
12a 12b 12c
CEI SOUTH INITIATION OF REFUND
Refunds to be Included in the GCA FOR THE PERIOD AUGUST 2021 THROUGH OCTOBER 2021
Description:
Nomination and Balancing Charges
Pipeline Refunds
Total to be Refunded
Distribution of Refunds to GCA Quarters (A) Sales Percentage
Quarter All Rate Classes (Schedule 2)
August 2021 - October 2021 7.129%
November 2021 - January 2022 50.000%
February 2022 - April 2022 36.930%
May 2022 - July 2022 5.941%
100.000%\
!Calculation Of Refunds To Be Returned In This GCA
Cause No. 37366-GCA 148
Cause No. 37366-GCA149
Cause No. 37366-GCA 150
Refunds from this GCA (Schedule 12A, Line 4)
Total to be Refunded in This Cause
August 2021 Refund (Line 12 / Sch. 2 Sales) September 2021 Refund (Line 12 / Sch. 2 Sales) October 2021 Refund (Line 12 / Sch. 2 Sales)
Schedule 12A
Amount of Refund I
$0
$0
$0 I
(B)
Refund (Line 2 * A)
$0
$0
$0
$0
$0 I
$0
$0
$0
$0
$0 I
$0 $0 $0

Cause No. 37366-GCA151
Line
No. Rate Class Description
Petitioner's Exhibit No. 1 Attachment KJT-2
CEI SOUTH RECONCILIATION OF DEMAND VARIANCE
Demand
I Demand I
Variance Variance 50% Sales 50% Fixed / mo
(A) (B) Demand Variance: (Over) Under Recovery (Schedule 6, Line 11 a)
(a) December 2020 $3,898 $0 (b) January 2021 ($90,874) $0 (c) February 2021 ($231,791) ($231,791)
2 TOTAL ($318,767) ($231,791)
Distribution Of Demand Variances To Quarters
Demand
I Variance
Total (C) = (A)+(B)
$3,898 ($90,874)
($463,581)
($550,557)
Quarter Col A= Line 2 * Quarter! Sales Percenta es, Sch. 2 ; Col B = Line 2 / 4
3
4
5
6
7
8
9
10
11
12
13
13a 13b 13c
August 2021 - October 2021
November 2021 - January 2022
February 2022 - April 2022
May 2022 - July 2022
Total Demand Variance
($22,725)1 ($57,948)1
($159,383)1 ($57,948)1
($111,120) 1 ($57,948)1
($18,938)1 ($57,948)1
($318,766) 1 ($231,791)1
Calculation Of Demand Variances For This Cause
Cause No. 37366-GCA 148 (Sch. 12B (pg 1 of 2), Line 6) $3,134 $0
Cause No. 37366-GCA149 (Sch. 12B (pg 1 of 2), Line 5) $10,474 $0
Cause No. 37366-GCA150 (Sch. 12B (pg 1 of 2), Line 4) ($20,915) $0
Variance from this GCA (Sch. 12 B (pg 1 of 2), Line 3) ($22,725) ($57,948)
Total Demand Variances to be Included in GCA ($30,032)1 ($57,948)1
Adjusted Total Demand Variance to be included in GCA (Line 12) ($30,032)1 ($57,948)1
August 2021 Variance (Line 13 / Sch. 2 Sales) ($6,207) ($19,316) September 2021 Variance (Line 13 / Sch. 2 Sales) ($10,611) ($19,316) October 2021 Variance (Line 13 / Sch. 2 Sales) ($13,214) ($19,316)
Note: Lines 13a-13C Col A= Line 13 * Quarterly Sales Percentages, Sch. 2 Col B = Line 13 / 3
($80,673)
($217,331)
($175,668)
($76,886)
($550,557)
$3,134
$10,474
($20,915)
($80,673)
($87,980)1
($87,980)1
($25,522) ($29,927) ($32,530)
Schedule 12B Page 1

Petitioner's Exhibit No. 1 Attachment KJT-2
Cause No. 37366-GCA151
Line
No.
2
CEISOUTH RECONCILIATION OF COMMODITY VARIANCE
Rate Class Descriotion
Commodity Variance: (Over) Under Recovery (Schedule 6, Line 11 b)
(a) December 2020 (b) January 2021 (c) February 2021 (d) LIFO Adjustment (e) Bad Debt Gas Cost Adjustment Dec. & Jan. (from Sch. 12C, L 6) (f) Bad Debt Gas Cost Adjustment - February 2021 (from Sch. 12C, L 6)
(g) Bad Debt Gas Cost Adjustment - LIFO Adjusted
TOTAL
Commodity Variance
50% Sales
(A)
($14,405) $325,292
$9,134,225 $742,254
$3,414 $58,077
$4,824
$10,253,681 I Distribution Of Commodity Variance To Quarters
Commodity Variance
50% Fixed oer Month
(B)
$0 $0
$9,134,225 $0 $0
$58,077 $0
$9,192,302 I
Commodity Variance
Total
(C) = (A)+(B)
Schedule 12B Page 2
($14,405) $325,292
$18,268,450 $742,254
$3,414 $116,154
$4,824
$19,445,983
Quarter Col A = Line 2 * Quarter! Sales Percenta es, Sch. 2 ; Col B = Line 2 / 4
3 August 2021 - October 2021 $730,985 $2,298,076 $3,029,061
4 November 2021 - January 2022 $5,126,841 $2,298,076 $7,424,917
5 February 2022 -April 2022 $3,786,684 $2,298,076 $6,084,760
6 May 2022 - July 2022 $609,171 $2,298,076 $2,907,247
7 Total Commodity Variance $10,253,681 $9,192,302 I $19,445,983 1
Calculation Of Commodity Variance For This Cause
Cause No. 37366-GCA 148 8 (Sch 12B (pg 2 of 2) , Line 6) ($12,278) $0 ($12,278)
Cause No. 37366-GCA149 9 (Sch 12B (pg 2 of 2) , Line 5) $26,610 $0 $26,610
Cause No. 37366-GCA 150 10 (Sch 12B (pg 2 of 2), Line 4) ($435) $0 ($435)
Variance from this GCA 11 (Sch 12B (pg 2 of 2) , Line 3) $730,985 $2,298,076 $3,029,061
12 Total Commodity Variance to be Included in GCA $744,ss2 I $2,29s,o76 I $3,042,958 I
13 Adjusted Total Commodity Variance to be included in GCA (Line 12) $744,ssz I $2,2ss,07s 1 $3,042,sss 1
13a August 2021 Variance (Line 13 / Sch. 2 Sales) $153,942 $766,025 $919,967 13b September 2021 Variance (Line 13 / Sch. 2 Sales) $263,192 $766,025 $1,029,217 13c October 2021 Variance (Line 13 / Sch. 2 Sales) $327,748 $766,025 $1,093,773
Note: Lines 13a-13C Col A = Line 13 * Quarterly Sales Percentages, Sch. 2 Col B = Line 13 / 3

Cause No. 37366-GCA151
Petitioner's Exhibit No. 1 Attachment KJT-2
CEI SOUTH
TABLE NO.1 Effects of
Estimated GCA v. Currently Effective GCA For Residential Customers
Bill At Bill At Currently Dollar
Consumption Estimated Effective Increase 0th GCA GCA (Decrease)
5 $79.49 $58.20 $21.29
10 $132.28 $89.70 $42.58
15 $185.08 $121.21 $63.87
20 $237.87 $152.71 $85.16
25 $290.67 $184.22 $106.45
Estimated GCA v. Currently Effective GCA Currently
Estimated Approved Customer Service Charge $11.00 $11.00 Commodity Charge Block 1 $1.620 $1.620 Commodity Charge Block 2 $1.302 $1.302 USF Rider (Eff. 10/1/20) $0.041 $0.041 EEFC (Eff. 5/6/21) $0.1605 $0.1605 SRC (Eff. 5/6/21) $0.1507 $0.1507 CSIA (Eff. 1/21/21) $14.100 $14.100 GCA150 $8.905 $4.647
TABLE NO. 2
Effects of Estimated GCA v. Prior Year Effective GCA
For Residential Customers
Bill At Bill At Prior Year Dollar
Consumption Estimated Effective Increase Dth GCA GCA (Decrease)
5 $79.49 $54.75 $24.74
10 $132.28 $82.79 $49.50
15 $185.08 $110.82 $74.26
20 $237.87 $138.86 $99.01
25 $290.67 $166.90 $123.77
Estimated GCA v. Prior Year Effective GCA Prior Year
Estimated Approved Customer Service Charge $11.00 $11.00 Commodity Charge Block 1 $1.620 $1.620 Commodity Charge Block 2 $1.302 $1.302 USF Rider (Eff. 10/1/20) $0.041 $0.0390 EEFC (Eff. 5/6/21) $0.1605 $0.1407 SRC (Eff. 5/6/21) $0.1507 $0.1388 CSIA (Eff. 1/21/21) $14.1000 $14.1200 GCA 147 $8.905 $3.987
Schedule 14 Page 1 of4
Percent Increase
(Decrease)
36.58%
47.47%
52.69%
55.76%
57.78%
Percent Increase
(Decrease)
45.19%
59.79%
67.00%
71.30%
74.16%
"-

Cause No. 37366-GCA151
Petitioner's Exhibit No. 1 Attachment KJT-2
CEI SOUTH
TABLE NO. 2 A
Effects of
Schedule 14 Page 2 of 4
Estimated August 2021 v. Prior Year Effective GCA For Residential Customers
Bill At Bill At Prior Year Dollar Percent
Consumption Estimated Effective Increase Increase Dth GCA GCA (Decrease) (Decrease)
5 $89.61 $54.30 $35.31 65.02%
10 $152.53 $81.90 $70.64 86.25%
15 $215.45 $109.49 $105.97 96.78%
20 $278.37 $137.08 $141.29 103.07%
25 $341.30 $164.67 $176.62 107.26%
Estimated August 2021 v. Prior Year Effective GCA Prior Year
Estimated Approved Customer Service Charge $11.00 $11.00 Commodity Charge Block 1 $1.620 $1.620 Commodity Charge Block 2 $1.302 $1.302 USF Rider (Eff. 10/1 /20) $0.041 $0.038 EEFC (Eff. 5/6/21) $0.1605 $0.1407 SRC (Eff. 5/6/21) $0.1507 $0.1388 CSIA (Eff. 1/21/21) $14.1000 $14.1200
Aug-21 $10.930 $3.899

Cause No. 37366-GCA151
Petitioner's Exhibit No. 1 Attachment KJT-2
GEi SOUTH
TABLE NO. 2 B
Effects of
Schedule 14 Page 3 of 4
Estimated September 2021 v. Prior Year Effective GCA For Residential Customers
Bill At Bill At Prior Year Dollar Percent
Consumption Estimated Effective Increase Increase 0th GCA GCA (Decrease) (Decrease)
5 $78.87 $55.86 $23.00 41.18%
10 $131.04 $85.02 $46.03 54.14%
15 $183.22 $114.17 $69.05 60.48%
20 $235.39 $143.32 $92.07 64.24%
25 $287.57 $172.47 $115.10 66.73%
Estimated September 2021 v. Prior Year Effective GCA Prior Year
Estimated Approved Customer Service Charge $11.00 $11.00 Commodity Charge Block 1 $1.620 $1.620 Commodity Charge Block 2 $1.302 $1.302 USF Rider (Eff. 10/1/20) $0.041 $0.038 EEFC (Eff. 5/6/21) $0.1605 $0.1407 SRC (Eff. 5/6/21) $0.1507 $0.1388 CSIA (Eff. 1/21/21) $14.100 $14.1200
Sep-21 $8.781 $4.211

Cause No. 37366-GCA151
Petitioner's Exhibit No. 1 Attachment KJT-2
CEI SOUTH
TABLE NO. 2 C
Effects of
Schedule 14 Page 4 of 4
Estimated October 2021 v. Prior Year Effective GCA For Residential Customers
Bill At Bill At Prior Year Dollar Percent
Consumption Estimated Effective Increase Increase Dth GCA GCA (Decrease) (Decrease)
5 $75.59 $54.38 $21.21 39.00%
10 $124.49 $82.06 $42.44 51.72%
15 $173.39 $109.73 $63.67 58.02%
20 $222.29 $137.40 $84.89 61.79%
25 $271.20 $165.07 $106.12 64.29%
Estimated October 2021 v. Prior Year Effective GCA Prior Year
Estimated Approved Customer Service Charge $11.00 $11.00 Commodity Charge Block 1 $1.620 $1.620 Commodity Charge Block 2 $1.302 $1.302 USF Rider (Eff. 10/1/20) $0.041 $0.041 EEFC (Eff. 5/6/21) $0.1605 $0.1407 SRC (Eff. 5/6/21) $0.1507 $0.1388 CSIA (Eff. 1/21/21) $14.1000 $14.1200
Oct-21 $8.126 $3.912
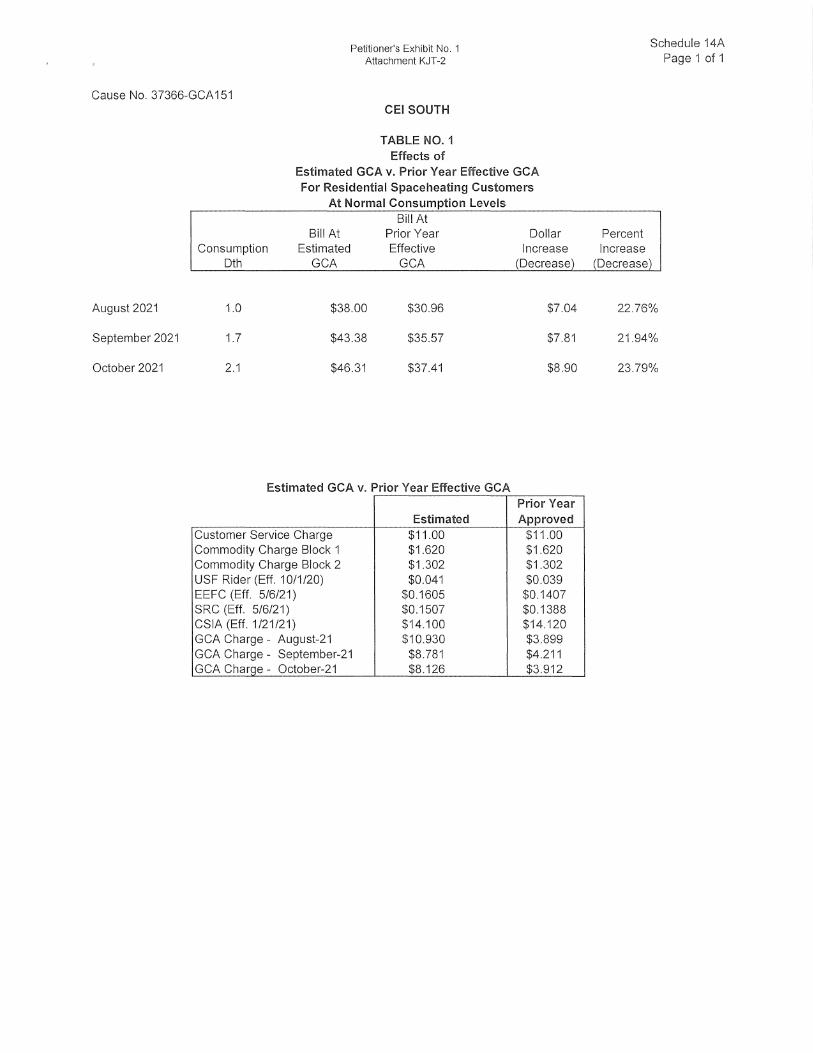
Petitioner's Exhibit No. 1 Attachment KJT-2
Cause No. 37366-GCA151
August 2021
September 2021
October 2021
CEI SOUTH
TABLE N0.1 Effects of
Estimated GCA v. Prior Year Effective GCA For Residential Spaceheating Customers
At Normal Consumption Levels Bill At
Bill At Prior Year Dollar Consumption Estimated Effective Increase
Dth GCA GCA (Decrease)
1.0 $38.00 $30.96 $7.04
1.7 $43.38 $35.57 $7.81
2.1 $46.31 $37.41 $8.90
Estimated GCA v. Prior Year Effective GCA Prior Year
Estimated Approved Customer Service Charge $11.00 $11.00 Commodity Charge Block 1 $1.620 $1.620 Commodity Charge Block 2 $1.302 $1.302 USF Rider (Eff. 10/1 /20) $0.041 $0.039 EEFC (Eff. 5/6/21) $0.1605 $0.1407 SRC (Eff. 5/6/21) $0.1507 $0.1388 CSIA (Eff. 1/21/21) $14.100 $14.120 GCA Charge - August-21 $10.930 $3.899 GCA Charge - September-21 $8.781 $4.211 GCA Chan:ie - October-21 $8.126 $3.912
Percent Increase
Schedule 14A Page 1 of 1
(Decrease)
22.76%
21.94%
23.79%

Cause No. 37366-GCA151
Petitioner's Exhibit No. 1 Attachment KJT-3
CEISOUTH DETERMINATION OF GAS COST ADJUSTMENT (GCA)
WITH DEMAND COSTS ALLOCATED
FOR THE PERIOD AUGUST 2021 THROUGH OCTOBER 2021
Commodity and Other Line ESTIMATED COST OF GAS TO BE RECOVERED No.
Purchased Gas Costs (Schedule 3)
2 Contract Storage & Transportation Costs (Schedule 4)
3 Cost of Gas (lnj.)/With. From Storage (Schedule 5)
4 Total Estimated Gas Costs
5 Estimated Cost of Unaccounted For Gas [2]
6 Net Cost Of Gas To Be Recovered
I COMMODITY COSTS TO BE RECOVERED
7 CommodityVariance-(Schedule 128 (pg. 2 of2), Line 13)
8 1 /4 of Excess of NO I Above Authorized NO I
9 Commodity Variance per Dth of Sales ((Line 7 + Line 8)/Schedule 2 Sales)
10 Commodity Dollars to be Refunded (Schedule 12A, Line 12)
11 Commodity Refund Per Dth (Line 10/Schedule 2 Sales)
12 Commodity Gas Costs (Line 6)
13 Monthly Commodity Gas Costs Per Dth (Line 12/Schedule 2 Sales)
14 Total Commodity Cost Per Dth of Sales (Lines 9 + 11 + 13)
Demand [1] August-21 A B
$1,317,998 $2,284,122
$0 $0
$0 ($1,794,061)
$1 317,998 $490,061
N/A $4,411
$1,317,998 $490,061
$289,375
$0
$1.867
$0
$0.000
$490,061
$3.162
$5,029
[1] The Demand portion of Purchased Gas Costs and Contract Storage & Transportation Costs were determined by multiplying the quarterly sales quantities for each rate class by the per Dth costs listed on Schedule 1 A.
[2] For informational purposes only (Line 4 • 0.9%).
September-21 C
$2,550,849
$0
($1,730,336)
$820,513
$7,385
$820,513
$494,737
$0
$1.867
$0
$0.000
$820,513
$3.096
$4.963
October-21 D
$2,106,607
$0
($1,109,328)
$997,279
$8,976
$997,279
$616,088
$0
$1.867
$0
$0.000
$997,279
$3.022
$4.889
Schedule 1 Page 1 of3
$8,259,576
$0
($4,633,725)
$3,625,851 1
$20,772
$3,s2s,8s1 1
$1,400,200
$0
$0
$2,307,853
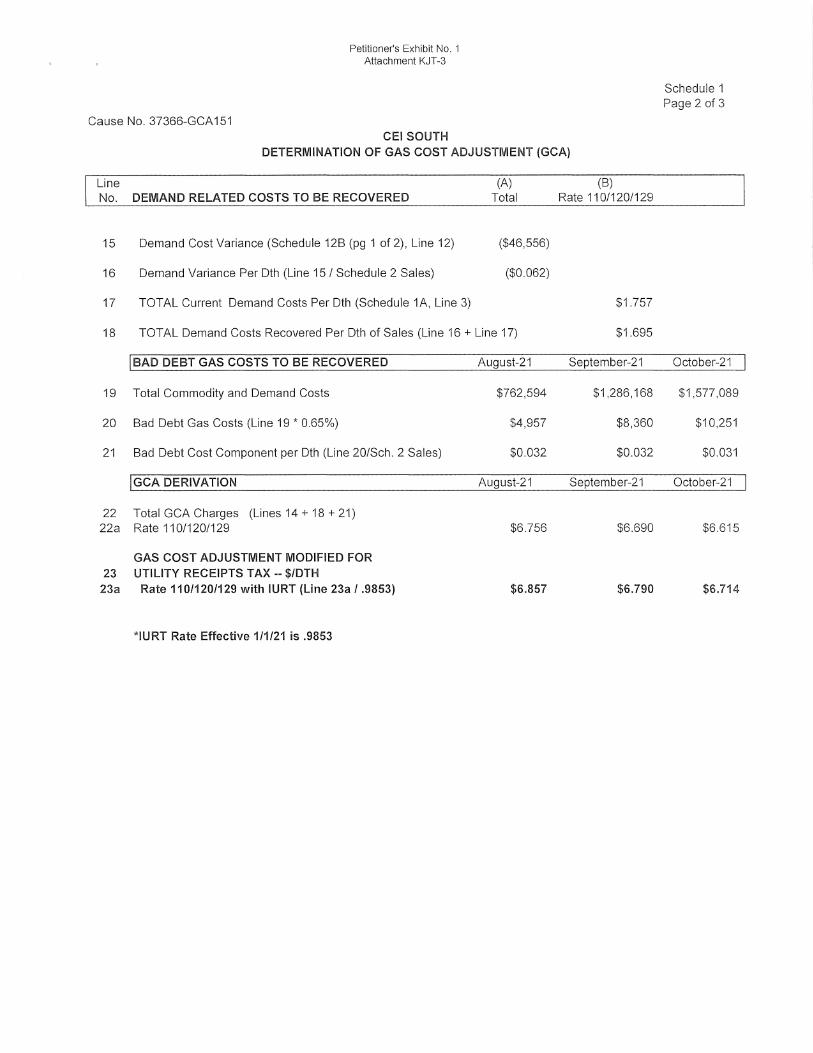
Cause No. 37366-GCA151
Petitioner's Exhibit No. 1 Attachment KJT-3
CEI SOUTH DETERMINATION OF GAS COST ADJUSTMENT (GCA)
Line (A) (B) No. DEMAND RELATED COSTS TO BE RECOVERED Total Rate 110/120/129
15 Demand Cost Variance (Schedule 12B (pg 1 of 2), Line 12) ($46,556)
16 Demand Variance Per 0th (Line 15 / Schedule 2 Sales) ($0.062)
17 TOTAL Current Demand Costs Per 0th (Schedule 1A, Line 3) $1.757
18 TOT AL Demand Costs Recovered Per 0th of Sales (Line 16 + Line 17) $1.695
I BAD DEBT GAS COSTS TO BE RECOVERED August-21 September-21
19 Total Commodity and Demand Costs $762,594 $1,286,168
20 Bad Debt Gas Costs (Line 19 * 0.65%) $4,957 $8,360
21 Bad Debt Cost Component per 0th (Line 20/Sch. 2 Sales) $0.032 $0.032
jGCA DERIVATION August-21 September-21
22 Total GCA Charges (Lines 14 + 18 + 21) 22a Rate 110/120/129 $6.756 $6.690
GAS COST ADJUSTMENT MODIFIED FOR 23 UTILITY RECEIPTS TAX --$/DTH
23a Rate 110/120/129 with IURT (Line 23a / .9853) $6.857 $6.790
*IURT Rate Effective 1/1/21 is .9853
Schedule 1 Page 2 of 3
October-21
$1,577,089
$10,251
$0.031
October-21
$6.615
$6.714
I

Cause No. 37366-GCA151
Petitioner's Exhibit No. 1 Attachment KJT-3
CEI SOUTH DETERMINATION OF GAS COST ADJUSTMENT (GCA)
FOR THE PERIOD AUGUST 2021 THROUGH OCTOBER 2021 ($/Dth)
Line No. Description Aug-21 Sep-21 24 Schedule 3 - Purchases 760,740 852,120
25 Schedule 5 - Storage (604,500) (585,000)
26 Total Gas Available for Sales 156,240 267,120
27 UAFG Percentage - 0.9% 0.9% 0.9%
28 UAFG Volumes 1,406 2,404
29 Average Commodity Price (Line 6 + Line 26) $ 3.137 $ 3.072
30 UAFG Costs [1] $ 4,411 $ 7,385
31 Schedule 2 Sales 155,000 265,000
32 UAFG Component (Line 30 + Line 31) [2] $ 0.028 $ 0.028
[1] Equals amount shown on Sch. 1, P1, LS. [2] For informational purposes only.
$
$
$
Schedule 1 Page 3 of 3
Oct-21 712,390
(379,750)
332,640
0.9%
2,994
2.998
8,976
330,000
0.027

Cause No. 37366-GCA151
Petitioner's Exhibit No. 1 Attachment KJT-3
CE\ SOUTH QUARTERLY ALLOCATION OF DEMAND COSTS
ESTIMATE OF DEMAND COST FOR THE PROJECTED GCA QUARTER
Line No. Description
1 August 2021 Monthly Demand Costs 2 Asset Management Fee (Credit)* 3 September 2021 Monthly Demand Costs 4 Asset Management Fee (Credit)* 5 October 2021 Monthly Demand Costs 6 Asset Management Fee (Credit)*
7 GCA Quarter (August, September, & October 2021) Demand Cost
GCA Quarter Demand
Cost
$441,922 ($50,417) $428,695 ($50,417) $598,632 ($50,417)
$1,317,998
*New Asset Management Agreement (AMA) begins April 1, 2021. Credit is $50,417 per month
!Derivation of Unit Demand Rate:! Rate 110 Rate 120
8 Projected Quarter Sales (Sch. 2) 485,000 265,000
9 Total Unit Demand Rate $1.757 $1.757
Schedule 1A Page 1 of 1
Total
750,000

Petitioner's Exhibit No. 1 Attachment KJT-3
Schedule 2 Page 1 of 1
Cause No. 37366-GCA151 CEI SOUTH
ESTIMATED SALES FOR THE TWELVE MONTHS ENDING JULY 2022
SUBJECT TO GCA
Sales Sales Sales Demand Not Subject Subject
Month/ Year Forecast ToGCA ToGCA Rate 110 Rate 120
Aug-21 155,000 155,000 100,000 55,000
Sep-21 265,000 265,000 170,000 95,000
Oct-21 330,000 330,000 215,000 115,000
Subtotal 750,000 0 750,000 485,000 26s,ooo I Nov-21 945,000 945,000 610,000 335,000
Dec-21 1,865,000 1,865,000 1,200,000 665,000
Jan-22 2,450,000 2,450,000 1,580,000 870,000
Subtotal 5,260,000 0 5,260,000 3,390,000 1,s?o,000 I Feb-22 1,950,000 1,950,000 1,260,000 690,000
Mar-22 1,315,000 1,315,000 850,000 465,000
Apr-22 620,000 620,000 400,000 220,000
Subtotal 3,885,000 0 3,885,000 2,510,000 1,37s,ooo I May-22 310,000 310,000 200,000 110,000
Jun-22 155,000 155,000 100,000 55,000
Jul-22 160,000 160,000 100,000 60,000
Subtotal 625,000 0 625,000 400,000 22s,ooo I Total 10,520,000 0 10,520,000 6,785,000 3,73s,ooo I
QUARTERLY PERCENTAGES BY RATE CLASS OF SALES SUBJECT TO GCA
Rate Rate Quarter Total Rate 110 Rate 120
August 2021 - October 2021 7.129% 7.148% 7.095%
November 2021 - January 2022 50.000% 49.963% 50.067%
February 2022 - April 2022 36.930% 36.993% 36.814%
May 2022 - July 2022 5.941% 5.896% 6.024%
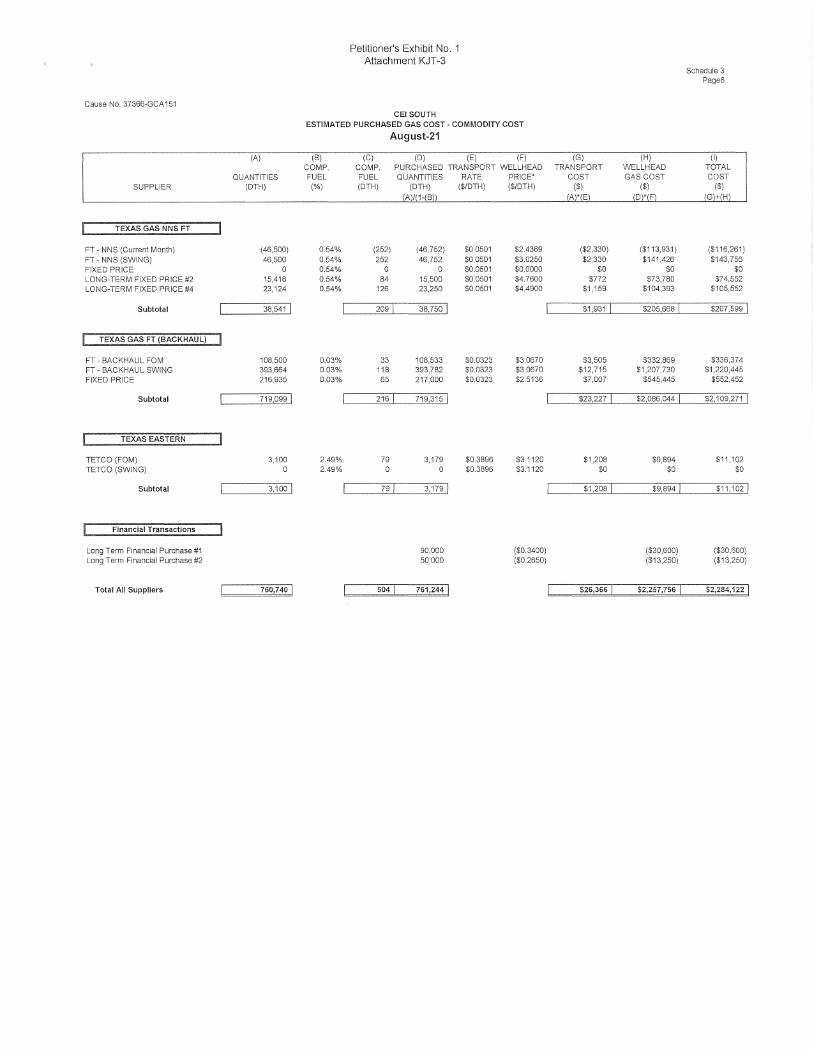
Cause No. 37366-GCA151
(A)
QUANTITIES SUPPLIER (DTH)
TEXAS GAS NNS FT
FT - NNS (Current Month) (46,500) FT - NNS (SWING) 46,500 FIXED PRICE 0 LONG-TERM FIXED PRICE#2 15,416 LONG-TERM FIXED PRICE #4 23,124
Subtotal 38,541 1
TEXAS GAS FT (BACKHAUL)
FT - BACKHAUL FOM 108,500 FT - BACKHAUL SWING 393,664 FIXED PRICE 216,935
Subtotal 719,099 I
TEXAS EASTERN
TETCO (FOM) 3,100 TETCO (SWING) 0
Subtotal 3,1001
Financial Transactions
Long Term Financial Purchase #1 Long Term Financial Purchase #2
Total All Suppliers 7so,140 I
Petitioner's Exhibit No. 1 Attachment KJT-3
GEi SOUTH ESTIMATED PURCHASED GAS COST - COMMODITY COST
August-21
(8) (C) (D) (E) (F) COMP. COMP. PURCHASED TRANSPORT WELLHEAD FUEL FUEL QUANTITIES RATE PRICE* (%) (DTH) (DTH) ($/DTH) ($/DTH)
(A)/(1-(8))
0.54% (252) (46,752) $0.0501 $2.4369 0.54% 252 46,752 $0.0501 $3.0250 0.54% 0 0 $0.0501 $0.0000 0.54% 84 15,500 $0.0501 $4.7600 0.54% 126 23,250 $0.0501 $4.4900
209 I 38,750 I
0.03% 33 108,533 $0.0323 $3.0670 0.03% 118 393,782 $0.0323 $3.0670 0.03% 65 217,000 $0.0323 $2.5136
2161 719,315 1
2.49% 79 3,179 $0.3896 $3.1120 2.49% 0 0 $0.3896 $3.1120
79 I 3,179 I
90,000 ($0.3400) 50,000 ($0.2650)
504 I 761,244 j
(G) (H) TRANSPORT WELLHEAD
COST GAS COST ($) ($)
(A)*(E) (D)'(F)
($2,330) ($113,931) $2,330 $141,426
$0 $0 $772 $73,780
$1,159 $104,393
$1,931 1 $205,668 1
$3,505 $332,869 $12,715 $1,207,730
$7,007 $545,445
$23,227 I $2,086,044 1
$1,208 $9,894 $0 $0
$1,208 I $9,894 1
($30,600) ($13,250)
$2s,3ss 1 $2,2s1,7ss I
Schedule 3 Page6
(I) TOTAL COST
($) (G)+(H)
($116,261) $143,756
$0 $74,552
$105,552
$207,599 j
$336,374 $1,220,445
$552.452
$2,109,271 1
$11,102 $0
$11,102 I
($30,600) ($13,250)
$2,2a4, 122 I

Cause No. 37366-GCA 151
(A)
QUANTITIES SUPPLIER (DTH)
TEXAS GAS NNS FT
FT- NNS (Current Month) (45,000) FT - NNS (SWING) 110,000 FIXED PRICE 0 LONG-TERM FIXED PRICE#2 14,919 LONG-TERM FIXED PRICE#4 22,379
Subtotal 102,298 I
TEXAS GAS FT (BACKHAUL)
FT - BACKHAUL FOM 105,000 FT - BACKHAUL SWING 431,885 FIXED PRICE 209,937
Subtotal 746,822 ! 24,894
TEXAS EASTERN
TETCO (FOM) 3,000 TETCO (SWING) 0
Subtotal 3,ooo I
Financial Transactions
Long Term Financial Purchase #1 Long Term Financial Purchase #2
Total All Suppliers 852,120 I
Petitioner's Exhibit No. 1 Attachment KJT-3
CEISOUTH ESTIMATED PURCHASED GAS COST- COMMODITY COST
September-21
(B) (C) (D) (E) (F) COMP. COMP. PURCHASED TRANSPORT WELLHEAD FUEL FUEL QUANTITIES RATE PRICE* (%) (DTH) (DTH) ($/DTH) ($/DTH)
(Al/(1-(B))
0.54% (244) (45,244) $0.0501 $2.4369 0.54% 597 110,597 $0.0501 $2.9960 0.54% 0 0 $0.0501 $0.0000 0.54% 81 15,000 $0.0501 $4.7600 0.54% 122 22,500 $0.0501 $4.4900
5551 102,853 I
0.03% 32 105,032 $0.0323 $3.0380 0.03% 130 432,015 $0.0323 $3.0380 0.03% 63 210,000 $0.0323 $2.5136
224 I 747,046 I
2.49% 77 3,077 $0.3896 $3.0580 2.49% 0 0 $0.3896 $3.0580
77! 3,077 I
90,000 ($0.3260) 50,000 ($0.2510)
8561 852,9761
(G) (HJ TRANSPORT WELLHEAD
COST GAS COST ($) ($)
(A)*(E) (D)*(F)
($2,255) ($110,255) $5,511 $331,349
$0 $0 $747 $71,400
$1,121 $101,025
$5,124 I $393,519 I
$3,392 $319,086 $13,950 $1,312,460
$6,781 $527,850
$24,123 I $2,159,396 I
$1,169 $9,408 $0 $0
$1,169 I $9,408 I
($29,340) ($12,550)
$30,416 ! $2,520,433 1
Schedule 3 Page1
(I) TOTAL COST
($) (G)+(H)
($112,510) $336,860
$0 $72,147
$102,146
$398,643 I
$322,478 $1,326,410
$534,631
$2,183,519 I
$10,577 $0
$10,577 I
($29,340) ($12,550)
$2,550,8491
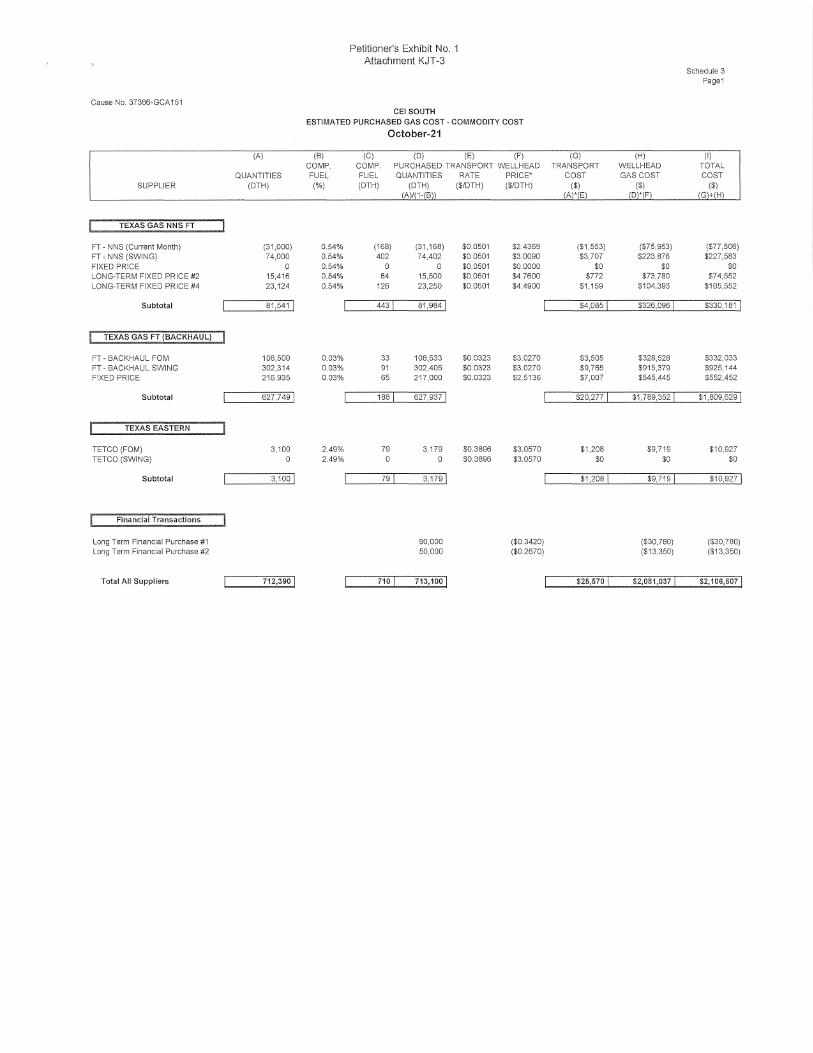
Petitioner's Exhibit No. 1 Attachment KJT-3
Schedule 3 Page1
Cause No. 37366-GCA151 CEI SOUTH
ESTIMATED PURCHASED GAS COST - COMMODITY COST
October-21
(A) (B) (C) (D) (E) (F) (G) (H) (I) COMP. COMP. PURCHASED TRANSPORT WELLHEAD TRANSPORT WELLHEAD TOTAL
QUANTITIES FUEL FUEL QUANTITIES RATE PRICE* COST GAS COST COST SUPPLIER (DTH) (%) (DTH) (DTH) ($/DTH) ($/DTH) ($) ($) ($)
(AV(1-/B)) (A)*/El /D)'(F) (G)+/Hl
TEXAS GAS NNS FT
FT - NNS (Current Month) (31,000) 0.54% (168) (31,168) $0.0501 $2.4369 ($1,553) ($75,953) ($77,506) FT - NNS (SWING) 74,000 0.54% 402 74,402 $0.0501 $3.0090 $3,707 $223,876 $227,583 FIXED PRICE 0 0.54% 0 0 $0.0501 $0.0000 $0 $0 $0 LONG-TERM FIXED PRICE #2 15,416 0.54% 84 15,500 $0.0501 $4.7600 $772 $73,780 $74,552 LONG-TERM FIXED PRICE #4 23,124 0.54% 126 23,250 $0.0501 $4.4900 $1,159 $104,393 $105,552
Subtotal 81,5411 4431 81,9841 $4,085 I $326,096 I $330,181 1
TEXAS GAS FT (BACKHAUL)
FT - BACKHAUL FOM 108,500 0.03% 33 108,533 $0.0323 $3.0270 $3,505 $328,528 $332,033 FT - BACKHAUL SWING 302,314 0.03% 91 302,405 $0.0323 $3.0270 $9,765 $915,379 $925,144 FIXED PRICE 216,935 0.03% 65 217,000 $0.0323 $2.5136 $7,007 $545,445 $552,452
Subtotal 627,749 I 1881 627,937 I $20,277 I $1,789,352 I $1,809,629 I
TEXAS EASTERN
TETCO (FOM) 3,100 2.49% 79 3,179 $0.3896 $3.0570 $1,208 $9,719 $10,927 TETCO (SWING) 0 2.49% 0 0 $0.3896 $3.0570 $0 $0 $0
Subtotal 3,1001 791 3,179 I $1,208 I $9,719 I $10,927 I
Financial Transactions
Long Term Financial Purchase #1 90,000 ($0.3420) ($30,780) ($30,780) Long Term Financial Purchase #2 50,000 ($0.2670) ($13,350) ($13,350)
Total All Suppliers 112,3so I 110 1 113,100 I $2s,s10I $2,081,037 I $2,106,6071

Cause No. 37366-GCA151
NYMEX Close Date:
NYMEX - August $ NYMEX - September $
NYMEX - October $
Purchase Price
August-21 $ September-21 $
October-21 $
6/21/2021
TGTNNS
3.215 3.201 3.217
Swing/FOM
3.025 2.996 3.009
TGTBH Swing/FOM
$ 3.067 $ 3.038 $ 3.027
Petitioner's Exhibit No. 1 Attachment KJT-3
CEI South For the Period August 2021 - October 2021
Purchase Price Workpaper
Current Basis Differential:
TGT NNS Basis - August $ (0.190) $
Basis - September $ (0.205) $ Basis - October $ (0.208) $
TETCO Swing/FOM
$ 3.112 $ 3.058 $ 3.057
TGTBH (0.148) $ (0.163) $ (0.190) $
TETCO (0.103) (0.143) (0.160)

Petitioner's Exhibit No. 1 Attachment KJT-3
CEI SOUTH Cause No. 37366-GCA151 FOR THE PERIOD AUGUST 2021 THROUGH OCTOBER 2021 Sch.3WACOG
WEIGHTED AVERAGE COST OF GAS Workpaper
August 2021 Seetember 2021 October 2021 Total Cause No. 37366-GCA151 Average
Volume Price Extension Volume Price Extension Volume Price Extension Volume Price Extension
LONG-TERM FINANCIAL PURCHASE #1 90,000 $ (0.3400) $ (30,600) 90,000 $ (0.3260) $ (29,340) 90,000 $ (0.3420) $ (30,780) 270,000 $ (0.3360) $ (90,720) LONG-TERM FINANCIAL PURCHASE #2 50,000 $ (0.2650) $ (13,250) 50,000 $ (0.2510) $ (12,550) 50,000 $ (0.2670) $ (13,350) 150,000 $ (0.2610) $ (39,150)
LONG-TERM FIXED PRICE #2 15,500 $ 4.7600 $ 73,780 15,000 $ 4.7600 $ 71,400 15,500 $ 4.7600 $ 73,780 46,000 $ 4.7600 $ 218,960 LONG-TERM FIXED PRICE #4 23250 $ 4.4900 $ 104,393 22,500 $ 4.4900 $ 101,025 23250 $ 4.4900 $ 104,393 69,000 $ 4.4900 $ 309,810 LONG-TERM FIXED WACOG 38,750 $ 3.4664 $ 134,323 37,500 $ 3.4809 $ 130,535 38,750 $ 3.4592 $ 134,043 115,000 $ 3.4687 $ 398,900
SHORT-TERM FIXEDTGT 217,000 $ 2.5136 $ 545,445 210,000 $ 2.5136 $ 527,850 217,000 $ 2.5136 $ 545,445 644,000 $ 2.5136 $ 1,618,740 SHORT-TERM FIXED WACOG 217,000 $ 2.5136 $ 545,445 210,000 $ 2.5136 $ 527,850 217,000 $ 2.5136 $ 545,445 644,000 $ 2.5136 $ 1,618,740
FIRST OF THE MONTH INDEX - TGT 108,533 $ 3.0670 $ 332,869 105,032 $ 3.0380 $ 319,086 108,533 $ 3.0270 $ 328,528 322,097 $ 3.0441 $ 980,483 FIRST OF THE MONTH INDEX - TETCO 3,179 $ 3.1120 $ 9,894 3,077 $ 3.0580 $ 9,408 3,179 $ 3.0570 $ 9,719 9,435 $ 3.0759 $ 29,021
FIRST OF THE MONTH WACOG 111,712 $ 3.0683 $ 342,763 108,108 $ 3.0386 $ 328,494 111,712 $ 3.0279 $ 338,247 331,532 $ 3.0450 $ 1,009,504
DAILY SWING INDEX - TGT 46,752 $ 3.0250 $ 141,426 110,597 $ 2.9960 $ 331,349 74,402 $ 3.0090 $ 223,876 231,751 $ 3.0060 $ 696,650 DAILY SWING INDEX - TGT BH 393,782 $ 3.0670 $ 1,207,730 432,015 $ 3.0380 $ 1,312,460 302,405 $ 3.0270 $ 915,379 1,128,201 $ 3.0452 $ 3,435,569 DAILY SWING INDEX - TETCO $ 3.1120 $ $ 3.0580 $ $ 3.0570 $ $ $
DAILY SWING WACOG 440,535 $ 3,0625 $ 1,349,156 542,612 $ 3.0294 $ 1,643,809 376,807 $ 3.0234 $ 1,139,255 1,359,953 $ 3.0385 $ 4,132,220
COMPANY STORAGE (604,500) $ 2.9678 $ (1,794,061) (585,000) $ 2.9578 $ (1,730,336) (379,750) $ 2.9212 $ (1,109,328) (1,569,250) $ 2.9528 $ (4,633,726) NNS - TEXAS GAS STORAGE (46,752) $ 2.4369 $ (113,931) (45,244) $ 2.4369 $ (110,255) (31,168) $ 2.4369 $ (75,953) (123,164) $ 2.4369 $ (300,139)
STORAGE WACOG (651,252) $ 2.9297 $ (1,907,992) (630,244) $ 2.9204 $ (1,840,591) (410,918) $ 2.8845 $ (1,185,281) (1,692,414) $ 2.9153 $ (4,933,865)
LONG-TERM FIXED WACOG 38,750 $ 3.4664 $ 134,323 37,500 $ 3.4809 $ 130,535 38,750 $ 3.4592 $ 134,043 115,000 $ 3.4687 $ 398,900 SHORT-TERM FIXEDWACOG 217,000 $ 2.5136 $ 545,445 210,000 $ 2.5136 $ 527,850 217,000 $ 2.5136 $ 545,445 644,000 $ 2.5136 $ 1,618,740
FIRST OF THE MONTH WACOG 111,712 $ 3,0683 $ 342,763 108,108 $ 3.0386 $ 328,494 111,712 $ 3,0279 $ 338,247 331,532 $ 3.0450 $ 1,009,504 DAILY SWING WACOG 440,535 $ 3.0625 $ 1,349,156 542,612 $ 3.0294 $ 1,643,809 376,807 $ 3.0234 $ 1,139,255 1,359,953 $ 3.0385 $ 4,132,220
STORAGE WACOG (651,252) $ 2.9297 $ (1,907,992) (630,244) $ 2.9204 $ (1,840,591) (410,918) $ 2.8845 $ (1,185,281) (1,692,414) $ 2.9153 $ (4,933,865)
TOTAL WEIGHTED AVERAGE COST OF GAS 156,744 $ 2.9583 $ 463,694 267,976 $ 2.9484 $ 790,097 333,350 $ 2.9150 $ 971,708 758,070 $ 2.9357 $ 2,225,498

Petitioner's Exhibit No. 1 Attachment KJT-3
Schedule 4 Page 1 of 1
Cause No. 37366-GCA151 CEI SOUTH
ESTIMATED GAS STORAGE AND DELIVERED SERVICES COST
FOR THE PERIOD AUGUST 2021 THROUGH OCTOBER 2021 COMMODITY COST
Estimated Volumes Estimated Rates Estimated Cost Injected Withdrawn Injected Withdrawn Com- Injected Withdrawn
Month and Compressor presser Compressor Su lier Dth Dth Fuel Dth Dth Fuel Fuel Total
August-21
TEXAS GAS NNS (46,500) 0 0 $0.0501 $0.0501 $0 $0 $0 $0
Subtotal (46,500)1 01 01 $0 1 $0 1 $0 1 $0 1
September-21
TEXAS GAS NNS (45,000) 0 0 $0.0501 $0.0501 $0 $0 $0 $0
Subtotal (45,oooil 01 01 $0 1 $0 1 $0 1 $0 1
October-21
TEXAS GAS NNS (31,000) 0 0 $0.0501 $0.0501 $0 $0 $0 $0
Subtotal (31,000)1 01 01 $0 1 $0 1 $0 1 $0 1
Total Commodity Cost $0 I $0 I $0 $0 I

Petitioner's Exhibit No. 1 Attachment KJT-3
Schedule 5 Page 1 of 1
Cause No. 37366-GCA151 CEI SOUTH
ESTIMATED COST OF GAS INJECTED AND WITHDRAWN FROM STORAGE AND DELIVERED SERVICES
FOR THE PERIOD AUGUST 2021 THROUGH OCTOBER 2021
Estimated Changes in Storage Month and Injected Withdrawn Net Estimated Gas Rates Cost of Gas
Type of Stora e Dth Dth Dth Demand Commodi Demand Commodit Net
August-21
Company (604,500) 0 (604,500) $2.968 $0 ($1,794,061) ($1,794,061)
(604,500)1 DI (604,500)1 $0 I ($1,794,061)1 ($1,794,061)1
September-21
Company (585,000) 0 (585,000) $2.958 $0 ($1,730,336) ($1,730,336)
(585,ooo) 1 DI (585,000)1 $0 I ($1,730,336) 1 ($1,730,336)1
October-21
Company (379,750) 0 (379,750) $2,921 $0 ($1,109,328) ($1,109,328)
(379,750)1 DI (379,750)1 $0 I ($1, 109,328)1 ($1,109,328) 1
Grand Total (1,5s9,25oJ 1 DI {1,569,250) I $0 I ($4,633,725)1 ($4,633,725) I

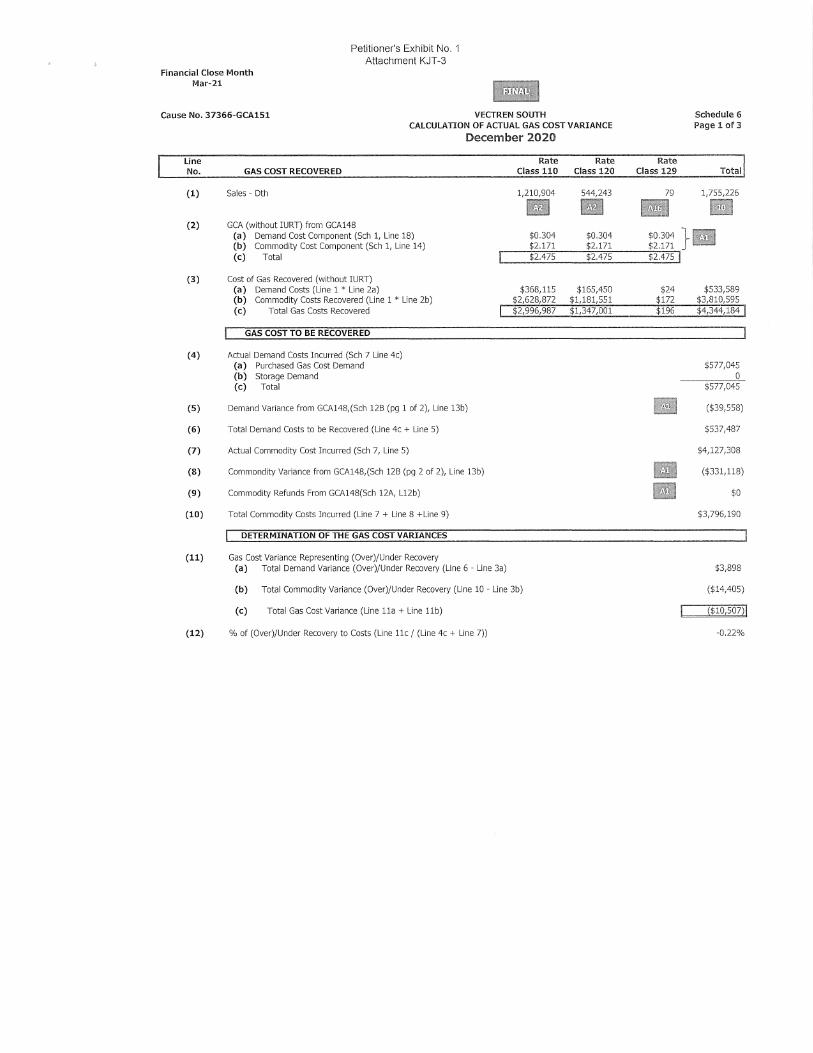
Financial Close Month Mar-21
Cause No. 37366-GCAlSl
Line No.
(1)
GAS COST RECOVERED
Sales - Dth
Petitioner's Exhibit No. 1 Attachment KJT-3
Fiifrii VECTREN SOUTH
CALCULATION OF ACTUAL GAS COST VARIANCE
December 2020
Rate Rate Class 110 Class 120
1,210,904 544,243
II Ill
Rate Class 129
79 -Schedule 6 Page 1 of 3
Total
1,755,226
m (2) GCA (without IURT) from GCAl 48
(a) Demand Cost Component (Sch 1, Line 18) (b) Commodity Cost Component (Sch 1, Line 14)
$0.304 $0.304 $0.304 }-__ .... $:;2:.::.l.:.,;71;,.-_ _:;;$2:::;.l::.:.7.;1 __ --:.$.:;;2·:;:;17:..::1:.., 111M
(3)
(c) Total
Cost of Gas Recovered (without IURT) (a) Demand Costs (Line 1 * Line 2a) (b) Commodity Costs Recovered (Line 1 * Line 2b) (c) Total Gas Costs Recovered
GAS COST TO BE RECOVERED
(4) Actual Demand Costs Incurred (Sch 7 Line 4c) (a) Purchased Gas Cost Demand (b) Storage Demand (c) Total
(5) Demand Variance from GCAl 48,(Sch 12B (pg 1 of 2), Line 13b)
(6) Total Demand Costs to be Recovered (Line 4c + Line 5)
(7) Actual Commodity Cost Incurred (Sch 7, Line 5)
(8) Commondity Variance from GCA148,(Sch 12B (pg 2 of 2), Line 13b)
(9) Commodity Refunds From GCA148(Sch 12A, L12b)
(10) Total Commodity Costs Incurred (Line 7 + Line 8 +Line 9)
DETERMINATION OF THE GAS COST VARIANCES
(11) Gas Cost Variance Representing (Over)/Under Recovery (a) Total Demand Variance (Over)/Under Recovery (Line 6 - Line 3a)
$2.475 $2.475 $2.475 I
$368,115 $2,628,872 $2,996,987
$165,450 $1,181,551 $1,347,001
$24 $172 $196
-Ill Ill
(b) Total Commodity Variance (Over)/Under Recovery (Line 10 - Line 3b)
(c) Total Gas Cost Variance (Line lla + Line llb)
(12) % of (Over)/Under Recovery to Costs (Line llc / (Line 4c + Line 7))
$533,589 $3,810,595 $4,344,184 I
$577,045 0
$577,045
($39,558)
$537,487
$4,127,308
($331,118)
$0
$3,796,190
$3,898
($14,405)
($10,507)!
-0.22%

Financial Close Month Mar-21
Cause No. 37366-GCAlSl
Petitioner's Exhibit No. 1 Attachment KJT-3
Fiifrii VECTREN SOUTH
CALCULATION OF ACTUAL GAS COST VARIANCE
January 2021
Line No.
(1)
(2)
(3)
(4)
(5)
(6)
(7)
(8)
(9)
(10)
(11)
(12)
GAS COST RECOVERED
Sales - Dth
GCA (without IURD from GCA148 (a) Demand Cost Component (Sch 1, Line 18) (b) Commodity Cost Component (Sch 1, Line 14) (c) Total
Cost of Gas Recovered (without IURT) (a) Demand Costs (Line 1 * Line 2a) (b) Commodity Costs Recovered (Line 1 * Line 2b) (c) Total Gas Costs Recovered
GAS COST TO BE RECOVERED
Actual Demand Costs Incurred (Sch 7 Line 4c) (a) Purchased Gas Cost Demand (b) Storage Demand (c) Total
Demand Variance from GCA148,(Sch 12B (pg 1 of 2), Line 13c)
Total Demand Costs to be Recovered (Line 4c + Line 5)
Actual Commodity Cost Incurred (Sch 7, Line 5)
Commondity Variance from GCA148,(Sch 12B (pg 2 of 2), Line 13c)
Commodity Refunds From GCA148(Sch 12A, L12c)
Total Commodity Costs Incurred (Line 7 + Line 8 +Line 9)
DETERMINATION OF THE GAS COST VARIANCES
Gas Cost Variance Representing (Over)/Under Recovery (a) Total Demand Variance (Over)/Under Recovery (Line 6 - Line 3a)
Rate Class 110
1,395,282
m $0.304 $2.473 $2.777
$424,166 $3,450,533 $3,874,699
(b) Total Commodity Variance (Over)/Under Recovery (Une 10 - Line 3b)
(c) Total Gas Cost Variance (Line lla + Line llb)
% of (Over)/Under Recovery to Costs (Line llc / (Line 4c + Line 7))
Rate Class 120
635,340
m $0.304 $2.473 $2.777
$193,143 $1,571,196 $1,764,339
Rate Class 129
172
m
Schedule 6 Page 2 of 3
Total
2,030,794
II $0.304 }m $2.473 $2.777 l
$52 $425 $477
II •
$617,361 $5,022,154 -$5,639,515 1
$577,045 0
$577,045
($50,558)
$526,487
$5,770,639
($423,193)
$0
$5,347,446
($90,874)
$325,292
$234,418 1
3.69%

Financial Close Month March 2021
Cause No. 37366-GCA151
Line No.
(1)
GAS COST RECOVERED
Sales - Dth
Petitioner's Exhibit No. 1 Attachment KJT-3
Mifrii VECTREN SOUTH
CALCULATION OF ACTUAL GAS COST VARIANCE
February 2021
Rate Rate Class 110 Class 120
1,537,529 688,202
m m
Rate Class 129
85
Ill
Schedule 6 Page 3 of 3
Total
2,225,816 -(2) GCA (without IURT) from GCAl 49 (a) Demand Cost Component (Sch 1, Line 18) (b) Commodity Cost Component (Sch 1, Line 14)
$0.420 $0.420 $0.420 } m $2.683 $2.683 $2.683
..---+$""'3..,..1.,,.,03,----$.;.,3,...,l,..,,0.,,..3---+-$3,....,l.,...,0"'3"'!
(3)
(c) Total
Cost of Gas Recovered (without IURT) (a) Demand Costs (Line 1 * Line 2a) (b) Commodity Costs Recovered (Line 1 * Line 2b) ( c) Tota I Gas Costs Recovered
GAS COST TO BE RECOVERED
(4) Actual Demand Costs Incurred (Sch 7 Line 4c) (a) Purchased Gas Cost Demand (b) Storage Demand (c) Total
(5) Demand Variance from GCA149,(Sch 128 (pg 1 of 2), Line 13a)
(6) Total Demand Costs to be Recovered (Line 4c + Line 5)
(7) Actual Commodity Cost Incurred (Sch 7, Line 5)
(8) Commondity Variance from GCA149,(Sch 128 (pg 2 of 2), Line 13a)
(9) Commodity Refunds From GCA149(Sch 12A, L12a)
(10) Total Commodity Costs Incurred (line 7 + Line 8 +Line 9)
DETERMINATION OF THE GAS COST VARIANCES
(11) Gas Cost Variance Representing (Over)/Under Recovery (a) Total Demand Variance (Over)/Under Recovery (Line 6 - Line 3a)
$645,762 $4,125,190 $4,770,952
(b) Total Commodity Variance (Over)/Under Recovery (line 10 - Line 3b)
(c) Total Gas Cost Variance (line lla + Line llb)
(12) % of (Over)/Under Recovery to Costs (Line llc / (line 4c + Line 7))
$289,045 $1,846,446 $2,135,491
$36 $227 $263
m
-m
$934,843 $5,971,863 $6,906,106 I
$519,306 0
$519,306
($48,044)
$471,262
$24,541,585
($301,272)
$0
$24,240,313
($463,581)
$18,268,450
$17,804,869 1
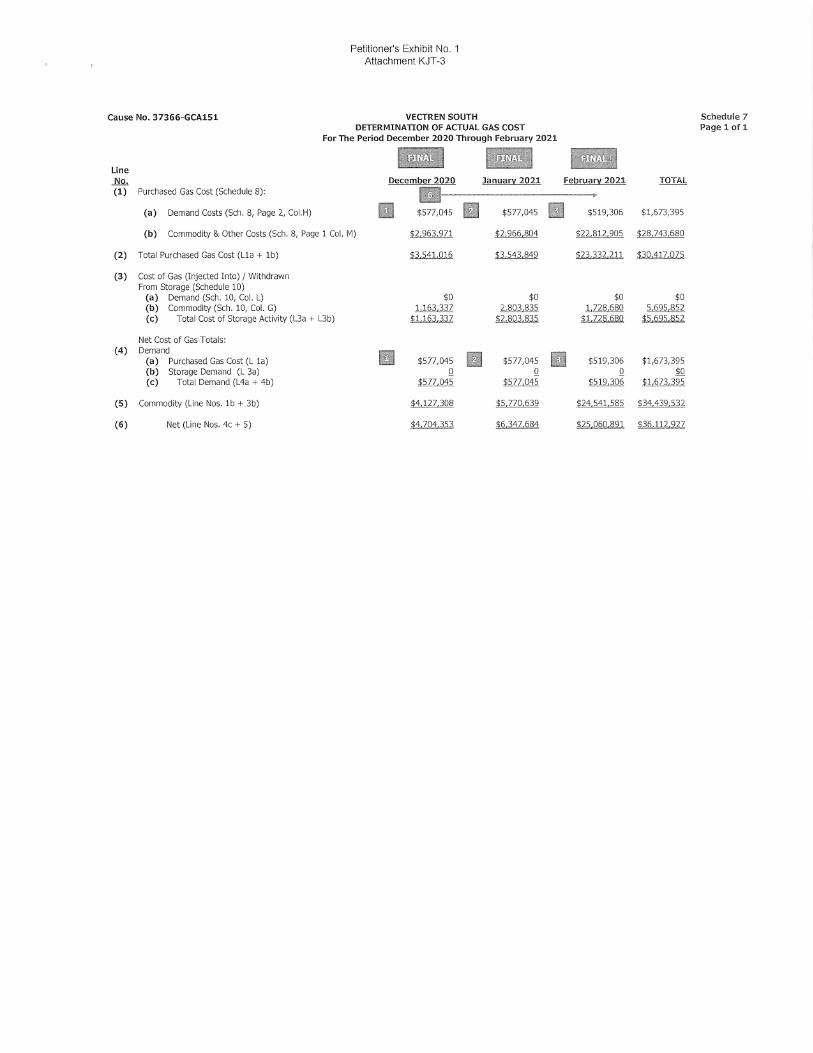
Cause No. 37366-GCA151
Petitioner's Exhibit No. 1 Attachment KJT-3
VECTREN SOUTH DETERMINATION OF ACTUAL GAS COST
For The Period December 2020 Through February 2021
Line Iii/hi MMMM Iii/Mi
JiQ,_ December 2020 January: 2021 Februa[Y'. 2021 (1) Purchased Gas Cost (Schedule 8): II
(a) Demand Costs (Sch. 8, Page 2, Col.H) II $577,045 II $577,045 II $519,306
(b) Commodity & Other Costs (Sch. 8, Page 1 Col. M) :1;2,963,971 $2,966,804 $22,812,905
(2) Total Purchased Gas Cost (Lla + lb) $3 5:11 Q16 :1;3 5:13 8:19 m3322ll
(3) Cost of Gas (Injected Into) / Withdrawn From Storage (Schedule 10)
(a) Demand (Sch. 10, Col. L) $0 $0 $0 (b) Commodity (Sch. 10, Col. G) 1,163,337 2,803,835 1,728,680 (c) Total Cost of Storage Activity (L3a + L3b) $1163.337 $2,803.835 $1.728 680
Net Cost of Gas Totals: (4) Demand
II II II (a) Purchased Gas Cost (L la) $577,045 $577,045 $519,306 (b) Storage Demand (L 3a) Q. Q. Q. (c) Total Demand (L4a + 4b) $577,045 $577,045 $519,306
(5) Commodity (Line Nos. lb+ 3b) $4,127,308 $5,770,639 $24,541,585
(6) Net (Line Nos. 4c + 5) H.7Q4,;J~~ $6,347,6fl4 :t2s Q§Q,IW
Schedule 7 Page 1 of 1
TOTAL
$1,673,395
$28,743,680
$3Q1lZ,QZS
$0 5,695,852
$5 695 852
$1,673,395 Ml
$1,673,395
$34,439,532
$36 112,927
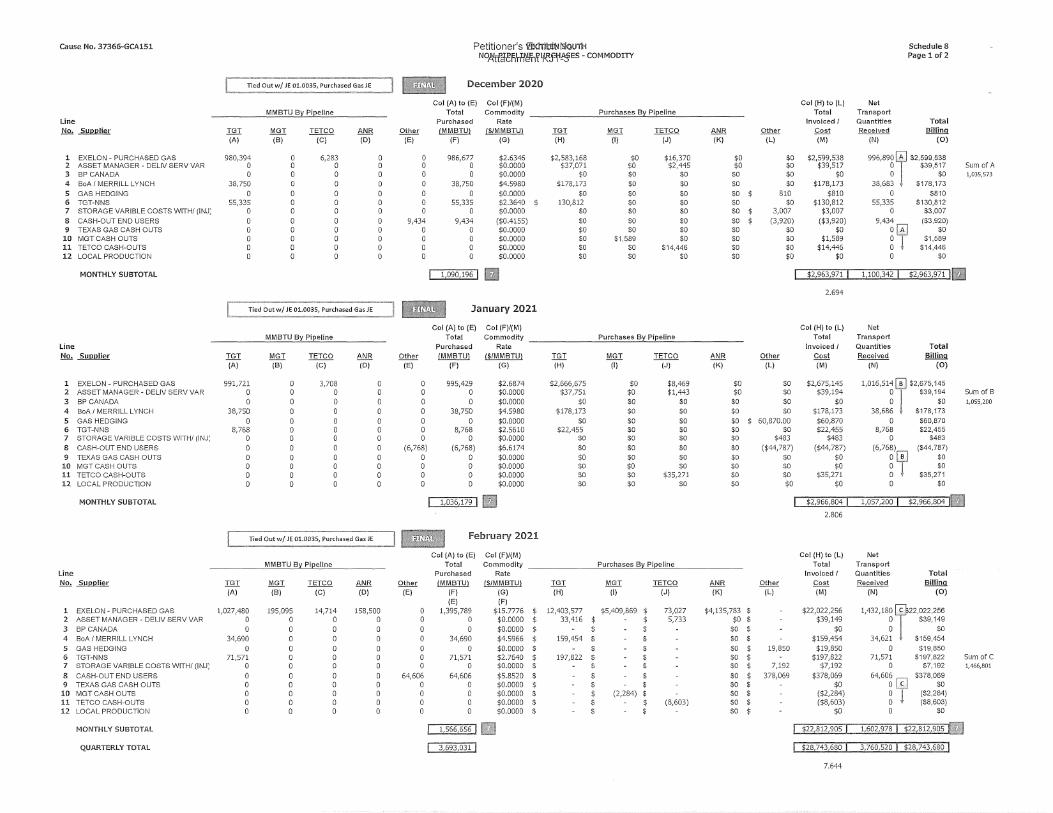
cause No. 37366-GCAlSl Petitioner's 'i'il<hibl~~ouni Schedule 8
NO!t!f.,f[!f,\-ffi!m~.f-jil'g>ES - COMMODITY Pagel of 2
Tied Out w/ JE Dl.0035, Purchased Gas JE I 11111-11 December 2020
Col (A) to (E) Col(F)/(M) Col (H) to (L) Net MMBTU By Pieeline Total Commodity Purchases By Pipeline Total Transport
Line Purchased Rate Invoiced/ Quantities Total No. Supplier TGT MGT TETCO ANR Other /MMBTUl /$/MMBTUl TGT MGT TETCO ANR Other Cost Received Billing
(A) (B) (C) (D) (E) (F) (G) (H) (I) (J) (K) (L) (M) (N) (0)
l EXELON - PURCHASED GAS 980,394 0 6,283 0 0 986,677 $2.6346 $2,583,168 $0 $16,370 $0 $0 $2,599,538 996,8901 $2.599.538 2 ASSET MANAGER - DELIV SERV VAR 0 0 0 0 0 0 $0.0000 $37,071 $0 $2,445 $0 $0 $39,517 0 $39,517 Sum of A 3 BP CANADA 0 0 0 o o o $0.0000 $0 $0 $0 $0 $0 $0 0 $0 1,035,573
4 BoA / MERRILL LYNCH 38,750 o o o 0 38,750 $4.5980 $178,173 $0 $0 $0 $0 $178,173 38,683 $178,173 5 GAS HEDGING 0 0 0 0 o 0 $0.0000 $0 $0 $0 $0 $ 810 $810 0 $810 6 TGT-NNS 55,335 0 0 0 0 55,335 $2.3640 $ 130,812 $0 $0 $0 $0 $130,812 55,335 $130,812 7 STORAGE VARIBLE COSTS WITH/ (!NJ; 0 o o 0 0 o $0.0000 $0 $0 $0 $0 $ 3,007 $3,007 o $3,007 8 CASH-OUT END USERS 0 0 0 0 9,434 9,434 ($0.4155) $0 $0 $0 $0 $ (3,920) ($3,920) 9,434 ($3,920) 9 TEXAS GAS CASH OUTS 0 0 0 0 0 0 $0.0000 $0 $0 $0 $0 $0 $0
~~ $0
10 MGTCASH OUTS 0 0 0 0 0 0 $0.0000 $0 $1,589 $0 $0 $0 $1,589 $1,589 11 TETCO CASH-OUTS 0 o o 0 o 0 $0.0000 $0 $0 $14,446 $0 $0 $14,446 $14,446 12 LOCAL PRODUCTION 0 o o 0 o o $0.0000 $0 $0 $0 $0 $0 $0 o $0
MONTHLY SUBTOTAL I 1,1 I 12,963,971 I 1,100,342 I g963,971 11,1 2.694
Tied Out w/ JE 01.0035, Purchased Gas JE 1 11111-11 January 2021
Col (A) to (E) Col (F)/(M) Col (H) to (L) Net MMBTU By Pipeline Total Commodity Purchases By Pipeline Total Transport
Line Purchased Rate Invoiced/ Quantities Total No. Supplier TGT MGT TETCO ANR Other (MMBTU) /$/MM BTU) TGT MGT TETCO ANR Other Cost Received Billing
(A) (B) (C) (D) (E) (F) (G) (H) (I) (J) (K) (L) (M) (N) (0)
l EXELON - PURCHASED GAS 991,721 o 3,708 o o 995,429 $2.6874 $2,666,675 $0 $8,469 $0 $0 $2,675,145 1,016,514 ! $2,675,145 2 ASSET MANAGER - DELIV SERV VAR o o o o o o $0.0000 $37,751 $0 $1,443 $0 $0 $39,194 0 . $39,194 Sum of 8 3 BP CANADA o o o o o o $0.0000 $0 $0 $0 $0 $0 $0 0 $0 1,055,200
4 BoA / MERRILL LYNCH 38,750 o o o o 38,750 $4.5980 $178,173 $0 $0 $0 $0 $178,173 38,686 $178,173 5 GAS HEDGING o o o o o o $0.0000 $0 $0 $0 $0 $ 60,870.00 $60,870 o $60,870 6 TGT-NNS 8,768 o o o o 8,768 $2.5610 $22,455 $0 $0 $0 $0 $22,455 8,768 $22,455 7 STORAGE VARIBLE COSTS WITH/ (!NJ; o o o o o o $0.0000 $0 $0 $0 $0 $483 $483 0 $483 8 CASH-OUT END USERS o o o o (6,768) (6,768) $6.6174 $0 $0 $0 $0 ($44,787) ($44,787) (6,768) ($44,787) 9 TEXAS GAS CASH OUTS o o o o o o $0.0000 $0 $0 $0 $0 $0 $0 ~f $0
10 MGT CASH OUTS o o o o o 0 $0.0000 $0 $0 $0 $0 $0 $0 $0 11 TETCO CASH-OUTS o o o o o 0 $0.0000 $0 $0 $35,271 $0 $0 $35,271 $35,271 12 LOCAL PRODUCTION o o o o o o $0.0000 $0 $0 $0 $0 $0 $0 o $0
MONTHLY SUBTOTAL I 1,036,179 I Ill I 12,966,804 I 1,os11200 I $2,966,804 111 2.806
Tied Out w/ JE 01.0035, Purchased Gas JE 111111-11 February 2021
Col (A) to (E) Col(F)/(M) Col (H) to (L) Net MMBTU B~ Pieeline Total Commodity Purchases By Pipeline Total Transport
Line Purchased Rate Invoiced/ Quantities Total N2,. Supplier Ifil MGT TETCO ANR Q!hg[ (MMBTU) [$/MMBTU) TGT MGT TETCO ANR Other Cost Received Billing
(A) (B) (C) (D) (E) (F) (G) (H) (I) (J) (K) (L) (M) (N) (0) (E) (F)
l EXELON - PURCHASED GAS 1,027,480 195,095 14,714 158,500 o 1,395,789 $15.7776 $ 12,403,577 $5,409,869 $ 73,027 $4,135,783 $ $22,022,256 1,432,180 122.022.256 2 ASSET MANAGER - DELIV SERV VAR o o o o o o $0.0000 $ 33,416 $ $ 5,733 $0 $ $39,149 o $39,149 3 BP CANADA o o o o o o $0.0000 $ $ $ $0 $ $0 o $0 4 BoA / MERRILL LYNCH 34,690 o o o 0 34,690 $4.5966 $ 159,454 $ $ $0 $ $159,454 34,621 $159,454 5 GAS HEDGING 0 o o o o o $0.0000 $ $ $ $0 $ 19,850 $19,850 o $19,850 6 TGT-NNS 71,571 o o o o 71,571 $2.7640 $ 197,822 $ $ $0 $ $197,822 71,571 $197,822 Sum of C 7 STORAGE VARIBLE COSTS WITH/ (!NJ; o 0 o o o o $0.0000 $ $ $ $0 $ 7,192 $7,192 o $7,192 1,466,801
8 CASH-OUT END USERS o o o o 64,606 64,606 $5.8520 $ $ $ $0 $ 378,069 $378,069 64,606 ' $378,069
9 TEXAS GAS CASH OUTS o o o o o o $0.0000 $ $ $ $0 $ $0 o .•• ~ so 10 MGT CASH OUTS o o o o o o $0.0000 $ $ (2,284) $ $0 $ ($2,284) o ($2,284) 11 TETCO CASH-OUTS o o o o o o $0.0000 $ $ $ (8,603) $0 $ ($8,603) o ($8,603) 12 LOCAL PRODUCTION 0 0 o o o o $0.0000 $ $ $ $0 $ $0 o $0
MONTHLY SUBTOTAL I 1,566,656 I II I $22,s12,9os I 1,602,978 I 122,s12,9os ■
QUARTERLY TOTAL I 3,693,031 I I t28,743,68o I 3,160,s20 I 128<743,sso I 7.644
l•-1'
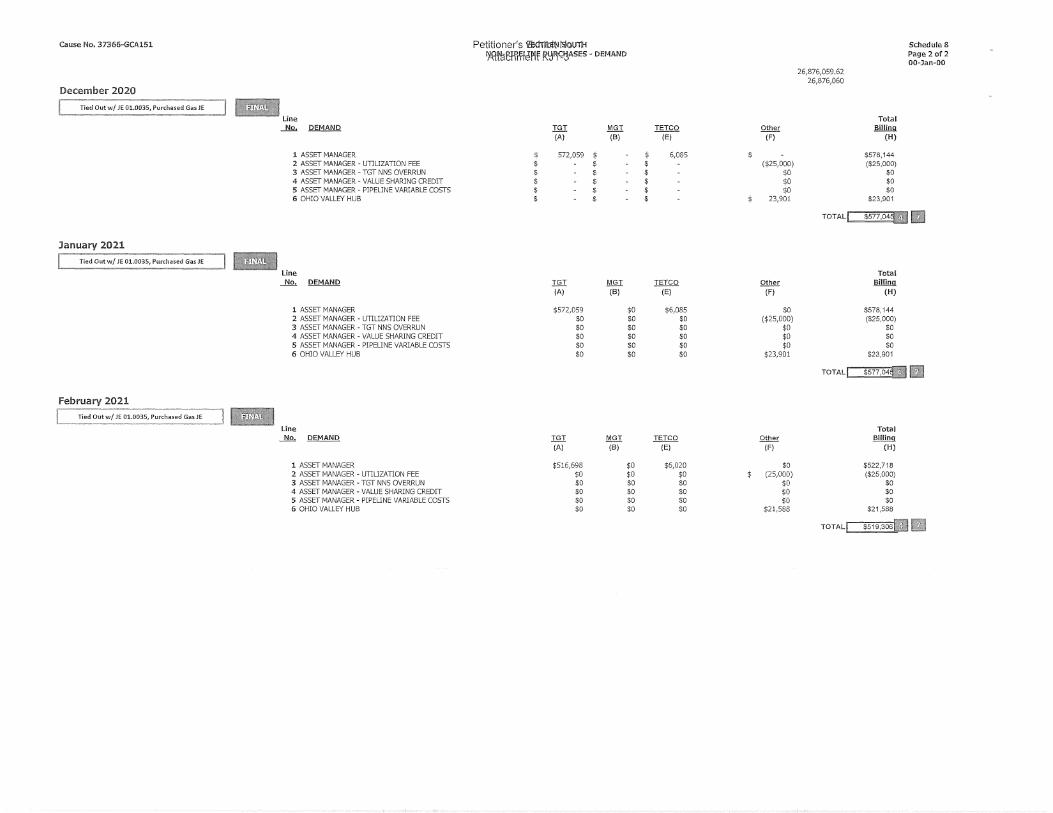
Cause No. 37366-GCA151 Petitioner's ~lllo1.m-1 Schedule 8
r.t{!fu~rr!eNf RWf-ijASES - DEMAND Page 2of 2 OO-Jan-00
26,876,059.62 26,876,060
December 2020
Tied Out w/ JE 01.0035, Purchased Gas JE I MiiiOH Line Total
...N!!. DEMAND TGT MGT TETCO Other Billing (A) (B) (E) (F) (H)
1 ASSET MANAGER $ 572,0S9 $ $ 6,085 $ $578,144 2 ASSET MANAGER - UTILJZATION FEE $ $ $ ($25,000) ($25,000) 3 ASSET MANAGER - TGT NNS OVERRUN $ $ $ $0 $0 4 ASSET MANAGER - VALUE SHARING CREDIT $ $ $ $0 $0 5 ASSET MANAGER - PIPELJNE VARIABLE COSTS $ $ $ $0 $0 6 OHIO VALLEY HUB $ $ $ $ 23,901 $23,901
TOTAL! $577,04 ••
January 2021
Tied Outw/ JE 01.0035, Purchased Gas JE 1111m+ Line Total ...N!!. DEMAND TGT MGT TETCO Other Billing
(A) (B) (E) (F) (H}
1 ASSET MANAGER $572,059 $0 $6,085 $0 $578,144 2 ASSET MANAGER - UTILIZATION FEE $0 $0 $0 ($25,000) ($25,000) 3 ASSET MANAGER - TGT NNS OVERRUN $0 $0 $0 $0 $0 4 ASSET MANAGER - VALUE SHARING CREDIT $0 $0 $0 $0 $0 5 ASSET MANAGER - PIPELINE VARIABLE COSTS $0 $0 $0 $0 $0 6 OHIO VALLEY HUB $0 $0 $0 $23,901 $23,901
TOTALi $577,041111
February 2021
I Tied Out w/ JE 01.00351 Purchased Gas JE 111111-1+ Line Total
...N!!. DEMAND NI MGT ill£Q Q!hfil Billing (A) (B) (E) (F) (H)
1 ASSET MANAGER $516,698 $0 $6,020 $0 $522,718 2 ASSET MANAGER - UTILJZATION FEE $0 $0 $0 $ (25,000) ($25,000) 3 ASSET MANAGER - TGT NNS OVERRUN $0 $0 $0 $0 $0 4 ASSET MANAGER - VALUE SHARING CREDIT $0 $0 $0 $0 $0 5 ASSET MANAGER - PIPELINE VARIABLE COSTS $0 $0 $0 $0 $0 6 OHIO VALLEY HUB $0 $0 $0 $21,588 $21,588
TOTAL( $519,3osll 11
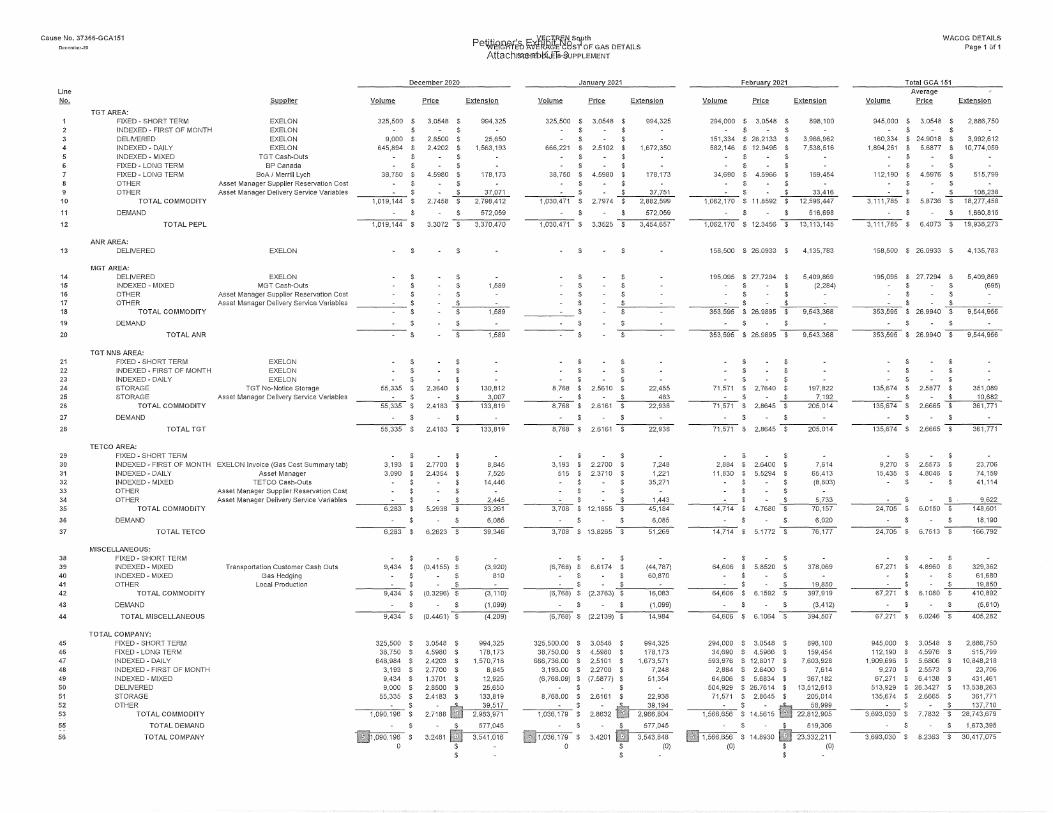
Cause No. 37366-GCA151 Pelitin , r= .. '/_~ftR/;N S<lflth WACOG DETAILS Pmmb .. -20 'WElliWfet> l>.\tt!#J>/GEI~8sl'oF GAS DETAILS Page 1 Of 1
AttachlSl&ll!bl~ .. ET&-&!PPLEMENT
December 2020 January 2021 February 2021 Total GCA 151 Line Average No. Supplier Volume ~ Extension Volume Price Extension Volume Price Extension Volume Price Extension
TGT AREA: FIXED - SHORT TERM EXELON 325,500 $ 3,0548 $ 994,325 325,500 $ 3.0548 $ 994,325 294,000 $ 3.0548 $ 898,100 945,000 $ 3.0548 $ 2,886,750 INDEXED - FIRST OF MONTH EXELON $ $ $ $ $ $ $ $
3 DELIVERED EXELON 9,000 $ 2.8500 $ 25,650 $ $ 151,334 $ 26.2133 $ 3,966,962 160,334 $ 24.9018 $ 3,992,612 4 INDEXED-DAILY EXELON 645,894 $ 2.4202 $ 1,563,193 666,221 $ 2.5102 $ 1,672,350 582,146 $ 12.9495 $ 7,538,516 1,894,261 $ 5.6877 $ 10,774,059 5 INDEXED - MIXED TGT Cash-Outs $ $ $ $ $ $ $ $ 6 FIXED - LONG TERM BP Canada $ $ $ $ $ $ $ $ 7 FIXED-LONGTERM BoA/MerrillLych 38,750 $ 4.5980 $ 178,173 38,750 $ 4.5980 $ 178,173 34,690 $ 4.5966 $ 159,454 112,190 $ 4.5976 $ 515,799 8 OTHER Asset Manager Supplier Reservation Cost $ $ $ $ $ $ $ $
9 OTHER Asset Manager Delivery Service Variables ---~~ $ $ 37,071 ---~~ $ $ 37,751 --~~- $ $ 33,416 -~~=- $ $ 108,238 10 TOTAL COMMODITY 1,019,144 $ 2.7458 $ 2,798,412 1,030,471 $ 2.7974 $ 2,882,599 1,062,170 $ 11.8592 $ 12,596,447 3,111,785 $ 5.8736 $ 18,277,458
11 DEMAND _____ $ $ 572,059 _____ $ $ 572,059 _____ $ $ 516,698 --~=- $ $ 1,660,815
12 TOTALPEPL 1,019,144 $ 3.3072 $ 3,370,470 1,030,471 $ 3.3525 $ 3,454,657 1,062,170 $ 12.3456 $ 13,113,145 3,111,785 $ 6.4073 $ 19,938,273
ANRAREA: 13 DELIVERED EXELON $ $ S $ 158,500 S 26.0933 $ 4,135,783 158,500 $ 26.0933 $ 4,135,783
MGT AREA: 14 DELIVERED EXELON $ $ $ $ 195,095 $ 27.7294 $ 5,409,869 195,095 $ 27.7294 $ 5,409,869 15 INDEXED- MIXED MGT Cash-Outs $ $ 1,589 $ $ $ $ (2,284) $ $ (695) 16 OTHER Asset Manager Supplier Reservation Cost $ $ $ $ $ $ $ $ 17 OTHER Asset Manager Delivery Service Variables _____ $ $ $ $ --==c-=- $ $ _____ $ $ 18 TOTAL COMMODITY $ $ 1,589 _____ $ $ 353,595 $ 26.9895 $ 9,543,368 353,595 $ 26.9940 $ 9,544,956
19 DEMAND _____ $ $ _____ $ $ --==c-=- $
20 TOTAL ANR $ $ 1,589 $ $ 353,595 $ 26.9895 $ 9,543,368 353,595 $ 26.9940 $ 9,544,956
TGT NNS AREA: 21 FIXED - SHORT TERM EXELON $ $ $ $ $ $ $ $ 22 INDEXED - FIRST OF MONTH EXELON $ $ $ $ $ $ $ $ 23 INDEXED - DAILY EXELON $ $ $ $ $ $ $ $
24 STORAGE TGT No-Notice Storage 55,335 $ 2.3640 $ 130,812 8,768 $ 2.5610 $ 22,455 71,571 $ 2.7640 $ 197,822 135,674 $ 2.5877 $ 351,089 25 STORAGE Asset Manager Delivery Service Variables _____ $ $ 3,007 _____ $ $ 483 _____ $ $ 7,192 _____ $ $ 10,682 26 TOTAL COMMODITY 55,335 $ 2.4183 $ 133,819 8,768 $ 2.6161 $ 22,938 71,571 $ 2.8645 $ 205,014 135,674 $ 2.6665 $ 361,771
27 DEMAND ---==,- $ $ ---==c- $ $ _____ $ 28 TOTAL TGT 55,335 $ 2.4183 $ 133,819 8,768 $ 2.6161 $ 22,938 71,571 $ 2.8645 $ 205,014 135,674 $ 2.6665 $ 361,771
TETCO AREA: 29 FIXED-SHORT TERM $ $ $ $ $ $ $ $ 30 INDEXED - FIRST OF MONTH EXELON Invoice (Gas Cost Summary tab) 3,193 $ 2.7700 $ 8,845 3,193 $ 2.2700 $ 7,248 2,884 $ 2.6400 $ 7,614 9,270 $ 2.5573 $ 23,706 31 INDEXED-DAILY AssetManager 3,090 $ 2.4354 $ 7,525 515 $ 2.3710 $ 1,221 11,830 $ 5.5294 $ 65,413 15,435 $ 4.8046 $ 74,159 32 INDEXED - MIXED TETCO Cash-Outs $ $ 14,446 $ $ 35,271 $ $ (8,603) $ $ 41,114 33 OTHER Asset Manager Supplier Reservation Cost $ $ $ $ $ $
34 OTHER Asset Manager Delivery Service Variables ---~~ $ $ 2,445 --~=~ $ $ 1,443 --~=~ $ $ 5,733 --~=~ $ $ 9,622 35 TOTAL COMMODITY 6,283 $ 5.2938 $ 33,261 3,708 $ 12.1855 $ 45,184 14,714 $ 4.7680 $ 70,157 24,705 $ 6.0150 $ 148,601
36 DEMAND ---~~ $ $ 6,085 --~=,- $ $ 6,085 --~=~ $ $ 6,020 --~=~ $ $ 18,190 37 TOTAL TETCO 6,283 $ 6.2623 $ 39,346 3,708 $ 13.8265 $ 51,269 14,714 $ 5.1772 $ 76,177 24,705 $ 6.7513 $ 166,792
MISCELLANEOUS: 38 FIXED - SHORT TERM $ $ $ $ $ $ $ $ 39 INDEXED- MIXED Transportation Customer Cash Outs 9,434 $ (0.4155) $ (3,920) (6,768) $ 6.6174 $ (44,787) 64,606 $ 5.8520 $ 378,069 67,271 $ 4.8960 $ 329,362 40 INDEXED- MIXED Gas Hedging $ $ 810 $ $ 60,870 $ $ $ $ 61,680
41 OTHER Local Production _____ $ $ --~=~ $ $ --~~- $ $ 19,850 --~=- $ $ 19,850 42 TOTAL COMMODITY 9,434 $ (0.3296) $ (3,110) (6,768) $ (2.3763) $ 16,083 64,606 $ 6.1592 $ 397,919 67,271 $ 6.1080 $ 410,892
43 DEMAND _____ $ $ (1,099) _____ $ $ (1,099) _____ $ $ (3,412) _____ $ $ (5,610)
44 TOTAL MISCELLANEOUS 9,434 $ (0.4461) $ (4,209) (6,768) $ (2.2139) $ 14,984 64,606 $ 6.1064 $ 394,507 67,271 $ 6.0246 $ 405,282
TOTAL COMPANY: 45 FIXED-SHORTTERM 325,500 $ 3.0548 $ 994,325 325,500.00 $ 3.0548 $ 994,325 294,000 $ 3.0548 $ 898,100 945,000 $ 3.0548 $ 2,886,750 46 FIXED-LONGTERM 38,750 $ 4.5980 $ 178,173 38,750.00 $ 4.5980 $ 178,173 34,690 $ 4.5966 $ 159,454 112,190 $ 4.5976 $ 515,799 47 INDEXED-DAILY 648,984 $ 2.4203 $ 1,570,718 666,736.00 $ 2.5101 $ 1,673,571 593,976 $ 12.8017 $ 7,603,928 1,909,696 $ 5.6806 $ 10,848,218 48 INDEXED - FIRST OF MONTH 3,193 $ 2.7700 $ 8,845 3,193.00 $ 2.2700 $ 7,248 2,884 $ 2.6400 $ 7,614 9,270 $ 2.5573 $ 23,706 49 INDEXED-MIXED 9,434 $ 1.3701 $ 12,925 (6,768.09) $ (7.5877) $ 51,354 64,606 $ 5.6834 $ 367,182 67,271 $ 6.4138 $ 431,461 50 DELIVERED 9,000 $ 2.8500 $ 25,650 $ $ 504,929 $ 26.7614 $ 13,512,613 513,929 $ 26,3427 $ 13,538,263 51 STORAGE 55,335 $ 2.4183 $ 133,819 8,768.00 $ 2.6161 $ 22,938 71,571 $ 2.8645 $ 205,014 135,674 $ 2.6665 $ 361,771
52 OTHER -~==,- $ - • 39,517 -~=~,.,- $ ii 39,194 -~==,.,- $ - • 58,999 -----c-==~ $ $ 137,710 53 TOTAL COMMODITY 1,090,196 $ 2.7188 2,963,971 1,036,179 $ 2.8632 2,966,804 1,566,656 $ 14.5615 22,812,905 3,693,030 $ 7.7832 $ 28,743,679
55 TOTAL DEMAND -lllllllc-=~~ $ $ 577,045 tlllllllc-=,..,.,,.,- $ $ 577,045 111!1111-c==cc-- $ - $ 519,306 _____ $ $ 1,673,395
56 TOTALCOMPANY i111,090,196 $ 3.2481 II 3,541,016 !111,036,179 $ 3.4201 II 3,543,848 1111,566,656 $ 14.8930 II 23,332,211 3,693,030 $ 8.2363 $ 30,417,075 0 $ 0 $ (0) (0) $ (0)
$ $ $
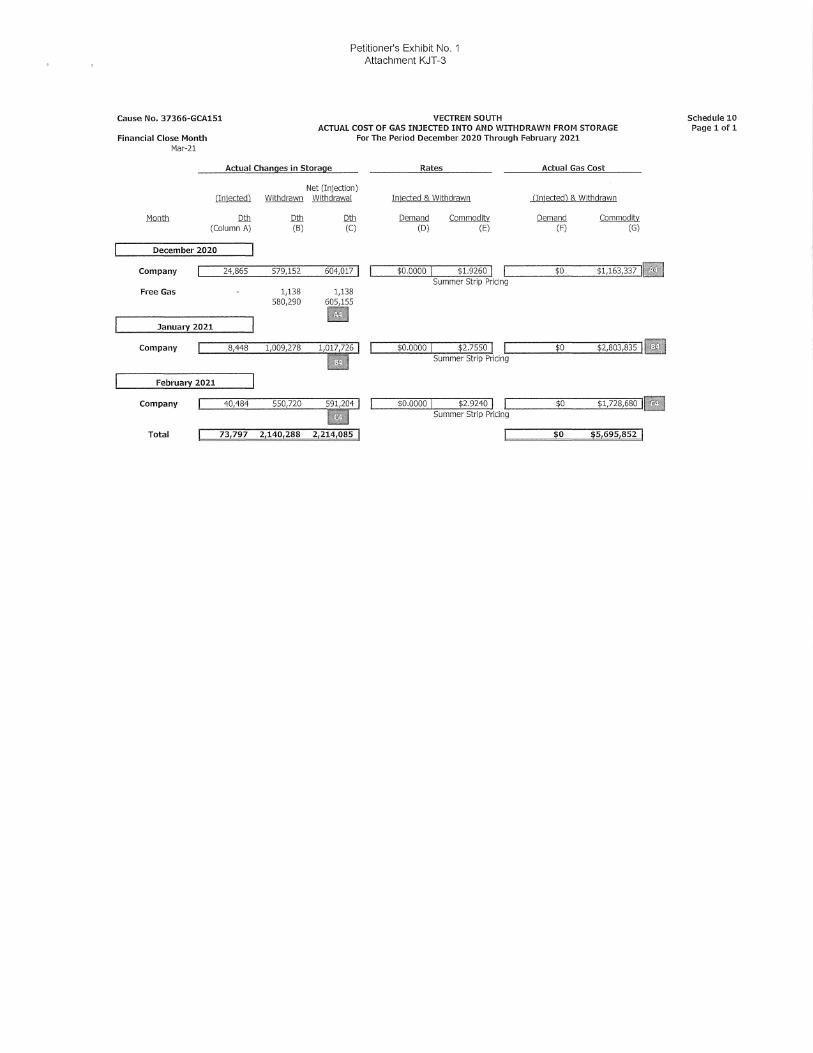
Cause No. 37366-GCA151
Financial Close Month Mar-21
Petitioner's Exhibit No. 1 Attachment KJT-3
VECTREN SOUTH ACTUAL COST OF GAS INJECTED INTO AND WITHDRAWN FROM STORAGE
For The Period December 2020 Through February 2021
Actual Changes in Storage Rates Actual Gas Cost
(Injected) Withdrawn
Month Dth Dth (Column A) (B)
December 2020
Company 24,865 579,152
Free Gas 1,138 580,290
January 2021
Company 8,448 1,009,278
February 2021
Company 40,484 550,720
Total 73,797 2,140,288
Net (Injection) Withdrawal
Dth (C)
604,011 I 1,138
605,155
II 1,011,726 I •
591,204 I ,., 2,214,085
Injected & Withdrawn
Demand (D)
Commodity (E)
$0.0000 1 $1.9260 I I
Summer Strip Pricing
$0.0000 1 $2.1550 1 I Summer Strip Pricing
$0.0000 I $2.9240 I I Summer Strip Pricing
(Injected) & Withdrawn
Demand (F)
$0
$0
$0
$0
Commodity (G)
$1,163,337 1111
$2,803,835 1111
$1,728,680 1111 $5,69s,ss2 1
Schedule 10 Page 1 of 1
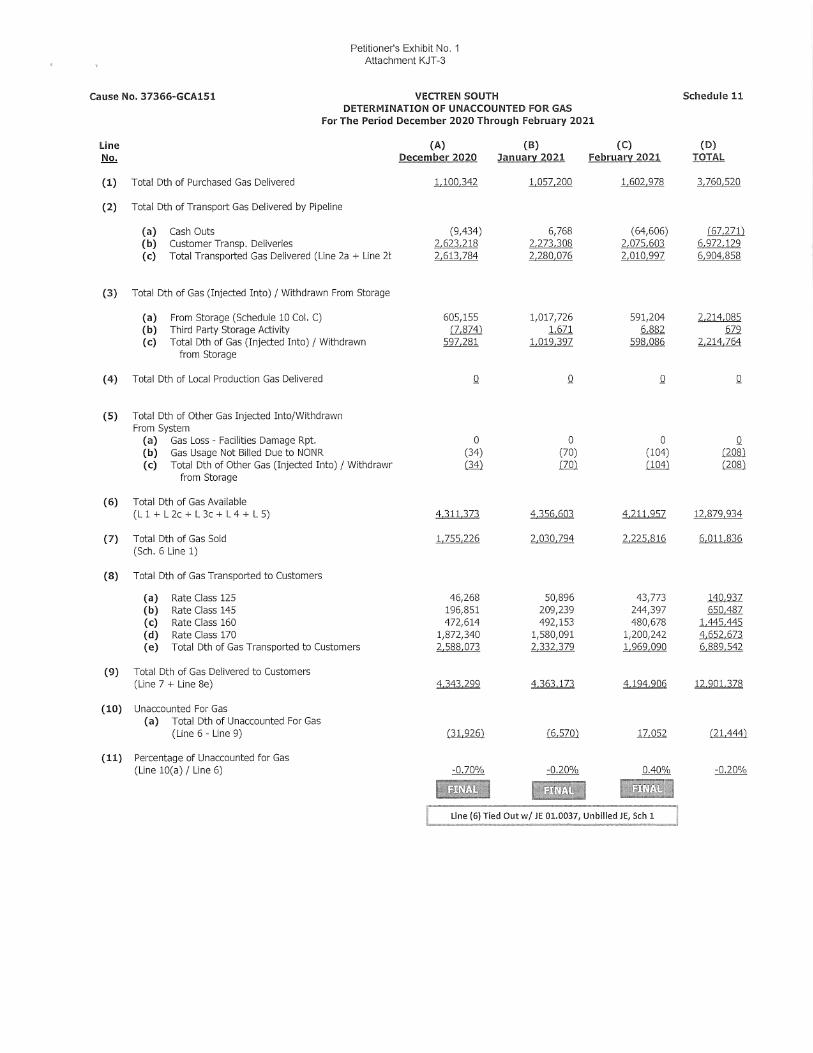
Petitioner's Exhibit No. 1 Attachment KJT-3
Cause No. 37366-GCA151 VECTREN SOUTH Schedule 11 DETERMINATION OF UNACCOUNTED FOR GAS
For The Period December 2020 Through February 2021
Line (A) (B) (C) (D) No. December 2020 Janua!Y 2021 Februa!Y 2021 TOTAL
(1) Total Dth of Purchased Gas Delivered 1.100.342 1.057.200 1.602.978 3,760.520
(2) Total Dth of Transport Gas Delivered by Pipeline
(a) Cash Outs (9,434) 6,768 (64,606) (67,271) (b) Customer Transp. Deliveries 2.623.218 2,273,308 2.075.603 6,972,129 (c) Total Transported Gas Delivered (Line 2a + Line 2t 2,613.784 2.280.076 2.010.997 6,904,858
(3) Total Dth of Gas (Injected Into)/ Withdrawn From Storage
(a) From Storage (Schedule 10 Col. C) 605,155 1,017,726 591,204 2.214.085 (b) Third Party Storage Activity (7,874) 1.671 6.882 679 (c) Total Dth of Gas (Injected Into) / Withdrawn 597,281 1.019.397 598.086 2.214.764
from Storage
(4) Total Dth of Local Production Gas Delivered _Q _Q _Q _Q
(5) Total Dth of Other Gas Injected Into/Withdrawn From System
(a) Gas Loss - Facilities Damage Rpt. 0 0 0 _Q
(b) Gas Usage Not Billed Due to NONR (34) (70) (104) (208) (c) Total Dth of other Gas (Injected Into) / Withdrawr .cw Q._Q) (104) (208)
from Storage
(6) Total Dth of Gas Available (L 1 + L 2c + L 3c + L 4 + L 5) 4,311.373 4.356.603 4,211,957 12,879.934
(7) Total Dth of Gas Sold 1.755,226 2,030.794 2,225,816 6.011,836 (Sch. 6 Line 1)
(8) Total Dth of Gas Transported to Customers
(a) Rate Class 125 46,268 50,896 43,773 140.937 (b) Rate Class 145 196,851 209,239 244,397 650.487 (c) Rate Class 160 472,614 492,153 480,678 1.445.445 (d) Rate Class 170 1,872,340 1,580,091 1,200,242 4,652,673 (e) Total Dth of Gas Transported to Customers 2,588,073 2,332.379 1.969,090 6,889,542
(9) Total Dth of Gas Delivered to Customers (Line 7 + Line Se) 4.343 299 4.363.173 4.194.906 12.901.378
(10) Unaccounted For Gas (a) Total Dth of Unaccounted For Gas
(Line 6 - Line 9) (31.926) (6,570) 17.052 (21.444)
(11) Percentage of Unaccounted for Gas (Line 10(a) / Line 6) -0.70% -0.20% 0.40% -0.20%
Ill~!.!■ 1mm1 lll~MI Line (6) Tied Out w/ JE 01.0037, Unbilled JE, Sch 1

Petitioner's Exhibit No. 1 Attachment KJT-3
Financial Close Month Mar-21
Line
No.
1
2
3
4
5
6
VECTREN SOUTH Determination of Bad Debt Gas Cost Recoveries
iiihJI NiUMI Description December 2020 January 2021
Actual Sales in Dth (from Sch. 6, Line 1) II 1,7ss,226 11 2,030,794
Projected Bad Debt Gas Cost Component ($/Dth) Ill $0.017 - $0.019 (from Sch. 1, Page 2, Line 21, prior GCAs)
Actual Bad Debt Gas Cost Recovery $29,839 $38,585 (Line 1 * Line 2)
Actual Recoverable Gas Costs (from Sch. 7, Line 6) $4,704,353 $6,347,684
Actual Recoverable Bad Debt Gas Costs $30,578 $41,260 (Line 4 * 0.65%)
Bad Debt Gas Cost Variance (Line 5 - Line 3) $739 $2,675
Schedule 12C
iih@i 3 Months Ending
February 2021 2/28/2021
II 2,22S,816 6,011,836
Ill $0.021
$46,742 $115,166
$25,060,891 $36,112,928
$162,896 $234,734
$116,154 $119,5681

Petitioner's Exhibit No. 1 Attachment KJT-3
Cause No. 37366-GCA151
Line No.
2
3
4
5
6
7
8
9
10
11
12
12a 12b 12c
CEI SOUTH INITIATION OF REFUND
Refunds to be Included in the GCA FOR THE PERIOD AUGUST 2021 THROUGH OCTOBER 2021
Description:
Nomination and Balancing Charges
Pipeline Refunds
Total to be Refunded
Distribution of Refunds to GCA Quarters
Quarter
August 2021 - October 2021
November 2021 - January 2022
February 2022 - April 2022
May 2022 - July 2022
I calculation Of Refunds To Be Returned In This GCA
Cause No. 37366-GCA 148
Cause No. 37366-GCA149
Cause No. 37366-GCA 150
Refunds from this GCA (Schedule 12A, Line 4)
Total to be Refunded in This Cause
August 2021 Refund (Line 12 / Sch. 2 Sales) September 2021 Refund (Line 12 / Sch. 2 Sales) October 2021 Refund (Line 12 / Sch. 2 Sales)
(A) Sales Percentage All Rate Classes (Schedule 2)
7.129%
50.000%
36.930%
5.941%
100.000% I
Schedule 12A
Amount of Refund\
(B)
Refund (Line 2 * A)
$0
$0
$0 I
$0
$0
$0
$0
$0 I
$0
$0
$0
$0
$0 I
$0 $0 $0

Petitioner's Exhibit No. 1 Attachment KJT-3
Cause No. 37366-GCA151
Line No.
2
3
4
5
6
7
8
9
10
11
12
13
13a 13b 13c
CEI SOUTH RECONCILIATION OF DEMAND VARIANCE
Rate Class Description
Demand Variance: (Over) Under Recovery (Schedule 6, Line 11 a)
(a) December 2020 (b) January 2021 (c) February 2021
TOTAL
Demand Variance
$3,898 ($90,874)
($463,581)
($550,557)
Distribution Of Demand Variances To Quarters
Quarter Line 2 * Quarter! Sales Percenta es, Sch. 2)
August 2021 - October 2021 ($39,249)1
November 2021 - January 2022 ($275,279) 1
February 2022 - April 2022 ($203,321 l I May 2022 - July 2022 ($32,709)1
Total Demand Variance ($550,558) I
Calculation Of Demand Variances For This Cause
Cause No. 37366-GCA 148 (Sch. 12B (pg 1 of 2), Line 6) $3,134
Cause No. 37366-GCA149 (Sch. 12B (pg 1 of 2), Line 5) $10,474
Cause No. 37366-GCA150 (Sch. 12B (pg 1 of 2), Line 4) ($20,915)
Variance from this GCA (Sch. 12 B (pg 1 of 2), Line 3) ($39,249)
Total Demand Variances to be Included in GCA ($46,556)1
Adjusted Total Demand Variance to be included in GCA (Line 12) ($46,556)1
August 2021 Variance (Line 13 / Sch. 2 Sales) ($9,622) September 2021 Variance (Line 13 / Sch. 2 Sales) ($16,450) October 2021 Variance (Line 13 / Sch. 2 Sales) ($20,485)
Schedule 12B Page 1

Petitioner's Exhibit No. 1 Attachment KJT-3
Cause No. 37366-GCA151
Line No.
2
3
4
5
6
7
8
9
10
11
12
13
13a 13b 13c
CEI SOUTH RECONCILIATION OF COMMODITY VARIANCE
Rate Class Descri tion
Commodity Variance: (Over) Under Recovery (Schedule 6, Line 11 b)
(a) December 2020 (b) January 2021 ( c) February 2021 (d) LIFO Adjustment (e) Annual UAF Adjustment - LIFO Adjusted (Sch. 11 B, L 18) (f) Bad Debt Gas Cost Adjustment (from Sch. 12C, L 6)
(g) Bad Debt Gas Cost Adjustment - LIFO Adjusted
TOTAL
Commodity Variance
($14,405) $325,292
$18,268,450 $742,254
$0 $119,568
$4,824
$19,445,983 1
Distribution Of Commodity Variance To Quarters Quarter Line 2 * Quarter! Sales Percenta es, Sch. 2
August 2021 - October 2021 $1,386,303
November 2021 - January 2022 $9,722,992
February 2022 - April 2022 $7,181,402
May 2022 - July 2022 $1,155,286
Total Commodity Variance ~19,445,983 I
Calculation Of Commodity Variance For This Cause
Cause No. 37366-GCA 148 (Sch 12B (pg 2 of 2) , Line 6) ($12,278)
Cause No. 37366-GCA149 (Sch 12B (pg 2 of 2) , Line 5) $26,610
Cause No. 37366-GCA150 (Sch 12B (pg 2 of 2), Line 4) ($435)
Variance from this GCA (Sch 12B (pg 2 of 2) , Line 3) $1,386,303
Total Commodity Variance to be Included in GCA $1,400,200 1
Adjusted Total Commodity Variance to be included in GCA (Line 12) $1,400,200 1
August 2021 Variance (Line 13 / Sch. 2 Sales) $289,375 September 2021 Variance (Line 13 / Sch. 2 Sales) $494,737 October 2021 Variance (Line 13 / Sch. 2 Sales) $616,088
Schedule 12B Page 2

Petitioner's Exhibit No. 1 Attachment KJT-3
Cause No. 37366-GCA 151 Schedule 14 Page 1 of4
GEi SOUTH
TABLE NO.1 Effects of
Estimated GCA v. Currently Effective GCA For Residential Customers
Bill At Bill At Currently Dollar Percent
Consumption Estimated Effective Increase Increase Dth GCA GCA (Decrease) (Decrease)
5 $68.65 $58.20 $10.46 17.97%
10 $110.61 $89.70 $20.91 23.31%
15 $152.57 $121.21 $31.37 25.88%
20 $194.53 $152.71 $41.82 27.38%
25 $236,50 $184.22 $52.28 28.38%
Estimated GCA v. Currently Effective GCA Currently
Estimated Approved Customer Service Charge $11.00 $11.00 Commodity Charge Block 1 $1.620 $1,620 Commodity Charge Block 2 $1,302 $1.302 USF Rider (Eff. 10/1/20) $0.041 $0.041 EEFC (Eff. 5/6/21) $0.1605 $0.1605 SRC (Eff. 5/6/21) $0.1507 $0.1507 CSIA (Eff. 1/21/21) $14.100 $14.100 GCA150 $6.738 $4,647
TABLE NO. 2
Effects of Estimated GCA v. Prior Year Effective GCA
For Residential Customers
Bill At Bill At Prior Year Dollar Percent
Consumption Estimated Effective Increase Increase Dth GCA GCA (Decrease) (Decrease)
5 $68.65 $54.75 $13.90 25.40%
10 $110.61 $82.79 $27.83 33.61%
15 $152.57 $110.82 $41.75 37.67%
20 $194.53 $138,86 $55.67 40.09%
25 $236.50 $166.90 $69.60 41.70%
Estimated GCA v. Prior Year Effective GCA Prior Year
Estimated Approved Customer Service Charge $11.00 $11.00 Commodity Charge Block 1 $1.620 $1.620 Commodity Charge Block 2 $1.302 $1.302 USF Rider (Eff. 10/1/20) $0.041 $0.0390 EEFC (Eff. 5/6/21) $0.1605 $0.1407 SRC (Eff. 5/6/21) $0.1507 $0.1388 CSIA (Eff. 1/21/21) $14.1000 $14.1200 GCA 147 $6.738 $3.987

, Petitioner's Exhibit No. 1
Attachment KJT-3
Cause No. 37366-GCA151 Schedule 14 Page 2 of 4
CEI SOUTH
TABLE NO. 2A
Effects of Estimated August 2021 v. Prior Year Effective GCA
For Residential Customers
Bill At Bill At Prior Year Dollar Percent
Consumption Estimated Effective Increase Increase Dth GCA GCA (Decrease) (Decrease)
5 $69.25 $54.30 $14.94 27.52%
10 $111.80 $81.90 $29.91 36.52%
15 $154.36 $109.49 $44.87 40.98%
20 $196.91 $137.08 $59.83 43.65%
25 $239.47 $164.67 $74.80 45.42%
Estimated August 2021 v. Prior Year Effective GCA Prior Year
Estimated Approved Customer Service Charge $11.00 $11.00 Commodity Charge Block 1 $1.620 $1.620 Commodity Charge Block 2 $1.302 $1.302 USF Rider (Eff. 10/1/20) $0.041 $0.038 EEFC (Eff. 5/6/21) $0.1605 $0.1407 SRC (Eff. 5/6/21) $0.1507 $0.1388 CSIA(Eff.1/21/21) $14.1000 $14.1200
Aug-21 $6.857 $3.899
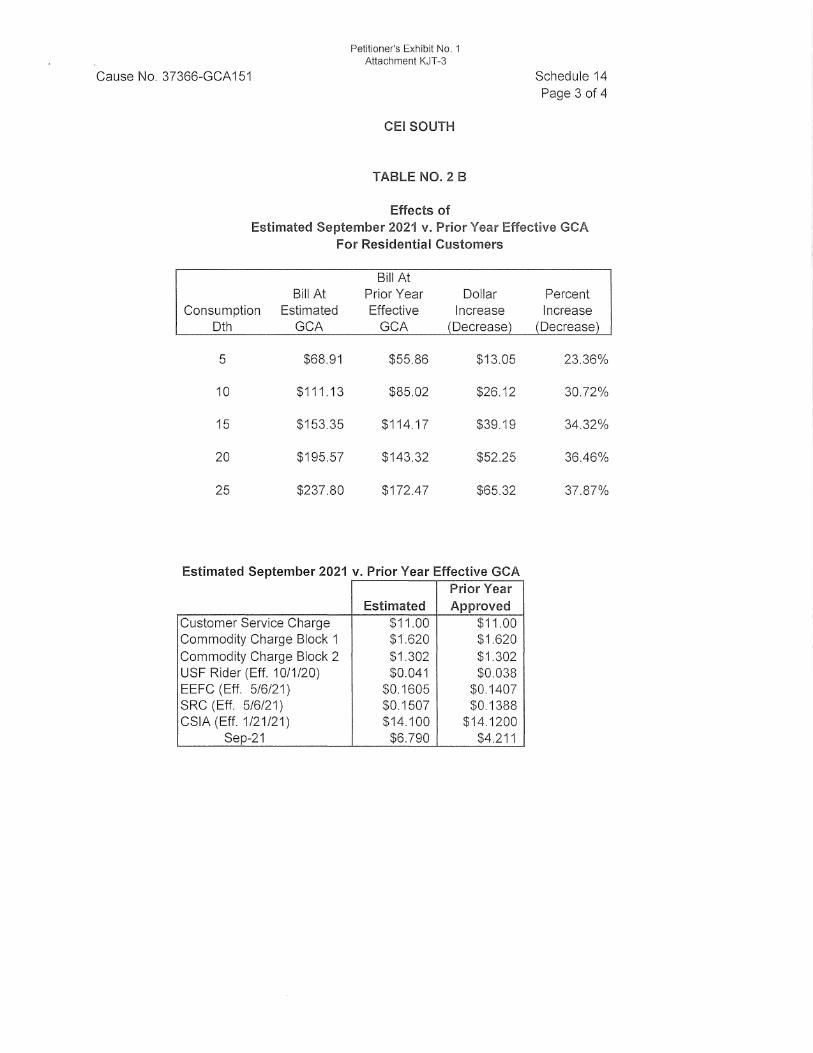
Cause No. 37366-GCA151
Petitioner's Exhibit No. 1 Attachment KJT-3
CEI SOUTH
TABLE NO. 2 B
Effects of
Schedule 14 Page 3 of 4
Estimated September 2021 v. Prior Year Effective GCA For Residential Customers
Bill At Bill At Prior Year Dollar Percent
Consumption Estimated Effective Increase Increase 0th GCA GCA (Decrease) (Decrease)
5 $68.91 $55.86 $13.05 23.36%
10 $111.13 $85.02 $26.12 30.72%
15 $153.35 $114.17 $39.19 34.32%
20 $195.57 $143.32 $52.25 36.46%
25 $237.80 $172.47 $65.32 37.87%
Estimated September 2021 v. Prior Year Effective GCA Prior Year
Estimated Approved Customer Service Charge $11.00 $11.00 Commodity Charge Block 1 $1.620 $1.620 Commodity Charge Block 2 $1.302 $1.302 USF Rider (Eff. 10/1/20) $0.041 $0.038 EEFC (Eff. 5/6/21) $0.1605 $0.1407 SRC (Eff. 5/6/21) $0.1507 $0.1388 CSIA (Eff. 1/21/21) $14.100 $14.1200
Sep-21 $6.790 $4.211

Cause No. 37366-GCA151
Petitioner's Exhibit No. 1 Attachment KJT-3
CEI SOUTH
TABLE NO. 2 C
Effects of
Schedule 14 Page 4 of 4
Estimated October 2021 v. Prior Year Effective GCA For Residential Customers
Bill At Bill At Prior Year Dollar Percent
Consumption Estimated Effective Increase Increase 0th GCA GCA (Decrease) (Decrease)
5 $68.53 $54.38 $14.15 26.02%
10 $110.37 $82.06 $28.32 34.51%
15 $152.21 $109.73 $42.49 38.72%
20 $194.05 $137.40 $56.65 41.23%
25 $235.90 $165.07 $70.82 42.90%
Estimated October 2021 v. Prior Year Effective GCA Prior Year
Estimated Approved Customer Service Charge $11.00 $11.00 Commodity Charge Block 1 $1.620 $1.620 Commodity Charge Block 2 $1.302 $1.302 USF Rider (Eff. 10/1/20) $0.041 $0.041 EEFC (Eff. 5/6/21) $0.1605 $0.1407 SRC (Eff. 5/6/21) $0.1507 $0.1388 CSIA (Eff. 1/21/21) $14.1000 $14.1200
Oct-21 $6.714 $3.912
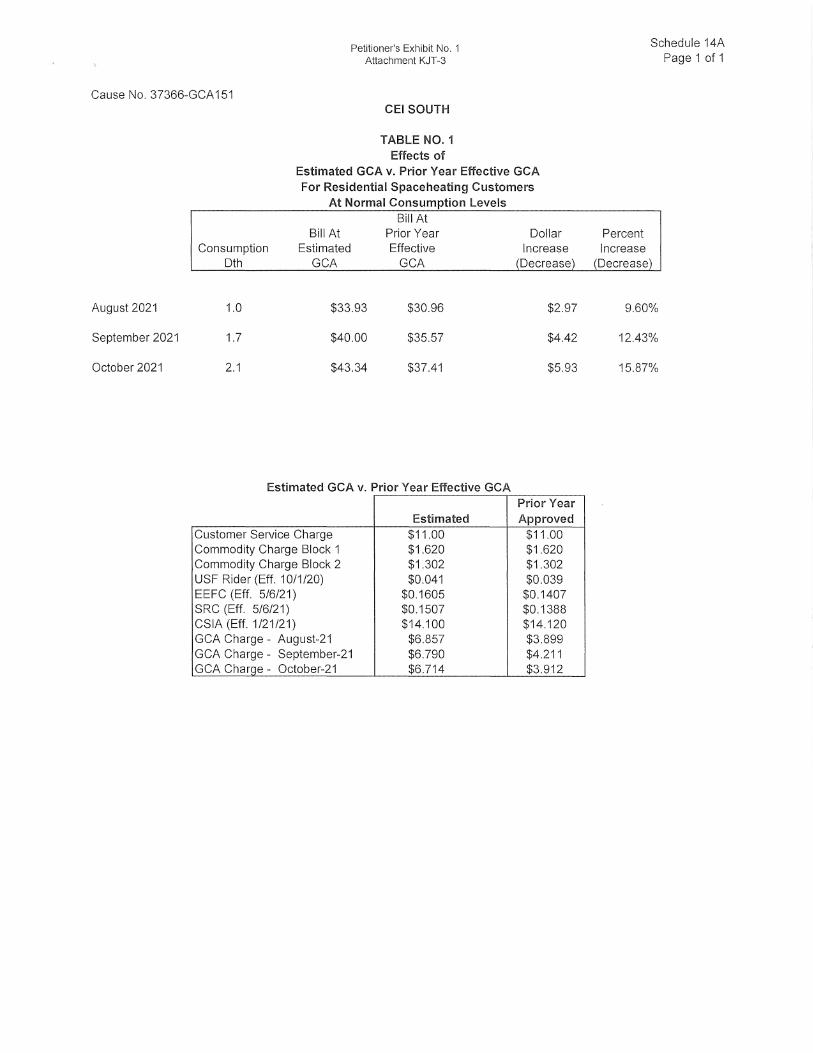
Petitioner's Exhibit No. 1 Attachment KJT-3
Cause No. 37366-GCA151
August 2021
September 2021
October 2021
CEI SOUTH
TABLE N0.1 Effects of
Estimated GCA v. Prior Year Effective GCA For Residential Spaceheating Customers
At Normal Consumption Levels Bill At
Bill At Prior Year Dollar Consumption Estimated Effective Increase
0th GCA GCA (Decrease)
1.0 $33.93 $30.96 $2.97
1.7 $40.00 $35.57 $4.42
2.1 $43.34 $37.41 $5.93
Estimated GCA v. Prior Year Effective GCA Prior Year
Estimated Approved Customer Service Charge $11.00 $11.00 Commodity Charge Block 1 $1.620 $1.620 Commodity Charge Block 2 $1.302 $1.302 USF Rider (Eff. 10/1 /20) $0.041 $0.039 EEFC (Eff. 5/6/21) $0.1605 $0.1407 SRC (Eff. 5/6/21) $0.1507 $0.1388 CSIA (Eff. 1/21/21) $14.100 $14.120 GCA Charge - August-21 $6.857 $3.899 GCA Charge - September-21 $6.790 $4.211 GCA Chan.:ie - October-21 $6.714 $3.912
Percent Increase
Schedule 14A Page 1 of 1
(Decrease)
9.60%
12.43%
15.87%

Cause No. 3735G-GC1\ 151 Petilioner'5 Exhibit No, 1
Altacl1me>11t KJT-4 CEI South
Par,~ lof 1
CE] South GCA 151 Alternative Method of Recovery for February 2021
Total GU\Sale> per Month (Sch,;dule 2
Percentage GC/i, of Sales per Mont
GCA151
Au~-21
155,000
1.4734%
116,154 17,92:1,023
9,134,225.00 (231,790.50)
53,077.00
8,960,511.50
GCA151
AUJt21
Se_e_-21
165,000
2.5190%
5eE_•21
330,000
3.1369%
Oct-21
GCA 152 Nov-21 Dec-21
945,000 1,865,000 2,450,000
B.9829% 17.7281% 23.2890%
GCA152
Nov-21 Dec-21
GCA153 Feb-22 Mar-22 A_e_r-22
1,950,000 1,315,000 620,000
18.5361% .12 . .5000% 5.8935%
GCA153
Feb·Z2 Mar-22. A.e_r-22.
GCA154
May-2:2
3.!0,000
2.9468%
GCA 154
May-22
Jun-22
155.000
1.4734%
Jun-22
Jul-2.2
160,000
1.5209%
Ju!-22
$ 134,582_ $ 230,092 $ 236,530 $ 820,517 $ $ 2,127,267 $ $ 1,141,778 $ 538,319 $ 269,164 $ 134.582 $ 138,924 $
$ (3,415) $ (5,839) $ (7,271) $ (.20,821) $ $ (53,982) $ $ (28,974} $ (13,661) $ {6,830) $ (3/11.5) $ (3,525) $
Total
10,520,000
100%
9,134,225 (231,791)
$ 356 $ 1.463 $ 1,822 $ 5,217 $ 1.0,296 $ 13,526 $ 10,765 $ 7,260 $ 3,423 $ 1,711 $ 856 $ 883 $ 58,077 132,02.3 $ 225,716 $ 281,081 $ 8011,913 $ 1,588,532 $ 2,086,811 $ 1,660,931 $ 1,120,0611 $ 528,091 $ 264,045 $ 132,023 $ 136,282 $ 8,960,512.
876,667
8.3333%
376,667
3.3333% 876,667
8.3333%
875,667 8,3}33~;
876,667
8.3333% 876,667
8.3333% 876,667
S.3333%
876,667
8.3333%
376,667
8.3333%
876,667
8.3333% 876,667 8.3333~0
876,667
8.3333%
$ 761,185 $ 761,185 $ 761,185 $ 761,185 $ 761,185 $ 761,185 $ 761,185 $ 761,185 $ 761,185 $ 761,185 $ 761,185 $ 761,135 $ $ (19,316) $ (19,316) $ (19,316) $ (EJ,316) $ (19,316) $ (19,316) $ (19,316) $ (19,316} $ (19,316) $ (19,316) $ (19,316) $ (19,316) $
10,520,000 100%
9,134,225 (231,791)
$ 4,840 $ 4,8,10 $ 4,840 $ 11,840 S 4,840 $ 11,840 S 4,8110 $ 11,840 $ 4,8,10 $ 4,840 $ 1LS40 $ 4,840 $ 58,077
746,709.29 $ 746,709 $ 746,709 $ 745,709 $ 746,709 $ 746,709 $ 746,709 $ 746,709 $ 7±6?Q? $ _ 746,709 $ __ 7116,7~ 7~6,709 $ ~960,512
17,921,023
GCA151 GCA 152 GCA 153 Aug-21 Sep-21 Oct-21 Nov-21 Dec-21 Jan-22 Feb·22 M;;r-22 Apr-22 ~-22 Jun-22 Jul-22 Total
Total 12 Month R1·":overy $ 132,022.75 $ 225,716.31 $ 281,080.68 S 804,912.87 $ 1,588,531.74 S 2,086,811.14 $ 1,660,931.31 S 1,120,063.94 $ 528,090.98 $ 264,045.49 $ [32,022.75 $ 136,281.54 $ 8,960,511.50
Tot~l 12 Month Recovery $ 746,709.29 5 746,709.29 $ 746,709.29 $ 746,709.29 S 746,709.29 $ 746,709_29 $ 746,709.29 $ 746.709.29 S 746,709.29 $ 7'16,709.29 $ 746,709.2.9 S 746,709.29 $ 3,960,51.\.50
$ 878,732.04 $ 972,425.60 $ 1,027,789.98 $ 1,551,622.15 $ 2,335,241.04 $ 2,833,520.43 $ 2,407,640.61 $ 1.,866,773.:?3 $ 1,274,800.27 $ 1,010,754.78 $ 878.732.04 $ 382,990.84 $ 17,921,023.00
$ $
ResidentialAUPC Residential lm_e.act__i_
155,000
5.669 5,754
1.0 5.75 $
265,000
3.670
1.7 6.33 $
330,000 945,000 1,865,000 2,450,000 1,950,000
3.115 $ 1-Ei42 $ 1.252 1.157 $ 1.235 $ 3.161 $ 1.666 $ 1.271 1.174 $ 1.253 S
5.9 11.7 15.30 12.10 6.64 $ 9.33 $ 14.87 $ 17.96 $ 15.16 $
1,315,000
1.420
1.441
8.20 11.81 $
620,000
2.0SG $ 2.0137 $
3.90 8.14 $
310,000
3.260
3.309
1.90 6.29 $
155,000
5.669
5.754
1.00 5.75 $
160,000 10,520,000
5.519 5.601
1.00 65.80 5.60 $ 114