Pesticide concentrations in frog tissue and wetland habitats in a landscape dominated by agriculture
11
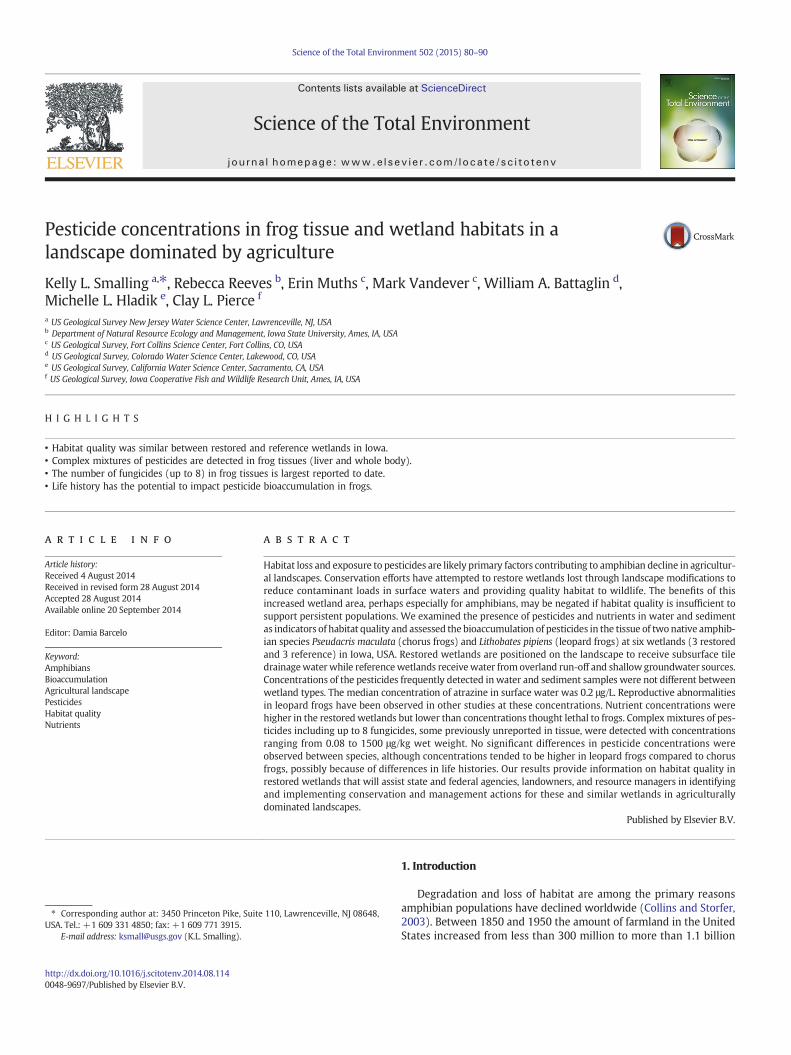
Pesticide concentrations in frog tissue and wetland habitats in a landscape dominated by agriculture Kelly L. Smalling a, ⁎, Rebecca Reeves b , Erin Muths c , Mark Vandever c , William A. Battaglin d , Michelle L. Hladik e , Clay L. Pierce f a US Geological Survey New Jersey Water Science Center, Lawrenceville, NJ, USA b Department of Natural Resource Ecology and Management, Iowa State University, Ames, IA, USA c US Geological Survey, Fort Collins Science Center, Fort Collins, CO, USA d US Geological Survey, Colorado Water Science Center, Lakewood, CO, USA e US Geological Survey, California Water Science Center, Sacramento, CA, USA f US Geological Survey, Iowa Cooperative Fish and Wildlife Research Unit, Ames, IA, USA HIGHLIGHTS • Habitat quality was similar between restored and reference wetlands in Iowa. • Complex mixtures of pesticides are detected in frog tissues (liver and whole body). • The number of fungicides (up to 8) in frog tissues is largest reported to date. • Life history has the potential to impact pesticide bioaccumulation in frogs. abstract article info Article history: Received 4 August 2014 Received in revised form 28 August 2014 Accepted 28 August 2014 Available online 20 September 2014 Editor: Damia Barcelo Keyword: Amphibians Bioaccumulation Agricultural landscape Pesticides Habitat quality Nutrients Habitat loss and exposure to pesticides are likely primary factors contributing to amphibian decline in agricultur- al landscapes. Conservation efforts have attempted to restore wetlands lost through landscape modifications to reduce contaminant loads in surface waters and providing quality habitat to wildlife. The benefits of this increased wetland area, perhaps especially for amphibians, may be negated if habitat quality is insufficient to support persistent populations. We examined the presence of pesticides and nutrients in water and sediment as indicators of habitat quality and assessed the bioaccumulation of pesticides in the tissue of two native amphib- ian species Pseudacris maculata (chorus frogs) and Lithobates pipiens (leopard frogs) at six wetlands (3 restored and 3 reference) in Iowa, USA. Restored wetlands are positioned on the landscape to receive subsurface tile drainage water while reference wetlands receive water from overland run-off and shallow groundwater sources. Concentrations of the pesticides frequently detected in water and sediment samples were not different between wetland types. The median concentration of atrazine in surface water was 0.2 μg/L. Reproductive abnormalities in leopard frogs have been observed in other studies at these concentrations. Nutrient concentrations were higher in the restored wetlands but lower than concentrations thought lethal to frogs. Complex mixtures of pes- ticides including up to 8 fungicides, some previously unreported in tissue, were detected with concentrations ranging from 0.08 to 1500 μg/kg wet weight. No significant differences in pesticide concentrations were observed between species, although concentrations tended to be higher in leopard frogs compared to chorus frogs, possibly because of differences in life histories. Our results provide information on habitat quality in restored wetlands that will assist state and federal agencies, landowners, and resource managers in identifying and implementing conservation and management actions for these and similar wetlands in agriculturally dominated landscapes. Published by Elsevier B.V. 1. Introduction Degradation and loss of habitat are among the primary reasons amphibian populations have declined worldwide (Collins and Storfer, 2003). Between 1850 and 1950 the amount of farmland in the United States increased from less than 300 million to more than 1.1 billion Science of the Total Environment 502 (2015) 80–90 ⁎ Corresponding author at: 3450 Princeton Pike, Suite 110, Lawrenceville, NJ 08648, USA. Tel.: +1 609 331 4850; fax: +1 609 771 3915. E-mail address: [email protected] (K.L. Smalling). http://dx.doi.org/10.1016/j.scitotenv.2014.08.114 0048-9697/Published by Elsevier B.V. Contents lists available at ScienceDirect Science of the Total Environment journal homepage: www.elsevier.com/locate/scitotenv
-
Upload
independent -
Category
Documents
-
view
0 -
download
0
Transcript of Pesticide concentrations in frog tissue and wetland habitats in a landscape dominated by agriculture
Science of the Total Environment 502 (2015) 80–90
Contents lists available at ScienceDirect
Science of the Total Environment
j ourna l homepage: www.e lsev ie r .com/ locate /sc i totenv
Pesticide concentrations in frog tissue and wetland habitats in alandscape dominated by agriculture
Kelly L. Smalling a,⁎, Rebecca Reeves b, Erin Muths c, Mark Vandever c, William A. Battaglin d,Michelle L. Hladik e, Clay L. Pierce f
a US Geological Survey New Jersey Water Science Center, Lawrenceville, NJ, USAb Department of Natural Resource Ecology and Management, Iowa State University, Ames, IA, USAc US Geological Survey, Fort Collins Science Center, Fort Collins, CO, USAd US Geological Survey, Colorado Water Science Center, Lakewood, CO, USAe US Geological Survey, California Water Science Center, Sacramento, CA, USAf US Geological Survey, Iowa Cooperative Fish and Wildlife Research Unit, Ames, IA, USA
H I G H L I G H T S
• Habitat quality was similar between restored and reference wetlands in Iowa.• Complex mixtures of pesticides are detected in frog tissues (liver and whole body).• The number of fungicides (up to 8) in frog tissues is largest reported to date.• Life history has the potential to impact pesticide bioaccumulation in frogs.
⁎ Corresponding author at: 3450 Princeton Pike, SuiteUSA. Tel.: +1 609 331 4850; fax: +1 609 771 3915.
E-mail address: [email protected] (K.L. Smalling).
http://dx.doi.org/10.1016/j.scitotenv.2014.08.1140048-9697/Published by Elsevier B.V.
a b s t r a c t
a r t i c l e i n f oArticle history:Received 4 August 2014Received in revised form 28 August 2014Accepted 28 August 2014Available online 20 September 2014
Editor: Damia Barcelo
Keyword:AmphibiansBioaccumulationAgricultural landscapePesticidesHabitat qualityNutrients
Habitat loss and exposure to pesticides are likely primary factors contributing to amphibian decline in agricultur-al landscapes. Conservation efforts have attempted to restore wetlands lost through landscape modifications toreduce contaminant loads in surface waters and providing quality habitat to wildlife. The benefits of thisincreased wetland area, perhaps especially for amphibians, may be negated if habitat quality is insufficient tosupport persistent populations. We examined the presence of pesticides and nutrients in water and sedimentas indicators of habitat quality and assessed the bioaccumulation of pesticides in the tissue of twonative amphib-ian species Pseudacris maculata (chorus frogs) and Lithobates pipiens (leopard frogs) at six wetlands (3 restoredand 3 reference) in Iowa, USA. Restored wetlands are positioned on the landscape to receive subsurface tiledrainagewaterwhile referencewetlands receivewater fromoverland run-off and shallow groundwater sources.Concentrations of the pesticides frequently detected inwater and sediment samples were not different betweenwetland types. The median concentration of atrazine in surface water was 0.2 μg/L. Reproductive abnormalitiesin leopard frogs have been observed in other studies at these concentrations. Nutrient concentrations werehigher in the restored wetlands but lower than concentrations thought lethal to frogs. Complexmixtures of pes-ticides including up to 8 fungicides, some previously unreported in tissue, were detected with concentrationsranging from 0.08 to 1500 μg/kg wet weight. No significant differences in pesticide concentrations wereobserved between species, although concentrations tended to be higher in leopard frogs compared to chorusfrogs, possibly because of differences in life histories. Our results provide information on habitat quality inrestored wetlands that will assist state and federal agencies, landowners, and resource managers in identifyingand implementing conservation and management actions for these and similar wetlands in agriculturallydominated landscapes.
Published by Elsevier B.V.
110, Lawrenceville, NJ 08648,
1. Introduction
Degradation and loss of habitat are among the primary reasonsamphibian populations have declined worldwide (Collins and Storfer,2003). Between 1850 and 1950 the amount of farmland in the UnitedStates increased from less than 300 million to more than 1.1 billion
81K.L. Smalling et al. / Science of the Total Environment 502 (2015) 80–90
acres (U.S. Department of Agriculture, 2013). However, in the last 5decades the amount of total cropland in the United States has decreasedas the amounts of urban, residential and special-use lands (mostly parksand wildlife areas) are increasing (U.S. Department of Agriculture,2007). In agriculturally dominated states like Iowa, 75% of the acreageis cropland (U.S. Department of Agriculture, 2007). These land-usechanges may not always destroy habitat but usually include alterations,such as the application of chemicals that can threaten amphibiansurvival. Amphibian declines and abnormalities have been attributedto contaminants, often with a focus on water quality, specificallywater at breeding sites. In a recent survey 30–60%of shallowgroundwa-ter and 60–95% of streams across different land-use categories in theUnited States were contaminated with at least one pesticide (Gilliom,2007).
Contaminants have the potential to cause lethal effects in amphib-ians, such as reduced survival or sub-lethal effects such as immunosup-pression, malformations, compromised reproduction and reduction ingrowth and development (Hecnar, 1995; Taylor et al., 2005; Johnsonet al., 2007; Gahl et al., 2011; Groner and Relyea, 2011). For example,the herbicide atrazine has the potential to cause immunosuppressionin adult northern leopard frogs (Brodkin et al., 2007) and impair sexualdevelopment ofmale frogs (Hayes et al., 2003). Glyphosate formulations(Howe et al., 2004; Relyea, 2005) aswell as some fungicide formulations(Belden et al., 2010; Bruhl et al., 2003) are toxic to amphibians at envi-ronmentally relevant concentrations. Decreases in growth and develop-ment have also been observed after exposure to fungicide formulationscontaining pyraclostrobin (Hartman et al., 2014). Laboratory studiesdesigned to identify acute and chronic effects frequently focus on a sin-gle compound or a specific class of compounds that are often conductedin simplified mesocosm settings (Relyea and Mills, 2001; Relyea, 2005;Boone et al., 2005; Boone, 2008). However, pesticides in the environ-ment exist as mixtures and efforts in the field to elucidate some ofthese relationships in non-laboratory settings have been limited.
Exposure to pesticides can lead to suppression of the immune sys-tem, preventing amphibians fromdeveloping a normal response againstpathogens (Mann et al., 2009). Christin et al. (2004) exposed frogs(Xenopus laevis and Rana pipiens) to amixture of herbicides and insecti-cides and found that at environmentally relevant concentrations,combinations of these pesticides altered aspects of the immune system.However, Davidson et al. (2007) found no correlation between acommon insecticide, carbaryl, and amphibians' susceptibility to the am-phibian chytrid fungus (Batrachochytrium dendrobatidis, Bd). Increasedeutrophication due to nitrogen based fertilizers, coupled with pesticideapplication, may cause trophic cascades resulting in increased rates ofparasitism in wetlands and has been linked to immunosuppression inamphibians (Brodkin et al., 2007; Johnson et al., 2007). Although adirect link has been made between pesticide exposure and infectionby trematodes (Rohr et al., 2008; Kiesecker, 2002), a general under-standing of these interactions in the field is lacking because resultsvary by species and land-use (King et al., 2007).
Despite landscape alterations and the suite of potentially negativeeffects related to such alterations, there are examples of amphibianspersisting inmodified habitats. For example, in Eastern Europe amphib-ians breed successfully in man-made drainage ditches (Hartel et al.,2001), in the Midwest, certain species persist despite agrochemical in-puts and habitat modifications (Kolozsvary and Swinhart, 1999;Gilliland et al., 2001) and in Florida not all species of anurans appearedto be adversely affected by development as long as permanent habitatwas available for breeding (Delis et al., 1996). In areas of Californiawhere habitats have been altered by human activities many of theamphibian species (with the exception of Ambystoma californiense)have significantly declined (Davidson et al., 2002). Although animalscan persist in altered landscapes, careful assessments of long-termpersistence and population health are warranted. The presence ofamphibians, or the appearance of population persistence can mask ahost of problems that may manifest in the long-term such as increased
susceptibility to disease, reduced probability of survival and recruit-ment or other genetic issues (i.e. breeding) related to lack of habitatconnectivity.
Much of Iowa illustrates the changes made to the land for crop pro-duction over the last two centuries; greater than 90% of the wetlandshave been drained and replaced with row crop agriculture, primarilycorn and soybeans (Whitney, 1994). Despite the dramatic changes,there is still a rich herpetofauna represented in Iowa and much of theMidwest. Although some amphibians persist, approximately 45% ofthe amphibian and reptile species in Iowa are imperiled because of hab-itat fragmentation and anthropogenic activities (Green, 2005; IDNR,2006). Thus, we chose the Des Moines Lobe of central Iowa to assessthe presence of pesticides and nutrients in water and sediment as indi-cators of habitat quality and to assess the bioaccumulation of pesticidesin the tissue of two amphibian species (chorus frogs (Pseudacristriseriata) and leopard frogs (Lithobates pipiens)). Furthermore, in2001, a major initiative between the state of Iowa and United StatesDepartment of Agriculture (USDA) Farm Service Agency enacted theConservation Reserve Enhancement Program (CREP) to help identifyand restore wetlands lost through landscape modifications as a meansto reduce nitrogen concentrations and loads in surface waters. TheDes Moines Lobe hosts 72 of these CREP sites in 29 counties. Theresulting wetlands appear to provide additional ecosystem servicessuch as habitat for migrating waterfowl (O'Neal et al., 2008), however,formany organisms, such as amphibians the related costs of livingwith-in a matrix of highly modified habitat have not been determined. Forexample, the value of increased habitat for species with low vagility(e.g., amphibians) is assumed to be high, but benefits may be negatedif the quality of the habitat is insufficient to support amphibian popula-tions' overtime.
Our objectivewas to determine if restoredwetlands in an agricultur-al landscape provide similar quality habitat for amphibians as adjacentreference wetlands as determined by the occurrence and distributionof 1) pesticides and nutrients in water, 2) pesticides in bed sedimentand 3) pesticides in tissues of leopard and chorus frogs, two amphibiansfound commonly in this area. Understanding the occurrence anddistribu-tion of contaminants provides information on habitat quality in restoredwetlands that can assist state and federal agencies, landowners, andresource managers in identifying and implementing conservation andmanagement actions for these and similar wetlands and their associatedamphibian fauna. Our data also provides useful covariates (i.e. pesticideand nutrient concentrations) for assessing population demographicsand the long-term trajectory of populations faced with the challenges ofliving in an altered landscape.
2. Materials and methods
2.1. Site information
Six wetlands in the Des Moines Lobe landform of central Iowa(Fig. 1) were sampled in 2012 and 2013 (3 restored and 3 reference).The restored wetlands were developed through the CREP and werepositioned on the landscape to receive substantial amounts of tile drain-agewater to reduce nitrate concentrations to surrounding surfacewaterbodies. Approximately, 80% of the flow into the restored wetlands isfrom tile drains and all wetlands sampled had several tile lines andditches leading directly into them. Two tile drains were observed atMarshall and Story while four large ditches with at least one outflowdrain were observed at Greene. All drains were considered lateralsandwere about 20–25 cm in diameter. The referencewetlands are likelyremnantwetlands but were restored from past agricultural use by land-owners and are not typically positioned in the landscape to accept asignificant amount of tile drainage from active agricultural fields andare not part of the CREP. Reference wetlands receive the majority oftheir water from overland flow (i.e. run-off) and, to a lesser extent,from shallow groundwater sources and tile drain outlets. Bjorkboda
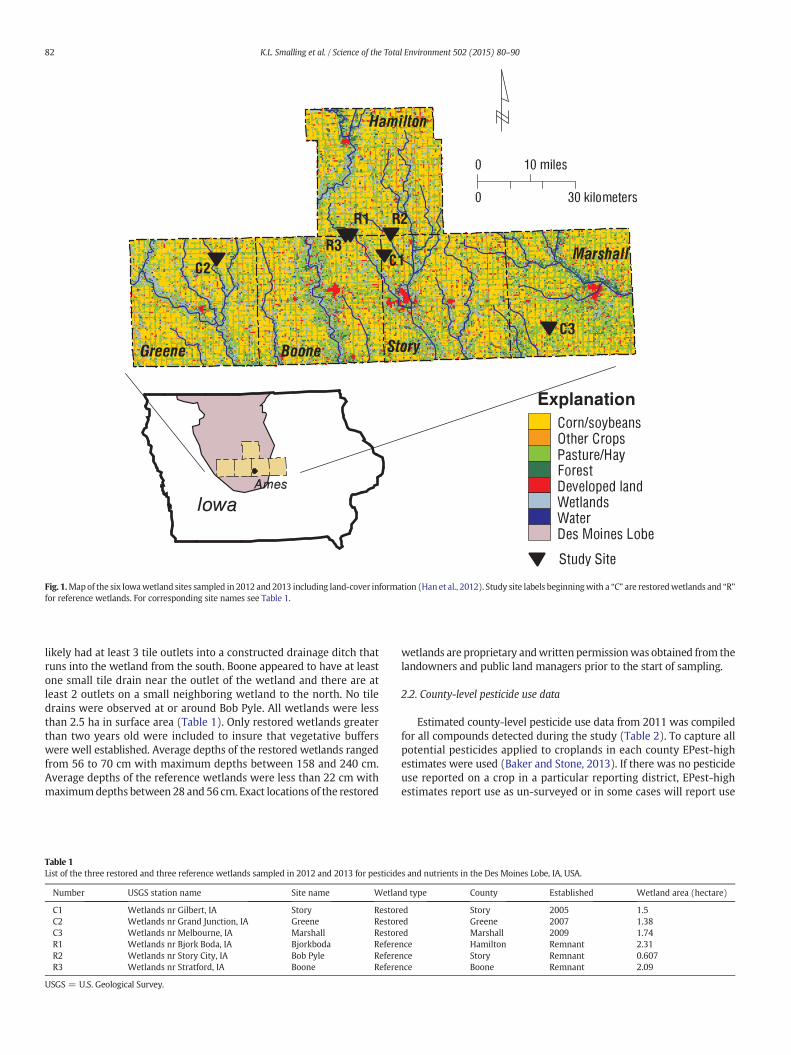
Fig. 1.Mapof the six Iowawetland sites sampled in 2012 and 2013 including land-cover information (Han et al., 2012). Study site labels beginningwith a “C” are restoredwetlands and “R”for reference wetlands. For corresponding site names see Table 1.
82 K.L. Smalling et al. / Science of the Total Environment 502 (2015) 80–90
likely had at least 3 tile outlets into a constructed drainage ditch thatruns into the wetland from the south. Boone appeared to have at leastone small tile drain near the outlet of the wetland and there are atleast 2 outlets on a small neighboring wetland to the north. No tiledrains were observed at or around Bob Pyle. All wetlands were lessthan 2.5 ha in surface area (Table 1). Only restored wetlands greaterthan two years old were included to insure that vegetative bufferswere well established. Average depths of the restored wetlands rangedfrom 56 to 70 cm with maximum depths between 158 and 240 cm.Average depths of the reference wetlands were less than 22 cm withmaximumdepths between 28 and 56 cm. Exact locations of the restored
Table 1List of the three restored and three reference wetlands sampled in 2012 and 2013 for pesticide
Number USGS station name Site name Wetlan
C1 Wetlands nr Gilbert, IA Story RestorC2 Wetlands nr Grand Junction, IA Greene RestorC3 Wetlands nr Melbourne, IA Marshall RestorR1 Wetlands nr Bjork Boda, IA Bjorkboda RefereR2 Wetlands nr Story City, IA Bob Pyle RefereR3 Wetlands nr Stratford, IA Boone Refere
USGS = U.S. Geological Survey.
wetlands are proprietary andwritten permissionwas obtained from thelandowners and public land managers prior to the start of sampling.
2.2. County-level pesticide use data
Estimated county-level pesticide use data from 2011 was compiledfor all compounds detected during the study (Table 2). To capture allpotential pesticides applied to croplands in each county EPest-highestimates were used (Baker and Stone, 2013). If there was no pesticideuse reported on a crop in a particular reporting district, EPest-highestimates report use as un-surveyed or in some cases will report use
s and nutrients in the Des Moines Lobe, IA, USA.
d type County Established Wetland area (hectare)
ed Story 2005 1.5ed Greene 2007 1.38ed Marshall 2009 1.74nce Hamilton Remnant 2.31nce Story Remnant 0.607nce Boone Remnant 2.09
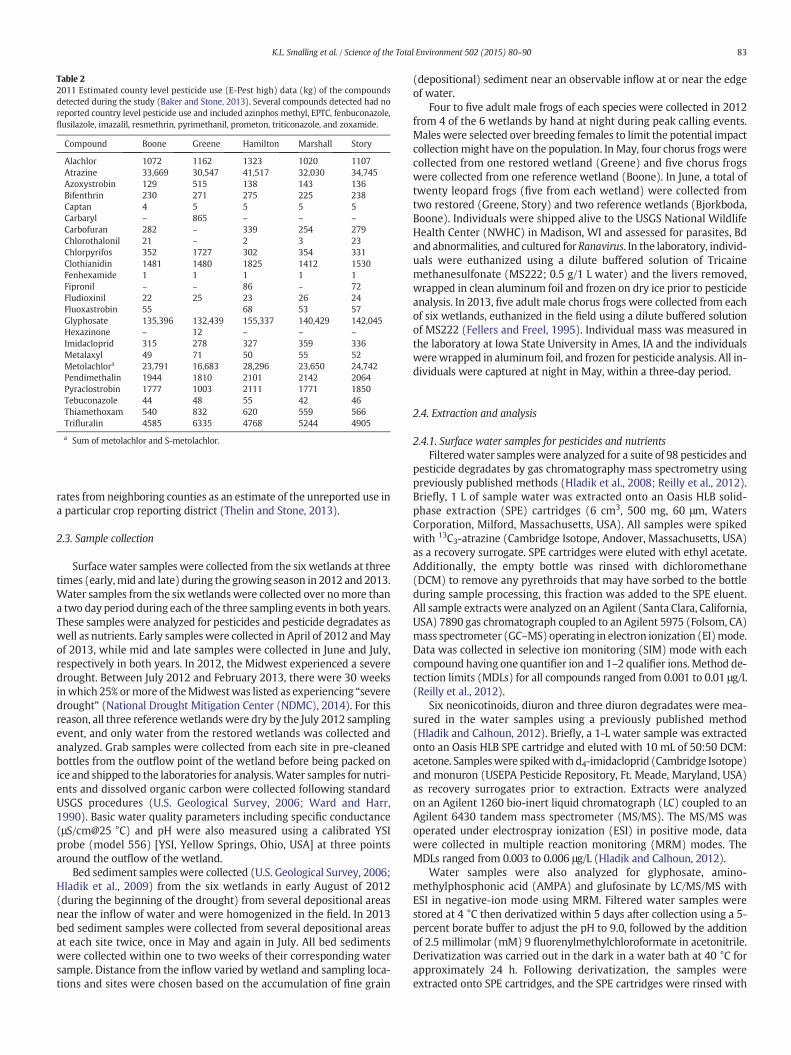
Table 22011 Estimated county level pesticide use (E-Pest high) data (kg) of the compoundsdetected during the study (Baker and Stone, 2013). Several compounds detected had noreported country level pesticide use and included azinphos methyl, EPTC, fenbuconazole,flusilazole, imazalil, resmethrin, pyrimethanil, prometon, triticonazole, and zoxamide.
Compound Boone Greene Hamilton Marshall Story
Alachlor 1072 1162 1323 1020 1107Atrazine 33,669 30,547 41,517 32,030 34,745Azoxystrobin 129 515 138 143 136Bifenthrin 230 271 275 225 238Captan 4 5 5 5 5Carbaryl – 865 – – –
Carbofuran 282 – 339 254 279Chlorothalonil 21 – 2 3 23Chlorpyrifos 352 1727 302 354 331Clothianidin 1481 1480 1825 1412 1530Fenhexamide 1 1 1 1 1Fipronil – – 86 – 72Fludioxinil 22 25 23 26 24Fluoxastrobin 55 68 53 57Glyphosate 135,396 132,439 155,337 140,429 142,045Hexazinone – 12 – – –
Imidacloprid 315 278 327 359 336Metalaxyl 49 71 50 55 52Metolachlora 23,791 16,683 28,296 23,650 24,742Pendimethalin 1944 1810 2101 2142 2064Pyraclostrobin 1777 1003 2111 1771 1850Tebuconazole 44 48 55 42 46Thiamethoxam 540 832 620 559 566Trifluralin 4585 6335 4768 5244 4905
a Sum of metolachlor and S-metolachlor.
83K.L. Smalling et al. / Science of the Total Environment 502 (2015) 80–90
rates from neighboring counties as an estimate of the unreported use ina particular crop reporting district (Thelin and Stone, 2013).
2.3. Sample collection
Surface water samples were collected from the six wetlands at threetimes (early,mid and late) during the growing season in 2012 and 2013.Water samples from the six wetlandswere collected over nomore thana two day period during each of the three sampling events in both years.These samples were analyzed for pesticides and pesticide degradates aswell as nutrients. Early samples were collected in April of 2012 andMayof 2013, while mid and late samples were collected in June and July,respectively in both years. In 2012, the Midwest experienced a severedrought. Between July 2012 and February 2013, there were 30 weeksinwhich 25% ormore of theMidwestwas listed as experiencing “severedrought” (National Drought Mitigation Center (NDMC), 2014). For thisreason, all three referencewetlands were dry by the July 2012 samplingevent, and only water from the restored wetlands was collected andanalyzed. Grab samples were collected from each site in pre-cleanedbottles from the outflow point of the wetland before being packed onice and shipped to the laboratories for analysis.Water samples for nutri-ents and dissolved organic carbon were collected following standardUSGS procedures (U.S. Geological Survey, 2006; Ward and Harr,1990). Basic water quality parameters including specific conductance(μS/cm@25 °C) and pH were also measured using a calibrated YSIprobe (model 556) [YSI, Yellow Springs, Ohio, USA] at three pointsaround the outflow of the wetland.
Bed sediment samples were collected (U.S. Geological Survey, 2006;Hladik et al., 2009) from the six wetlands in early August of 2012(during the beginning of the drought) from several depositional areasnear the inflow of water and were homogenized in the field. In 2013bed sediment samples were collected from several depositional areasat each site twice, once in May and again in July. All bed sedimentswere collected within one to two weeks of their corresponding watersample. Distance from the inflow varied by wetland and sampling loca-tions and sites were chosen based on the accumulation of fine grain
(depositional) sediment near an observable inflow at or near the edgeof water.
Four to five adult male frogs of each species were collected in 2012from 4 of the 6 wetlands by hand at night during peak calling events.Males were selected over breeding females to limit the potential impactcollectionmight have on the population. In May, four chorus frogs werecollected from one restored wetland (Greene) and five chorus frogswere collected from one reference wetland (Boone). In June, a total oftwenty leopard frogs (five from each wetland) were collected fromtwo restored (Greene, Story) and two reference wetlands (Bjorkboda,Boone). Individuals were shipped alive to the USGS National WildlifeHealth Center (NWHC) in Madison, WI and assessed for parasites, Bdand abnormalities, and cultured for Ranavirus. In the laboratory, individ-uals were euthanized using a dilute buffered solution of Tricainemethanesulfonate (MS222; 0.5 g/1 L water) and the livers removed,wrapped in clean aluminum foil and frozen on dry ice prior to pesticideanalysis. In 2013, five adult male chorus frogs were collected from eachof six wetlands, euthanized in the field using a dilute buffered solutionof MS222 (Fellers and Freel, 1995). Individual mass was measured inthe laboratory at Iowa State University in Ames, IA and the individualswerewrapped in aluminum foil, and frozen for pesticide analysis. All in-dividuals were captured at night in May, within a three-day period.
2.4. Extraction and analysis
2.4.1. Surface water samples for pesticides and nutrientsFilteredwater sampleswere analyzed for a suite of 98 pesticides and
pesticide degradates by gas chromatography mass spectrometry usingpreviously published methods (Hladik et al., 2008; Reilly et al., 2012).Briefly, 1 L of sample water was extracted onto an Oasis HLB solid-phase extraction (SPE) cartridges (6 cm3, 500 mg, 60 μm, WatersCorporation, Milford, Massachusetts, USA). All samples were spikedwith 13C3-atrazine (Cambridge Isotope, Andover, Massachusetts, USA)as a recovery surrogate. SPE cartridges were eluted with ethyl acetate.Additionally, the empty bottle was rinsed with dichloromethane(DCM) to remove any pyrethroids that may have sorbed to the bottleduring sample processing, this fraction was added to the SPE eluent.All sample extracts were analyzed on an Agilent (Santa Clara, California,USA) 7890 gas chromatograph coupled to an Agilent 5975 (Folsom, CA)mass spectrometer (GC–MS) operating in electron ionization (EI)mode.Data was collected in selective ion monitoring (SIM) mode with eachcompound having one quantifier ion and 1–2 qualifier ions. Method de-tection limits (MDLs) for all compounds ranged from 0.001 to 0.01 μg/L(Reilly et al., 2012).
Six neonicotinoids, diuron and three diuron degradates were mea-sured in the water samples using a previously published method(Hladik and Calhoun, 2012). Briefly, a 1-L water sample was extractedonto an Oasis HLB SPE cartridge and eluted with 10 mL of 50:50 DCM:acetone. Sampleswere spikedwith d4-imidacloprid (Cambridge Isotope)and monuron (USEPA Pesticide Repository, Ft. Meade, Maryland, USA)as recovery surrogates prior to extraction. Extracts were analyzedon an Agilent 1260 bio-inert liquid chromatograph (LC) coupled to anAgilent 6430 tandem mass spectrometer (MS/MS). The MS/MS wasoperated under electrospray ionization (ESI) in positive mode, datawere collected in multiple reaction monitoring (MRM) modes. TheMDLs ranged from 0.003 to 0.006 μg/L (Hladik and Calhoun, 2012).
Water samples were also analyzed for glyphosate, amino-methylphosphonic acid (AMPA) and glufosinate by LC/MS/MS withESI in negative-ion mode using MRM. Filtered water samples werestored at 4 °C then derivatized within 5 days after collection using a 5-percent borate buffer to adjust the pH to 9.0, followed by the additionof 2.5 millimolar (mM) 9 fluorenylmethylchloroformate in acetonitrile.Derivatization was carried out in the dark in a water bath at 40 °C forapproximately 24 h. Following derivatization, the samples wereextracted onto SPE cartridges, and the SPE cartridges were rinsed with
84 K.L. Smalling et al. / Science of the Total Environment 502 (2015) 80–90
500 μL of deionized water. MDLs for AMPA, glyphosate, and glufosinatein surface water were 20 ng/L (Meyer et al., 2009).
Nutrients, including total nitrogen, total phosphorous, orthophos-phate, and nitrate/nitrite, were analyzed in filtered and unfilteredwater samples by the National Water Quality Laboratory usingapproved methods outlined in Patton and Kryskalla (2003). MDLs fortotal nitrogen, total phosphorous, and nitrate/nitrite as nitrogen were0.05, 0.003, and 0.008 mg/L, respectively. Filtered water samples wereanalyzed for dissolved organic carbon (DOC) and total dissolved nitro-gen (TDN) by high-temperature catalytic combustion using a ShimadzuTOC-VCNS total organic carbon analyzer (Shimadzu Scientific Instru-ments, Columbia, Maryland) according to a modified version of UnitedStates Environmental Protection Agency (USEPA) Method 415.3 (Birdet al., 2003; Potter and Wimsatt, 2005).
2.4.2. Bed sediment samples for pesticidesBed sediment sampleswere extracted and analyzed for 94 pesticides
and pesticide degradates based on previously published methods(Smalling et al., 2013a; Hladik and McWayne, 2012). Briefly, wet sedi-ments (10 g) were spiked with trifluralin-d10, ring-13C-p,p′-DDE andphenoxy-13C-cis-permethrin (Cambridge Isotopes, Andover, MA, USA)as recovery surrogates, homogenizedwith sodium sulfate and extractedusing pressurized liquid extraction. Following extraction, extracts weredried over sodium sulfate, reduced and sulfur was removed by gel per-meation chromatography. Samples were again reduced to 0.5 mL, splitin half and subjected to two different clean-up methods: 1) 6%deactivated Florisil for all fungicides and 2) carbon/alumina stackedSPE cartridges for all herbicides and insecticides. Sample extracts wereanalyzed on an Agilent 5975 GC/MS (Santa Clara, California, USA) in EImode. Data were collected in SIM mode with each compound havingone quantifier ion and 1–2 qualifier ions. MDLs for all compounds inranged from 0.6 to 3.8 μg/kg sediment dry weight (Smalling et al.,2013a; Hladik and McWayne, 2012).
Bed-sediment samples were analyzed for organic carbon and nitro-gen content by combustion and thermal conductivity using a PerkinElmer CHNS/O elemental analyzer (Perkin Elmer Corporation, Waltham,Mass.) according to a modified version of USEPA 440.0 (Zimmermanet al., 2007). Dry, homogenized sediments were combusted at 925 °Cin silver boats after being exposed to concentrated hydrochloric acid(HCl) fumes in a desiccator for 24 h to remove inorganic carbon. Beforeanalysis, sediments were dried at 100 °C for 3 h. Acetanilide was usedfor instrument calibration. MDLs for carbon and nitrogen were 0.01%.
2.4.3. Tissue samples for pesticidesWhole bodies and livers were extracted and analyzed for 98
pesticides and pesticide degradates based on previously publishedmethods (Smalling et al., 2013b). Briefly, tissue samples (whole frogsor livers) were thawed and homogenized with Na2SO4 using a clean,solvent-rinsed mortar and pestle. Samples were spiked withtrifluralin-d10, ring-13C-p,p′-DDE andphenoxy-13C-cis-permethrin as re-covery surrogates and extracted with DCM using pressurize liquid ex-traction. Following extraction, sample extracts were dried overNa2SO4, reduced to 1 mL and 10% by volume of each raw extract wasallowed to evaporate to a constant weight in a fume hood for gravimet-ric lipid determination to the nearest 0.001 g using a microbalance. Amajority of the lipid was removed using gel permeation chromatogra-phy followed by 6% deactivated Florisil previously activated at 550 °Cfor 16 h. Prior to analysis, sampleswere reduced to 0.2mL, and a deuter-ated internal standard was added to each extract. Sample extracts wereanalyzed on an Agilent 7890 GC coupled to an Agilent 5975 MS operat-ing in EI mode. Data for all pesticides were collected in SIM mode witheach compound having one quantifier ion and 1 to 2 qualifier ions.MDLs for all compounds ranged from 0.5 to 4.2 μg/kg wet weight(Smalling et al., 2013b).
2.5. Quality control
All sample glassware was hand-washed and rinsed with tap waterfollowed by acetone and hexane prior to use. All solvents and other re-agents were American Chemical Society (ACS) grade or better (ThermoFisher Scientific). Pesticide standard materials were donated by theUSEPA National Pesticide Repository. Purities ranged from 95% to 99%.
Performance-based quality assurance and quality control includedthe parallel analysis of procedural blanks, matrix spikes, and replicatesin 10% of the samples analyzed for each matrix (water, sediment andtissue). Procedural blanks run with each batch of samples did notcontain detectable levels of pesticides or nutrients. Mean (±standarddeviation) of 13C-atrazine, imidacloprid-d4 and monuron added toeach water sample as recovery surrogates prior to extraction was105 ± 15%, 78 ± 6%, and 84 ± 8%, respectively. Mean (±standarddeviation) of trifluralin-d10, ring-13C p,p′-DDE and phenoxy-13C-cis-permethrin added prior to sediment samples extraction as recoverysurrogates was 83 ± 16%, 85 ± 14%, 89 ± 12%, respectively. Mean(±standard deviation) of trifluralin-d10, ring-13C p,p′-DDE andphenoxy-13C-cis-permethrin added prior to tissue sample extractionas recovery surrogates was 92 ± 15%, 101 ± 14%, and 100 ± 18%, re-spectively. Matrix spikes were analyzed in 10% of the water, sedimentand tissue samples and the recoveries ranged from 70% to 131% (medi-an of 92%), 61%–129% (median of 93%) and 60% to 129% (median of85%), respectively. Relative percent difference of all replicate sampleswas less than 25% for both water (pesticides and nutrients) andsediment (pesticides). Water samples were held for no longer than48 h at 4 °C prior to extraction for all pesticides except glyphosate andAMPA. Water samples for glyphosate and AMPA were stored frozen at−20 °C and held for no longer than 1 week prior to derivatization.Water samples for nutrients and DOC were held for no longer than1 week at 4 °C prior to analysis. Sediment and tissue for pesticideswere stored frozen at −20 °C and held for no longer than 1 year priorto extraction.
2.6. Statistical analyses
An alpha level of 0.05 and a 95% confidence interval was used for allstatistical analyses. Because the data was not normally distributed, aKruskal–Wallis one-way analysis of variance by ranks was used todetermine if there were significant differences in pesticide, nutrientand DOC concentrations in water between wetland types and years.The same test was used to determine if there were significant differ-ences in pesticide concentrations between, species, wetland type andyears. No statistical tests were conducted on the sediment data becausesample size was small. All non-detections were assigned a value of 1/2the method detection limit for all statistical tests. Statistical analyseswere performed using R software (R Development Core Team 2013, Vi-enna Austria).
3. Results and discussion
3.1. Water and sediment quality
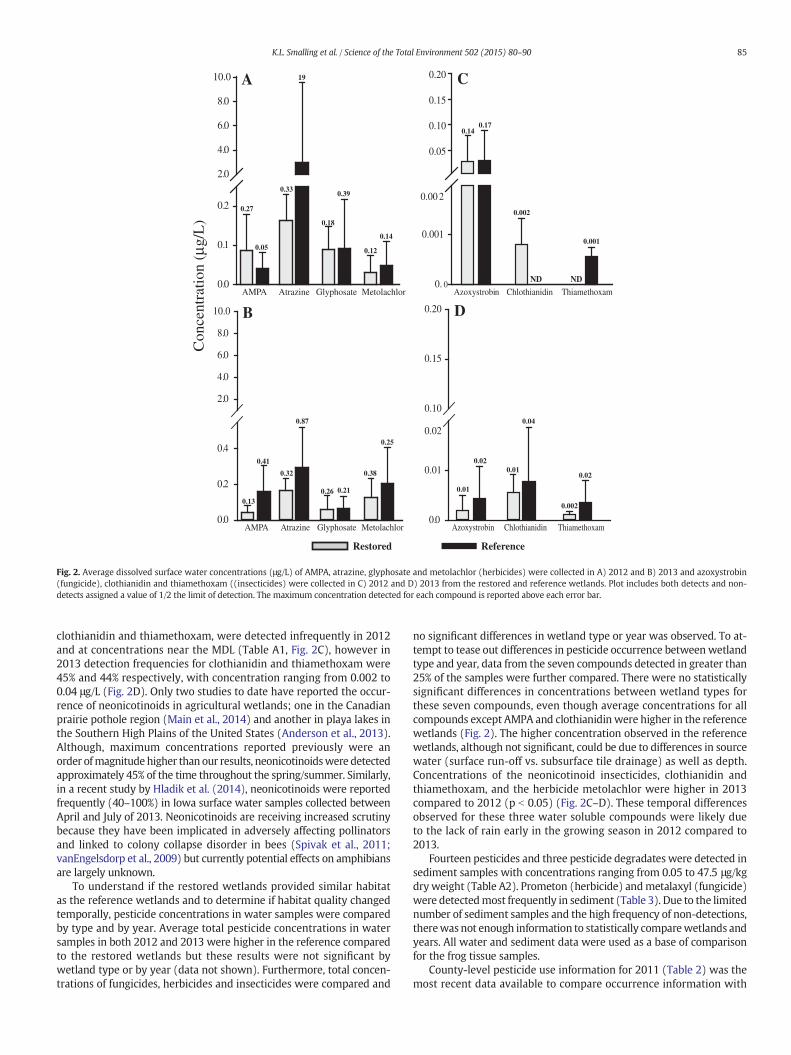
Thirty-two pesticides and pesticide degradates were detected inwater samples collected in both 2012 and 2013 from the 6 wetlandswith concentrations ranging from 0.1 to 19 μg/L (Table A1). Atrazinewas detected in all water samples collected in 2012 and 2013 and atthe highest concentration (19 μg/L) relative to the other pesticidesdetected (Fig. 2A–B). The most frequently detected pesticides in watersamples were atrazine, metolachlor, and glyphosate (all herbicides),and AMPA (glyphosate's primary degradate). These three herbicideswere the most heavily used in the study area (Table 2) and have histor-ically been among the most frequently detected pesticides in surfaceand groundwater in the Midwest (Battaglin et al., 2014; Battaglinet al., 2005; Kolpin et al., 1995). Two neonicotinoid insecticides,
Restored Reference
Con
cent
rati
on (
µg/L
)
0.0
0.1
0.2
2.0
4.0
6.0
8.0
10.0
AMPA Atrazine Glyphosate Metolachlor
0.27
0.05
0.33
19
0.18
0.39
0.12
0.14
A
0. 0
0.001
0.00 2
0.05
0.10
0.15
0.20
AzoxystrobinND
ChlothianidinND
Thiamethoxam
0.140.17
0.002
0.001
C
0.0
0.2
0.4
2.0
4.0
6.0
8.0
10.0
AMPA Atrazine Glyphosate Metolachlor
0.13
0.41
0.32
0.87
0.26 0.21
0.38
0.25
B
0.0
0.01
0.02
0.10
0.15
0.20
Azoxystrobin Chlothianidin Thiamethoxam
0.01
0.020.01
0.04
0.002
0.02
D
Fig. 2. Average dissolved surface water concentrations (μg/L) of AMPA, atrazine, glyphosate and metolachlor (herbicides) were collected in A) 2012 and B) 2013 and azoxystrobin(fungicide), clothianidin and thiamethoxam ((insecticides) were collected in C) 2012 and D) 2013 from the restored and reference wetlands. Plot includes both detects and non-detects assigned a value of 1/2 the limit of detection. The maximum concentration detected for each compound is reported above each error bar.
85K.L. Smalling et al. / Science of the Total Environment 502 (2015) 80–90
clothianidin and thiamethoxam, were detected infrequently in 2012and at concentrations near the MDL (Table A1, Fig. 2C), however in2013 detection frequencies for clothianidin and thiamethoxam were45% and 44% respectively, with concentration ranging from 0.002 to0.04 μg/L (Fig. 2D). Only two studies to date have reported the occur-rence of neonicotinoids in agricultural wetlands; one in the Canadianprairie pothole region (Main et al., 2014) and another in playa lakes inthe Southern High Plains of the United States (Anderson et al., 2013).Although, maximum concentrations reported previously were anorder ofmagnitudehigher than our results, neonicotinoidswere detectedapproximately 45% of the time throughout the spring/summer. Similarly,in a recent study by Hladik et al. (2014), neonicotinoids were reportedfrequently (40–100%) in Iowa surface water samples collected betweenApril and July of 2013. Neonicotinoids are receiving increased scrutinybecause they have been implicated in adversely affecting pollinatorsand linked to colony collapse disorder in bees (Spivak et al., 2011;vanEngelsdorp et al., 2009) but currently potential effects on amphibiansare largely unknown.
To understand if the restored wetlands provided similar habitatas the reference wetlands and to determine if habitat quality changedtemporally, pesticide concentrations in water samples were comparedby type and by year. Average total pesticide concentrations in watersamples in both 2012 and 2013 were higher in the reference comparedto the restored wetlands but these results were not significant bywetland type or by year (data not shown). Furthermore, total concen-trations of fungicides, herbicides and insecticides were compared and
no significant differences in wetland type or year was observed. To at-tempt to tease out differences in pesticide occurrence betweenwetlandtype and year, data from the seven compounds detected in greater than25% of the samples were further compared. There were no statisticallysignificant differences in concentrations between wetland types forthese seven compounds, even though average concentrations for allcompounds except AMPA and clothianidin were higher in the referencewetlands (Fig. 2). The higher concentration observed in the referencewetlands, although not significant, could be due to differences in sourcewater (surface run-off vs. subsurface tile drainage) as well as depth.Concentrations of the neonicotinoid insecticides, clothianidin andthiamethoxam, and the herbicide metolachlor were higher in 2013compared to 2012 (p b 0.05) (Fig. 2C–D). These temporal differencesobserved for these three water soluble compounds were likely dueto the lack of rain early in the growing season in 2012 compared to2013.
Fourteen pesticides and three pesticide degradates were detected insediment samples with concentrations ranging from 0.05 to 47.5 μg/kgdry weight (Table A2). Prometon (herbicide) andmetalaxyl (fungicide)were detectedmost frequently in sediment (Table 3). Due to the limitednumber of sediment samples and the high frequency of non-detections,therewas not enough information to statistically comparewetlands andyears. All water and sediment data were used as a base of comparisonfor the frog tissue samples.
County-level pesticide use information for 2011 (Table 2) was themost recent data available to compare occurrence information with
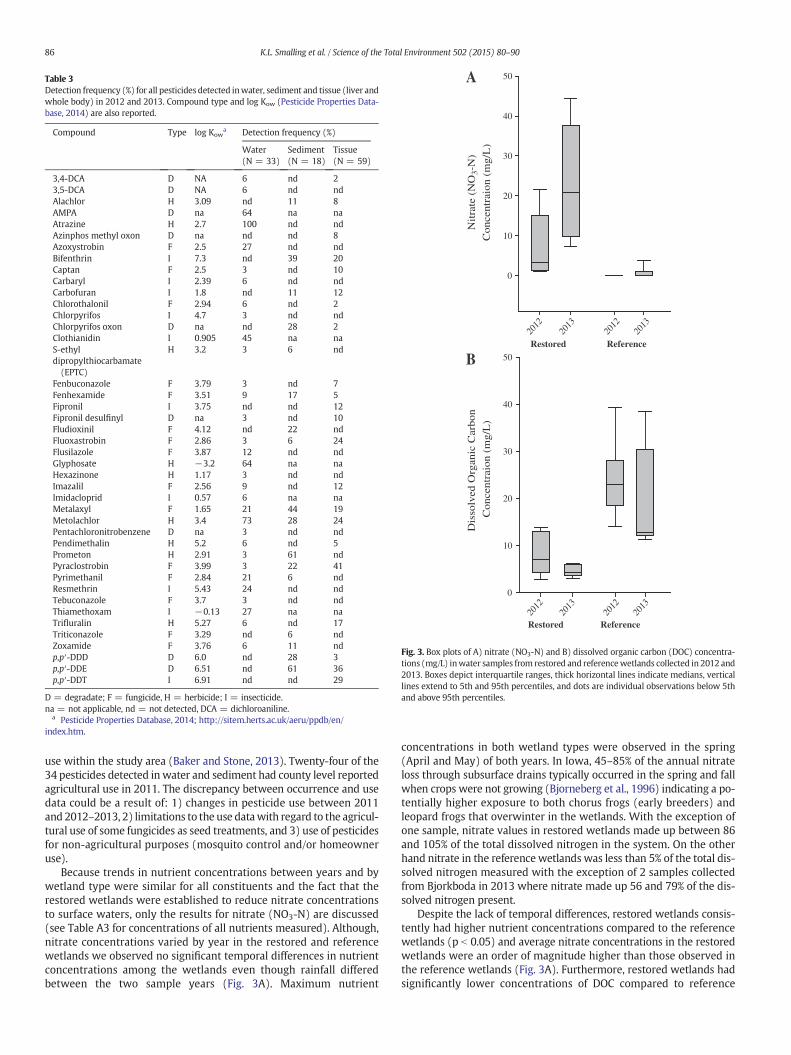
Table 3Detection frequency (%) for all pesticides detected inwater, sediment and tissue (liver andwhole body) in 2012 and 2013. Compound type and log Kow (Pesticide Properties Data-base, 2014) are also reported.
Compound Type log Kowa Detection frequency (%)
Water(N = 33)
Sediment(N = 18)
Tissue(N = 59)
3,4-DCA D NA 6 nd 23,5-DCA D NA 6 nd ndAlachlor H 3.09 nd 11 8AMPA D na 64 na naAtrazine H 2.7 100 nd ndAzinphos methyl oxon D na nd nd 8Azoxystrobin F 2.5 27 nd ndBifenthrin I 7.3 nd 39 20Captan F 2.5 3 nd 10Carbaryl I 2.39 6 nd ndCarbofuran I 1.8 nd 11 12Chlorothalonil F 2.94 6 nd 2Chlorpyrifos I 4.7 3 nd ndChlorpyrifos oxon D na nd 28 2Clothianidin I 0.905 45 na naS-ethyldipropylthiocarbamate(EPTC)
H 3.2 3 6 nd
Fenbuconazole F 3.79 3 nd 7Fenhexamide F 3.51 9 17 5Fipronil I 3.75 nd nd 12Fipronil desulfinyl D na 3 nd 10Fludioxinil F 4.12 nd 22 ndFluoxastrobin F 2.86 3 6 24Flusilazole F 3.87 12 nd ndGlyphosate H −3.2 64 na naHexazinone H 1.17 3 nd ndImazalil F 2.56 9 nd 12Imidacloprid I 0.57 6 na naMetalaxyl F 1.65 21 44 19Metolachlor H 3.4 73 28 24Pentachloronitrobenzene D na 3 nd ndPendimethalin H 5.2 6 nd 5Prometon H 2.91 3 61 ndPyraclostrobin F 3.99 3 22 41Pyrimethanil F 2.84 21 6 ndResmethrin I 5.43 24 nd ndTebuconazole F 3.7 3 nd ndThiamethoxam I −0.13 27 na naTrifluralin H 5.27 6 nd 17Triticonazole F 3.29 nd 6 ndZoxamide F 3.76 6 11 ndp,p′-DDD D 6.0 nd 28 3p,p′-DDE D 6.51 nd 61 36p,p′-DDT I 6.91 nd nd 29
D = degradate; F = fungicide, H = herbicide; I = insecticide.na = not applicable, nd = not detected, DCA = dichloroaniline.
a Pesticide Properties Database, 2014; http://sitem.herts.ac.uk/aeru/ppdb/en/index.htm.
2012
2013
2012
2013
Nit
rate
(N
O3-
N)
Con
cent
raio
n (m
g/L
)
0
10
20
30
40
50
Restored Reference
A
2012
2013
2012
2013
Dis
solv
ed O
rgan
ic C
arbo
n
Con
cent
raio
n (m
g/L
)
0
10
20
30
40
50
Restored Reference
B
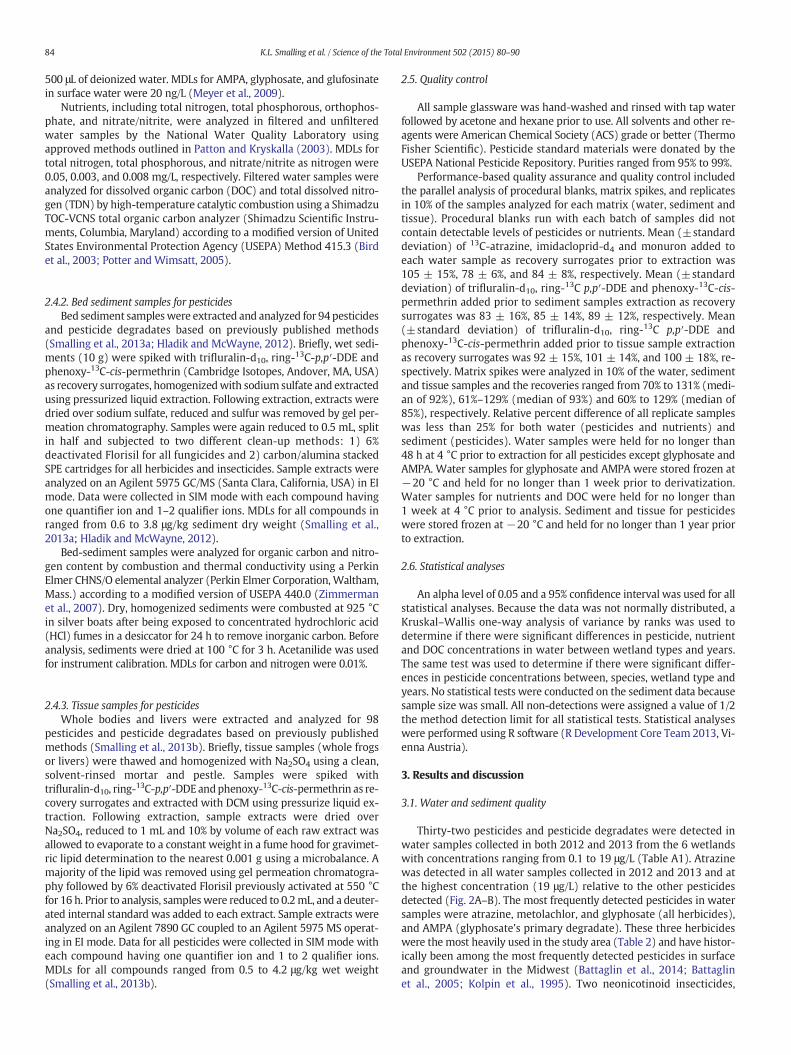
Fig. 3. Box plots of A) nitrate (NO3-N) and B) dissolved organic carbon (DOC) concentra-tions (mg/L) inwater samples from restored and referencewetlands collected in 2012 and2013. Boxes depict interquartile ranges, thick horizontal lines indicate medians, verticallines extend to 5th and 95th percentiles, and dots are individual observations below 5thand above 95th percentiles.
86 K.L. Smalling et al. / Science of the Total Environment 502 (2015) 80–90
use within the study area (Baker and Stone, 2013). Twenty-four of the34 pesticides detected in water and sediment had county level reportedagricultural use in 2011. The discrepancy between occurrence and usedata could be a result of: 1) changes in pesticide use between 2011and 2012–2013, 2) limitations to the use datawith regard to the agricul-tural use of some fungicides as seed treatments, and 3) use of pesticidesfor non-agricultural purposes (mosquito control and/or homeowneruse).
Because trends in nutrient concentrations between years and bywetland type were similar for all constituents and the fact that therestored wetlands were established to reduce nitrate concentrationsto surface waters, only the results for nitrate (NO3-N) are discussed(see Table A3 for concentrations of all nutrients measured). Although,nitrate concentrations varied by year in the restored and referencewetlands we observed no significant temporal differences in nutrientconcentrations among the wetlands even though rainfall differedbetween the two sample years (Fig. 3A). Maximum nutrient
concentrations in both wetland types were observed in the spring(April and May) of both years. In Iowa, 45–85% of the annual nitrateloss through subsurface drains typically occurred in the spring and fallwhen crops were not growing (Bjorneberg et al., 1996) indicating a po-tentially higher exposure to both chorus frogs (early breeders) andleopard frogs that overwinter in the wetlands. With the exception ofone sample, nitrate values in restored wetlands made up between 86and 105% of the total dissolved nitrogen in the system. On the otherhand nitrate in the reference wetlands was less than 5% of the total dis-solved nitrogen measured with the exception of 2 samples collectedfrom Bjorkboda in 2013 where nitrate made up 56 and 79% of the dis-solved nitrogen present.
Despite the lack of temporal differences, restored wetlands consis-tently had higher nutrient concentrations compared to the referencewetlands (p b 0.05) and average nitrate concentrations in the restoredwetlands were an order of magnitude higher than those observed inthe reference wetlands (Fig. 3A). Furthermore, restored wetlands hadsignificantly lower concentrations of DOC compared to reference
Fluo
xastr
obin
Meto
lachl
or
p,p'-D
DE
Pyra
clostr
obin
Con
cent
rati
on (
µg/k
g w
et w
t.)
0
40
80
200
400
600
800
1,000
Chorus frogs Leopard frogs
70
1,130
19 2019
330
1,500
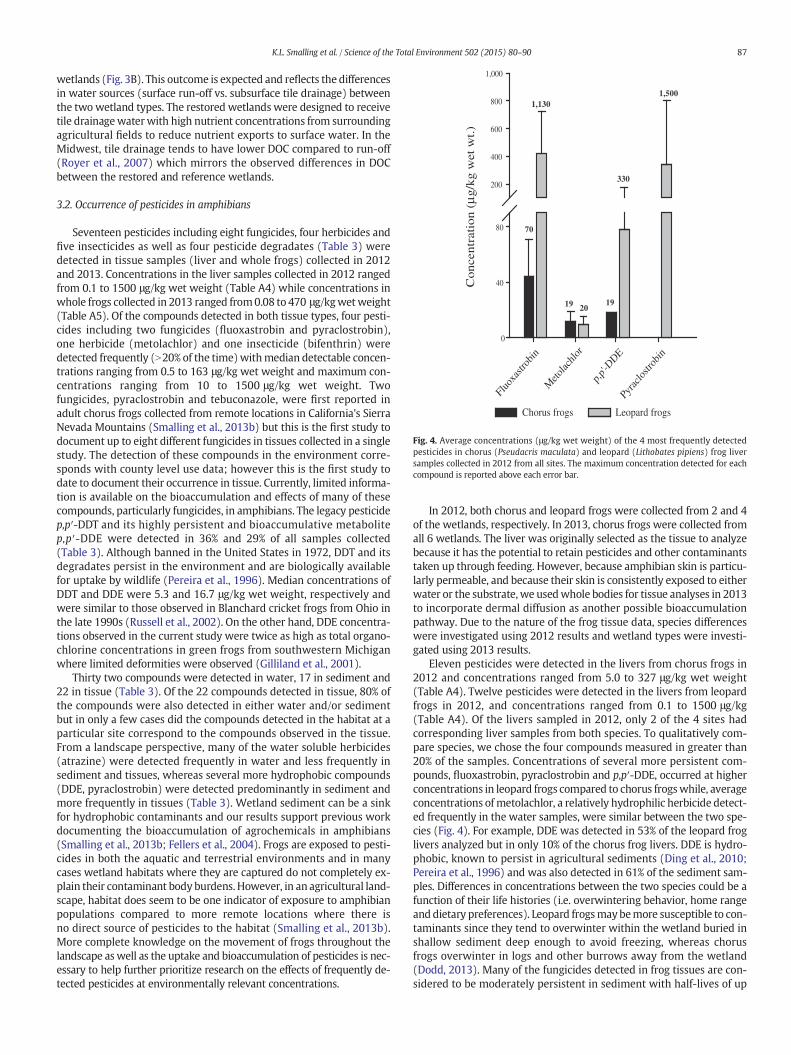
Fig. 4. Average concentrations (μg/kg wet weight) of the 4 most frequently detectedpesticides in chorus (Pseudacris maculata) and leopard (Lithobates pipiens) frog liversamples collected in 2012 from all sites. The maximum concentration detected for eachcompound is reported above each error bar.
87K.L. Smalling et al. / Science of the Total Environment 502 (2015) 80–90
wetlands (Fig. 3B). This outcome is expected and reflects the differencesin water sources (surface run-off vs. subsurface tile drainage) betweenthe two wetland types. The restored wetlands were designed to receivetile drainagewaterwith high nutrient concentrations from surroundingagricultural fields to reduce nutrient exports to surface water. In theMidwest, tile drainage tends to have lower DOC compared to run-off(Royer et al., 2007) which mirrors the observed differences in DOCbetween the restored and reference wetlands.
3.2. Occurrence of pesticides in amphibians
Seventeen pesticides including eight fungicides, four herbicides andfive insecticides as well as four pesticide degradates (Table 3) weredetected in tissue samples (liver and whole frogs) collected in 2012and 2013. Concentrations in the liver samples collected in 2012 rangedfrom 0.1 to 1500 μg/kg wet weight (Table A4) while concentrations inwhole frogs collected in 2013 ranged from0.08 to 470 μg/kgwetweight(Table A5). Of the compounds detected in both tissue types, four pesti-cides including two fungicides (fluoxastrobin and pyraclostrobin),one herbicide (metolachlor) and one insecticide (bifenthrin) weredetected frequently (N20% of the time)withmedian detectable concen-trations ranging from 0.5 to 163 μg/kg wet weight and maximum con-centrations ranging from 10 to 1500 μg/kg wet weight. Twofungicides, pyraclostrobin and tebuconazole, were first reported inadult chorus frogs collected from remote locations in California's SierraNevada Mountains (Smalling et al., 2013b) but this is the first study todocument up to eight different fungicides in tissues collected in a singlestudy. The detection of these compounds in the environment corre-sponds with county level use data; however this is the first study todate to document their occurrence in tissue. Currently, limited informa-tion is available on the bioaccumulation and effects of many of thesecompounds, particularly fungicides, in amphibians. The legacy pesticidep,p′-DDT and its highly persistent and bioaccumulative metabolitep,p′-DDE were detected in 36% and 29% of all samples collected(Table 3). Although banned in the United States in 1972, DDT and itsdegradates persist in the environment and are biologically availablefor uptake by wildlife (Pereira et al., 1996). Median concentrations ofDDT and DDE were 5.3 and 16.7 μg/kg wet weight, respectively andwere similar to those observed in Blanchard cricket frogs from Ohio inthe late 1990s (Russell et al., 2002). On the other hand, DDE concentra-tions observed in the current study were twice as high as total organo-chlorine concentrations in green frogs from southwestern Michiganwhere limited deformities were observed (Gilliland et al., 2001).
Thirty two compounds were detected in water, 17 in sediment and22 in tissue (Table 3). Of the 22 compounds detected in tissue, 80% ofthe compounds were also detected in either water and/or sedimentbut in only a few cases did the compounds detected in the habitat at aparticular site correspond to the compounds observed in the tissue.From a landscape perspective, many of the water soluble herbicides(atrazine) were detected frequently in water and less frequently insediment and tissues, whereas several more hydrophobic compounds(DDE, pyraclostrobin) were detected predominantly in sediment andmore frequently in tissues (Table 3). Wetland sediment can be a sinkfor hydrophobic contaminants and our results support previous workdocumenting the bioaccumulation of agrochemicals in amphibians(Smalling et al., 2013b; Fellers et al., 2004). Frogs are exposed to pesti-cides in both the aquatic and terrestrial environments and in manycases wetland habitats where they are captured do not completely ex-plain their contaminant body burdens. However, in an agricultural land-scape, habitat does seem to be one indicator of exposure to amphibianpopulations compared to more remote locations where there isno direct source of pesticides to the habitat (Smalling et al., 2013b).More complete knowledge on the movement of frogs throughout thelandscape aswell as the uptake and bioaccumulation of pesticides is nec-essary to help further prioritize research on the effects of frequently de-tected pesticides at environmentally relevant concentrations.
In 2012, both chorus and leopard frogs were collected from 2 and 4of the wetlands, respectively. In 2013, chorus frogs were collected fromall 6 wetlands. The liver was originally selected as the tissue to analyzebecause it has the potential to retain pesticides and other contaminantstaken up through feeding. However, because amphibian skin is particu-larly permeable, and because their skin is consistently exposed to eitherwater or the substrate, we usedwhole bodies for tissue analyses in 2013to incorporate dermal diffusion as another possible bioaccumulationpathway. Due to the nature of the frog tissue data, species differenceswere investigated using 2012 results and wetland types were investi-gated using 2013 results.
Eleven pesticides were detected in the livers from chorus frogs in2012 and concentrations ranged from 5.0 to 327 μg/kg wet weight(Table A4). Twelve pesticides were detected in the livers from leopardfrogs in 2012, and concentrations ranged from 0.1 to 1500 μg/kg(Table A4). Of the livers sampled in 2012, only 2 of the 4 sites hadcorresponding liver samples from both species. To qualitatively com-pare species, we chose the four compounds measured in greater than20% of the samples. Concentrations of several more persistent com-pounds, fluoxastrobin, pyraclostrobin and p,p′-DDE, occurred at higherconcentrations in leopard frogs compared to chorus frogswhile, averageconcentrations ofmetolachlor, a relatively hydrophilic herbicide detect-ed frequently in the water samples, were similar between the two spe-cies (Fig. 4). For example, DDE was detected in 53% of the leopard froglivers analyzed but in only 10% of the chorus frog livers. DDE is hydro-phobic, known to persist in agricultural sediments (Ding et al., 2010;Pereira et al., 1996) and was also detected in 61% of the sediment sam-ples. Differences in concentrations between the two species could be afunction of their life histories (i.e. overwintering behavior, home rangeanddietary preferences). Leopard frogsmaybemore susceptible to con-taminants since they tend to overwinter within the wetland buried inshallow sediment deep enough to avoid freezing, whereas chorusfrogs overwinter in logs and other burrows away from the wetland(Dodd, 2013). Many of the fungicides detected in frog tissues are con-sidered to be moderately persistent in sediment with half-lives of up
Restored Reference
Co
nce
ntr
atio
n (
µg/k
g w
et w
t)
Story
Greene
Marshall
Bjorkboda
Boone
Bob Pyle
0
100
200
300
400
500
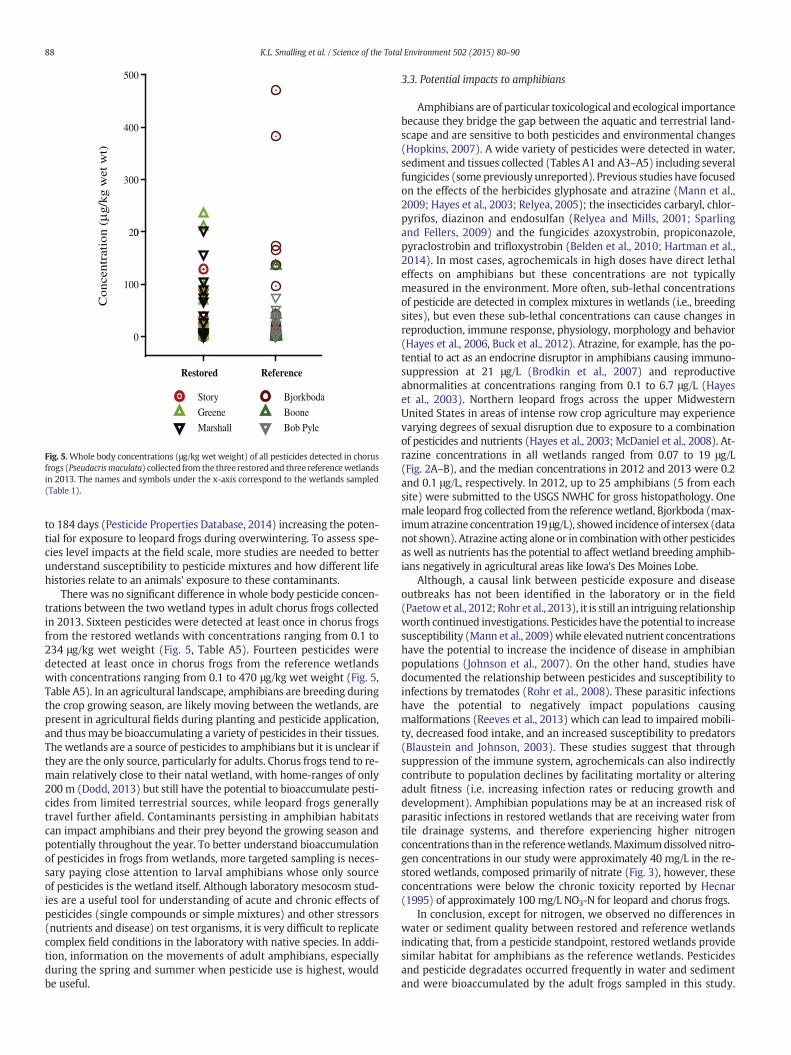
Fig. 5.Whole body concentrations (μg/kg wet weight) of all pesticides detected in chorusfrogs (Pseudacrismaculata) collected from the three restored and three referencewetlandsin 2013. The names and symbols under the x-axis correspond to the wetlands sampled(Table 1).
88 K.L. Smalling et al. / Science of the Total Environment 502 (2015) 80–90
to 184 days (Pesticide Properties Database, 2014) increasing the poten-tial for exposure to leopard frogs during overwintering. To assess spe-cies level impacts at the field scale, more studies are needed to betterunderstand susceptibility to pesticide mixtures and how different lifehistories relate to an animals' exposure to these contaminants.
There was no significant difference in whole body pesticide concen-trations between the two wetland types in adult chorus frogs collectedin 2013. Sixteen pesticides were detected at least once in chorus frogsfrom the restored wetlands with concentrations ranging from 0.1 to234 μg/kg wet weight (Fig. 5, Table A5). Fourteen pesticides weredetected at least once in chorus frogs from the reference wetlandswith concentrations ranging from 0.1 to 470 μg/kg wet weight (Fig. 5,Table A5). In an agricultural landscape, amphibians are breeding duringthe crop growing season, are likely moving between the wetlands, arepresent in agricultural fields during planting and pesticide application,and thusmay be bioaccumulating a variety of pesticides in their tissues.The wetlands are a source of pesticides to amphibians but it is unclear ifthey are the only source, particularly for adults. Chorus frogs tend to re-main relatively close to their natal wetland, with home-ranges of only200 m (Dodd, 2013) but still have the potential to bioaccumulate pesti-cides from limited terrestrial sources, while leopard frogs generallytravel further afield. Contaminants persisting in amphibian habitatscan impact amphibians and their prey beyond the growing season andpotentially throughout the year. To better understand bioaccumulationof pesticides in frogs from wetlands, more targeted sampling is neces-sary paying close attention to larval amphibians whose only sourceof pesticides is the wetland itself. Although laboratory mesocosm stud-ies are a useful tool for understanding of acute and chronic effects ofpesticides (single compounds or simple mixtures) and other stressors(nutrients and disease) on test organisms, it is very difficult to replicatecomplex field conditions in the laboratory with native species. In addi-tion, information on the movements of adult amphibians, especiallyduring the spring and summer when pesticide use is highest, wouldbe useful.
3.3. Potential impacts to amphibians
Amphibians are of particular toxicological and ecological importancebecause they bridge the gap between the aquatic and terrestrial land-scape and are sensitive to both pesticides and environmental changes(Hopkins, 2007). A wide variety of pesticides were detected in water,sediment and tissues collected (Tables A1 and A3–A5) including severalfungicides (some previously unreported). Previous studies have focusedon the effects of the herbicides glyphosate and atrazine (Mann et al.,2009; Hayes et al., 2003; Relyea, 2005); the insecticides carbaryl, chlor-pyrifos, diazinon and endosulfan (Relyea and Mills, 2001; Sparlingand Fellers, 2009) and the fungicides azoxystrobin, propiconazole,pyraclostrobin and trifloxystrobin (Belden et al., 2010; Hartman et al.,2014). In most cases, agrochemicals in high doses have direct lethaleffects on amphibians but these concentrations are not typicallymeasured in the environment. More often, sub-lethal concentrationsof pesticide are detected in complex mixtures in wetlands (i.e., breedingsites), but even these sub-lethal concentrations can cause changes inreproduction, immune response, physiology, morphology and behavior(Hayes et al., 2006, Buck et al., 2012). Atrazine, for example, has the po-tential to act as an endocrine disruptor in amphibians causing immuno-suppression at 21 μg/L (Brodkin et al., 2007) and reproductiveabnormalities at concentrations ranging from 0.1 to 6.7 μg/L (Hayeset al., 2003). Northern leopard frogs across the upper MidwesternUnited States in areas of intense row crop agriculture may experiencevarying degrees of sexual disruption due to exposure to a combinationof pesticides and nutrients (Hayes et al., 2003; McDaniel et al., 2008). At-razine concentrations in all wetlands ranged from 0.07 to 19 μg/L(Fig. 2A–B), and the median concentrations in 2012 and 2013 were 0.2and 0.1 μg/L, respectively. In 2012, up to 25 amphibians (5 from eachsite) were submitted to the USGS NWHC for gross histopathology. Onemale leopard frog collected from the referencewetland, Bjorkboda (max-imumatrazine concentration19 μg/L), showed incidence of intersex (datanot shown). Atrazine acting alone or in combinationwith other pesticidesas well as nutrients has the potential to affect wetland breeding amphib-ians negatively in agricultural areas like Iowa's Des Moines Lobe.
Although, a causal link between pesticide exposure and diseaseoutbreaks has not been identified in the laboratory or in the field(Paetowet al., 2012; Rohr et al., 2013), it is still an intriguing relationshipworth continued investigations. Pesticides have the potential to increasesusceptibility (Mann et al., 2009)while elevated nutrient concentrationshave the potential to increase the incidence of disease in amphibianpopulations (Johnson et al., 2007). On the other hand, studies havedocumented the relationship between pesticides and susceptibility toinfections by trematodes (Rohr et al., 2008). These parasitic infectionshave the potential to negatively impact populations causingmalformations (Reeves et al., 2013) which can lead to impaired mobili-ty, decreased food intake, and an increased susceptibility to predators(Blaustein and Johnson, 2003). These studies suggest that throughsuppression of the immune system, agrochemicals can also indirectlycontribute to population declines by facilitating mortality or alteringadult fitness (i.e. increasing infection rates or reducing growth anddevelopment). Amphibian populations may be at an increased risk ofparasitic infections in restored wetlands that are receiving water fromtile drainage systems, and therefore experiencing higher nitrogenconcentrations than in the referencewetlands.Maximumdissolvednitro-gen concentrations in our study were approximately 40 mg/L in the re-stored wetlands, composed primarily of nitrate (Fig. 3), however, theseconcentrations were below the chronic toxicity reported by Hecnar(1995) of approximately 100 mg/L NO3-N for leopard and chorus frogs.
In conclusion, except for nitrogen, we observed no differences inwater or sediment quality between restored and reference wetlandsindicating that, from a pesticide standpoint, restored wetlands providesimilar habitat for amphibians as the reference wetlands. Pesticidesand pesticide degradates occurred frequently in water and sedimentand were bioaccumulated by the adult frogs sampled in this study.
89K.L. Smalling et al. / Science of the Total Environment 502 (2015) 80–90
Amphibians residing and breeding in both restored and reference wet-lands in an agricultural landscape are exposed to a wide variety of con-taminants throughout their lifecycle and the potential impacts of theseenvironmental mixtures are unknown. Also, quantifying the relation-ship between habitat quality (such as pesticide and nutrient levels)and the prevalence of disease and parasites in both restored and refer-ence wetlands are needed to manage quality habitat for amphibians.Furthermore, understanding and documenting the quality of the habitatavailable for amphibians will help prioritize research necessary to deci-pher the effects of pesticides, nutrients, habitat loss/degradation andother potential stressors on the long term viability and managementof native amphibian populations in an agricultural landscape.
Supplemental data associated with the article can be found, in theonline version, at PANGAEA. Supplementary data associated with thisarticle can be found, in the online version, at doi.http://dx.doi.org/10.1016/j.scitotenv.2014.08.114.
Role of the funding source
This study was funded by the U.S. Geological Survey AmphibianResearch andMonitoring Initiative (ARMI). The managers of the sourceof funding did not participate in the design of the study, nor in the inter-pretation or writing of the manuscript. All such decisions were solelymade by the authors.
Acknowledgments
The authors thank M. McWayne and C. Sanders of the U.S. GeologicalSurvey Pesticide Fate ResearchGroup in Sacramento, CA andDr.M.Meyerand staff at the USGS Organic Geochemistry Research Laboratory inLawrence, KS for their help with sample processing and analysis.Thank you to E. Nilsen of the USGS for her thoughtful colleague reviewof our manuscript. We would also like to thank J. Oberheim-Vorwald,K. Edmunds, L. Truong, J. Harmon, and K. Flood for assistance in thefield, as well as S. Richmond, M. Lechtenberg and all the landownersthat allowed us access to their wetlands. Any use of trade, firm, or prod-uct names in this article is for descriptive purposes only and does notimply endorsement by the U.S. Government. All individuals werecollected under a State of Iowa collectors permit number SC 699. TheIowa State University Institutional Animal Care and Use Committee(IACUC) approved the use of vertebrate animals under ISU IACUCprotocol # 3-12-7324-D. This is contribution number 482 of the U.S.Geological Survey Amphibian Research and Monitoring Initiative(ARMI).
References
Anderson TA, Salice CJ, Erickson RA, McMurray ST, Cox SB, Smith LM. Effects of land-useand precipitation on pesticides and water quality in playa lakes in the southernhigh plains. Chemosphere 2013;92:84–90.
Baker NT, Stone WW. Preliminary estimates of annual agricultural pesticide use forcounties of the conterminous United States, 2010–11: U.S. Geological SurveyOpen-File Report 2013-1295. [2-p. pamphlet, 14 tables] http://dx.doi.org/10.3133/ofr20131295, 2013.
Battaglin WA, Kolpin DW, Scribner EA, Kuivila KM, Sandstrom MW. Glyphosate, otherherbicides and transformation products in Midwestern streams, 2002. JAWRA2005;41:323–32.
Battaglin WA, Meyer MT, Kuivila KM, Dietze JE. Glyphosate and its degradation productAMPA occur frequently and widely in U.S. soils, surface water, groundwater, andprecipitation. JAWRA 2014;50(2):275–90. http://dx.doi.org/10.1111/jawr.12159.
Belden J, McMurray S, Smith L, Reilley P. Acute toxicity of fungicide formulations toamphibians and environmentally relevant concentrations. Environ Toxicol Chem2010;29:2477–80.
Bird SM, FramMS, Crepeau KL. Method of analysis by the U.S. Geological Survey CaliforniaDistrict Sacramento Laboratory—determination of dissolved organic carbon in waterby high temperature catalytic oxidation, method validation and quality controlpractices: U.S. Geological Survey Open-File Report 2003-366; 2003 [14 pp.].
Bjorneberg DL, Kanwar RS, Melvin SW. Seasonal changes in flow and nitrate N loss fromsubsurface drains. Trans ASAE 1996;36:961–76.
Blaustein AR, Johnson PT. The complexity of deformed amphibians. Front Ecol Environ2003;1(2):87–94.
BooneMD. Examining the single and interactive effects of three insecticides on amphibianmetamorphosis. Environ Toxicol Chem 2008;27:1561–8.
Boone MD, Bridges CM, Fairchild JF, Little EE. Multiple sublethal chemicals negativelyaffect tadpoles of the green frog, Rana clamitans. Environ Toxicol Chem 2005;24:1267–72.
Brodkin MA, Madhoun H, Rameswaran M, Vatnick I. Atrazine is an immune disruptor inadult northern leopard frogs (Rana pipiens). Environ Toxicol Chem 2007;26(1):80–4.
Bruhl CA, Schmidt T, Pieper S, Alscher A. Terrestrial pesticide exposure of amphibians: anunderestimated global decline? Sci Rep 2003;3:1135. http://dx.doi.org/10.1038/srep01135.
Buck JC, Scheessele EA, Relyea RA, Blaustein AR. The effects of multiple stressors onwetland communities: pesticides, pathogens and competing amphibians. FreshwaterBiol 2012;57(1):61–73.
ChristinMS, Ménard L, Gendron AD, Ruby S, Cyr D, Marcogliese DJ, et al. Effects of agricul-tural pesticides on the immune system of Xenopus laevis and Rana pipiens. AquatToxicol 2004;67(1):33–43.
Collins JP, Storfer A. Global amphibian declines: sorting the hypotheses. Divers Distrib2003;9:89–98.
Davidson C, Shafer HB, JenningsMR. Spatial tests of the pesticide drift, habitat destruction,UV-B, and climate-change hypotheses for California amphibian declines. Conserv Biol2002;16:1588–601.
Davidson C, Benard MF, Shaffer HB, Parker JM, O'Leary C, Conlon JM, et al. Effects ofchytrid and carbaryl exposure on survival, growth and skin peptide defenses infoothill yellow-legged frogs. Environ Sci Technol 2007;41:1771–6.
Delis PR, Mushinsky HR, McCoy ED. Declines of some west-central Florida anuranpopulations in response to habitat degradation. Biodivers Conserv 1996;5:1579–95.
Ding Y, Harwood AD, Foslund HM, Lydy MJ. Distribution and toxicity of sediment-associated pesticides in urban and agricultural waterways from Illinois, USA. EnvironToxicol Chem 2010;29(1):149–57.
Dodd CKFrogs of the United States and Canada, vol. 1. Johns Hopkins University Press;2013.
Fellers GM, Freel KL. A standardized protocol for surveying aquatic amphibians. NPS/WRUC/NRTR-95-001. Technical Report. Davis, CA, USA: National Biological Service,Cooperative Park Studies Unit, University of California; 1995.
Fellers GM, McConnell LL, Pratt D, Datta S. Pesticides in mountain yellow-legged frogs(Rana muscosa) from the Sierra NevadaMountains of California, USA. Environ ToxicolChem 2004;23:2170–7.
Gahl MK, Pauli DB, Houlahan JF. Effects of chytrid fungus and a glyphosate-based fungi-cides on survival and growth of wood frogs (Lithobates sylvaticus). Ecol App 2011;21:2521–9.
Gilliland CD, Summer CL, Gilliland MG, Kannan K, Villeneuve DL, Coady K, et al. Organo-chlorine insecticides, polychlorinated biphenyls, and metals in water, sediment andgreen frogs from Southwestern Michigan. Chemosphere 2001;44:327–39.
Gilliom RJ. Pesticides in the nation's streams and groundwater. Environ Sci Technol 2007;41(10):3408–14.
Green DM. Bufo americanus. In: Lannoo M, editor. Amphibian declines. Berkeley, CA USA:University of California Press; 2005.
Groner ML, Relyea RA. A tale of two pesticides: how common insecticides affect aquaticcommunities. Freshwater Biol 2011;56:2391–404.
HanW, Yang Z, Di L, Mueller R. CropScape: AWeb service based application for exploringand disseminating US conterminous geospatial cropland data products for decisionsupport. Comput Electron Agr 2012;84:111–23.
Hartel T, Bancila R, Cogalniceanu D. Spatial and temporal variability of aquatic habitat useby amphibians in a hydrologically modified landscape. Freshwater Biol 2001;56:2288–98.
Hartman EAH, Belden JB, Smith LM, McMurry ST. Chronic effects of strobilurin fungicideson development, growth and mortality of larval Great Plains toads (Bufo cognatus).Ecotoxicology 2014;23:396–403.
Hayes T, Haston K, Tsui M, Hoang A, Haeffele C, Vonk A. Atrazine-induced hermaphrodit-ism at 0.1 ppb in American leopard frogs (Rana pipiens): laboratory and fieldevidence. Environ Health Persp 2003;111(4):568–75.
Hayes TB, Case P, Chui S, Chung D, Haefele C, Haston K, et al. Pesticidemixtures, endocrinedisruption, and amphibian declines: are we underestimating the impact? EnvironHealth Persp 2006;114:40–50.
Hecnar SJ. Acute and chronic toxicity of ammonium-nitrate fertilizer to amphibians fromsouthern Ontario. Environ Toxicol Chem 1995;14(12):2131–7.
Hladik ML, Calhoun DL. Analysis of the herbicide diuron, three diuron degradates, and sixneonicotinoid insecticides in water—method details and application to two Georgiastreams: U.S. Geological Survey Scientific Investigations Report 2012-5206. http://pubs.usgs.gov/sir/2012/5206, 2012. [10 pp.].
Hladik ML, McWayne MM. Methods of analysis—determination of pesticides in sedimentusing gas chromatography/mass spectrometry: U.S. Geological Survey Techniquesand, Methods 5-C3. http://pubs.usgs.gov/tm/tm5c3, 2012. [18 pp.].
Hladik ML, Smalling KL, Kuivila KM. A multi-residue method for the analysis and pesti-cides and pesticide degradates in water using Oasis HLB solid phase extraction andgas chromatography–ion trap mass spectrometry. Bull Environ Contam Toxicol2008;80:139–44.
Hladik ML, Orlando JL, Kuivila KM. Collection of pyrethroids in water and sediment matri-ces: development and validation of a standard operating procedure: U.S. GeologicalSurvey Scientific Investigations Report 2009-5012. http://pubs.usgs.gov/sir/2009/5012/, 2009. [22 pp.].
Hladik ML, Kolpin DW, Kuivila KM. Widespread occurrence of neonicotinoid insecticidesin streams in a high corn and soybean producing region, USA. Environ Pollut 2014;193:189–96.
Hopkins WA. Amphibians as models for studying environmental change. ILAR J 2007;48:270–7.
90 K.L. Smalling et al. / Science of the Total Environment 502 (2015) 80–90
Howe CM, Berrill M, Pauli BD, Helbing CC, Werry K, Veldhoen N. Toxicity of glyphosate-based pesticides to four North American frog species. Environ Toxicol Chem 2004;23:1928–38.
IDNR. Iowa Wildlife Action Plan. Iowa Department of Natural Resources; 2006.Johnson PT, Chase JM, Dosch KL, Hartson RB, Gross JA, Larson DJ, et al. Aquatic eutrophi-
cation promotes pathogenic infection in amphibians. Proc Natl Acad Sci U S A 2007;104(40):15781–6.
Kiesecker JM. Synergism between trematode infection and pesticide exposure: a link toamphibian limb deformities in nature? Proc Natl Acad Sci U S A 2002;99:9900–4.
King KC, McLaughlin JD, Gendron AD, Pauli BD, Giroux I, Rondeau B, et al. Impacts ofagriculture on the parasite communities of northern leopard frogs (Rana pipiens) insouthern Quebec, Canada. Parasitology 2007;134:2063–80.
Kolozsvary MB, Swinhart RK. Habitat fragmentations and the distribution of amphibians:patch and landscape correlates in farmland. Can J Zoolog 1999;77(8):1288–99.
Kolpin DW, Kalkhoff SJ, Goolsby DA, Sneck-Fahrer DA, Thurman EM. Occurrence of selectedherbicides and herbicide degradation products in Iowa's ground water, 1995. GroundWater 1995;35(4):679–88.
Main AR, Headley JV, Peru KM, Michel NL, Cessna AJ, Morrisey CA. Widespread use andfrequent detection of neonicotinoid insecticides in wetlands of Canada's Prairie Pot-hole Region. PLoS One 2014;9(3):e92821. http://dx.doi.org/10.1371/journal.pone.0092821.
Mann RM, Hyne RV, Choung CB, Wilson SP. Amphibians and agricultural chemicals:review of the risks in a complex environment. Environ Pollut 2009;157:2903–27.
McDaniel TV, Martin PA, Struger J, Marvin CH, McMaster ME, Clarence S, et al. Potentialendocrine disruption of sexual development in free ranging male northern leopardfrogs (Rana pipiens) and green frogs (Rana clamitans) from areas of intensive rowcrop agriculture. Aquatic Toxicol 2008;88(4):230–42.
Meyer MT, Loftin KA, Lee EA, Hinshaw GH, Dietze JE, Scribner EA. Determination of glyph-osate, its degradation product aminomethylphosphonic acid, and glufosinate. Waterby isotope dilution and online solid-phase extraction and liquid chromatography/tandem mass spectrometry: U.S. Geological Survey Techniques and Methods; 2009[book 5, chap. A10, 32 pp.].
National Drought Mitigation Center (NDMC). United States drought monitor archives.http://droughtmonitor.unl.edu/, 2014.
O'Neal BJ, Heske EJ, Stafford JD. Waterbird response to wetlands restored through theConservation Reserve Enhancement Program. J Wildlife Manage 2008;72:654–64.
Paetow LJ, McLaughlin JD, Cue RI, Pauli BD, Marcogliese DJ. Effects of herbicides and thechytrid fungus Batrachochytrium dendrobatidis on the health of post-metamorphicnorthern leopard frogs (Lithobates pipiens). Ecotox Environ Safe 2012;80:372–80.
Patton CJ, Kryskalla JR. Methods of Analysis by the U.S. Geological Survey National WaterQuality Laboratory—evaluation of alkaline persulfate digestion as an alternative toKjeldahl digestion for determination of total and dissolved nitrogen and phosphorusin Water: U.S. Geological SurveyWater-Resources Investigations Report 03–4174;2003. http://nwql.usgs.gov/pubs/WRIR/WRIR-03-4174.pdf [33 pp.].
Pereira W, Domagalski JL, Hostetteler F, Brown LR, Rapp JB. Occurrence and accumulationof pesticides and organic contaminants in river sediment, water and clam tissuesfrom the San Joaquin River and tributaries, California. Environ Toxicol Chem 1996;15:172–80.
Pesticide Properties Database http://sitem.herts.ac.uk/aeru/footprint/index2.htm, 2014.Potter BB, Wimsatt JC. Measurement of total organic carbon, dissolved organic carbon
and specific UV absorbance at 254 nm in source water and drinking water: U.S.Washington, DC: Environmental Protection Agency; 2005 [EPA/600/R-05/055,Method 415.3].
Development Core R, Team R. A language and environment for statistical computing. RFoundation for Statistical Computing. Austria: Vienna; 2013 [ISBN 3-900051-07-0,URL http://www.R-project.org].
Reeves MK,Medley KA, Pinkney AE, HolyoakM, Johnson PTJ, LanooMJ. Localized hotspotsdrive continental geography of abnormal amphibians on U.S. Wildlife Refuges. PLoSOne 2013;8(11):e77467.
Reilly TJ, Smalling KL, Orlando JL, Kuivila KM. Occurrence of boscalid and other selectedfungicides in surface water and groundwater in three targeted use areas in theUnited States. Chemosphere 2012;89:228–34.
Relyea RA. The lethal impacts of Roundup and predatory stress on six species of NorthAmerican tadpoles. Arch Environ Con Tox 2005;48:351–7.
Relyea R, Mills NN. Predator-induced stress makes the pesticide carbaryl more deadly togray tree frog tadpoles (Hyla versicolor). Proc Natl Acad Sci U S A 2001;98:2491–6.
Rohr JR, Schotthoefer AM, Raffel TR, Carrick HJ, Halstead N, Hoverman JT, et al. Agrochem-icals increase trematode infections in a declining amphibian species. Nature 2008;455:1235–9.
Rohr JR, Raffel TR, Halstead NT, McMahon TA, Johnson SA, Boughton RK, et al. Early-lifeexposure to a herbicide has enduring effects on pathogen-induced mortality. Proc RSoc B-Biol Sci 2013;280:20131502.
Royer E, Anders DA, ChantignyMH, Simard RR, Cluis D. Dissolved organic carbon in runoffand tile-drain water under corn and forage fertilizedwith hogmanure. J Environ Qual2007;36(3):855–63.
Russell RW, Lipps GJ, Hecnar SJ, Haffner GD. Persistent organic pollutants in Blanchard'scricket frogs (Acris crepitans Blanchardi) from Ohio. Ohio J Sci 2002;102(5):119–22.
Smalling KL, Reilly TJ, Sandstrom MW, Kuivila KM. Occurrence and persistence of fungi-cides in bed sediments and suspended solids from three targeted uses areas in theUnited States. Sci Total Environ 2013a;447:179–85.
Smalling KL, Fellers GM, Kleeman PM, Kuivila KM. Accumulation of pesticides in pacificchorus frogs (Pseudacris regilla) from California's Sierra Nevada Mountains, USA.Environ Toxicol Chem 2013b;32(9):2026–34.
Sparling DW, Fellers GM. Toxicity of two insecticides to California, USA anurans and itsrelevance to declining amphibian populations. Environ Toxicol Chem 2009;28:1696–703.
Spivak M, Mader E, Vaughan M, Euliss NH. The plight of the bees. Environ Sci Technol2011;45:34–8.
Taylor B, Skelly D, Demarchis LK, Slade MD, Galusha D, Rabinowitz PM. Proximity to pol-lution sources and risk of amphibian limb malformation. Environ Health Persp 2005;113:1497–501.
Thelin GP, Stone WW. Estimation of annual agricultural pesticide use for counties of theconterminous United States, 1992–2009: U.S. Geological Survey Scientific Investiga-tions Report 2013-5009; 2013 [54 pp.; http://pubs.usgs.gov/sir/2013/5009/].
U.S. Department of Agriculture. Economic Research Service. Major uses of land in theUnited States; 2007 [http://www.ers.usda.gov/data-products/major-land-uses.aspx#.U39Xx_ldXg8].
U.S. Department of Agriculture. Census of Agriculture Historical Census Publications.Accessed 7/2013 at http://www.agcensus.usda.gov/Publications/Historical_Publications/index.php, 2013.
U.S. Geological Survey. The national field manual for the collection of water quality data.Collection of water samples (ver 2.0): U.S. Geological Survey Techniques ofWater Re-sources Investigations; 2006 [book 9, chap A4; http://pubs.water.usgs.gov/twri9A4/].
vanEngelsdorp D, Evans JD, Saegerman C, Mullin C, Haubruge E, Nguygen BK, et al. Colonycollapse disorder: a descriptive study. PLoS One 2009;8:e6481.
Ward JR, Harr CA, editors. Methods for collection and processing of surface-water andbed-material samples for physical and chemical analyses: U.S. Geological SurveyOpen-File Report 90-140; 1990. [71 pp., Available at http://pubs.er.usgs.gov/usgspubs/ofr/ofr90140].
Whitney GC. From coastal wilderness to fruited plain: a history of environmental changein temperate North America, 1500 to the present. Cambridge, UK: Cambridge Univer-sity Press; 1994.
Zimmerman CF, Keefe CW, Bashe J. Determination of carbon and nitrogen in sedimentsand particulates of estuarine/coastal waters using elemental analysis: U.S. Environ-mental Protection Agency Method 440.0. 2007. http://www.caslab.com/EPA-Methods/PDF/EPA-Method-440.pdf, 2007.