Perth as a Globally Connected City
34
PERTH as a globally connected city a FACTBase Special Report as a globally connected city a FACTBase Special Report PERTH
Transcript of Perth as a Globally Connected City

UniPrint 109413
For further information on the FACTBase project, contact:
Marion FulkerCEO, Committee for PerthT: 0419 048 665E: [email protected]
Dr Kirsten MartinusAssociate Professor-Human GeographySchool of Earth and EnvironmentThe University of Western AustraliaT: 08 6488 7674E: [email protected]
PERTH a
s a glob
ally connected city
a FA
CTB
ase
Spe
cia
l Re
po
rt
as a globally connected city
a FACTBase Specia l Repor t
PERTH

Committee for Perth and The University of Western Australia November 2013
The FACTBase project is a collaborative research project between the Committee for Perth and The University of Western Australia to benchmark the liveability of Perth and its global connectedness through an examination of Perth’s economic, social, demographic and political character.
The FACTBase team of academics and researchers condense a plethora of existing information and databases on the major themes, map what is happening in Perth in pictures as well as words,
This report is copyright of The University of Western Australia and the Committee for Perth. While we encourage its use, it should be referenced as:
Martinus, K. & Tonts, M. (2013) Perth as a Globally Connected City, a FACTBase Special Report, The University of Western Australia and Committee for Perth, Perth.
All research work commissioned by the Committee for Perth, including the FACTBase project is entirely funded through the contribution of our members. Our Foundation members are:
ANZBHP BillitonChevron AustraliaErnst & YoungHerbert Smith FreehillsRio TintoShellThe West AustralianWesfarmersWoodside
A full list of Committee for Perth members is available at www.committeeforperth.com.au
ABOUT FACTBaseand examine how Perth compares with, and connects to, other cities around the world.
Research findings are released regularly, providing an important resource for academics, planners and decision-makers on the following major themes:• Reinterpreting the
dynamics of Perth’s regional economy
• Economic governance for a globalising Perth
• Exploring ‘urban liveability’ in Perth
• Perth’s local government and governance landscape.

as a globally connected city
a FACTBase Specia l Repor t
PeRTh

ConTenTSForeword | 3
About the report | 4
Introduction | 5
economic connectivity | 6
People connectivity | 38
Political connectivity | 46
Concluding comments | 51
References | 53
Acknowledgments | 56
About the authors | 57
as a globally connected city
a FACTBase Specia l Repo r t
PeRTh
1

FoRewoRdover recent years, I have had the good fortune to visit numerous cities around the world to better understand what makes them both competitive and liveable. what these visits have made clear is the important role of being well connected with other cities. This doesn’t simply mean connectivity in a traditional transport and mobility sense, but broader cultural, political and economic connectivity. It’s become increasingly clear that Perth’s future success depends on being globally connected,
and this report highlights the ways in which this is happening. Importantly, the report stresses that this connectivity is not limited to Perth’s resources sector, but extends to science, education, population, and culture. Collectively these connections are enhancing Perth’s international standing, and contributing to greater prosperity, vibrancy and even resilience. I congratulate the research team on providing a set of unique, thought provoking insights into Perth and its position in the world.
Marion FulkerChief Executive OfficerCommittee for Perth
2 3
Perth as a globally connected city
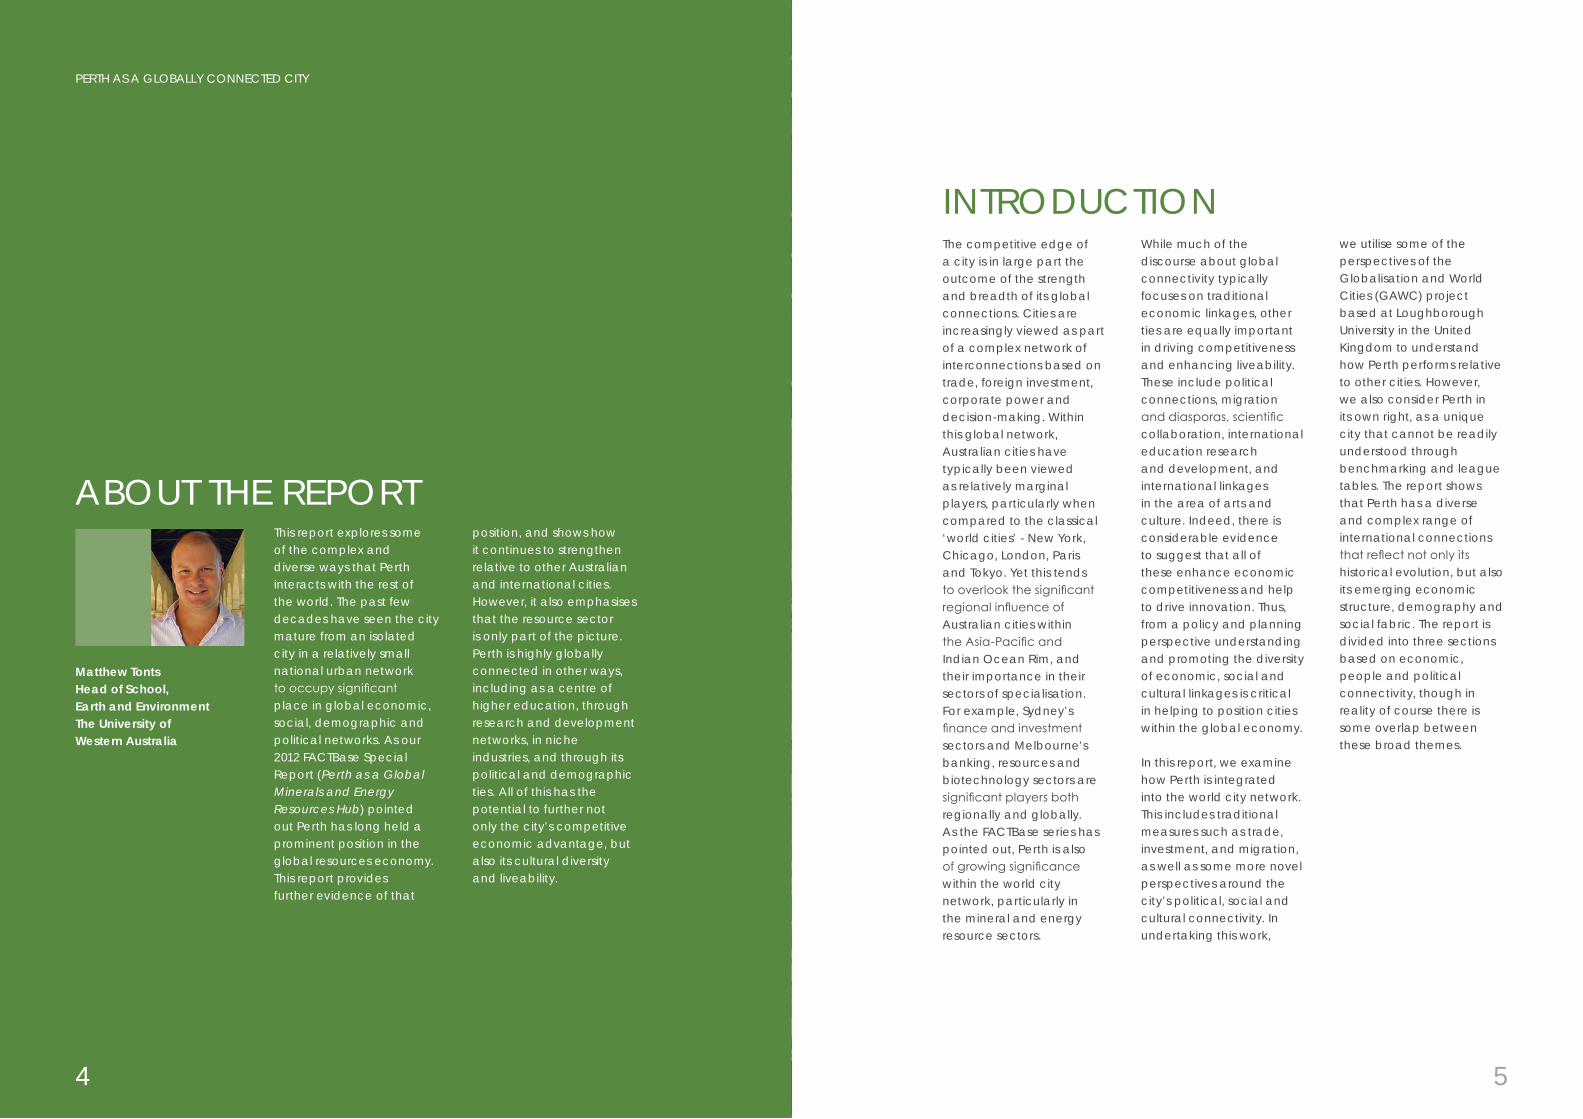
This report explores some of the complex and diverse ways that Perth interacts with the rest of the world. The past few decades have seen the city mature from an isolated city in a relatively small national urban network to occupy significant place in global economic, social, demographic and political networks. As our 2012 FACTBase Special Report (Perth as a Global Minerals and Energy Resources Hub) pointed out Perth has long held a prominent position in the global resources economy. This report provides further evidence of that
ABouT The RePoRTposition, and shows how it continues to strengthen relative to other Australian and international cities. however, it also emphasises that the resource sector is only part of the picture. Perth is highly globally connected in other ways, including as a centre of higher education, through research and development networks, in niche industries, and through its political and demographic ties. All of this has the potential to further not only the city’s competitive economic advantage, but also its cultural diversity and liveability.
Matthew TontsHead of School, Earth and EnvironmentThe University of Western Australia
InTRoduCTIonThe competitive edge of a city is in large part the outcome of the strength and breadth of its global connections. Cities are increasingly viewed as part of a complex network of interconnections based on trade, foreign investment, corporate power and decision-making. within this global network, Australian cities have typically been viewed as relatively marginal players, particularly when compared to the classical ‘world cities’ - new York, Chicago, London, Paris and Tokyo. Yet this tends to overlook the significant regional influence of Australian cities within the Asia-Pacific and Indian ocean Rim, and their importance in their sectors of specialisation. For example, Sydney’s finance and investment sectors and Melbourne’s banking, resources and biotechnology sectors are significant players both regionally and globally. As the FACTBase series has pointed out, Perth is also of growing significance within the world city network, particularly in the mineral and energy resource sectors.
while much of the discourse about global connectivity typically focuses on traditional economic linkages, other ties are equally important in driving competitiveness and enhancing liveability. These include political connections, migration and diasporas, scientific collaboration, international education research and development, and international linkages in the area of arts and culture. Indeed, there is considerable evidence to suggest that all of these enhance economic competitiveness and help to drive innovation. Thus, from a policy and planning perspective understanding and promoting the diversity of economic, social and cultural linkages is critical in helping to position cities within the global economy.
In this report, we examine how Perth is integrated into the world city network. This includes traditional measures such as trade, investment, and migration, as well as some more novel perspectives around the city’s political, social and cultural connectivity. In undertaking this work,
we utilise some of the perspectives of the Globalisation and world Cities (GAwC) project based at Loughborough university in the united Kingdom to understand how Perth performs relative to other cities. however, we also consider Perth in its own right, as a unique city that cannot be readily understood through benchmarking and league tables. The report shows that Perth has a diverse and complex range of international connections that reflect not only its historical evolution, but also its emerging economic structure, demography and social fabric. The report is divided into three sections based on economic, people and political connectivity, though in reality of course there is some overlap between these broad themes.
54
PeRTh AS A GLoBALLY ConneCTed CITY

eConoMIC ConneCTIvITYInternational trade
economic trade activity provides simple and powerful insights into Perth’s global connectivity. It has become a central element in the city’s prosperity and well-being, with wA’s exports being 54.7 per cent of its GSP. In addition, it encourages foreign investment which assists in economic development and business expansion
department of Foreign Affairs and Trade, 2012
There is, of course, nothing new in the importance of international trade to the State’s prosperity. Perth and western Australia’s economic history is built on extensive international trading networks, focused initially within the British empire before branching out into a more extensive and complex set of arrangements.
A century ago, western Australia’s position as a major producer of raw commodities for Britain and other parts of the empire was evident in the major commodities being exported. Gold, wheat and flour, and wool dominated exports, and were the State’s major drivers of economic growth. The role of gold is difficult to understate over the first few decades of the
20th century, being not only an important export commodity in its own right, but also underpinning major agricultural development initiatives that boosted the production of wheat, wool and other farm commodities.
Some 50 years later, the economy had evolved. western Australia demonstrated diminishing dependence on gold, and was beginning to enjoy the benefits of agricultural investment evident in the dominance of wool and wheat/flour exports. Industrial developments of the 1950s were also bearing fruit, with petroleum products from the Kwinana oil refinery becoming an important source of income with rising exports to South east Asia, India and new Zealand.
This historical background demonstrates the enormity of the economic transition that western Australia has experienced over the past 50 years. By 2013, the dominant export commodity was iron ore – a fledgling industry in 1963. Petroleum products also figure prominently. However, rather than output from refining, the export base has switched to natural gas and crude oil largely from the north west Shelf. Perhaps the most notable shift is the diminished significance of agriculture. wool no longer figures as a major export commodity and wheat accounts for just over two per cent of exports. This is a considerable drop from the around 20 per cent it was 50 years earlier.
MAjor ExPorT CoMModITIES, 1913 (%)
MAjor ExPorT CoMModITIES, 1963 (%)
MAjor ExPorT CoMModITIES, 2013 (%)
Wheat and flour 23% Gold 33%
Pearl shell 6%
Timber 16%
Wool 22%
Wheat and flour 35%
Wool 44%
Gold 6%
Petroleum products 11%
Crayfish 4%
Wheat 3%
Gold 16%
Crude petroleum 12%
Natural gas 11%
Iron ore 58%
Source: Commonwealth Bureau of Census and Statistics (1913).
Source: Commonwealth Bureau of Census and Statistics (1963).
Source: Australian Bureau of Statistics (2013).
6 7
Perth as a globally connected city

Trade networks
Along with commodities traded, western Australia’s trading networks and partners have changed dramatically over the past 100 years. Initial linkages were concentrated on countries within the British empire or more traditional economic and trade partners. In 1913, the majority of western Australia’s exports went to the united Kingdom, India and Ceylon, with imports dominated by the united Kingdom, the united States and Germany. These trading relationships reflect the State’s ‘staple-led development’, where exports were dominated by agricultural commodities and raw materials and imports of mainly manufactured goods from the world’s industrialised core.
By the 1960s, the trading networks had begun to change quite dramatically. no longer was trade concentred on the empire, having expanded into new territories, notably Asia with Japan (iron ore) and China (wool) becoming
two of the largest export markets. other major export nations included the united States and uSSR. In terms of imports, the State remained heavily dependent on the united Kingdom, but had engaged closely with the Middle east, largely as a result of oil imports for the refinery at Kwinana. Thus, Iran, Kuwait and Qatar began to figure as major trade partners.
By 2013, export relationships were increasingly oriented towards Asia. Indeed, of the top five export destinations all were in Asia. China now dominates western Australia’s exports in a way that the united Kingdom did a century ago. In addition, Japan, South Korea and Singapore also form important export destinations. In many respects, the past century can be interpreted as one in which the State’s trading relationships switched from a geopolitical configuration around empire to one that sees western Australia more deeply embedded within its geographical region.
Major import partners by value, 1913 (% share)
Major import partners by value, 1963 (% share)
Major import partners by value, 2013 (% share)
Major export partners by value, 1913 (% share)
Major export partners by value, 1963 (% share)
Major export partners by value, 2013 (% share)
India 6%France 2%
UK 66%
USA 17%
Germany 9%
Ceylon 11%
India 15%
UK 64%
South Africa 7% Egypt 3%
UK 39%
USA 14%
Qatar 8%Kuwait 17%
Iran 22%
USA 20%
Fed Rep Germany 9%UK 22%
China 15%
Japan 34%
China 23%
Japan 18%
USA 23%
Singapore 22%
united Arab Emirates 14%
China 59%Japan 23%
Republic of Korea 10%
India 4%Singapore 4%
Source: Commonwealth Bureau of Census and Statistics (1913).
Source: Commonwealth Bureau of Census and Statistics (1963).
Source: Australian Bureau of Statistics (2013).
8 9
Perth as a globally connected city

Foreign investment
one of the critical drivers of economic growth in Perth and western Australia is foreign investment. This is particularly important in relatively small sub-national economies where local investment sources are not of the scale required to support major development projects. unfortunately, detailed foreign investment data at State level are not available within Australia. however, the western Australian situation is somewhat analogous to Australia as a whole.
Since 2005, foreign investment in Australia has increased steadily with the resource sector as a major beneficiary. oeCd and APeC member countries invest most heavily in Australia, and in 2012 reached almost $400,000 million and $280,000 million dollars respectively. other than a slight decline in investment from the european union and united Kingdom, Australia has seen rises in investment levels from most other major regions and
countries. Indeed, it has continued to attract foreign investment even during and immediately following the Global Financial Crisis, despite a worldwide 20 per cent decrease in foreign investment funds (unCTAd, 2009).
ForEIGN dIrECT INVESTMENT IN AUSTrALIA 2001-2012 ($MIL)
ForEIGN dIrECT INVESTMENT IN AUSTrALIA 2001-2012 (% CHANGE)
Source: ABS (2013).
10 11
PeRTh AS A GLoBALLY ConneCTed CITY
450,000 ____________________________________________________________________________________________________
400,000 ____________________________________________________________________________________________________
350,000 ____________________________________________________________________________________________________
300,000 ____________________________________________________________________________________________________
250,000 ____________________________________________________________________________________________________
200,000 ____________________________________________________________________________________________________
150,000 ____________________________________________________________________________________________________
100,000 ____________________________________________________________________________________________________
50,000 ____________________________________________________________________________________________________
0 ____________________________________________________________________________________________________$mill
ion
2001 2002 2003 2004 2005 2006 2007 2008 2009 2010 2011 2012
oeCd
APeC
eu
uSA
uK
Japan
ASeAn
80 ____________________________________________________________________________________________________________________
60 ____________________________________________________________________________________________________________________
40 ____________________________________________________________________________________________________________________
20 ____________________________________________________________________________________________________________________
0 ____________________________________________________________________________________________________________________
-20 ____________________________________________________________________________________________________________________
-40 ____________________________________________________________________________________________________________________
-60 ____________________________________________________________________________________________________________________
-80 ____________________________________________________________________________________________________________________% c
hang
e
2001-02 2002-03 2003-04 2004-05 2005-06 2006-07 2007-08 2008-09 2009-10 2010-11 2011-22
oeCd
APeC
eu
uSA
uK
Japan
ASeAn

Perth
USAChevron Australia 47% (San Ramon, CA)
The NetherlandsShell development Australia 25% (The Hague)
japanChubu Electric Power 0.417%
Osaka Gas 1.25%
Tokyo Gas 1%
Foreign investment and the Gorgon Joint venture
Foreign investment has been particularly important in driving the expansion of western Australia’s resource sector. Across the sector, major transnational corporations play a significant role in providing the skills, expertise and, importantly, financial resources required to establish major projects.
The scale and complexity of projects means that the ‘joint venture’ model tends to dominate the industry. not only does this spread risk and draw on a diversity of expertise, but it also expands the pool of capital available to underwrite large projects. one of the largest of these joint venture arrangements is the Gorgon
Gas Project. Located off the Pilbara coast, the project will produce 15 million tonnes per annum of liquefied natural gas (LNG).
with an estimated value of $43 billion, the Gorgon Project represents one of the Australia’s largest ever foreign investments in a single project. The project is
GorGoN joINT VENTUrE: PArTNEr CoNTrIBUTING SHArES ANd LoCATIoN oF GLoBAL HEAdQUArTErS
Gorgon
owned by the Gorgon Joint venture (GJv) and includes the Australian subsidiaries of Chevron (47.3 per cent interest) in joint venture with the Australian subsidiaries of exxonMobil (25 per cent), Shell (25 per cent), osaka Gas (1.25 percent), Tokyo Gas (1 percent) and Chubu electric Power (0.417 percent).
when production commences around 2015, the project will not only be a major employer, but contribute around $40 billion to Australian government revenue and $64 billion to Australia’s Gross domestic Product over its estimated 30 year production life (Chevron, 2013).
Source: Chevron (2013).
USAMobile Australia 25% (Irving, TX)
12 13
PeRTh AS A GLoBALLY ConneCTed CITY

Corporate Connectivity
ToP 20 CoMPANIES HEAdQUArTErEd IN PErTH
Large corporations and the power that they wield are at the heart of modern economies. These firms play a critical role in orchestrating flows of materials, products, people, services and finance. As such, the locational choices of firms have become a key measure to understand the degree to which a city is connected to the world city network. The mass of complex cross-border firm interactions play a large role in shaping and influencing the strategic transnational networks of cities. The most powerful cities in the network are viewed as global command centres concentrating world financial, political and production power. The identification of the particular importance of advanced producer services to the hierarchy paved the way to rank cities based on the nodes and networks of multinational corporations in accountancy, advertising,
insurance, management consulting, banking/finance and commercial law (Beaverstock, Smith & Taylor, 2000; Taylor, 2001). This forms the base for the Globalisation and world Cities (GawC) research network city hierarchy, which ranks the Australian cities of Sydney as α+; Melbourne as α-; Perth and Brisbane β-; and, Adelaide as γ- (GawC, 2013).
This research by GawC has had a large impact in defining the world view of different cities. Perth’s lower role in advanced producer services networks means it typically features as a mid-tier city with strong regional links. however, the choice to examine only advanced producer services may diminish the importance of alternative indicators of a city’s power and influence which incorporate more historic drivers and processes, such as securing resources.
The development and global significance of Australia’s capital cities through the exploitation of resources exemplifies this (Tonts, Martinus & Plummer, 2013). over recent decades, Perth has gone from a city that had just a handful of large local firms to one of Australia’s most powerful corporate cities. Indeed, Perth can now be viewed as Australia’s ‘third corporate city’ behind Sydney and Melbourne when it comes to the concentration of listed firms (Tonts and Taylor, 2010).
The table to the left shows the largest 20 listed firms in Perth in 2013, while the figure shows the sectors that the city’s largest 100 listed firms are engaged in. While materials (which includes mining) dominates, other sectors are also prominent, including capital goods, energy, and real estate.
ToP 100 HEAdQUArTErS IN PErTH, ASx LISTINGS
Materials 51%
Food and staples retailing 1%
Energy 12%
Diversified financial 2%
Consumer services 1%
Consumer durables and apparel 1%
Commercial and professional services 4%
Capital goods 14%Utilities 1%
Transportation 2%
Media 1%
Real Estate 6%
Telecommunication services 2%
Retailing 2%
Source: Australian Stock exchange (2013).
1 wesfarmers Limited2 woodside Petroleum Limited3 Fortescue Metals Group Ltd4 Iluka Resources Limited5 Regis Resources Limited6 Monadelphous Group Limited7 Seven west Media Limited8 Mineral Resources Limited9 navitas Limited10 Aurora oil & Gas Limited
11 Atlas Iron Limited12 BwP Trust13 Sandfire Resources NL14 Aquila Resources Limited15 Independence Group nL16 Sundance Resources Limited17 Automotive holdings Group Limited18 Paladin energy Limited19 Silver Lake Resources Limited20 CGA Mining Limited
14 15
Perth as a globally connected city

Connectivity in resources
The prominence of corporate headquarters associated with resources reflects in part the historically strong role that this sector has played in the development of Perth. The global connectivity of Perth in the resources sector can be calculated using the world’s top 90 firms of the Standard and Poors’ Global natural Resource Index (comprised of agriculture, oil and gas, coal, industrial and precious metals). These firms were found to have some level of presence in 498 cities in the world. Summing these
provided a pattern of global resource company locations (see Martinus, 2013). higher-value cities denoted a stronger overall corporate presence and higher strategic importance to the overall global resources network.
of the Australian cities, Melbourne was calculated to have the highest strategic importance ranked 4th in the world by number of cities with strategic offices reporting to Melbourne offices. Whilst Perth is significantly less connected, it is still well-linked by
global standards being in the top 36 of the 498 cities when ranked by in-coming connections. Its connectivity increases when ranked by the number of cities it reports to is calculated – with Melbourne falling to 17th and Perth rising to 23rd.
The most highly linked regions of the world are the east Coast of the united States, as well as the Germany-uK region (including The netherlands, Switzerland, northern Italy and eastern France).
rESoUrCE SECTor CITy INFLoW ANd oUTFLoW rEPorTING CoNNECTIoNS, rANkEd By rEPorTING IN-FLoWS
GLoBAL rESoUrCE SECTor CITy CoNNECTIoNS WITH MELBoUrNE
GLoBAL rESoUrCE SECTor CITy CoNNECTIoNS WITH PErTH
0 10 20 30 40 50 60 70 80 90
Perth, Australia
Rome, Italy
Zurich, Swtizerland
Chicago, IL, USA
Mexico City, Mexico
Tunis, Tunisia
Washington DC, USA
Luxembourg, Belgium
Sao Paulo, Brazil
Kassel, Germany
Utrecht, The Netherlands
St Louis, MO, USA
Manila, Phillipines
Rio de Janeiro, Brazil
Johannesburg, South Africa
Pohang, South Korea
Indianapolis, IN, USA
Toronto, Canada
Paris, France
Shanghai, China
Calgary, Canada
Brussels, Belgium
Geneva, Switzerland
The Hague, Switzerland
Denver, CO, USA
Singapore
Madrid, Spain
Moscow, Russia
Beijing, China
Stockholm, Sweden
Tokyo, Japan
Basel, Switzerland
Melbourne, Australia
Antwerpen, Belgium
Houston, TX, USA
London, UK
Number of reporting cities
Number of reporting out-flows
Number of reporting in-flows
16 17
Perth as a globally connected city
City

Connectivity in the energy sector
drilling down into the energy sector as a sub-set of the resources sector highlights the central role that energy plays in the global economy. If regions with production reserves or large consumption markets are of high strategic importance to both corporate and national interests, the locations of large multinationals dealing in these markets can be used as proxies in understanding global power and influence across the energy sector (Martinus, 2013).
Australia’s energy consumption is only one third of its energy production, making it a net energy exporter. Its energy exports contribute
34% of Australia’s total commodity exports, with top energy exporters being coal, petroleum and LnG (department of Resources energy and Tourism, 2012).
The petroleum sector was wA’s second most important commodity export sector in 2012, comprising of crude oil, condensate, natural gas and LnG. Total sales of $24.4 billion represented a 1% increase from 2011. LnG was the most valuable product, with output increasing by 21% (to 18.3 million tonnes or $11.3 billion in sales) over 2011. Crude oil is the next most valuable, though sales fell by 17% (to 63 million barrels or $7.1 billion in sales) (department of Mines and Petroleum, 2013).
The relative importance of key cities within the resource network can be determined by simply summing the city’s total number of corporate headquarters of the Top 100 Global energy Companies (see Platts, 2013). The above map visually represents this. The cities with the most corporate headquarters are Calgary (Canada) and Moscow (Russia) at equal first having seven each, houston (uSA), followed closely by Beijing
(China) and then Tokyo (Japan). According to the uS department of energy, these cities are located in countries known for being major energy producers (Canada, uSA, Russia and China) as well as major energy consumers (China, uSA, Russia and Japan).
There are also significant clusters of cities with corporate energy headquarters in the uSA (west coast, east coast
and mid-west), South America (Brazil), western europe (Germany, england, Spain and The netherlands), eastern europe (Poland, hungary and Kazakhstan) and Southeast Asia (India and China). Perth is not particularly significant with its one headquarter (woodside Petroleum) located a long way from the nearest cluster in South-east Asia.
ToP ENErGy ProdUCING ANd CoNSUMING CoUNTrIES
Top energy producing countries Top energy consuming countries
world rank
Btu units world rank
Btu units
2010 2011 2010 2011
1 China 90 98 1 China 101 110
2 united States 75 78 2 united States 98 97
3 Russia 53 56 3 Russia 29 33
4 Saudi Arabia 25 26 4 India 22 24
5 Canada 18 19 5 Japan 22 21
6 India 15 16 6 Germany 14 13
9 Australia 12 13 18 Australia 6 6
Source: adapted from Platts (2013).
LoCATIoNS oF ENErGy CorPorATIoN HEAdQUArTErS
6 – 7 corporate headquarters
4 – 5 corporate headquarters
2 – 3 corporate headquarters
1 corporate headquarter
18 19
Perth as a globally connected city
Source: uS department of energy (2013).
unit of measure: Quadrillion British thermal units (Btu)

The story shifts slightly when the analysis is broadened beyond global company headquarters to include all corporate offices. FACTBase 31 noted some level of functioning corporate office for the top 100 global energy companies in 491 cities (Martinus, 2013).
London and houston were by far the most important, followed closely by Singapore, Calgary and Moscow, and then Beijing. Perth emerged in the third grouping of cities, ranked as 11th overall (equal with hong Kong). The only other Australian city appearing in the top 25 energy cities was Melbourne.
The significance of relations and positions of each office within respective corporate hierarchies establishes and maps connections between cities. directionality can be assigned to the data to account for communication and reporting flows (inflows and outflows) from
progressively smaller offices to corporate headquarters. This acknowledges the importance of local information to corporate operational practices given that the operations and strategies of multinationals are increasingly influenced by local conditions. This is based on observations of the gradual replacement of traditional top-down governance structures by bottom-up decision-making in modern business practices. This is due to local knowledge about governance, environment, economic and social conditions become progressively critical to the success of local operations.
Put another way, if an office in Perth reported to a regional headquarters in Singapore then this is reported as an ‘outflow’, while an office in, say, Malaysia reporting to an office in Perth would be recorded as an ‘inflow’. The interaction between
the cities is evident in the world map on page 21, with colours and groups roughly forming regional territories. The colour of each circle is a city’s regional territory and arrows indicate the direction of local information flows. From this, we can see the key energy territorial units are the Americas (light blue), Middle east/Africa (medium green), Asia/oceania (dark green) and europe (dark blue). Cities coloured differently to the territory they are located in are either: 1) too insignificant in the network to be assigned a territory (e.g., cities in pink, yellow, etc); or 2) have high significance outside of their own territorial unit (i.e., Tokyo is light blue, indicating its strong corporate energy relationship to the Americas). Perth appears moderately influential within the energy network, with connections largely associated with its own territorial unit of Asia/oceania.
GLoBAL ENErGy SECTor CITy CoNNECTIoNS, ToTAL NETWork
0 20 40 60 80 100 120 140 160
London, UK
Houston, USA
Singapore
Calgary, Canada
Moscow, Russia
Beijing, China
Jakarta, Indonesia
Tokyo, Japan
Dubai, UAE
Rio de Janeiro, Brazil
Perth, Australia
Hong Kong
Warsaw, Poland
Abu Dhabi, UAE
Buenos Aires, Argentina
Stavanger, Norway
Kuala Lumpur, Malaysia
Bangkok, Thailand
Aberdeen, UK
Bogota, Colombia
Seoul, South Korea
Paris, France
Brussels, Belgium
Amsterdam, Netherlands
Melbourne, Australia Sum of corporate presence
City
SUMMEd STrENGTH oF ToTAL ENErGy CorPorATIoN PrESENCE, ToP 25 CITIES
20 21
PeRTh AS A GLoBALLY ConneCTed CITY
City

The position of Perth, along with its information in- and out- flows, is highlighted in red in the graph and map on page 23. whilst Perth has a high degree of connectivity across the whole Asia/oceania region, it has particularly strong connections with Tokyo, Kuala Lumpur, hong Kong, Singapore, Bangkok, Seoul and Beijing.
It also links directly to western europe and the uSA through the highly connected cities of Paris and houston and lesser-linked cities of vienna, el dorado and San Antonio.
Analysis of network inflows and outflows of information provide insight into the differences in influence and control of the energy landscape by regional territories and individual cities. In the context of incoming connections, the top 25 cities are dominated by western europe (9 of the 25 cities or 36%) and Asia/Oceania (6 cities or 24%). however, the importance of western europe in the energy landscape declines sharply to 12% (three cities) in the top 25 cities of outgoing connections. As such, there appears to be greater equality
in regional influence in terms of network outflows amongst the regional units of Eastern Europe (16%), South America (16%), Middle East/Africa (24%) and Asia/Oceania 24%).
Perth’s presence in the top 25 cities for both incoming and outgoing connections suggests it is prominent in the overall connectivity of the energy network. However, its inflows at 18 (ranked 15th) are 59% less than that of the highest ranked cities. Similarly, in terms of outflows at 11 (ranked 12th) are 70% less than that of the highest ranked cities. This wide gap implies that the position of cities must be viewed in the context of relative magnitudes of influence and control, not just rank.
This study found that Perth emerges as Australia’s most global city in terms of energy with particular strong ties to the Asian region. Importantly, this role has emerged over a relatively short period of time, with the development of the north west Shelf in the 1980s a critical turning point.
ENErGy SECTor CITy INFLoW ANd oUTFLoW rEPorTING CoNNECTIoNS, rANkEd By rEPorTING IN-FLoWS
GLoBAL ENErGy SECTor CITy CoNNECTIoNS WITH PErTH
0 10 20 30 40 50 60 70
Bogota, Colombia Hong Kong
Cairo, Egypt Seoul, South Korea
Dubai, UAE Hague, The Netherlands
Barcelona, Spain Madrid, Spain Berkshire, UK Bilboa, Spain
Perth, Australia Rome, Italy
Vienna, Austria Calgary, Canada New Delhi, India
Singapore Budapest, Hungary
Rio de Janeiro, Brazil Körfez, Turkey
Tokyo, Japan Paris, France
Moscow, Russia Beijing, China Houston, USA
London, UK
Number of reporting cities
City
Number of reporting out-flows
Number of reporting in-flows
22 23
Perth as a globally connected city
City

Connectivity in manufacturing
while Perth is typically conceived as simply a resource-based economy, a range of other sectors play an important role in the city’s economic makeup and its connectivity. one of these is manufacturing. Perth has a long history of niche industries involved in relatively high value export – Chamberlain tractors between the 1940s and early 1980s, petroleum products from the Kwinana oil refinery from the 1950s, and numerous food and wine products.
however, manufacturing represents a sector of considerable contention. on one hand, increasingly competitive macro-economic conditions conspire against the industry leading to the closure of numerous export-oriented manufacturing enterprises. Yet, on the other, the industry is an important driver of innovation. Support for the retention of manufacturing in the State is further driven by arguments about economic diversity, and observations that
Germany’s strongly diversified manufacturing sector allowed it to weather the Global Financial Crisis better than its european neighbours (Industry Innovation Council, 2011).
In 2011, manufacturing represented around 8% of total wA employment and around 8.5% in Perth. Perth had the highest levels of manufacturing employment, claiming almost 80% of the State’s employment in the sector (ABS, 2011). By 2012, wA’s manufacturing sector had fallen slightly to to 7.9% of wAs total employment in the sector. It contributed 10.7% to Australia’s total industry employment (Australian Government, 2012). In August 2013, the contribution of the sector to total wA and Australian national total employment had fallen to 6.7% and 9.6% respectively (declines of 1.2 and 2.7 points). The falling numbers employed in the manufacturing industry are the result of a combination of high exchange rates, global competition, technology changes
and the general trading environment (Australian Government, 2012).
nonetheless, manufacturing remains a key industry of potential growth and opportunity for western Australia given its ‘disproportionally large contributions to exports and research and development’ (Australian Government, 2012, p.2). That is, one dollar spent on manufacturing is associated with multiplier effects on national product, employment, investment and innovation. western Australia’s particular strengths in manufacturing lie in high value, niche markets. Its businesses are often characterised as having a high degree of ‘flexible specialisation’ and capacity to rapidly respond to changes in market conditions. A great example of this is the knowledge-intensive food and wine sector, having evolved so as to quickly adapt to changes in market demand and taste.
MANUFACTUrING EMPLoyMENT By STATE, AUSTrALIA AUGUST 2013
Employment (‘000s persons)
Share of total State/Territory employment
Share of total manufacturing employment in Australia
Victoria 284 9.8% 30.9%
New South Wales 266 7.3% 28.9%
Queensland 178 7.6% 19.3%
Western Australia 88 6.7% 9.6%
South Australia 78 9.8% 8.5%
Tasmania 18 7.9% 2.0%
ACT 4 1.9% 0.4%
Northern Territory 4 3.1% 0.4%
Australia 921 8.0% 100%
Source: ABS (2013b)
24 25
Perth as a globally connected city

Austal
high-value niche manufacturing has the potential to deliver new sources of growth for the western Australian economy. Indeed, the State’s diversity of industry, advanced technological development and level of specialised knowledge provides a solid foundation for economic diversification beyond current strengths in resources. There are clear and emerging opportunities within manufacturing to leverage existing assets and create new avenues of competitive advantage. Austal provides a good example of this sectors’ capacity to drive innovation and global connections.
established in the 1970s manufacturing compact fast aluminum craft for the local rock lobster (crayfish) industry in Fremantle, Austal has become a leading world supplier of high performance vessels. Clients in the global defence and securities sector include Australian Customs, Royal Australian navy, nSw water Police, Bermuda Police, uS navy, Yemen Ministry
of defence, Government of Kuwait, Trinidad and Tobago Coast Guard. while those in the commercial leisure and personal cruising sector are across the countries of Ireland, Greece, Maldives, Sweden, new Caledonia, Saudi Arabia, Poland, to name but a few (Austal, 2013).
Austal’s story is linked to Alan Bond’s efforts to bring the America’s Cup to Perth. his three challenges during the 1974-1980 period, eventual success in 1983 and the hosting of the Cup in Perth in 1987 saw the growth of a small but enthusiastic and highly-skilled aluminium boat building industry. when the need for these skills declined with the loss of the Cup in 1987, the local boat building workforce turned to markets outside of Perth. Competing in global export markets exposed these local builders to international industry design standards, further developing the expertise and specialisation of its labour force (Austal, 2008).
GLoBAL dELIVErIES ANd ProdUCTIoN LoCATIoNS
Austal emerged in 1988 with a vision to build high quality commercial ships for the international market. Its success in doing so saw it listed on the Australian Stock exchange in 1998.
In August 2013, Austal’s order backlog was reported to be $2.6 billion with work until 2017 (Bellamy, 2013). Its ship yards in henderson, western Australia, The Philippines and Mobile
Alabama, uSA have delivered more than 240 ships of various combat, patrol and auxiliary vessels, ferries, cruise and ocean fast luxury yachts, as well as private and commercial recreation crafts. vessel support facilities, positioned with access to regions of uSA, Australia, europe, the Caribbean, the Middle east and Asia, enable Austal to service their vessels.
1972Manufacturing crayfish vessels
1983Success of Australia II and the America’s Cup
1988Formation of Austal
1993world’s leading supplier of 40m passenger catamarans; dominant supplier to Asia
1988Listed on ASX
1999established uSA operations
2008opens ship building facility in Tasmania
2010Closes Tasmania operations
2012Cebu Philippines facility starts operation
Production Locations Service Support Centres delivery Locations
Source: Austal (2013).
26 27
Perth as a globally connected city

Animation and games industry
other sectors are also emerging in Perth that are illustrative of the city’s ability to move beyond the resources sector. As an industry with an increasingly on-line component, animation and games provides insight into Perth’s virtual connectivity as well as its ability to expand into new and emerging global markets.
In 2007, the Minister for Industry and enterprise announced in hansard Parliamentary documents the arrival of the American-based Interzone, one of the world’s largest computer games companies, to Perth. Perth was selected above other Australian cities to develop the company’s presence in the massively multiplayer online (MMo) games market. This was based on the quality of its workforce, attractive lifestyle, proximity to Asia as one of the largest games markets and State government support in its efforts to diversify industry outside of resources. expected to employ 300 western Australians, the company presented a significant employment opportunity in computing. It brought some of the world’s best developers to Perth (from various companies such as Microsoft) and created strong links with
collaborators in Sao Paulo, Brazil. Whilst financial mismanagement caused the company to close its doors in 2010, this example illustrates a niche market advantage Perth appears to be fostering.
In 2006, the International Game developers Association opened a branch in Perth. Between 2006 and 2009, Perth hosted Australia’s first demo party called the IZ nullarbor (a competition promoting game development and allowing developers and gamers to demonstrate skills). By 2007, IZ nullarbor was reported to have grown into one of the worlds’ biggest demo parties. In this year also, three other international gaming companies located offices in Perth – Giant Dice (Canada),Floor Pty Ltd (Japan) and Subversive Games (uK). In 2008, Apple opened its app store which enabled professionals across Perth to join the mobile gaming/app revolution from suburban homes.
whilst not all the above-mentioned have survived, the online games and animation industries continue to grow with Perth’s expanding game developer community. In 2008, Perth was the only Australian city to
join the inaugural Global Game Jam (GGJ) where gamers around the world came together virtually to participate in a 48-hour hackathon focused on game development. In 2012, Perth was one of 242 GGJ locations (including Sydney, Canberra, Melbourne and Adelaide) across 47 countries developing a total of 2000 games over the weekend.
The more recent moves for Perth to grow its development industry has been by Let’s Make Games which emerged in 2009 as a non-profit vehicle to support game development and initiatives (such as Perth’s Independent Game Makers’ Initiative).
Game design and development degrees are now offered by The university of western Australia, Curtin university, Murdoch university and edith Cowan university, and diplomas by various Institutes of Technology. A 2009 survey of 109 developers found 53 per cent held bachelors, 17 per cent diploma and 17 per cent postgraduate degree (Masters or Phd).
having considerable cross-over linkage with the gaming industry, animation is also a sector of growing popularity in Perth.
There has been increasing attendance at Perth’s various annual comic and animation festivals, such as wai-con (Perth-based Japanese animation conference), Supanova (national pop-culture conference held annually in Perth, Brisbane, Adelaide, Melbourne, Sydney and the
Gold Coast) and oz Comic-con (an Australian version of ComicCon for comic, movie and sci-fi fans held annually in over 30 locations throughout the world, including Perth, Sydney, Melbourne, Adelaide and Brisbane). Perth’s Supanova attracted 21,100 in 2012 and 26,300 in 2013, this is second
to Sydney (with 28,400 and 39,400 respectively) with the third highest attendance being the Gold Coast (at 19,200 and 26,000). whilst wai-con is a smaller conference, it has grown sharply from 400 to 4109 over the past 10 years.
WAI-CoN (ANIME CoNFErENCE) ATTENdANCE By yEAr, PErTH
SUPANoVA ATTENdANCE By yEAr (PoP CULTUrE CoNFErENCE), PErTH
Source: Supanova (2013).
28 29
Perth as a globally connected city
4500 _______________________________________________________________________________________
4000 _______________________________________________________________________________________
3500 _______________________________________________________________________________________
3000 _______________________________________________________________________________________
2500 _______________________________________________________________________________________
2000 _______________________________________________________________________________________
1500 _______________________________________________________________________________________
1000 _______________________________________________________________________________________
500 _______________________________________________________________________________________
0 _______________________________________________________________________________________
Year 2004 2005 2006 2007 2009 2010 2011 2012 2013
number of attendees
note: there was no conference in 2008.
note: the 2013 Brisbane and Adelaide conferences are held after this report is due to be printed.
40,000 _______________________________________________________________________________________
35,000 _______________________________________________________________________________________
30,000 _______________________________________________________________________________________
25,000 _______________________________________________________________________________________
20,000 _______________________________________________________________________________________
15,000 _______________________________________________________________________________________
10,000 _______________________________________________________________________________________
5,000 _______________________________________________________________________________________
0 _______________________________________________________________________________________Melbourne Gold Coast Sydney Perth Brisbane Adelaide
2012 2013
number of attendees

International students enrich Australian communities, bringing energy, diversity and new ways of seeing things. They expand Australia’s global networks and link us to the world. Their high quality life experiences in Australia contribute to our regional and global standing.
The international education sector is also very important economically. It is Australia’s third largest source of export income. International students supplement and diversify our labour force in the longer term if they meet Australia’s skills needs and choose to stay in or return to Australia.
Council of Australian Governments, 2010
education is Australia’s third most important export, following coal and iron ore. Its economic and social value to regions makes it an increasingly competitive industry, with a growing number of quality institutions
within the Asian-Pacific region (hearney et al., 2010). Looking at overseas students as a percent of total State population, Perth ranks as a moderately popular education tourism destination with significantly
less international students than the States of new South wales, Queensland and victoria. The majority of students to Australia are from the Asia-Pacific region.
oVErSEAS STUdENTS IN HIGHEr EdUCATIoN AS A PErCENTAGE oF ToTAL STATE PoPULATIoN, yEAr-To-dATE CoMMENCEMENTS dECEMBEr 2012
The university of western Australia
Taking The university of western Australia as an example, in 2013 the majority of students undertaking study were from Asia and the Middle east. As a proportion of
total international students, there was 14% less from these regions studying a higher degree (e.g., Masters by Research or Phd) than doing under graduate (bachelor)
or graduate (Graduate diploma or Masters) In contrast, there were 10% more europeans studying higher degrees at uwA than doing undergraduate or postgraduate courses.
PoSTGrAdUATE ANd UNdErGrAdUATE CoUrSEWork 2013
HIGHEr dEGrEES By rESEArCH 2013
Europe 5%North America 3%
Oceania 0%South America 2%
Africa 4%
Asia (including Middle East) 86%
Europe 15% North America 7%
Oceania 0%
South America 5%Africa 2%
Asia (including Middle East) 71%
Source: Australian education International (2013). Source: uwA (2013).
0
5,000
10,000
15,000
20,000
25,000
30,000
35,000
NSW VIC QLD WA SA ACT TAS NT
Number of students
Other nationalities
Saudi Arabia
Malaysia/Indonesia/Singapore
India/Pakistan/Nepal
China/Republic of Korea
Connectivity in education
30 31
Perth as a globally connected city

Connectivity in research and development
Australia’s most attractive universities are also an integral part of its national innovation system, making huge contributions both in basic and applied R&d. The
Australian Government is a vital provider of research funding through various Australian Research Council (ARC) grants. Publications associated with ARC
funded research rose by 41% between the 1996-2000 and 2001-2005 periods. This is two-fold international growth rates (Biglia & Butler, 2009).
INTErNATIoNAL CoLLABorATIoN oN ToTAL AUSTrALIAN rESEArCH CoUNCIL FUNdEd ProjECTS
ToTAL INTErNATIoNAL CoLLABorATIoNS oN AUSTrALIAN rESEArCH CoUNCIL GrANTS By CoUNTry, 2013
Arc Industry Linkage Funding
The ARC aims to bring together researchers to ‘advance Australian research and innovation globally and benefit the community’ (ARC, 2013). of all nation-wide ARC funded projects, collaboration with organisations outside of Australia (industry or academic) increased from 42% to 55% between
2002 and 2013. In 2013, an overwhelming majority of these collaborations occurred with uSA partners, followed by those from the uK. Trailing behind, the top five collaborating countries were Germany, France, Canada, China and Japan.
one funding type, ARC Industry Linkage grants,
encourages Australian universities to connect with industry. In WA, 90% of these engagements were with companies located across the country (80% of these were with WA-based firms). Of the 10% of international collaborations, 61% were with companies from the USA, 11% the UK and 5% Canada.
ToTAL INdUSTry CoLLABorATIoNS WITH WA UNIVErSITIES oN AUSTrALIAN rESEArCH CoUNCIL INdUSTry LINkAGES GrANTS
0 50 100 150 200 250 300
Korea, Republic of
Austria
Indonesia
Norway
Spain
Singapore
Denmark
India
Sweden
Netherlands, The
Switzerland
New Zealand
Italy
Japan
China, People's Republic
Canada
France
Germany
Other
United Kingdom
United States
Number of international collaborations on ARC grants
Country
30%
40%
50%
60%
70%
400
600
800
1000
1200
Num
ber
of p
roje
cts
0%
10%
20%
0
200
400
2002 2003 2004 2005 2006 2007 2008 2009 2010 2011 2012 2013
Num
ber
ofpr
ojec
ts
Projects indicating international collaboration
Percentage of projects indicating international collaboration
Total collaborators with WA institutions
International collaborators
Australian collaborators
Australian 90%
International 10%
USA 61%
Canada 5% UK 11% Germany 3%Norway 2%Japan 2%Thailand 2%Singapore 2%The Netherlands 2%France 2%Italy 4%Mexico 2%India 2%
WA 80%
NSW 7% Victoria 6%Queensland 2%
Tasmania 0%
NT 0%
ACT 4%SA 1%
Source: ARC (2013). Source: ARC (2013).
32 33
Perth as a globally connected city

Square Kilometre Array (SKA)
In 2012, western Australia received a major boost to its research and development capacity with the announcement that the State would be a key player in the Square Kilometre Array radio astronomy facility. with construction planned in Murchison 700kms north of Perth by an international team lead by institutions in Perth, SKA promises to expand the city’s scientific capacity and competitive edge, and potentially take Perth’s economy in new directions. upon its 2024 completion, SKA will be the largest and most sensitive telescope on earth capable of capturing data which will change
our understandings of the universe. Indeed, the key technology being used – radio astronomy – is already credited with this; its most notable inventions being wi-Fi, medical imaging, quantum cryptography, mobile phone location systems, space craft navigation systems and GPS applications. The SKA give us the next generation in technologies – driving ‘innovation insupercomputer capacity, high speed data transmission and storage, smart sensor networks, remote area infrastructure and renewable energy technologies’ (department of Commerce, 2013).
The 10 member nations, international Mou to work with industry alliances throughout the world and impressive list of support from multi-national organisations, not to mention the global industry engagement being undertaken during construction, all leave no doubt of the positive impact the project will increasingly have on connecting Perth and its scientific community to the rest of the world. The project will attract outstanding new talent to Perth, and provide the foundations for further development of the State’s ‘knowledge economy’.
NATIoNALITy oF SkA BoArd MEMBErS, 2013
AUSTrALIAN SkA INdUSTry CoNSorTIUM
SkA INdUSTry PArTICIPATIoN LANdSCAPE
TWO BOARD MEMBERS FROM EACH OF 10 SKA MEMBERCOUNTRIES (and representative from India), 2013
Australia, 2
Canada, 2
China, 2
Germany, 2
Italy, 2Netherlands, 2
New Zealand, 2
South Africa, 2
Sweden, 2
UK, 2India, 1
With construction planned in Murchison 700kms north of Perth by an international teamlead by institutions in Perth, SKA promises to put Perth in the center of something veryglobally exciting. Upon its 2024 completion, SKA will be the largest and most sensitivetelescope on earth capable of capturing data which will change our understandings of theUniverse. Indeed, the key technology being used – radio astronomy – is already creditedwith this, its most notable inventions being Wi-Fi, medical imaging, quantum cryptography,Mobile phone location systems, space craft navigation systems and GPS applications. TheSKA give us the next generation in technologies – driving ‘innovation in supercomputercapacity, high speed data transmission and storage, smart sensor networks, remote area infrastructure and renewable energy technologies’ (Department of Commerce, 2013).
‘The data collected by the SKA in a single day would take nearly two million years toplayback on an ipod’ (SKA Organisation, 2013)
The 10 member nations, international MOU to work with industry alliances throughout theworld and impressive list of support from multi-national organisations, not to mention the global industry engagement being undertaken during construction, leave no doubt of thepositive impact the project will increasingly have on connecting Perth to the rest of the world.
Square Kilometre Array (SKA)
SKA INDUSTRY PARTICIPATION LANDSCAPE
Australian SKA industry consortium
Australia, 2
Canada, 2
China, 2
Germany, 2
Italy, 2The netherlands, 2
new Zealand, 2
South Africa, 2
Sweden, 2
uK, 2India, 1
Formal consortium
Managed cohort
Loose alliance
vendor listing
Compiled by P. Crosby (SKA organisation), and J. humphreys (ASKAIC), 2013.
34 35
Perth as a globally connected city
International MoU for SkA Industry Engagement Collaboration
The SkA organisation
dutch Industry Alliance
Germany / Spain / Portugal Green energy Alliance Industry Consortia
Spanish Industry Consortia
SKA Supplier d-Base
Indian Govt/TATA Consortium
Canadian Industry Cluster
uSA Industry Alliance
Japanese SKA Industry Consortium
Chinese Govt Industry Collective
SKA Korea Industry working Group
Australasian SKA Industry Cluster
Italian SKA Industry Consortium
uK SKA Industry Group

USA 23% China 23%
France 8%
Germany 23%Belgium 8%
UK 15%
CoUNTry LoCATIoNS oF 13 orGANISATIoNS ASSoCIATEd WITH 7 CHIEF INVESTIGATorS
NUMBEr oF FACEBook LIkES FroM EACH rECordEd CoUNTry ANd CITy
Where are staff and students from?Belgium Greece Scotland
Canada Ireland Singapore
Chile Israel Spain
China Japan Sweden
France Malaysia uK
Germany Poland uSA
36 37
Perth as a globally connected city
India 5276uSA 1807Australia 790Pakistan 455Phillipines 392uK 291nepal 283Bangladesh 182Canada 147Mexico 138egypt 125Tunisia 125Brazil 111Algeria 106Germany 86Malaysia 84Sri Lanka 80Indonesia 59nigeria 57Italy 56
Chennai 271Bangalore 218hyderabad 207new delhi 195Mumbai 189Kathmandu 162Calcutta 132Prune 126Srinagar 122Karachi 105dhaka 103Coimbatore 91Chandigarh 82Lahore 85Ahmedabad 77
Perth 180Melbourne 137Sydney 107Brisbane 65
Plant energy Biology
A further example of the State’s scientific capacity and connectedness is the Australian Research Council Centre of excellence in Plant energy Biology based at uwA. The centre engages in highly innovative research investigating plant energy metabolism that aims to advance global knowledge on plant biomass productivity, fruit and grain yield, plant nutrient composition and adaption to abiotic and biotic stresses. The centre is exemplar of Perth’s capacity to engage in cutting-edge research outside of the resource industry and globally position itself as a leader in knowledge-intense industries.
The Centre represents a collaboration between three Australian universities – The university of westernAustralia, The Australian national university and university of Adelaide. Its 110 staff and students come from across the globe to work under the direction of seven chief investigators strongly affiliated with 13 R&d organisations. To date, the Centre has supported the publication of 330 articles in key journals nature, Cell, Science, Proceedings of national Academy of Science uSA and The Plant Cell.
Perth
of the Australian papers published in top plant journals, 21% were from the Centre. There have been 670 international media commentaries of various Centre achievements.
The 5,940 people who liked their Facebook page ‘Science is Amazing’ in 2012 rose to 13,000 in november 2013. This number continues to rise rapidly and reflects global interest. while concentrated in South Asia and north America, these supporters come from most continents on the globe. of those who nominated a city, most were located in India.

PeoPLe ConneCTIvITY
PErCENTAGE oF AUSTrALIA’S PoPULATIoN BorN oVErSEAS, 2011
CoUNTry oF orIGIN oF NoN-AUSTrALIAN BorN PErTH METroPoLITAN PoPULATIoN 2011
The figure above outlines the regions of origin for those born overseas in 2011 (circle size denotes source regions of greater migrant numbers). of all migrants: 34% came from the UK and Islands; 11% Maritime SE Asia; 10% from each South and east Africa and new
Zealand; 7% from Southern Asia; 4% or less from all other regions. In some respects, the map represents the cumulative connectivity of Perth’s diverse migrant history, social, economic and political backgrounds. For example, the strength of various colonial
connections to the uK and South and East Africa (57% and 16.5% of migrants from this region come from South Africa and Zimbabwe), economic and political Asia-Pacific ties, as well as Trans-Tasman relations with new Zealand.
The notion that migrants uproot from social and business networks in the homeland to transplant themselves into a host country has been replaced by new ideas focused on the forward and backward information linkages created by the international movement of people. The importance of this for the globalisation process is not wasted on either source or receptor nations. Indeed, many countries now offer dual or even multi-nation citizenships to encourage and support ‘social and political membership to those residing outside their territories in an attempt to capture the resources migrants can offer’ (Levitt,
2001, p.196). For source nations, the ‘resources’ of emigrants include not only the financial, but the transferal of ‘ideas’ acquired by migrants from their new home to susceptible family and friends effecting cultural or demographic trends (e.g., change in birth rate, gender relations) (Fargues, 2011; Levitt, 2001). For receiving countries, migration has been attributed to greater overall economic competitiveness and growth through increases in factors, such as cultural diversity, tourism, propensity to innovate, as well as inward and outward foreign investment and trade (nikamp et al., 2011).
Perth’s steeped history of multiculturalism has led to a high degree of cultural diversity (Maginn, 2012). It is one of Australia’s most multicultural cities, moving from having the second highest percentage of overseas born residents in 2001 (31.1%, behind Sydney’s 31.2%) to first in 2011 (34.6% overtaking Sydney’s 34.3%). It finds above national average migration growth rates (2001-2011) with Asian migrant proportions slowly rising against the dominate Anglo-Sphere migrant group.
Born Australia 76%
Born overseas 24%County of birth not stated 6%
Overseas visitors 1%
Born in Australia 59%
Born overseas 34%
Northern America 2.19%
Caribbean 0.13%
Central America 0.3%
South America 1.09% South and East Africa 10.17%
New Zealand 9.65%
Polynesia 0.26%
Melanesia 0.25%
Micronesia 0.01%
Maritime SE Asia 10.94%
SE Asia 0.00%
Mainland SE Asia 4.13%
Japan and Koreas 1.02%Southern Asia 7.04%
Central Asia 0.26%
Central and West Africa 0.37%
north Africa and Middle East 0.0%
North Africa 0.55%Southern Europe 2.29%
Ireland 2.39%
uK and Islands 34.25%
Northern Europe 0.48%
Eastern Europe 1.44%
Middle East 1.34%
Western Europe 3.39%
Se europe 2.59%
Source: ABS (2011).
Source: ABS (2011).
Chinese Asia (incl. Mongolia) 3.47%
38 39
Perth as a globally connected city

VISA GroUPING For oVErSEA MIGrANTS To WA AS PErCENTAGE oF ToTAL NoM, 2009
In 2012, wA ranked third in terms of net overseas migration (noM) with a total increase of 52,306 migrants. This is compared to nSw with 61,484, victoria with 56,191 and Queensland with 47,251. As a percentage of total noM, wA was the only state to have migration
increases across all major population groupings.
Of immigrants to WA, 53% came on temporary visas with the largest group being business long stay visas (25%). 18% came for both higher education and veT sector studies, and 8% as
some other type of student. working holiday and other visitors comprised 14% and 17% respectively. Of the 35% of permanent visa holders, 58% were skilled migrants, 29% joined family already in the State and 13% were granted on special eligibility and humanitarian grounds.
NET oVErSEAS MIGrATIoN, 2012
MAjor GroUPINGS By STATE AS PErCENT oF ToTAL NoM, 2009
0 10,000 20,000 30,000 40,000 50,000 60,000 70,000
TAS
NT
ACT
SA
QLD
WA
VIC
NSW
Number of persons
Net overseas migration by State, 2012
63.7
63.7
56.9
50.9
53.4
47.6
55.5
67.6
37.1
32.6
23.2
45
35.2
43.1
41
36.7
-20 0 20 40 60 80 100 120
NSW
VIC
Qld
SA
WA
Tas
NT
ACT
%
Temporary visas Permanent visas New Zealand citizen Australian citizen Other
Permanent visas 35%
Other 12%
Temporary visas 53%
Special eligibility and humanitarian 13%
Skill 58%
Family 29%
working holiday 14%
Visitor 17%
VET sector 18%
higher education sector 18%
Student other 8%Business long stay (subclass 457) 25%
Source: ABS (2012)
Source: ABS (2013).
Source: ABS (2012).
40 41
Perth as a globally connected city

5% 10%
0% 6% 4% 4% 5% 6% 4% 3% 4% 4% 4% 5% 4% 5% 5% 3% 4%
9% 7%3% 5% 4% 5%
12% 6%
13%
13%
9% 8% 10%
10% 13% 12% 10%
17%
9%
19%
10% 11% 8%
9%12%
6%8%
10% 8% 10% 9%
13%
8%
0%
10%
11% 19%
9% 7%
14%
11% 8%
4%
9%
4%
5% 4%
7%4%
14%
6% 7%7% 6% 5% 8%
11%
6%
0%
7% 10%
7%
8% 10%
13%
10%
8% 8%
12%
13%
9% 10% 8%
11%
11%
7% 8%9% 9% 7%
9%
7%
5%
30%
7% 5%
5%
8% 8%
9%
6%
8% 8% 10%
20%
14%
23% 27%
11%
11%
7%
15%
8% 8%4%
7%
13%
8%
26%
10%
8% 6%
9% 8%
9%
10%
8% 7%
8%
7%
7%
8% 7%
9%
13%
6%
7%
7%3%
7%
8%
6%
6%
0%
6%
7% 6% 5%
6%
6%
5%
5% 5%
4%
3%
7%
5% 4%
5%
4%
6%
3%
5%8%
3%
7%
7%
13%
13%
8%
10% 11% 13%
13%
7%
8%
14% 10%
13%
7%
12%
11% 8%
10%
9%
16%
13%
8%15%
7%
14%
10%
12%
0%
12%
11% 10% 9% 10%
7%
14% 10%
10%
7%
6%
8%
6% 7%
13%
5%
11%
13%
13%
13%
9%
8%
5%
13%
17%
5% 10% 8%
11% 9%
8%
7%
8% 9%
9%
4%
7%
6% 9%
7%
5%
14%
8%
13%
11%
7%
9%
11% 14%
0%
16% 15% 17% 14% 13%
9% 14%
16% 18% 14% 12%
15% 11% 10%
16%13% 12% 11%
19%15%
37%
16%
5%10%
0%6% 4% 4% 5% 6% 4% 3% 4% 4% 4% 5% 4% 5% 5% 3% 4%
9% 7% 3% 5% 4% 5%
12%6%
13%
13%
9% 8%10%
10% 13%12% 10%
17%
9%
19%
10%11% 8%
9% 12%
6% 8%
10% 8% 10% 9%
13%
8%
0%
10%
11%19%
9% 7%
14%
11%8%
4%
9%
4%
5%4%
7% 4%
14%
6% 7% 7% 6% 5% 8%
11%
6%
0%
7%10%
7%
8%10%
13%
10%
8%8%
12%
13%
9%10% 8%
11%
11%
7% 8% 9% 9% 7%
9%
7%
5%
30%
7%5%
5%
8%8%
9%
6%
8%8% 10%
20%
14%
23% 27%
11%
11%
7%
15%
8% 8% 4%
7%
13%
8%
26%
10%
8%6%
9%8%
9%
10%
8%7%
8%
7%
7%
8%7%
9%
13%
6%
7%
7% 3%
7%
8%
6%
6%
0%
6%
7%6% 5%
6%
6%
5%
5%5%
4%
3%
7%
5%4%
5%
4%
6%
3%
5% 8%
3%
7%
7%
13%
13%
8%
10%11% 13%
13%
7%
8%
14% 10%
13%
7%
12%
11% 8%
10%
9%
16%
13%
8% 15%
7%
14%
10%
12%
0%
12%
11% 10% 9%10%
7%
14%10%
10%
7%
6%
8%
6%7%
13%
5%
11%
13%
13%
13%
9%
8%
5%
13%
17%
5%10% 8%
11%9%
8%
7%
8%9%
9%
4%
7%
6% 9%
7%
5%
14%
8%
13%
11%
7%
9%
11%14%
0%
16% 15% 17%14% 13%
9%14%
16% 18%14% 12%
15%11% 10%
16% 13% 12% 11%
19% 15%
37%
16%
PErCENTAGE oF MIGrANTS IN PErTH FroM EACH SoUrCE rEGIoN WorkING IN SPECIFIC INdUSTry, 2011
The below graph examines migrant profiles for Perth by source region for broad categories of industry of employment. overall, health care and social assistance were found to be a large proportion of employment in all migrant groups. Central & west Africa had the largest number employed (37% of their population) with the next group being Central America (19%). The professional, scientific
and technical services group was dominated by North American (16%) and Caribbean (15%) cohorts. Manufacturing had the highest proportions of Mainland SE Asian (19%) and North African (17%) groups. examining the specific employment choice of different migrant groups, new Zealand migrants gravitated towards manufacturing (12%), construction, electricity, gas, water
and waste services (13%) and wholesale trade, transport, postal and warehousing (13%). North Americans concentrated in professional, scientific and technical (16%) and education and training (14%). Eastern europeans and South & east Africa tended towards professional, scientific and technical services (14%) and health care and social assistance (16%), along with the Middle
east group (respectively 13% and 14%). Micronesia (30%), Chinese Asians (23%) and Japanese/Koreans (27%) were strongest in arts, recreation services, accommodation and food services. UK migrants (15%) leaned towards health care and social assistance; the Irish were mostly likely in construction (19%).
Regional migrant profiles suggest some employment advantages for migrants from particular source countries in different industries. The reasons for this are likely to be
varied and complex encompassing both individual attributes derived from cultural conditioning as well as the development of international connections. For example, employment and industry strengths derived from the homeland or culture (i.e., strong customer service culture), regional trade agreements in particular industries, or the education levels or english-language limitation of general migrate populations (i.e., migrants with lower education or limited english may seek low-skilled manufacturing
positions). An example of this can be found in the concentration of north American migrants in education and mining, the second highest after Micronesia. The former industry is most likely an outcome of north America strength in research and education and resultant links with Australian universities and the broader education sector. The latter may be an outcome of north America’s connectivity in the resource sector (see Martinus, 2013).
100%
80%
60%
40%
20%
0%
new Zealand
Melanesia
Micronesia
Polynesia (e
xcludes hawaii)
uK and Islands
Ireland
western europe
northern europe
Southern europe
South eastern europe
eastern europe
north Afric
a
Middle east
Mainland South east Asia
Maritime South east A
sia
Chinese Asia (in
cl. Mongolia)
Japan and Koreas
Southern Asia
Central Asia
northern America
South America
Central America
Caribbean
Central and west A
frica
Southern and east Afric
a
health care and social assistance
education and training
Administration, support services, public administration and safety
Professional, scientific and technical services
Information media, telecommunications, financial, insurance services, rental, hiring and real estate services
wholesale trade, transport, postal and warehousing
Arts, recreation services, accommodation and food services
Retail trade
Construction, electricity, gas, water and waste services
Manufacturing
Mining, agriculture, forestry and fishing
5%10%
0%6%4%4%5%6%4%3%4%4%4%5%4%5%5%3%4%
9%7%3%5%4%5%
12%6%
13%
13%
9%8%10%
10%13%12%10%
17%
9%
19%
10%11%8%
9%12%
6%8%
10%8%10%9%
13%
8%
0%
10%
11%19%
9%7%
14%
11%8%
4%
9%
4%
5%4%
7%4%
14%
6%7%7%6%5%8%
11%
6%
0%
7%10%
7%
8%10%
13%
10%
8%8%
12%
13%
9%10%8%
11%
11%
7%8%9%9%7%
9%
7%
5%
30%
7%5%
5%
8%8%
9%
6%
8%8%10%
20%
14%
23%27%
11%
11%
7%
15%
8%8%4%
7%
13%
8%
26%
10%
8%6%
9%8%
9%
10%
8%7%
8%
7%
7%
8%7%
9%
13%
6%
7%
7%3%
7%
8%
6%
6%
0%
6%
7%6%5%
6%
6%
5%
5%5%
4%
3%
7%
5%4%
5%
4%
6%
3%
5%8%
3%
7%
7%
13%
13%
8%
10%11%13%
13%
7%
8%
14%10%
13%
7%
12%
11%8%
10%
9%
16%
13%
8%15%
7%
14%
10%
12%
0%
12%
11%10%9%10%
7%
14%10%
10%
7%
6%
8%
6%7%
13%
5%
11%
13%
13%
13%
9%
8%
5%
13%
17%
5%10%8%
11%9%
8%
7%
8%9%
9%
4%
7%
6%9%
7%
5%
14%
8%
13%
11%
7%
9%
11%14%
0%
16%15%17%14%13%
9%14%
16%18%14%12%
15%11%10%
16%13%12%11%
19%15%
37%
16%
5%10%
0%6%4%4%5%6%4%3%4%4%4%5%4%5%5%3%4%
9%7%3%5%4%5%
12%6%
13%
13%
9%8%10%
10%13%12%10%
17%
9%
19%
10%11%8%
9%12%
6%8%
10%8%10%9%
13%
8%
0%
10%
11%19%
9%7%
14%
11%8%
4%
9%
4%
5%4%
7%4%
14%
6%7%7%6%5%8%
11%
6%
0%
7%10%
7%
8%10%
13%
10%
8%8%
12%
13%
9%10%8%
11%
11%
7%8%9%9%7%
9%
7%
5%
30%
7%5%
5%
8%8%
9%
6%
8%8%10%
20%
14%
23%27%
11%
11%
7%
15%
8%8%4%
7%
13%
8%
26%
10%
8%6%
9%8%
9%
10%
8%7%
8%
7%
7%
8%7%
9%
13%
6%
7%
7%3%
7%
8%
6%
6%
0%
6%
7%6%5%
6%
6%
5%
5%5%
4%
3%
7%
5%4%
5%
4%
6%
3%
5%8%
3%
7%
7%
13%
13%
8%
10%11%13%
13%
7%
8%
14%10%
13%
7%
12%
11%8%
10%
9%
16%
13%
8%15%
7%
14%
10%
12%
0%
12%
11%10%9%10%
7%
14%10%
10%
7%
6%
8%
6%7%
13%
5%
11%
13%
13%
13%
9%
8%
5%
13%
17%
5%10%8%
11%9%
8%
7%
8%9%
9%
4%
7%
6%9%
7%
5%
14%
8%
13%
11%
7%
9%
11%14%
0%
16%15%17%14%13%
9%14%
16%18%14%12%
15%11%10%
16%13%12%11%
19%15%
37%
16%
Source: ABS (2011).
42 43
Perth as a globally connected city

PErCENTAGE oF MIGrANTS FroM EACH rEGIoNAL PoPULATIoN HoLdING A dEGrEE/QUALIFICATIoN, 2011
Brain gain or brain drain?
despite an overall loss of Australian residents overseas, research has found that it is more than compensated by a net gain of skilled migrants (dobson et al., 2005). Migration of highly skilled persons can be used to fill specific human capital gaps in industry as well as lift and diversify overall knowledge and skill levels to encourage innovation and research. Migrants to Perth may also include
returnees – past residents of Perth whose overseas study/work/life experiences enable them to return as more globally aware and connected citizens.
Looking at the degrees held as a percent of each population grouping highlights distinct differences in the degree of educational attainment by region. uK migrants were almost 14% less likely to have a qualification than
the overall most educated group of Southern Asia migrants (77%). Other top migrant groups faired equally poorly, with migrants from new Zealand and Mainland Se Asia having some of the lowest education rates. The lower education of the Australian-born population is most likely a reflection of Australian migration policy targeting skilled migrants (see huddleston et al., 2012).
ToP 5 rEGIoNS PEr QUALIFICATIoN AS PErCENTAGE oF rEGIoNS MIGrANTS, 2011
PErMANENT oVErSEAS dEPArTUrES By oCCUPATIoN By STATE, 2011-2012, NUMBEr oF PErSoNS
The above table extracts the top five migrant source regions per qualification. variations in regional education profile suggest broader socio-economic differences which may be linked to cultural attitudes
towards and previous opportunities to access education and skills. The mostly highly educated populations with either a Master’s or Phd were Southern & Chinese Asia, north America, the
Middle east and eastern europe. Those populations which largely comprised of certificate-level qualifications were Ireland, uK, new Zealand, Southern and western europe.
0
1,000
2,000
3,000
4,000
5,000
6,000
Vic. NSW Qld WA SA ACT Tas. NT
Number of persons
State
Labourers & Related Workers
Machinery Operators & Drivers
Sales Workers
Clerical & Administrative Workers
Community & Personal Service Workers
Technicians & Trades Workers
Professionals
Managers
Postgraduate degree
Graduate diploma and Graduate Certificate
Bachelor degree
Advanced diploma and diploma
Certificate
Southern Asia (19.8%)
Melanesia (3.7%)
Maritime South-East Asia (40.2%)
Micronesia (22.7%)
Ireland (26.6%)
Chinese Asia (17.8%)
South America (3.3%)
South America (36.2%)
Southern and East Africa (17.4%)
united Kingdom (25.4%)
northern America (17%)
northern America (3.2%)
Japan & Koreas (35.8%)
eastern europe (16.2%)
new Zealand (24.2%)
Middle east (16.4%)
Caribbean (3.1%)
northern America (34.4%)
Central & west Africa (15.3%)
Southern europe (22.7%)
eastern europe (14.2%)
united Kingdom (2.8%)
Middle east (30.3%)
Southern Asia (14.6%)
western europe (22.3%)
Source: Adapted from ABS (2011).
Source: Australian education International (2013).
43.0%
44.5% 48.1%
50.4%
55.1%
56.4%
58.0%
59.5% 63.4%
65.8%
67.0%
68.8%
69.7%
69.7%
69.8%
70.7%
70.8%
71.4% 71.5%
71.9%
72.7%
73.4%
73.5%
73.5%
75.0%
77.2%
0 10 20 30 40 50 60 70 80 90
Mainland South-East Asia
Central Asia
Southern Europe
New Zealand
Polynesia (excludes Hawaii)
Australia (includes External Territories)
South Eastern Europe
North Africa
United Kingdom, Channel Islands and Isle of Man
Chinese Asia (includes Mongolia)
Central America
Japan and the Koreas
Caribbean
Middle East
Northern Europe
Western Europe
Melanesia
Central and West Africa
Southern and East Africa
Maritime South-East Asia
Micronesia
South America
Northern America
Ireland
Eastern Europe
Southern Asia
%
Region
Postgraduate Degree Level
Graduate Diploma and Graduate Certificate Level
Bachelor Degree Level
Advanced Diploma and Diploma Level
Certificate Level
Source: ABS (2011).
44 45
Perth as a globally connected city
Region

Countries with consulate presence in Perth
PErCENTAGE FroM EACH rEGIoN oF ALL PErTH CoNSULATES
Western Europe
Asia/oceania
Eastern Europe
Africa South America
North America
Middle East
Austria Bangladesh Belarus Botswana Brazil Canada Turkey
Belgium China Croatia Ghana Chile uSA
denmark India Czech Republic Kenya Peru
Finland Indonesia estonia Mali uraguay
France Japan hungary Mauritius
Germany Laos Kazakhstan South Africa
Greece Malaysia Latvia Tanzania
Ireland Mongolia Macedonia uganda
Italy new Zealand
Malta Pakistan
netherlands Phillipines
norway Sri Lanka
Poland Thailand
Portugal Timor-Leste
Spain vietnam
Sweden
Switzerland
uK
embassies and consulates promote diplomatic relations and the interconnectedness of countries. Consulates handle minor foreign relations between nations providing ex-patriot and tourist support, such as issuing passports and visas and aiding trade relations. A consular presence is a source of prestige for both host city and foreign nation. It can be viewed as
a measure of the strength in cultural and economic connection, pointing to a city’s importance to another nation’s trade, migrant or tourist networks.
As illustrated by the map above, there are a large number of nations with consulates in Perth. Perth appears to have particular strong ties with the Asia-Pacific, Western Europe and north American regions.
PoLITICAL ConneCTIvITY
46 47
PeRTh AS A GLoBALLY ConneCTed CITY
Perth
Source: Adapted from department of Foreign Affairs and Trade (2013b).
40% _____________________________________________________________________________________________
20% _____________________________________________________________________________________________
0% _____________________________________________________________________________________________
Region western europe
Asia/oceania
eastern europe
Africa South America
north America
Middle east

Sister city relations
Feelings of belonging and maintained connections with source countries appear to have little impact over a migrants’ assimilation or socio-economic integration into the receptor country (van Bochove et al., 2010). Rather it contributes to the globalisation process as the socio-economic connections created by migrant socio-cultural, political and economic choices can lead to more formalised relations between two countries, such as sister-city arrangements, as
well as shared ‘ethnic’ memberships of community organisations and festivals (see Levitt, 2001). Cosmini-Rose (2008) present Australia as a case study of this, noting that the shift from past assimilation pressures to increased tolerance of ethnic diversity has encouraged connection with migrant homelands. Such an environment works to embed transnational connections beyond first generation migrants into the community in general.
PErTH CITy SISTEr-CITy (BLUE) ANd MUTUAL FrIENdSHIP (GrEEN) AGrEEMENTS
WESTErN AUSTrALIA SISTEr-STATE rELATIoNS
Perth
The limitless possibilities in how or why people connect places greater emphasis on the ability of migrants to ‘connect’ across national borders through various types of activities and knowledge exchange. Regardless of the level of homeland attachment a migrant feels, the connection provides a portal for others who may be interested (Soehl & waldinger, 2010).
western Australia’s and Perth’s respective Sister-State and Sister-City relations illustrate past efforts to set the foundations and provide a portal for future economic and social exchange with specific areas. They are likely to be key means to connect migrant diasporas and develop economic links.
Source: Adapted from City of Perth (2013).
48 49
PeRTh AS A GLoBALLY ConneCTed CITY
San diego, CA, USA1987
Perth, Scotland2006
Houston, Tx, USA1984
Seocho, korea2008
Vasto, Italy1989
Megisti, Greece1984
rhodes, Greece1984
Chengdu, China2010
Nanjing, China1998
kagoshima, japan1974
Taipei, Taiwan1999
Tuscany region, 1999
Zhejiang Province, 1987
Province of East java, 1990
Hyogo Prefecture, 1981

Perth
State Government offices
Against a backdrop of intensifying global pressures and shifting political landscapes, geopolitical relationships are becoming increasingly important and relevant to national socio-economic stability and security.
The overseas locations of wA State government offices (see map below), such as the department of State development and department of Premier
and Cabinet, are in key trade and investment regions. As noted at the beginning of this report, these locations are likely to be associated with historic connections with the British empire as well as strategic decisions to advance wA’s political, social and economic interests in Asia and the Middle East. Indeed, the offices of both the department of Premier and Cabinet and the department of
State development (dSd) controlling europe, the Middle east and north Asia are in the respective cities of London, Tokyo and dubai. The additional dSd offices found in China, South Korea, Singapore, India and Indonesia demonstrate the high significance of the Asia-Pacific Region to western Australia’s economic development, whilst the newly opened office in Kenya signifies wA’s emerging relations.
WESTErN AUSTrALIAN GoVErNMENT INTErNATIoNAL oFFICES
Source: Adapted from department of State development (2013) and the department of Premier and Cabinet (2013).
ConCLudInG CoMMenTSGlobal connectivity plays an increasingly large role in the success of local regions. Technological advances and globalisation have allowed places such as Perth, one of the most isolated cities in the world, to emerge as competitive locations in attracting business and people. Traditionally, global connectedness could be simply calculated by people movements and trade volumes through air and sea ports. however, current assessments are muddied by the added layer of virtual connectivity through the Internet and social media. Indeed, the limitless reasons international connections occur makes facilitating them through all manner of activities and knowledge exchange more important than ever. As such, this report attempts to give readers a glimpse into the sheer mass and complexity of connections that Perth now engages in. These connections strongly reflect the diverse and distinctive character of
a city underwritten by a highly specialised and skilled workforce and diverse society.
This report is structured to capture the diversity of Perth’s connections to the rest of the world across economic, social and political realms. It unpacks the scalar qualities of connectivity by considering its global properties alongside specific case studies chosen to highlight broader trends in the City. As a whole, the content of this report represents six years of complex evidence-based investigation and inquiry into Perth’s global connectivity by the Committee for Perth FACTBase team. This work has focused on synthesising previously disparate and dispersed information into a central research hub, with the hope of providing the Perth community with a platform of general discussion and policy debate in areas critical in shaping the future of our City.
50 51
PeRTh AS A GLoBALLY ConneCTed CITY
London: for Europe
dubai: for Middle East
Mumbai
Singaporejakarta
Shanghai
Hangzhou
Seoul
kobe and Tokyo: for North Asia
Nairobi: for Africa

ReFeRenCeSAeCoM (2013) Pluto LNG Project, Karratha, Australia. www.aecom.com/where+we+Are/Australia+-+new+Zealand/oil+Gas/_carousel/Pluto+LnG+Project,+Karratha,+Australia>. Accessed november 2013.
ARC (n.d.) ARC Centre of Excellence for All-Sky Astrophysics. www.arc.gov.au/ncgp/ce/astrophysics.htm. Accessed november 2013.
------- (2010) Super Science Fellowships. www.arc.gov.au/pdf/SSF_leads.pdf. Accessed november 2013.
------- (2013) Welcome to the Australian Research Council Website www.arc.gov.au/ Accessed november 2013.
Austal (2008) Celebrating 20 Years 1988-2008. The west Australian, Advertising Feature.
------ (2013) [website] www.austal.com/ Accessed november 2013.
Australian Bureau of Statistics (ABS) (2011) Census of Population and Housing Data, 2011. ABS: Canberra.
------- (2013) International Investment Positions, Australia: Supplementary Statistics, 2012. ABS Cat. no. 5352.0. ABS: Canberra.
------- (2013b) Labour Force, Australia, Detailed, Quarterly, Aug 2013. Cat. no. 6291.0.55.003. ABS: Canberra.
------- (2012) Australia National Accounts: States Account, 2011-12. ABS Cat. no. 5220.0.
Australian education International (2012) AEI International Student Enrolment Data 2012. Australian Government: Canberra.
Australian Government (2012) Prime Minister’s Manufacturing Taskforce: Report of the Non-Government Members. Australian Government: Canberra.
Australian Research Council (ARC) (2013) NCGP Statistics. www.arc.gov.au/general/searchable_data.htm Accessed november 2013.
------- (2013) NCGP Statistics: Partner Organisations. Commonwealth of Australia: Canberra.
Australian Stock exchange (2013) Listed Companies. AXS: Sydney.
Australian Trade Commission (2013) Australia Unlimited. www.australiaunlimited.com/ Accessed november 2013.
Bellamy, A. (2013) FY2013 Results Presentation. Austal: Perth.
Biglia, B. & Butler, L. (2009) ARC-Supported Research: The Impact of Journal Publication Output 2001-2005. Australian Government: Canberra.
Chevron (2013) Gorgon Project Fact Sheet May 2013 www.chevronaustralia.com/Libraries/Chevron_documents/Gorgon_Project_overview.pdf.sflb.ashx Accessed November 2013.
City of Perth (2013) Sister Cities. www.perth.wa.gov.au/council/national-and-international-relations/sister-cities Accessed november 2013.
Commonwealth Bureau of Census and Statistics (Australia) Western Australia Office & Western Australia. Government Statistician’s Office (1913) Statistical Register of Western Australia for…and Previous Years. Government Printer, Perth, wA.
-------- (1963) Statistical Register of Western Australia for…and Previous Years. Government Printer, Perth, wA.
Cosmini-Rose, d. (2008) Connections with the homeland: community and individual bonds between South Australian Italian migrants from Caulonia (Calabria) and their hometown. FuLGoR, 3(3).
Council of Australian Governments (2010) International Students Strategy for Australia 2010-2014. Australian Government: Canberra.
department of Commerce (2013) The Square Kilometre Array in Australia: Exploring the Universe with the World’s Largest Radio Telescope. western Australian Government: Perth.
52 53
Perth as a globally connected city

department of Foreign Affairs and Trade (2012) Trade at a Glance 2012. Australian Government: Canberra.
-------- (2013) Trade Matters 2012, Western Australia: State Trade with the World www.dfat.gov.au/tradematters/wa.html Accessed november 2013.
-------- (2013b) Australia and the World www.dfat.gov.au/aib/australia-and-the-world.html Accessed november 2013.
department of Immigration and Citizenship (2013) Statistics www.immi.gov.au/media/statistics/ Accessed november 2013.
department of Mines and Petroleum (2013) Latest Statistics Release: Highlights in 2012 www.dmp.wa.gov.au/1525.aspx Accessed november 2013.
department of Premier and Cabinet (2013) Annual Report 2012-2013. Government of western Australia: Perth.
department of Resources energy and Tourism (2012) Energy in Australia 2012. Australian Government: Canberra.
department of State development (2013) Western Australia Economic Profile – August 2013. www.dsd.wa.gov.au/8480.aspx Accessed november 2013.
-------- (2013) Key Trading Partners www.dsd.wa.gov.au/8480.aspx Accessed november 2013.
dobson, R., Birrell, B., Rapson, v. & Smith, T. (2005) Brain drain and brain gain: the challenges of internationalisation brain drain: fact or fiction? Proceedings of OECD Conference on Trends in the Management of Human Resources in Higher Education. Paris, 25-26 August.
Fargues, P. (2011) International migration and the demographic transition: a two-way interaction. International Migration Review, 45(3), 588-614.
GawC (2013) GaWC Research Bulletins www.lboro.ac.uk/gawc/publicat.html Accessed november 2013.
heaney, J-G, Ryan, P. & heaney, M. (2010) Branding Private Higher Education Institutions in Australia to International Students http://hdl.voced.edu.au/10707/204146 Accessed november 2013.
huddleston, P. & huddleston, v. (2010) Global Competitiveness: Implications for Perth. FACTBase Bulletin no. 13, The university of western Australia and Committee for Perth, Perth.
huddleston, v., huddleston, P. and Tonts, M. (2012) Migrants’ attraction to Cities: Implications for Perth. FACTBase Bulletin No.27, The university of western Australia and Committee for Perth, Perth.
Industry Innovation Council (2011) Trends in Manufacturing to 2020: A Foresighting Discussion Paper. department of Innovation Industry Science and Research: Canberra.
Levitt, P. (2001) Transnational migration: taking stock and future directions. Global Networks, 1(3), 195-216.
Martinus, K. (2013) Perth’s Global Connectivity in Energy. FACTBase Bulletin no. 32, The university of western Australia and Committee for Perth, Perth.
nikamp, P., Gheasi, M. & Rietveld, P. (2011) Migrants and international economic linkages: a meta-overview. Spatial Economic Analysis, 6(4), 359-376.
Platts (2013) Top 100 Energy Company Rankings. Platts: nY, uSA.
Smarter Manufacturing for a Smarter Australia: Report of the Non-Government Members. Commonwealth of Australia: Canberra.
Rix, n. (2013) Square Kilometre Array: Where Science Meets Industry [powerpoint] https://www.stfc.ac.uk/resources/pdf/10%20SKA%20where%20Science%20meets%20Industry%20-%20Nigel%20Rix.pdf Accessed november 2013.
S&P (2013) S&P Global Natural Resources Index. S&P: nY, uSA.
SKA organsation (2013) Amazing Facts [website] www.skatelescope.org/media-outreach/fun-stuff/facts-figures/ Accessed November 2013.
Soehl, T. & waldinger, R. (2010) Making the connection: Latino immigrants and their cross-border ties. Ethnic and Racial Studies, 33(9), 1489-1510.
Supanova (2013) Supanova Pop Culture Expo: Brisbane and Adelaide 2013 Expo Information.
Tonts, M., Martinus, K. & Plummer, P. (2013, in press) Regional development, redistribution and the extraction of mineral resources: The Western Australian Goldfields as a resource bank. Applied Geography, http://dx.doi.org/10.1016/j.apgeog.2013.03.004
Tonts, M. & Taylor, M. (2010) Corporate location, concentration and performance: large company headquarters in the Australian urban system. Urban Studies, 47(12), 2641-2664.
unCTAd (2009) Global FdI decline due to the financial crisis, and a further drop expected. UNCTAD Investment Brief, No. 1. united nations Conference on Trade and development: Geneva, Switzerland.
uS department of energy (2013) International Energy Statistics. www.eia.gov/cfapps/ipdbproject/IedIndex3.cfm?tid=44&pid=44&aid=2 Accessed november 2013.
uwA (2013) Unistats 2013 www.stats.uwa.edu.au/StatsOffice/unistats/2013 Accessed november 2013.
van Bochove, M., Rusinovic, K. & engbersen, G. (2010) The multiplicity of citizenship: transnational and local practices and identifications of middle-class migrants. Global Networks, 10(3), 344-364.
Victoria Competition and Efficiency Commission (2008) A State of Liveablity: An Inquiry into Enhancing Victoria’s Liveability. State of victoria: Melbourne.
whalley, J. (2013) Pluto Liquefied Natural Gas Project Rises for Woodside, www.heraldsun.com.au/business/pluto-liquefied-natural-gas-project-rises-for-woodside/story-fn7j19iv-1226556161567 Accessed november 2013.
woodside (2013) Pluto LNG, www.woodside.com.au/our-business/pluto/pages/default.aspx Accessed november 2013.
54 55
Perth as a globally connected city

ACKnowLedGMenTSThe authors acknowledge the assistance provided by the following individuals in the preparation of this report:
• Phil Crosby Strategic Planning and Major Project Specialist CSIRo Astronomy and Space
• Marty Cunningham department of Culture and the Arts
• Anthony di Leo School of earth and environment, The university of western Australia
• Graham harvey uniPrint, The university of western Australia
• John humphreys Australiasian SKA Industry Consortium
• Tony Monaghan Brand Agency
• Cameron Murray School of economics, The university of Queensland
• Thomas Sigler The university of Queensland
• Sashi walker eventsCorp (Tourism wA)
• Staff at International Centre for Radio Astronomy Research, The university of western Australia
• Staff at Plant energy Biology, The university of western Australia
ABouT The AuThoRSThe authors of this report work on the FACTBase project, a collaborative research project between The university of western Australia’s School of earth and environment and the Committee for Perth, aimed at benchmarking the liveability of Perth and its global connectedness through an examination of Perth’s economic, social, demographic and political character.
kirsten Martinus(Socio-Economic Analysis, Urban and Regional Planning) is Assistant Professor of geography at the School of earth and environment. her research interests lie in the human geography impact of globalisation and technology. This includes increased labour mobility and connectedness, global industry networks, knowledge economies and public policy.
Matthew Tonts(Economic Development, Labour Markets, Public Policy) is Professor of geography and currently head of the School of earth and environment. his research is focused on urban and regional development, with much of his recent work concerned with the shifting geography of corporate power, spatial labour markets and economic development, and regional policy.
56 57
Perth as a globally connected city

Committee for Perth and The University of Western Australia November 2013
The FACTBase project is a collaborative research project between the Committee for Perth and The University of Western Australia to benchmark the liveability of Perth and its global connectedness through an examination of Perth’s economic, social, demographic and political character.
The FACTBase team of academics and researchers condense a plethora of existing information and databases on the major themes, map what is happening in Perth in pictures as well as words,
This report is copyright of The University of Western Australia and the Committee for Perth. While we encourage its use, it should be referenced as:
Martinus, K. & Tonts, M. (2013) Perth as a Globally Connected City, a FACTBase Special Report, The University of Western Australia and Committee for Perth, Perth.
All research work commissioned by the Committee for Perth, including the FACTBase project is entirely funded through the contribution of our members. Our Foundation members are:
ANZBHP BillitonChevron AustraliaErnst & YoungHerbert Smith FreehillsRio TintoShellThe West AustralianWesfarmersWoodside
A full list of Committee for Perth members is available at www.committeeforperth.com.au
ABOUT FACTBaseand examine how Perth compares with, and connects to, other cities around the world.
Research findings are released regularly, providing an important resource for academics, planners and decision-makers on the following major themes:• Reinterpreting the
dynamics of Perth’s regional economy
• Economic governance for a globalising Perth
• Exploring ‘urban liveability’ in Perth
• Perth’s local government and governance landscape.

UniPrint 109413
For further information on the FACTBase project, contact:
Marion FulkerCEO, Committee for PerthT: 0419 048 665E: [email protected]
Dr Kirsten MartinusAssociate Professor-Human GeographySchool of Earth and EnvironmentThe University of Western AustraliaT: 08 6488 7674E: [email protected]
PERTH a
s a glob
ally connected city
a FA
CTB
ase
Spe
cia
l Re
po
rt
as a globally connected city
a FACTBase Specia l Repor t
PERTH


![OF No. 15] PERTH: FRIDAY, 28th FEBRUARY [1975](https://static.fdokumen.com/doc/165x107/6320f1b7eb38487f6b0fd6fa/of-no-15-perth-friday-28th-february-1975.jpg)