personality traits and mental health of - UM Students' Repository
257
2017 PERSONALITY TRAITS AND MENTAL HEALTH OF LOCAL AND INTERNATIONAL STUDENTS IN A PUBLIC UNIVERSITY IN MALAYSIA: A COMPARATIVE STUDY NAFISEH KANANIFAR FACULTY OF MEDICINE UNIVERSITY OF MALAYA KUALA LUMPUR University of Malaya
-
Upload
khangminh22 -
Category
Documents
-
view
2 -
download
0
Transcript of personality traits and mental health of - UM Students' Repository

2017
PERSONALITY TRAITS AND MENTAL HEALTH OF LOCAL AND INTERNATIONAL STUDENTS IN A PUBLIC UNIVERSITY IN MALAYSIA: A COMPARATIVE STUDY
NAFISEH KANANIFAR
FACULTY OF MEDICINE UNIVERSITY OF MALAYA KUALA LUMPUR
Univers
ity of
Mala
ya

2017
PERSONALITY TRAITS AND MENTAL HEALTH OF
LOCAL AND INTERNATIONAL STUDENTS IN
A PUBLIC UNIVERSITY IN MALAYSIA:
A COMPARATIVE STUDY
NAFISEH KANANIFAR
THESIS SUBMITTED IN FULFILMENT OF THE
REQUIREMENTS FOR THE DEGREE OF DOCTOR OF
PHILOSOPHY
FACULTY OF MEDICINE
UNIVERSITY OF MALAYA
KUALA LUMPUR
Univers
ity of
Mala
ya

UNIVERSITY OF MALAYA
ORIGINAL LITERARY WORK DECLARATION
Name of Candidate: NAFISEH KANANIFAR
Matric No: MHA100034
Name of Degree: PhD
Title of Thesis (“this Work”): PERSONALITY TRAITS AND
MENTAL HEALTH OF LOCAL AND INTERNATIONAL STUDENTS IN
A PUBLIC UNIVERSITY IN MALAYSIA: A COMPARATIVE STUDY
Field of Study: PSYCHOLOGY
I do solemnly and sincerely declare that:
(1) I am the sole author/writer of this Work;
(2) This Work is original;
(3) Any use of any work in which copyright exists was done by way of fair
dealing and for permitted purposes and any excerpt or extract from, or
reference to or reproduction of any copyright work has been disclosed
expressly and sufficiently and the title of the Work and its authorship have
been acknowledged in this Work;
(4) I do not have any actual knowledge nor do I ought reasonably to know that
the making of this work constitutes an infringement of any copyright work;
(5) I hereby assign all and every rights in the copyright to this Work to the
University of Malaya (“UM”), who henceforth shall be owner of the
copyright in this Work and that any reproduction or use in any form or by any
means whatsoever is prohibited without the written consent of UM having
been first had and obtained;
(6) I am fully aware that if in the course of making this Work I have infringed
any copyright whether intentionally or otherwise, I may be subject to legal
action or any other action as may be determined by UM.
Candidate’s Signature Date:
Subscribed and solemnly declared before,
Witness’s Signature Date:
Name:
Designation:
Univers
ity of
Mala
ya

iii
ABSTRACT
University students are an important pillar in building the society as they represent how
the society is shaped generation after generations. Various challenges during study
period have been found affecting the students, resulting in an increment of mental health
issues. Therefore, student mental health requires a special concern by the educational
authorities to avoid undesirable consequences that may accrue due to severe mental
health issues. This research presents a cross-sectional study to evaluate the prevalence
of mental health among the University of Malaya (local and international) students
based on their personality traits. According to statistical information given by
Information System of Malaya University, the sampling size has been computed. G-
power and Cochran formula have been employed to obtain and verify the sampling size.
Thus, a total of 755 samples; include 352 for international and 403 for local Malaysian
students, were selected for data analysis. Three personality traits measurements namely:
Revised NEO Personality Inventory (NEO-FFI), Clance Imposter Phenomenon Scale
(CIPS) and MACH Questionnaires (MACH-IV), have been used for personality data
collection. Besides, General Health Questionnaires (GHQ-28) has been employed for
screening student’s mental health. All the data was collected through self-administrated
questionnaires filling by university students after the reliability of the selected tools
were verified. The acquired data was analyzed by using multiple statistical methods.
The comparisons of personality differences and mental health among the university
students (local and international) have been investigated using Two-way Analysis of
Variance (2-way ANOVA). In addition, the relationship of personality traits and mental
health was examined through correlation and regression analysis. Prior to the data
analysis, the normality and construct validity have been checked. All the data were
analyzed using IBM SPSS Statistics software (Version 21) and AMOS (Version 21)
while Microsoft Office Excel has been used to prepare and tabulate the data. The data
Univers
ity of
Mala
ya

iv
analysis results demonstrated that there were no significant differences between local
and international students in terms of personality traits and mental health. However,
there was a significant difference between male and female in both personality traits and
mental health. In addition, the correlation results revealed that some of the personality
traits factors were significantly correlated with mental health state. Finally, yet
importantly, the regression analysis was shown that student’s mental health condition
could be predicted using personality traits. According to the statistical analysis results, a
shortened personality traits questionnaire named University of Malaya Personality
Traits Questionnaire (UM-PTQ) has been developed using factor analysis approach and
the content validity was checked through a panel of experts. The reliability of new tool
has been checked using Cronbach’s Alpha, the result shows that the developed tool is
reliable to use at the University of Malaya as well as any personality and mental health
assessment in future.
Univers
ity of
Mala
ya

v
ABSTRAK
Pelajar universiti adalah tunjang penting dalam pembangunan masyarakat kerana
mereka melambangkan bagaimana sesebuah masyarakat dibentuk dari generasi ke
generasi. Pelbagai cabaran dalam tempoh kajian telah dijumpai yang memberi kesan
kepada pelajar, menyebabkan satu peningkatan dalam masalah kesihatan mental. Oleh
itu, kesihatan mental pelajar memerlukan satu perhatian khusus melalui kuasa
pendidikan bagi mengelakkan kesan yang tidak diingini yang boleh berlaku disebabkan
oleh masalah kesihatan mental yang teruk. Kajian ini memberi satu keratan bagi menilai
kelaziman kesihatan mental dalam kalangan pelajar Universiti Malaya berdasarkan sifar
personaliti mereka. Berdasarkan kepada maklumat statistik yang diberi oleh Sistem
Maklumat Universiti Malaya, saiz persampelan telah dikira. Dengan itu, jumlah
keseluruhan sampel ialah 755 termasuk 352 pelajar antarabangsa dan 403 pelajar
Malaysia dipilih untuk analisis data. Tiga pengukuran sifat personaliti adalah: “Revised
NEO Personality Inventory (NEO-FFI)”, “Clance Imposter Phenomenon Scale (CIPS)”
dan “MACH Questionnaires (MACH-IV)”, telah digunakan sebagai personaliti
pengumpulan data. Selain itu, “General Health Questionnaires (GHQ-28)” telah
ditugaskan untuk pemeriksaan kesihatan mental pelajar. Semua data telah dikumpulkan
melalui “self-administrated” pengisian soal selidik oleh pelajar universiti selepas
kebolehpercayaan alat yang dipilih disahkan. Pengambilan data telah dianalisis
menggunakan pelbagai kaedah statistik. Perbandingan perbezaan personaliti dan
kesihatan mental dalam kalangan pelajar telah disiasat menggunakan “Two-way
Analysis of Variance (2-way ANOVA)”. Tambahan pula, hubungan sifat personaliti and
kesihatan mental telah diperiksa melalui analisis korelasi dan regresi. Sebelum analisis
data, normaliti dan kesahihan membina telah disemak. Semua data telah dianalisis
menggunakan “IBM SPSS Statistics” perisian (versi 21) dan AMOS (versi 21)
sementara “Microsoft Office Excel” digunakan untuk menyedia dan menjadualkan data.
Univers
ity of
Mala
ya
vi
Keputusan analisis data menunjukkan tidak ada perbezaan yang ketara antara pelajar
tempatan dengan pelajar antarabangsa dalam bentuk sifat personaliti dan kesihatan
mental. Tetapi, terdapat perbezaan ketara di antara lelaki dan perempuan dalam sifat
personaliti dan kesihatan mental. Tambahan pula, keputusan korelasi mendapati
beberapa faktor sifat personaliti adalah korelasi ketara dengan keadaan kesihatan
mental. Akhir sekali yang amat penting, analisis regrasi menunjukkan keadaan
kesihatan mental pelajar boleh diramal menggunakan sifat personaliti. Menurut kepada
keputusan analisis statistik, satu soal selidik sifat personaliti diberi nama “University of
Malaya Personality Traits Questionnaire (UM-PTQ)” telah dikembangkan
menggunakan pendekatan analisis faktor. Kebolehpercayaan alat baru telah disemak
menggunakan “Cronbach‟s Alpha”, hasil menunjukkan alat dibangunkan adalah boleh
dipercayai untuk digunakan di Universiti Malaya dan juga personaliti dan penilaian
kesihatan mental pada masa hadapan.
Univers
ity of
Mala
ya

vii
ACKNOWLEDGEMENTS
First and foremost, I would like to express my gratitude and thanks to ALLAH and
those who have offered me a hand when carrying out my research. In particular, my
sincere appreciation goes to my supervisor, Associate Prof. Dr. Stephen
Jambunathan for his guidance, encouragement, and support throughout the duration
of this work.
I am grateful to all my parents, especially my father Mr. Ismael Kananifar for giving
me full support, aspiration, and understanding during the period of my study. Also, I
would like to thank my beloved husband Dr. Salah Al-Obaidi, who has been a great
source of motivation and inspiration during the challenges of my PhD journey. I give
you my deepest expression of ultimate love and appreciation.
Eventually, I would like to thank all my beloved family, I am really grateful to all of
you; you have been my inspiration and my soul mates. Thanks for your great support
and continuous prayer.
Univers
ity of
Mala
ya

viii
TABLE OF CONTENTS
Abstract ............................................................................................................................ iii
Abstrak .............................................................................................................................. v
Acknowledgements ......................................................................................................... vii
Table of Contents ........................................................................................................... viii
List of Figures ................................................................................................................ xiv
List of Tables................................................................................................................. xvii
List of Symbols and Abbreviations ................................................................................ xxi
List of Appendices ........................................................................................................ xxii
CHAPTER 1: INTRODUCTION .................................................................................. 1
1.1 Overview and Research Motivation ........................................................................ 1
1.2 Problem Statement ................................................................................................... 4
1.3 Research Scope ........................................................................................................ 6
1.4 Research Objective .................................................................................................. 7
1.5 The Research Hypothesis ........................................................................................ 7
1.6 Significance of The Study ....................................................................................... 8
1.7 Definition of Terms ................................................................................................. 9
1.7.1 Personality ................................................................................................ 10
1.7.2 Five Factor Personality Traits................................................................... 10
1.7.3 Imposter Personality Trait ........................................................................ 12
1.7.4 Machiavellianism Personality Traits ........................................................ 13
1.7.5 Mental health ............................................................................................ 14
1.8 Thesis Structure ..................................................................................................... 14
Univers
ity of
Mala
ya
ix
CHAPTER 2: LITRUTURE REVIEW ...................................................................... 16
2.1 Introduction............................................................................................................ 16
2.2 University Students Mental Health ........................................................................ 16
2.3 Factors Effect on Mental Health ............................................................................ 18
2.3.1 Internalizing Problems .............................................................................. 19
2.3.2 Externalizing Problems ............................................................................ 20
2.4 Personality Theories and Approaches ................................................................... 21
2.4.1 The Biological Approaches ...................................................................... 22
2.4.2 The Psychoanalysis Approach .................................................................. 23
2.4.3 Adoption Theory ...................................................................................... 23
2.4.4 Need Theory ............................................................................................. 24
2.4.5 Arousal Theory ......................................................................................... 24
2.4.6 Type and Trait Theory .............................................................................. 25
2.5 Big Five Traits Theories ........................................................................................ 27
2.5.1 Introduction to the Five-Factor Model ..................................................... 29
2.5.2 Defining the Five Factor ........................................................................... 29
2.5.3 The Reasons for Using Big Five Factor ................................................... 34
2.5.4 The Big Five Model and Gender .............................................................. 37
2.5.5 Personality Traits and Nationality/ Cultures ............................................ 39
2.5.6 Personality and Mental Health ................................................................. 40
2.6 The Concept of Imposter Personality Traits .......................................................... 59
2.6.1 The Imposter Components ....................................................................... 60
2.6.2 Description of the Imposter Personality Traits ......................................... 62
2.6.3 Imposter Personality Traits and Gender ................................................... 64
2.6.4 Imposter Personality Trait and Nationality/ Cultures ............................... 66
2.6.5 Imposter Personality and FFM ................................................................. 67
Univers
ity of
Mala
ya
x
2.6.6 Imposter Personality Traits and Mental Health ........................................ 68
2.7 Machiavellian Personality Traits ........................................................................... 71
2.7.1 History and Characteristics of Machiavellian .......................................... 72
2.7.2 Machiavellian Personality Traits and Gender .......................................... 76
2.7.3 Machiavellian Personality Traits and Big Five ........................................ 77
2.7.4 Machiavellian Personality Traits and Mental Health ............................... 78
2.8 Structural Equation Modelling (SEM) ................................................................... 80
2.8.1 Measurement Model of the NEO-FFI ...................................................... 82
2.8.2 Measurement Model of the Imposter Phenomenon.................................. 83
2.8.3 Measurement Model of the Mach IV ....................................................... 84
2.8.4 Measurement Model of the GHQ-28 ........................................................ 86
2.9 Chapter Summary .................................................................................................. 87
CHAPTER 3: METHODOLOGY ............................................................................... 89
3.1 Introduction............................................................................................................ 89
3.2 Research Design .................................................................................................... 89
3.2.1 Research Location and Population ........................................................... 93
3.2.2 Determination of Sample Size .................................................................. 94
3.2.3 Research Tools ......................................................................................... 97
3.2.3.1 Part A: Socio-demographic information ................................... 98
3.2.3.2 Part B: Personality traits ............................................................ 98
3.2.3.3 Part C: Imposter traits................................................................ 99
3.2.3.4 Part D: Machiavellian traits .................................................... 100
3.2.3.5 Part E: Mental health ............................................................... 101
3.2.3.6 Validity of research instruments .............................................. 102
3.3 Pilot Study and Reliability Test ........................................................................... 103
3.4 Data Collection Procedure ................................................................................... 104
Univers
ity of
Mala
ya
xi
3.5 Data Preparation .................................................................................................. 105
3.5.1 Normality test ......................................................................................... 105
3.5.2 Outliers ................................................................................................... 107
3.6 Construct Validity ................................................................................................ 108
3.6.1 Convergent validity ................................................................................ 111
3.6.2 Discriminant validity .............................................................................. 112
3.7 Constructs Validity of Research Instruments ...................................................... 112
3.7.1 Construct validity of NEO-FFI ............................................................... 114
3.7.2 Construct validity of Clance Imposter Phenomenon (CIPS) .................. 116
3.7.3 Construct validity of Mach IV ................................................................ 118
3.7.4 Construct validity of GHQ 28 ................................................................ 120
3.8 Data Analysis ....................................................................................................... 122
3.8.1 Comparison ............................................................................................ 122
3.8.2 Correlation .............................................................................................. 123
3.8.3 Regression .............................................................................................. 124
3.9 Development of New Tool (UM-PTQ) ............................................................... 125
3.9.1 Items Loading Factors ............................................................................ 125
3.9.2 Pilot Study and Reliability Test .............................................................. 127
3.9.3 Exploratory Factor Analysis ................................................................... 127
3.10 Chapter Summary ................................................................................................ 128
CHAPTER 4: RESULTS ............................................................................................ 129
4.1 Introduction.......................................................................................................... 129
4.2 Demographic Characteristics of The Participants ............................................... 129
4.3 Descriptive Results .............................................................................................. 131
4.3.1 Descriptive statistic for Traits of personality NEO-FFI ......................... 131
4.3.1.1 Neuroticism ............................................................................. 132
Univers
ity of
Mala
ya

xii
4.3.1.2 Extroversion ............................................................................. 133
4.3.1.3 Openness .................................................................................. 134
4.3.1.4 Agreeableness .......................................................................... 136
4.3.1.5 Conscientiousness .................................................................... 138
4.3.2 Descriptive Statistics for Traits of Personality Imposter ........................ 139
4.3.2.1 Fake ......................................................................................... 140
4.3.2.2 Luck… ..................................................................................... 142
4.3.2.3 Discount .................................................................................. 143
4.3.3 Descriptive statistics for Traits of personality Machiavellian: ............... 144
4.3.3.1 Positive view of human nature ................................................ 144
4.3.3.2 Negative interpersonal tactics .................................................. 145
4.3.3.3 Positive interpersonal tactics ................................................... 146
4.3.3.4 Cynical view of human nature ................................................. 147
4.3.4 Descriptive statistics General Health Questionnaire .............................. 148
4.3.4.1 Somatization: ........................................................................... 149
4.3.4.2 Depression ............................................................................... 150
4.3.4.3 Anxiety .................................................................................... 151
4.3.4.4 Social Dysfunction .................................................................. 152
4.4 Inferential Statistics ............................................................................................. 153
4.4.1 Comparisons of Personality Traits and Mental Health ........................... 153
4.4.1.1 Big five personality ................................................................. 153
4.4.1.2 Imposter phenomenon ............................................................. 158
4.4.1.3 Machiavellian .......................................................................... 162
4.4.1.4 Mental health ........................................................................... 167
4.4.2 The Relationship between Personality Traits and Mental Health .......... 172
4.4.2.1 The Relationship between big five personality and imposter . 173
Univers
ity of
Mala
ya
xiii
4.4.2.2 The relationship between big five personality and
Machiavellian………………………………………………...174
4.4.2.3 The relationship between mental health and Machiavellian ... 176
4.4.2.4 The relationship between mental health and imposter ............ 178
4.4.2.5 The relationship between mental health and big five .............. 179
4.5 Prediction of Mental Health by Personality ......................................................... 181
4.6 Developing a Summarized Questionnaire for Personality Traits ........................ 185
4.6.1 Reliability of the instruments ................................................................. 190
4.6.2 Exploratory Factor Analysis ................................................................... 191
CHAPTER 5: DISCUSSION AND CONCLUSION ................................................ 194
5.1 Introduction.......................................................................................................... 194
5.2 Comparisons of Personality Traits and Mental Health ........................................ 195
5.2.1 Big Five Personality ............................................................................... 195
5.2.2 Imposter Phenomenon ............................................................................ 198
5.2.3 Machiavellian ......................................................................................... 200
5.2.4 Mental Health ......................................................................................... 201
5.3 The Relationship between Personality Traits and Mental Health ........................ 203
5.3.1 The Relationship between Big Five Personality and Imposter .............. 203
5.3.2 The Relationship between Big Five Personality and Machiavellian ...... 205
5.3.3 The Relationship between Mental Health and Machiavellian ................ 206
5.3.4 The Relationship between Mental Health and Imposter ........................ 209
5.3.5 The Relationship between Mental Health and Big Five ......................... 211
5.4 Prediction of Mental Health by Personality ......................................................... 213
5.5 Limitation and Recommendation for Future Research ........................................ 214
References ..................................................................................................................... 217
Appendix ....................................................................................................................... 235
Univers
ity of
Mala
ya
xiv
LIST OF FIGURES
Figure 1.1: Some of the Students‟ Challenges at University ............................................ 1
Figure 1.2: An Increment in Mental Health Problems among University Students as
Reported by ACCA (Gallagher, 2014) .............................................................................. 2
Figure 2.1: The Main Personality Approaches................................................................ 22
Figure 3.1: Research Methodology Flow Chart .............................................................. 90
Figure 3.2: Research Developed Tool Flow Chart .......................................................... 91
Figure 3.3: The University of Malaya Student Based on the Enrolment of 2013 ........... 94
Figure 3.4: Measurement Model for NEO-FFI ............................................................. 115
Figure 3.5: Measurement Model for Clance Imposter Phenomenon ............................ 117
Figure 3.6: Measurement Model for Mach IV .............................................................. 119
Figure 3.7: Measurement Model for GHQ 28 ............................................................... 121
Figure 4.1: Estimated Marginal Means of Neuroticism ................................................ 156
Figure 4.2: Estimated Marginal Means of Extroversion ............................................... 157
Figure 4.3: Estimated Marginal Means of Openness .................................................... 157
Figure 4.4: Estimated Marginal Means of Agreeableness ............................................ 157
Figure 4.5: Estimated Marginal Means of Conscientiousness ...................................... 158
Figure 4.6: Estimated Marginal Means of Luck ........................................................... 161
Figure 4.7: Estimated Marginal Means of Discount ..................................................... 161
Figure 4.8: Estimated Marginal Means of Fake ............................................................ 161
Figure 4.9: Estimated Marginal Means of Total Imposter ............................................ 162
Figure 4.10: Estimated Marginal Means of Positive View of Human Nature .............. 165
Figure 4.11: Estimated Marginal Means of Cynical View of Human Nature............... 166
Figure 4.12: Estimated Marginal Means of Positive Interpersonal Tactic .................... 166
Figure 4.13: Estimated Marginal Means of Negative Interpersonal Tactic .................. 166
Figure 4.14: Estimated Marginal Means of Total Machiavellian .................................. 167
Univers
ity of
Mala
ya
xv
Figure 4.15: Estimated Marginal Means of Somatization ............................................ 170
Figure 4.16: Estimated Marginal Means of Depression................................................ 171
Figure 4.17: Estimated Marginal Means of Anxiety ..................................................... 171
Figure 4.18: Estimated Marginal Means of Social Dysfunction ................................... 171
Figure 4.19: Estimated Marginal Means of Total GHQ ............................................... 172
Univers
ity of
Mala
ya
xvii
LIST OF TABLES
Table 1.1: The Big Five Personality Factors ................................................................... 11
Table 2.1: Big Five Factor Personality Facets ................................................................ 33
Table 3.1: Determination of Sample size Based on G-Power ......................................... 95
Table 3.2: Number of respondents in each group ........................................................... 97
Table 3.3: Section division for the Questionnaire ........................................................... 97
Table 3.4: Subscale Items Numbers for NEO-FFI .......................................................... 99
Table 3.5: Subscale Items Numbers for CIPS ............................................................... 100
Table 3.6: Subscale Items Numbers for MACH-IV ...................................................... 101
Table 3.7: Subscale Items Numbers for GHQ-28 ......................................................... 102
Table 3.8: Cronbach‟s Alpha Value of the Instruments ................................................ 103
Table 3.9: Normality Test for all Research Variables Imputed Mean Score ................ 106
Table 3.10: Fit Measurement Indication ....................................................................... 111
Table 3.11: Convergent Validity of NEO ..................................................................... 114
Table 3.12: Construct Correlation Matrix for discriminant validity of NEO ................ 115
Table 3.13: Convergent validity of CIPS ...................................................................... 116
Table 3.14: Construct correlation matrix for discriminant validity of CIPS ................. 117
Table 3.15: Convergent validity of Mach IV ................................................................ 118
Table 3.16: Construct correlation matrix for discriminant validity of Mach IV ........... 119
Table 3.17: Convergent Validity of GHQ ..................................................................... 120
Table 3.18: Construct correlation matrix for Discriminant validity of GHQ ................ 121
Table 3.19: Criteria for interpreting strength of relationship between two variables ... 123
Table 3.20: Loading Factor Range for Selected Items .................................................. 126
Table 4.1: Distribution of demographic variables among Malaysian and International
Students n (%) ............................................................................................................... 130
Table 4.2: Distribution of International students based on Continent ........................... 131
Univers
ity of
Mala
ya
xviii
Table 4.3: Descriptive Statistic for Items of Neuroticism............................................. 133
Table 4.4: Descriptive statistic for items of extroversion ............................................. 134
Table 4.5: Descriptive statistic for items of Openness .................................................. 135
Table 4.6: Descriptive statistic for items of Agreeableness .......................................... 137
Table 4.7: Descriptive statistic for items of Conscientiousness .................................... 139
Table 4.8: Descriptive statistic for items of Fake ......................................................... 141
Table 4.9: Descriptive statistic for items of Luck ......................................................... 142
Table 4.10: Descriptive Statistic for Items of Discount ................................................ 143
Table 4.11: Descriptive statistic for items of Positive View Human Nature ................ 145
Table 4.12: Descriptive statistics for items of Negative interpersonal tactics .............. 146
Table 4.13: Descriptive statistics for items of Positive Interpersonal Tactics .............. 147
Table 4.14: Descriptive statistics for items of Cynical View Human Nature ............... 148
Table 4.15: Descriptive statistics for items of Somatization ......................................... 149
Table 4.16: Descriptive statistics for items of Depression ............................................ 150
Table 4.17: Descriptive statistics for items of Anxiety ................................................. 151
Table 4.18: Descriptive statistics for items of Social Dysfunction ............................... 152
Table 4.19: Summary of results of Two Way Anova for Big 5 subscales .................... 154
Table 4.20: Pairwise comparison between Malaysian and International for both male
and female NEO subscales ........................................................................................... 155
Table 4.21: Pairwise comparison between male and female for both Malaysian and
International students NEO .......................................................................................... 156
Table 4.22: Summary of Results of Two Way Anova for Imposter Subscales ............ 159
Table 4.23: Pairwise Comparison between Malaysian and International for both Male
and Female ................................................................................................................... 160
Table 4.24: Pairwise Comparison between Male and Female for both Malaysian and
International Students ....................................................................................................... 160
Univers
ity of
Mala
ya
xix
Table 4.25: Summary of Results of Two Way Anova for Machiavellian Subscales .... 163
Table 4.26: Pairwise Comparison between Malaysian and International for both Male
and Female ................................................................................................................... 164
Table 4.27: Pairwise Comparison between Male and Female for both Malaysian and
International Students ....................................................................................................... 165
Table 4.28: Summary of Results of Two Way Anova for GHQ Subscales .................. 168
Table 4.29: Pairwise Comparison between Malaysian and International for both Male
and Female ................................................................................................................... 169
Table 4.30: Pairwise Comparison between Male and Female for both Malaysian and
International Students ....................................................................................................... 170
Table 4.31: Criteria for interpreting strength of relationship between two variables ... .173
Table 4.32: Correlation between Big Five and Imposter among International Students
........................................................................................................................................173
Table 4.33: Correlation between Big Five and Imposter among Malaysian Students.. 174
Table 4.34: Correlation between Big Five and Machiavellian among International
Students ................................................................................................................ …….175
Table 4.35: Correlation between Big Five and Machiavellian among Malaysian Students
........................................................................................................................................176
Table 4.36: Correlation between Mental Health and Machiavellian among International
Students ........................................................................................................................ 177
Table 4.37: Correlation between Mental Health and Machiavellian among Malaysian
Students ........................................................................................................................ 177
Table 4.38: Correlation between Mental Health and Imposter among International
Students ........................................................................................................................ 178
Table 4.39: Correlation between Mental Health and Imposter among Malaysian
Students ........................................................................................................................ 179
Univers
ity of
Mala
ya
xx
Table 4.40: Correlation between Mental Health and Big Five among International
Students ........................................................................................................................ .180
Table 4.41: Correlation between Mental Health and Big Five among Malaysian Students
........................................................................................................................................181
Table 4.42: Multiple Regression Model Summary among International and Malaysian
Students ........................................................................................................................ 182
Table 4.43: ANOVA for Multiple Regressions Model among International and
Malaysian Students .......................................................................................................... 183
Table 4.44: Regression Coefficients of independent variables on Mental Health among
International Students ....................................................................................................... 184
Table 4.45: Regression Coefficients of independent variables on Mental Health among
Malaysian Students ...................................................................................................... 185
Table 4.46: Content Validation of Neuroticism Domain .............................................. 186
Table 4.47: Content Validation of Extroversion Domain ............................................. 187
Table 4.48: Content Validation of Openness Domain .................................................. 187
Table 4.49: Content Validation of Agreeableness Domain .......................................... 188
Table 4.50: Content Validation of Conscientiousness Domain .................................... 188
Table 4.51: Content Validation of Imposter Domain.................................................... 189
Table 4.52: Content Validation of Machiavellian Domain ........................................... 189
Table 4.53: Results of Reliability analysis for all sub-dimension of UM-PTQ ........... .191
Table 4.54: Factor Loadings and Dimensionality Analysis of New Questionnaire Using
Principal Component Method and Using Varimax Rotation ...................................... .193
Univers
ity of
Mala
ya

xxi
LIST OF SYMBOLS AND ABBREVIATIONS
IP : Imposter Phenomenon
Mach : Machiavellian
Univers
ity of
Mala
ya
xxii
LIST OF APPENDICES
Appendix A: Normality Test P-P Plot…………………………………................. 235
Appendix B: Univariate Outlier Test…………………………………................... 239
Appendix C: Individual Models………………………………….......................... 247
Appendix D: Regression Model Between Mental Health And Personality Types 251
Appendix E: NEO-FFI…………………………………........................................ 252
Appendix F: CIPS…………………………………............................................... 254
Appendix G: MACH IV…………………………………...................................... 255
Appendix H: GHQ28…………………………………........................................... 256
Appendix I: G-Power Sampling Size Calculation……………............................... 259
Appendix J: Results Of Confirmatory Factor Analysis……………....................... 262
Appendix K: Exploratory Factor Analysis (EFA) Of UM-PTQ Instrument……… 266
Appendix L: Medical Ethics Committee Approval…………….............................. 270
Appendix M: Informed Consent Form……………………………………………... 271
Appendix N: Shortened Personality Questionnaire UM-PTQ……………………... 272
Univers
ity of
Mala
ya

xxii
Univers
ity of
Mala
ya

1
INTRODUCTION CHAPTER 1:
Overview and Research Motivation 1.1
In modern societies, students’ mental health becomes a concern for educational
authorities due to the importance of mental health as a basic element to have healthy
and productive societies. Mental health is a level of psychological well-being or an
absence of a mental disorder which has a complex interactive relationship with students’
performance. For most youth, the university is a time to become independent, gain
valuable skills and build lifelong relationships. In addition, university is their first
challenge due to the sudden increase of responsibilities in term of money, making
friends, social pressures, experiencing the adjustments of family separation and stress of
grades that can be overwhelming, leading to depression, anxiety and substance abuse
issues which can affect negatively into student’s academic learning and various
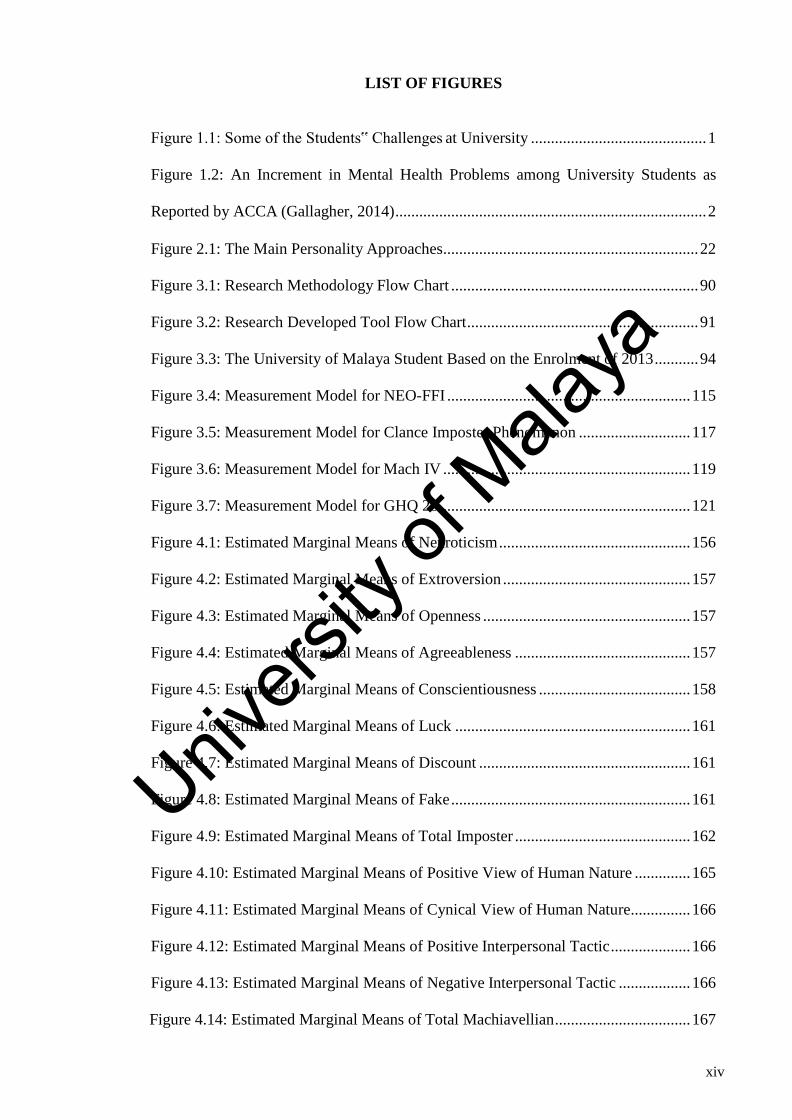
activities. Figure 1.1 shows some of the students’ challenges at the university.
Figure 1.1: Some of the Students’ Challenges at University
Student’s Life
Exam
Self Esteem
Relationships
Tutution Fees
Midterms
Grades Students Loan
Assignments
Depression
Peer Pressur
e
Homesick
Univers
ity of
Mala
ya
2
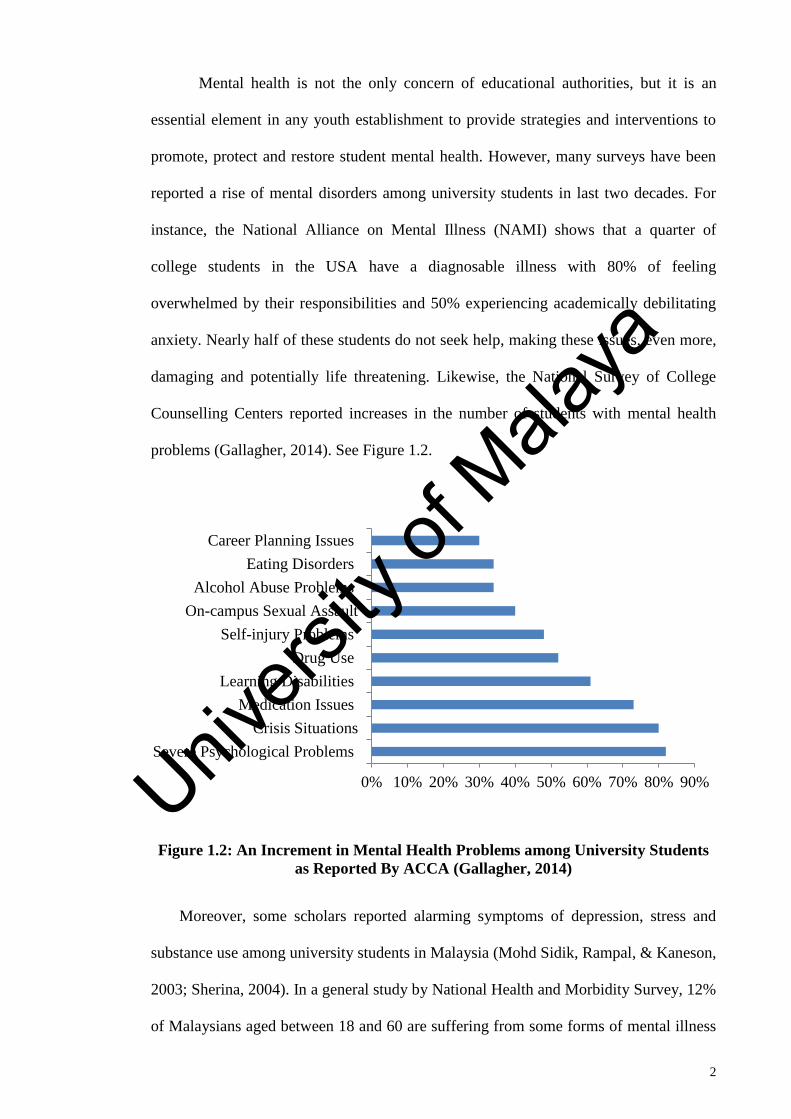
Mental health is not the only concern of educational authorities, but it is an
essential element in any youth establishment to provide strategies and interventions to
promote, protect and restore student mental health. However, many surveys have been
reported a rise of mental disorders among university students in last two decades. For
instance, the National Alliance on Mental Illness (NAMI) shows that a quarter of
college students in the USA have a diagnosable illness with 80% of feeling
overwhelmed by their responsibilities and 50% experiencing academically debilitating
anxiety. Nearly half of these students do not seek help, making these issues, even more,
damaging and potentially life threatening. Likewise, the National Survey of College
Counselling Centers reported increases in the number of students with mental health
problems (Gallagher, 2014). See Figure 1.2.
Figure 1.2: An Increment in Mental Health Problems among University Students
as Reported By ACCA (Gallagher, 2014)
Moreover, some scholars reported alarming symptoms of depression, stress and
substance use among university students in Malaysia (Mohd Sidik, Rampal, & Kaneson,
2003; Sherina, 2004). In a general study by National Health and Morbidity Survey, 12%
of Malaysians aged between 18 and 60 are suffering from some forms of mental illness
0% 10% 20% 30% 40% 50% 60% 70% 80% 90%
Severe Psychological Problems
Crisis Situations
Medication Issues
Learning Disabilities
Drug Use
Self-injury Problems
On-campus Sexual Assault
Alcohol Abuse Problems
Eating Disorders
Career Planning Issues
Univers
ity of
Mala
ya

3
(IPH, 2008). Therefore, mental health integrity has been investigated by some other
scholars.
For example, Nordin et al. (2009) investigated the prevalence of mental health
issues in Malaysia universities based on multistage cluster sampling. The results of this
study revealed that a total of 34.4% of Malaysian students showed indications of mental
problems whilst it was increased to 41.9% in the year of 2011 (Al-Dubai, Al-Naggar,
Alshagga, & Rampal). Shamsuddin (2013) stated that students aged between 20 and 24
are most affected by depression. Similarly, a study conducted by Sherina et al, (2004)
also found out that 41.9 % of students in a public institution in Malaysia were faced
with depression problem. Several researchers tried to specify the cause of these mental
problems. Zaid et al. (2007) related 39% of mental disorder to examinations and
relationships. While Yusoff et al. (2010) stated that academic related problems were the
major stressor among students.
Therefore, university students are one of the most sensitive strata of society, many
of whom will become the future’s managers and planners, and the mental health of the
society is depending upon their mental health. In addition, students make an essential
component of the higher education system, coming from various demographic and
cultural backgrounds, each of them displaying unique personality traits. These features
can be considered as important confounding variables in academic behaviour and better
performance.
Univers
ity of
Mala
ya

4
Problem Statement 1.2
The prevalence of mental disorder has been found in continuous increasing
among university students during the last decades. Due to this fact, student mental
health has been considered an important area of research and educational authorities
concerns. In the early stages of student mental health assessment, statistical information
was usually based on students who approach the counselling centers.
In last two decade, many efforts using interview, semi-structured interview,
surveys, and questionnaires have been proposed in the literature to precisely evaluate
student mental health based on some technique such as general health questioners
(GHQ), diagnostic and statistical manual of mental disorders (DSM) and Minnesota
multiphasic personality inventory (MMPI). Although most of these methods were
shown to be effective in varying degree for student mental health evaluation, a major
difficulty relates to its use under particular conditions. In addition, there is still no
consensus on reliable methods for student mental health assessment, or criteria to define
successful needs assessment efforts.
For an instant, many surveys have an insufficient focus on diverse groups of
college students to ensure the understanding of similarities and differences both among
and between identity groups. Further, some surveys have incomplete investigation due
to the lake of students’ participation. On the other hand, statistical information based on
university counseling centers cannot be generalized to evaluate the mental health of
entire population because usually their data has been collected from students who seek
mental health treatment. Thus, mental health of students who didn’t approach clinics or
counseling centers has been left outside the population. Therefore, more efforts for
Univers
ity of
Mala
ya

5
comprehensive data collection are needed among university student in order to have a
better sight on students’ mental health. Mental health evaluation based on the
conventional personality traits analysis considered more efficient because personality is
one of the most important psychological factors that associated with mental health
(Malouff, Thorsteinsson, & Schutte, 2005; R. R. McCrae & Costa, 1991). However,
several scholars only investigated the feasibility of personality traits analysis for mental
health evaluation.
For example, neuroticism and introversion have been found correlated with
mental health issues such as depression and suicidal ideation (S. M. Lamers, G. J.
Westerhof, V. Kovács, & E. T. Bohlmeijer, 2012; Mandelli et al., 2015). In another
study, associations of Big Five personality theory with mental health issues like anxiety,
depression, and addiction has been proven to be strongly correlated (Kotov, Gamez,
Schmidt, & Watson, 2010; Mandelli et al., 2015). In addiction studies, personality
dimensions and mental health were positively correlated (Habibi, Sadeghi,
Haghrangbar, Madanipour, & Azarnoosh, 2013b).
Furthermore, impostor characteristic has been diagnosed with anxiety,
depression, self-acceptance, low self-confidence, and irritation (Loretta Neal McGregor,
Damon E Gee, & K Elizabeth Posey, 2008; September, McCarrey, Baranowsky, Parent,
& Schindler, 2001). Some other researchers reported the correlation of Machiavellian
personality with mental health issues such as depression (Bakir, Yilmaz, & Yavas,
1996) , lack of self-esteem (Valentine & Fleischman, 2003) , alexithymia (Wastell &
Booth, 2003) , paranoia (Christoffersen & Stamp, 1995) , and perfectionism (Sherry,
Hewitt, Besser, Flett, & Klein, 2006).
Univers
ity of
Mala
ya

6
Understandably, the correlations of personality traits with mental disorder issues
vary from aspect to other. In other words, some aspects of personality traits are highly
correlated to mental health and some other aspects could be related to genetic,
environment or culture. However, few studies only tried to investigate the strength of
these aspects to student mental health. Further, several personality traits tools have been
found to be used in students mental health assessment. Nevertheless, no method has
been developed from these personality traits tools to be specifically used as an indicator
of student mental health. Research on student mental health using personality traits is
needed to be more investigated indeed. To overcome this limitation, this work will
investigate the feasibility of combining Big Five personality traits, Imposter personality
and Machiavellian together with general health questioners (GHQ) as a new tool to be
used for mental health assessment among university students. It is believed that
developing a method by combining these elements will provide a clearer insight into
student mental health. By using this method, student mental health can be scan
sufficiently and effectively at a different time during their study. The new method will
provide an easier scan for student mental health instead if the existing random methods.
Research Scope 1.3
The research will be conducted among university students including graduate
and post graduates students. The University of Malaya has been selected to be the
domain of data collection sampling population. Data analysis will be based on self-
report questionnaires. SPSS and AMOS will be the main software to the analysis while
Microsoft Office Excel will be used to prepare and tabulate the data. Expert views and
opinion on the development of the short version personality inventory will be obtained
for consideration.
Univers
ity of
Mala
ya

7
Research Objectives 1.4
The main purpose of this research is to assess mental health based on personality
traits among Malaysian and international students. Furthermore, a shortened personality
inventory based on Malaysian and international student personality traits is developed.
To achieve this target, several objectives have been highlighted for this research which
includes:
1. To compare the personality traits (Big Five, imposter, and Machiavellian) and
mental health among Malaysian and International students by gender.
2. To investigate the relationships between personality traits and mental health
among Malaysian and International students.
3. To predict the mental health based on personality traits among Malaysian and
International students.
4. To develop a shortened personality inventory based on a finding of the
research.
The Research Hypothesis 1.5
The research hypothesis (H1) indicate that there are significant differences for
personality traits (Big Five, imposter, and Machiavellian) and mental health among
international and Malaysian students by gender. On the contrary, the investigation null
hypothesis (H01) assumed that there are no differences for personality traits (Big Five,
imposter, and Machiavellian) and mental health among international and Malaysian
students by gender. Furthermore, research hypothesis (H2) indicates that there is a
Univers
ity of
Mala
ya
8
significant relationship between personality trait in both Malaysian and international
students. Opposing, the investigation null hypothesis (H02) state that there is no
relationship between personality traits and mental health among Malaysian and
international. Moreover, the research hypothesis (H3) assumed that the students’ mental
health is significantly affected by personality traits patterns. In other words, it is
possible to evaluate the mental health among students by using students’ personality
traits (Big Five, imposter, and Machiavellian). While the investigation null hypothesis
(H03) assumed that the students’ mental health are not affected by personality traits and
that what we are trying to investigate through this research.
Significance of the Study 1.6
The investigation in this study will concentrate on the application of mental
health evaluation of university students based on Big Five, imposter, and Machiavellian
measurement. However, the research aims to develop a tool based on personality trait
patterns that can diagnose student’ mental health by using statistical analysis. Therefore,
it believes that the result of this work will be important for student’ mental health
evaluation. Since each individual has their own culture, lifestyle and attitudes this study
may declare the role of culture, environment, and genetics on personality by
investigating the personality traits pattern in distinct groups of International and
Malaysian. Therefore, the current study gives us a great opportunity to a better
understanding of personality traits differences between both groups of International and
Malaysian students.
The comprehensive personality traits pattern may provide an opportunity to get
better insight on how to support and care for college students in various aspects of
Univers
ity of
Mala
ya

9
mental health integrity and academic performance by designing a coherent and
purposeful counselling programs, include life skill courses such as stress management,
self-esteem, assertiveness, problem solving, and decision making as a subject in
between university courses. Additionally, university licensed mental health
professionals can benefit from greater insight into the integrated personality traits to
identify student strengths and weaknesses and can provide feedback on how the student
is improving. Moreover, comprehensive personality traits measurement may give
licensed mental health professionals an additional tool to assist the student through the
college experience.
This study also benefits student affairs practitioners in their work with college
students by providing information and make efforts to support students struggling with
mental health issues in residential and classroom settings. Moreover, student affairs
professionals can serve and direct students to licensed mental health professionals when
they observe students with specific personality traits that may threat mental health
integrity among students.
Definition of Terms 1.7
Every important term used in this study is defined conceptually and
operationally. This is because clearly defined key terms or variables guide the
researcher in data collection, data analysis, as well as generalizability of the research
results.
Univers
ity of
Mala
ya
10
1.7.1 Personality
The literature provides several definitions of the term, personality. A definition
of personality according to (J. Burger, 2015) is: “Personality can be defined as
consistent behavior patterns and intrapersonal processes originating within the
individual.” D. C. Funder (2004) defines personality as: “an individual’s characteristic
patterns of thought, emotion, and behavior together with the psychological mechanisms
(hidden or not) behind those patterns”.
1.7.2 Five Factor Personality Traits
Personality traits are defined as the relatively enduring patterns of thoughts,
feelings, and behaviors that distinguish individuals from one another. Further, there are
several terms in psychological literature that are used to define the aspects of a character
through its behavior. Examples of these terms apart from personality, are temperament,
attitude, mood, emotion etc. Eysenck in (1990) presents Warren’s (1934) definition of
temperament as: "the general affective nature of an individual as determined by his
inheritance and life history". The definition of temperament that is accepted by Eysneck
(1990) is: “Temperament refers to the characteristic phenomenon of an individual’s
emotional nature, including his susceptibility to emotional stimulation, his customary
strength and speed of response, the quality of the prevailing mood, and the peculiarities
of fluctuations and intensity in mood.” A significant differentiation has been made in
the literature between personality and temperament. Strelau (1983) sees “temperament”
as an inborn characteristic and “personality” as a product of the interaction between
temperamental traits and environmental demands and opportunities. In fact,
temperament has been said to have higher priority over personality within a system and
Univers
ity of
Mala
ya

11
to be historically and functionally higher within the hierarchical structure. Temperament
theorists focus on the aspects of personality obtained from nature, at birth, rather than
those learned after birth.
Personality trait theory, as organized by McCrae and Costa (1997), is a
framework of five universal domains that in concert form personality. Often referred to
as the Big Five factors (BFF) which are: neuroticism, extraversion, conscientiousness,
agreeableness, and openness to experience. Table 1.1 illustrates the big five personality
traits.
Table 1.1: The Big Five Personality Factors
Big Five
Personality Factors Description
Extroversion
The definition of this personality dimension is based on
Golberg’s (1993) lexical approach to the Big-Five
factors. The Extraversion dimensions “contrasts such
traits as talkativeness, assertiveness, and activity level
with traits such as silence, passivity, and reserve”
(Goldberg, 1993, p. 27).
Emotional Stability
(Neuroticism)
The definition of this personality dimension is based on
Golberg’s (1993) lexical approach to the Big-Five
factors. The Emotional Stability dimension “includes
such traits as nervousness, moodiness, and
temperamentality” (Goldberg, 1993, p. 27).
Agreeableness
The definition of this personality dimension is based on
Golberg’s (1993) lexical approach to the Big-Five
factors. The Agreeableness dimension “contrasts traits
such as kindness, trust, and warmth with traits such as
hostility, selfishness, and distrust” (Goldberg, 1993, p.
27).
Conscientiousness
The definition of this personality dimension is based on
Golberg’s (1993) lexical approach to the Big-Five
factors. The Conscientiousness dimensions “contrasts
such traits as organization, thoroughness, and reliability
with traits such as carelessness, negligence, and
unreliability” (Goldberg, 1993, p. 27).
Openness to Experience
Openness to Experience refers to the broad domain of
personality comprising active imagination, aesthetic
sensitivity, attentiveness to inner feelings (both positive
and negative), preference for variety, intellectual
curiosity, and independence of judgment (Costa &
McCrae, 1992).
Univers
ity of
Mala
ya
12
1.7.3 Imposter Personality Trait
Impostor syndrome (also spelled imposter syndrome, also known as impostor
phenomenon or fraud syndrome) is a term coined in the 1970s by psychologists and
researchers to informally describe people who are unable to internalize their
accomplishments. Despite external evidence of their competence, those exhibiting the
syndrome remain convinced that they are frauds and do not deserve the success they
have achieved. Proof of success is dismissed as luck, timing, or as a result of deceiving
others into thinking they are more intelligent and competent than they believe
themselves to be. Notably, impostor syndrome is particularly common among high-
achieving women, (Pauline R Clance & Imes, 1978a) although some studies indicate
that both genders may be affected in equal numbers (Laursen, 2008).
According to Clance and Imes (1978a), those that experienced IP often felt
emotions or thoughts of being discovered as incompetent. They would attribute their
success to hard work, luck, knowing the right people, being in the right place at the right
time, or through interpersonal assets such as charm and adaptability. Those with IP
tendencies have difficulty in accepting praise or recognition for accomplishments or
positive feedback; they will constantly dwell or focus on negative feedback as a reason
for their deficits, mistakes, or failures. While fixated on their flaws, those with IP are
afraid of shame and humiliation associated with failure and the feelings of foolishness.
And finally, those with IP tendencies will overestimate others’ intellect and competence
while comparing their weaknesses with the strengths of others.
Univers
ity of
Mala
ya
13
1.7.4 Machiavellianism Personality Traits
Machiavellian orientation is an individual's general strategy for dealing with
other people and the degree to which individuals feel they can manipulate others in
interpersonal situations. The word comes from the Italian Renaissance diplomat and
writer Niccolò Machiavelli, who wrote The Prince, among other works.In modern
psychology, Machiavellianism is one of the dark triad personalities, characterized by a
duplicitous interpersonal style, a cynical disregard for morality and a focus on self-
interest and personal gain (Christie & Geis, 2013).
Machiavellianism is also a term that some social and personality psychologists
use to describe a person's tendency to be unemotional, and, therefore, able to detach him
or herself from conventional morality and hence to deceive and manipulate others. In
the 1960s, Richard Christie and Florence L. Geis developed a test for measuring a
person's level of Machiavellianism (1999). Their Mach-IV test, a twenty-statement
personality survey, became the standard self-assessment tool of Machiavellianism.
People scoring high on the scale (high Machs) tend to endorse statements such as,
"Never tell anyone the real reason you did something unless it is useful to do so," (No.
1) but not ones like, "Most people are basically good and kind" (No. 4), "There is no
excuse for lying to someone else," (No. 7) or "Most people who get ahead in the world
lead clean, moral lives" (No. 11). Using their scale, Christie and Geis conducted
multiple experimental tests that showed that the interpersonal strategies and behavior of
"High Machs" and "Low Machs" differ (2013). Their basic results have been widely
replicated (McIlwain, 2003). Measured on the Mach - IV scale, males are, on average,
slightly more Machiavellian than females (Gunnthorsdottir, McCabe, & Smith, 2002).
Univers
ity of
Mala
ya
14
1.7.5 Mental health
According to WHO (2010), mental health refers to a broad array of activities
directly or indirectly related to the mental well-being component included in the WHO's
definition of health: "A state of complete physical, mental and social well-being, not
merely the absence of disease". Thus, we can say that mental health is related to the
promotion of well-being, the prevention of mental disorders, and the treatment and
rehabilitation of people affected by mental disorders.
According to Skalski and Smith (2006) mental health, like physical health,
mental health may be viewed as existing on a continuum from healthy living to chronic
illness. A person with positive mental health uses interpersonal assets and skills to
function successfully in his or her daily life. Mental health problems emerge when these
assets and skills begin to deteriorate, resulting in a struggle to cope with life’s
challenges and responsibilities. The continued deterioration of these skills signals the
onset of mental illness as significant distortions to thinking, coping, and responding
dominate personal functioning and impair a person’s ability to perform the activities of
daily life. All people fall somewhere on this continuum on any given day (Skalski &
Smith, 2006).
Thesis Structure 1.8
Chapter 1 introduces the background of the study, objectives, significance of
research, research hypothesis and keywords definitions. Chapter 2 reviews the state of
the art on the concepts of mental health and personality trait (Big Five, imposter, and
Machiavellian) as well as a brief review of Structural Equation Modelling (SEM). The
Univers
ity of
Mala
ya

15
research methodology includes the research design, sampling methods, research
location and population selection, research tools, data collection procedures, data
preparation and analysis methods have all been illustrated in chapter 3. The analysis of
the results including comparison, correlation, and regression has been reported in
chapter 4. In addition, the shortened personality questionnaire (UM-PTQ) has been
stated in the same chapter. Finally, chapter 5 includes the discussion and
recommendation of the thesis.
Univers
ity of
Mala
ya
16
LITRUTURE REVIEW CHAPTER 2:
Introduction 2.1
Mental health is a key to well-being that individuals cannot be truly healthy
without it. It involves how we feel, thinks, act, and interact with the world around us.
Mental health is about realizing our potential, coping with the normal stresses of life,
and contribution to the community. This chapter provides a review of mental health
importance, outcome of poor mental, factors affecting on mental health and methods to
assess mental health by focusing on university students. On the other hand, one from the
most important factors that can effect of student mental health is their personality.
Therefore, the personality traits such as imposter trait and Machiavellian personality
have been studied and reviewed in the state of the art. The next sections will go through
all the mentioned points in more details.
University Students Mental Health 2.2
As stated previously, mental health is a key to people emotional, psychological,
and social well-being. It effects on the way of thinking, feeling and behaving in their
life. It also determines stress handling, relationship with others, and makes choices.
Mental health is important at every stage of life, from childhood and adolescence
through adulthood. In contrary, mental illnesses are serious disorders which can affect
people thinking, mood, and behaviour.
Univers
ity of
Mala
ya
17
In particular, mental health problems are highly prevalent among college
students. According to National College Health Assessment sponsored by the American
College Health Association (ACHA-NCHA), more than one in three undergraduates
reported with mental health issues. There are many signs of a mental health condition
can be found among student. First of all, poor mental health will lead to low academic
achievements. According to the National Institute of Mental Health, 20% of students
may have undiagnosed mental health problems that cause difficulty with academic
work. For an instant, poor attendance; particularly frequent absences for unclear
physical health problems, may be related to underlying poor mental health. Further,
difficulties with academic work, social integration, adjustment to school, behaviour
regulation, attention, and concentration may be other signs of existing mental health
problems among students.
Moreover, the National Institute on Alcohol Abuse and Alcoholism (NIAAA)
reported that 80% of college students are alcoholic with 50% of those are indulge
drinkers. They also reported 1825 of students; ages of 18 to 24 were dying from
alcohol-related injuries every year. Consequently, other students are more likely to be
assaulted, sexually abused or injured by someone who has been drinking. In addition,
25% of students who drink regularly report academic problems (Gunzerath, Faden,
Zakhari, & Warren, 2014). According to the National Health and Morbidity Survey
2011 in Malaysia, 12.8% (2.3 million) of adults 18 years and above consumed alcoholic
beverages and 25% (4.4 million) of adults smoking tobacco product such as cigarettes,
cigars, pipes, shisha, etc. ("NHMS," 2011). Impulsive behaviours such as fighting,
drinking, and stealing are increasing among students as well. The frequency of violent
campus attacks was examined by the FBI, and was found to demonstrate a marked
Univers
ity of
Mala
ya

18
increase in the 1980s into the 1990s and has probably plateaued since then, although
conclusions are very difficult to draw.
Furthermore, suicide and self-injury are one of the most harmful consequences
of mental health issues in student‟s life. A groundbreaking 2006 study conducted by
researchers at Princeton and Cornell found that 17% of college students self-injure-cut,
carve, burn, or otherwise hurt themselves. More recent data indicate that 12 percent to
23 percent of adolescents have self-injured, and the behaviour, which declines sharply
with age, is more common among women as 60% of those who self-injure were female
(Whitlock, Eckenrode, & Silverman, 2006). Between 2007 and 2011, suicides by male
students in full-time higher education grew by 36%, while female student suicides
almost doubled, according to new figures released by the Office for National Statistics
(ONS, (2004). Nearly one in 10 reported seriously considering attempting suicide
(2007). According to a study of 26,000 students from 70 colleges and universities in
2009, 6% of undergraduates and 4% of postgraduate students reported having seriously
considered suicide in the previous 12 months (Drum, Brownson, Burton Denmark, &
Smith, 2009). According to ("NHMS," 2011) in Malaysia, 1.7% (0.3 million) reported
to have suicidal ideation and 1.1% (0.2 million) reported to have attempted suicide in
the past.
Factors Effect on Mental Health 2.3
Mental health is defined as the presence or absence of psychopathology. In
general, psychopathology is often conceptualized as referring to two broadband
syndrome clusters, specifically internalizing disorders (e.g., anxiety, depression) and
externalizing disorders (e.g., anger/ aggression, rule-breaking behaviour, hyperactivity;
Univers
ity of
Mala
ya

19
American Psychiatric Association, (2000). These two broad categories of social,
emotional, and behavioural problems are yielded using the behavioural dimensions
approach, which employs statistical analysis of symptoms to yield the two categories
(Whitcomb & Merrell, 2013).
There are several methods commonly utilized to assess and categorize mental
health (e.g., rating scales, interviews, checklists of symptom criteria). The most
common system in use is the Diagnostic and Statistical Manual of Mental Disorders,
Fifth Edition Text Revision (2013). This system provides a common language for
professionals to use during communication. By using this diagnostic approach, it has
been found that one over five-person in the United States has some type of mental
health difficulty (Brown, Riley, & Wissow, 2007). Further, the study by the World
Health Organization suggests that by the year 2020, neuropsychiatric disorders will
increase by over 50% and becoming one of five most common causes of disease, death,
and disability worldwide (Satcher, 2000).
2.3.1 Internalizing Problems
Internalizing problems are core disturbances in emotional problem behaviours
that are inner-directed and reflect internal distress that is not directly expressed in overt
action but indirectly through social withdrawal, anxiety, somatic complaints, or
depressed mood (Sabri, 2012). In addition, internalizing problems result from
behaviours that are over controlled and over inhibited problems (Durand & Barlow,
2012). Epidemiological studies have indicated that depression and anxiety are two of
the most common internalizing disorders (E Jane Costello, Helen Egger, & Adrian
Univers
ity of
Mala
ya

20
Angold, 2005). These disorders have many outcomes such as risk behaviours (i.e. self-
injury, suicide), drug and alcohol dependency, poor academic achievement, and
unsatisfactory relationships with others, compared to peers without psychiatric
diagnoses (Abela, 2008; Marel et al., 2015). In regards to social outcomes, students with
depression and anxiety report poor peer relationships, a high degree of emotional
reliance on others, unsatisfactory relationships with best friends and romantic interests,
low self-esteem, and deficits in social problem-solving skills (Siu & Shek, 2010).
2.3.2 Externalizing Problems
Externalizing behavioural problems are problem behaviours that entail acting
out or under controlled behaviour such as aggression, anti-social behaviours, and
opposition. Correspondingly, disorders characterized by symptoms that are external are
considered externalizing disorders (Seifert, 2011). In addition, externalizing disorders
are described as outer-directed or under controlled and are related to moving against the
world. Individuals with externalizing disorders are at odds with society (Fiske, Gilbert,
& Lindzey, 2010). Evidence suggests that antisocial or aggressive behaviour, a
symptom of externalizing disorders, in adolescence undermines student achievement.
Moreover, physical health outcomes, aggression is associated with unwed pregnancy for
males and females, in addition to substance use by males (Richards & O'Hara, 2014). In
summary, internalizing and externalizing problems are predictive of negative outcomes
in personality. Next section the personality traits will explain in more details.
Univers
ity of
Mala
ya
21
Personality Theories and Approaches 2.4
Personality refers to individual differences in characteristic patterns of thinking,
feeling and behaving. The literature provides several definitions of the term, personality.
A definition of personality according to Burger (2011) is “Personality can be defined as
consistent behaviour patterns and intrapersonal processes originating within the
individual.” Funder (2012) defines personality as “an individual‟s characteristic patterns
of thought, emotion, and behaviour together with the psychological mechanisms
(hidden or not) behind those patterns”. Further, several terms in psychological literature
are used to define the aspects of a character through its behaviour. Examples of these
terms apart from personality are temperament, attitude, mood, and emotion.
Temperament refers to the characteristic phenomenon of an individual‟s emotional
nature, including his susceptibility to emotional stimulation, his customary strength and
speed of response, the quality of the prevailing mood, and the peculiarities of
fluctuations and intensity in the mood (Hans Jürgen Eysenck, 1990). A significant
differentiation has been made in the literature between personality and temperament.
Strelau (1983) sees “temperament” as an inborn characteristic and “personality” as a
product of the interaction between temperamental traits and environmental demands and
opportunities. In fact, temperament has been said to have higher priority over
personality within a system and to be historically and functionally higher within the
hierarchical structure. Temperament theorists focus on the aspects of personality
obtained from nature, at birth, rather than those learned after birth. Next sections
introduce the approaches used in some of the prominent personality models in the
literature. Meanwhile, the purpose of this section is an overview of different approaches
based on personality. Figure 2.1 illustrate the main personality the types of personality
approaches.
Univers
ity of
Mala
ya

22
2.4.1 The Biological Approaches
The basis of this theory is that human behaviour is the product of a complex
biological system. There are three main areas of investigation in personality theories
adopting this approach: the relationship between brain and anatomy, biochemistry and
personality and the relation between genetics and personality. The anatomy of the brain
is studied using imaging techniques like MRI and PET. The association of the mental
anatomy to personality and behaviour is made using these imaging techniques and the
association of the obtained information in cases of brain surgery and brain injury. There
is an association between personality and biochemical like neurotransmitters and
hormones. Epinephrine and Norepinephrine rise in situations of fight or flight and are a
part of the adrenaline rush. Another response to stress, anxiety or depression is the level
of Cortisol. Serotonin is associated with high and low aggression. There are other, more
complex associations between biochemistry and personality. The other important
direction is the relationship between genetics and personality. Evolutionary theory
attempts to explain the origin and development of a personality. The initial genetic
makeup of people differentiates their personality. It influences the inclination to certain
ways of adaptation. Adaptation to the environment results in the further evolution of
personality (Zuckerman, 2005).
Figure 2.1: The Main Personality Approaches
Personality Theories
Biological Psychoanalytic Adoption Need Arousal Traits
Univers
ity of
Mala
ya
23
2.4.2 The Psychoanalysis Approach
The classic psychoanalytic theories explain human behaviour in terms of the
interaction of various components of personality. Sigmund Freud was the founder of
this school of thought. Freud divides human personality into three significant
components: the id, ego, and super-ego. The id acts according to the pleasure principle,
demanding immediate gratification of its needs regardless of the external environment;
the ego then must emerge in order to realistically meet the wishes and demands of the id
in accordance with the outside world, adhering to the reality principle. Finally, the
superego (conscience) inculcates moral judgment and societal rules upon the ego, thus
forcing the demands of the id to be met not only realistically but also morally. The
superego is the last function of the personality to develop and is the embodiment of
parental/social ideals established during childhood. According to Freud, personality is
based on the dynamic interactions of these three components (Zuckerman, 2005).
2.4.3 Adoption Theory
Karen Homey‟s adaptation theory defines personality by the three styles people
choose to adapt to the world and to deal with anxiety. These are the passive, the
aggressive and the withdrawn styles. The adaptation style is reflected in the defense
mechanisms people use in dealing with situations. Barret & et al (2002) has studied the
way people interact in this context. As per Homey‟s original theory an individual will
respond or adapt to a situation by either moving toward, against or away from people.
Univers
ity of
Mala
ya
24
2.4.4 Need Theory
Henry Murray‟s theory deviates from the Freudian premise of biological
instincts and biological processes being the only source of an individual‟s personality
and drives. Murray took into account the influence of learning due to the influence of
the environment on personality. Murray‟s theory follows the evolutionary theory to
personality in that the individual‟s personality is defined as a function of both his innate
genetic makeup and the characteristics that are learned through experiences with the
environment (Zuckerman, 2005). Murray (Murray) defined a set of psychogenic „needs‟
that are used to understand personality. The psychodynamic pleasure principle is based
on the principle that people seek pleasure and conversely, avoid pain. He defined a
psychogenic need as “readiness to respond in a certain way under certain conditions”.
Eysneck (1990) summarizes Murray‟s theory as distinguishing between primary needs
and secondary needs. The former are said to be biologically based while examples of
the latter are “need for achievement” and “need for affiliation”.
2.4.5 Arousal Theory
An individual can be considered as a system that absorbs and discharges energy.
Absorbed energy is transmitted to the environment by allocating it to various activities.
The arousal theory looks at these energies as drives, internal states or behaviour elicited
by a stimulant. Powell (1979) further summarizes Eysenck‟s theory as defining the
neuronal networks to be in a state of activity, in a state susceptible to activation or
alternatively in an inert state that is harder to activate. Eysenck‟s theory on cortical
excitation and inhibition differentiates human beings based on “the speed with which
excitation and inhibition are produced, the strength of the excitation and inhibition
Univers
ity of
Mala
ya
25
produced and the speed with which inhibition is dissipated”. These are in the context of
the cortical response of the physical brain to a stimulus. H. J. Eysenck (1997) elaborates
that personalities are characterized by the neuronal activity level, the cortical activity
level or the excitation and inhibition regulated by (RAS) Reticular Activation System.
Extroverts are characterized by an inhibited state of cortical activity. Introverts are said
to be in a cortically excited state. Further, they are said to have a highly redundant
processing system that manifests in them being overly cautious. The Ascending
Reticular Activating System (ARAS) regulates “the balance between excitatory and
inhibitory neural mechanisms”. An introvert is characterized by a high level of cortical
arousal and is overly affected by most stimuli. Extroverts have a low level of cortical
arousal. They ignore a big portion of received stimulation.
2.4.6 Type and Trait Theory
Type and traits theories have evolved as the most pragmatic personality models.
The approach in these cases is to identify and enumerate characteristics that can be used
to represent different types of personalities and behaviours. Type theories
compartmentalize people to be of different types. Thus, the type personality models are
based on a set of personality types and individuals are usually assigned a single
personality type. These have been criticized for being restrictive, as they do not take
into account the variation in a person's behaviour due to different situational settings.
Trait theories, although based on a set of entities that characterize personality, are
different. The basis set of traits consists of elements that in combination define a
personality. This approach allows for flexibility in defining an individual‟s personality
with substantial provision for complexity. In the following of this section, some of the
prominent trait theories summarize.
Univers
ity of
Mala
ya
26
Gordon Allport: His theory gave importance to motives and the concept of
„self‟. Allport and Odbert (1936) studied unabridged dictionaries of the English
language and formulated a list of 17,953 words. These were words whose meanings
described an aspect of personality and were each treated as a personality trait. These
traits were organized hierarchically based on the extent of their influence on behaviour.
For instance, Allport used around 10 traits as the “central traits” of a person. Allport
also gave importance to the influence of environment on personality. He took into
account the changes made in personality due to adaptation to environment and
conditioning by experiences. Allport‟s perception differed from the common definition
of traits in that, he saw them in the context of an individual, as the entities that are
integral to an individual and to define his personality. This is different from defining
traits as a set of factors that are used to represent all possible human behaviours in
general (Buss & Plomin, 2014).
Hans Eysenck: his theory developed a type theory with the definition of types
in terms of traits. Eysenck‟s theory proposes the neuronal network to be in two states,
active or inert. The active state includes a neutral state that is ready to be activated and
the inert state is relatively harder to activate. The (RAS) reticular activation system is
responsible for excitation or inhibition via cortical arousal. He used these definitions to
characterize the traits Extroversion and Introversion. The excitation of the brain and a
consequent low cortical arousal are associated with extroversion. Conversely, the
inhibition of the brain and a high level of cortical arousal are associated with individuals
who have high introversion.
Eysenck‟s theory also explains anxiety in the context of pre-attentive and
attentive processes. Individuals with high anxiety tend to pay high attention to
Univers
ity of
Mala
ya

27
threatening stimuli. The aspect of Eysenck‟s theory of relevance in the given context is
its importance to higher order traits or super factors. The genetically determined super
factors are measured using the Eysenck Personality Questionnaire (EPQ) and are
derived from factor analysis. Three super factors that were initially proposed are
Extroversion, Introversion, and Neuroticism. Psychoticism was later added to this set
(Buss & Plomin, 2014).
Raymond Cattell: he believed that the factors that describe personality are
genetically determined. He conducted the study by formulating 181 groups of
personality-describing words. These were used by subjects to describe people they
knew. These adjectives were further distilled into 12 clusters using factor analysis. With
an additional 4 factors, a total of 16 factors were said to be used by individuals to
describe people. These were termed “source traits” and were said to be the core
elements of personality that manifested into outward behaviour or “surface traits”.
These personality traits were used to create the 16PF Personality Questionnaire. This
personality test is widely accepted and used in clinical research and practical
assessments of personalities.
Big Five Traits Theories 2.5
There is more than 20,000 traits adjective, which people used to describe
characteristics. That is calls trait-descriptive adjectives. Traits are characters, which
describe how people are different. Personality traits are defined as “consistent patterns
of thoughts, feelings, or actions that distinguish people from one another” (Buss &
Plomin, 2014). There is emerging agreement that five broad factors capture most of the
variability in normal personality traits. These “Big Five” trait domains consist of
Univers
ity of
Mala
ya

28
Extraversion (traits like energetic and sociable), Agreeableness (traits like considerate
and kind), Conscientiousness (traits like hard-working and orderly), Emotional Stability
(or its converse, Neuroticism, that includes traits like nervous and tense), and Openness
(traits like artistic and creative). Several trait theories are based on the Lexical
Hypothesis. In 1936, Gordon Allport and H. S. Odbert (1936) proposed the Lexical
Hypothesis as “Individual differences that are most salient and socially relevant in
people‟s lives will eventually become encoded into their language; the more important
such a difference, the more likely is it to become expressed as a single word”. As Acton
(1998) states, this hypothesis justifies factor analysis in deducing characterizing factors
from personality related terms from language dictionaries. Proof of the convergence
proposed by the hypothesis was provided by theoretical research and led to the
development of a model that describes personality using five aggregate-level trait
descriptors.
Allport and Odbert extracted 18,000 personality-describing words from
dictionaries of the English language. The lexical analysis led to the distillation of this
list to 4500 personality-describing adjectives. These were traits of personality that
characterize an individual over a relatively long period. Raymond Cattell further
consolidated this list using factor analysis and came up with 16 basic factors. W.T.
Norman later found that personality could comprehensively be represented using five
factors. In 1981, a consensus was reached by leading researchers in the area (Lewis
Goldberg, Naomi Takamoto- Chock, Andrew Comrey and John M. Digman) on the fact
that most research pointed to five standard factors to represent personality (2010). This
five-factor model has been widely accepted as a standard by personality psychologists.
Psychological studies have concurred on five personality factors through adjectives
analysis and through analysis of data from personality rating questionnaires. R. R.
Univers
ity of
Mala
ya
29
McCrae and Costa (2003), noted that the five-factor model formalizes these five traits
by organizing them in a personality model.
2.5.1 Introduction to the Five-Factor Model
The five-factor model developed by Costa and McCrae allows for the
convenient parametric description of a character‟s personality. This model consists of
the five types: Openness, Conscientiousness, Extroversion, Agreeableness, and
Neuroticism (1992). John (1999), noted that previous theories had not succeeded in
formulating a set of traits that could predict characteristic behaviour. The five-factor
model succeeded in developing a taxonomy of traits to consistently predict behaviour in
different situations. Popkins (1998) shown that this model had been accepted as a
standard and years of studies in the field has led to the model being accepted as a
standard personality model. Wide practical use of the model in research has allowed for
the formulation of associations between behavioural characteristics and various
configurations of the five factors.
2.5.2 Defining the Five Factor
Psychologists have used two approaches to identify and define the five factors.
R. R. McCrae and P. O. John (1992) describe the methods of lexical analysis and the
method of using questionnaire data to extract the traits in detail. Most researchers have
concluded with the same five factors to describe personality. There has been a wide
consensus among theorists in deriving the definitions of the factors. The following is a
summary of the widely used definitions and characteristics of these five factors:
Openness, Conscientiousness, Extroversion, Agreeableness, and Neuroticism.
Univers
ity of
Mala
ya

30
Openness to Experience: There are some variations in the definitions of
Openness. There is a debate between defining O as openness to experience or, a wider
definition of O as intelligence, But as McCrae and John (1992) discuss, intellect is
included in the aspects that define O. Openness can be to susceptibility to
consciousness, to a variety or to experiences. Experiences could include a variety of
feelings, thoughts or values. Thus, there can be an openness to several kinds of
experiences. Theories that distilled the factor O using questioner studies define it with a
broad scope. The included characteristics are creativity, intellectual interests,
differentiated emotions, aesthetic sensitivity, the need for variety and unconventional
values. Openness to experience is defined by John (1990) as “Appreciation for art,
emotion, adventure, and unusual ideas; imaginative and curious”. In terms of cognitive
style, John (1990) characterizes people with high O as imaginative and creative,
intellectually curious, appreciative of art and sensitive to beauty. They think and act in
independent and unconventional ways. People with low O are down-to-earth and
conventional, prefer familiarity and are resistant to change. Popkins (1998) refers to
openness as willingness “to make adjustments in notions and activities in accordance
with new ideas or situations”.
Conscientiousness: In association with a conscience, McCrae (1992) called C
the inhibitive factor that restricts impulsive behaviour. Along the same lines, he also
associates the concepts “Constraint” and “Prudence” with C. John (1990) elaborates this
factor as “the way in which we control, regulate, and direct our impulses”. Individuals
high on C are controlled and do not take snap decisions and are not impulsive.
Conscientiousness is also associated with self-discipline by John in (1990). According
to McCrae and John (1987), individuals of this type are organized, careful and neat.
Univers
ity of
Mala
ya
31
They also characterize conscientious individuals with diligence and thoroughness.
Individuals with high C are said to be strong-willed and are associated with persistence.
Extroversion: defines a trait characterized by a keen interest in other people and
external events, and venturing forth with confidence into the unknown. John (1990)
associates extroversion with social adaptability. Extroverts are characterized by a
tendency to seek stimulation and the company of others. They like engaging with the
external worlds and other people and are prominently visible in group settings.
Extroverts are also associated with high energy, enthusiasm, positive emotions and are
action oriented. Introverts, by contrast, have lower energy, are deliberated and are
indifferent to or, avoid social stimulation. In terms of the arousal theory, Extroversion is
associated with being sociable, energetic and assertive. Introversion is associated with
independence and stability.
Agreeableness defines as the measure of “how compatible people are with
other people, or basically how able they are to get along with others”. According to
McCrae (1969), Agreeable people are compassionate and cooperative as opposed to
being suspicious and antagonistic. The degree of Agreeableness is directly proportional
to cooperation and social harmony. John (1990) explains characteristics of
Agreeableness in terms of the value placed on getting along with other individuals.
Agreeable people are high on this scale and are resultantly considerate, friendly, helpful,
and willing to give higher priority to the interests of others. Less agreeable people, on
the other hand, place self-interest above getting along with others. These individuals are
less likely to be friendly. In addition, John (1990) finds agreeable people to have
optimistic views. These individuals are trusting and believe other people are honest.
Univers
ity of
Mala
ya
32
People with low agreeableness are sceptical of others' motives and, as a result, are
suspicious, unfriendly, and uncooperative.
Neuroticism: The definition of the term Neuroticism is most agreed on. Popkins
(1998) finds that theories label “N” as “negative emotionality”, or conversely
“adjustment”. John (1990) identifies a prominent feature of neuroticism as the proclivity
to feel negative emotions. Individuals with high N are inclined to often experience more
than one negative feeling. These individuals are inclined to react to situations with
anxiety, anger, or depression. They are more likely to interpret a situation, even a
neutral one, as threatening. However, individuals with low N need not be characterized
by a higher likelihood of feeling positive emotions. The frequency of being in a positive
mood or reacting positively is in fact influenced by the individual‟s level of
Extroversion.
As per John (1990), another feature of N is emotional reactivity. Individuals
with high N tend to react emotionally to neutral situations or situations in which other
individuals would not get emotional. These reactions, apart from occurring easily and
being relatively more negative are also more intense and have a tendency to last for
longer periods. McCrae and John (1992) find that individuals with low N are less
emotionally reactive and are not upset easily. McCrae and John (1990) describe a third
salient feature of high N as low emotional regulation. People with high N are
emotionally unstable and often experience mood swings. In comparison, personalities
with low N are emotionally stable, well-adjusted, relaxed and even tempered. Below the
sub-factors of Five Factor Model is presented in Table 2.1.
Univers
ity of
Mala
ya

33
Table 2.1: Big Five Factor Personality Facets
Personality Traits Low High
Openness
Stubborn Curious
Nominative Intelligent
Uncreative Imaginative
Narrow-minded Creative
Unoriginal Original
Artistic
Conscientious ess
Disorganized road-minded
Negligent Responsible
Undisciplined Organized
Irresponsible Persevering
Unsystematic Persistent
Careless Through
Goal-directed
Careful
Extroversion
Introverted Assertive
Reserved Energetic
Withdrawn Talkative
Silent Social
Inactive Gregarious
Unsocial Lively
Active
Agreeableness
Aggressive Cooperative
Argumentative Forgiving
Suspicious Modest
Confrontational Tolerant
Impolite Trustworthy
Inflexible Courteous
Egoistic Flexible
Insensitive Soft hearted
Altruistic
Sensitive
Neuroticism
Self-confident Anxious
Secure Insecure
Assured Sensitive
Hopeful Moody
Encouraging Depressed
Emotional
Angry
Embarrassed
Worried
Univers
ity of
Mala
ya
34
2.5.3 The Reasons for Using Big Five Factor
The five-factor taxonomy has been studied, critiqued and accepted by
psychologists. To look at one such study by Popkins et al. (1998) the taxonomy is
analysed and measured to see if it meets the criteria of being a good personality theory.
R. R. McCrae and P. O. John (1999) define the personality process to include the
“thoughts, feelings and actions of an individual”. The five-factor model successfully
and concisely represents the characteristic individual differences between people and
their personality processes. Apart from fulfilling this basic requirement, the five-factor
model also satisfies the following significant aspects of a correct personality model.
Appropriateness across Cultures: As Popkins (1998) notes, psychological
researchers define a universal model as one that is independent of cultures or situations.
However, keeping in mind the vast variety in human nature, this definition is a
guideline a good theory should tend towards. The Five Factor model has been proven to
be universal. The factors hold across cultures and languages. Digman (1990) conducted
a study in Japan, the Philippines, and Germany and found the factors stable. He
proposes that the way people construe personality is characterized by fundamental
features that are independent of language and culture. In addition, R. R. McCrae and P.
O. John (1992) stated that with adults, the five factors have consistently shown validity
across observers and across time.
Comprehensiveness: R. R. McCrae and P. O. John (1992) credit the five factors
with have included all the required relevant traits. The Five Factor model is
comprehensive in that, it systematically enumerates the personality traits and provides
these traits as predictors of human behaviour in most universal situations.
Univers
ity of
Mala
ya

35
Quantifiable: Popkins (1998) critiqued the Five Factor model to be an empirical
model. Although the model does not provide interpretations of the collected data, the
model based on factor analysis is compatible with statistical data collected through
questionnaires. Even more relevantly, the five factors can be defined as variables that
are quantifiable in a normalized range. This gives the convenience of representing the
traits parametrically using sliding scales
BFFM in Comparison with other Theories: The Big Five Model originated as
a result of the convergence of research of personality theories. Popkins (1998) states it
to be compatible and complementary to other theories. R. R. McCrae and P. O. John
(1992) note that this can be explained by the fact that all the personality theories have
the common goal of identifying the fundamental features of the same entities, human
personality, and behaviour. The Five Factor model formalizes individual differences.
The five factors are a result of statistical analysis and represent the basic dimensions of
human personality.
Applications of Big Five: The Five Factor model has various applications
ranging from personality assessment in a corporate setting to diagnosing and curing
pathological psychological conditions. Listed below are a few applications of the five-
factor model in the given context.
In research: The five-factor model and factor analysis, in general, has been
applied extensively in academics, research, experimentation, and learning. The model
also aids in correlating the resulting empirical data and helps to further the research of
personality theories as well as other research that focuses on human behaviour. As
Digman (1990) says, the Five Factor model provides a way to represent individual
Univers
ity of
Mala
ya
36
differences using a conveniently sized set of parameters that have reliable means of
measuring and validating.
In personality assessment: The Five Factor model is suited for any task that
requires personality assessment of an individual or a group of individuals. The
personality model has been applied in practical areas including education, forensic
psychology, health psychology and organizational psychology. It is used regularly to
assess employees. McCrae and John (1992) note another practical application as an
assessment of interpersonal relations in a particular everyday setting.
For behaviour prediction: Personality psychologists apply the individual
assessment to predict behaviour. The goal of the big five model is to scientifically
correlate traits and specific behaviour. For instance, it gives a scientific and reliable
method to access employee behaviour in a given situation or, to design environments
that cause employees to behave efficiently. John (1990) notes that the model is also
used to predict “life outcomes” of individuals based on their personality configurations.
For instance, high N and low A and C indicate a likelihood of smoking. High O
indicates a wider musical taste. Popkins (1998) noted that the behavioural prediction
could be extended to other behaviours like financial success and religious faith.
Suitability of BFFM to Task at Hand: The Five Factor model allows for the
convenient parametric description of a character‟s personality. They describe as the Five
Factor model as an effective tool to describe human personalities in common terms used
by people in general. O, A and C are familiar terms to people with no psychological
background. Furthermore, years of studies in the field has led to OCEAN being
accepted as a standard personality model. This wide acceptance not only proves the
Univers
ity of
Mala
ya
37
model to be tried and tested but being a universal standard has allowed for further
development in psychology, based on the model. Wide practical use of the model in
research has allowed for of associations between behavioural characteristics with
various configurations of the five factors. Analysis of empirical data collected through
questionnaires and other data collection methods yield this association of personality
and behaviour. These results have been extrapolated to predict behaviours of different
kinds. Of relevance, in this case, is the ability to be able to predict physiological
behaviour via psychological states. To conclude Popkins‟ (1998) analysis, the Five
Factor model has been shown to be compatible with psychological theories, based on
factor analysis or based on other approaches. Most recent personality theorists have
used statistical analysis and the Five Factor model has been found to be compatible with
other trait theories. Boeree (2004) has pointed out that, in spite of following different
statistical analysis approaches; the different trait theorists have proposed parallel sets of
personality dimensions. Most theorists have included E and N in their lists. Further,
even though other personality theories define personality in terms of a different set of
characterizing factors that seem unrelated to the five factors, R. R. McCrae and P. O.
John (1992) state that “item analysis “has shown these factors to tend towards the five
factors. The apparent compatibility of the factor model with other personality theories
and models corroborates its validity. It also allows for interpretation of the associations
to nonverbal behaviour formulated in the current work to be easily applied in the
context of a different personality model.
2.5.4 The Big Five Model and Gender
Vianello, Schnabel, Sriram, and Nosek (2013), investigated the personality traits
Big Five and its relationship with gender on 14,348 general population. Participants
Univers
ity of
Mala
ya

38
have completed five NEO domains (Goldberg, 1999) and a 40-item adjective measure
(“Mini-Markers”) of the five-factor structure were used to measure Extraversion,
Neuroticism, Conscientiousness, Agreeableness, Openness and Gender Identity online.
Their result confirms the previous result indicating that Agreeableness, Conscientiousness,
Extraversion, and Neuroticism reported higher among the female population than male.
Vecchione, et al. (2012), conducted the longitudinal study on the relationships of
personality Big Five and gender differences on 403 from Genzano, a small town near
Rome. Data collection was done at three different time points where T1 and T2
participants were high school students, and T3 participants were college students.
Participants have completed the measure of Big Five Questionnaire. Their result
showed that there are differences between men and women in terms of personality
dimensions. At time 1 (Age 16), females scored significantly higher on measures of
Agreeableness, Conscientiousness, and Openness. Males, in contrast, scored higher than
females on a measure of Emotional stability. In both males and females,
Conscientiousness and Openness increased linearly from age 16 to age 20, whereas
Energy/Extraversion remained stable. Emotional stability slightly increased in males
and remained stable in females. Agreeableness increased linearly in males and showed a
quadratic trend in females, first increasing and then declining over time. Finally,
females showed higher inter-individual variability than males on the trajectories of
Conscientiousness and Emotional Stability.
Roccas, et al. (2002), examined the relationship between Big Five personality
dimensions and personal values on 246 introductory psychology students at an Israeli
university. Participant completed the measures of value inventory, NEO Personality
Inventory (NEO-PI), Positive/Negative Affect Scale, and Religiosity. Their result
showed that Agreeableness correlates most positively with benevolence and tradition
Univers
ity of
Mala
ya

39
values, Openness with self-direction and universalism values, Extroversion with
achievement and stimulation values, and Conscientiousness with achievement and
conformity values. Correlations of values with facets of the five factors reveal nuances
of the facets and clarify ambiguities in the meanings of the factors. Values and
personality traits exhibit different patterns of correlation with religiosity and positive
affect. Findings support the idea that the influence of values on behaviour depends more
on cognitive control than does the influence of traits. Srivastava, John, Gosling, and
Potter (2003), studied compared five-factor personality and other personality theory in
respect to trait changes during life course on 132,515 sample aged 21 to 60. Participants
completed measures of Big Five personality via the internet. Agreeableness and
conscientiousness have shown to be increased during adulthood. Neuroticism decreased
among women. They concluded that Big Five personality dimensions are complex
phenomena subject to a variety of developmental influences.
2.5.5 Personality Traits and Nationality/ Cultures
Heine and Buchtel (2009), reviewed about personality (personality traits Big
Five) in different cultures. They concluded that personality traits especially Big Five
personality are consistent across different culture. Furthermore, they discussed that in
collectivistic cultures people show a higher level of traits which more is concerning
about understanding others than in individualistic cultures. Eap et al. (2008),
investigated the comparison of Five Big personality dimension among 320 Asian
American and 242 European American male university students. The result showed that
there are significant differences between Asian American and European American in
traits of extroversion, openness, neuroticism, and conscientiousness. Mohammed,
Unher, and Sugawara (2009), conducted across sectional on the Big Five personality
Univers
ity of
Mala
ya
40
dimension among 83 Japanese and 100 Egyptian students. Participants completed the
measure of NEO-FFI Inventory. Their result showed that neuroticism and conscientious
was significantly different between Japanese and Egyptian. Agreeableness, Openness to
experience and extraversion showed similarities between both groups. Allik and
McCrae (2004), investigated the personality traits among 36 cultures by using five-
factor personality model on 27,965 college student and adults volunteers of from five
continents. Subjects completed the NEO-PI-R is a 240-item questionnaire that assesses
30 specific traits which explain the five basic elements of personality contains
neuroticism, extraversion, openness, agreeableness, and conscientiousness. Although
temperament was not significantly in relation with personality elements but, cultures
from the proximate geographic area shown to have similar characteristics while remote
geographic area such as Europe, American, African, and Asian cultures have
significantly different personality profiles. They reported that extroversion, openness,
and agreeableness reported high among the former. They suggested that personality may
effect by genetic integration in the proximate areas and cultural features.
2.5.6 Personality and Mental Health
Ghazinour and Richter (2013) investigated the relationships of personality,
mental health, and some socio-demographic variables on 121 female social work
Swedish students. Subject completed a demographic form, the Temperament and
Character Inventory, and the Symptom Checklist. Their result indicates that personality
traits highly predictor of mental health scores. Subjects reported a higher level of harm
avoidance, self-transcendence, and reward dependence also reported more somatization,
obsessive-compulsive, and phobic-anxious symptoms, and less hostility compares to
general Swedish population. Habibi, et al. (2013a) investigated the personality
Univers
ity of
Mala
ya
41
characteristics and mental health on 100 subjects selected randomly from drop-out
addiction centers aged 25-55. Participants completed the set of surveys contained NEO-
FFI and 90-R-SCL. Their result showed the significant positive relationship between
personality dimensions and mental health.
Kjell, et al. (2013) studied cross-cultural relationships of personality
characteristics and well-being on two sample of Iranian (122) and Sweden (190) high
school students population. Participants completed Big Five personality inventory, The
Satisfaction with Life Scale, The Positive Affect, and Negative Affect Schedule, and
The Scales of Psychological Well-Being. Their result showed that subjective and
psychological well-being reported to be higher among Sweden participants whereas,
agreeableness, conscientiousness, and openness were higher among Iranian.
Extraversion and Neuroticism were reported similar among two cultures. Moreover,
there was the relationship between neuroticism and well-being in both cultures, while
openness reported being related with well-being among Iranian sample, and
extraversion was related to well-being among only Sweden sample. Finally, they
concluded that certain personality characteristics (extroversion, openness, and
conscientiousness) are related to well-being in regards to the culture. Although
neuroticism was seemed to be related to subjective well-being regardless of culture. The
complexity of the results suggested more research in this area.
Kokko, Tolvanen, and Pulkkinen (2013) conducted the longitudinal survey
about the associations between personality dimensions and well-being on 369
individuals. Participants completed the Big Five Personality Inventory, Psychological
Well-Being, and Life satisfaction. Their result showed that well-being is highly
correlated with extroversion (positively) and neuroticism (negatively). In addition,
Univers
ity of
Mala
ya

42
conscientiousness, openness, and agreeableness are significantly correlated with well-
being as well
Lu (1994) investigated the associations of personality, mental health, and major
stressors life events, minor daily hassles, and perceived university stress. They found
that anxiety is predicted by life events while, depression is predicted by daily hassles,
extroversion negatively correlated with locus of control, neuroticism is positively
correlated with university stress, neuroticism was the main predictor of somatic
symptoms, and extroversion has vulnerability effect on somatic symptoms. Furnham
and Cheng (1999) studied personality dimensions in correlations with happiness and
mental health among 384 undergraduate participants from British, China, and Japan
aged 16-40. Participants completed Eysenck Personality Questionnaire, Oxford
Happiness Inventory, and Langner 22-Item Measure (which measures mental health and
physical conditions). Their result indicated that British students have the highest levels
of happiness, mental health, and extroversion than other groups. Extroversion has
shown to be a major correlation of happiness among all groups whereas, neuroticism
had a strong relationship with mental health. N. Ghorbani, Watson, and Morris (2000)
investigated the associations of personality, mental health, and stress on 94 Iranian
managers. Participants completed the measures evaluating personality, mental health
and stress. Their result confirmed that the role of personality in stress and mental health
is valid cross-culturally among Iranian as well.
Anthony (2001), studied the relationship of well-being and personality
dimensions. They employed Big Five personality dimensions and well-being measure
along with other well-being related factors on undergraduate York University students.
The validity of each well-being dimension was supported by simple correlations.
Univers
ity of
Mala
ya
43
Principal component and multiple linear regression analyses were used. They found that
Ryff‟s multidimensional well-being scale is a useful research tool for assessing well-
being.
Cheng and Furnham (2003) examined the correlations and causes of happiness
and depression among 234 adolescents in schools and colleges (mean age=18.23 years).
Participants were asked to complete self-report measures of, self-esteem (Rosenberg
Self-Esteem Scale), personality (Eysenck Personality Questionnaire), affect (Positive
Affect; Negative Affect), happiness (Oxford Happiness Inventory), and depression
(Beck Depression Inventory).
Multiple regressions indicated that extraversion was significantly correlated with
positive and negative affect, depression, and happiness. Neuroticism showed to be
significantly correlated with positive and negative affect, depression, and happiness in
the same level. Self-esteem and relationship with parents were directed predictive of
happiness and the opposite predictor of depression Extraversion and neuroticism were
predictors of depression and happiness by mediating of self-esteem. Further, sex also
showed direct predictive power for depression (β=0.20, P<0.01). Result of analysis
clearly that, self-esteem, personality, and demographic are predictors of happiness and
depression.
Diener, Oishi, and Lucas (2003) reviewed past literature about the associations
of well-being and personality with regards to different cultural contexts. They
concluded that personality traits such as extroversion, neuroticism, and self-esteem are
effective on the levels of well-being. Besides personality, life events and environments
also have a large effect on the well-being of people. Cultural variables found to explain
and moderate well-being differences among different societies. It is very challenging to
Univers
ity of
Mala
ya

44
assess well-being across different societies, yet this kind of cross-cultural measures it
valuable and still so many unanswered questions need to be answered.
Egan (2003) conducted cross-sectional and correlational designs were used on
167 samples from out-patient, in-patient, and court referrals. Participants completed the
NEO-five factor Inventory to measure Big Five personality traits and The International
Personality Disorder Examination-Screening Questionnaire (IPDE-SQ) to measure
personality disorder (self-report) which has defined by DSM-IV. Participants were
interviewed through IPDE semi-structured interview as well. High Neuroticism, low
Extroversion, low Agreeableness and low Conscientiousness appeared to be strongly
correlated with most personality disorders, especially Paranoid, Schizotypal, Borderline
and Antisocial personality disorders. High Neuroticism was associated with higher
scores on the self-report measures of personality disorder. High Extroversion was not
related to any of the „outgoing‟ personality disorders. High Conscientiousness was not
related to a higher score on the measure of Compulsive personality disorder.
Widiger and Anderson (2003) Considerable research has been done on the
effect of personality traits on the etiologic of depression with the consideration of
gender differences. They investigated the associations between personality traits and
personality disorders and their relevance to women and gender issues. They found that
personality functioning is one of the significant factors of depression in women as well
as a depression treatment. Maladaptive personality traits may affect the efficiency of
depression treatment. Maladaptive personality trait which increases vulnerability to
depression is inflexible than normal personality traits. Liu, Zhang, Xiao, and Feng
(2004) evaluated personality characteristics, major satisfaction, and mental health of
294 military medical college students. Participants completed Symptom Checklist 90
Univers
ity of
Mala
ya

45
(SCL-90) and Eysenck personality questionnaires (EPQ). They concluded that students
with introverted, psychogenic, and neurotic personality are more likely to be dissatisfied
with their major, and greater major dissatisfaction may lead to increased mental
problems. Yang (2005) investigated the personality and mental health of 550 junior
medic students from Harbin Medical University. Participants completed the measures of
Eysenck personality questionnaire and Self-rating depressive scale (SCL-90). They
concluded that junior medical students score higher in compulsion, anxiety, psychosis,
and crankiness that normal population Chinese. Personality problem and severity of
mental health were positively correlated.
Chioqueta and Stiles (2005) investigated the relationship between personality
traits, depression, hopelessness, and suicide ideation on university students (N = 219).
The results of the factor-level multiple regression analyses revealed that depressive
symptoms were positively predicted by Neuroticism and Openness, and negatively predicted
by Extraversion. Hopelessness was positively predicted by Neuroticism and negatively
predicted by Extraversion. Finally, suicide ideation was positively predicted by Neuroticism.
Accordingly, depressive (Buckley et al., 1999) symptoms were positively predicted by
the Neuroticism facets, angry hostility, and depression, and negatively predicted by the
Extraversion facet, positive emotions, and by the Openness facet, actions. Hopelessness
was positively predicted by the Neuroticism facet, depression, and negatively predicted
by the Extraversion facets, assertiveness and positive emotions.
E. J. Costello, H. Egger, and A. Angold (2005) reviewed the prevalence of child
and adolescence psychiatric in a previous decade. They report that prevalence and burden
assessment of child and adolescence has significantly improved. Methods of
Univers
ity of
Mala
ya

46
different kind of interviews (respondent based, interviewer based, best estimate) and
data collection (paper and pencil, computer assisted, interviewer or self-completion) had
helped researchers and clinician to facilitate diagnose. They concluded that some of the
life course psychiatric disorders would appear from childhood and adolescence. Stewart,
Ebmeier, and Deary (2005) assessed the relationship of personality and mood states.
Eight hundred seventy 870 Edinburgh‟s Universities students aged above 17 were the
participants of their study. Personality was assessed by using the Eysenck Personality
Questionnaire-Revised (EPQ-R) and the Tridimensional Personality Questionnaire
(TPQ). The mood was assessed by the State and Trait Anxiety Inventory (STAI), the
General Health Questionnaire 28 (GHQ-28) and the Oxford Happiness Inventory (OHI).
Harm Avoidance (TPQ), Neuroticism (EPQ-R) and Extraversion (EPQ-R) were highly
correlated with both positive and negative mood.
Neuroticism and Harm Avoidance was equally predicting the negative mood.
Harm Avoidance has a negative correlation with Happiness. Harm Avoidance was a
predictor of both Extraversion and Neuroticism. Psychoticism had a small but
significant correlation with mood variance. (Stewart et al., 2005) conclude that, traits of
Neuroticism and Harm Avoidance have a high significant effect in the state of mood.
Low Harm Avoidance tends to be extroverts and emotionally stable (low Neuroticism).
Hui-min (2006), investigated the relationship of personality and mental health
on 128 undergraduate from three universities in Henan province. Participant was asked
to complete Eysenck Personality Questionnaire (EPQ ) which is included 4 dimensions
(Extroversion, Neuroticism, Psychoticism, And Social Desirability) and Symptom
Checkkist90 ( SCL90) which is include 9 dimension and 90 questions. Their result
indicated that personality and mental health of a student are strongly correlated
Univers
ity of
Mala
ya
47
internally especially introversion, emotional instability, and psychoticism aspect of
personality.
Jylhä and Isometsä (2006) explored the relationship of personality dimensions
specifically neuroticism with mental health issues such as depression and anxiety.
Participants were 441 individual from the general population at two finish cities aged 20
to 70. They asked to fill up Beck Depression Inventory (BDI), Eysenck Personality
Inventory (EPI), and Beck Anxiety Inventory (BAI). For diagnosing lifetime mental
disorder participants were asked about past 12 month‟s history of any mental disorder.
Their result showed that neuroticism was strongly correlated with depression and
anxiety while, participants who reported lifetime mental disorder in past 12 months,
versus extroversion, was negatively correlated with depression, anxiety, and self-
reported lifetime mental health in past 12 months. For gender, age, and education, BDI
scores were significantly associated with neuroticism, extraversion, and age, whereas
BAI scores were associated only with neuroticism. Neuroticism is strongly associated
with depressive and anxiety symptoms, and introversion is moderately associated with
depressive symptoms in the urban general population. The relationship of these
personality dimensions to both self-reported lifetime mental disorders and use of health
services for psychiatric reasons strengthens the clinical validity of these personality
dimensions.
Li et al. (2008) investigated the factors influencing on mental health among
Chines College students. factors of age, gender, ethnicity, the level of satisfaction with
major, and place of origin were evaluated in associated with 3 mental health group.
Group A: severe mental health issues which need counselling serves necessary, group
B: symptoms of adjusting problems, group c: no symptoms of mental health. Mental
Univers
ity of
Mala
ya
48
health was assessed by University Personality Inventory. Their results revealed that,
ethnicity, gender, age, and level of satisfaction with major influence the level of
student‟s mental health.
Steel, Schmidt, and Shultz (2008) reviewed the associations of personality and
subjective well-being by the method of meta-analysis. They reviewed personality and
well-being by measures of NEO and categories of SWB (for example life satisfaction).
They concluded that different personality and SWB inventories may have
fundamentally different and the relationship between these two factors is much stronger
than other meta-analysis had reported. Song et al. (2008) analysed the relationship
between depression and three personality factors in college freshmen from Beijing (988)
and Hong Kong (802). There was no sex difference in prevalence in Beijing while the
prevalence was significantly different between sexes in Hong Kong. High neuroticism,
concern over mistakes, doubts about actions, low self-esteem, and poor organization
were associated with depressive symptoms in both sites. In college freshmen in Hong
Kong suggests that their mental health is not as satisfactory as that of their counterparts
in Beijing. The strong relationship between certain personality features and depressive
symptoms is similar in both regions. Personality differences in the two sites explain
only part, but not all, of the difference in depressive symptoms between the two sites.
Md Nordin, Abu Talib, and Yaacob (2009) examined the relations of
personality and loneliness and its effect on mental health of 1468 Malaysian
undergraduate students. Participants were recruited from five universities by cluster
sampling. Subject completed the General Health Questionnaire (GHQ-12), Big Five
Inventory, and revised UCLA Loneliness Scale. Their result showed that 34.4
percentages of students are at risk of mental health problems. Also, extroversion,
Univers
ity of
Mala
ya
49
agreeableness, conscientiousness, openness, and loneliness showed to have a significant
relationship on mental health. There was a significant difference in mental health
between the year of study, the field of study, ethnicity, and religion. Finally, they
reported that loneliness, neuroticism, and extroversion were significant predictors of
mental health.
Paterson, Reniers, and Völlm (2009) studied the differences of personality traits,
mental health, and empathy of 54 volunteers and 52 non-volunteers students for
telephone helpline. Participants completed the Big Five Inventory, Interpersonal
Reactivity Index (IRI, for evaluating empathy), and Mini International Neuropsychiatric
Interview (for evaluating participants mental health). Their result showed that
volunteers scored higher empathic concern and agreeableness than non-volunteers.
Mental health reported being similar between both groups. The big five model of
personality is currently the most comprehensive descriptive model of normal
personality.
Wang and Miao (2009) examined the relation of personality traits, mental
health, and coping style among medical students in Xi‟an Jiatong University School of
Medicine. Subjects completed the measures of Eysenck Personality Questionnaire,
Coping Style Questionnaire, and the Symptoms Checklist-90. They found that there is a
relationship between personality, the level of emotional health, and coping style.
Personality traits and coping style were correlated with mental health. Neuroticism,
rationalization, paranoid ideation, education level of the father, fantasizing and
academic stress were factors which affect the level psychological and emotional health.
Smillie et al. (2009) stated that Personality traits leads individuals into particular
affective states and have important role mental illnesses in particular. Their study has
Univers
ity of
Mala
ya

50
taken 50 bipolar patients, 50 unipolar patients, and 50 controls matched for age and sex.
Participants in the control groups were screened for symptoms of depression. The result
showed that unipolar patients from controls, such that unipolar patients were higher on
neuroticism and lower on extraversion. Bipolar patients showed a similar personality
profile too but were not clearly distinguished from, unipolar patients.
Ahadi and Basharpoor (2010) examined the relations of personality dimension,
mental health, and sensory processing sensitivity on the sample of 180 Iranian students.
Participant completed scales of NEO (Big Five Inventory), GHQ (General Health
Questionnaire), and sensitive person scale. Their result revealed that excitation ease
showed a positive correlation between neuroticism and mental health and negative
correlation to extroversion. There was positive relationship between aesthetic sensitivity
and openness to new experience
Tosevski, Milovancevic, and Gajic (2010) reviewed the personality and mental
health of university students. They concluded that university students represent the
national capital and investment for the future, with an implicit mission both for their
families and for society as a whole. However, they face multiple stressors such as
academic overload, resistance pressure to succeed, competition with peers and in some
countries financial burden and concerns about the future. As all this may lead to
psychopathology, the health of university students has been the subject of increasing
focus in recent years. Recent findings have shown multiple protective and risk factors
are involved in the psychological well-being and distress of university students. Specific
risk factors for the development of psychopathology are high test anxiety, lower self-
efficacy, as well as certain personality traits. Moreover, some students arrive at college
with already existing mental health problems. The most frequent mental disorders
Univers
ity of
Mala
ya

51
among students are substance abuse, depression, self-harm and suicide, eating and
anxiety disorders. Obtaining and improving knowledge about the student population is a
crucial factor in the development of mental health promotion programs in order to meet
their needs and to help them cope with various problems. Better understanding and care
of the personality profile of university students can be helpful in academic and career
choice and prevention of future mental health problems
Leandro and Castillo (2010) explored the relationships of coping style in
stressful events with personality, depression, and anxiety. They also studied the
modulating effect of gender in relation to personality and coping styles. Two hundreds
and seventy four participants (43% male& 56% women) with an age range of 17 to 62
years old (M = 29.8; SD = 11.7) filled up the package of questionnaires consist of
stress-coping styles, personality traits, the locus of control, self-esteem, anxiety, and
depression. The method of correlation analysis and mean differences was used to
analysis the data. The result indicates that generally, different dimensions of personality
were related to different coping strategies. More specifically, the female tends to use
emotion-focused coping strategies than men do, although both equally used task-
focused strategies. The results of overall measures of coping style indicated that task-
focused strategy has been used by subjects with high self-esteem, the low external locus
of control, and low depression and anxiety the most. On the other hand, the emotional-
focused strategy had been used by subjects with low self-esteem, the high external locus
of control, and high depression. The influence of personality on the way people cope
with stressful situations has been discussed many times. It has even been discussed
whether stress-coping styles and personality traits could be confused.
Univers
ity of
Mala
ya
52
Ghazinour, Lauritz, Du Preez, Cassimjee, and Richter (2010) studied the status
of mental health and personality on 103 police trainees from Sweden. Participants
completed “Temperament and Character Inventory”, and The Symptom Checklist-90-
Revised (SCL-90-R). Their result showed that police trainees are mentally healthier
than the normal population. Police trainees‟ personality characters are more developed
in aspects of strength, reliability, and responsibility. All aspects of psychopathology
were positively associated with harm avoidance while negatively associated with self-
directedness. Overall, trainees reported sufficient mental health and personality
characteristics, especially female population showed to have enough strength to handle
stressful events. Lală, Bobîrnac, and Tipa (2010) investigated the associations of
personality types and level of stress on 500 students from Romania. Demographic
information and other related questionnaires were completed by participants. The result
showed that there is a high level of stress among students. Type A and C personality
showed to be highly associated with stress level.
Andriola, Di Trani, Grimaldi, and Donfrancesco (2011) clarified the relationship
between depression and personality in men and women who are expecting a baby.
ANOVAs showed that pregnant women had higher levels of depression, reward
dependence, and self-transcendence than the expectant fathers did. Hierarchical
Multiple Regression Analysis in the pregnant women group showed that harm
avoidance and self-directedness were significant predictors of the level of depression. In
the expectant fathers, only self-directedness was a significant predictor of depression.
du Preez, Cassimjee, Lauritz, Ghazinour, and Richter (2011), investigated the
relationships between personality and mental health on 1145 police trainees from South
African Police Academy, 648 males, and 497 females. Participants completed
“Temperament and Character Inventory”, and The Symptom Checklist-90-Revised
Univers
ity of
Mala
ya
53
(SCL-90-R). Their result showed that men have less level of somatization, anxiety,
depression, and phobic anxiety symptoms, harm avoidance and a higher level of
persistence than women. The two most important demographic variables which are
predicting personality are gender and English language proficiency.
Farnam, Farhang, Bakhshipour, and Niknam (2011) evaluated the personality
dimensions of patients with mixed anxiety/depressive disorder and its implication on
treatment‟s result. For that, 80 patients were diagnosed as a mix depression/anxiety by
structured clinical interview. Patients were asked to complete NEO inventory and
anxiety/depression and stress Scale (DASS) in order to measure the personality
dimensions and severity of illness in the beginning and end of the treatment.
Introversion, neuroticism, and disagreeableness were higher in the sample compared
with the normal individual.
Josefsson et al. (2011) studied the relationship of personality and well-being in
the sample of 1940 volunteer from Cardiovascular Risk in Young Finns. Participants
were completed Multidimensional Scale of Perceived Social Support (PSS) and
Temperament and Character Inventory (TCI). Their result indicated that self-
directedness and well-being were strongly associated. More, cooperativeness was
associated with most dimensions of well-being (especially perceived social support).
Self-transcendence showed to be effective on well-being by cultural influences. Finally,
they concluded that personality has a strong effect on overall well-being (affective and
non-affective).
Chang, Law, and Chang (2011) examine the impact of four selected personality
traits, namely interpersonal problems, ideas of being persecuted, social students in
Univers
ity of
Mala
ya
54
introversion, and self-depreciation, on the inclination to be depressed among students in
a Taiwanese university. Depression is a problem for many university students in
Taiwan. Understanding which personality traits are related to depression in Taiwanese
students is important for student affair administrators and medical professionals and will
help them to prevent and treat this debilitating illness. They declared that Depression is
a problem for many university students in Taiwan. They suggested that understanding
which personality traits are related to depression in Taiwanese students is important for
student affair administrators and medical professionals and will help them to prevent
and treat this debilitating illness. The results of the study indicate that depression
represents a serious problem in the lives of many students at Chang Gung University.
Joshanloo and Afshari (2011) examined the correlations of personality traits, life
satisfaction, and self-esteem on 235 Muslims Iranian university students. They
completed the Big Five Inventory, Satisfaction with Life Scale, and Rosenberg Self-
esteem Scale. Their funding indicated that big-five personality dimension counts 25%
of life satisfaction variance. Extraversion, Neuroticism, and self-esteem were the strong
predictors of life satisfaction. In addition, self-esteem was shown to mediate the effects
of extroversion, neuroticism, conscientiousness, and agreeableness upon life
satisfaction. Furthermore, female students scored higher life satisfaction than male.
Gender moderated the relationships between life satisfaction and conscientiousness.
Garcia (2011) investigated the personality and well-being on 289 Sweden high
school students. Participants completed the temperament and character inventory (TCI)
to measure student‟s personality, NEO personality inventory-revised (NEO-PI-R), and
psychological well-being was measured by Life Satisfaction, Positive Affect, and
Univers
ity of
Mala
ya

55
Negative Affect. Their result showed a strong relationship between Neuroticism,
Conscientiousness, Persistence, and Self-directedness with well-being.
Tse, Rochelle, and Cheung (2011) indicated that social functioning is a mediator
between personality traits such as harm avoidance or self-directness and depression.
Self-directedness was also shown to have direct effects on depression. The results
support the social reinforcement theory of depression and provide a theoretical account
of how the variables are related based on the correlation. A sample of 902 individuals
completed a self-report questionnaire consisting of the Temperament and Character
Inventory (TCI), Beck Depression Inventory (BDI), and Social Adaptation Self-
Evaluation Scale (SASS).
H. A. Ghorbani, Ahmadi, and Shayan (2011) studied the relationships between
personality type and mental health on 50 psychologist students from Iran. Participants
completed general health Goldenberg and two type personality questionnaire. Their
result indicated that there is a significant relationship between personality type A and
mental health. Type A personality showed to have a negative association with mental
health while type B had a positive association with mental health.
Abdel-Khalek (2012), explored the associations between personality traits and
mental health on Kuwaiti volunteer sample aged 18-32. Participants completed the
Eysenck Personality Questionnaire, Arabian Version of Five Personality Factor, and
Arabic Scale of Mental Health. They concluded that mental health was positively
correlated with extroversion, conscientiousness while negatively correlated with
neuroticism.
Univers
ity of
Mala
ya

56
Chapman, Weiss, Barrett, and Duberstein (2012) The structure of the Eysenck
Personality Inventory (EPI) is poorly understood, and applications have mostly been
limited to the scales of Neuroticism, Extraversion and Lie scales. Using a hierarchical
factoring procedure, we mapped the sequential differentiation of EPI scales from broad,
molar factors to more specific, molecular factors, in a UK population sample of over
6500 persons. Replicable facets at the lowest tier of Neuroticism included
oversensitivity, mood lability, nervous tension, and rumination. The lowest order set of
replicable Extraversion facets consisted of social dynamism, sociology, haste,
jocularity, communalism, and impulsivity. The Lie scale consisted of an interpersonal
virtue and a behavioural diligence facet. Users of the EPI may be well served in some
circumstances by considering its broad Neuroticism, Extraversion and Lie scales as
multifactorial, a feature that was explicitly incorporated into subsequent Eysenck
inventories and is consistent with another hierarchical trait. De Clercq and De Fruyt
(2012) conducted the review on the validation of Big Five personality dimensions and
its relevance to childhood background of personality psychopathology. They supported
that five-dimensional personality models are describing childhood‟s trait differences
and extend it into life spam personality difficulties. Furthermore, they suggested that
several childhood personality disorders may be predicted certain adulthood disorders.
Finally, they suggested that personality dimensions and pathology are standards tools
for measuring mental health in adulthood.
Garcia (2012) ) studied about the correlations of personality and mental health
on 109 high school students from Sweden. Participants were asked to complete surveys
of NEO Personality Inventory-Revised, Temperament and Character Inventory for
assessing personality dimensions, and the Positive Affect and Negative Affect Schedule
for assessing well-being. Participants were grouped by four categories based on their
Univers
ity of
Mala
ya
57
negative and positive affection. Self-actualizing (high PA and Low NA), high affection
(high PA and high NA), low affection (low PA and low NA), and self-destructive (low
PA and high NA). Their result showed that low level of negative effect was correlated
with the low level of neuroticism. Nevertheless, despite the experience of high NA
respectively, low PA, high and low affective reported higher Self-Directedness than
self-destructive adolescents.
Shirazi, Khan, and Ansari (2012) examined the relationships of personality and
mental health among 300 students from Aligarh Muslim University. Participants
completed the measures of Mental Health Inventory and NEO-FFI. Their result showed
that mental health and personality traits are significantly correlated. Mental health was
significantly predicted by agreeableness, neuroticism, and openness and there were no
significant differences between professional and non-professional mental health and
personality between both genders. Lamers, et al. (2012) examined the relationships of
psychopathology and positive mental health with personality in accordance with two
continua model on the sample of 1161 aged 18-88. Participants completed the measures
of personality by international personality item pool, psychopathology by brief
symptoms inventory (BSI), and positive mental health by mental health continuum-
short form (MHC-SF). Their result released that Neuroticism was shown to be the main
correlations psychopathology, whereas extroversion and agreeableness were associated
with positive mental health. Their result supported the tow continue model by showing
how personality traits are differently associated with psychopathology and positive
mental health.
Moshki, Atarodi, Moslem, and Taheri (2012) conducted the experimental study
to promote students mental health and self-esteem on 154 medical Iranian students.
Univers
ity of
Mala
ya
58
Students were randomly assigned into two groups and were asked to complete
Rosenberg self-esteem scale, GHQ-28, and enabling-reinforcing and predisposing
factors. Experimental group was trained based on PRECEDE model. Their result
indicated that health-promoting programs could improve student‟s mental health and
self-esteem. Moosavi, Ghotnian, and Torabzadeh (2012) studied the relations of
personality traits, mental health and emotional intelligence on 50 female undergraduate
students in Tehran. Participants completed the Big Five Personality Inventory (BFI),
Emotional Intelligence Questionnaire Times, and General Health Questionnaire. Their
funding indicated that there is a positive correlation between emotional intelligence and
mental health. Finally, Big Five personality factor, extraversion, and mental irritation
can predict 48 percentages of mental health and mental health can predict 61% of
emotional intelligence.
Hill and Needham (2013) examined three propositions that are widely (but not
universally) accepted in the gender and mental health literature. First, women and men
have similar or equal rates of overall psychopathology. Second, affective disorders like
anxiety and depression, which are more common among women, and behavioural
disorders like substance abuse and antisocial personality, which are more common
among men, are functionally equivalent indicators of misery. Finally, women are more
likely to respond to stressful conditions with affective disorders while men are more
likely to respond to stressful conditions with behavioural disorders. Our review of
previous research shows little to no consistent empirical support for any of these
propositions. Results from national studies of overall psychopathology or “any
disorder” are, at best, mixed and limited to a narrow range of mental health conditions.
Univers
ity of
Mala
ya

59
A comprehensive test of gender differences in overall psychopathology would
require a systematic and exhaustive examination of gender differences across the known
universe of mental health conditions, but this may be impossible to achieve due to a
lack of consensus on the universe, the proliferation of diagnostic categories, and the
tendency to anthologize the mental health of women. There is no empirical evidence to
suggest that women substitute affective disorders for behavioural disorders or that men
substitute behavioural disorders for affective disorders. There is no theory to suggest
that affective and behavioural disorders should be treated as comparable indicators of
misery. Some studies support the idea that women and men respond to stress in different
ways, but most do not. Numerous studies show that women and men respond to
stressors with higher levels of emotional distress, substance abuse, and antisocial
behaviour. They conclude with seven recommendations to advance theory and research
and several general reflections on the sociological study of gender and mental health.
The Concept of Imposter Personality Traits 2.6
The Impostor Phenomenon discovered and then named by two psychotherapists,
Dr. Pauline Rose Clance and Dr. Suzanne Imes, who were colleagues and researchers in
the Atlanta area in 1974. They began to see clients and students who were intelligent
and high-achieving, but who doubted their success and stressed about their abilities
(Clance, 1985). After years of counselling clients and researching this phenomenon,
Clance defined the typical "impostor" and created the Clance Impostor Phenomenon
Scale (CIP, 1985) that measures the intensity that an "impostor" could experience.
Surprisingly, as many as 70 percent of the population in general experience the
Impostor Phenomenon at some level in some circumstances (Clance, 1985).
Univers
ity of
Mala
ya

60
Although "impostors" come from different economic and social backgrounds,
from different fields, are at various levels of their careers, and have different talents and
abilities, they all have intense feelings that characterize this phenomenon. Impostors
believe they are intellectual frauds who have attained success because they were at the
right place at the right time, knew someone in power, or simply were hard workers,
never because they were talented or intelligent or deserved their positions (Pauline Rose
Clance, 1985). The so-called "impostors" have "done well in school, earned the correct
degrees, received awards and praise from their colleagues, and advanced rapidly in their
careers"(p. i). However, this has never been internalized. "Impostors" do not enjoy their
successes because they do not believe they deserve them. As a professor and practicing
psychotherapist at Georgia State University, Clance recognized the "impostor"
symptoms among her students, another faculty, and among the staff (Clance, 1985). The
early research done on this topic reveals 12 dissertations (published between 1979 and
1989), 11 articles (published between 1978 and 1989), and three books (Clance, 1985,
1986; Harvey, 1985).
2.6.1 The Imposter Components
There are six components of the Impostor Phenomenon according to Clance
(1985) that are described below. It is important to note that not all "impostors"
experience all of the components; however, the higher the score on the Clance Impostor
Phenomenon Scale (CIP), the more components one is likely to experience.
Treadmill experience: The first component is the impostor cycle which Clance
(1985) describes as a treadmill experience. The person is faced with a new challenge or
needs to perform and then experiences feelings of anxiety, self-doubt, and dread" (p.
Univers
ity of
Mala
ya

61
51). Her needs to do well trigger one of two automatic responses: she either
procrastinates or she digs in and does intense and prolonged hard work. Either way, she
suffers. She is constantly thinking, "How good am I really?" (p. 25). When the
challenge has passed, the "impostor" experiences only a brief time of relief and
happiness. "But the next time a similar situation arises, the whole vicious cycle is
repeated, and the success of the previous project is negated" (p. 26). Time after time the
"impostor" experiences the same pressure:
The need to be special, to be the very best: The second component of the
Impostor Phenomenon is "the need to be special, to be the very best" (Clance, 1985, p.
26). This stems from experiences in early childhood when she is the top performer. But
in later years when she cannot retain that position, she feels like a failure. The
"impostor" is not comforted by the fact that she is among the exceptional people in her
field, no longer the best.
Superwoman (and Superman) Complex: The third aspect of the Impostor
Phenomenon is referred to as the "Superwoman (and Superman) Complex" (Glance,
1985, p. 26). The "impostor" believes that she should be able to do anything attempted
with ease and with perfection. When this does not occur, she feels like a failure. This
impossible position often causes the "impostor" to feel overwhelmed.
The fear of failure: The fear of failure is the fourth component frequently
experienced by the “impostor" (Clance, 1985). In order to avoid this unpleasant
experience of failing, the “impostor" frequently goes to great lengths (by over-
preparing) to make sure that she doesn't make a public mistake. Shame and humiliation
are usually found at the root of this fear and are associated with early mistakes and less-
Univers
ity of
Mala
ya
62
than-top performance in childhood. It is interesting to note that the high goals set as an
adult are usually self-imposed, and only the “impostor” (p. 27) usually notices the
failures.
Impostors cannot or will not believe the evidence that they are indeed
intelligent and/or successful: Clance, in her counselling practice, saw examples of
people distorting and discounting praise they received which enabled them to continue
to believe that they were failures. This "denial of competence and discounting praise"
(p. 27), is the fifth component of the Impostor Phenomenon (Clance, 1985, p. 27).
Fear of and guilt about success: The last component listed by Clance (1985) is
the "fear of and guilt about success" (p. 27). Her research seemed to show that women
experience this aspect of the Impostor Phenomenon because they fear that their personal
success will interfere with their relationships with the men in their lives. Men
experience this aspect of the Impostor Phenomenon because they fear being seen as
more successful than their fathers do. Also, if "impostors" perceive "their successes as
atypical of their family, race, sex, or the region in which they live (they) may experience
guilt about those successes" (p. 28). In both cases, the fear is related to separation and
rejection. Another factor in this component is that "impostors" are afraid that success
may bring more responsibilities and that they will not be able to repeat their success in
subsequent tasks.
2.6.2 Description of the Imposter Personality Traits
This section briefly describes some of the features of persons experiencing
strong imposter feelings.
Univers
ity of
Mala
ya

63
1. The Impostor Cycle. The person faces an exam or project or task. She
experiences great doubt or fear. She questions whether or not she will
succeed this time. She may experience anxiety, psychosomatic symptoms,
nightmares, etc. She works hard and over-prepares, or, procrastinates and
then prepares in a frenzied manner. She succeeds and receives positive
feedback. The whole cycle is reinforced. She may have the superstitious
belief, "I must suffer in order to succeed." Doubting is reinforced (Clance
& Imes, 1978; Clance, 1985).
2. Introversion. Introverted persons are much more likely to have high IP
scores (Lawler, 1984).
3. The dread of Evaluation. She hypothesizes that others will know all that
she does not know.
4. Terror of Failure. She is very afraid of the shame and humiliation
associated with "looking foolish."
5. Guilt about Success. She handles this by denying her success.
6. Great Difficulty in Internalizing Positive Feedback. She has trouble
experiencing the excitement that comes with the acceptance of such
feedback. She avoids the excitement that would come if she accepted
praise. She has difficulty dealing with energy and excitement and is afraid
of the effects.
7. Generalized Anxiety.
8. Overestimating Others While Underestimating Oneself. She has a
tremendous respect for the intellect of others and a tendency to compare
her weaknesses with the strengths of others. Therefore, she undervalues
her own abilities and overestimates others' assets.
Univers
ity of
Mala
ya

64
9. Defining Intelligence in a Skewed Manner. She has many myths about
intelligence and what constitutes intelligence, and these usually work to
her detriment.
10. False and Non-affirming Family Messages. She has received messages
from her family that contradicts others' messages about her competence,
and her family has, subtly or overtly, refused to recognize her specific
assets (Clance & Imes, 1978; Grays, 1985).
2.6.3 Imposter Personality Traits and Gender
Pauline R Clance and Imes (1978b) The term impostor phenomenon is used to
designate an internal experience of intellectual phonies, which appears to be particularly
prevalent and intense among a select sample of high-achieving women. Certain early
family dynamics and later introjection of societal sex-role stereotyping appear to
contribute significantly to the development of the impostor phenomenon. Despite
outstanding academic and professional accomplishments, women who experience the
imposter phenomenon persists in believing that they are really not bright and have
fooled anyone who thinks otherwise.
Numerous achievements, which one might expect to provide ample object
evidence of superior intellectual, functioning, do not appear to affect the impostor
belief. Therapeutic approaches found to be effective in helping women change the
impostor self-concept. They describe what they refer to as "clinical symptoms" (p. 242)
and list them as: "generalized anxiety, lack of self-confidence, depression, and
frustration related to the inability to meet self-imposed standards of achievement" (p.
242). They draw from the work of Deaux (1976) for their understanding of attribution
Univers
ity of
Mala
ya

65
theory. This initial research seemed to indicate that women (unlike men) attributed their
success to luck or effort, not to their ability. September et al. (2001), examined the
correlations of six component of well-being with imposter phenomenon and gender
roles on 379 Canadian students. Participants completed Ryff‟s Scale of Psychological
Well-being, Clance Imposter Phenomenon Scale, and Personal Attributes
Questionnaire. Their results indicated that a higher instrumental trait is related to higher
well-being, the higher imposter is related to lower well-being in self-acceptance
component.
Lester and Moderski (1995) reported the association of imposter and
psychological disturbance on the sample of 233 high school student. Gender and age did
not show association with imposter score. They found that the imposter feeling was
related to a history of prior suicidal ideation and attempts, psychoticism, neuroticism,
irrational thinking, and manic and depressive tendencies as assessed with the Eysenck
Personality Questionnaire. L. N. McGregor, D. E. Gee, and K. E. Posey (2008)
examined the relationship of IP and depression on college students. Their result
indicated the positive correlation between IP and depression, woman score higher than
men did in term of IP. Are the negative thought patterns and self-doubt associated with
the Imposter Phenomenon similar to the negative thought patterns and self-doubt that
many individuals who have mild depression experience? If so, it is reasonable to believe
that a relation between depression and the Imposter Phenomenon (IP) exists. The
relation between the IP and depression among college students was examined. Results
of a Pearson product-moment correlation yielded a positive correlation between the IP
and BDI-II scores. Additionally, a Multivariate Analysis of Variance (MANOVA) using
the IP scores and BDI scores as the dependent variables, with sex serving as the
independent variable, revealed that men and women differ significantly on the
Univers
ity of
Mala
ya

66
combined dependent variables of IP and BDI scores. More specifically, the main effect
between sex and IP score indicates that women have higher IP scores man men.
However, the effect between sex and BDI was not statistically significant. Lastly, the
implications of these findings are discussed.
Jöstl, Bergsmann, Lüftenegger, Schober, and Spiel (2012) examined the
relationships between imposter phenomenon and self-efficacy on a sample of 631
Austrian Ph.D. students in German-speaking countries. Prevalence of imposter feeling
was almost high among students. An imposter feeling was higher whereas self-efficacy
was lower in women doctoral students than men. Furthermore, the impostor
phenomenon and research self-efficacy are associated with faculty membership. The
most important finding is that the impostor phenomenon is negatively related to
research self-efficacy. Research self-efficacy is an important indicator for successful
university careers; hence, the impostor phenomenon was shown to be a psychological
barrier for female university careers. Implications for support programs for female
doctoral students are discussed.
2.6.4 Imposter Personality Trait and Nationality/ Cultures
Cokley, McClain, Enciso, and Martinez (2013), founded that minority status
stress and impostor feelings were predictors of mental health. Impostor feelings were
stronger predictors of mental health than minority status stress. They examined
differences in minority status stress, impostor feelings, and mental health in a sample of
240 ethnic minority college students. African Americans reported higher minority status
stress than Asian Americans and Latino/an Americans whereas; Asian Americans
reported higher impostor feelings. Ross (2003) examined the relationship of imposter
Univers
ity of
Mala
ya

67
phenomenon and personality pathology by DSM-III-R on the sample of 177 DePauw
University undergraduate students. Participants completed the Harvey Imposter
Phenomenon Scale (HIP) and Schedule for maladaptive and adaptive Personality
(SNAP). The result indicated a positive relationship between IP and Neuroticism and
Extraversion.
2.6.5 Imposter Personality and FFM
Chae, Piedmont, Estadt, and Wicks (1995) studied the association of imposter
phenomenon (IP) with Big Five personality dimensions on 654 Korean samples from a
normal population of 4 major cities in Korea. Participant completed Clance Imposter
Phenomenon Scale (CIPS), Myers-Briggs Type Indicator (MBTI), and NEO Inventory
(NEO-FI-R). Their result indicated the correlation between imposters and introverted
type of personality on MBTI Inventory. The result of NEO revealed negative
correlations between imposters and high level of neuroticism, and low level of
conscientiousness, extroversion, and agreeableness. Bernard, Dollinger, and Ramaniah
(2002) studied the relationships of Big Five personality dimension with imposter
phenomenon among 190 (79 males and 111 females) college students. Participants
completed the measures of Clance Imposter Phenomenon Scale (Clance, 1985), the
NEO-PI-R, and the Perceived Fraudulence Scale. Their result indicated that high
neuroticism and low conscientiousness were the predictors of imposter feelings.
Furthermore, Depression, anxiety, perceived competence, and self-discipline were to
found be correlated with imposter feelings.
Univers
ity of
Mala
ya
68
2.6.6 Imposter Personality Traits and Mental Health
The term impostor phenomenon used to describe an internal experience of
intellectual phonies, which appears to be particularly prevalent and intense among a
select sample of high-achieving women. Certain early family dynamics and later
introjection of societal sex-role stereotyping appear to contribute significantly to the
development of the impostor phenomenon. Despite outstanding academic and
professional accomplishments, women who experience the imposter phenomenon
persists in believing that they are really not bright and have fooled anyone who thinks
otherwise. Numerous achievements, which one might expect to provide ample object
evidence of superior intellectual, functioning, do not appear to affect the impostor belief
(Pauline R Clance & Imes, 1978b). Most Impostors are able to fulfill their academic or
work requirements despite their self-perceived fraudulence. It is possible that
subclinical symptoms resulting from impostor fears can, if prolonged, lead to clinical
levels of depression or anxiety. A greater understanding of the factors contributing to
impostors and its consequences may lead to effective interventions that reduce
psychological distress. (Sakulku, 2011)
(Ives, 2010) investigated the IP and anxiety and their interrelationships. Findings
from this research study indicated that students who feel they are imposters might not
be achieving to their full potential and capability. Implications for social change include
useful knowledge for educators and administrators who can design orientation programs
to reduce IP and anxiety, which could potentially lead to both increased retention and
completion rates, and ensure student success. Sonnak and Towell (2001) investigated
the relationships of parental rearing style, parental background, self-esteem, mental
health with imposter phenomenon on a sample of 107 undergraduate students.
Univers
ity of
Mala
ya

69
Participants completed Clance IP Scale (imposter phenomenon), Parental Bonding
Instrument (parental rearing style), Rosenberg Self-esteem Scale (self-esteem), General
Health Questionnaire 12 (mental health), student demographic and parental background
information, and academic outcomes. Regression analysis indicated that parental control
and low self-esteem are the significant predictors of an imposter, whereas parental care,
parental education and occupation level, subject‟s demographic information and mental
health are not the significant predictors of an imposter. Moreover, posthoc regression
analysis revealed that lower parental care and poor mental health are positively
associated with high level of an imposter. In addition, they concluded that participants
who diagnosed as imposters have reported poorer mental health in compare with non-
imposters. They have concluded that imposters are suffering from low mental health.
High score in IP is experiencing higher levels of anxiety, fear, doubt, and
psychosomatic symptoms. Moreover, they are more introverted, sensitive to evaluation,
and fear of failure. Henning, Ey, and Shaw (1998) investigated about psychopathology,
perfectionism, and imposter feeling on 477 medicine student. .Perfectionism and
imposter phenomenon are set of personality traits that are at risk of high anxiety and
depression. Imposter phenomenon refers to high achieving individuals who consistently
doubt their ability and success and afraid of being discovered by phoniness and fraud.
Their result revealed that 27.5 percentages of students were experiencing a high level of
psychological distress. Moreover, Psychological distress, perfectionism, and imposter
feelings were reported to be strongly associated.
Kumar and Jagacinski (2006) investigated the relationship of imposter and
achievement goals on 135 college students. Participants completed the Clance
Phenomenon Scale and relevant achievement goal measures. Both imposter fears and
ability-avoid achievement goals were positively related to test anxiety and negatively
Univers
ity of
Mala
ya
70
related to confidence in one's intelligence. Women expressed greater imposter fears than
men and were also higher on ability-avoid goals. Using hierarchical regression, we
examined the pattern of achievement goals that related to imposter fears for men and
women. Among men, imposter fears were primarily associated with ability-avoid goals.
In contrast, among women, imposter fears were positively related to ability-approach
goals and negatively related to task goals. Further, among women, but not men,
endorsement of an entity theory of intelligence was associated with imposter fears.
Cromwell et al. (1990) investigated the IP among 104 honored high school students.
They found out that around 20 % of student shown a high level of IP. The Impostor
Phenomenon (IP) has been identified as a contributor to distress in some high-achieving
individuals. In spite of evidence to the contrary, these individuals do not accept their abilities
and achievements but believe that the approval and recognition they receive are a fluke and
undeserved. Thus, they agonize and fear to the point where they manifest clinical symptoms.
This study determined if the IP was manifested in 104 honors English high school students.
Results show that the IP was present in 21 School students (impostors) and absent in 83
School students (nonimpostors). Discriminant analysis on the Adjective Checklist (ACL)
and Irrational Beliefs tests showed that 75% of the School students were correctly classified
on the basis of personality characteristics. Regression analysis showed that the Adapted
Child scale on the ACL accounted for 29% of the variance.
Ross et al. (2001), investigated the associations of imposter phenomenon, Big
Five personality traits, and achievement disposition on 129 college students. Their result
indicated that imposter is related to all aspects of achievement. Neuroticism was positively
associated with an imposter while extroversion and conscientiousness were
Univers
ity of
Mala
ya
71
negatively associated with an imposter. In multiple regressions, they found that
neuroticism is a significant predictor of imposter score. Finally, they reported that
depression and self-consciousness were a significant predictors of neuroticism.
Bernard et al. (2002) studied the relationships of Big Five personality dimension
with imposter phenomenon among 190 (79 males and 111 females) college students.
Participants completed the measures of Clance Imposter Phenomenon Scale, the NEO-
PI-R, and the Perceived Fraudulence Scale. Their result indicated that high neuroticism
and low conscientiousness were the predictors of imposter feelings. Furthermore,
Depression, anxiety, perceived competence, and self-discipline were to found be
correlated with imposter feelings.
Machiavellian Personality Traits 2.7
Early in the 16th century, Niccolo Machiavelli acted as chief political advisor to
the ruling Medici family in Florence, Italy. The details of his counsel are well known
because Machiavelli laid them out for posterity in his 1513 book, The Prince. The gist
of his advice for maintaining political control is captured in the phrase "the end justifies
the means." According to Machiavelli, a ruler with a clear agenda should be open to any
and all effective tactics, including manipulative interpersonal strategies such as flattery
and lying. Richard Christie noticed that Machiavelli's political strategies had parallels in
people's everyday social behaviour. Christie and his colleagues at Columbia University
identified a corresponding personality syndrome, which they dubbed Machiavellianism.
The label was chosen to capture a duplicitous interpersonal style assumed to emerge
from a broader network of cynical beliefs and pragmatic morality. Christie applied his
psychometric expertise to develop a series of questionnaires designed to tap individual
Univers
ity of
Mala
ya

72
differences in Machiavellianism. Those questionnaires, along with the research
supporting their construct validity, were presented in Christie and Geis's (2013) book,
Studies in Machiavellianism. Of these measures, by far the most popular has been the
Mach IV. Used in more than 2,000 cited studies, the scale has proved valuable in
studying manipulative tendencies among student, community, and worker samples. The
follow-up version, Mach V, was designed as an improvement but, in the end, raised
more problems than it solved.
2.7.1 History and Characteristics of Machiavellian
Social psychologist Richard Christie (1970) was the first to examine the
personality construct of Machiavellianism. The construct grew from his interest in the
unique personality characteristics of individuals who successfully apply manipulative
tactics to acquire political prominence or other forms of social power. Since the use of
such power tactics has a historical association with the sixteenth-century Florentine
philosopher Niccoló Machiavelli, who wrote on the subject in several classic works, the
construct came to be named in his honor. The Machiavellianism literature has accrued a
substantial body of research to confirm and support the original conceptualization of the
construct (R Christie & F Geis, 1970; Ickes, Reidhead, & Patterson, 1986). This
behavioural data reveals a clearer picture of the social, behavioural, and personality
dimensions of Machiavellianism. Based on the working with colleagues in the political
sciences, Christie conceptualized the Machiavellian individual as having the following
personality characteristics.
The relative lack of affect in interpersonal relationships: Since the
Machiavellian individual frequently seeks to manipulate others for his or her own gain,
Univers
ity of
Mala
ya

73
genuine empathy and emotional attachment are not necessary for, and may be
counterproductive to, the achievement of these goals. Interpersonal relationships for the
Machiavellian individual are focused more upon their usefulness for achieving self-
interested goals like power or social advancement, and less focused upon intrinsic
rewards such as intimacy or emotional expression. The Machiavellian individual may
appear to be engaged in relationships with others, but this is often only a superficial act
designed to achieve a more tangible goal (Christie, 1970).
Lack of concern with conventional morality: Machiavellian individuals take a
pragmatic view of morality and do not base their behaviour on abstract notions of right
and wrong. Commonly accepted moral and social values are disregarded when they
prohibit actions seen as necessary for goal attainment. Instead, Machiavellian
individuals take effectiveness in producing desired results as the standard of value when
judging the proper course of action to take in a given situation (Christie, 1970).
Low ideological commitment: Machiavellians act in a utilitarian, self-
interested manner. In order to preserve the greatest number of options for personal
advancement, the Machiavellian individual does not tend to limit themselves with a
lasting commitment to a particular group, government, or system of belief. Although a
Machiavellian may outwardly profess belief in a certain ideology, he or she will
maintain the capacity to separate ideological behaviours and goals from personal ones
and will choose the personal over the ideological when the two diverge (Christie, 1970).
Self-focused orientation: Ickes et al. (1986) videotaped pairs of participants in
an unstructured interaction and used independent raters totally personal pronoun usage
in their conversations. They discovered that Machiavellianism was positively associated
with increased usage of self-focused first-person pronouns and decreased usage of
Univers
ity of
Mala
ya

74
other-focused second and third-person singular pronouns in conversation. From these
results, the researchers concluded that Machiavellians in social interactions tend to
direct attention and interest toward the self, rather than towards partners. This finding is
in line with Christie‟s (1970) conceptualization of the Machiavellian as primarily
committed to personal goals and interests.
Attitude towards social norms: Geis (1970) had subjects participate in a board-
game activity in which three players competed to be the first to get their token to the
end of a series of spaces. The players in the game were permitted to form coalitions
with one another, which could be entered into, and broken at will. While in a coalition,
two members played as a pair and could advance their tokens further during each turn.
However, if the coalition was still intact when the participants reached the final space,
the members were required to split the “points” awarded as a prize. Geis found that
individuals who scored highly on a measure of Machiavellianism (referred to as higher-
Machs) achieved disproportionate success in the game by forming coalitions and
manipulating them to personal advantage. Geis noted that players often made offers of a
coalition to others on the condition that the other player promises not to break the
coalition.
In every instance when a higher-Mach player required this promise of a partner,
the higher-Mach went on to later break the coalition. By contrast, none of the lower-
Mach players who required partners to promise not to break the coalition went on to
break it themselves. From this, Geis (1970) concluded that lower-Machs assume that
unspoken social norms of reciprocity imply that a promise obligates the person who
requests it as well as the person who assents; while higher-Machs treat unspoken
assumptions as nonbinding and use them as a loophole to gain strategic advantage.
Univers
ity of
Mala
ya

75
Use of social influence: varieties of experimental tasks have shown
Machiavellianism to be associated with the effective use of social influence. Higher
Machs have been shown to perform better than lower Machs in tasks such as:
convincing others to support controversial political “bills” in a game based on
legislative negotiation (Geis, Wenheimer, & Berger, 1970), bargaining for a sum of
money (Christie & Geis, 1970), creating alliances to win a board game (Geis, 1970),
maintaining eye contact while lying (Exline, Thibaut, Hickey, & Gumpert, 1970), and
covertly distracting and confusing others while administering an activity (Geis, Christie,
& Nelson, 1970). The Machiavellianism literature presents a compelling pattern of
results to support the idea that higher Machs understand the dynamics of social
influence and use this knowledge to their advantage.
Correlations with intelligence and success: In a review of the Machiavellian
literature, Wilson, Near, and Miller (1996) noted that nine studies have been performed
attempting to relate Machiavellianism to various measures of intelligence, and all have
failed to find a correlation. The authors describe the lack of connection between
Machiavellianism and intelligence as being one of the most consistent findings in the
Machiavellianism literature. The authors go on to find a similar lack of empirical
support across various studies for the notion that Machiavellians attain more
occupational success, noting that the only job-related outcome that the construct seems
to consistently predict is lower job satisfaction in a variety of occupations, such as
stockbroker and real estate agent.
In a study of Machiavellianism, intelligence, and social mobility, Touhey (1973)
replicated findings that Machiavellianism is uncorrelated with intelligence and social
success. However, he found additional evidence suggesting that Machiavellianism may serve
Univers
ity of
Mala
ya
76
as a moderator between social mobility and intelligence as measured by IQ score.
Specifically, subjects with high IQ scores and high Mach scores were found to have
greater upward mobility in terms of socioeconomic status relative to the previous
generation than those with high IQs and low Mach scores. For low IQ subjects,
however, higher Mach scores were associated with lower social mobility in comparison
to low Mach scores. The author interpreted these results as suggesting that the social
advantages that one may gain from Machiavellianism are highly dependent on
intelligence.
2.7.2 Machiavellian Personality Traits and Gender
Richmond (2001) studied about ethical dilemmas among 68 undergraduate
accounting students. Participants completed the measure of Mach IV scale to measure
moral behaviour and Defining Issues Test to measure accounting students‟ ethical
reasoning processes. Sixty-eight undergraduate accounting students were participated to
examine three hypotheses. Literature suggests that individuals with lower ethical
reasoning levels are more likely to agree with unethical behaviour. Therefore,
hypothesis one investigated the relationship between ethical reasoning and ethical
decision-making. Literature also suggests that individuals agreeing with Machiavellian
statements are more likely to agree with questionable activities. Hypothesis 2
investigated the relationship between Machiavellian behaviour and ethical decision-
making. Prior gender literature suggests that gender influences ethical decision making,
with females being more ethical than males. Therefore, hypothesis three examined
whether female accounting students agree less with questionable activities compared to
males. Results indicate that ethical reasoning is significantly correlated with students‟
ethical ratings on the business vignettes. Similarly, the Machiavellian behaviour is
Univers
ity of
Mala
ya
77
significantly correlated with students‟ ethical ratings. Consistent with prior gender
literature, females agree less with questionable activities compared to male accounting
students.
2.7.3 Machiavellian Personality Traits and Big Five
Paulhus and Williams (2002) studied on three non-pathological personalities
(Dark Triad personalities) included Machiavellianism, subclinical narcissism, and
subclinical psychopathy in a sample of 245 undergraduate psychology students which
65% were female. They examined Big Five personality dimension together with other
personality characteristics. For that, participants were asked to fill up inventory
packages included Mach-IV inventory (Machiavellian trend), SRP III (subclinical
Psychopathy), NPI (narcissism), and BFI (Big five inventory which has 44 item
questionnaire designed to measure extroversion, agreeableness, conscientiousness,
neuroticism, and openness ). Male scored significantly higher on all three personality
types. Agreeableness showed correlations with narcissism, Machiavellianism, and
psychopathy. Machiavellians and psychopaths had a low score on conscientiousness.
Philip A. Vernon a and Leanne C. Vickers a (2007) studied the relationship of
behavioural genetic of three Dark Triad (narcissism, Machiavellianism, and
psychopathy) and Big 5 personality on 278 adult twins. Participant completed measures
of Dark Triad Mach-IV inventory (Machiavellian trend), SRP III (subclinical
Psychopathy), NPI (narcissism) and big five (NEO-PI-R). Their result showed that
Machiavellianism correlates negatively with agreeableness and conscientiousness and
positively correlated with neuroticism.
Univers
ity of
Mala
ya
78
Austin, Farrelly, Black, and Moore (2007) examined the associations between
Machiavellianism (Mach) and emotional manipulation with personality dimensions on
the samples of 199 Edinburg University‟s students. They found, that Mach is negatively
correlated with agreeableness and conscientiousness, but positively correlated with
emotional manipulation. The strongest associations between Mach and personality are
negative correlations with Agreeableness and Conscientiousness. Jakobwitz and Egan
(2006), investigated the Dark Triad personality traits on the sample of 82 individual
from a general population with snowball sampling system. Subjects completed NEO-
FFI-R, MACH-IV, LSRP, and NPI inventories. Researchers measured the relationship
between dark triad and Big Five personality dimensions. Their result indicated that
Machiavellianism is associated with a moderate level of neuroticism, and low levels of
conscientiousness.
Lee and Ashton (2005), investigated the associations of dark triad personality
traits with Five Factor model of personality and HEXACO model of personality
structure on 164 undergraduate students. Their result showed the negative correlation
between dark triad and an honesty-humility factor of HEXACO personality structure
and moderate negative correlations between Big Five Agreeableness and Machiavellianism.
2.7.4 Machiavellian Personality Traits and Mental Health
Nigro and Galli (1985) investigated the associations of Machiavellian and
personality. One hundred and thirty Italian undergraduates‟ students responded to the
Italian version of Christ Mach IV scale and the Italian version of Trait Anxiety
Inventory. A positive correlation between Mach score and both states of anxiety and
trait anxiety were found in both sexes. They hypothesized that moderate anxiety may be
Univers
ity of
Mala
ya

79
associated with high Machiavellian. O'Boyle et al. (2012) reviewed studies of the Dark
Triad (DT) personality traits and meta-analytically examined their implications for job
performance and counterproductive work behavior (CWB). Relations among the DT
traits and behaviors were extracted from original reports published between 1951 and
2011 of 245 independent samples (N = 43,907). We found that reductions in the quality
of job performance were consistently associated with increases in Machiavellianism and
psychopathy and that CWB was associated with increases in all 3 components of the
DT, but that these associations were moderated by such contextual factors as authority
and culture. Multivariate analyses demonstrated that the DT explains moderate amounts
of the variance in counterproductivity, but not job performance. The results showed that
the 3 traits are positively related to one another but are sufficiently distinctive to warrant
theoretical and empirical partitioning. Jonason and Tost (2010) investigated the Dark
Triad personality traits within life history theory. Participants were two hundred and
fifty-nine psychology students. This result indicated that Psychopathy and
Machiavellianism are associated with low self-control, a tendency to discount future
consequences, and attention deficit disorder which are characteristic of impulsivity.
Beverly Fehr, Samsom, and Paulhus (1992) reviewed the literature on Machiavellianism
from 1971 to 1987 and they found that Machiavellianism was consistently associated
with anxiety. Nigro and Galli (1985) reported that Machiavellianism was positively
associated with both trait and state anxiety, which suggests that these individuals are not
only inherently more anxious but are also more likely to experience anxiety when
presented with psychologically stressful situations.
John W McHoskey (1999) reported that Machiavellianism was negatively
associated with self-reports of subjective well-being.Latorre and McLeoad (1978) found
no clear link between Machiavellianism and depression. Together, these findings
Univers
ity of
Mala
ya
80
suggest that Machiavellians can be generally psychologically stable individuals who
nevertheless may be dissatisfied with their accomplishments, prone to high anxiety, and
oftentimes disconnected from their emotions in ways that greatly compromise their
overall well-being. Skinner (1982) demonstrated that Machiavellians do not significantly
differ from non-Machiavellians in their level of neuroticism, psychoticism, or
occupational, home, health, and emotional adjustment. (Austin et al. (2007); Dahling,
Whitaker, and Levy (2009); Jones and Paulhus (2009)) also indicates a negative
relationship between Machiavellianism and self-esteem, which may be related to
research showing that Machiavellianism is distinct from other traits such as emotional
intelligence, cognitive, and social skills. McHoskey (1999) examined self-report
relations between Machiavellianism and measures related to adjustment, well-being,
and ethical orientations. Their result indicated that Machiavellian is inversely associated
with self-esteem, subjective well-being, and hope but positively associated with
powerlessness and nihilism.
Structural Equation Modelling (SEM) 2.8
Structural equation modeling (SEM), also known as path analysis with latent
variables, is now a regularly used method for representing dependency (arguably causal)
relations in multivariate data in the behavioural and social sciences (Tomarken &
Waller, 2005). In many instances, researchers are interested in variables that cannot be
directly observed, such as achievement, intelligence, or beliefs. In research
methodology, authors use terms such as latent variables or factors to describe
unobserved variables. They attempt to gain information about latent factors through
observable variables. Factor analysis (exploratory and confirmatory) and structural
equation modeling (SEM) are statistical techniques that one can use to reduce the
Univers
ity of
Mala
ya
81
number of observed variables into a smaller number of latent variables by examining
the covariation among the observed variables (Schreiber, Nora, Stage, Barlow, & King,
2006).
SEM has been described as a combination of exploratory factor analysis and
multiple regression (Ullman & Bentler, 2003). It used to think of SEM as CFA and
multiple regressions because SEM is more of a confirmatory technique, but it also can
be used for exploratory purposes. SEM, in comparison with CFA, extends the
possibility of relationships among the latent variables and encompasses two
components: (a) a measurement model (essentially the CFA) and (b) a structural model.
SEM, in comparison with CFA, extends the possibility of relationships among the latent
variables and encompasses two components: (a) a measurement model (essentially the
CFA) and (b) a structural model. In addition to the new terms, measurement and
structural, two other terms are associated with SEM: exogenous, similar to independent
variables and endogenous, similar to dependent or outcome variables. The measurement
model of SEM is the CFA and depicts the pattern of observed variables for those latent
constructs in the hypothesized model. A major component of a CFA is the test of the
reliability of the observed variables. Exogenous and endogenous variables can be
observed or unobserved, depending on the model being tested. Within the context of
structural modelling, exogenous variables represent those constructs that exert an
influence on other constructs under study and are not influenced by other factors in the
quantitative model. Those constructs identified as endogenous are affected by
exogenous and other endogenous variables in the model.
The measurement model of SEM is the CFA and depicts the pattern of observed
variables for those latent constructs in the hypothesized model. A major component of a
Univers
ity of
Mala
ya

82
CFA is the test of the reliability of the observed variables. Moreover, researchers also
use the measurement model to examine the extent of interrelationships and covariation
(or lack thereof) among the latent constructs. In sum, SEM allows researchers to test
theoretical propositions regarding how constructs are theoretically linked and the
directionality of significant relationships. In general, the authors prefer the TLI, CFI,
and RMSEA for one-time analyses. When modifications are made to the model after an
initial analysis or multiple models are tested, one should use different indexes that are
discussed in the following paragraphs.
2.8.1 Measurement Model of the NEO-FFI
In an investigation conducted by Gignac, Bates, and Jang (2007) NEO-FFI was
evaluated in three stages analyses process. First, each of the five dimensions of the five
dimensions of the NEO-FFI was modeled, individually, as single-factor models. Next,
within each single-factor model, correlated residuals were added to the model successively,
based on the modification indices (i.e., Lagrange multiplier), until both the TLI and CFI for
each dimension tested individually achieved an approximate value of .950 which is
considered to be an indication of adequate model fit. Finally, for the purposes of evaluating
the replicability of the correlated errors, the models identified within the satisfactory-fitting
conditions (sample one) were re-test. A correlated residual was considered replicated if it
was observed to be statistically significant and in the same direction within both sample
solutions. Further, theme an absolute difference between the respective residuals was also
calculated. All models were identified/scaled by constraining the latent variable variance to
1.0 and tested via AMOS 5.0. (Chamorro-Premuzic, Swami, Furnham, & Maakip, 2009)
SEM via AMOS 4.0was used to test the overall fit and specific parameters specified in the
hypothesized model. This model
Univers
ity of
Mala
ya

83
included the Big Five traits as exogenous variables, enabling Neuroticism to correlate
with Extraversion, Extraversion to correlate with Openness to Experience, and
Agreeableness, Conscientiousness, and Neuroticism to correlate with each other.
2.8.2 Measurement Model of the Imposter Phenomenon
The CIPS (Pauline Rose Clance, 1985) was used to measure the level of
imposter feelings. The CIPS is a 20-item, self-report instrument that measures fear of
evaluation, feeling less capable than peers, fear that success cannot be repeated, feelings
of inadequacy, and self-monitoring behaviours. CIPS items are anchored with a Likert
scale with a 1 (not at all true) to 5 (very true) response ranges. Items on the CIPS
include: “I can give the impression that I‟m more competent than I really am,” and “At
times, I feel my success has been due to some kind of luck.” Factor analysis of the CIPS
resulted in three factors: Fake, Discount, and Luck (Chrisman, Pieper, Clance, Holland,
& Glickauf-Hughes, 1995). The first factor, Fake, included items related to self-doubt
and concerns about intellect and abilities. Discount included items related to fear of
evaluation and difficulty accepting success. Luck, the third factor, included items
related to beliefs that successful performances were due to chance or erroneous
evaluation. Fake accounted for the greatest percentage of variance in the CIPS (38.5%)
while Discount accounted for 9.2% of variance and Luck accounted for 7.2%.
Chrisman et al. (1995) reported that the results of the factor analysis were consistent
with those found in an unpublished study by Kertay, Clance, and Holland (1991)
providing preliminary support for the construct validity of the CIPS by validating its
stable structure. French, Ullrich-French, and Follman (2008) conducted a confirmatory
factor analysis and found that responses that loaded onto the Fake and Discount
subscales were correlated. A two-factor model that combined Fake and Discount had a
Univers
ity of
Mala
ya
84
comparable fit to the three-factor model. They noted that the three-factor model fits the
data well and called it “theoretically preferred” (p. 1274). French et al. considered the
two-factor model, described as one factor made up of Fake and Discount combined and
a second factor made up of Luck, most parsimonious.
2.8.3 Measurement Model of the Mach IV
The development of instruments to measure Machiavellianism by the original
author went through several phases (Richard Christie & F Geis, 1970) ending in two
different versions of the Mach scale. The Mach IV is made up of 20 items, from an
original pool of 71. These items were selected by counterbalancing the wording of the
items, content variety, and discriminatory power From These 20 items, 10 related to
Machiavellianism and the other 10 to non-Machiavellianism. When the Mach IV was
developed, it was classified the items into the above-mentioned three categories:
Interpersonal Tactics, Cynical View of Human Nature, and Disregard for Conventional
Morality. The last category has the fewest items because “Machiavelli was less
concerned with abstractions and ethical judgments than with pragmatic advice”
(Christie, 197Gb, p. 14). Actually, the Mach IV scale has only two items in this
category and one of them (item 19) has been dropped in studies because of poor
psychometric properties.
In consequence, several studies show Disregard for Conventional Morality as
the least reliable subscale of the Mach IV, with the most complex factor loadings. The
other two factors, Tactics and Views, are generally supported by various studies,
although this is masked by the tendency of positively and negatively worded items to
load on separate factors (Ahmed & Stewart, 1981; Hunter, Gerbing, & Boster, 1982).
Univers
ity of
Mala
ya

85
Beverley Fehr and Samsom (2013), after carrying out a comprehensive review of the
literature, recommended using the Mach IV scale and scoring the subfactors (Tactics
and Cynicism) (Beverley Fehr & Samsom, 2013) separately. Corzine (1997) revised
several studies on the dimensionality of the Mach IV and concluded that the different
factor structures found in the literature indicate that further investigation of
measurement issues in Machiavellianism is warranted.
Calvete and Corral (2000), evaluated the Mach IV confirmatory factor analysis
within the context of Spanish sample. The Machiavellianism as a four-factor structure is
consisting of Positive Interpersonal Tactics, Negative Interpersonal Tactics, Positive
View of Human Nature, and Cynical View of Human Nature. In all the models, the
factor loading matrix was full and fixed (LX). Each item had a nonzero loading on the
latent variable that it was designed to measure, and zero loading on the other factors.
The factor correlation matrix (PH) was symmetrical, with all coefficients freely
estimated, thereby indicating that the factors were correlated. The error variance-
covariance matrix (TD) was symmetrical, with diagonal elements free and off-diagonal
elements fixed at zero. The measurement model specifies the pattern by which each
item loads on a particular factor.
The regression coefficient represents the magnitude of expected change in the
items for every change in the related latent factor. The Theta-Delta coefficient
represents the random measurement error. AII the Lambda-X coefficients were
statistically different from zero (t-value >±1.96) both in the total sample and in the
female sample. The alpha coefficient for the Mach IV scale was .70, with the following
values for the subscales: .50, .53, .62, and .40for Positive View of Human Nature,
Univers
ity of
Mala
ya

86
Cynical View of Human Nature, and Positive Interpersonal Tactics, and Negative
Interpersonal Tactics, respectively.
2.8.4 Measurement Model of the GHQ-28
General health questionnaire (D. Goldberg, 1978) was developed as a self-
administered screening instrument to diagnose early psychological distress in primary
care settings. The GHQ-28 has been widely used for other purposes, such as measuring
the change in symptomatology over time (Ormel, Koeter, Brink, & Giel, 1989). The
GHQ-28 comprises 28 items that form four subscales, namely, Somatic Symptoms,
Anxiety and Insomnia, Social Dysfunction, and Severe Depression (D. P. Goldberg &
Hillier, 1979).
The GHQ-28 shows comparable indices of validity and discriminative power,
accompanied by the advantage of being shorter and easy to fill out (Lobo, Pérez-
Echeverría, & Artal, 1986) than longer versions. Although the GHQ was developed in
the in English, there have been many applications and translations into other languages.
Various studies have sought evidence of reliability and measurement validity of the
GHQ, most of which confirmed the GHQ-28 as a reliable and valid measure of
psychological distress within various cultural contexts (Kalliath, O'Driscoll, & Brough,
2004). Most research on the factorial structure of the GHQ-28 in other national samples
has confirmed the original four-factor solution with the Severe Depression and Social
Dysfunction subscales showing the greatest stability (Werneke, Goldberg, Yalcin, &
Üstün, 2000).
Univers
ity of
Mala
ya
87
Kock, Görgens-Ekermans, and Dhladhla (2014) investigated the psychometric
properties and factor structure of the GHQ-28 within a nonclinical African sample of
adults employed in the South African military. The factor structures of the GHQ-28
were examined with confirmatory factor analysis (CFA) via LISREL 8.8 (Joreskog &
Sorbom, 2004). Earlier models were suggested a four-factor model (D. P. Goldberg &
Hillier, 1979). The authors utilized a split-sample approach and used the results of the
single-group CFAs to determine the best-fitting baseline model for conducting cross-
validation. Cross-validation measurement invariance tests were conducted with multi-
group CFA (MGCFA) to provide a second confirmation of the model with the best
generalization potential (Hair, 2010).
The following series of tests were conducted with MGCFA: loose cross-
validation (single-group CFAs on both samples), factor structure equivalence, metric
invariance, scalar invariance, error variance invariance (Vandenberg & Lance, 2000),
and full/complete invariance. The model exhibited very good fit based on the root mean
square error of approximation (RMSEA), Nonnormed Fit Index (NNFI), Comparative
Fit Index (CFI), and standardized root mean residual (SRMR) values. The cut-off
criteria were liberally exceeded (i.e. RMSEA < .07, CFI/NNFI > .92, SRMR< .08).
Chapter Summary 2.9
Student mental health issues and the outcome of poor mental health have been
reviewed by studying previous reports outcome. It was concluded that student‟s mental
health issues are in continues increment in the past two decades. Moreover, the severe
mental health issues could result in undesirable consequences for student life. These
consequences are varying according to the mental health state ranging from poor
Univers
ity of
Mala
ya

88
academic achievements to commit a crime. Therefore, student‟s mental health
evaluation must be given a high consecration from the educational authorities as well as
from the researchers who work in this field.
On the other hand, the correlation of mental health with different personality
traits have been reviewed. A large connection between personality and mental health
has been reported. However, there was no effort to employ this connection to develop a
single tool that can evaluate student mental health as well as student‟s personality traits.
Therefore, the personality traits namely: big five, imposter and Machiavellian
personality have been selected to be the main objectives of this research in an attempt to
develop a new tool.
Univers
ity of
Mala
ya
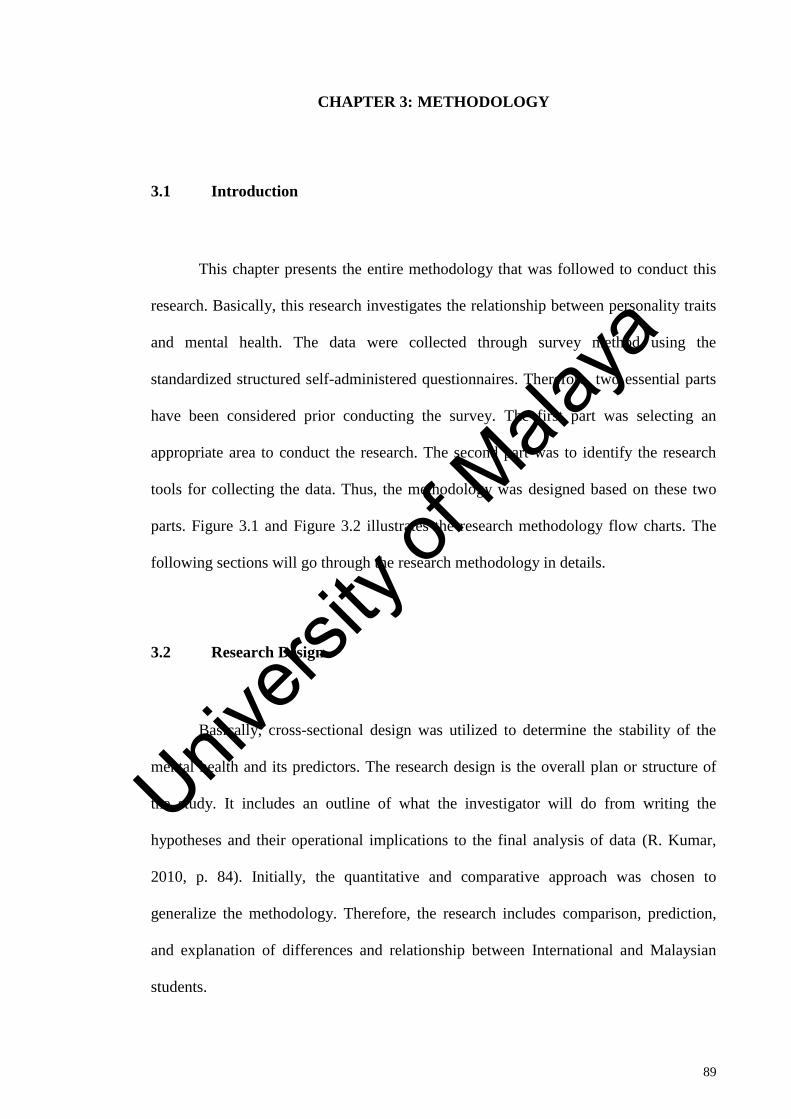
89
METHODOLOGY CHAPTER 3:
Introduction 3.1
This chapter presents the entire methodology that was followed to conduct this
research. Basically, this research investigates the relationship between personality traits
and mental health. The data were collected through survey method using the
standardized structured self-administered questionnaires. Therefore, two essential parts
have been considered prior conducting the survey. The first part was selecting an
appropriate area to conduct the research. The second part was to identify the research
tools for collecting the data. Thus, the methodology was designed based on these two
parts. Figure 3.1 and Figure 3.2 illustrates the research methodology flow charts. The
following sections will go through the research methodology in details.
Research Design 3.2
Basically, cross-sectional design was utilized to determine the stability of the
mental health and its predictors. The research design is the overall plan or structure of
the study. It includes an outline of what the investigator will do from writing the
hypotheses and their operational implications to the final analysis of data (R. Kumar,
2010, p. 84). Initially, the quantitative and comparative approach was chosen to
generalize the methodology. Therefore, the research includes comparison, prediction,
and explanation of differences and relationship between International and Malaysian
students.
Univers
ity of
Mala
ya
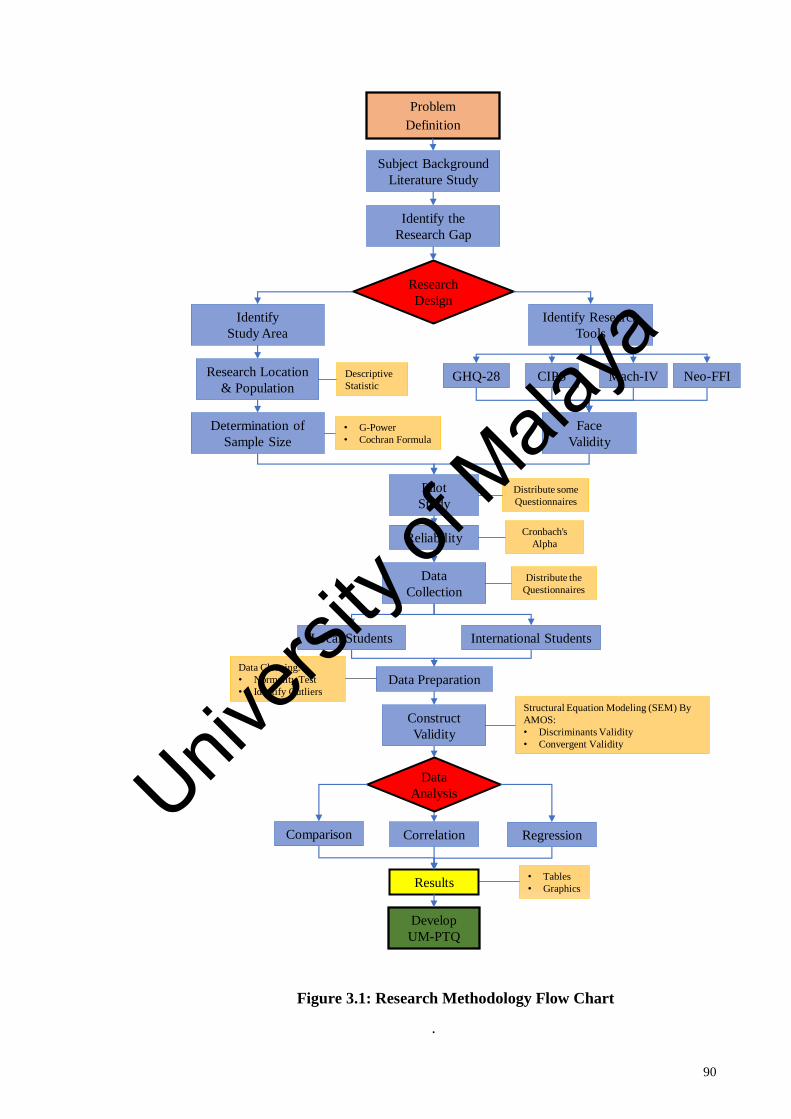
90
Research
Design
Subject Background
Literature Study
Identify the
Research Gap
Identify Research
Tools
Identify
Study Area
Mach-IVResearch Location
& Population
Pilot
Study
Problem
Definition
Data Preparation
Face
Validity
Construct
Validity
Correlation
Results
Determination of
Sample Size
Develop
UM-PTQ
Distribute some
Questionnaires
Data Cleaning:
• Normality Test
• Identify Outliers
Data
Collection
Comparison
Structural Equation Modeling (SEM) By
AMOS:
• Discriminants Validity
• Convergent Validity
CIPSGHQ-28 Neo-FFI
• G-Power
• Cochran Formula
Descriptive
Statistic
Distribute the
Questionnaires
ReliabilityCronbach's
Alpha
Regression
Data
Analysis
• Tables
• Graphics
International StudentsLocal Students
Figure 3.1: Research Methodology Flow Chart
.
Univers
ity of
Mala
ya

91
Figure 3.2: Research Developed Tool Flow Chart
Conventional Personality Traits Tools
Machiavellianism Questionnaires
(Mach-IV)
Clance Imposter Phenomenon Scale
(CIPS)
Neo Five-Factors Inventory
(NEO-FFI)
The Selected
Research Tools
Finalize University of Malaya Personality Trait Questionnaire
(UM-PTQ)
Exploratory
Factor Analysis
Standardized Regression Weights (Loading Factors)
Structural Equation Modeling
(SEM) By AMOS:
• Measurement Model
Shortened Personality Traits Questionnaire
According to the
Highest Loading
Factors
Pilot StudyDistribute
Questionnaires
ReliabilityCronbach's
Alpha
Construct ValidityNew Tool
Develop UM-PTQ Procedure
Modify the Shortened Questions
Panel of Experts
Not Satisfactory
Results
Satisfactory Results
Pre-Test (Content Validity )
Univers
ity of
Mala
ya

92
Initially, the quantitative and comparative approach was chosen to generalize the
methodology. The quantitative approach is more objective and independent research
(Punch & Punch, 2009). Therefore, the research includes comparison, prediction, and
explanation of differences and relationship between International and Malaysian
students. The main variables were the personality patterns (Big Five, Imposter
personality, and Machiavellian) with mental health. The demographics (age, gender,
course, the level of education, marital status, religion, nationality, and ethnicity) were
utilized in the comparison between International and Malaysian students.
The correlation approach was employed to investigate the relationship between
variables. (Ary, Jacobs, Sorensen, & Walker, 2013) Ary, Jacobs, Razavieh, & Sorensen,
(2009) stated that correlation research is useful in wide study fields. They also
mentioned the most useful applications of correlation are classified as (1) Determining
relationships, (2) Assessing consistency, and (3) Prediction. Correlation research
methods are used to determine relationships and patterns among variables in a single
group of subjects.
Subsequently, in this research, survey technique using self-administered
questionnaire was adapted to gather information from participants. Survey research
design is a procedure in quantitative approach that helps the researchers to administer a
questionnaire in order to identify trends in the attitudes, opinion, behaviour or
characteristic of the population (Hanson, Creswell, Clark, Petska, & Creswell, 2005).
Accordingly, the research has been constructed based on identifying the research tools
and the study area. Next sections will go through the area selection and the research
tools.
Univers
ity of
Mala
ya

93
3.2.1 Research Location and Population
This research was conducted at the University of Malaya, which is the oldest
public research university among Malaysians‟ universities located in Kuala Lumpur.
The University consists of 17 faculties and research centers that cover the whole
spectrum of learning from the Arts, Sciences, and Humanities. The university considers
the first choice of Malaysia's students as well as the international student who comes
from more than 80 different countries. Therefore, it was offering an excellent
environment to conduct this research.
On the other hand, the university includes a variety of population, which is
highly required in this research. The population defined as the group of interest to the
researcher, the group to which person would like the results of the study to be
generalized (Gay & Airasian, 2003). The population also is the group of individuals
having one characteristic that distinguishes them from other groups (Fowler Jr, 2013).
Thus, the target population of this study was composed of all Malaysian and
international students enrolled in University Malaya included both male and female,
undergraduate and postgraduate students involved in various university courses. Local
Student” refers to a student who has Malaysian citizenship / permanent resident status;
International Student” refers to a student who does not has Malaysian citizenship /
permanent resident status.
According to statistical information given by (Higher Degree of Information
System of Malaya University), the University has a total of 27249 students. Include
3381 International students (Undergraduate = 643 and Postgraduate = 2738) and 23868
Univers
ity of
Mala
ya
94
Local students (Undergraduate = 12440 and Postgraduate = 11428). The Pie chart in
Figure 3.3 illustrates the population of interest in this research.
Figure 3.3: the University of Malaya Student Based on the Enrolment of 2013
3.2.2 Determination of Sample Size
According to Morse (2000), there are several approaches to determining the
sample size. These include using a census for small populations, imitating a sample size
of similar studies, using published tables, applying formulas, and analysis program to
determine a sample size. In this research, the sample size was obtained by using two
methods namely the post hoc power analysis with the program G*Power (Faul,
Erdfelder, Lang, & Buchner, 2007) and the sample size Cochran formula.
G-power analysis (a software that can be obtained through Heinrich-Heine
University of Dusseldorf, its capabilities are limited to power calculations and sample
size calculations) indicated that a total sample of 269 students are needed to detect
3381
23868
International Students
Local Students
Univers
ity of
Mala
ya

95
medium effects size with 80% power using a two ways ANOVA between means with
alpha at 0.05 among four numbers of groups (Gender × Nationality). Further, a total
sample of 82 individual would be needed to detect medium effects size with 80% power
using correlation with alpha at 0.05 at two-tailed hypotheses. Moreover, a total sample
of 123 individual would be needed to detect medium effects size with 80% power using
Linear multiple regression with alpha at 0.05 with 11 numbers of predictors at two-
tailed hypothesis. See Table 3.1. For more details, refer to Appendix I.
Table 3.1: Determination of Sample Size Based on G-Power
Statistical Method Effect Size Total Sample Size
2 Way Anova 0.25 269
Correlation 0. 82
Multiple Linear Regression 0.1 123
Moreover, the estimation of appropriate sample size for prevalence surveys
requires an attentive choice of calculating formula (Arya, Antonisamy, & Kumar,
2012).
3.1
(
)
3.2
Where:
= calculated sample size
e= desired margin of error =0.05
Univers
ity of
Mala
ya
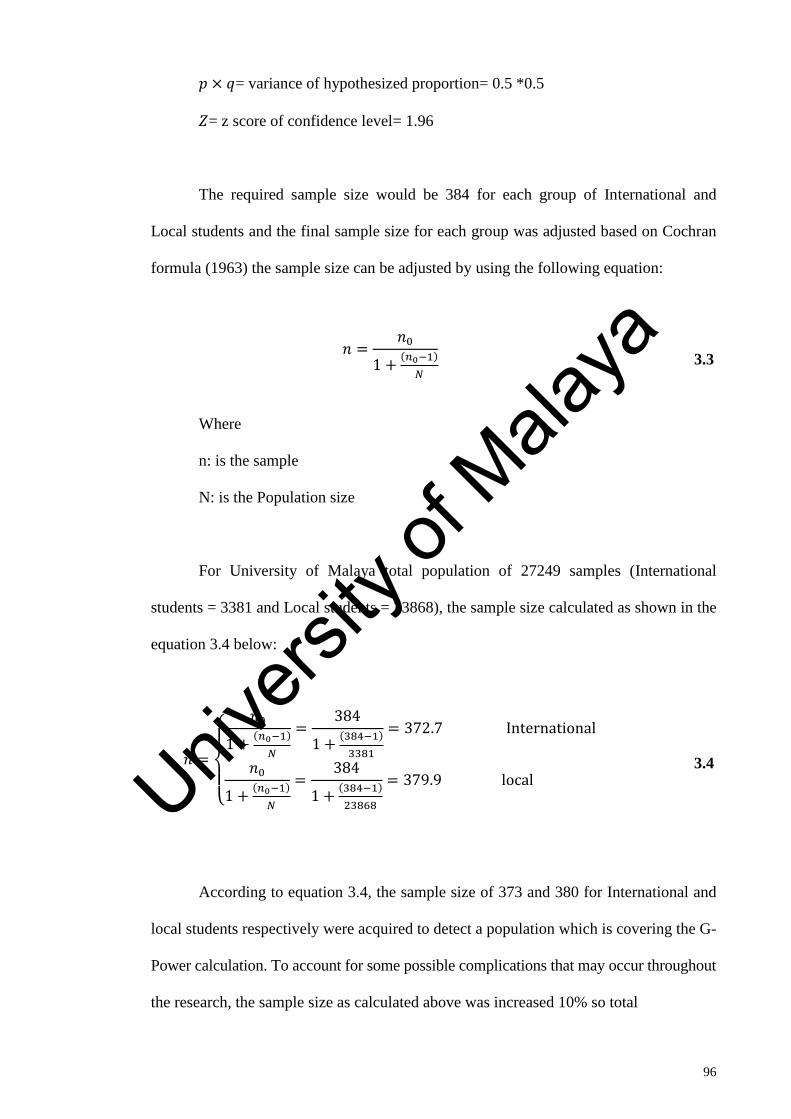
96
= variance of hypothesized proportion= 0.5 *0.5
= z score of confidence level= 1.96
The required sample size would be 384 for each group of International and
Local students and the final sample size for each group was adjusted based on Cochran
formula (1963) the sample size can be adjusted by using the following equation:
( )
3.3
Where
n: is the sample
N: is the Population size
For University of Malaya total population of 27249 samples (International
students = 3381 and Local students = 23868), the sample size calculated as shown in the
equation 3.4 below:
{
( )
( )
( )
( )
3.4
According to equation 3.4, the sample size of 373 and 380 for International and
local students respectively were acquired to detect a population which is covering the G-
Power calculation. To account for some possible complications that may occur throughout
the research, the sample size as calculated above was increased 10% so total
Univers
ity of
Mala
ya
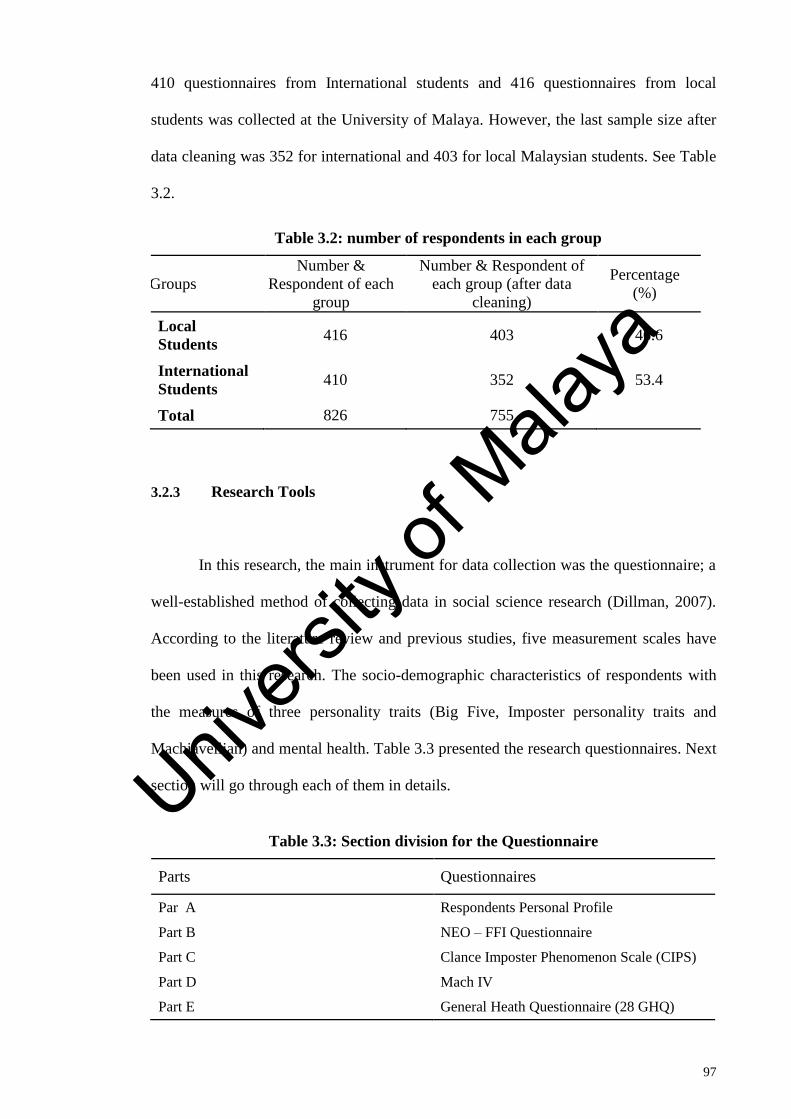
97
410 questionnaires from International students and 416 questionnaires from local
students was collected at the University of Malaya. However, the last sample size after
data cleaning was 352 for international and 403 for local Malaysian students. See Table
3.2.
Table 3.2: number of respondents in each group
Groups
Number &
Respondent of each
group
Number & Respondent of
each group (after data
cleaning)
Percentage
(%)
Local
Students 416 403 46.6
International
Students 410 352 53.4
Total 826 755
3.2.3 Research Tools
In this research, the main instrument for data collection was the questionnaire; a
well-established method of collecting data in social science research (Dillman, 2007).
According to the literature review and previous studies, five measurement scales have
been used in this research. The socio-demographic characteristics of respondents with
the measures of three personality traits (Big Five, Imposter personality traits and
Machiavellian) and mental health. Table 3.3 presented the research questionnaires. Next
section will go through each of them in details.
Table 3.3: Section division for the Questionnaire
Parts Questionnaires
Par A Respondents Personal Profile
Part B NEO – FFI Questionnaire
Part C Clance Imposter Phenomenon Scale (CIPS)
Part D Mach IV
Part E General Heath Questionnaire (28 GHQ)
Univers
ity of
Mala
ya

98
3.2.3.1 Part A: Socio-Demographic Information
A portion of the survey asked the participants to provide demographic
information. Demographic variables collected for this research included the participants
were the age, gender, course, level of education, marital status, religion, nationality, and
ethnicity.
3.2.3.2 Part B: Personality Traits
The NEO-FFI (Costa & McCrae, 1992) is a 60-item short version of the 240-
item NEO-PI-R (Costa & McCrae, 1992) measuring five domains (Neuroticism,
Extraversion, Openness, Agreeableness, and Conscientiousness). These 60 items were
selected by Costa and McCrae (1992) considering 12 items from each of the five factors
with the highest pattern/structure coefficients on the principal component that
represented that particular personality domain (McCrae & Costa, 2004, 2007). The final
60 items that were included in the NEO-FFI were based on additional exploratory factor
analyses and examinations of internal consistency. The NEO-FFI measures personality
at the domain level only. Each item consists of a statement rated on a Likert scales
ranging from strongly disagree to strongly agree. Scale alpha reliabilities was reported
.88 (Neuroticism), .81 (Extraversion), .74 (Openness), .77 (Agreeableness) and.87
(Conscientiousness). Many studies have been reported the reliability and validity of
NEO-FFI scores, as well as the cross-cultural transportability of the items (e.g., Caruso,
2000; Church et al., 2008; Holden, Wasylkiw, Starzyk, Book, & Edwards, 2006; Hong
et al., 2008; McCrae & Costa, 2007; Murray, Rawlings, Allen, & Trinder, 2003;
Scandell, 2000). They found that the mean reliability coefficients were .88, .83, .79, .75,
and .83 for the N, E, O, A, and C personality domains, respectively. The questions
Univers
ity of
Mala
ya

99
belong to each subscale is presented in Table 3.4. Refer to Appendix E for the Full
Version.
Table 3.4: Subscale Items Numbers for NEO-FFI
Subscale Name Involved Questions
Emotional Stability
(Neuroticism)
NEO1, NEO6, NEO11, NEO16, NEO21, NEO26, NEO31,
NEO36, NEO41, NEO46, NEO51, and NEO56
Extroversion NEO2, NEO7, NEO12, NEO17, NEO22, NEO27, NEO32,
NEO37, NEO42, NEO47, NEO52, and NEO57
Openness to
Experience
NEO3, NEO8, NEO13, NEO18, NEO23, NEO28, NEO33,
NEO38, NEO43, NEO48, NEO53, and NEO58
Agreeableness NEO4, NEO9, NEO14, NEO19, NEO24, NEO29, NEO34,
NEO39, NEO44, NEO49, NEO54, and NEO59
Conscientiousness NEO5, NEO10, NEO15, NEO20, NEO25, NEO30, NEO35,
NEO40, NEO45, NEO50, NEO55, and NEO60
3.2.3.3 Part C: Imposter Traits
Clance Imposter Phenomenon Scale (CIPS) was conducted by means of “paper
and pencil” for the first time by Clance and Ames (1978). It consists of 20 questions and
the subjects are to choose the responses from the range 1 “never", 2 "rarely", 3
"Sometimes", 4 "often", 5 "very high". When total score is less than 40% it indicates
that the Imposter syndrome is poor, between 41 and 60% - medium and between 61 and
80% - disease and 80% above is considered severe. An alpha coefficient of 94 % is
reported in research findings Chrisman et al (1995). In the findings of Holmes et al
(1993) alpha coefficient of 96% is reported. The split-half method involved two
techniques for calculating reliability coefficients namely: Spearman-Brown and
Gatman. The values of the coefficients calculated by means of Cronbach's alpha,
Univers
ity of
Mala
ya
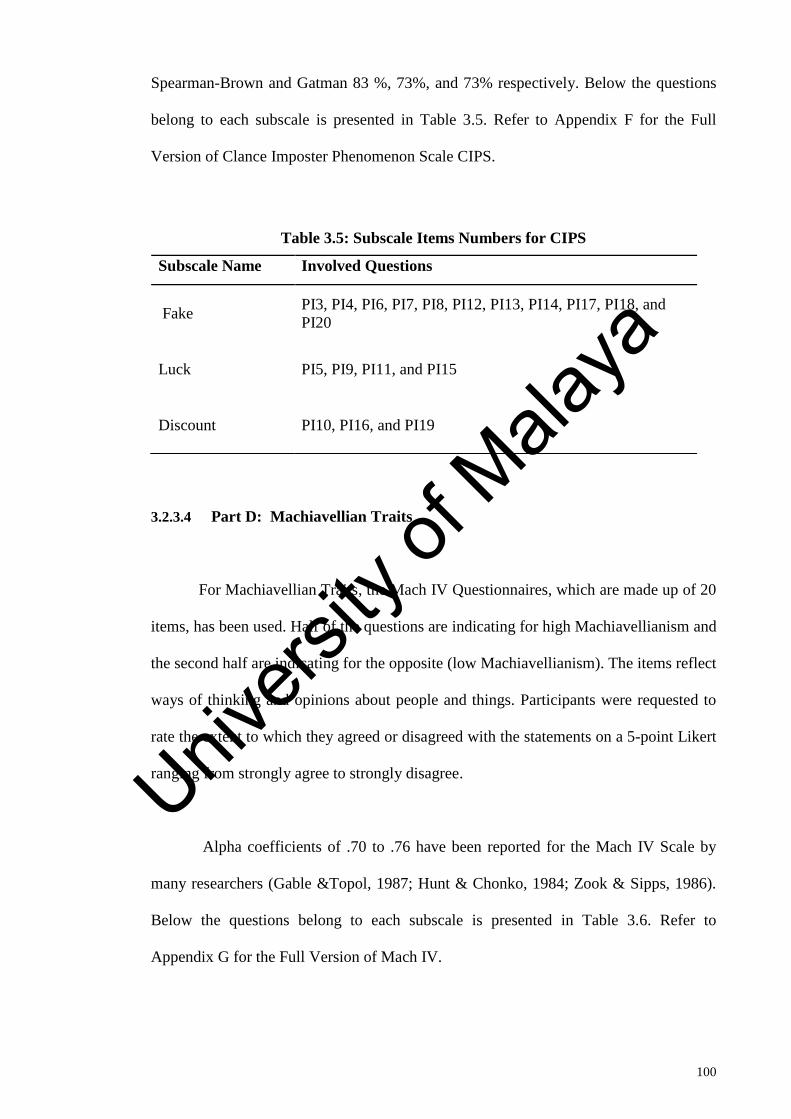
100
Spearman-Brown and Gatman 83 %, 73%, and 73% respectively. Below the questions
belong to each subscale is presented in Table 3.5. Refer to Appendix F for the Full
Version of Clance Imposter Phenomenon Scale CIPS.
Table 3.5: Subscale Items Numbers for CIPS
Subscale Name Involved Questions
Fake PI3, PI4, PI6, PI7, PI8, PI12, PI13, PI14, PI17, PI18, and
PI20
Luck PI5, PI9, PI11, and PI15
Discount PI10, PI16, and PI19
3.2.3.4 Part D: Machiavellian Traits
For Machiavellian Traits, the Mach IV Questionnaires, which are made up of 20
items, has been used. Half of the questions are indicating for high Machiavellianism and
the second half are indicating for the opposite (low Machiavellianism). The items reflect
ways of thinking and opinions about people and things. Participants were requested to
rate the extent to which they agreed or disagreed with the statements on a 5-point Likert
ranging from strongly agree to strongly disagree.
Alpha coefficients of .70 to .76 have been reported for the Mach IV Scale by
many researchers (Gable &Topol, 1987; Hunt & Chonko, 1984; Zook & Sipps, 1986).
Below the questions belong to each subscale is presented in Table 3.6. Refer to
Appendix G for the Full Version of Mach IV.
Univers
ity of
Mala
ya

101
Table 3.6: Subscale Items Numbers for MACH-IV
Subscale Name Involved Questions
Negative
Interpersonal
Tactics
Mach1, Mach3, Mach7, and Mach9
Positive
Interpersonal
Tactics
PI15 Mach5, Mach15, Mach10, Mach2, Mach8, and Mach13
Positive View of
Human Nature Mach14, Mach17, Mach20, and Mach12
Cynical View of
Human Nature Mach4, Mach6, Mach11, Mach19, Mach16, and Mach18
3.2.3.5 Part E: Mental Health
General Health Questionnaire (GHQ-28) was developed by Goldenberg (1978)
and has been translated into 38 languages. It was developed as a screening tool to detect
those likely to have or to be at risk of developing psychiatric disorder measures
emotional distress in medical settings. Through factor analysis, the GHQ-28 has been
divided into four subscales. These are: somatic symptoms include item 1-7;
anxiety/insomnia included item 8-14; social dysfunction include item 15-21, and severe
depression includes item 22-28. (Goldberg 1978). Items are accompanied by four
possible responses: Not at all, No more than usual, Rather more than usual, and Much
more than usual. Several scoring options are available; we used the Likert method to
indicate symptom severity, which scores the item response between 0–3 (0–1–2–3,
subscale range 0 to 21) as this is the recommended method for assessment of the
subscales and it is less skewed distributions and is more suitable for correlation analysis
and intergroup comparisons (Banks et al., 1980). The score of each item relies on
whether the item is formulated positively or negatively (Richard, Lussier, Gagnon &
Lamarche, 2004).Many studies investigated reliability and validity of the GHQ-28 in
Univers
ity of
Mala
ya
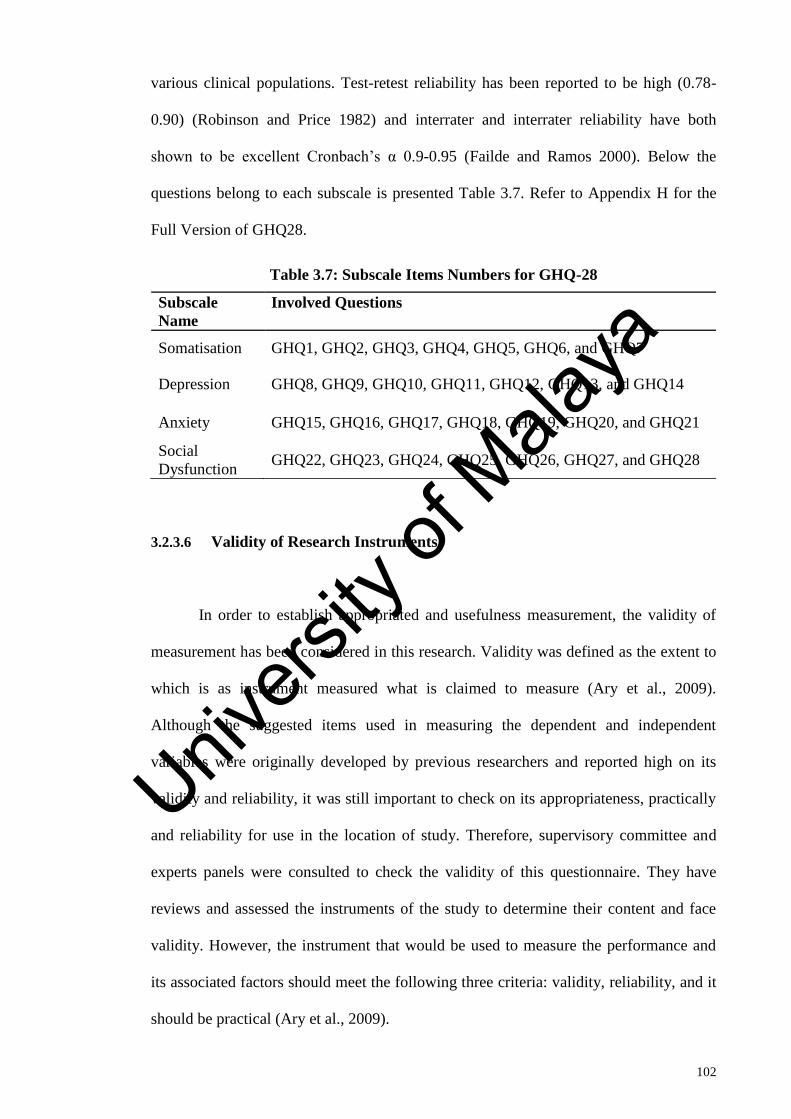
102
various clinical populations. Test-retest reliability has been reported to be high (0.78-
0.90) (Robinson and Price 1982) and interrater and interrater reliability have both
shown to be excellent Cronbach‟s α 0.9-0.95 (Failde and Ramos 2000). Below the
questions belong to each subscale is presented Table 3.7. Refer to Appendix H for the
Full Version of GHQ28.
Table 3.7: Subscale Items Numbers for GHQ-28
Subscale
Name
Involved Questions
Somatisation GHQ1, GHQ2, GHQ3, GHQ4, GHQ5, GHQ6, and GHQ7
Depression GHQ8, GHQ9, GHQ10, GHQ11, GHQ12, GHQ13, and GHQ14
Anxiety GHQ15, GHQ16, GHQ17, GHQ18, GHQ19, GHQ20, and GHQ21
Social
Dysfunction GHQ22, GHQ23, GHQ24, GHQ25, GHQ26, GHQ27, and GHQ28
3.2.3.6 Validity of Research Instruments
In order to establish appropriated and usefulness measurement, the validity of
measurement has been considered in this research. Validity was defined as the extent to
which is as instrument measured what is claimed to measure (Ary et al., 2009).
Although the suggested items used in measuring the dependent and independent
variables were originally developed by previous researchers and reported high on its
validity and reliability, it was still important to check on its appropriateness, practically
and reliability for use in the location of study. Therefore, supervisory committee and
experts panels were consulted to check the validity of this questionnaire. They have
reviews and assessed the instruments of the study to determine their content and face
validity. However, the instrument that would be used to measure the performance and
its associated factors should meet the following three criteria: validity, reliability, and it
should be practical (Ary et al., 2009).
Univers
ity of
Mala
ya
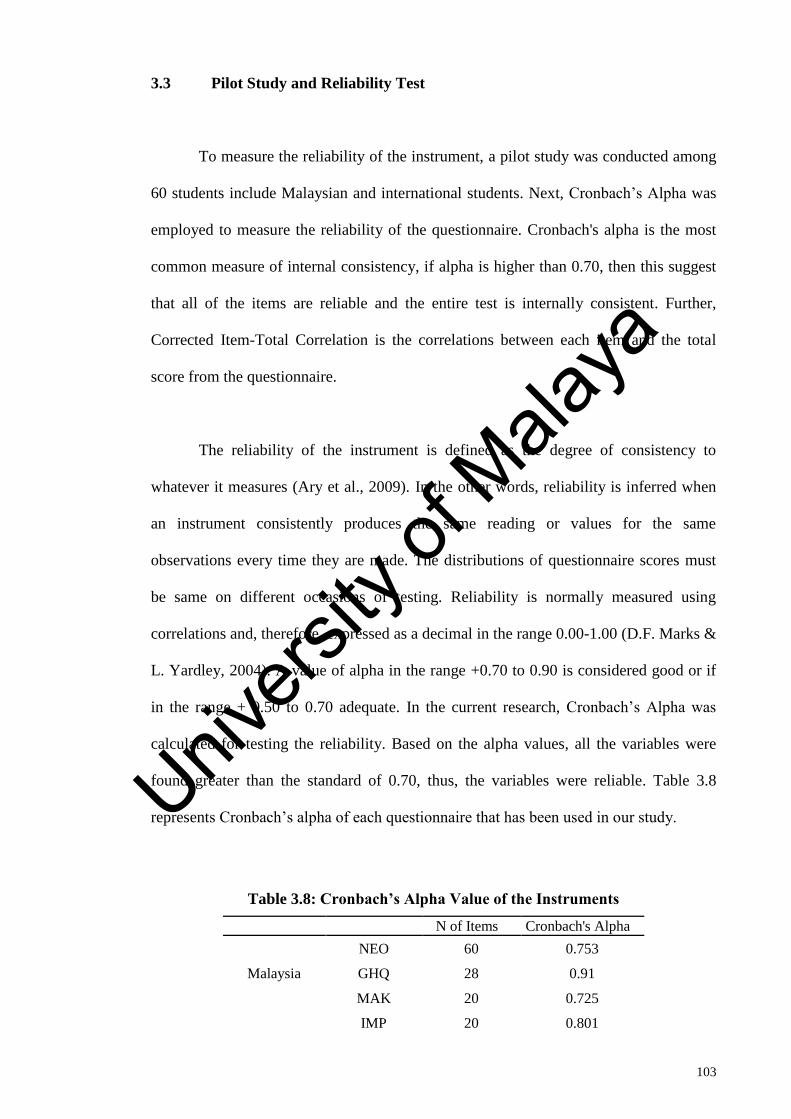
103
Pilot Study and Reliability Test 3.3
To measure the reliability of the instrument, a pilot study was conducted among
60 students include Malaysian and international students. Next, Cronbach‟s Alpha was
employed to measure the reliability of the questionnaire. Cronbach's alpha is the most
common measure of internal consistency, if alpha is higher than 0.70, then this suggest
that all of the items are reliable and the entire test is internally consistent. Further,
Corrected Item-Total Correlation is the correlations between each item and the total
score from the questionnaire.
The reliability of the instrument is defined as the degree of consistency to
whatever it measures (Ary et al., 2009). In the other words, reliability is inferred when
an instrument consistently produces the same reading or values for the same
observations every time they are made. The distributions of questionnaire scores must
be same on different occasions of testing. Reliability is normally measured using
correlations and, therefore, expressed as a decimal in the range 0.00-1.00 (D.F. Marks &
L. Yardley, 2004). A value of alpha in the range +0.70 to 0.90 is considered good or if
in the range + 0.50 to 0.70 adequate. In the current research, Cronbach‟s Alpha was
calculated for testing the reliability. Based on the alpha values, all the variables were
found greater than the standard of 0.70, thus, the variables were reliable. Table 3.8
represents Cronbach‟s alpha of each questionnaire that has been used in our study.
Table 3.8: Cronbach’s Alpha Value of the Instruments
N of Items Cronbach's Alpha
NEO 60 0.753
Malaysia GHQ 28 0.91
MAK 20 0.725
IMP 20 0.801
Univers
ity of
Mala
ya

104
„Table 3.8, continued‟
NEO 60 0.972
International GHQ 28 0.91
MAK 20 0.925
IMP 20 0.946
Data Collection Procedure 3.4
As mentioned previously, a self-administrated questionnaire was used to collect
information. These questionnaires have been distributed randomly to the respondents.
When permission was approved by the University ethic committee (refer to the
Appendix L), data collection schedule has been made and researcher started collecting
the data daily from 9 am to 4 pm at different faculties in Malaya University campus.
Participants were provided consent form containing information includes the purpose of
the study at the beginning of the questionnaires. During the distribution of the
questionnaire to the respondents, they could ask questions or discuss any concerns if
they had any problem in understanding the questionnaire to the researcher or to the
research assistants. However, a briefing was given by the researcher and research
assistants before respondents starting to fill the questionnaire. In addition, researcher
addressed the procedure of data collection to respondents whenever it was necessary. It
should be noted screening question was asked to identify if they were local students or
international students. The researcher then proceeded to distribute the questionnaire to
both groups of students. Questionnaires were collected on the same day by the
researcher. Accordingly, the researcher completed all data collection on the scheduled
day.
In order to achieve accurate data to represent the population of university
students, some inclusion and exclusion criteria must be considered during data
collection. Inclusion criteria is defined as basic characteristics must be met by the
Univers
ity of
Mala
ya

105
research participants before take part in this study whereas exclusion criteria is defined
as specific characteristic in the participants that are not desirable to include in the study
and must be excluded from the study if any of them has found (DeRenzo & Moss,
2005). In this research, participant‟s enrollment at the University of Malaya is an
essential criterion.
Further, individuals were eligible to participate if they were not having limited
English proficiency. Since the research was conducted in the University of Malaya, this
criterion was met, as the English language is the medium of study. However, research
assistants were employed to assist participant if they have any inquiry. Furthermore,
agreement of participation was considered as all the participants had to sign a consent
form before filling the questioners. On the other hand, participants have been
questioned if they were experiencing serious mental health and physical health issues,
such cases have been excluded from this study.
Data Preparation 3.5
After the data collection has been done, data should be prepared for analysis.
The preparation includes checking the analysis assumptions such as normality and
outliers. Next subsections will go through the explanation and results of these two tests
for the collected data.
3.5.1 Normality test
One from the main assumption for data analysis is the normality of distribution.
In other words, Distribution of data measuring the variation of variables in the collected
Univers
ity of
Mala
ya
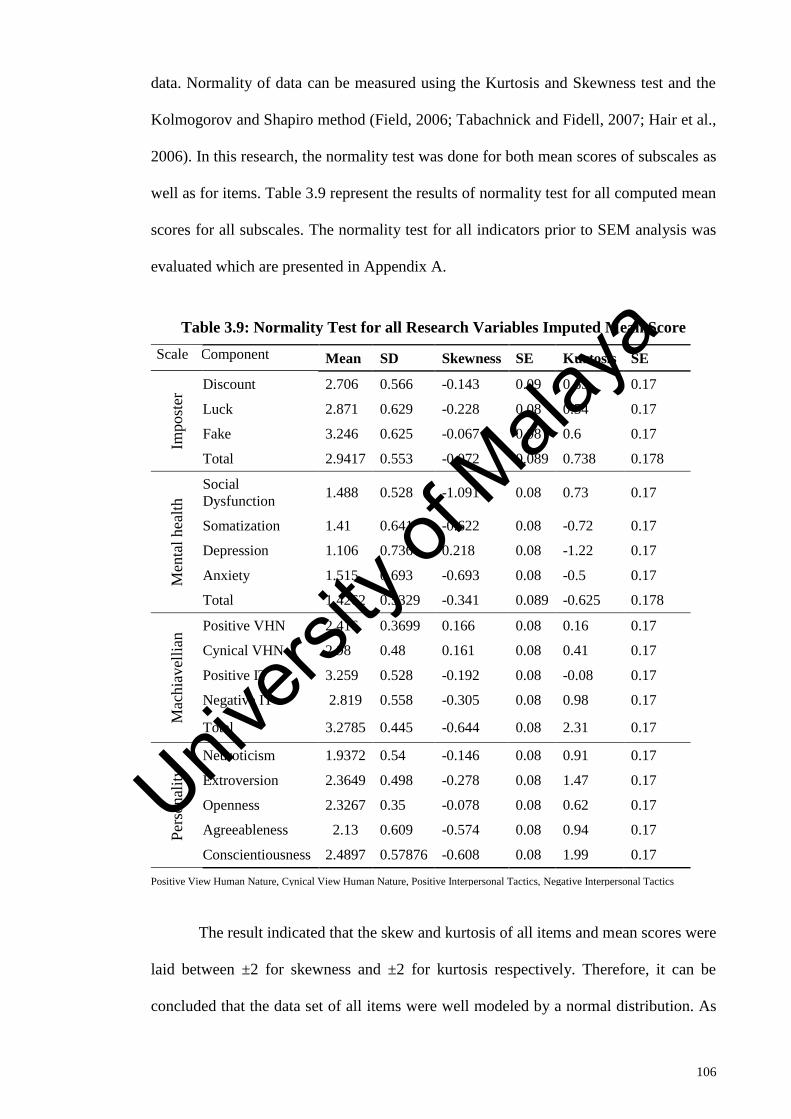
106
data. Normality of data can be measured using the Kurtosis and Skewness test and the
Kolmogorov and Shapiro method (Field, 2006; Tabachnick and Fidell, 2007; Hair et al.,
2006). In this research, the normality test was done for both mean scores of subscales as
well as for items. Table 3.9 represent the results of normality test for all computed mean
scores for all subscales. The normality test for all indicators prior to SEM analysis was
evaluated which are presented in Appendix A.
Table 3.9: Normality Test for all Research Variables Imputed Mean Score
Scale Component Mean SD Skewness SE Kurtosis SE
Impost
er Discount 2.706 0.566 -0.143 0.09 0.65 0.17
Luck 2.871 0.629 -0.228 0.08 0.54 0.17
Fake 3.246 0.625 -0.067 0.08 0.6 0.17
Total 2.9417 0.553 -0.072 0.089 0.738 0.178
Men
tal
hea
lth
Social
Dysfunction 1.488 0.528 -1.091 0.08 0.73 0.17
Somatization 1.41 0.641 -0.622 0.08 -0.72 0.17
Depression 1.106 0.736 0.218 0.08 -1.22 0.17
Anxiety 1.515 0.693 -0.693 0.08 -0.5 0.17
Total 1.4262 0.5329 -0.341 0.089 -0.625 0.178
Mac
hia
vel
lian
Positive VHN 2.416 0.3699 0.166 0.08 0.16 0.17
Cynical VHN 2.98 0.48 0.161 0.08 0.41 0.17
Positive IT 3.259 0.528 -0.192 0.08 -0.08 0.17
Negative IT 2.819 0.558 -0.305 0.08 0.98 0.17
Total 3.2785 0.445 -0.644 0.08 2.31 0.17
Per
sonal
ity
Neuroticism 1.9372 0.54 -0.146 0.08 0.91 0.17
Extroversion 2.3649 0.498 -0.278 0.08 1.47 0.17
Openness 2.3267 0.35 -0.078 0.08 0.62 0.17
Agreeableness 2.13 0.609 -0.574 0.08 0.94 0.17
Conscientiousness 2.4897 0.57876 -0.608 0.08 1.99 0.17
Positive View Human Nature, Cynical View Human Nature, Positive Interpersonal Tactics, Negative Interpersonal Tactics
The result indicated that the skew and kurtosis of all items and mean scores were
laid between ±2 for skewness and ±2 for kurtosis respectively. Therefore, it can be
concluded that the data set of all items were well modeled by a normal distribution. As
Univers
ity of
Mala
ya
107
shown in the following table, for total mean scores the skewness ranged from -0.693 to
0.238 and the kurtosis ranged from -1.22 to 2.31.
3.5.2 Outliers
Usually, the univariate outliers should be identified by considering frequency
distributions of Z-scores of the observed data (Kline, 2005). However, no univariate
outlier was identified for this study, due to utilizing a 5 point Likert scale that ranging
from 0 to 4 and 1 to 5. For imputed variables, outliers were identified using univariate
(histograms, boxplots, and standardized Z score). According to Hair (1998) for large
sample size, Absolut (Z) > 4 indicates an extreme observation. The result showed that
the standardized (z) scores of the imputed variables ranged from –2.80 to -3.19,
indicating that none of the variables exceeded this threshold (See Appendix B).
The multivariate outlier was tested by defining the Mahalanobis distance (D2),
which is a measure of distance in standard deviation units between each observation
compared with the mean of all observations (Byrne 2001; Kline, 2005; Hair et al.,
2006). A large D2 shows the case as an extreme value at one or more variables. The data
were examined by applying multivariate detection. High D2 / df value greater than 3.5
represents potential multivariate outlier (Hair et al. 1998). As depicted in Table B-1 (see
Appendix B), the results of Mahalanobis distance for NEO-FFI showed that the largest
D2 value is 142.955. Regarding the 60 exogenous and endogenous variables together
with their relative estimation errors, the maximum D2 / df was equal to 1.19 (142.95 /
120) which was far below the cut-off 3.5 which indicates there are no multivariate
outliers for NEO-FFI scale, meaning all observations in this scale were retained for
analysis.
Univers
ity of
Mala
ya

108
As depicted in Table B.3 (see Appendix B), the results of Mahalanobis distance
for Imposter showed that the largest D2 value is 64.999. Regarding the 20 exogenous
and endogenous variables together with their relative estimation errors, the maximum
D2 / df was equal to 1.6 (64.999/ 40) which was far below the cut-off 3.5 which
indicates there are no multivariate outliers for Imposter Phenomenon Scale (CIPS)
scale, meaning all observations in this scale were retained for analysis.
As depicted in Table B.4 (see Appendix B), the results of Mahalanobis distance
for Machiavellian showed that the largest D2 value is 122.322. Regarding the 20
exogenous and endogenous variables together with their relative estimation errors, the
maximum D2 / df was equal to 3.05 (122.322/ 40) which was below the cut-off 3.5
which indicates there are no multivariate outliers for Mach IV scale, meaning all
observations in this scale were retained for analysis.
As depicted in Table B.2 (see Appendix B), the results of Mahalanobis distance
for GHQ showed that the largest D2 value is 82.352. Regarding the 28 exogenous and
endogenous variables together with their relative estimation errors, the maximum D2 /
df was equal to 1.7 (82.352/ 48) which was far below the cut-off 3.5 which indicates
there are no multivariate outliers for GHQ28 scale, meaning all observations in this
scale were retained for analysis.
Construct validity 3.6
Construct validity is the appropriateness of inferences made on the basis of
observations or measurements (often test scores), specifically whether a test measures
the intended construct. Constructs are abstractions that are deliberately created by
researchers in order to conceptualize the latent variable. Construct validity is essential to
Univers
ity of
Mala
ya
109
the perceived overall validity of the test. It is particularly important in the social
sciences, psychology, and psychometrics and language studies. Convergent and
discriminant validities are both considered subcategories and subtypes of construct
validity. Convergent validity occurs where measures of constructs that are expected to
correlate do so and discriminant validity occur where constructs that are expected not to
relate do not, such that it is possible to discriminate between these constructs.
Convergence and discrimination are often demonstrated by correlation of the measures
used within constructs. In this research, confirmatory factor analysis (CFA) was applied
for those latent construct hypothesized model. Confirmatory factor analysis plays the
role of validating (both convergent and discriminant) and also finding the reliability of
research measurements.
Structural educational modelling (SEM) is a multivariate statistical approach
that allows researchers to examine both the measurement and structural components of a
model by testing the relationships among multiple independent and dependent
constructs simultaneously (Tabachnick & Fidell, 2001). One of most usable software for
analysis SEM is called Analysis of Moment Structures (AMOS). In this research,
AMOS (Ver21) was used to evaluate the construct validity including convergent and
discriminant validity among constructs and indicators using confirmatory factor analysis
(CFA), also known as measurement model (Bentler, 1995; Hoyle, 1995, Hair et al.,
2006), which are described below. CFA is the very important technique of SEM (Kline,
2005). It is generally applied when there is some background knowledge of the
underlying constructs and measurement items (Byrne, 2013). There are two broad
approaches used in CFA to evaluate the measurement model: (1) deciding the goodness
of fit (GOF) criteria indices, (2) evaluating the validity and reliability of measurement
Univers
ity of
Mala
ya

110
model (Hair et al., 2006). Therefore, the researcher used the measurement model in this
research for assessing the unidimensionality, validity, and reliability of the measures.
The goodness of fit indices Structural equation modelling (SEM) has three main
types of fit measure indices: absolute fit indices, incremental fit indices, and
parsimonious fit indices (Hair et al., 1998). The absolute fit indices are used to assess
the ability of the overall model fit and these indices include the likelihood ratio statistic
chi-square (χ2), in association with root, mean square error of approximation (RMSEA),
and the goodness of fit index (GFI) (Hair et al., 1998). The incremental fit indexes are
used to compare the proposed model to some baseline model and the incremental fit
indices consist of the normed fit index (NFI), and comparative fit index (CFI) (Hair et
al., 1998; Hair et al., 2006).
The parsimonious fit indices are used to investigate whether the estimated model
is simpler or can be improved by specifying fewer estimated parameter paths (Hair et
al., 1998). The parsimonious fit index includes the adjusted goodness-of-fit index
(AGFI). To examine the matter that a model‟s fit or how the model performs in
explaining a set of observable data, the following indices are used: Goodness-of-Fit
Index (GFI), Normed Fit Index (NFI), Increment Fit Index (IFI), and Comparative Fit
Index (CFI). The high value (0.9) of the indices indicates the highly appropriate fit of
the designed model compared to the possible models. In the end, to examine how the
model integrates the fitness and cost-effectiveness, the highly strong index Root Mean
Square Error of Approximation (RMSEA) is used. The index is, in fact, the Root Mean
Square of Approximation. The model where the index is 0.10 or so has weak fit. Root
Mean Square Residual (RMSR) is, in fact, the same the mean differences between data
and variance-covariance matrix reproduced. The smaller the criterion is (<0.05 is
Univers
ity of
Mala
ya
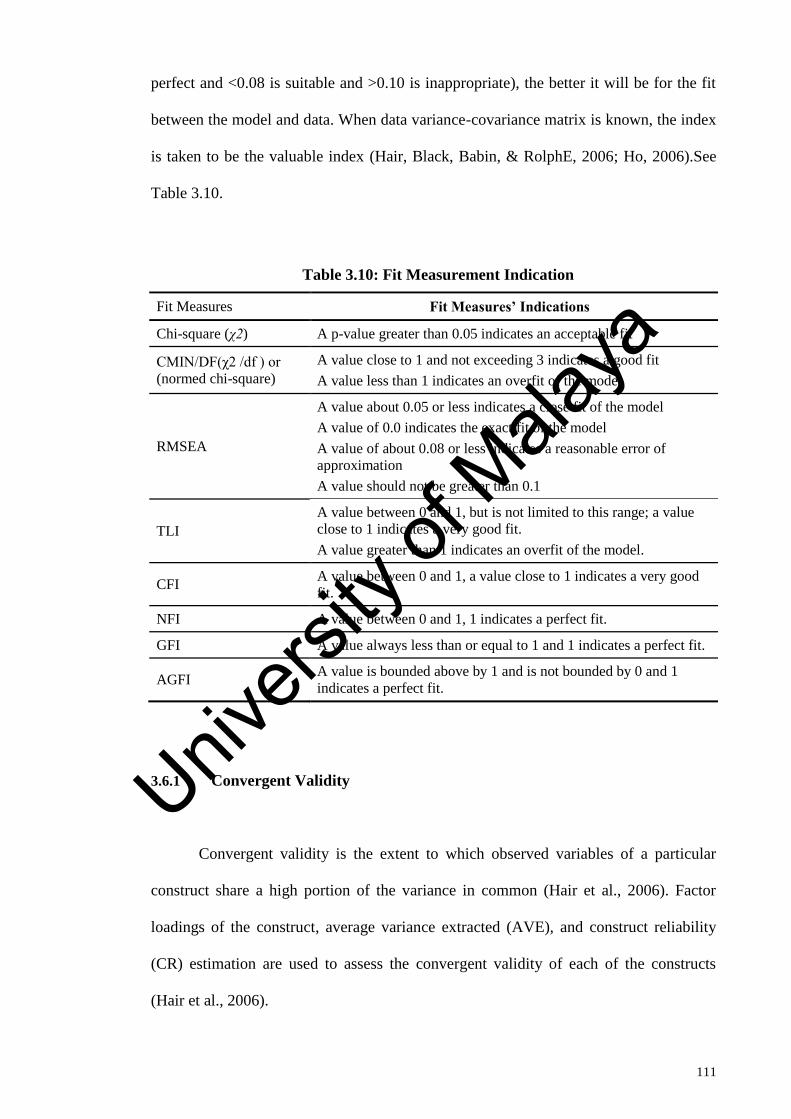
111
perfect and <0.08 is suitable and >0.10 is inappropriate), the better it will be for the fit
between the model and data. When data variance-covariance matrix is known, the index
is taken to be the valuable index (Hair, Black, Babin, & RolphE, 2006; Ho, 2006).See
Table 3.10.
Table 3.10: Fit Measurement Indication
Fit Measures Fit Measures’ Indications
Chi-square (χ2) A p-value greater than 0.05 indicates an acceptable fit
CMIN/DF(χ2 /df ) or
(normed chi-square)
A value close to 1 and not exceeding 3 indicates a good fit
A value less than 1 indicates an overfit of the model
RMSEA
A value about 0.05 or less indicates a close fit of the model
A value of 0.0 indicates the exact fit of the model
A value of about 0.08 or less indicates a reasonable error of
approximation
A value should not be greater than 0.1
TLI
A value between 0 and 1, but is not limited to this range; a value
close to 1 indicates a very good fit.
A value greater than 1 indicates an overfit of the model.
CFI A value between 0 and 1, a value close to 1 indicates a very good
fit.
NFI A value between 0 and 1, 1 indicates a perfect fit.
GFI A value always less than or equal to 1 and 1 indicates a perfect fit.
AGFI A value is bounded above by 1 and is not bounded by 0 and 1
indicates a perfect fit.
3.6.1 Convergent Validity
Convergent validity is the extent to which observed variables of a particular
construct share a high portion of the variance in common (Hair et al., 2006). Factor
loadings of the construct, average variance extracted (AVE), and construct reliability
(CR) estimation are used to assess the convergent validity of each of the constructs
(Hair et al., 2006).
Univers
ity of
Mala
ya
112
In addition, Hair et al. (2006) suggested that ideal standardized loading estimates
should be 0.7 or higher, AVE estimation should be greater than 0.5, and reliability
estimates should be above 0.7 to show adequate convergent validity. Therefore, in this
study, the minimum cut off criteria for loadings > 0.7, AVE > 0.5, and reliability > 0.7
were used for assessing the convergent validity.
3.6.2 Discriminant validity
Discriminant validity refers to the extent to which a latent construct is truly
distinct from other latent constructs (Hair et al., 2006). Discriminant validity was
assessed by a method, suggested by Hair et al. (2006), In which the average variance
extracted for each construct is compared with the corresponding squared inner construct
correlations (SIC), and the AVE estimate consistently larger than the SIC estimates
indicates support for the discriminant validity of the construct. This procedure was used
in this research to assess the discriminant validity of each of the constructs.
Constructs Validity of research instruments 3.7
Prior to testing the research hypothesizes confirmatory factor analysis was done
for evaluation of construct validity (convergent and discriminating validity) for all
instruments, applying AMOS (Ver21). In this research, the measurement model was
evaluated using CFA for all scales. The measurement model is related to the rules
governing how the latent variables are measured in terms of the observed variables
(items), and it defines the measurement properties of the observed variables. That is,
measurement models are concerned with the relations between observed and latent
variables. Such models specify hypotheses about the relations between a set of observed
Univers
ity of
Mala
ya

113
variables, such as ratings or questionnaire items, and the unobserved variables or
constructs they were designed to measure. The measurement model is important as it
provides a test for the reliability of the observed variables employed to measure the
latent variables. A measurement model that offers a poor fit to the data suggests that at
least some of the observed indicator variables are unreliable, and precludes the
researcher from moving to the analysis of the structural model.
Prior to run the measurement model, individual models for each subscale were
fitted. Individual item reliability can be assessed by evaluating the individual item
loadings with values greater than 0.7, which indicates adequate indicator reliability or
correlation with each construct (Henseler, Ringle, & Sinkovics, 2009). However, Hair et
al. (2010) further suggest the acceptable factor loading (outer loading) of 0.4 if the
sample size is 200 or more. Early, the author has suggested using the newly developed
scale which is 0.5 or higher should be retained in the measurement model. The results
of the modified individual model were presented in Appendix C. After modifying the
individual CFA model for each dimension the overall measurement model for each
questionnaire were evaluated by using their total dimensions. The measurement CFA
model of this study includes 128 items to measure sixteen constructs which presented
by this study questionnaires. The measurement CFA model in this study included into
four parts with all 128 items. The models are shown in figure 1 to 4 respectfully. Two
items including IMPOSTER.1 and IMPOSTER.2 were removed from the model due to
low loading factors which were lower than 0.4.
Univers
ity of
Mala
ya

114
3.7.1 Construct Validity of NEO-FFI
The convergent and discriminant validity of the NEO-FFI constructs were
examined with several tests. The confirmatory factor analysis (CFA) conducted by
using AMOS 21 demonstrated a good model fit, supporting both convergent and
discriminant validity.The measurement model obtained using AMOS showed
satisfactory fit statistics (Chi-square = 3547.932, df = 1700, CFI = .914, AGFI = .837,
GFI = .849, RMSEA =0.039). While an ideal RMSEA score is .05 or less, a value of
about 0.08 indicates acceptable fit (Bollen & Long, 1993). See Table 3.11.
Table 3.11: Convergent Validity of NEO
CR AVE MSV ASV
Agreeableness 0.920 0.491 0.023 0.010
Neuroticism 0.928 0.518 0.04 0.005
Extroversion 0.921 0.494 0.147 0.057
Openness 0.882 0.485 0.088 0.048
Conscientiousness 0.925 0.509 0.147 0.065
Following CFA, determining the measurement model the construct validity was
evaluated to ensure convergent, and discriminant validity of the variables. As illustrated
in Table 3-12, all variables in the table have provided a sufficient convergent validity.
The result shows that the Composite Reliability (CR) is between 0.882 - 0.928 in this
construct. Convergent validity refers to a set of variables that presume to measure a
construct (Kline, 2005). The standardized factor loadings were highly significant.
Composite reliabilities (CR) of all variables exceeded the minimum limit of 0.70
(except for openness) and were larger than the average variance extracted (AVE).
Estimated AVE was all almost above the acceptable threshold 0.50 level, which implied
that more than one-half of the variances observed. To discriminant validity, we
compared the maximum-shared squared variances (MSV) between factors and average
Univers
ity of
Mala
ya
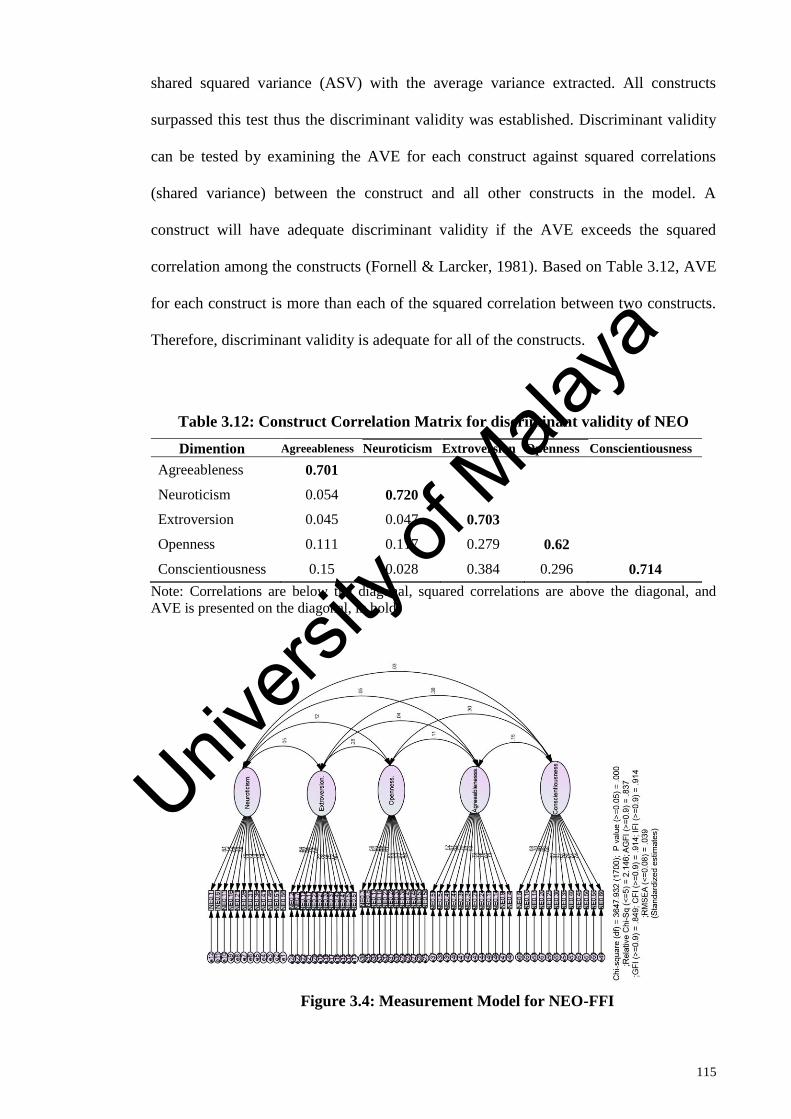
115
shared squared variance (ASV) with the average variance extracted. All constructs
surpassed this test thus the discriminant validity was established. Discriminant validity
can be tested by examining the AVE for each construct against squared correlations
(shared variance) between the construct and all other constructs in the model. A
construct will have adequate discriminant validity if the AVE exceeds the squared
correlation among the constructs (Fornell & Larcker, 1981). Based on Table 3.12, AVE
for each construct is more than each of the squared correlation between two constructs.
Therefore, discriminant validity is adequate for all of the constructs.
Table 3.12: Construct Correlation Matrix for discriminant validity of NEO
Dimention Agreeableness Neuroticism Extroversion Openness Conscientiousness
Agreeableness 0.701
Neuroticism 0.054 0.720
Extroversion 0.045 0.047 0.703
Openness 0.111 0.117 0.279 0.62
Conscientiousness 0.15 0.028 0.384 0.296 0.714
Note: Correlations are below the diagonal, squared correlations are above the diagonal, and
AVE is presented on the diagonal, in bold
Figure 3.4: Measurement Model for NEO-FFI
Univers
ity of
Mala
ya
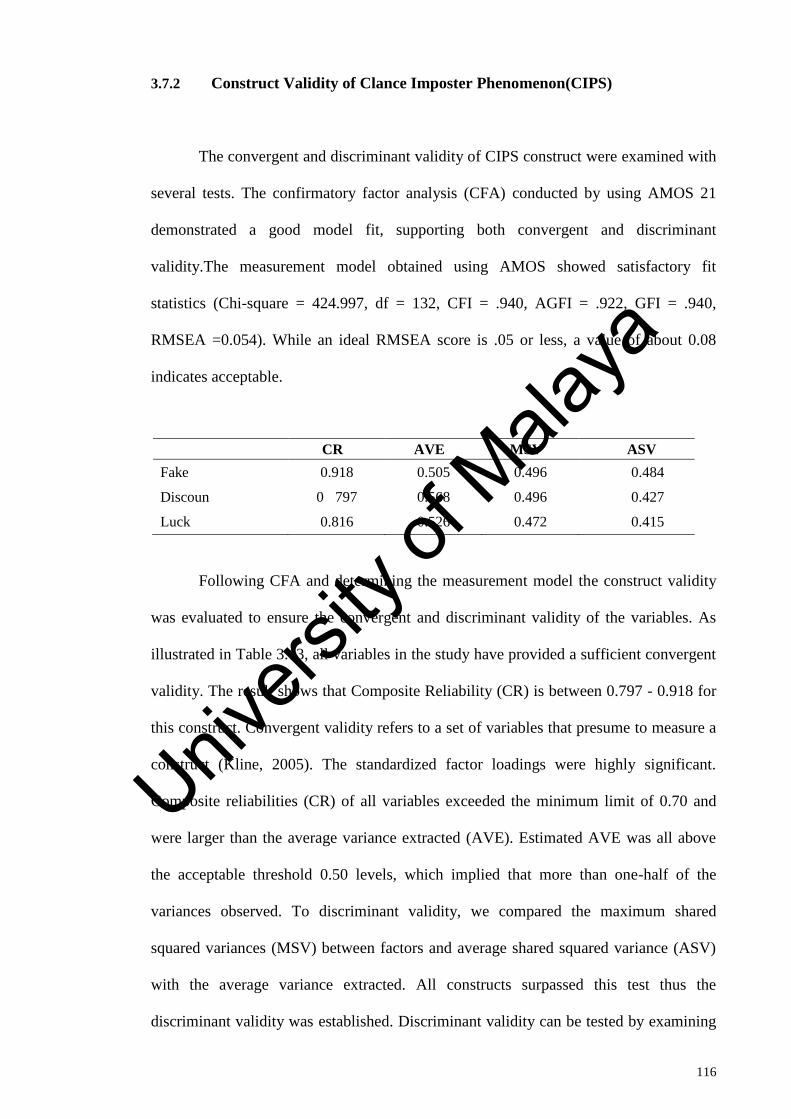
116
3.7.2 Construct Validity of Clance Imposter Phenomenon(CIPS)
The convergent and discriminant validity of CIPS construct were examined with
several tests. The confirmatory factor analysis (CFA) conducted by using AMOS 21
demonstrated a good model fit, supporting both convergent and discriminant
validity.The measurement model obtained using AMOS showed satisfactory fit
statistics (Chi-square = 424.997, df = 132, CFI = .940, AGFI = .922, GFI = .940,
RMSEA =0.054). While an ideal RMSEA score is .05 or less, a value of about 0.08
indicates acceptable.
Table 3.13: Convergent validity of CIPS
CR AVE MSV ASV
Fake 0.918 0.505 0.496 0.484
Discoun 0 797 0.568 0.496 0.427
Luck 0.816 0.526 0.472 0.415
Following CFA and determining the measurement model the construct validity
was evaluated to ensure the convergent and discriminant validity of the variables. As
illustrated in Table 3.13, all variables in the study have provided a sufficient convergent
validity. The result shows that Composite Reliability (CR) is between 0.797 - 0.918 for
this construct. Convergent validity refers to a set of variables that presume to measure a
construct (Kline, 2005). The standardized factor loadings were highly significant.
Composite reliabilities (CR) of all variables exceeded the minimum limit of 0.70 and
were larger than the average variance extracted (AVE). Estimated AVE was all above
the acceptable threshold 0.50 levels, which implied that more than one-half of the
variances observed. To discriminant validity, we compared the maximum shared
squared variances (MSV) between factors and average shared squared variance (ASV)
with the average variance extracted. All constructs surpassed this test thus the
discriminant validity was established. Discriminant validity can be tested by examining
Univers
ity of
Mala
ya

117
the AVE for each construct against squared correlations (shared variance) between the
construct and all other constructs in the model. A construct will have adequate
discriminant validity if the AVE exceeds the squared correlation among the constructs
(Fornell & Larcker, 1981; Hair et al., 2006). Based on Table 3.14 AVE for each
construct is more than each of the squared correlation between two constructs.
Therefore, discriminant validity is adequate for all of the constructs.
Table 3.14: Construct correlation matrix for discriminant validity of CIPS
Dimension Fake Discount Luck
Fake 0.71
Discount 0.704 0.754
Luck 0.687 0.599 0.726
Note: Correlations are below the diagonal, squared correlations are above the
diagonal, and AVE is presented on the diagonal, in bold
Figure 3.5: Measurement Model for Clance Imposter Phenomenon
Univers
ity of
Mala
ya
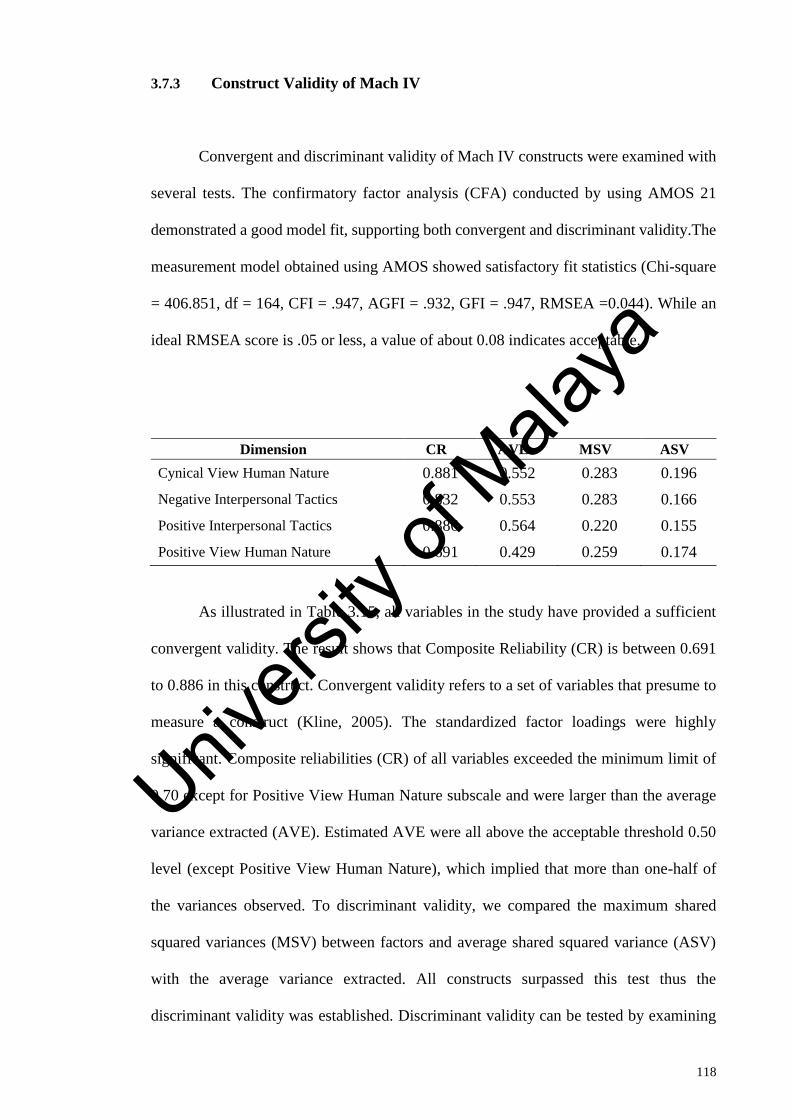
118
3.7.3 Construct Validity of Mach IV
Convergent and discriminant validity of Mach IV constructs were examined with
several tests. The confirmatory factor analysis (CFA) conducted by using AMOS 21
demonstrated a good model fit, supporting both convergent and discriminant validity.The
measurement model obtained using AMOS showed satisfactory fit statistics (Chi-square
= 406.851, df = 164, CFI = .947, AGFI = .932, GFI = .947, RMSEA =0.044). While an
ideal RMSEA score is .05 or less, a value of about 0.08 indicates acceptable.
Table 3.15: Convergent validity of Mach IV
Dimension CR AVE MSV ASV
Cynical View Human Nature 0.881 0.552 0.283 0.196
Negative Interpersonal Tactics 0.832 0.553 0.283 0.166
Positive Interpersonal Tactics 0.886 0.564 0.220 0.155
Positive View Human Nature 0.691 0.429 0.259 0.174
As illustrated in Table 3.15, all variables in the study have provided a sufficient
convergent validity. The result shows that Composite Reliability (CR) is between 0.691
to 0.886 in this construct. Convergent validity refers to a set of variables that presume to
measure a construct (Kline, 2005). The standardized factor loadings were highly
significant. Composite reliabilities (CR) of all variables exceeded the minimum limit of
0.70 except for Positive View Human Nature subscale and were larger than the average
variance extracted (AVE). Estimated AVE were all above the acceptable threshold 0.50
level (except Positive View Human Nature), which implied that more than one-half of
the variances observed. To discriminant validity, we compared the maximum shared
squared variances (MSV) between factors and average shared squared variance (ASV)
with the average variance extracted. All constructs surpassed this test thus the
discriminant validity was established. Discriminant validity can be tested by examining
Univers
ity of
Mala
ya

119
the AVE for each construct against squared correlations (shared variance) between the
construct and all other constructs in the model. A construct will have adequate
discriminant validity if the AVE exceeds the squared correlation among the constructs
(Fornell & Larcker, 1981; Hair et al., 2006). Based on Table 3.16, AVE for each
construct is more than each of the squared correlation between two constructs.
Therefore, discriminant validity is adequate for all of the constructs. We had to delete
item Mach12 from the measurement model in order to get the more accurate model.
Table 3.16: Construct correlation matrix for discriminant validity of Mach IV
CVHN NIT PIT PVHN
Cynical View of Human Nature 0.743
Negative Interpersonal Tactics 0.532 0.744
Positive Interpersonal Tactics 0.327 0.369 0.751
Positive View of Human Nature 0.434 0.271 0.509 0.655
Figure 3.6: Measurement Model for Mach IV
Univers
ity of
Mala
ya

120
3.7.4 Construct Validity of GHQ 28
The convergent and discriminant validity of Mach IV constructs were examined
with several tests. The confirmatory factor analysis (CFA) conducted by using AMOS
21 demonstrated a good model fit, supporting both convergent and discriminant validity.
The measurement model obtained using AMOS showed satisfactory fit statistics (Chi-
square = 1004.239, df = 338, CFI = .947, AGFI = .895, GFI = .912, RMSEA = 0.051).
While an ideal RMSEA score is .05 or less, a value of about 0.08 indicates acceptable
fit.
Table 3.17: Convergent Validity of GHQ
Dimension CR AVE MSV ASV
Somatization 0.884 0.525 0.517 0.300
Anxiety 0.920 0.624 0.517 0.342
Depressi 0.894 0.549 0.350 0.258
Social Dysfunction 0.891 0.539 0.158 0.137
Following CFA and determining the measurement model the construct validity was
evaluated to ensure the convergent and discriminant validity of the variables. As illustrated
in Table 3.17, all variables in the study have provided a sufficient convergent validity. The
result shows that Composite Reliability (CR) is between 0.884 to 0.920 in this construct.
Convergent validity refers to a set of variables that presume to measure a construct (Kline,
2005). The standardized factor loadings were highly significant. Composite reliabilities (CR)
of all variables exceeded the minimum limit of 0.70 and were larger than the average
variance extracted (AVE). Estimated AVE was all above the acceptable threshold 0.50
levels, which implied that more than one-half of the variances observed. To discriminant
validity, we compared the maximum shared squared variances (MSV) between factors and
average shared squared variance (ASV) with the average variance extracted. All constructs
surpassed this test thus the
Univers
ity of
Mala
ya

121
discriminant validity was established. Discriminant validity can be tested by examining
the AVE for each construct against squared correlations (shared variance) between the
construct and all other constructs in the model. A construct will have adequate
discriminant validity if the AVE exceeds the squared correlation among the constructs
(Fornell & Larcker, 1981; Hair et al., 2006). Based on Table 3.18, AVE for each
construct is more than each of the squared correlation between two constructs.
Therefore, discriminant validity is adequate for all of the constructs.
Table 3.18: Construct correlation matrix for Discriminant validity of GHQ
Somatization Anxiety Depression Social Dysfunction
Somatization 0.725
Anxiety 0.719 0.79
Depression 0.526 0.592 0.741
Social Dysfunction 0.325 0.397 0.385 0.734
Figure 3.7: Measurement Model for GHQ 28
Univers
ity of
Mala
ya

122
Data analysis 3.8
The data for all the research instruments will be numerically scored and quantified.
Each of these quantitative scores will be entered into SPSS version 21 for analysis. The
descriptive statistics will be used to organize, summarize, and display a set of numerical
data (Gall et al, 2003).
In the present study exploratory data analysis (EDA) procedures was applied to
examine all data in details before any specific statistical analysis is done and to
determine the appropriateness of statistical techniques for data analysis by using some
methods such as frequency distribution of dataset, description of the location (mean,
mode, standard deviation). The following subsections will go through the main
statistical analysis used in this research.
3.8.1 Comparision
In this research, a comparison between the variables was conducted by using 2-
way ANOVA. The reason for opting this method was to compare the variables between
groups (International and Malaysian) and gender as well as the interaction between
group and gender at the same time. The interaction term in a two-way ANOVA informs
whether the effect of one independent variable on the dependent variable is the same for
all values of any other independent variable (and vice versa). For example, to check the
effect of gender (male/female) on one of the variable influenced by nationality (International/
Malaysian), two-way ANOVA is the correct method to use.
Univers
ity of
Mala
ya
123
3.8.2 Correlation
Correlation method was used to evaluate the relationships among the research
variables according to the significant level P-value. Pearson‟s product moment
correlations were performed to examine the presence of bivariate linear relationships
and also to determine the significant relationships between the two variables. The
correlation helps to clarify how the variables are related in strength and magnitude. The
Pearson correlation coefficient, r, will be utilized for measurement of the extent of the
linear relationship. Pearson r can take on only values from -1 to +1. This study used the
Guilford and Fruchter (1973) rule of thumb to determine the strength of the relationship
between variables. The p-value was set at .05 in these analyses.
In this study, Pearson Correlation Test was used to examine the relationship
between independent variables (Big Five personality Dimension which include:
neuroticism, extroversion, openness, agreeableness, and conscientious; Imposter
phenomenon, and Machiavellian traits) as well as demographic characteristics contain
age, gender, and level of education. Dependent variable was mental health in this study.
Table 3-19 shows the criteria for interpreting the strength of the relationship between
two variables.
Table 3.19: Criteria for interpreting strength of relationship between two variables
r Strength of Relationship
<.20 Slight relationship
.20-.40 Low correlation, definite but small
.40-.70 Moderate correlation, substantial relationship
.70-.90 High correlation, marked relationship
>.90 Very high correlation, very dependable relationship
Univers
ity of
Mala
ya

124
3.8.3 Regression
Multiple regression analysis is a powerful technique used for predicting the
unknown value of a variable from the known value of two or more variables that called
the predictors (Draper & Smith, 2014). In a narrower sense, multiple regressions may
refer specifically to the estimation of continuous response variables that can be used in
classification. However, multiple regressions can be divided into linear and polynomial
regression depending on the response of the dependent variables to the change of the
independent variables.
Multiple linear regression attempts to model the relationship between two or
more explanatory variables and a response variable by fitting a linear equation to the
observed data. In general, the multiple linear regression equations is given by:
3.5
Where is a linear combination of the independent variables and
are known as the regression coefficient.
In this research, the multiple linear regression will attempt to model to predict
mental health based on personality traits. All the above equations will be used for
modeling and comparison will make according to the R-squared. However, the
prediction in social science research is too complicated. Therefore, is so difficult to get
high R-squared.
Univers
ity of
Mala
ya
125
Development of New Tool (UM-PTQ) 3.9
After verifying the results of the comparison, correlation and regression in the
data analysis part, a short version personality inventory named University Malaya
Personality Trait Questionnaire (UM-PTQ) was developed from the utilized research
tools. First, factor loadings have been computed according to confirmatory factor
analysis (CFA). The items with the highest loading factor have been selected to be in
the new tool. In contrary, items a low loading factor has been ignored. Next, a new tool
has been distributed to a portion of students in order to conduct a pilot study. Reliability
of the test has been verified by using Cronbach's Alpha. Finally, the construct validity
of the new tool was evaluated by using exploratory factor analysis. The factor analysis
showed that the new tool is consisting of five dimensions of NEO-FFI, Mach IV, and
CIPS which is proposed to evaluate students personality traits and mental health in this
study. The methodology of developing the new tool presented in Figure 3.2. The
following subsections will go through the method of developing the new tool in details.
3.9.1 Items Loading Factors
In confirmatory factor analysis, the relationship of each variable to the
underlying factor is expressed by the factor loading. Factor loadings should be 0.7 or
higher to confirm that independent variables identified a priori are represented by a
particular factor, on the rationale that the 0.7 level corresponds to about half of the
variance in the indicator being explained by the factor. Loading factors have been
computed for the research questionnaires by using AMOS software (Version 21). Thus,
AMOS can display the standardized factor loadings for each observed variable.
Accordingly, the shortened questionnaire has been developed from the utilized research
Univers
ity of
Mala
ya

126
tools. The result of the loading factor will be presented in the next chapter. In the first
step considering the results of confirmatory factor analysis (CFA) for all instruments
(Appendix J) for each dimension the highest contributed items based on their loading
factor were selected and were used to form new questionnaires. Results showed that
loading factors for ranged between 0.816 and 0.630. See Table 3.20.
Table 3.20: Loading Factor Range for Selected Items
Dimension Range of Loading factors
Neuroticism 0.756 – 0.738
Extroversion 0.779 - 0.722
Openness 0.678 - 0.630
Agreeableness 0.816 - 0.726
Conscientiousness 0.812- 0.735
Mach 0.802- 0.772
Imposter 0.811- 0.751
To evaluate the new short form of personality traits questionnaire a pilot study
was done among university students, seventy students contained 45 female, and 25 male
completed the combined personality inventory UM-PTQ. Participant in this study was
selected randomly among UM students and they were voluntary. A self-administrated
questionnaire was distributed to the samples during working hours among students at
different faculties in Malaya University campus. Among that, three responses were
excluded from the analysis due to incomplete answerers. Finally, 67 samples consisted
of the factor analysis of the UM-PTQ.
Univers
ity of
Mala
ya

127
3.9.2 Pilot Study and Reliability Test
To measure the reliability of the new instrument, a pilot study was conducted
among 70 students include both Malaysian and international students. The Cronbach‟s
Alpha was employed to measure the reliability of the questionnaire. The reliability is
inferred when an instrument consistently produces the same reading or values for the
same observations every time they are made. As explained earlier if alpha value
observed to be higher than 0.7, means that all of the items in the new questionnaire are
reliable and the entire test is internally consistent. However, when a value of alpha
observed in the range of 0.7 to 0.9 is considered good while when the range fall
between 0.5 to 0.7 is considered as adequate. In addition, Corrected Item-Total
Correlation presents in table showed the correlations between each item in the
questionnaire and the total score. Thus, Cronbach‟s Alpha was calculated after
collecting data using the new tool. The result will be presented in next chapter.
3.9.3 Exploratory Factor Analysis
Exploratory factor analysis examines the inter-correlations between all items in
scale to reduce the data into a smaller number of dimensions (factors). The dimensions
produced by factor analysis can be used as input for further analysis (Beavers et al.,
2013). Exploratory factor analysis is commonly used when developing a scale
(a scale is a collection of questions used to measure a particular research topic) and
identify a set of latent constructs underlying a battery of measured variables is required
(Fabrigar, Wegener, MacCallum, & Strahan, 1999). Exploratory factor analysis (EFA)
has been used to uncover the underlying structure of the large set of questionnaires
items. The underlying relationships between measured variables have been investigated
Univers
ity of
Mala
ya
128
within factor analysis. Within the factor model, a function of common factors, unique
factors, and errors of measurements expresses measured items have been identified.
Common factors influence two or more measured variables, while each unique factor
influences only one measured variable and does not explain correlations among
measured variables (Norris & Lecavalier, 2010). EFA assumes that any
indicator/measured variable may be associated with any factor. In the developing of
scale stage, EFA has been used for construct validity.
Chapter Summary 3.10
This chapter addresses the overall philosophy of this research. It presents the
research strategy that was followed in this research. This strategy includes a detailed
description of the research design, research area, research instrument, as well as all the
statistical methods that were employed to complete this research. Next chapter will go
through the results and analysis.
Univers
ity of
Mala
ya
129
RESULTS CHAPTER 4:
Introduction 4.1
This chapter presents the entire results of this research. The results consist of
two parts namely: descriptive and inferential statistics. The descriptive analysis includes
frequency, percentage, mean, and standard deviation for research variables and samples.
The inferential statistics includes verifying the relationship among the research variables
using the correlation analysis and regression. Further, comparisons among the research
variables using 2-way ANOVA are presented in this chapter. Moreover, the shortened
personality inventory has been presented at the end of this chapter. The following
sections will go through the highlighted points in more details.
Demographic Characteristics of the Participants 4.2
Age: Table 4.1 presents demographic information between two groups of
Malaysian and International students. In the category of age (<20 years) 3.2 present of
student were within group one while it contained 26.3% of Malaysian group (Because
International students are logically coming to study overseas in older ages). The second
category of age 28.4 present was International and 54.3 percentages were Malaysian. In
the third category, 33.9 percentages from a total of International student were in the
third category and 12.8 % were Malaysian group. (34.5) percentage of International was
above 30 years old and 6.8 percentage of Malaysian group were above 30 years old.
The level of Education: 19.4 percentage of the International group were
undergraduate and 80.6 percentages were postgraduate students (here explains why
Univers
ity of
Mala
ya
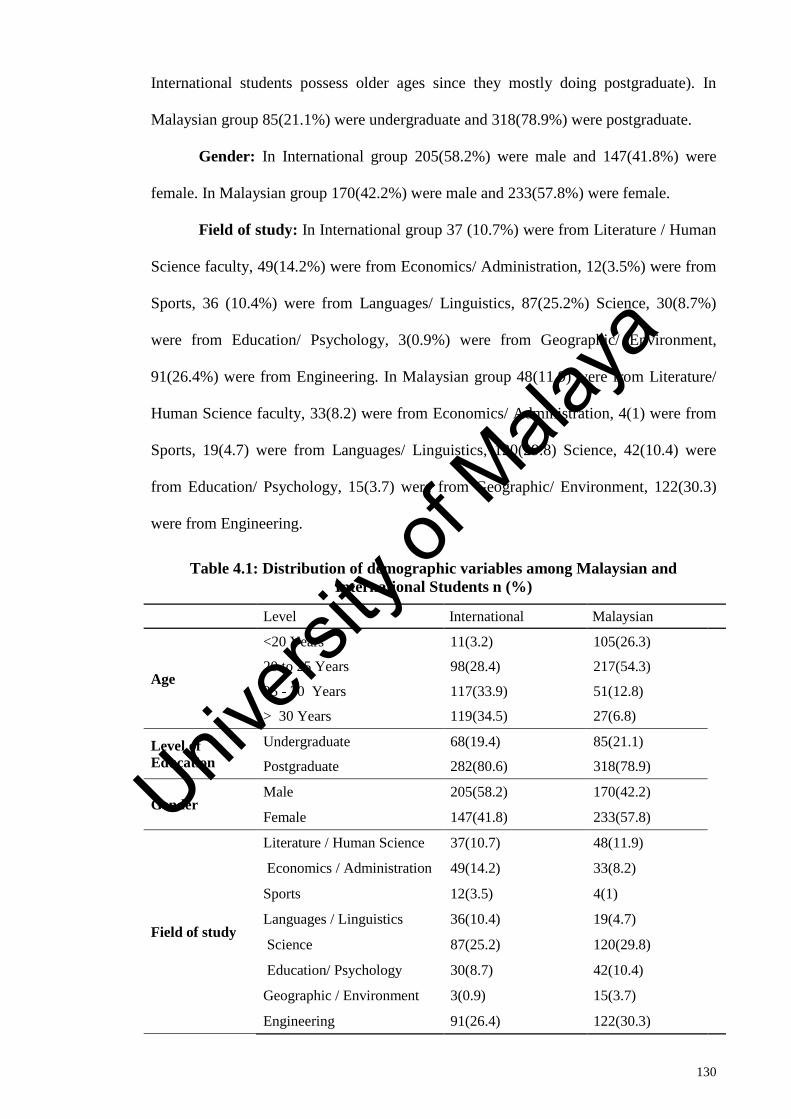
130
International students possess older ages since they mostly doing postgraduate). In
Malaysian group 85(21.1%) were undergraduate and 318(78.9%) were postgraduate.
Gender: In International group 205(58.2%) were male and 147(41.8%) were
female. In Malaysian group 170(42.2%) were male and 233(57.8%) were female.
Field of study: In International group 37 (10.7%) were from Literature / Human
Science faculty, 49(14.2%) were from Economics/ Administration, 12(3.5%) were from
Sports, 36 (10.4%) were from Languages/ Linguistics, 87(25.2%) Science, 30(8.7%)
were from Education/ Psychology, 3(0.9%) were from Geographic/ Environment,
91(26.4%) were from Engineering. In Malaysian group 48(11.9) were from Literature/
Human Science faculty, 33(8.2) were from Economics/ Administration, 4(1) were from
Sports, 19(4.7) were from Languages/ Linguistics, 120(29.8) Science, 42(10.4) were
from Education/ Psychology, 15(3.7) were from Geographic/ Environment, 122(30.3)
were from Engineering.
Table 4.1: Distribution of demographic variables among Malaysian and
International Students n (%)
Level International Malaysian
Age
<20 Years 11(3.2) 105(26.3)
20 to 25 Years 98(28.4) 217(54.3)
25 - 30 Years 117(33.9) 51(12.8)
> 30 Years 119(34.5) 27(6.8)
Level of
Education
Undergraduate 68(19.4) 85(21.1)
Postgraduate 282(80.6) 318(78.9)
Gender Male 205(58.2) 170(42.2)
Female 147(41.8) 233(57.8)
Field of study
Literature / Human Science 37(10.7) 48(11.9)
Economics / Administration 49(14.2) 33(8.2)
Sports 12(3.5) 4(1)
Languages / Linguistics 36(10.4) 19(4.7)
Science 87(25.2) 120(29.8)
Education/ Psychology 30(8.7) 42(10.4)
Geographic / Environment 3(0.9) 15(3.7)
Engineering 91(26.4) 122(30.3)
Univers
ity of
Mala
ya

131
Table 4.2 demonstrate that 75.6 percent (266) of International students were
from Asia, 11.1(39) percent were from Africa, and 3.4 (12) percent were from another
continent, and 9.9 (35) percent did not declare their country of origin.
Table 4.2: Distribution of International students based on Continent
Continent Frequency Percent
Asia 266 35.2
Africa 39 5.2
Others 12 1.6
Descriptive Results 4.3
Descriptive data analysis offers an overview of variables and their measures and
it can be useful for better understanding and interpretation of results. Descriptive
analysis of different research variables and dimensions and related items was conducted
through summarizing and describing results in the form of tables based on measures
such as frequencies, mean and standard deviation.
4.3.1 Descriptive statistic for Traits of personality NEO-FFI
The NEO-FFI is a 60-item questionnaire that comprehensively measures Big
Five personality traits. It has five dimensions included: Neuroticism, Extroversion,
Openness, Agreeableness, and Consciousness. In this instrument, each dimension
consists of 12 questions. 5 points Likert scale ranging from strongly disagrees to
strongly disagree from 0-4 was applied. Table 4.3 presents Neuroticism, Table 4.4
presents Extroversion, Table 4.5 presents Openness, Table 4.6 presents Agreeableness,
and Table 4.7 presents conscientiousness respectively.
Univers
ity of
Mala
ya

132
4.3.1.1 Neuroticism
In NEO-FFI inventory question number 1, 6, 11, 16, 21, 26, 31, 36, 41, 46, 51,
and 56 evaluate the measurement of neuroticism. According to descriptive statistics of
related items to neuroticism (Table 4.3), the highest mean belongs to NEO11 for both
International (M=2.03, SD=0.753) and the Malaysian (M=2.09, SD=0.676) group
followed by NEO1 for both Malaysian (M=2.05. SD=0.631) and International (M=1.97,
SD=0.691) students. NEO6 had a mean value of M=1.84, SD= 0.744 for International
students and M=1.99, SD=633 for Malaysian students. NEO16 had a mean value of
M=1.91, SD= 0.699 for International students and M=1.93, SD=938 for Malaysian
students. NEO21 had a mean value of M=1.94, SD= 0.768 for International students and
M=1.89, SD=636 for Malaysian students. NEO26 had a mean value of M=1.91, SD=
0.792 for International students and M=1.93, SD=785 for Malaysian students. NEO31
had a mean value of M=1.93, SD= 0.731 for International students and M=1.96,
SD=651 for Malaysian students. NEO36 had a mean value of M=1.84, SD= 0.726 for
International students and M=1.92, SD=714 for Malaysian students. NEO41 had a mean
value of M=1.84, SD= 0.744 for International students and M=1.91, SD=784 for
Malaysian students. NEO46 had a mean value of M=1.84, SD= 0.776 for International
students and M=1.97, SD=736 for Malaysian students. NEO51 had a mean value of
M=1.81, SD= 0.762 for International students and M=1.87, SD=756 for Malaysian
students. NEO56 had a mean value of M=1.93, SD= 0.857 for International students and
M=2, SD=748 for Malaysian students. U Mann-Whitney U test was applied for
comparison of related items to neuroticism between Malaysian and International
students and the results showed that except item6 there were no significant for all items
between Malaysian and International students.
Univers
ity of
Mala
ya

133
Table 4.3: Descriptive Statistic for Items of Neuroticism
International Malaysian
Items Mean SD Mean SD Z P
Value
1- I am not a worrier. 1.97 0.691 2.05 0.631 -1.657 0.097
6- I often feel inferior to others. 1.84 0.744 1.99 0.633 -3.115 0.002
11- When I‟m under a great deal of
stress, sometimes I feel like I‟m
going to pieces.
2.03 0.753 2.09 0.676 -1.069 0.285
16- I rarely feel lonely or blue. 1.91 0.699 1.93 0.613 -0.078 0.938
21- I often feel tense and jittery. 1.94 0.768 1.89 0.636 -1.271 0.204
26- Sometimes I feel completely
worthless. 1.91 0.792 1.93 0.758 -0.169 0.866
31- I rarely feel fearful or anxious. 1.93 0.731 1.96 0.651 -0.44 0.66
36- I often get angry at the way
people treat me. 1.84 0.726 1.92 0.714 -1.355 0.175
41- Too often, when things go
wrong, I get discouraged and felt
like giving up.
1.91 0.784 1.92 0.732 -0.219 0.827
46- I am seldom sad or depressed. 1.91 0.776 1.97 0.736 -0.953 0.341
51- I often feel helpless and want
someone else to solve my problems. 1.81 0.762 1.87 0.756 -1.171 0.241
56- At times, I have been so
ashamed I just wanted to hide. 1.93 0.857 2.00 0.748 -1.37 0.171
4.3.1.2 Extroversion
In NEO-FFI inventory question number 2, 7, 12, 17, 22, 27, 32, 37, 42, 47, 52,
and 57 evaluate the measurement (Dimension) of extroversion. According to descriptive
statistics of related items to extroversion (Table 4.4), the highest mean belongs to NEO2
for both International (M=2.43, SD=767) and Malaysian students (M=2.52, SD=0.666)
followed by NEO52 for both International (M=2.38, SD= 0.764) and Malaysian
(M=2.39, SD=0.611) students. The lowest mean was belonged to NEO47 for both
International (M=2.25, SD=727) and Malaysian (M=2.26, SD=0.602) students. U
Mann-Whitney U test was applied for comparison of related items to extroversion
Univers
ity of
Mala
ya
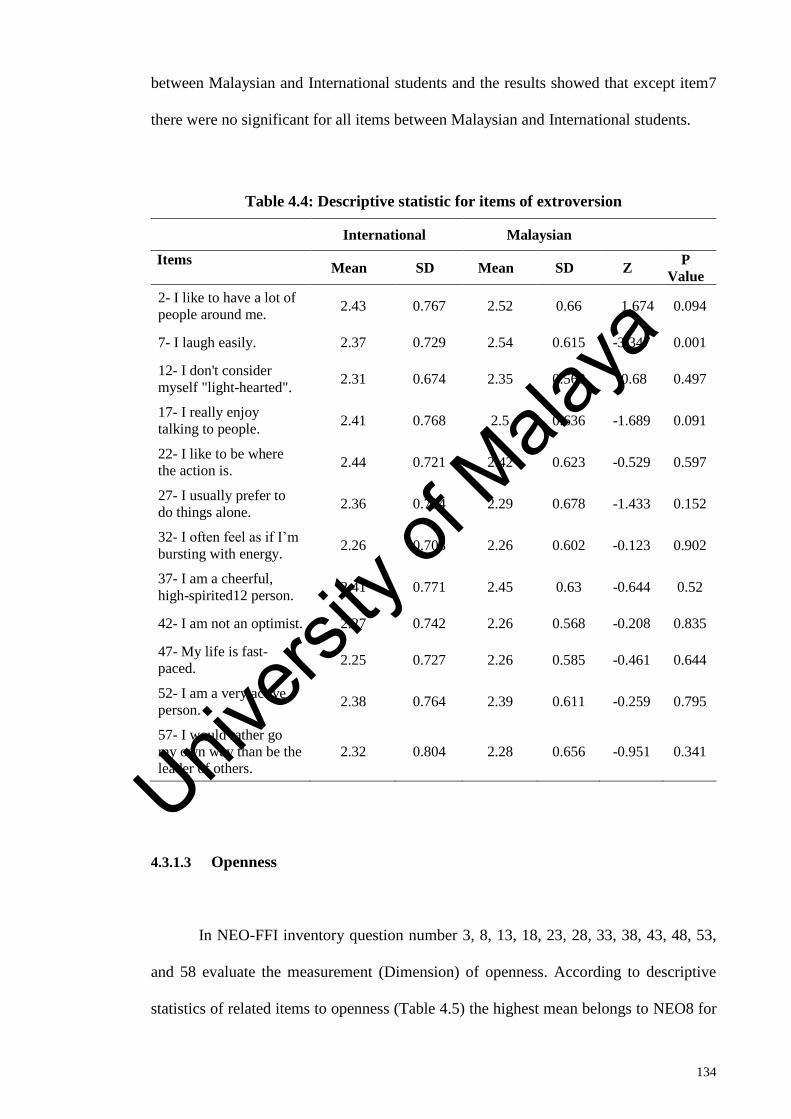
134
between Malaysian and International students and the results showed that except item7
there were no significant for all items between Malaysian and International students.
Table 4.4: Descriptive statistic for items of extroversion
International Malaysian
Items Mean SD Mean SD Z
P
Value
2- I like to have a lot of
people around me. 2.43 0.767 2.52 0.66 1.674 0.094
7- I laugh easily. 2.37 0.729 2.54 0.615 -3.347 0.001
12- I don't consider
myself "light-hearted". 2.31 0.674 2.35 0.568 -0.68 0.497
17- I really enjoy
talking to people. 2.41 0.768 2.5 0.636 -1.689 0.091
22- I like to be where
the action is. 2.44 0.721 2.42 0.623 -0.529 0.597
27- I usually prefer to
do things alone. 2.36 0.794 2.29 0.678 -1.433 0.152
32- I often feel as if I‟m
bursting with energy. 2.26 0.703 2.26 0.602 -0.123 0.902
37- I am a cheerful,
high-spirited12 person. 2.41 0.771 2.45 0.63 -0.644 0.52
42- I am not an optimist. 2.27 0.742 2.26 0.568 -0.208 0.835
47- My life is fast-
paced. 2.25 0.727 2.26 0.585 -0.461 0.644
52- I am a very active
person. 2.38 0.764 2.39 0.611 -0.259 0.795
57- I would rather go
my own way than be the
leader of others.
2.32 0.804 2.28 0.656 -0.951 0.341
4.3.1.3 Openness
In NEO-FFI inventory question number 3, 8, 13, 18, 23, 28, 33, 38, 43, 48, 53,
and 58 evaluate the measurement (Dimension) of openness. According to descriptive
statistics of related items to openness (Table 4.5) the highest mean belongs to NEO8 for
Univers
ity of
Mala
ya
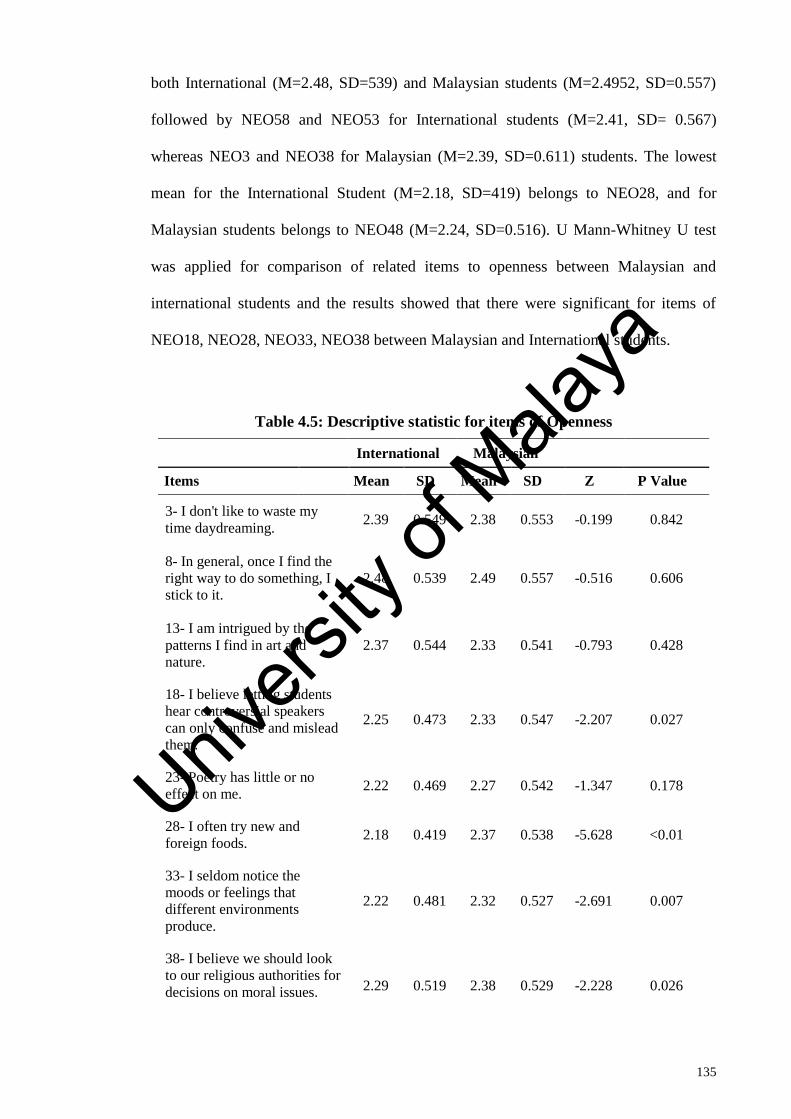
135
both International (M=2.48, SD=539) and Malaysian students (M=2.4952, SD=0.557)
followed by NEO58 and NEO53 for International students (M=2.41, SD= 0.567)
whereas NEO3 and NEO38 for Malaysian (M=2.39, SD=0.611) students. The lowest
mean for the International Student (M=2.18, SD=419) belongs to NEO28, and for
Malaysian students belongs to NEO48 (M=2.24, SD=0.516). U Mann-Whitney U test
was applied for comparison of related items to openness between Malaysian and
international students and the results showed that there were significant for items of
NEO18, NEO28, NEO33, NEO38 between Malaysian and International students.
Table 4.5: Descriptive statistic for items of Openness
International Malaysian
Items Mean SD Mean SD Z P Value
3- I don't like to waste my
time daydreaming. 2.39 0.549 2.38 0.553 -0.199 0.842
8- In general, once I find the
right way to do something, I
stick to it.
2.48 0.539 2.49 0.557 -0.516 0.606
13- I am intrigued by the
patterns I find in art and
nature.
2.37 0.544 2.33 0.541 -0.793 0.428
18- I believe letting students
hear controversial speakers
can only confuse and mislead
them.
2.25 0.473 2.33 0.547 -2.207 0.027
23- Poetry has little or no
effect on me. 2.22 0.469 2.27 0.542 -1.347 0.178
28- I often try new and
foreign foods. 2.18 0.419 2.37 0.538 -5.628 <0.01
33- I seldom notice the
moods or feelings that
different environments
produce.
2.22 0.481 2.32 0.527 -2.691 0.007
38- I believe we should look
to our religious authorities for
decisions on moral issues.
2.29 0.519 2.38 0.529 -2.228 0.026
Univers
ity of
Mala
ya

136
„Table 4.5, continued‟
43- Sometimes when I am
reading poetry or looking at a
work of art, I feel a chill or
wave.
2.3
0.53
2.28
0.536
-0.566
0.571
48- I have little interest in
speculating on the nature of
the universe or the human
condition.
2.3 0.528 2.24 0.516 -1.736 0.083
53- I have a lot of intellectual
curiosity. 2.41 0.563 2.35 0.546 -1.428 0.153
58- I often enjoy playing with
theories or abstract ideas. 2.41 0.567 2.26 0.555 -3.633 <0.01
4.3.1.4 Agreeableness
In NEO-FFI inventory question number 4, 9, 14, 18, 24, 29, 34, 39, 44, 49, 54,
and 59 evaluate the measurement (Dimension) of agreeableness. According to
descriptive statistics of related items to agreeableness (Table 4-6), the highest mean
belongs to NEO49 for both International (M=2.28, SD=846) and Malaysian students
(M=2.29, SD=0.736) followed by NEO4 for both International (M=2.26, SD= 1.013)
and Malaysian (M=2.29, SD=0.817) students. The lowest mean was belonged to
NEO44 for both International (M=2.03, SD=835) and Malaysian (M=2.07, SD=0.698)
students. U Mann-Whitney U test was applied for comparison of related items to
agreeableness between Malaysian and International students and the results showed that
there were significant for items of NEO9, NEO24, NEO54, between Malaysian and
International students.
Univers
ity of
Mala
ya
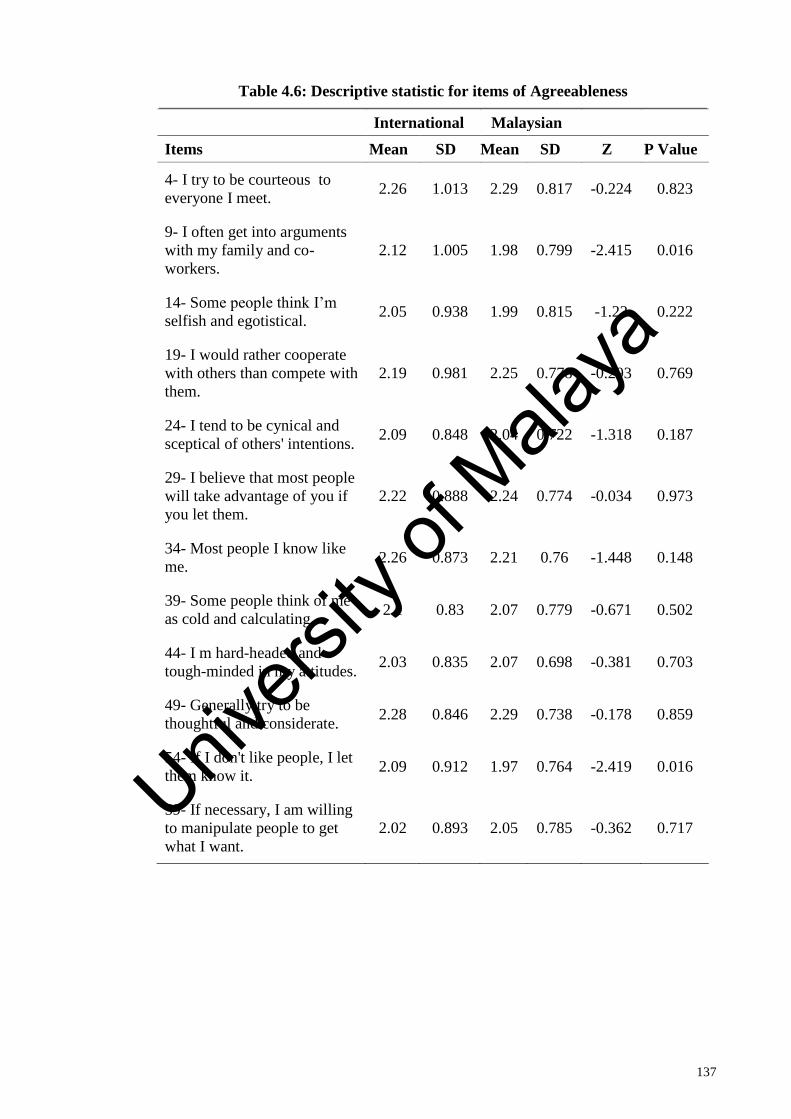
137
Table 4.6: Descriptive statistic for items of Agreeableness
International Malaysian
Items Mean SD Mean SD Z P Value
4- I try to be courteous to
everyone I meet. 2.26 1.013 2.29 0.817 -0.224 0.823
9- I often get into arguments
with my family and co-
workers.
2.12 1.005 1.98 0.799 -2.415 0.016
14- Some people think I‟m
selfish and egotistical. 2.05 0.938 1.99 0.815 -1.22 0.222
19- I would rather cooperate
with others than compete with
them.
2.19 0.981 2.25 0.778 -0.293 0.769
24- I tend to be cynical and
sceptical of others' intentions. 2.09 0.848 2.04 0.722 -1.318 0.187
29- I believe that most people
will take advantage of you if
you let them.
2.22 0.888 2.24 0.774 -0.034 0.973
34- Most people I know like
me. 2.26 0.873 2.21 0.76 -1.448 0.148
39- Some people think of me
as cold and calculating. 2.1 0.83 2.07 0.779 -0.671 0.502
44- I m hard-headed and
tough-minded in my attitudes. 2.03 0.835 2.07 0.698 -0.381 0.703
49- Generally try to be
thoughtful and considerate. 2.28 0.846 2.29 0.738 -0.178 0.859
54- If I don't like people, I let
them know it. 2.09 0.912 1.97 0.764 -2.419 0.016
59- If necessary, I am willing
to manipulate people to get
what I want.
2.02 0.893 2.05 0.785 -0.362 0.717
Univers
ity of
Mala
ya

138
4.3.1.5 Conscientiousness
In NEO-FFI inventory question number 5, 10, 15, 20, 25, 30, 35, 40, 45, 50, 55,
and 60 evaluate the measurement (Dimension) of conscientiousness. According to
descriptive statistics of related items to conscientiousness (Table 4.7), the highest mean
belongs to NEO35 for both International (M=2.62, SD=872) and Malaysian students
(M=2.64, SD=0.751) followed by NEO40 for both International (M=2.58, SD= 0.823)
and Malaysian (M=2.64, SD=0.751) students. The lowest mean was belonged to
NEO15 for both International (M=2.38, SD=79) and Malaysian (M=2.29, SD=0.75)
students. U Mann-Whitney U test was applied for comparison of related items to
conscientiousness between Malaysian and International students and the results showed
that there were significant for items of NEO15, NEO45 between Malaysian and
International students.
Univers
ity of
Mala
ya
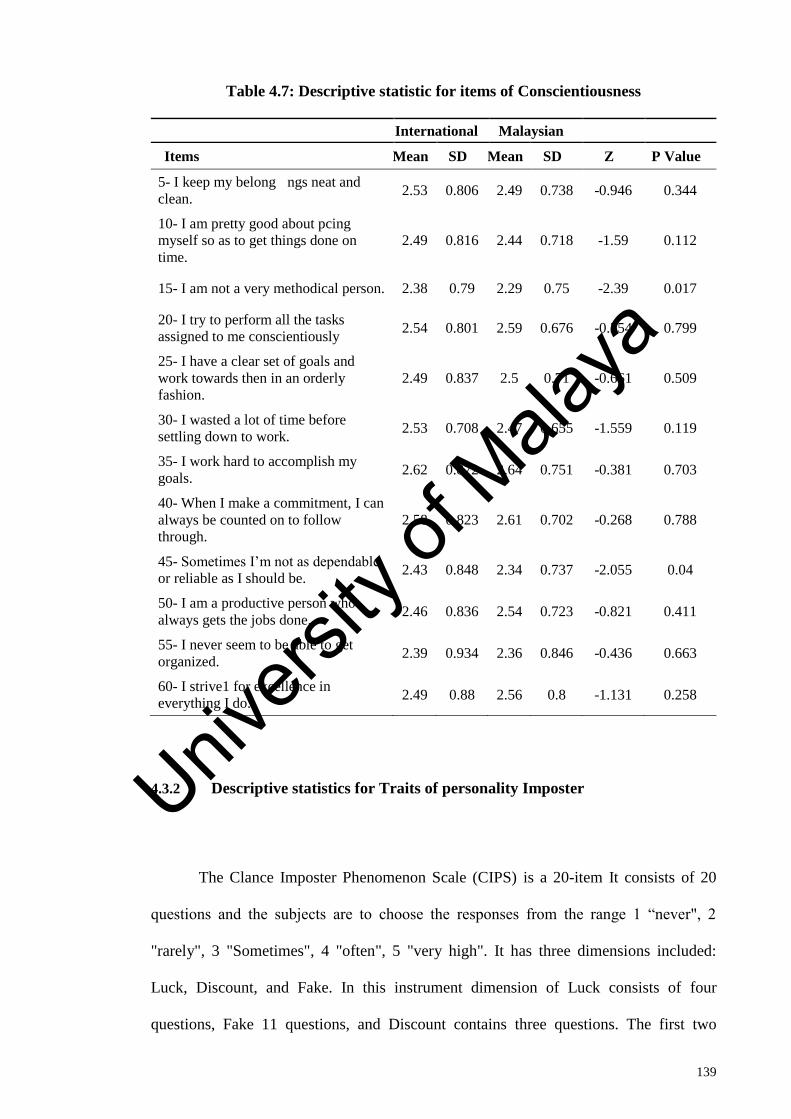
139
Table 4.7: Descriptive statistic for items of Conscientiousness
International Malaysian
Items Mean SD Mean SD Z P Value
5- I keep my belong ngs neat and
clean. 2.53 0.806 2.49 0.738 -0.946 0.344
10- I am pretty good about pcing
myself so as to get things done on
time.
2.49 0.816 2.44 0.718 -1.59 0.112
15- I am not a very methodical person. 2.38 0.79 2.29 0.75 -2.39 0.017
20- I try to perform all the tasks
assigned to me conscientiously 2.54 0.801 2.59 0.676 -0.254 0.799
25- I have a clear set of goals and
work towards then in an orderly
fashion.
2.49 0.837 2.5 0.71 -0.661 0.509
30- I wasted a lot of time before
settling down to work. 2.53 0.708 2.47 0.655 -1.559 0.119
35- I work hard to accomplish my
goals. 2.62 0.872 2.64 0.751 -0.381 0.703
40- When I make a commitment, I can
always be counted on to follow
through.
2.58 0.823 2.61 0.702 -0.268 0.788
45- Sometimes I‟m not as dependable
or reliable as I should be. 2.43 0.848 2.34 0.737 -2.055 0.04
50- I am a productive person who
always gets the jobs done. 2.46 0.836 2.54 0.723 -0.821 0.411
55- I never seem to be able to get
organized. 2.39 0.934 2.36 0.846 -0.436 0.663
60- I strive1 for excellence in
everything I do. 2.49 0.88 2.56 0.8 -1.131 0.258
4.3.2 Descriptive statistics for Traits of personality Imposter
The Clance Imposter Phenomenon Scale (CIPS) is a 20-item It consists of 20
questions and the subjects are to choose the responses from the range 1 “never", 2
"rarely", 3 "Sometimes", 4 "often", 5 "very high". It has three dimensions included:
Luck, Discount, and Fake. In this instrument dimension of Luck consists of four
questions, Fake 11 questions, and Discount contains three questions. The first two
Univers
ity of
Mala
ya
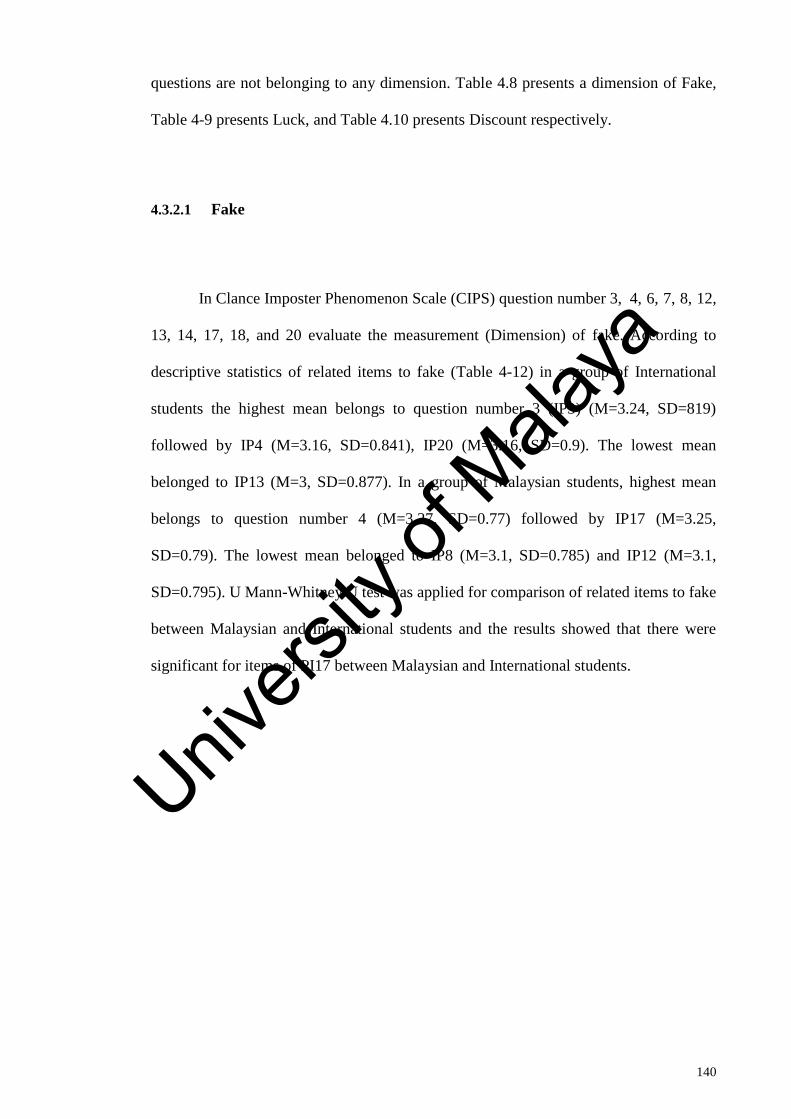
140
questions are not belonging to any dimension. Table 4.8 presents a dimension of Fake,
Table 4-9 presents Luck, and Table 4.10 presents Discount respectively.
4.3.2.1 Fake
In Clance Imposter Phenomenon Scale (CIPS) question number 3, 4, 6, 7, 8, 12,
13, 14, 17, 18, and 20 evaluate the measurement (Dimension) of fake. According to
descriptive statistics of related items to fake (Table 4-12) in a group of International
students the highest mean belongs to question number 3 (IP3) (M=3.24, SD=819)
followed by IP4 (M=3.16, SD=0.841), IP20 (M=3.16, SD=0.9). The lowest mean
belonged to IP13 (M=3, SD=0.877). In a group of Malaysian students, highest mean
belongs to question number 4 (M=3.27, SD=0.77) followed by IP17 (M=3.25,
SD=0.79). The lowest mean belonged to IP8 (M=3.1, SD=0.785) and IP12 (M=3.1,
SD=0.795). U Mann-Whitney U test was applied for comparison of related items to fake
between Malaysian and International students and the results showed that there were
significant for items of PI17 between Malaysian and International students.
Univers
ity of
Mala
ya
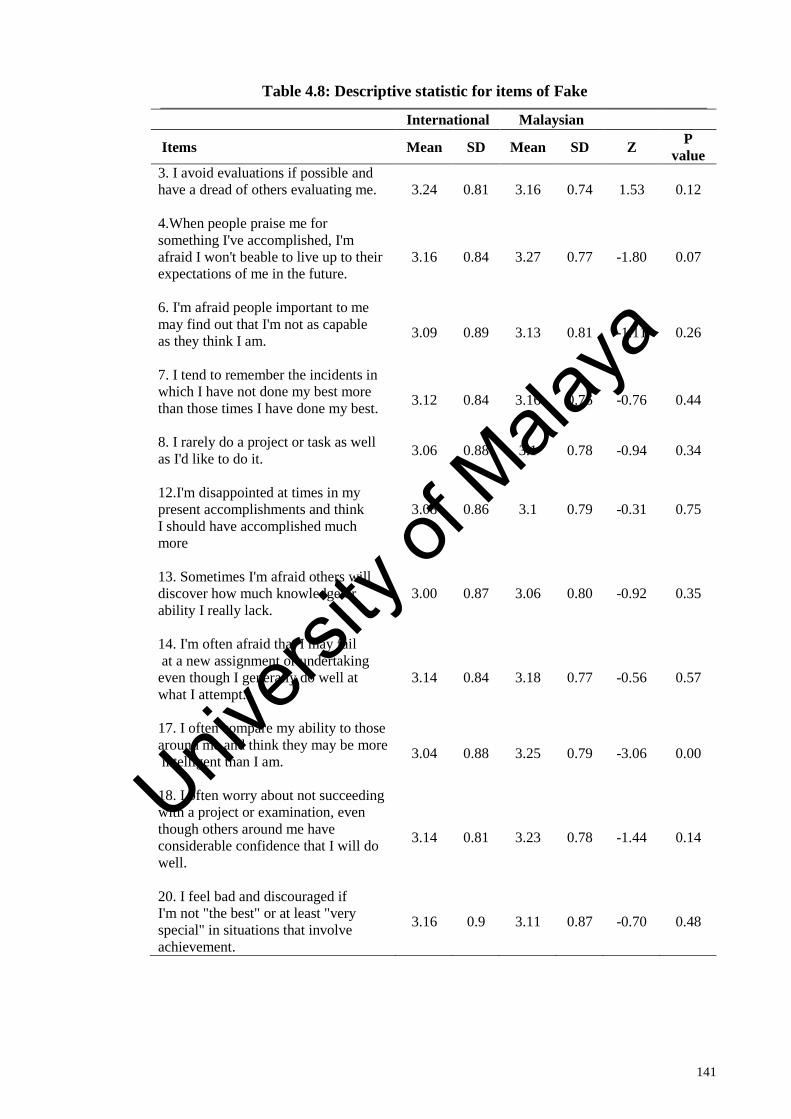
141
Table 4.8: Descriptive statistic for items of Fake
International Malaysian
Items Mean SD Mean SD Z P
value
3. I avoid evaluations if possible and
have a dread of others evaluating me.
3.24 0.81 3.16 0.74 1.53 0.12
4.When people praise me for
something I've accomplished, I'm
afraid I won't beable to live up to their
expectations of me in the future.
3.16 0.84 3.27 0.77 -1.80 0.07
6. I'm afraid people important to me
may find out that I'm not as capable
as they think I am.
3.09 0.89 3.13 0.81 -1.11 0.26
7. I tend to remember the incidents in
which I have not done my best more
than those times I have done my best.
3.12 0.84 3.16 0.76 -0.76 0.44
8. I rarely do a project or task as well
as I'd like to do it. 3.06 0.88 3.1 0.78 -0.94 0.34
12.I'm disappointed at times in my
present accomplishments and think
I should have accomplished much
more
3.08 0.86 3.1 0.79 -0.31 0.75
13. Sometimes I'm afraid others will
discover how much knowledge or
ability I really lack.
3.00 0.87 3.06 0.80 -0.92 0.35
14. I'm often afraid that I may fail
at a new assignment or undertaking
even though I generally do well at
what I attempt.
3.14 0.84 3.18 0.77 -0.56 0.57
17. I often compare my ability to those
around me and think they may be more
intelligent than I am.
3.04 0.88 3.25 0.79 -3.06 0.00
18. I often worry about not succeeding
with a project or examination, even
though others around me have
considerable confidence that I will do
well.
3.14 0.81 3.23 0.78 -1.44 0.14
20. I feel bad and discouraged if
I'm not "the best" or at least "very
special" in situations that involve
achievement.
3.16 0.9 3.11 0.87 -0.70 0.48
Univers
ity of
Mala
ya

142
4.3.2.2 Luck
In Clance Imposter Phenomenon Scale (CIPS) question number 5, 9, 11, and 15
evaluate the measurement (Dimension) of Luck. According to descriptive statistics of
related items to Luck (Table 4.13) in a group of International students the highest mean
belongs to question number 5 (M=2.91, SD=0.974) followed by IP9 (M=2.91,
SD=1.048), IP15 (M=2.91, SD=0.975). The last and least mean was belongs to IP11
(M=2.77, SD=1.048). In a group of Malaysian students, highest mean belongs to
question number 15 (M=3.22, SD=0.783) followed by IP11 (M=3.17, SD=0.844). The
last and the least lowest mean was belonged to IP5 (M=3.12, SD=0.839) and IP9
(M=3.1, SD=0.888).U Mann-Whitney U test was applied for comparison of related
items to luck between Malaysian and International students and the results showed that
there were significant for items of PI5, PI11, PI15 between Malaysian and International
students.
Table 4.9: Descriptive statistic for items of Luck
International Malaysian
Items Mean SD Mean SD Z P Value
5. I sometimes think I
obtained my present position
or gained my present success
because I happened to be in
the right place at the right
time or knew the right people.
2.91 0.974 3.12 0.839 -3.082 0.002
9. Sometimes I feel or believe
that my success in my life or
in my job has been the result
of some kind of error.
2.91 1.048 3.01 0.888 -1.357 0.175
11. At times, I feel my
success has been due to some
kind of luck.
2.77 1.04 3.17 0.844 -5.431 <0.01
15. When I've succeeded at
something and received
recognition for my
accomplishments, I have
doubts that I can keep
repeating that success.
2.91 0.975 3.22 0.783 -4.472 <0.01
Univers
ity of
Mala
ya

143
4.3.2.3 Discount
In Clance Imposter Phenomenon Scale (CIPS) question number 10, 16, and 19
evaluate the measurement (Dimension) of Discount. According to descriptive statistics
of related items to Discount (Table 4.14) in a group of International students the highest
mean belongs to question number 19 (M=3.21, SD=0.985) followed by IP16 (M=3.05,
SD=0.911). The last and least mean was belongs to IP10 (M=2.94, SD=0.963). In a
group of Malaysian students, highest mean belongs to question number 19 (M=3.27,
SD=0.85) followed by IP16 (M=3.12, SD=0.754). ). U Mann-Whitney U test was
applied for comparison of related items to Discount between Malaysian and
International students and the results showed that there were no significant for all items
between Malaysian and International students.
Table 4.10: Descriptive Statistic for Items of Discount
International Malaysian
Items Mean SD Mean SD Z P Value
10. it's hard for me to
accept compliments or
praise about my
intelligence or
accomplishments.
2.94 0.963 2.99 0.796 -0.226 0.821
16. If I receive a great
deal of praise and
recognition for
something I've
accomplished, I tend to
discount the importance
of what I've done.
3.05 0.911 3.12 0.754 -0.389 0.697
19. If I'm going to
receive a promotion or
gain recognition of some
kind, I hesitate to tell
others until it is an
accomplished fact.
3.21 0.985 3.27 0.85 -0.481 0.631
Univers
ity of
Mala
ya

144
4.3.3 Descriptive statistics for Traits of personality Machiavellian:
The Mach IV is made up of 20 items and the subjects are to choose the
responses to rate the extent to which they agreed or disagreed with the statements on a
5-point Likert-type scale: 1 = Strongly Disagree, 2 = Disagree, 3=Neutral, 5 = Agree
and 6 =Strongly Agree. In our study, we have chosen the four subscale design, which is
including Positive View Human Nature, Cynical View Human Nature, Positive
interpersonal Tactics, and Negative interpersonal tactics. Positive View Human Nature
contains four questions, Cynical View Human Nature contains six questions, Positive
interpersonal Tactics contains six questions, and Negative interpersonal tactics have
four items. Tables 4.15, 4.16, 4.17, and Table 4.18 present each dimension mean and
standard deviation respectively.
4.3.3.1 Positive View of Human Nature
In The Mach IV question number 14, 17, 20, and 12 evaluate the measurement
(Dimension) of The Positive View Human Nature. According to descriptive statistics of
related items to Positive View Human Nature (Table 4.11) in a group of International
students the highest mean belongs to question number Mach14 (M=3.29, SD=835)
followed by Mach17 (M=3.15, SD=0.773). The last and least mean was belongs to
Mach12 (M=3.1, SD=0.785, and Mach12 (M=3.09, SD=1.02). In a group of Malaysian
students, highest mean belongs to question number Mach14 (M=3.43, SD=0.777)
followed by Mach20 (M=3.1, SD=0.723). The last and least mean was belongs to
Mach17 (M=3.17, SD=0.785, and Mach12 (M=2.92, SD=0.881). U Mann-Whitney U
test was applied for comparison of related items to Positive View Human Nature
Univers
ity of
Mala
ya

145
between Malaysian and International students and the results showed that there were
significant for items Mach14, Mach12 between Malaysian and International students.
Table 4.11: Descriptive statistic for items of Positive View Human Nature
International Malaysian
Items Mean SD Mean SD Z P Value
14. Most people are
basically good and kind. 3.29 0.835 3.43 0.777 -2.696 0.007
17. Most people who get
ahead in the world lead
clean, moral lives.
3.15 0.773 3.17 0.723 -0.375 0.708
20. Most men are brave. 3.1 0.785 3.2 0.749 -1.723 0.085
12. People suffering from
incurable diseases should
have the choice of being put
painlessly to death.
3.09 1.02 2.92 0.881 -2.518 0.012
4.3.3.2 Negative Interpersonal Tactics
In The Mach IV question number 1, 3, 7, and 9 evaluate the measurement
(Dimension) of The Negative interpersonal tactics. According to descriptive statistics of
related items to Negative interpersonal tactics (Table 4.12) in a group of International
students, the highest mean belongs to question number Mach3 (M=3.32, SD=0.928)
followed by Mach1 (M=3.21, SD=0.894) and Mach9 (M=3.21, SD=0.914).The last
mean was belonged to Mach7 (M=3.18, SD=0.934. In a group of Malaysian students,
highest mean belongs to question number Mach1 (M=3.23, SD=0.869) followed by
Mach3 (M=3.21, SD=0.861). The last and least mean was belongs to Mach7 (M=3.15,
SD=0.886, and Mach9 (M=3.07, SD=0.798). U Mann-Whitney U test was applied for
comparison of related items to Negative Interpersonal Tactics between Malaysian and
International students and the results showed that there were significant for items
Mach9, Mach3 between Malaysian and International students.
Univers
ity of
Mala
ya

146
Table 4.12: Descriptive statistics for items of Negative interpersonal tactics
International Malaysian
Items Mean SD Mean SD Z P Value
7. Never tell anyone the
real reason you did
something unless it is
useful to do so
3.18 0.934 3.15 0.866 -0.554 0.579
9. It is wise to flatter
important people. 3.21 0.914 3.07 0.798 -2.434 0.015
1. The best way to handle
people is to tell them
what they want to hear.
3.21 0.894 3.23 0.869 -0.582 0.56
3. Anyone who
completely trusts anyone
is asking for trouble.
3.32 0.928 3.21 0.861 -2.153 0.031
4.3.3.3 Positive Interpersonal Tactics
In The Mach IV question number 2, 5, 8, 10, 13, and 15 evaluate the
measurement (Dimension) of The Positive interpersonal tactics. According to
descriptive statistics of related items to Positive interpersonal tactics (Table 4.13) in a
group of International students the highest mean belongs to question number Mach5
(M=3.62, SD=0.95) followed by Mach10 (M=3.621, SD=0.929). The lowest mean
belonged to Mach13 (M=3.47, SD=0.896). In a group of Malaysian students, highest
mean belongs to question number Mach10 (M=3.62, SD=0.929) followed by Mach5
(M=3.62, SD=0.854). The last and least mean was belongs to Mach15 (M=3.5,
SD=0.783) and Mach13 (M=3.53, SD=0.85). U Mann-Whitney U test was applied for
comparison of related items to Positive Interpersonal Tactics between Malaysian and
International students and the results showed that there were no significant for all items
between Malaysian and International students.
Univers
ity of
Mala
ya
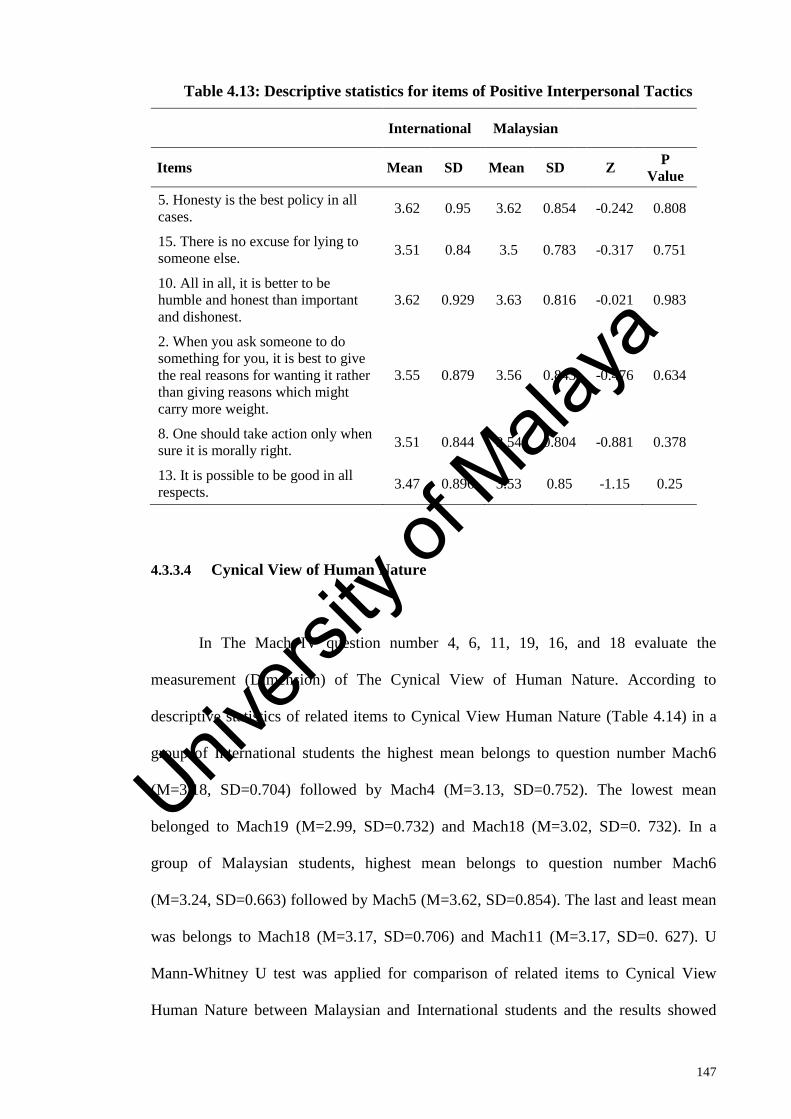
147
Table 4.13: Descriptive statistics for items of Positive Interpersonal Tactics
International Malaysian
Items Mean SD Mean SD Z P
Value
5. Honesty is the best policy in all
cases. 3.62 0.95 3.62 0.854 -0.242 0.808
15. There is no excuse for lying to
someone else. 3.51 0.84 3.5 0.783 -0.317 0.751
10. All in all, it is better to be
humble and honest than important
and dishonest.
3.62 0.929 3.63 0.816 -0.021 0.983
2. When you ask someone to do
something for you, it is best to give
the real reasons for wanting it rather
than giving reasons which might
carry more weight.
3.55 0.879 3.56 0.843 -0.476 0.634
8. One should take action only when
sure it is morally right. 3.51 0.844 3.54 0.804 -0.881 0.378
13. It is possible to be good in all
respects. 3.47 0.896 3.53 0.85 -1.15 0.25
4.3.3.4 Cynical View of Human Nature
In The Mach IV question number 4, 6, 11, 19, 16, and 18 evaluate the
measurement (Dimension) of The Cynical View of Human Nature. According to
descriptive statistics of related items to Cynical View Human Nature (Table 4.14) in a
group of International students the highest mean belongs to question number Mach6
(M=3.18, SD=0.704) followed by Mach4 (M=3.13, SD=0.752). The lowest mean
belonged to Mach19 (M=2.99, SD=0.732) and Mach18 (M=3.02, SD=0. 732). In a
group of Malaysian students, highest mean belongs to question number Mach6
(M=3.24, SD=0.663) followed by Mach5 (M=3.62, SD=0.854). The last and least mean
was belongs to Mach18 (M=3.17, SD=0.706) and Mach11 (M=3.17, SD=0. 627). U
Mann-Whitney U test was applied for comparison of related items to Cynical View
Human Nature between Malaysian and International students and the results showed
Univers
ity of
Mala
ya

148
that there were significant for items Mach18, Mach19 between Malaysian and
International students.
Table 4.14: Descriptive statistics for items of Cynical View Human Nature
International Malaysian
Items Mean SD Mean SD Z P Value
6. It is safest to assume that all people
have vicious streak and it will come out
when they are given a chance.
3.18 0.704 3.24 0.663 -1.351 0.177
11. Barnum was very wrong when he
said there's a sucker born every minute. 3.11 0.646 3.17 0.627 -1.239 0.215
19. The biggest difference between
most criminals and other people is that
criminals are stupid enough to get
caught.
2.99 0.732 3.16 0.668 -3.279 0.001
16. Most men forget more easily the
death of their father than the loss of
their property.
3.06 0.704 3.14 0.638 -1.547 0.122
18. Generally speaking, men won't
work hard unless they're forced to do so 3.02 0.732 3.17 0.706 -2.913 0.004
4. It is hard to get ahead without cutting
corners here and there. 3.13 0.752 3.14 0.711 -0.048 0.962
4.3.4 Descriptive statistics General Health Questionnaire
The GHQ-28 has a 4-item response scale anchored (typically) with „Not at all‟,
„No more than usual‟, „Rather more than usual‟, and „Much more than usual‟. Several
scoring options are available; we used the Likert method to indicate symptom severity,
which scores the item response between 0–3 (0–1–2–3, subscale range 0 to 21) as this is
the recommended method for assessment of the subscales. In this instrument consist of
four dimension include of Somatization, Depression, Anxiety, Social Dysfunction and
each scale consist of seven items. Tables 4.18, 4.19, 4.20, and 4.21 present each
dimension mean and standard deviation respectively.
Univers
ity of
Mala
ya
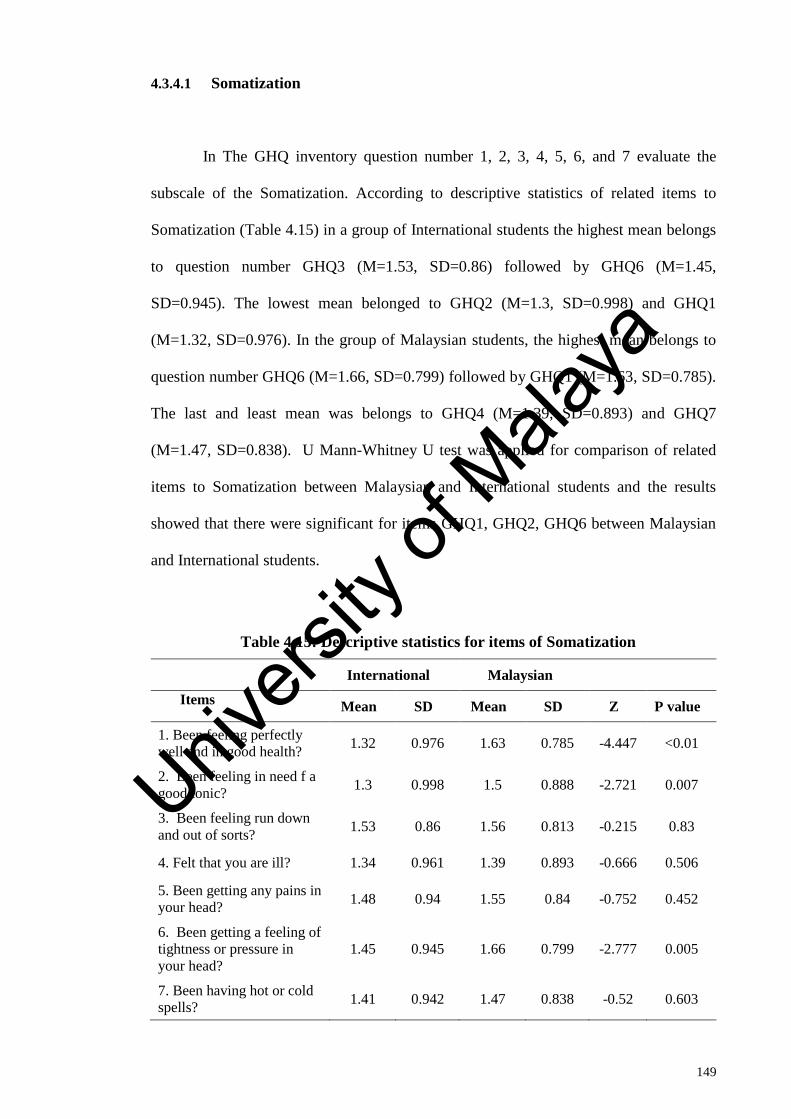
149
4.3.4.1 Somatization
In The GHQ inventory question number 1, 2, 3, 4, 5, 6, and 7 evaluate the
subscale of the Somatization. According to descriptive statistics of related items to
Somatization (Table 4.15) in a group of International students the highest mean belongs
to question number GHQ3 (M=1.53, SD=0.86) followed by GHQ6 (M=1.45,
SD=0.945). The lowest mean belonged to GHQ2 (M=1.3, SD=0.998) and GHQ1
(M=1.32, SD=0.976). In the group of Malaysian students, the highest mean belongs to
question number GHQ6 (M=1.66, SD=0.799) followed by GHQ1 (M=1.63, SD=0.785).
The last and least mean was belongs to GHQ4 (M=1.39, SD=0.893) and GHQ7
(M=1.47, SD=0.838). U Mann-Whitney U test was applied for comparison of related
items to Somatization between Malaysian and International students and the results
showed that there were significant for items GHQ1, GHQ2, GHQ6 between Malaysian
and International students.
Table 4.15: Descriptive statistics for items of Somatization
International Malaysian
Items
Mean SD Mean SD Z P value
1. Been feeling perfectly
well and in good health? 1.32 0.976 1.63 0.785 -4.447 <0.01
2. Been feeling in need f a
good tonic? 1.3 0.998 1.5 0.888 -2.721 0.007
3. Been feeling run down
and out of sorts? 1.53 0.86 1.56 0.813 -0.215 0.83
4. Felt that you are ill? 1.34 0.961 1.39 0.893 -0.666 0.506
5. Been getting any pains in
your head? 1.48 0.94 1.55 0.84 -0.752 0.452
6. Been getting a feeling of
tightness or pressure in
your head?
1.45 0.945 1.66 0.799 -2.777 0.005
7. Been having hot or cold
spells? 1.41 0.942 1.47 0.838 -0.52 0.603
Univers
ity of
Mala
ya

150
4.3.4.2 Depression
In The GHQ inventory question number 8, 9, 10, 11, 12, 13, and 14 evaluate the
subscale of the Depression. According to descriptive statistics of related items to
Depression (Table 4.16) in the group of International students, the highest mean belongs
to question number GHQ8 (M=1.53, SD=0.908) followed by GHQ13 (M=1.52,
SD=0.867). The lowest mean was belonged to GHQ9 (M=1.42, SD=0.873) and GHQ12
(M=1.42, SD=0.893). In a group of Malaysian students, the highest mean belongs to
question number GHQ8 (M=1.54, SD=0.85) followed by GHQ11 (M=1.54, SD=0.77).
The last and least mean was belongs to GHQ12 (M=1.46, SD=0.82) and GHQ9
(M=1.47, SD=0.808). U Mann-Whitney U test was applied for comparison of related
items to depression between Malaysian and International students and the results
showed that there were no significant for all items between Malaysian and International
students.
Table 4.16: Descriptive statistics for items of Depression
International Malaysian
Items
Mean SD Mean SD Z P Value
8. Lost much sleep over
worry? 1.53 0.908 1.54 0.85 -0.263 0.793
9. Had difficulty in
staying asleep once you
are off?
1.42 0.873 1.47 0.808 -0.622 0.534
10. Felt constantly
under strain? 1.49 0.877 1.48 0.811 -0.476 0.634
11. Been getting edgy
and bad-tempered? 1.44 0.878 1.54 0.77 -1.269 0.204
12. Been getting scared
or panicky for no good
reason?
1.42 0.893 1.46 0.82 -0.292 0.77
13. Found everything
getting on top of you? 1.52 0.867 1.5 0.796 -0.679 0.497
14. Been feeling nervous
and strung up all the
time?
1.44 0.938 1.5 0.871 -0.709 0.478
Univers
ity of
Mala
ya
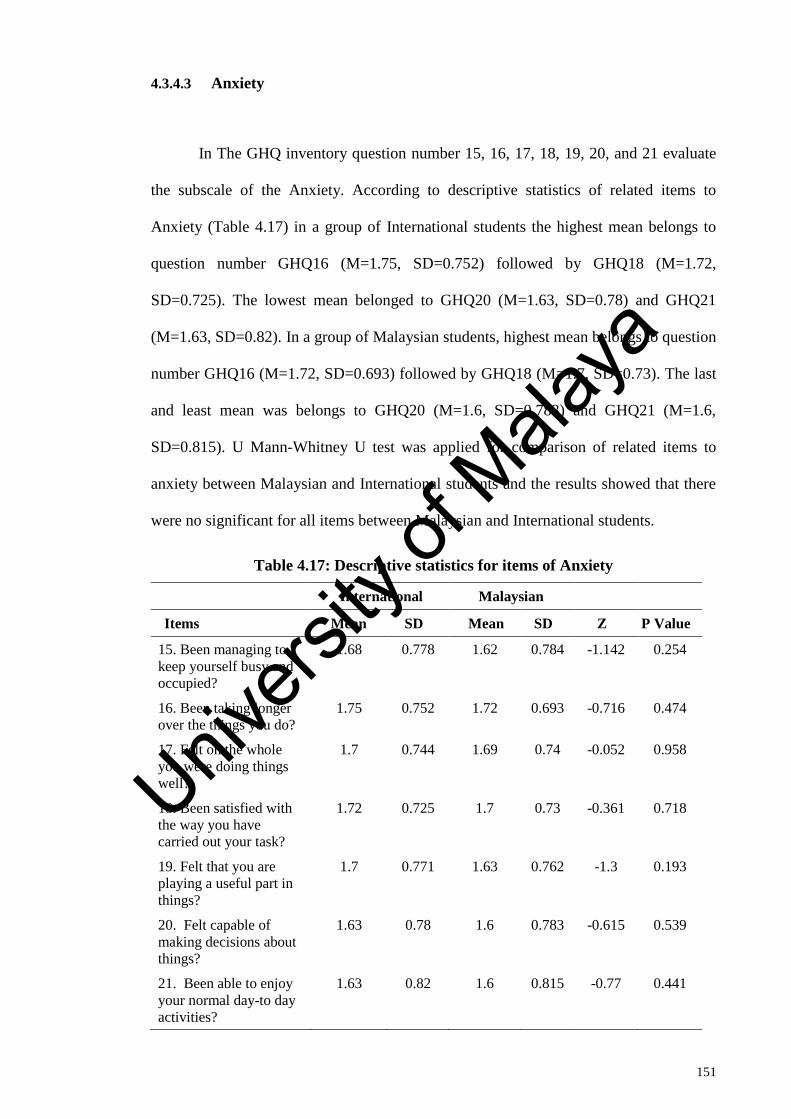
151
4.3.4.3 Anxiety
In The GHQ inventory question number 15, 16, 17, 18, 19, 20, and 21 evaluate
the subscale of the Anxiety. According to descriptive statistics of related items to
Anxiety (Table 4.17) in a group of International students the highest mean belongs to
question number GHQ16 (M=1.75, SD=0.752) followed by GHQ18 (M=1.72,
SD=0.725). The lowest mean belonged to GHQ20 (M=1.63, SD=0.78) and GHQ21
(M=1.63, SD=0.82). In a group of Malaysian students, highest mean belongs to question
number GHQ16 (M=1.72, SD=0.693) followed by GHQ18 (M=1.7, SD=0.73). The last
and least mean was belongs to GHQ20 (M=1.6, SD=0.783) and GHQ21 (M=1.6,
SD=0.815). U Mann-Whitney U test was applied for comparison of related items to
anxiety between Malaysian and International students and the results showed that there
were no significant for all items between Malaysian and International students.
Table 4.17: Descriptive statistics for items of Anxiety
International Malaysian
Items Mean SD Mean SD Z P Value
15. Been managing to
keep yourself busy and
occupied?
1.68 0.778 1.62 0.784 -1.142 0.254
16. Been taking longer
over the things you do?
1.75 0.752 1.72 0.693 -0.716 0.474
17. Felt on the whole
you were doing things
well?
1.7 0.744 1.69 0.74 -0.052 0.958
18. Been satisfied with
the way you have
carried out your task?
1.72 0.725 1.7 0.73 -0.361 0.718
19. Felt that you are
playing a useful part in
things?
1.7 0.771 1.63 0.762 -1.3 0.193
20. Felt capable of
making decisions about
things?
1.63 0.78 1.6 0.783 -0.615 0.539
21. Been able to enjoy
your normal day-to day
activities?
1.63 0.82 1.6 0.815 -0.77 0.441
Univers
ity of
Mala
ya

152
4.3.4.4 Social Dysfunction
In The GHQ inventory question number 22, 23, 24, 25, 26, 27, and 28 evaluate
the subscale of the Social Dysfunction. According to descriptive statistics of related
items to Social Dysfunction (Table 4.18) in a group of International students the highest
mean belongs to question number GHQ22 (M=1.32, SD=0.982) followed by GHQ22
(M=1.21, SD=0.987). The lowest mean belonged to GHQ27 (M=0.99, SD=1.01) and
GHQ24 (M=1.01, SD=0.993). In a group of Malaysian students, highest mean belongs
to question number GHQ26 (M=1.22, SD=0.927) followed by GHQ25 (M=1.16,
SD=0.958). The last and least mean was belongs to GHQ24 (M=0.9, SD=0.97) and
GHQ23 (M=0.95, SD=0.977). U Mann-Whitney U test was applied for comparison of
related items to social dysfunction between Malaysian and International students and
the results showed that there were significant for items GHQ22, GHQ23 between
Malaysian and International students.
Table 4.18: Descriptive statistics for items of Social Dysfunction
International Malaysian
Items Mean SD Mean SD Z P Value
22. Been thinking of yourself
as a worthless person?
1.32 0.982 1.03 0.995 -3.914 <0.01
23. Felt that life is entirely
hopeless?
1.21 0.987 0.95 0.977 -3.486 <0.01
24. Felt that life isn't worth
living?
1.01 0.993 0.9 0.97 -1.45 0.147
25. The thought of the
possibility that you might
make away with yourself?
1.21 0.966 1.16 0.958 -0.654 0.513
26. Found at times you
couldn't do anything because
your nerves were too bad?
1.15 0.993 1.22 0.927 -1.128 0.259
27. Found yourself wishing
you were dead and away from
it all?
0.99 1.01 0.97 0.95 -0.22 0.826
28. Found that the idea of
taking your own life kept
coming into your mind?
1.05 1.005 0.99 1.01 -0.812 0.417
Univers
ity of
Mala
ya
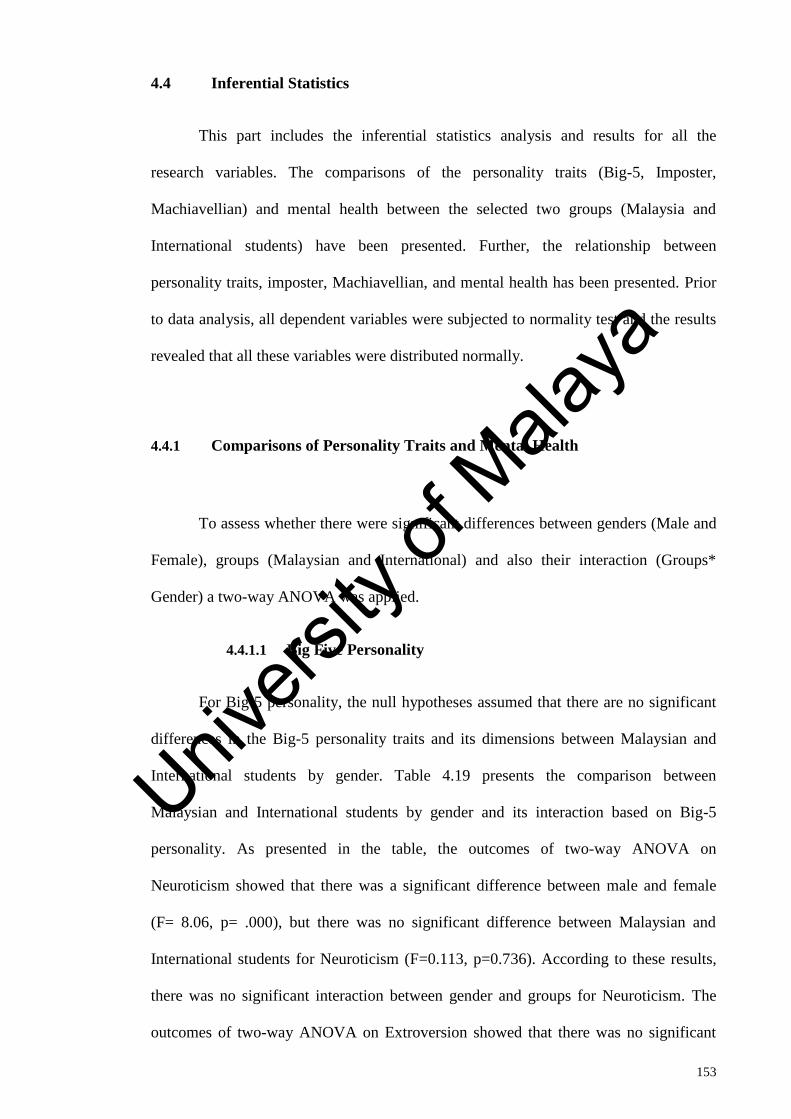
153
Inferential Statistics 4.4
This part includes the inferential statistics analysis and results for all the
research variables. The comparisons of the personality traits (Big-5, Imposter,
Machiavellian) and mental health between the selected two groups (Malaysia and
International students) have been presented. Further, the relationship between
personality traits, imposter, Machiavellian, and mental health has been presented. Prior
to data analysis, all dependent variables were subjected to normality test and the results
revealed that all these variables were distributed normally.
4.4.1 Comparisons of Personality Traits and Mental Health
To assess whether there were significant differences between genders (Male and
Female), groups (Malaysian and International) and also their interaction (Groups*
Gender) a two-way ANOVA was applied.
4.4.1.1 Big Five Personality
For Big-5 personality, the null hypotheses assumed that there are no significant
differences in the Big-5 personality traits and its dimensions between Malaysian and
International students by gender. Table 4.19 presents the comparison between
Malaysian and International students by gender and its interaction based on Big-5
personality. As presented in the table, the outcomes of two-way ANOVA on
Neuroticism showed that there was a significant difference between male and female
(F= 8.06, p= .000), but there was no significant difference between Malaysian and
International students for Neuroticism (F=0.113, p=0.736). According to these results,
there was no significant interaction between gender and groups for Neuroticism. The
outcomes of two-way ANOVA on Extroversion showed that there was no significant
Univers
ity of
Mala
ya
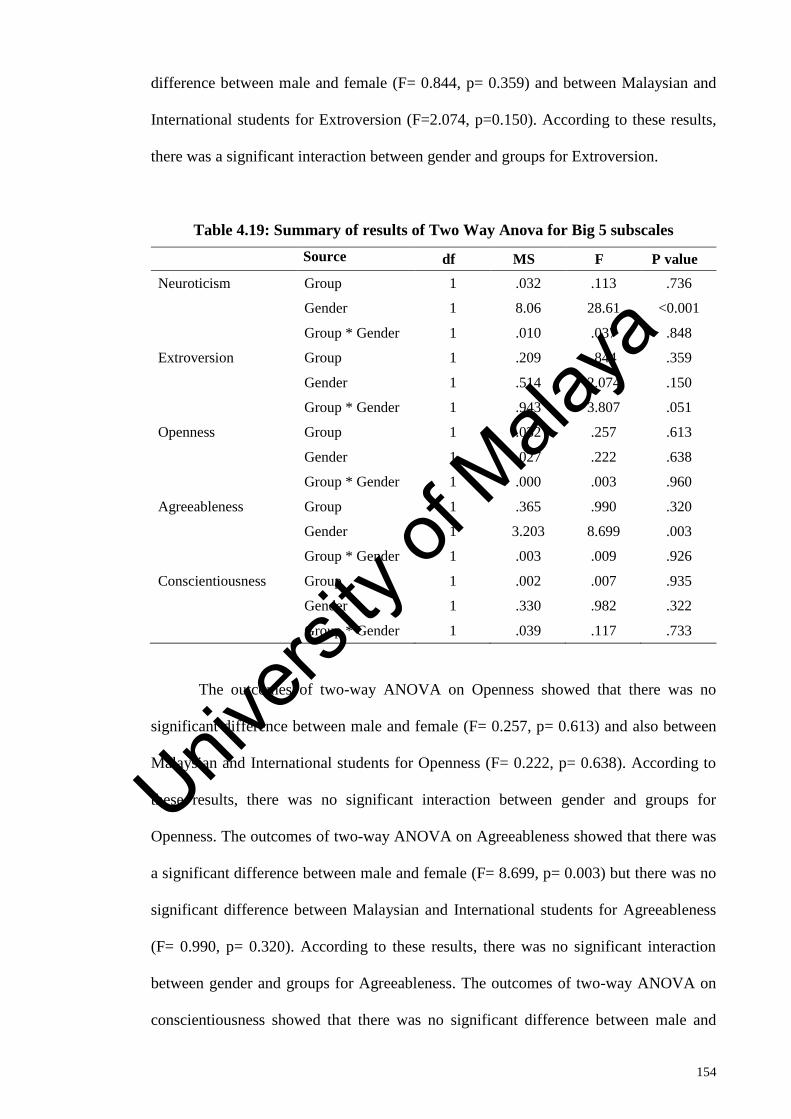
154
difference between male and female (F= 0.844, p= 0.359) and between Malaysian and
International students for Extroversion (F=2.074, p=0.150). According to these results,
there was a significant interaction between gender and groups for Extroversion.
Table 4.19: Summary of results of Two Way Anova for Big 5 subscales
Source df MS F P value
Neuroticism Group 1 .032 .113 .736
Gender 1 8.06 28.61 <0.001
Group * Gender 1 .010 .037 .848
Extroversion Group 1 .209 .844 .359
Gender 1 .514 2.074 .150
Group * Gender 1 .943 3.807 .051
Openness Group 1 .032 .257 .613
Gender 1 .027 .222 .638
Group * Gender 1 .000 .003 .960
Agreeableness Group 1 .365 .990 .320
Gender 1 3.203 8.699 .003
Group * Gender 1 .003 .009 .926
Conscientiousness Group 1 .002 .007 .935
Gender 1 .330 .982 .322
Group * Gender 1 .039 .117 .733
The outcomes of two-way ANOVA on Openness showed that there was no
significant difference between male and female (F= 0.257, p= 0.613) and also between
Malaysian and International students for Openness (F= 0.222, p= 0.638). According to
these results, there was no significant interaction between gender and groups for
Openness. The outcomes of two-way ANOVA on Agreeableness showed that there was
a significant difference between male and female (F= 8.699, p= 0.003) but there was no
significant difference between Malaysian and International students for Agreeableness
(F= 0.990, p= 0.320). According to these results, there was no significant interaction
between gender and groups for Agreeableness. The outcomes of two-way ANOVA on
conscientiousness showed that there was no significant difference between male and
Univers
ity of
Mala
ya

155
female (F=0.007, p= 0.322) and also between Malaysian and International students for
conscientiousness (F=0.982, p=0.322). According to these results, there was no
significant interaction between gender and groups for conscientiousness.
Bonferroni test was applied first to study the difference between Malaysian and
International students for each gender separately and the results (Table 4-20) showed
that the Neuroticism between Malaysian students and International student for both
male and female students were not statistically different (p>0.05). Extroversion,
Openness, Agreeableness, and Conscientiousness were not statistically different
between Malaysian and International students for both genders.
Table 4.20: Pairwise comparison between Malaysian and International for both
male and female NEO subscales
Mean
Gender International Malaysian
Mean
Difference SE P value
Neuroticism Male 1.827 1.833 -.006 .055 .918
Female 2.030 2.050 -.021 .056 .711
Extroversion Male 2.403 2.365 .038 .052 .462
Female 2.278 2.384 -.106
* .052 .044
Openness Male 2.313 2.327 -.014 .036 .691
Female 2.326 2.338 -.012 .037 .749
Agreeableness Male 2.089 2.040 .049 .063 .438
Female 2.217 2.176 .040 .064 .527
Conscientiousness Male 2.519 2.501 .018 .060 .763
Female 2.462 2.473 -.011 .061 .855
Table 4.21 illustrates the result of comparison between male and female students
for both groups separately using family wise Bonferroni test. The results revealed that
the Neuroticism and Agreeableness between male students and female students were
statistically different in both Malaysian and International students (p<0.05).
Extroversion was statistically different between International male and female students
Univers
ity of
Mala
ya

156
but was not statistically different between Malaysian male and female. Openness and
Conscientiousness between male students and female students were not statistically
different in both Malaysian and International students (p>0.05).
Table 4.21: Pairwise comparison between male and female for both Malaysian and
International students NEO
Mean
Male Female
Mean
Difference SE P value
Neuroticism International 1.827 2.030 -.202* .0 7 <0.001
Malaysian 1.833 2.050 -.217
* .054 <0.001
Extroversion International 2.403 2.278 .125* .054 .021
Malaysian 2.365 2.384 -.019 .050 .708
Openness International 2.313 2.326 -.014 .038 .721
Malaysian 2.327 2.338 -.011 .035 .758
Agreeableness International 2.089 2.217 -.128 .066 .051
Malaysian 2.040 2.176 -.136
* .061 .026
Consciousness International 2.519 2.462 .057 .063 .362
Malaysian 2.501 2.473 .028 .058 .634
Figure 4.1: Estimated Marginal Means of Neuroticism
1.827
2.03
1.833
2.050
1
1.2
1.4
1.6
1.8
2
2.2
Male Female Male Female
International Malaysian
Me
an S
core
Univers
ity of
Mala
ya
157
Figure 4.2: Estimated Marginal Means of Extroversion
Figure 4.3: Estimated Marginal Means of Openness
Figure 4.4: Estimated Marginal Means of Agreeableness
2.403 2.278
2.365 2.384
11.21.41.61.82
2.22.42.6
Male Female Male Female
International Malaysian
Me
an S
core
2.313
2.326 2.327 2.338
2.2
2.25
2.3
2.35
Male Female Male Female
International Malaysian
Me
an S
core
1.827
2.03
1.833
2.050
1
1.2
1.4
1.6
1.8
2
2.2
Male Female Male Female
International Malaysian
Me
an S
core
Univers
ity of
Mala
ya
158
Figure 4.5: Estimated Marginal Means of Conscientiousness
4.4.1.2 Imposter Phenomenon
For imposter personality, the null hypotheses assumed that there are no
significant differences in imposter personality traits and its dimension between
Malaysian and International students by gender. The outcomes of two-way ANOVA on
Luck showed that there was no significant difference between male and female (F=
2.614, p= 0.106) and there were no significant differences between Malaysian and
International students for Luck (F=6.863, p=0.0). According to these results, there was
no significant interaction between gender and groups for Luck. The discount was not
significantly difference between male and female (F= 4.505, p= 0.034) and there were
no significant differences between Malaysian and International students for Luck
(F=1.352, p=0.245). According to these results, there was no significant interaction
between gender and groups for Discount.
Fake showed that there was a significant difference between male and female
(F= 13.882, p= 0.00) and there was no significant difference between Malaysian and
International students for Fake (F=883, p=0.347). According to these results, there was
2.519 2.462 2.501 2.473
11.21.41.61.82
2.22.42.6
Male Female Male Female
International Malaysian
Me
an S
core
Univers
ity of
Mala
ya
159
no significant interaction between gender and groups for Fake. Total imposter showed
that there was a significant difference between male and female (F= 7.499, p= 0.006)
and there were significant differences between Malaysian and International students for
total Imposter (F=5.486, p=.019). According to these results, there was no significant
interaction between gender and groups for total Imposter.
Table 4.22: Summary of Results of Two Way Anova for Imposter Subscales
Source df MS F P value
Luck Group 1 6.863 17.800 <0.001
Gender 1 1.008 2.614 0.106
Group * Gender 1 0.016 0.040 0.841
Discount Group 1 0 432 1.520 0.245
Gender 1 1.440 4.505 0.034
Group * Gender 1 0.044 0.138 0.710
Fake Group 1 0.339 0.883 0.348
Gender 1 5.329 13.882 <0.001
Group * Gender 1 0.062 0.162 0.688
Total Imposter Group 1 1.655 5.486 0.019
Gender 1 2.262 7.499 <0.001
Group * Gender 1 0.001 0.003 0.958
Bonferroni test was applied first to study the difference between Malaysian and
International students for each gender separately and the results (Table 4.23) showed
that the Luck between Malaysian students and International student for both male and
female students were statistically different (p<0.05). Discount was not statistically
different between Malaysian students and International student for both male and
female students (p>0.05). Fake were not statistically different between Malaysian
students and International student for both male and female students (p>0.05). Total
Imposter was statistically different between Malaysian students for male students
(p<0.05) while it was not the statistically difference between Malaysian and
International student for female students (p>0.05).
Univers
ity of
Mala
ya
160
Table 4.23: Pairwise Comparison between Malaysian and International for both
Male and Female
Mean
Gender International Malaysian
Mea
Difference SE P value
Luck Male 2. 27 2.930 -.203* .064 .002
Female 2.810 2.995 -.184
* .065 .005
Discount Male 2.629 2.694 -.064 .059 .275
Female 2.734 2.767 -.033 .060 .579
Fake Male 3.146 3.170 -.025 .064 .702
Female 3.298 3.359 -.061 .065 .347
Total
Imposter
Male 2.834 2.931 -.097 .057 .088
Female 2.947 3.040 -.093 .058 .108
Table 4.24 illustrates the result of comparison between male and female students
for both groups separately using family wise Bonferroni test and the results revealed
that the Luck, Discount, Fake, and Total Imposter between male students and female
students was statistically different in both Malaysian and International students
(p<0.05).
Table 4.24: Pairwise Comparison between Male and Female for both Malaysian
and International Students
Mean
Male Female Mean Difference SE P value
Luck International 2.727 2.810 -.083 .067 .214
Malaysian 2.930 2.995 -.065 .063 .300
Discount International 2.629 2.734 -.104 .061 .088
Malaysian 2.694 2.767 -.073 .057 .200
Fake International 3.146 3.298 -.152* .067 .023
Malaysian 3.170 3.359 -.189* .062 .003
Total
Imposter
International 2.834 2.947 -.113 .059 .057
Malaysian 2.931 3.040 -.109* .055 .049
Univers
ity of
Mala
ya

161
Figure 4.6: Estimated Marginal Means of Luck
Figure 4.7: Estimated Marginal Means of Discount
Figure 4.8: Estimated Marginal Means of Fake
2.727 2.810
2.930 2.995
1
1.5
2
2.5
3
3.5
Male Female Male Female
International Malaysian
Mea
n S
core
2.629 2.733 2.693
2.766
11.21.41.61.82
2.22.42.62.83
Male Female Male Female
International Malaysian
Me
an S
core
3.145 3.297
3.170
3.359
1
1.5
2
2.5
3
3.5
Male Female Male Female
International Malaysian
Me
an S
core
Univers
ity of
Mala
ya
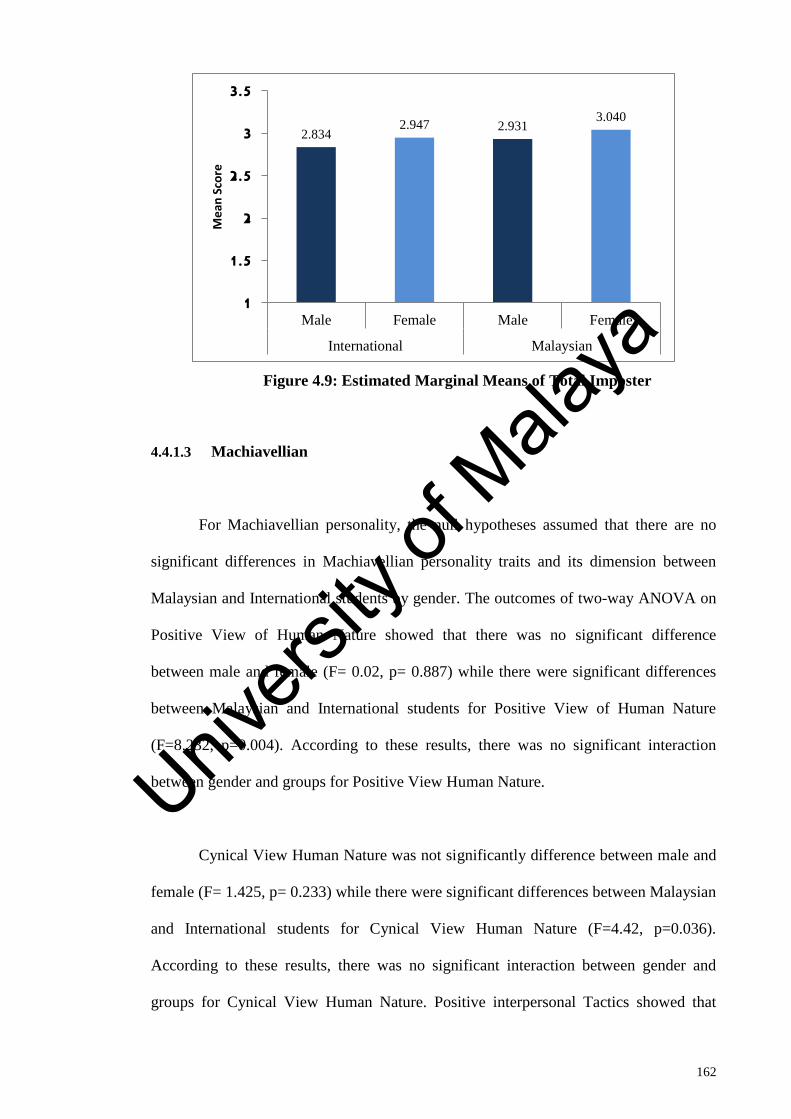
162
Figure 4.9: Estimated Marginal Means of Total Imposter
4.4.1.3 Machiavellian
For Machiavellian personality, the null hypotheses assumed that there are no
significant differences in Machiavellian personality traits and its dimension between
Malaysian and International students by gender. The outcomes of two-way ANOVA on
Positive View of Human Nature showed that there was no significant difference
between male and female (F= 0.02, p= 0.887) while there were significant differences
between Malaysian and International students for Positive View of Human Nature
(F=8.232, p=0.004). According to these results, there was no significant interaction
between gender and groups for Positive View Human Nature.
Cynical View Human Nature was not significantly difference between male and
female (F= 1.425, p= 0.233) while there were significant differences between Malaysian
and International students for Cynical View Human Nature (F=4.42, p=0.036).
According to these results, there was no significant interaction between gender and
groups for Cynical View Human Nature. Positive interpersonal Tactics showed that
2.834 2.947 2.931
3.040
1
1.5
2
2.5
3
3.5
Male Female Male Female
International Malaysian
Me
an S
core
Univers
ity of
Mala
ya
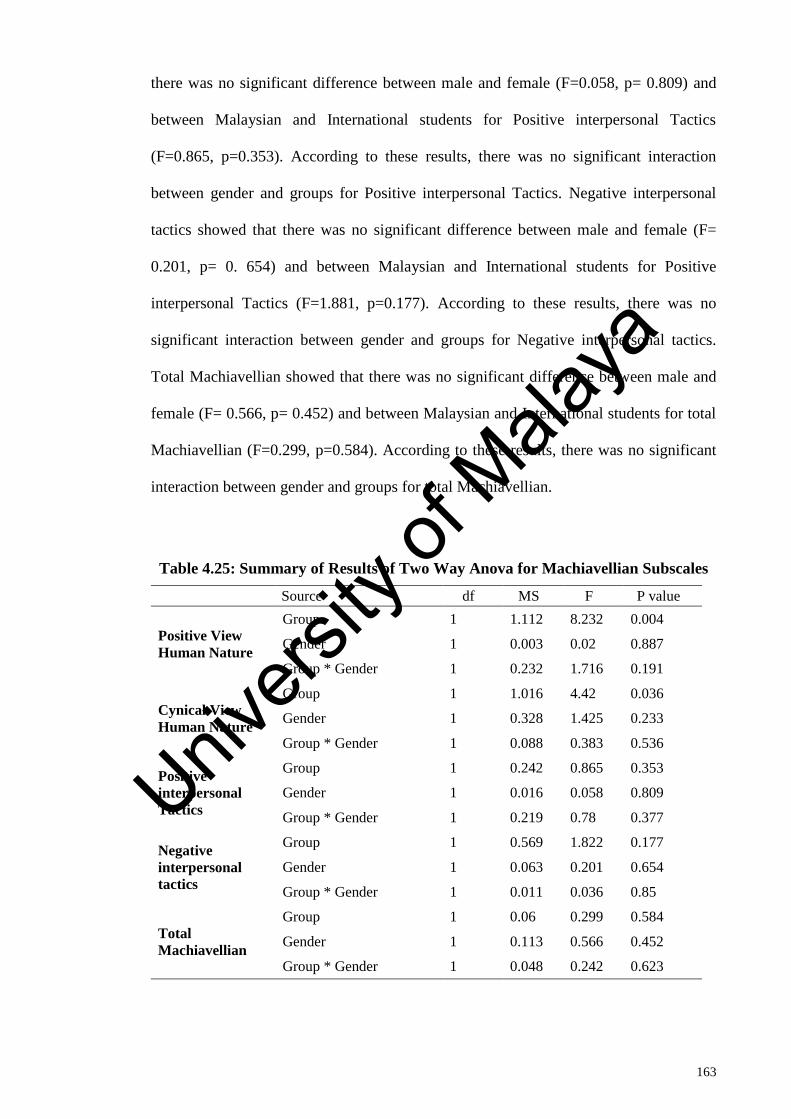
163
there was no significant difference between male and female (F=0.058, p= 0.809) and
between Malaysian and International students for Positive interpersonal Tactics
(F=0.865, p=0.353). According to these results, there was no significant interaction
between gender and groups for Positive interpersonal Tactics. Negative interpersonal
tactics showed that there was no significant difference between male and female (F=
0.201, p= 0. 654) and between Malaysian and International students for Positive
interpersonal Tactics (F=1.881, p=0.177). According to these results, there was no
significant interaction between gender and groups for Negative interpersonal tactics.
Total Machiavellian showed that there was no significant difference between male and
female (F= 0.566, p= 0.452) and between Malaysian and International students for total
Machiavellian (F=0.299, p=0.584). According to these results, there was no significant
interaction between gender and groups for total Machiavellian.
Table 4.25: Summary of Results of Two Way Anova for Machiavellian Subscales
Source df MS F P value
Positive View
Human Nature
Group 1 1.112 8.232 0.004
Gender 1 0.003 0.02 0.887
Group * Gender 1 0.232 1.716 0.191
Cynical View
Human Nature
Group 1 1.016 4.42 0.036
Gender 1 0.328 1.425 0.233
Group * Gender 1 0.088 0.383 0.536
Positive
interpersonal
Tactics
Group 1 0.242 0.865 0.353
Gender 1 0.016 0.058 0.809
Group * Gender 1 0.219 0.78 0.377
Negative
interpersonal
tactics
Group 1 0.569 1.822 0.177
Gender 1 0.063 0.201 0.654
Group * Gender 1 0.011 0.036 0.85
Total
Machiavellian
Group 1 0.06 0.299 0.584
Gender 1 0.113 0.566 0.452
Group * Gender 1 0.048 0.242 0.623
Univers
ity of
Mala
ya

164
Bonferroni test was applied first to study the difference between Malaysian and
International students for each gender separately and the results (Table 4.26) showed
that the Positive View Human Nature between Malaysian students and International
student for male students statistically different (p<0.05) while not statistically different
for female students. Cynical View Human Nature was not statistically different between
Malaysian and International student for both male and female (p>0.05). Positive
interpersonal Tactics were not statistically different between Malaysian students and
International student for both male and female students (p>0.05). Negative interpersonal
tactics were not statistically different between Malaysian students and International
student for both male and female students (p>0.05). Total Machiavellian were
statistically different between Malaysian students for male students (p<0.05) while it
was not the statistically difference between Malaysian and International student for
female students (p>0.05).
Table 4.26: Pairwise Comparison between Malaysian and International for both
Male and Female
Mean
Gender International Malaysian
Mean
Difference SE P value
Positive View
of Human
Nature
Male 2.3584 2.4719 .114* 0.038 0. 03
Female 2.3979 2.4402 -0.042 0.039 0.274
Cynical View
of Human
Nature
Male 2.9167 3.0131 -0.096 0.05 0.053
Female 2.9809 3.0335 -0.053 0.051 0.298
Positive
Interpersonal
Tactics
Male 3.2502 3.2521 -0.002 0.055 0.973
Female 3.2251 3.2961 -0.071 0.056 0.204
Negative
Interpersonal
Tactics
Male 2.8434 2.7799 0.064 0.058 0.273
Female 2.8541 2.8062 0.048 0.059 0.416
Total
Machiavellian
Male 3.2632 3.265 -0.002 0.046 0.968
Female 3.2718 3.306 -0.034 0.047 0.466
Univers
ity of
Mala
ya
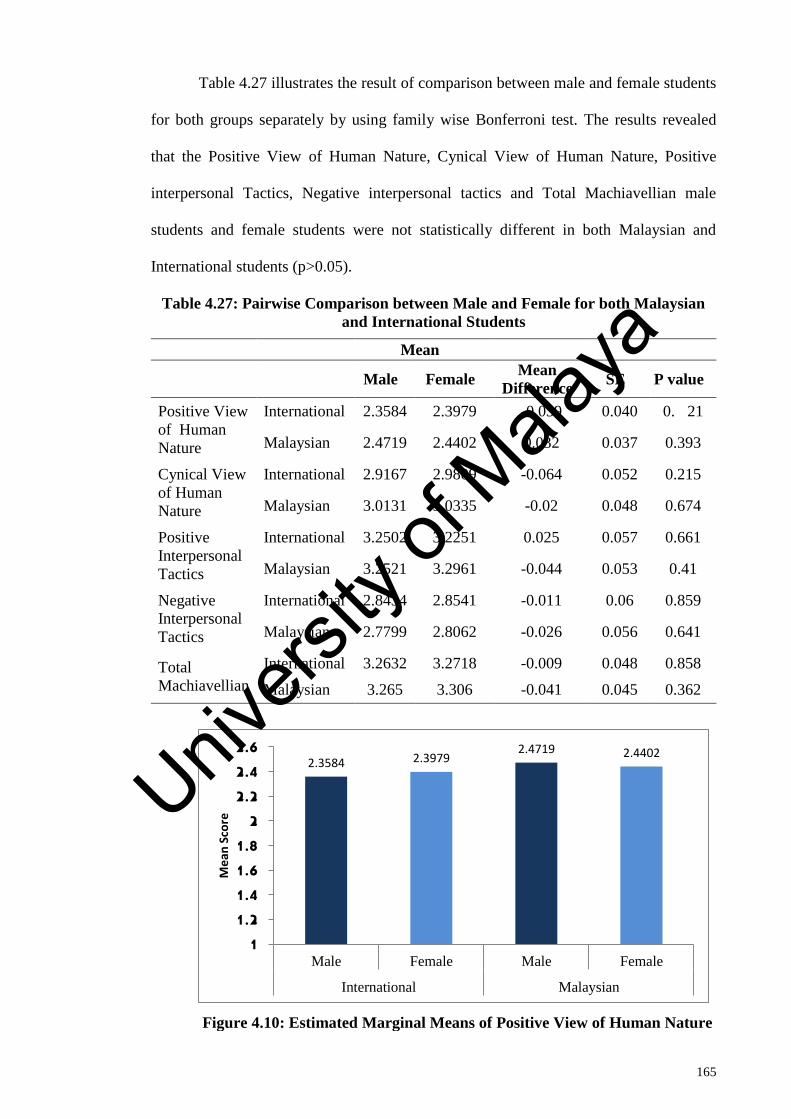
165
Table 4.27 illustrates the result of comparison between male and female students
for both groups separately by using family wise Bonferroni test. The results revealed
that the Positive View of Human Nature, Cynical View of Human Nature, Positive
interpersonal Tactics, Negative interpersonal tactics and Total Machiavellian male
students and female students were not statistically different in both Malaysian and
International students (p>0.05).
Table 4.27: Pairwise Comparison between Male and Female for both Malaysian
and International Students
Mean
Male Female
Mean
Difference SE P value
Positive View
of Human
Nature
International 2.3584 2.3979 -0.039 0.040 0. 21
Malaysian 2.4719 2.4402 0.032 0.037 0.393
Cynical View
of Human
Nature
International 2.9167 2.9809 -0.064 0.052 0.215
Malaysian 3.0131 3.0335 -0.02 0.048 0.674
Positive
Interpersonal
Tactics
International 3.2502 3.2251 0.025 0.057 0.661
Malaysian 3.2521 3.2961 -0.044 0.053 0.41
Negative
Interpersonal
Tactics
International 2.8434 2.8541 -0.011 0.06 0.859
Malaysian 2.7799 2.8062 -0.026 0.056 0.641
Total
Machiavellian
International 3.2632 3.2718 -0.009 0.048 0.858
Malaysian 3.265 3.306 -0.041 0.045 0.362
Figure 4.10: Estimated Marginal Means of Positive View of Human Nature
2.3584 2.3979 2.4719 2.4402
11.21.41.61.82
2.22.42.6
Male Female Male Female
International Malaysian
Me
an S
core
Univers
ity of
Mala
ya
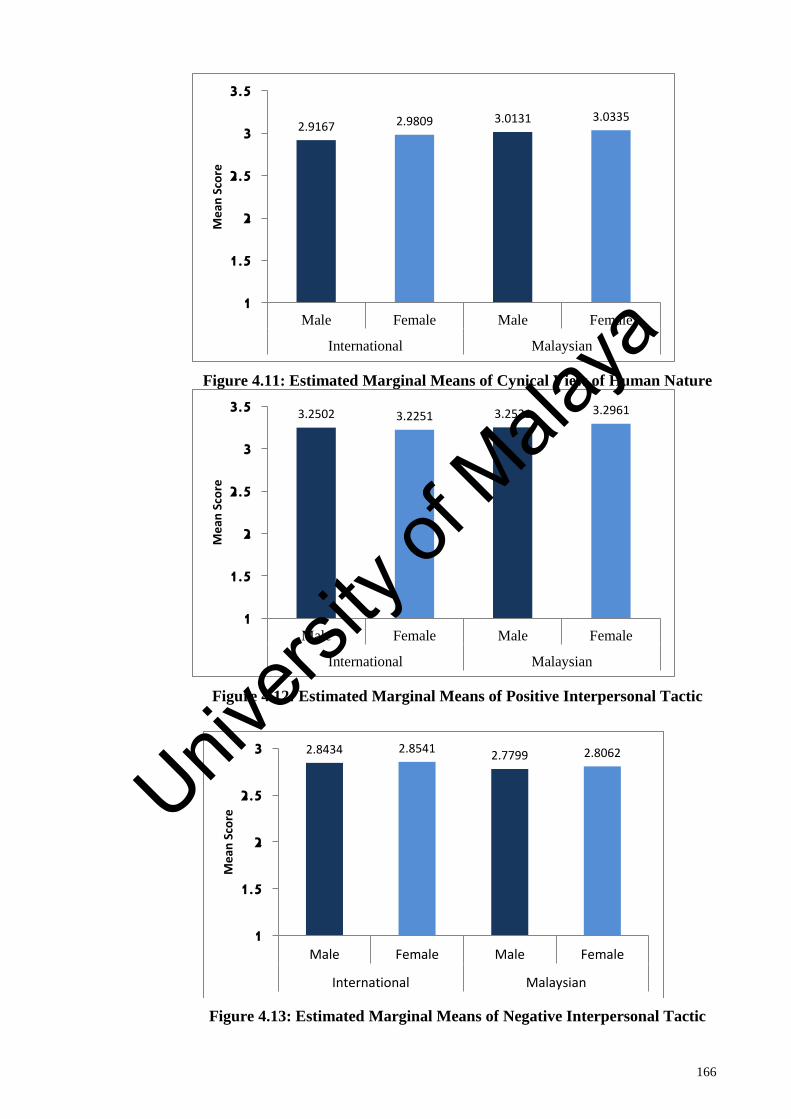
166
Figure 4.11: Estimated Marginal Means of Cynical View of Human Nature
Figure 4.12: Estimated Marginal Means of Positive Interpersonal Tactic
Figure 4.13: Estimated Marginal Means of Negative Interpersonal Tactic
2.9167 2.9809 3.0131 3.0335
1
1.5
2
2.5
3
3.5
Male Female Male Female
International Malaysian
Me
an S
core
3.2502 3.2251 3.2521 3.2961
1
1.5
2
2.5
3
3.5
Male Female Male Female
International Malaysian
Me
an S
core
2.8434 2.8541 2.7799 2.8062
1
1.5
2
2.5
3
Male Female Male Female
International Malaysian
Me
an S
core
Univers
ity of
Mala
ya

167
Figure 4.14: Estimated Marginal Means of Total Machiavellian
4.4.1.4 Mental Health
For mental health, the null hypotheses assumed that there are no significant
differences in the mental health among Malaysian and International students by gender.
The outcomes of two-way ANOVA on Somatization showed that there was a significant
difference between male and female (F= 16.698, p= 0.000) and there were no
significant differences between Malaysian and International students for Luck (F=2.654,
p=0.104). According to these results, there was no significant interaction between
gender and groups for Somatization.
Depression was a significant difference between male and female (F= 8.849, p=
.003) and there were no significant differences between Malaysian and International
students for Depression (F=2.871, p=0.091). According to these results, there was no
significant interaction between gender and groups for Depression. Anxiety showed that
there was a significant difference between male and female (F= 17.196, p= 0.00) and
there were no significant differences between Malaysian and International students for
3.2632 3.2718 3.265 3.306
1
1.5
2
2.5
3
3.5
Male Female Male Female
International Malaysian
Me
an S
core
Univers
ity of
Mala
ya

168
Anxiety (F=0.000, p=.995). According to these results, there was no significant
interaction between gender and groups for Anxiety.
Social Dysfunction showed that there was a significant difference between male
and female (F= 4.243, p= 0.040) and there were no significant differences between
Malaysian and International students for Social Dysfunction (F=1.191, p=0. .275).
According to these results, there was no significant interaction between gender and
groups for Social Dysfunction. Total GHQ showed that there was a significant
difference between male and female (F= 17.841, p= 0.00) and there were no significant
differences between Malaysian and International students for Total GHQ (F=.231, p=0.
.631). According to these results, there was no significant interaction between gender
and groups for Total GHQ.
Table 4.28: Summary of Results of Two Way Anova for GHQ Subscales
Source df MS F P value
Somatization Group 1 1.064 2.654 .104
Gender 1 6.694 16.698 <0.001
Group * Gender 1 .005 .012 .913
Depression Group 1 1.543 2.871 .091
Gender 1 4.756 8.849 .003
Group*Gender 1 .013 .025 .875
Anxiety Group 1 .000 .000 .995
Gender 1 8.109 17.196 .000
Group*Gender 1 .029 .061 .805
Social Dysfunction Group 1 .332 1.191 .275
Gender 1 1.181 4.243 .040
Group*Gender 1 .058 .209 .647
Total GHQ Group 1 .064 .231 .631
Gender 1 4.966 17.841 <0.001
Group*Gender 1 .023 .084 .772
Univers
ity of
Mala
ya

169
Bonferroni test was applied first to study the difference between Malaysian and
International students for each gender separately and the results (Table 4.29) showed
that the Somatization between Malaysian students and International student for both
male and female students was not statistically different (p>0.05). Depression was not
statistically different between Malaysian students and International student for both
male and female students (p>0.05). Anxiety was not statistically different between
Malaysian students and International student for both male and female students
(p>0.05). Social Dysfunction was not statistically different between Malaysian students
and International student for both male and female students (p>0.05). Total GHQ was
not statistically different between Malaysian students and International student for both
male and female students (p>0.05).
Table 4.29: Pairwise Comparison between Malaysian and International for both
Male and Female
Mean
Gender International Malaysian
Mean
Difference SE P value
Somatization Male 1.272 1.353 -.081 .066 .216
Female 1.468 1.5 9 -.071 .067 .287
Depression Male 1.078 0.977 .100 .076 .187
Female 1.230 1.147 .083 .077 .281
Anxiety Male 1.415 1.415 .012 .071 .864
Female 1.415 1.626 -.013 .072 .859
Social
Dysfunction
Male 1.478 1.418 .060 .055 .270
Female 1.541 1.516 .025 .056 .657
Total GHQ Male 1.358 1.328 .030 .055 .583
Female 1.511 1.504 .007 .056 .894
Table 4.30 illustrates the result of comparison between male and female students
for both groups separately using family wise Bonferroni test and the results revealed
that the Somatization, Depression, Anxiety, Social Dysfunction, and total GHQ between
Univers
ity of
Mala
ya

170
male students and female students was statistically different in both Malaysian and
International students (p>0.05).
Table 4.30: Pairwise Comparison between Male and Female for both Malaysian
and International Students
Mean
Male Female
Mean
Difference SE P value
Somatization International 1.272 1.468 -.196* 0.068 0.004
Malaysian 1.353 1.539 -.186* 0.064 0.004
Depression International 1.078 1.230 -.153 0.079 0.050
Malaysian 0.977 1.147 -.170* 0.074 0.022
Anxiety International 1.415 1.613 -.198* 0.074 0.008
Malaysian 1.415 1.626 -.223* 0.069 0.001
Social
Dysfunction
International 1.478 1.541 -.062 0.057 0.274
Malaysian 1.418 1.516 -.098 0.053 0.065
Total GHQ International 1.358 1.511 -.153* 0.057 0.007
Malaysian 1.328 1.504 -.176* 0.053 0.001
Figure 4.15: Estimated Marginal Means of Somatization
1.2715
1.4679
1.3792
1.5198
1
1.1
1.2
1.3
1.4
1.5
1.6
Male Female Male Female
International Malaysian
Me
an S
core
Univers
ity of
Mala
ya
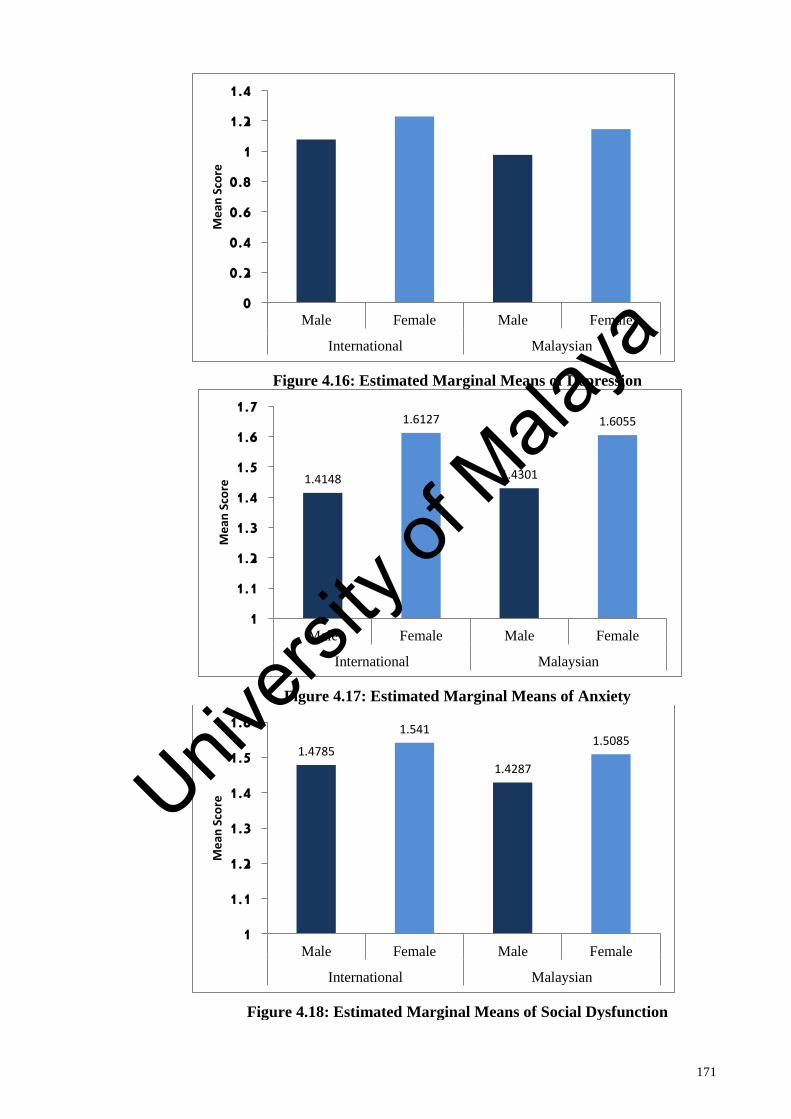
171
Figure 4.16: Estimated Marginal Means of Depression
Figure 4.17: Estimated Marginal Means of Anxiety
Figure 4.18: Estimated Marginal Means of Social Dysfunction
0
0.2
0.4
0.6
0.8
1
1.2
1.4
Male Female Male Female
International Malaysian
Me
an S
core
1.4148
1.6127
1.4301
1.6055
1
1.1
1.2
1.3
1.4
1.5
1.6
1.7
Male Female Male Female
International Malaysian
Me
an S
core
1.4785
1.541
1.4287
1.5085
1
1.1
1.2
1.3
1.4
1.5
1.6
Male Female Male Female
International Malaysian
Me
an S
core
Univers
ity of
Mala
ya

172
Figure 4.19: Estimated Marginal Means of Total GHQ
4.4.2 The Relationship between Personality Traits and Mental Health
Pearson‟s product moment correlations were performed to examine the presence
of bivariate linear relationships and also to determine the significant relationships
between the two variables. The correlation helps to clarify how the variables are related
in strength and magnitude. The Pearson correlation coefficient, r, will be utilized for
measurement of the extent of the linear relationship. Pearson r can take on only values
from -1 to +1. This study used the Guilford and Fruchter (1973) rule of thumb to
determine the strength of the relationship between variables. The p-value was set at .05
in these analyses. In this study, Pearson Correlation Test was used to examine the
relationship between independent variables (Big Five personality Dimension which
include: neuroticism, extroversion, openness, agreeableness, and conscientious;
Imposter phenomenon, and Machiavellian traits) as well as demographic characteristics
contain age, gender, and level of education. The dependent variable was mental health
in this study. Table 4.39 shows the criteria for interpreting the strength of the
relationship between two variables.
1.358
1.5114
1.3521
1.4864
1
1.1
1.2
1.3
1.4
1.5
1.6
Male Female Male Female
International Malaysian
Me
an S
core
Univers
ity of
Mala
ya

173
Table 4.31: Criteria for interpreting strength of relationship between two variables
r Strength of Relationship
<.20 Slight relationship
.20-.40 Low correlation, definite but small
.40-.70 Moderate correlation, substantial relationship
.70-.90 High correlation, marked relationship
>.90 Very high correlation, very dependable relationship
Source: Guildford Rule of Thumb (1973)
4.4.2.1 The Relationship between Big Five Personality and Imposter
The null hypothesis assumed there is no relationship between Big Five
personality dimension and imposter phenomenon and its sub-scales. The correlations
between big five (neuroticism, extroversion, openness, agreeableness,
conscientiousness) and an imposter (luck, discount, fake, and total imposter) among
international students are presented in Table 4.32. Pearson product-moment correlation
coefficient analyses showed that there is a significant strong correlation between
neuroticism and discount, luck, fake, and a total imposter (P<0.001). Meanwhile,
diverse correlations have observed between agreeableness and fake, discount, and total
imposter.
Table 4.32: Correlation between Big Five and Imposter among International
Students
Discount Luck Fake Total IP
Neuroticism .367** .415** .511** .473**
Extroversion -0.073 -0.053 -0.075 -0.073
Openness 0.026 -0.007 0.046 0.023
Agreeableness -.126* -0.049 -.136* -.112*
Conscientiousness -0.079 0.02 -0.056 -0.04
**. Correlation is significant at the 0.01 level (2-tailed).
*. Correlation is significant at the 0.05 level (2-tailed).
Univers
ity of
Mala
ya
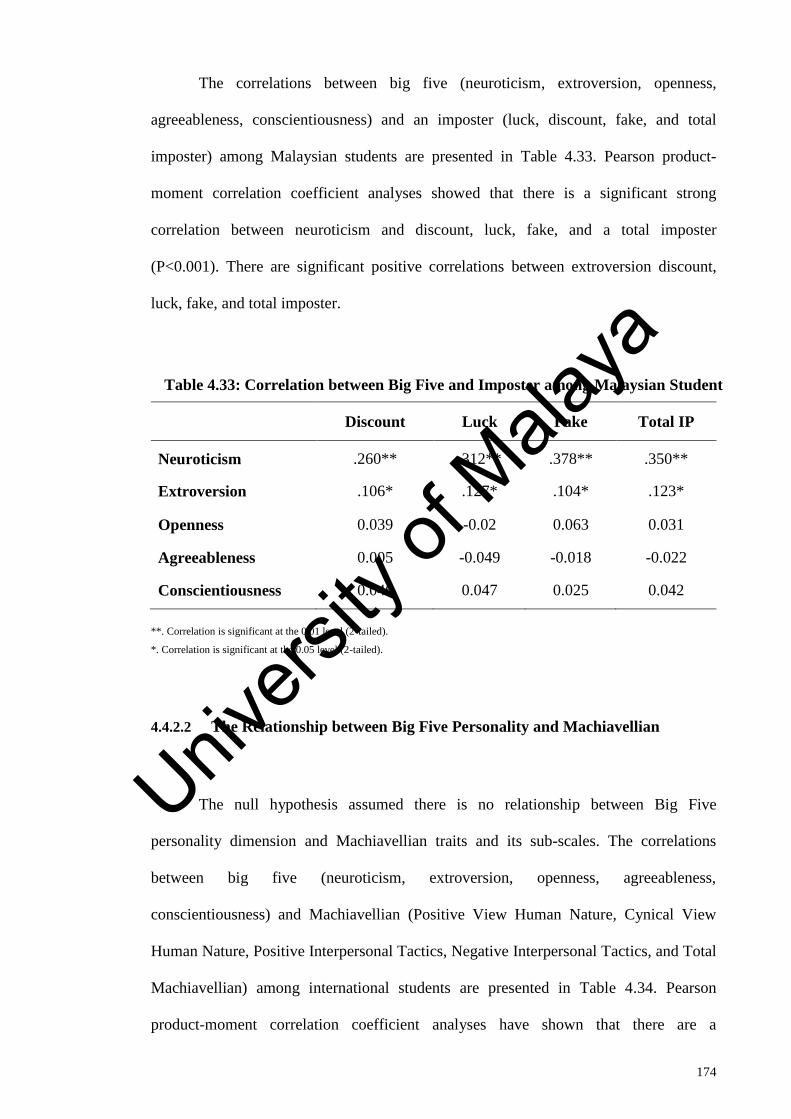
174
The correlations between big five (neuroticism, extroversion, openness,
agreeableness, conscientiousness) and an imposter (luck, discount, fake, and total
imposter) among Malaysian students are presented in Table 4.33. Pearson product-
moment correlation coefficient analyses showed that there is a significant strong
correlation between neuroticism and discount, luck, fake, and a total imposter
(P<0.001). There are significant positive correlations between extroversion discount,
luck, fake, and total imposter.
Table 4.33: Correlation between Big Five and Imposter among Malaysian Students
Discount Luck Fake Total IP
Neuroticism .260** .312** .378** .350**
Extroversion .106* .127* .104* .123*
Openness 0.039 -0.02 0.063 0.031
Agreeableness 0.005 -0.049 -0.018 -0.022
Conscientiousness 0.046 0.047 0.025 0.042
**. Correlation is significant at the 0.01 level (2-tailed).
*. Correlation is significant at the 0.05 level (2-tailed).
4.4.2.2 The Relationship between Big Five Personality and Machiavellian
The null hypothesis assumed there is no relationship between Big Five
personality dimension and Machiavellian traits and its sub-scales. The correlations
between big five (neuroticism, extroversion, openness, agreeableness,
conscientiousness) and Machiavellian (Positive View Human Nature, Cynical View
Human Nature, Positive Interpersonal Tactics, Negative Interpersonal Tactics, and Total
Machiavellian) among international students are presented in Table 4.34. Pearson
product-moment correlation coefficient analyses have shown that there are a
Univers
ity of
Mala
ya
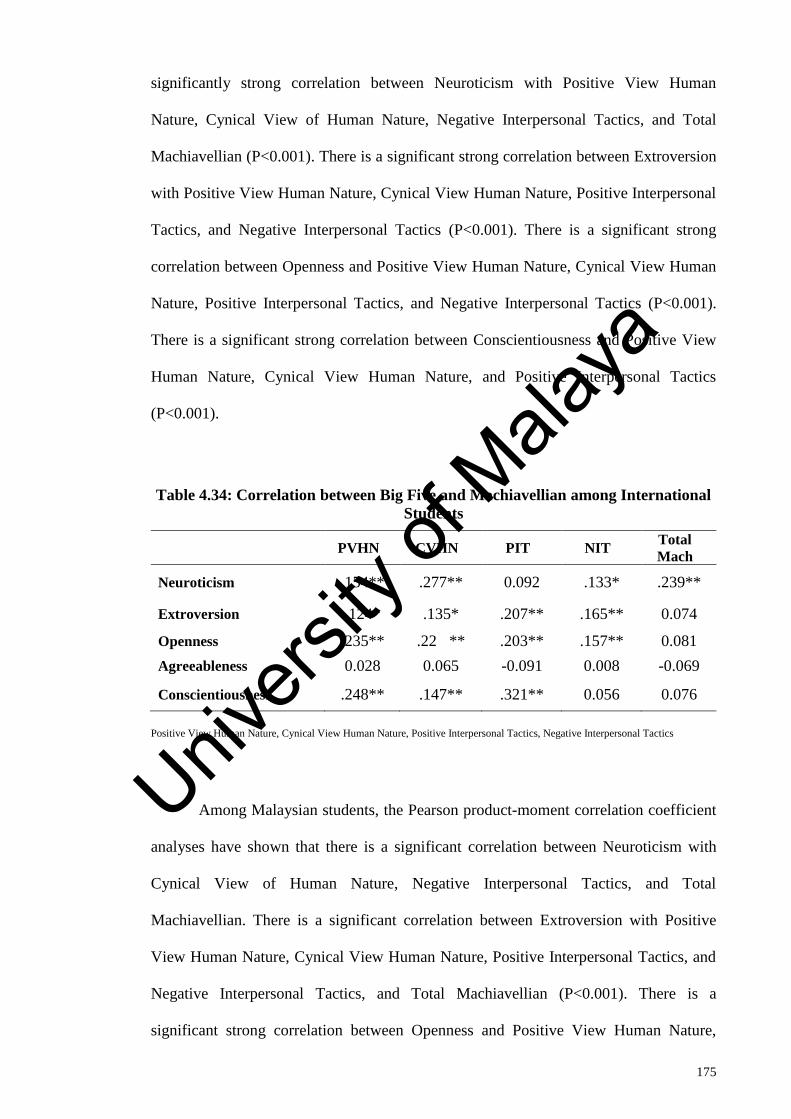
175
significantly strong correlation between Neuroticism with Positive View Human
Nature, Cynical View of Human Nature, Negative Interpersonal Tactics, and Total
Machiavellian (P<0.001). There is a significant strong correlation between Extroversion
with Positive View Human Nature, Cynical View Human Nature, Positive Interpersonal
Tactics, and Negative Interpersonal Tactics (P<0.001). There is a significant strong
correlation between Openness and Positive View Human Nature, Cynical View Human
Nature, Positive Interpersonal Tactics, and Negative Interpersonal Tactics (P<0.001).
There is a significant strong correlation between Conscientiousness and Positive View
Human Nature, Cynical View Human Nature, and Positive Interpersonal Tactics
(P<0.001).
Table 4.34: Correlation between Big Five and Machiavellian among International
Students
PVHN CVHN PIT NIT
Total
Mach
Neuroticism .154** .277** 0.092 .133* .239**
Extroversion .124* .135* .207** .165** 0.074
Openness .235** .22 ** .203** .157** 0.081
Agreeableness 0.028 0.065 -0.091 0.008 -0.069
Conscientiousness .248** .147** .321** 0.056 0.076
Positive View Human Nature, Cynical View Human Nature, Positive Interpersonal Tactics, Negative Interpersonal Tactics
Among Malaysian students, the Pearson product-moment correlation coefficient
analyses have shown that there is a significant correlation between Neuroticism with
Cynical View of Human Nature, Negative Interpersonal Tactics, and Total
Machiavellian. There is a significant correlation between Extroversion with Positive
View Human Nature, Cynical View Human Nature, Positive Interpersonal Tactics, and
Negative Interpersonal Tactics, and Total Machiavellian (P<0.001). There is a
significant strong correlation between Openness and Positive View Human Nature,
Univers
ity of
Mala
ya
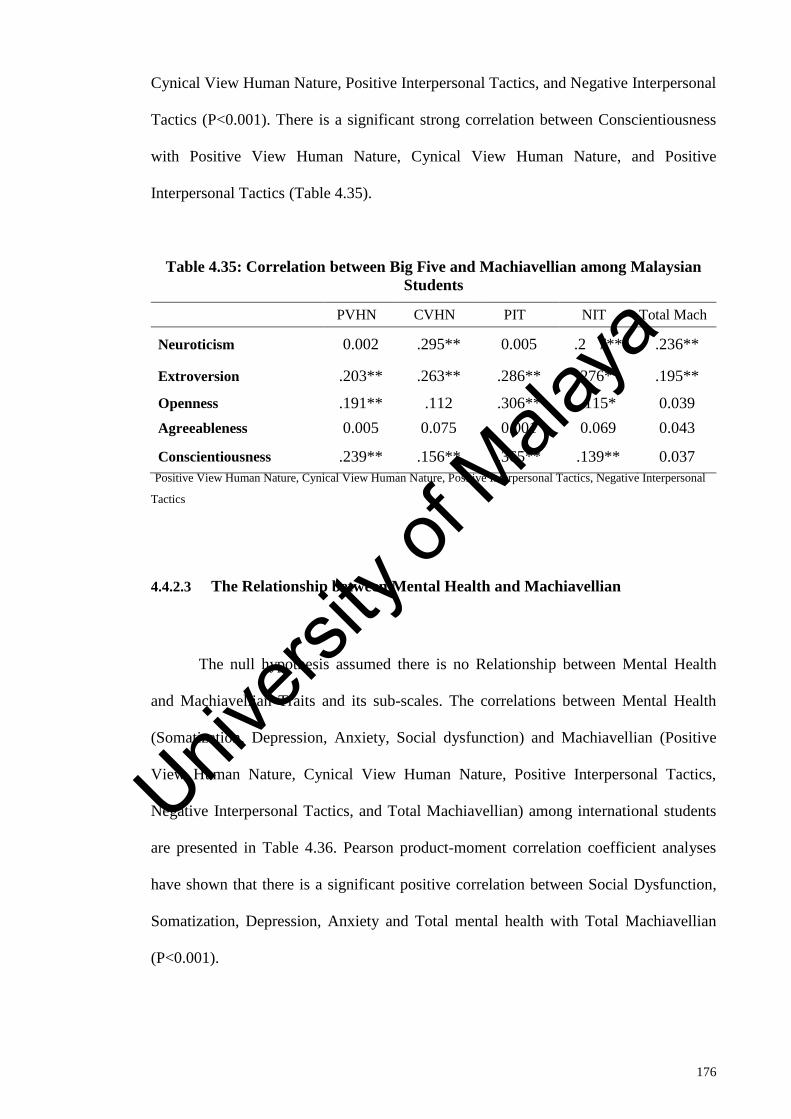
176
Cynical View Human Nature, Positive Interpersonal Tactics, and Negative Interpersonal
Tactics (P<0.001). There is a significant strong correlation between Conscientiousness
with Positive View Human Nature, Cynical View Human Nature, and Positive
Interpersonal Tactics (Table 4.35).
Table 4.35: Correlation between Big Five and Machiavellian among Malaysian
Students
PVHN CVHN PIT NIT Total Mach
Neuroticism 0.002 .295** 0.005 .2 7** .236**
Extroversion .203** .263** .286** .276** .195**
Openness .191** .112 .306** .115* 0.039
Agreeableness 0.005 0.075 0.001 0.069 0.043
Conscientiousness .239** .156** .365** .139** 0.037
Positive View Human Nature, Cynical View Human Nature, Positive Interpersonal Tactics, Negative Interpersonal
Tactics
4.4.2.3 The Relationship between Mental Health and Machiavellian
The null hypothesis assumed there is no Relationship between Mental Health
and Machiavellian Traits and its sub-scales. The correlations between Mental Health
(Somatization, Depression, Anxiety, Social dysfunction) and Machiavellian (Positive
View Human Nature, Cynical View Human Nature, Positive Interpersonal Tactics,
Negative Interpersonal Tactics, and Total Machiavellian) among international students
are presented in Table 4.36. Pearson product-moment correlation coefficient analyses
have shown that there is a significant positive correlation between Social Dysfunction,
Somatization, Depression, Anxiety and Total mental health with Total Machiavellian
(P<0.001).
Univers
ity of
Mala
ya

177
Table 4.36: Correlation between Mental Health and Machiavellian among
International Students
PVHN CVHN PIT N IT Total Mach
Social Dysfunction 0 005 0.072 .031 0.064 133
Somatization 0.044 .159** -.043 0.051 .203**
Depression 0.103 .271** -.065 .120* .202**
Anxiety 0.061 .136** -.016 0.06 .194**
Total GHQ 0.058 .191** -.034 0.075 .220**
**. Correlation is significant at the 0.01 level (2-tailed).
*. Correlation is significant at the 0.05 level (2-tailed).
Positive of View Human Nature, Cynical View of Human Nature, Positive Interpersonal Tactics, Negative Interpersonal Tactics,
The correlations between Mental Health (Somatization, Depression, Anxiety,
Social dysfunction) and Machiavellian (Positive View Human Nature, Cynical View
Human Nature, Positive Interpersonal Tactics, Negative Interpersonal Tactics, and Total
Machiavellian ) among Malaysian students are presented in Table 4.37. Pearson
product-moment correlation coefficient analyses have shown that there is a significant
positive correlation between Somatization, Anxiety, and Total mental health with Total
Machiavellian (P<0.001).
Table 4.37: Correlation between Mental Health and Machiavellian among
Malaysian Students
PVHN CVHN PIT N IT Total Mach
Social Dysfunction -0.091 -0.008 -0.100* -0.007 0.027
Somatization -0.029 0.120* -0.153** 0.139** 0.113*
Depression -0.140** 0.061 -0.297** 0.066 0.031
Anxiety -0.081 0.131** -0.145** 0.169** 0.146**
Total GHQ -0.104* 0.097 -0.221** .0114* 0.103*
**. Correlation is significant at the 0.01 level (2-tailed).
*. Correlation is significant at the 0.05 level (2-tailed).
Positive of View Human Nature, Cynical View of Human Nature, Positive Interpersonal Tactics, Negative Interpersonal Tactics,
Univers
ity of
Mala
ya

178
4.4.2.4 The Relationship between Mental Health and Imposter
The null hypothesis assumed there is no relationship between mental health and
imposter traits and its sub-scales. The correlations between Mental Health
(Somatization, Depression, Anxiety, Social dysfunction) and Imposter (Discount, Luck,
Fake, a Total imposter) among international students are presented in Table 4.38.
Pearson product-moment correlation coefficient analyses have shown that there is a
significant strong correlation between Social Dysfunction with Discount, Luck, Fake,
and a Total imposter (P<0.001). There is a significant strong correlation between
Somatization with Discount, Luck, Fake, and a Total imposter (P<0.001). There is a
significant strong correlation between Depression with Discount, Luck, Fake, and a
Total imposter (P<0.001). There is a significant strong correlation between Anxiety
with Discount, Luck, Fake, and a Total imposter (P<0.001). There is a significant strong
correlation between Total Mental Health with Discount, Luck, Fake, and a Total
imposter (P<0.001).
Table 4.38: Correlation between Mental Health and Imposter among
International Students
Discount Luck Fake Total IP
Social Dysfunction .195** .225** .243** .243**
Somatization .182** .290** .297** .283**
Depression .237** .354 * .357** .348**
Anxiety .300** .361** .394** .386**
Total GHQ .275** .375** .394** .384**
**. Correlation is significant at the 0.01 level (2-tailed).
*. Correlation is significant at the 0.05 level (2-tailed).
IP, Imposter
The correlations between Mental Health (Somatization, Depression, Anxiety,
Social dysfunction) and Imposter (Discount, Luck, Fake, a Total imposter) among
Univers
ity of
Mala
ya

179
Malaysian students are presented in Table 4.39. Pearson product-moment correlation
coefficient analyses have shown that there is a significant positive correlation between
Social Dysfunction with Fake (P<0.001). There is a significant strong correlation
between Somatization with Discount, Luck, Fake, and a Total imposter (P<0.001).
There is a significant strong correlation between Depression with Discount, Luck, Fake,
and a Total imposter (P<0.001). There is a significant strong correlation between
Anxiety with Discount, Luck, Fake, and a Total imposter (P<0.001). There is a
significant strong correlation between Total Mental Health with Discount, Luck, Fake,
and a Total imposter (P<0.001).
Table 4.39: Correlation between Mental Health and Imposter among
Malaysian Students
Discount Luck Fake Total IP
Social Dysfunction 0.022 0.077 .105* 0.07
Somatization .157** .204** .213** .211**
Depression .104* .175** .174** .167**
Anxiety .231** .227** .307** .282**
Total GHQ .164** .219** .251** .234**
**. Correlation is significant at the 0.01 level (2-tailed).
*. Correlation is significant at the 0.05 level (2-tailed).
IP, Imposter
4.4.2.5 The Relationship between Mental Health and Big Five
The null hypothesis assumed there is no relationship between mental health and
Big Five personality traits and its sub-scales. The correlations between Mental Health
(Somatization, Depression, Anxiety, Social dysfunction) and Big Five (Neuroticism,
Extroversion, Openness, Agreeableness, Conscientiousness) among international
students are presented in Table 4.40. Pearson product-moment correlation coefficient
analyses have shown that there is a significant strong correlation between Social
Univers
ity of
Mala
ya
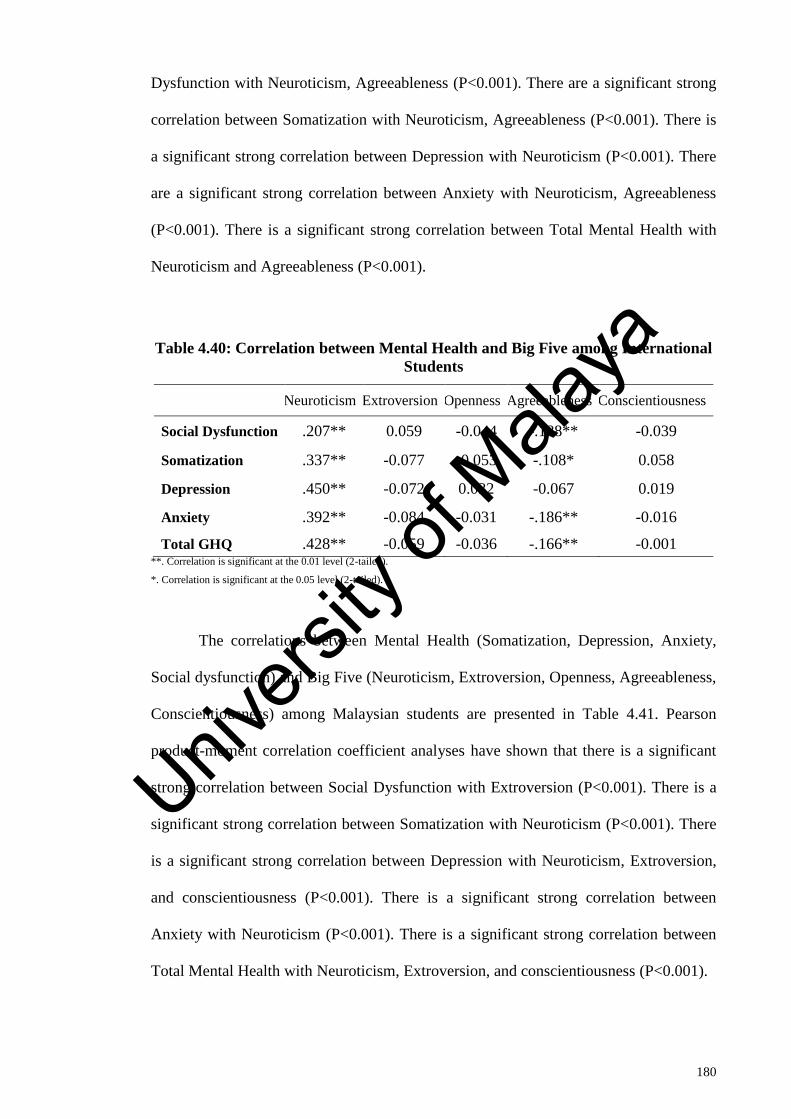
180
Dysfunction with Neuroticism, Agreeableness (P<0.001). There are a significant strong
correlation between Somatization with Neuroticism, Agreeableness (P<0.001). There is
a significant strong correlation between Depression with Neuroticism (P<0.001). There
are a significant strong correlation between Anxiety with Neuroticism, Agreeableness
(P<0.001). There is a significant strong correlation between Total Mental Health with
Neuroticism and Agreeableness (P<0.001).
Table 4.40: Correlation between Mental Health and Big Five among International
Students
Neuroticism Extroversion Openness Agreeableness Conscientiousness
Social Dysfunction .207** 0.059 -0.044 -.188** -0.039
Somatization .337** -0.077 -0.053 -.108* 0.058
Depression .450** -0.072 0.032 -0.067 0.019
Anxiety .392** -0.084 -0.031 -.186** -0.016
Total GHQ .428** -0.059 -0.036 -.166** -0.001
**. Correlation is significant at the 0.01 level (2-tailed).
*. Correlation is significant at the 0.05 level (2-tailed).
The correlations between Mental Health (Somatization, Depression, Anxiety,
Social dysfunction) and Big Five (Neuroticism, Extroversion, Openness, Agreeableness,
Conscientiousness) among Malaysian students are presented in Table 4.41. Pearson
product-moment correlation coefficient analyses have shown that there is a significant
strong correlation between Social Dysfunction with Extroversion (P<0.001). There is a
significant strong correlation between Somatization with Neuroticism (P<0.001). There
is a significant strong correlation between Depression with Neuroticism, Extroversion,
and conscientiousness (P<0.001). There is a significant strong correlation between
Anxiety with Neuroticism (P<0.001). There is a significant strong correlation between
Total Mental Health with Neuroticism, Extroversion, and conscientiousness (P<0.001).
Univers
ity of
Mala
ya
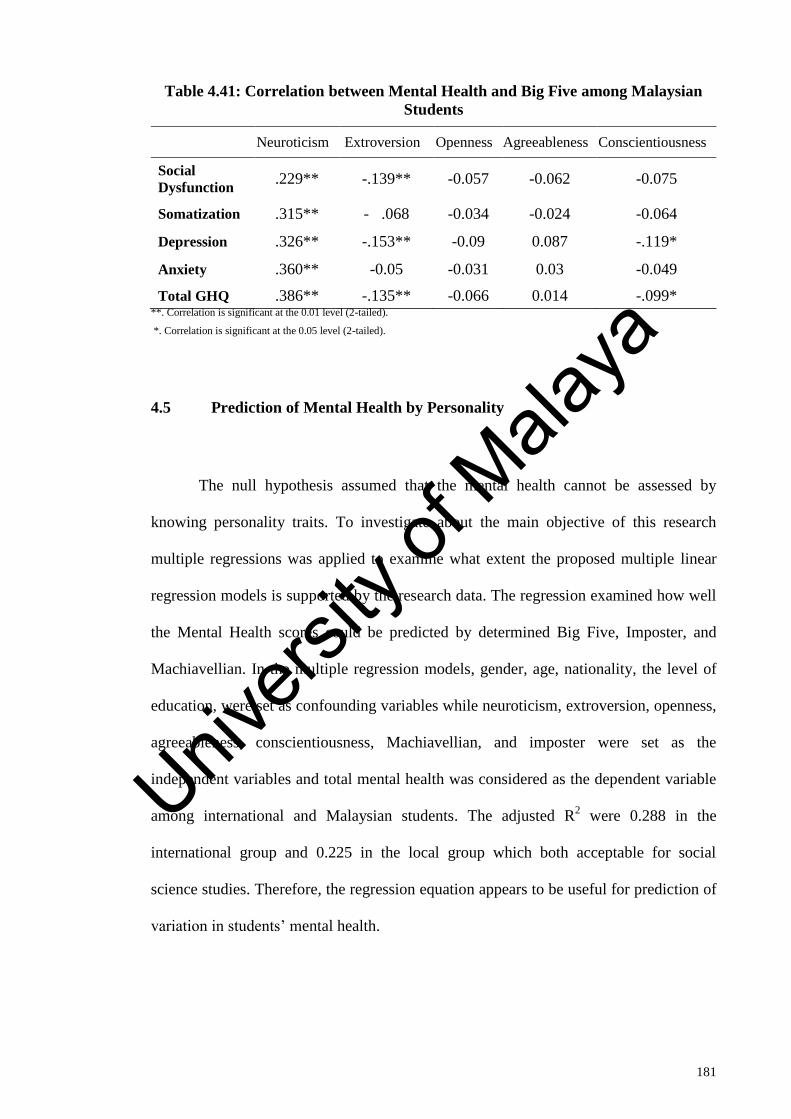
181
Table 4.41: Correlation between Mental Health and Big Five among Malaysian
Students
Neuroticism Extroversion Openness Agreeableness Conscientiousness
Social
Dysfunction .229** -.139** -0.057 -0.062 -0.075
Somatization .315** - .068 -0.034 -0.024 -0.064
Depression .326** -.153** -0.09 0.087 -.119*
Anxiety .360** -0.05 -0.031 0.03 -0.049
Total GHQ .386** -.135** -0.066 0.014 -.099*
**. Correlation is significant at the 0.01 level (2-tailed).
*. Correlation is significant at the 0.05 level (2-tailed).
Prediction of Mental Health by Personality 4.5
The null hypothesis assumed that the mental health cannot be assessed by
knowing personality traits. To investigate about the main objective of this research
multiple regressions was applied to examine what extent the proposed multiple linear
regression models is supported by the research data. The regression examined how well
the Mental Health scores could be predicted by determined Big Five, Imposter, and
Machiavellian. In the multiple regression models, gender, age, nationality, the level of
education, were set as confounding variables while neuroticism, extroversion, openness,
agreeableness, conscientiousness, Machiavellian, and imposter were set as the
independent variables and total mental health was considered as the dependent variable
among international and Malaysian students. The adjusted R2 were 0.288 in the
international group and 0.225 in the local group which both acceptable for social
science studies. Therefore, the regression equation appears to be useful for prediction of
variation in students‟ mental health.
Univers
ity of
Mala
ya

182
Table 4.42: Multiple Regression Model Summary among International and Malaysian Students
Group Model R R Square Adjusted
R Square SE
R Square
Change F Change df1 df2
Sig. F
Change
International
1 .280a 0.079 0.065 0.53991 0.079 5.599 5 328 <0.001
2 .537b 0.288 0.261 0.4798 0.209 13.476 7 321 <0.001
Malaysian
1 .162d 0.026 0.014 0.50635 0.026 2.111 5 392 0.063
2 .475e 0.225 0.201 0.45571 0.199 14.137 7 385 <0.001
a Predictors: (Constant), Level of Education, Gender, Age
b Predictors: (Constant), Level of Education, Gender, Age, Conscientiousness, Total Machiavellian , Agreeableness, Openness, Extroversion, Total Imposter, Neuroticism
d Predictors: (Constant), ), Level of Education, Gender, Age
e Predictors: (Constant), Level of Education, Gender, Age, Conscientiousness, Agreeableness Total Machiavellian, Neuroticism, Openness, Total Imposter, Extroversion
Univers
ity of
Mala
ya
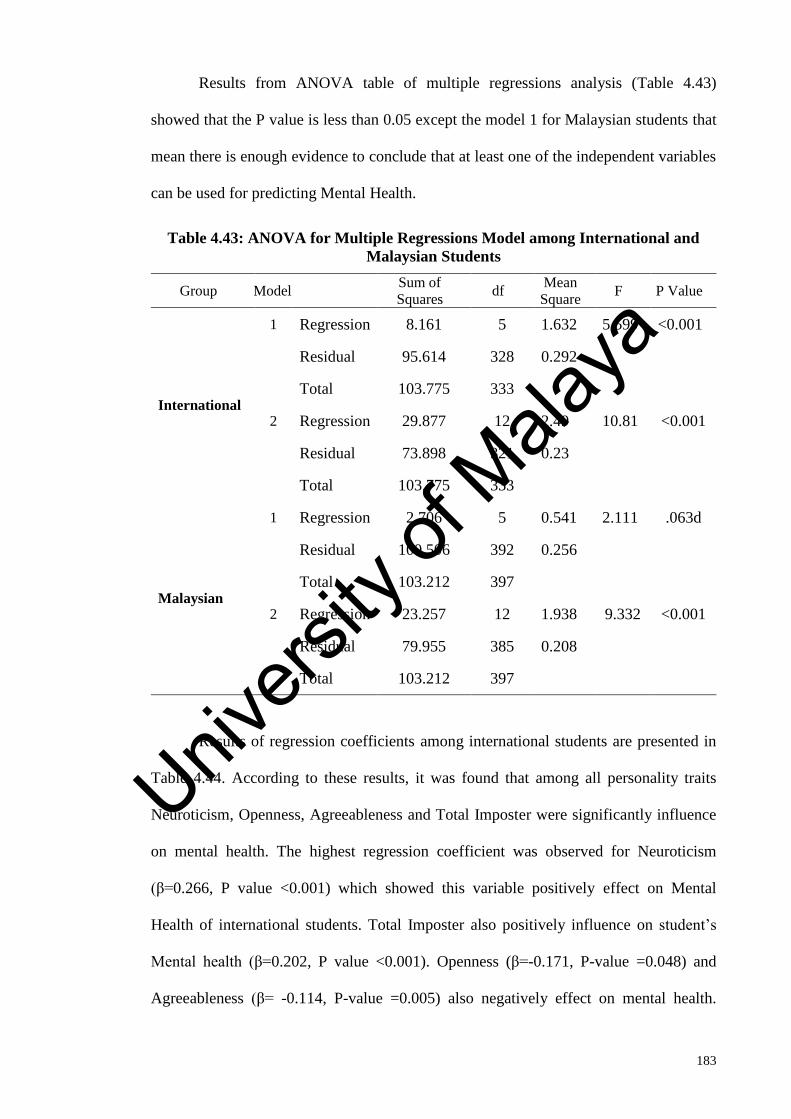
183
Results from ANOVA table of multiple regressions analysis (Table 4.43)
showed that the P value is less than 0.05 except the model 1 for Malaysian students that
mean there is enough evidence to conclude that at least one of the independent variables
can be used for predicting Mental Health.
Table 4.43: ANOVA for Multiple Regressions Model among International and
Malaysian Students
Group Model Sum of
Squares df
Mean
Square F P Value
International
1 Regression 8.161 5 1.632 5.599 <0.001
Residual 95.614 328 0.292
Total 103.775 333
2 Regression 29.877 12 2.49 10.81 <0.001
Residual 73.898 321 0.23
Total 103.775 333
Malaysian
1 Regression 2.706 5 0.541 2.111 .063d
Residual 100.506 392 0.256
Total 103.212 397
2 Regression 23.257 12 1.938 9.332 <0.001
Residual 79.955 385 0.208
Total 103.212 397
Results of regression coefficients among international students are presented in
Table 4.44. According to these results, it was found that among all personality traits
Neuroticism, Openness, Agreeableness and Total Imposter were significantly influence
on mental health. The highest regression coefficient was observed for Neuroticism
(β=0.266, P value <0.001) which showed this variable positively effect on Mental
Health of international students. Total Imposter also positively influence on student‟s
Mental health (β=0.202, P value <0.001). Openness (β=-0.171, P-value =0.048) and
Agreeableness (β= -0.114, P-value =0.005) also negatively effect on mental health.
Univers
ity of
Mala
ya

184
According to these results, there was no serious collinearity among independent
variables and results indicated that VIF for all independent variables was less than five.
Table 4.44: Regression Coefficients of independent variables on Mental Health
among International Students
IV B SE Beta t P Value Tolerance VIF
(Constant) 0.674 0.367
1.838 0.067
Age 0.001 0.005 0.013 0.243 0.809 0.748 1.338
Level Education 0.029 0.077 0.02 0.374 0.709 0.757 1.321
Gender 0.119 0.055 0.106 2.149 0.032 0.916 1.092
Religion -0.097 0.029 -0.163 -3.302 0.001 0.915 1.093
Neuroticism 0.266 0.053 0.288 5.046 <0.001 0.683 1.465
Extroversion -0.022 0.05 -0.022 -0.435 0.664 0.842 1.188
Openness -0.171 0.086 -0.1 -1.982 0.048 0.872 1.146
Agreeableness -0.114 0.04 -0.139 -2.855 0.005 0.936 1.068
Conscientiousness 0.021 0.043 0.024 0.48 0.632 0.87 1.15
Total Imposter 0.202 0.053 0.214 3.786 <0.001 0.697 1.434
Total Mach 0.055 0.065 0.044 0.85 0.396 0.835 1.198
Results of regression coefficients among Malaysian is presented in Table 4.45.
According to these results, it was found that among all personality traits Neuroticism,
Extroversion, and Total Imposter were significantly influence on the mental health of
Malaysian students. The highest regression coefficient was observed for Neuroticism
(β=0.403, P value <0.001) which showed this variable positively effect on Mental
Health. Total Imposter also positively influence on student‟s Mental health (β=0.103, P
value=0.049). Extroversion (β=0.282, P value<0.001) also negatively effect on mental
health. According to these results, there was no serious collinearity among independent
variables and results indicated that VIF for all independent variables was less than five.
Univers
ity of
Mala
ya

185
Table 4.45: Regression Coefficients of independent variables on Mental Health
among Malaysian Students
IV B SE Beta t P Value Tolerance VIF
(Constant) 1.103 0.328
3.357 0.001
Age -0.01 0.005 -0.094 -1.922 0.055 0.848 1.179
Level Education 0.03 0.061 0.024 0.494 0.622 0.863 1.159
Gender 0.036 0.048 0.035 0.755 0.451 0.934 1.07
Religion 0.008 0.036 0.011 0.232 0.816 0.957 1.045
Neuroticism 0.403 0.053 0.382 7.556 <0.001 0.788 1.269
Extroversion -0.282 0.066 -0.229 -4.295 <0.001 0.709 1.41
Openness -0.077 0.067 -0.055 -1.153 0.25 0.873 1.146
Agreeableness 0.025 0.044 0.026 0.572 0.567 0.948 1.055
Conscientiousness 0.028 0.052 0.028 0.532 0.595 0.712 1.405
Total Imposter 0.103 0.052 0.101 1.974 0.049 0.776 1.289
Total Mach 0.01 0.055 0.009 0.183 0.855 0.851 1.175
Developing a Summarized Questionnaire for Personality Traits 4.6
According to the analysis of structural equation modelling (SEM)‟ loading
factor, certain questions were considered in developing UM-PTQ (UM Personality Trait
Questionnaire). Next, the selected questions were listed in a new form. The form was
reviewed by a committee of eight experts with representation and recognition in the area
of interest of this study.
Content validity analysis was used to evaluate the expert views in terms of
clarity, representative, and relevance of the selected questions. In other words, a content
validation certifies whether an instrument measures what is intended and verifies that
the questions properly reflect the content domain of scale (Benson & Clark, 1982). The
Univers
ity of
Mala
ya

186
content validity of the developed instrument was statistically analysed by a Content
Validity Index (CVI). To calculate the CVI, each item was ranked on a four-point scale
(1 = not relevant, 2 = somewhat relevant, 3 = quite relevant, 4 = highly relevant). For
each item, the CVI was calculated as the number of experts who provided a rank of 3 or
4, divided by the total number of experts. The Kappa Modified Coefficient was used to
determine the degree of relevance agreement of the CVI and was calculated according
to Polit et al. (2007). The first version of the instrument was developed with 35 items
divided into seven domains: Neuroticism (5 items), Extroversion (5 items), Openness (5
items), Agreeableness (5 items), Conscientiousness (5 items), Machiavellian (5 items),
and Imposter (5 items). In each domain, the content validity of the items (35 items) was
evaluated separately. Table 4.46 to Table 4.52 illustrates the result of content validity
index in this study.
According to CVI and Kappa value, all items in the Neuroticism domain
obtained satisfactory scores. Therefore the items in this domain were maintained as the
last version of the instrument (the domains were considered satisfactory CVI between
0.71- 1.00 and Kappa between 0.80-1.00). See Table 4.46.
Table 4.46: Content Validation of Neuroticism Domain
Clarifying Relevance Representative
Results
Item CVI kappa CVI kappa CVI kappa
N1 1.000 1.000 1.000 1.000 1.000 1.000 Validated
N2 1.000 1.000 0.875 0.871 1.000 1.000 Validated
N3 0.875 0.871 0.875 0.871 1.000 1.000 Validated
N4 0.875 0.871 1.000 1.000 1.000 1.000 Validated
N5 0.875 0.871 0.875 0.871 1.000 1.000 Validated
Univers
ity of
Mala
ya

187
According to CVI and Kappa value, all items in the Extroversion domain
obtained satisfactory scores. Therefore the items in this domain were maintained as the
last version of the instrument (the domains were considered satisfactory CVI between
0.71- 1.00 and Kappa between 0.80-1.00). See Table 4.47.
Table 4.47: Content Validation of Extroversion Domain
Clarifying Relevance Representative
Results
Item CVI kappa CVI kappa CVI kappa
E1 0.875 0.871 0.875 0.871 1.000 1.000 Validated
E2 1.000 1.000 1.000 1.000 1.000 1.000 Validated
E3 0.875 0.871 1.000 1.000 1.000 1.000 Validated
E4 1.000 1.000 1.000 1.000 1.000 1.000 Validated
E5 0.875 0.871 1.000 1.000 1.000 1.000 Validated
According to CVI and Kappa value, all items in the Openness domain obtained
satisfactory scores. Therefore the items in this domain were maintained as the last
version of the instrument (the domains were considered satisfactory CVI between 0.71-
1.00 and Kappa between 0.80-1.00). See Table 4.48.
Table 4.48: Content Validation of Openness Domain
Clarifying Relevance Representative
Results
Item CVI kappa CVI kappa CVI kappa
O1 0.875 0.871 0.875 0.871 0.875 0.871 Validated
O2 0.875 0.871 0.875 0.871 1.000 1.000 Validated
O3 0.875 0.871 0.875 0.871 1.000 1.000 Validated
O4 1.000 1.000 1.000 1.000 1.000 1.000 Validated
O5 0.750 0.719 0.875 0.871 0.875 0.871 Validated
Univers
ity of
Mala
ya
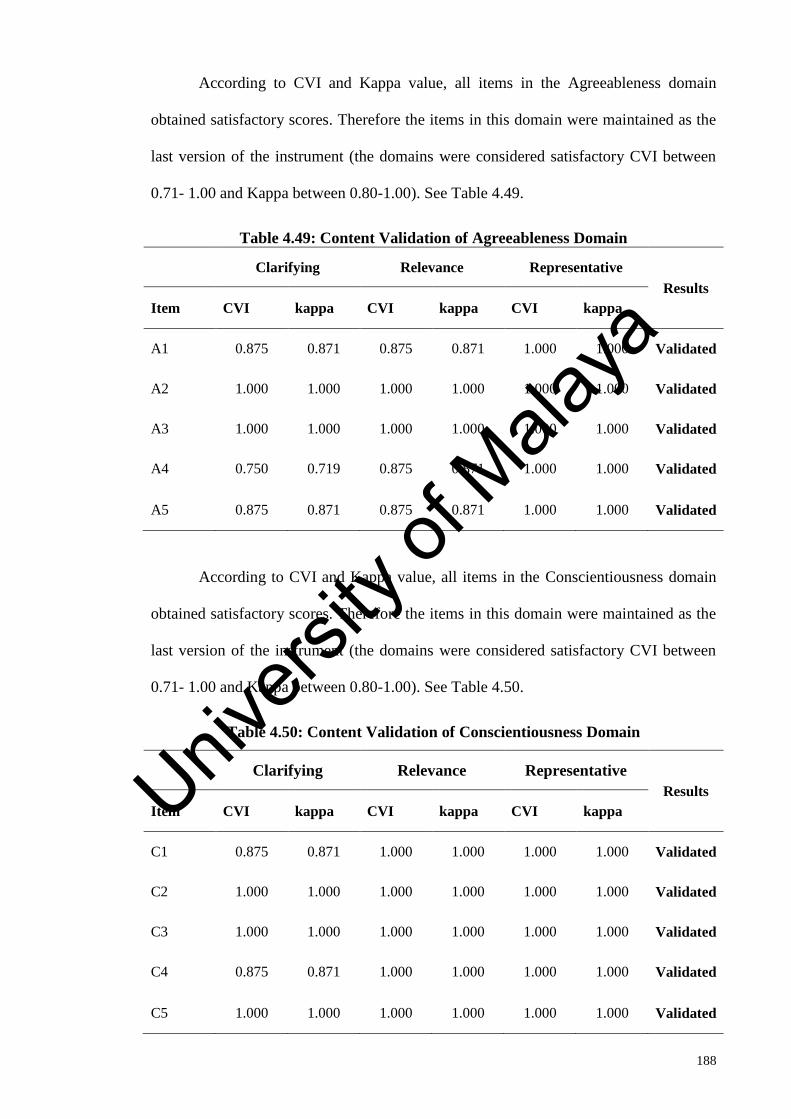
188
According to CVI and Kappa value, all items in the Agreeableness domain
obtained satisfactory scores. Therefore the items in this domain were maintained as the
last version of the instrument (the domains were considered satisfactory CVI between
0.71- 1.00 and Kappa between 0.80-1.00). See Table 4.49.
Table 4.49: Content Validation of Agreeableness Domain
Clarifying Relevance Representative
Results
Item CVI kappa CVI kappa CVI kappa
A1 0.875 0.871 0.875 0.871 1.000 1.000 Validated
A2 1.000 1.000 1.000 1.000 1.000 1.000 Validated
A3 1.000 1.000 1.000 1.000 1.000 1.000 Validated
A4 0.750 0.719 0.875 0.871 1.000 1.000 Validated
A5 0.875 0.871 0.875 0.871 1.000 1.000 Validated
According to CVI and Kappa value, all items in the Conscientiousness domain
obtained satisfactory scores. Therefore the items in this domain were maintained as the
last version of the instrument (the domains were considered satisfactory CVI between
0.71- 1.00 and Kappa between 0.80-1.00). See Table 4.50.
Table 4.50: Content Validation of Conscientiousness Domain
Clarifying Relevance Representative
Results
Item CVI kappa CVI kappa CVI kappa
C1 0.875 0.871 1.000 1.000 1.000 1.000 Validated
C2 1.000 1.000 1.000 1.000 1.000 1.000 Validated
C3 1.000 1.000 1.000 1.000 1.000 1.000 Validated
C4 0.875 0.871 1.000 1.000 1.000 1.000 Validated
C5 1.000 1.000 1.000 1.000 1.000 1.000 Validated
Univers
ity of
Mala
ya

189
According to CVI and Kappa value, all items in the Imposter domain obtained
satisfactory scores. Therefore the items in this domain were maintained as the last
version of the instrument (the domains were considered satisfactory CVI between 0.71-
1.00 and Kappa between 0.80-1.00). See Table 4.51.
Table 4.51: Content Validation of Imposter Domain
Clarifying Relevance Representative
Results
Item CVI kappa CVI kappa CVI kappa
IP1 0.875 0.871 1.000 1.000 1.000 1.000 Validated
IP2 0.875 0.871 1.000 1.000 1.000 1.000 Validated
IP3 0.875 0.871 1.000 1.000 1.000 1.000 Validated
IP4 0.875 0.871 1.000 1.000 1.000 1.000 Validated
IP5 0.875 0.871 1.000 1.000 1.000 1.000 Validated
According to CVI and Kappa value, all items in the Machiavellian domain
obtained satisfactory scores. Therefore the items in this domain were maintained as the
last version of the instrument (the domains were considered satisfactory CVI between
0.71- 1.00 and Kappa between 0.80-1.00). See Table 4.52.
Table 4.52: Content Validation of Machiavellian Domain
Clarifying Relevance Representative
Results
Item CVI kappa CVI kappa CVI kappa
Mach1 0.875 0.871 1.000 1.000 1.000 1.000 Validated
Mach2 0.875 0.871 1.000 1.000 1.000 1.000 Validated
Mach3 0.875 0.871 1.000 1.000 1.000 1.000 Validated
Mach4 0.875 0.871 1.000 1.000 1.000 1.000 Validated
Mach5 0.875 0.871 1.000 1.000 1.000 1.000 Validated
Univers
ity of
Mala
ya

190
4.6.1 Reliability of the instruments
For testing the reliability of the questionnaire, a Cronbach‟s Alpha test was
implemented. Cronbach's alpha is the most common measure of internal consistency
(reliability). The alpha for all items in all sub-dimensions was higher than 0.70,
suggesting that all of the items are reliable and the entire instrument is internally
consistent. Corrected Item-Total Correlation is the correlations between each item and
the total score from the questionnaire. In a reliable scale, all items should have an
acceptable correlation with the total. Items with a corrected Item-total correlation less
than 0.3 with the overall score have to be on the scale. The reliability coefficients for
different sections of Shortened Inventory pilot study are presented in Table 4.47.
Therefore, based on the reliability alpha values of all the variables that were found
greater than the standard of 0.70, the variables were reliable.
Univers
ity of
Mala
ya

191
Table 4.53: Results of Reliability analysis for all sub-dimension of UM-PTQ
Dimension Item
Corrected
Item-Total
Correlation
Cronbach's
Alpha if
Item Deleted
Cronbach's Alpha
for Scale
Neuroticism
NE0.26 0.76 0.887
0.906
NE0.36 0.722 0.894
NE0.41 0.801 0.877
NE0.51 0.791 0.881
NE0.56 0.755 0.887
Extroversion
NE0.22 0.703 0.896
0.904
NE0.37 0.823 0.869
NE0.42 0.816 0.870
NE0.47 0.723 0.892
NE0.52 0.746 0.886
Openness
NE0.13 0.674 0.715
19790
NE0.18 0.538 0.761
NE0.23 0.519 0.767
NE0.38 0.564 0.753
NE0.43 0.55 0.757
Agreeableness
NE0.4 0.81 0.896
19900
NE0.9 0.894 0.874
NE0.14 0.804 0.893
NE0.24 0.725 0.911
NE0.44 0.748 0.908
Conscientiousness
NE0.35 0.766 0.908
199.0
NE0.40 0.783 0.905
NE0.50 0.823 0.897
NE0.55 0.823 0.897
NE0.60 0.777 0.906
Machiavellian
MAK.7 0.559 0.861
198.0
MAK.5 0.829 0.781
MAK.10 0.625 0.838
MAK.18 0.819 0.798
MAK.19 0.584 0.847
Imposter
IMP.14 0.695 0.864
19880
IMP.15 0.649 0.876
IMP.16 0.777 0.845
IMP.18 0.847 0.832
IMP.19 0.654 0.874
4.6.2 Exploratory Factor Analysis
Exploratory Factor Analysis was applied to determine the factor structure among
35 items of combined UM Personality Trait Questionnaire (UM-PTQ). Several well-
Univers
ity of
Mala
ya
192
known criteria for the factorability of a correlation were used. Firstly, the Kaiser-Meyer-
Olkin measure of sampling adequacy was 0.622, above the suggested value of .6, and
Bartlett‟s test of sphericity was significant (2 (595) = 1666.734, p <0.05). The
diagonals of the anti-image correlation matrix were all over 0.5, supporting the
inclusion of each item in the factor analysis. Initial communalities are estimates of the
variance in each variable accounted for by all components and small values (<0.3)
indicate variables that do not fit well with the factor solution. In the current study, all
initial communalities were above the threshold. All loading factors were above 0.5 (see
Appendix K).
The results of EFA on all 35 items extracted seven factors with eigenvalues
greater than 1. The eigenvalues and total variance explained by the seven factors is
shown in Table 4.48. Total seven components were extracted which explained 72.625%
of the variance among data and the results after Varimax rotation showed that the first
component which is related to “Conscientiousness” explained 11.44 % of the variance
and the second important component was related to “Agreeableness” which was able to
explain 11.29% of the variance. The third components included items of “Neuroticism”
and results indicated that this factor explained 10.76% of variance followed by fourth
component “Imposter” by 10.55% of total variance. Items related to “Extroversion”
formed the next components that explained 10.55 % of the variance followed by
“Machiavellian” which was able to explain 10.22% of the variance. The last factor
based on the result of Varimax rotation was related to “Openness” with 8.% explained
the variance. The results of EFA also revealed that all items were categorized according
to the original construct which confirmed the similar diminish ability of a new
instrument.
Univers
ity of
Mala
ya
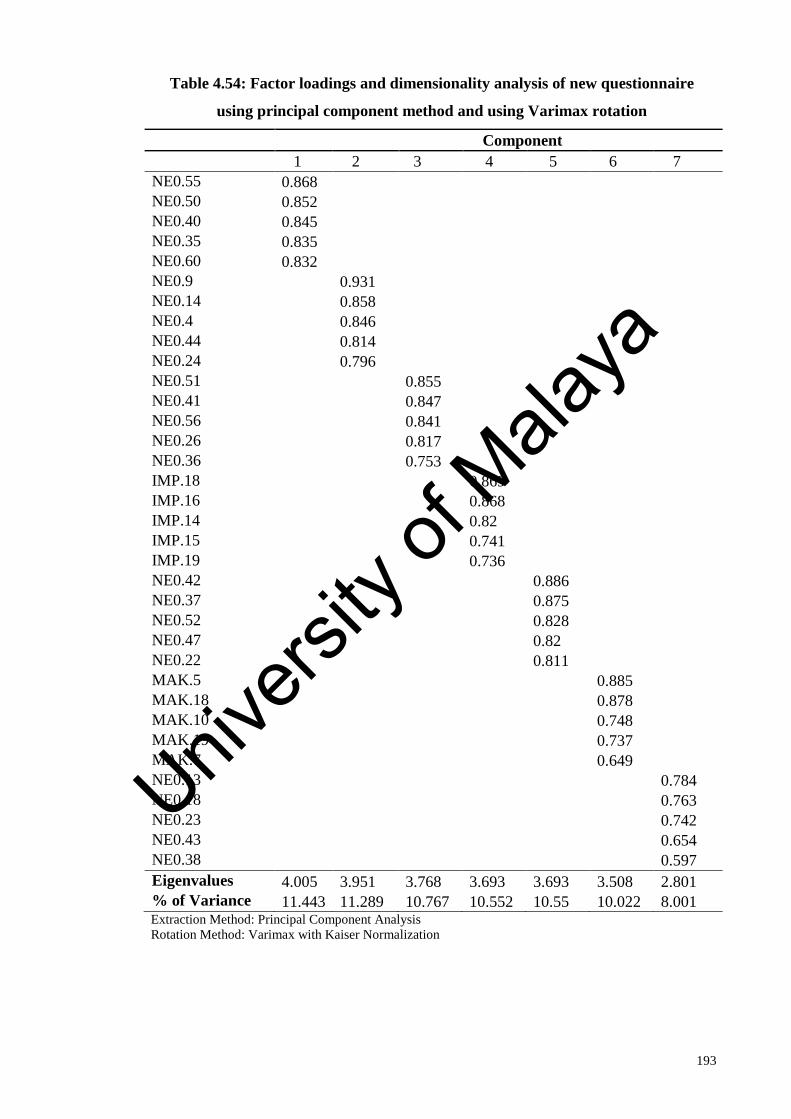
193
Table 4.54: Factor loadings and dimensionality analysis of new questionnaire
using principal component method and using Varimax rotation
Component
1 2 3 4 5 6 7
NE0.55 0.868
NE0.50 0.852
NE0.40 0.845
NE0.35 0.835
NE0.60 0.832
NE0.9
0.931
NE0.14
0.858
NE0.4
0.846
NE0.44
0.814
NE0.24
0.796
NE0.51
0.855
NE0.41
0.847
NE0.56
0.841
NE0.26
0.817
NE0.36
0.753
IMP.18 0.869
IMP.16 0.868
IMP.14 0.82
IMP.15 0.741
IMP.19 0.736
NE0.42
0.886
NE0.37
0.875
NE0.52
0.828
NE0.47
0.82
NE0.22
0.811
MAK.5
0.885
MAK.18
0.878
MAK.10
0.748
MAK.19
0.737
MAK.7
0.649
NE0.13
0.784
NE0.18
0.763
NE0.23
0.742
NE0.43
0.654
NE0.38
0.597
Eigenvalues 4.005 3.951 3.768 3.693 3.693 3.508 2.801
% of Variance 11.443 11.289 10.767 10.552 10.55 10.022 8.001 Extraction Method: Principal Component Analysis
Rotation Method: Varimax with Kaiser Normalization
Univers
ity of
Mala
ya

194
DISCUSSION AND CONCLUSION CHAPTER 5:
Introduction 5.1
In this chapter, the findings of the study are summarized. Following the
summary, the limitations and contribution of the research are presented. Finally, the
suggestions for possible future research have been given.
The research hypothesis (H1) assume that there are significant differences for
personality traits (Big Five, imposter, and Machiavellian) and mental health among
international and Malaysian students by gender. On the contrary, the investigation null
hypothesis (H01) assumed that there are no differences for personality traits (Big Five,
imposter, and Machiavellian) and mental health among international and Malaysian
students by gender. Furthermore, research hypothesis (H2) indicates that there is a
significant relationship between personality trait in both Malaysian and International
students. Opposing, the investigation null hypothesis (H02) state that there is no
relationship between personality traits and mental health between Malaysian and
International. Moreover, the research hypothesis (H3) assumed that the students‟ mental
health is significantly affected by personality traits patterns. In other words, it is
possible to evaluate the mental health among students by using students‟ personality
traits (Big Five, imposter, and Machiavellian), While the investigation null hypothesis
(H03) assumed that the students‟ mental health are not affected by personality traits and
that what we are trying to investigate through this research.
The following discussion expands on this study’s findings and integrates them in
the context of the relevant literature. Next, the study’s contributions to the literature and
Univers
ity of
Mala
ya
195
implications of the findings for practice are detailed. Last, the study’s limitations are
presented along with recommendations for future research intended to address the
identified limitations.
Comparisons of Personality Traits and Mental Health 5.2
(H01) Assumed that there are no differences for personality traits (Big Five,
imposter, and Machiavellian) and mental health among international and Malaysian
students by gender.
5.2.1 Big Five Personality
For Big-5 personality, the null hypotheses assumed that there are no significant
differences in the Big-5 personality traits and its dimensions between Malaysian and
International students by gender. Table 4.19 presents the comparison between
Malaysian and International students by gender and its interaction based on Big-5
personality.
Based on Table 4.19 which has provided in chapter 4 the outcomes of two ways
ANOVA showed that Neuroticism and Agreeableness were a significant difference
between Male and female; while extroversion, openness, and conscientiousness were
not significantly differences between male and female. There was no significant
difference between Malaysian and International students for Neuroticism, Extroversion,
Openness, Agreeableness, and Conscientiousness. Bonferroni test was applied first to
study the difference between Malaysian and International students for each gender
separately, and the results shown in Table 4.20. The result revealed that Neuroticism,
Univers
ity of
Mala
ya
196
Extroversion, Openness, Agreeableness, and Conscientiousness were not statistically
different between Malaysian and International students for both genders.
Table 4.21 illustrates the result of comparison between male and female students
for both groups separately using family wise Bonferroni test. The result showed that
Neuroticism and Agreeableness between male students and female students were
statistically different in both Malaysian and International students. Extroversion was
statistically different between International male and female students but was not
statistically different between Malaysian male and female. Openness and
Conscientiousness between male students and female students were not statistically
different in both Malaysian and International students.
The result of the study was consistent with McCrae (2002) and Schmitt et al.
(2008). They suggested that personality dimensions are a significant difference between
men and women. Schmitt et al. (2008) indicated that sex differences in personality
consistently tended to be larger in individualistic than in collectivistic nations. Costa et
al. (2008) and Schmitt et al. (2002) used translated, and administered personality scales
in participants’ native languages, whereas in the current study personality items were in
English. Thus, language-related effects could have influenced the several studies’
results. Agreeableness and Neuroticism were the personality traits that corresponded
most closely in the current study and the Costa et al. (2001) study. Estimates of sex
differences in agreeableness and neuroticism in the 18 overlapping countries did, in fact,
correlate significantly across these two studies. Agreeableness, neuroticism, and
extraversion were the traits that corresponded most closely in the current study and the
Schmitt et al. (2008) study. McCrae et.al, (2002) claimed that cultural effects are
potentially confounded with linguistic effects.
Univers
ity of
Mala
ya

197
Vianello, et al., (2013) confirmed the previous result showing that
Agreeableness, Conscientiousness, Extraversion, and Neuroticism reported higher
among the female population than male. Heine and Buchtel (2009) reviewed personality
traits Big Five in different cultures. They concluded that personality traits especially Big
Five personality dimension were consistent across different culture. Furthermore, they
discussed that in the collectivistic cultures people show a higher level of traits which
more is concerning about understanding others than in individualistic cultures.
Weisberg, DeYoung, & Hirsh, (2011) investigated gender differences in personality
traits, and they reported that women showed higher score in neuroticism, agreeableness,
and extroversion. Lippa, Richard A (2010) assessed gender differences in personality
dimensions by using BBC internet survey from over 200,000 participants from 53
nations. Lippa claimed that women scored significantly higher on neuroticism,
extroversion, and agreeableness across nations. Costa et al., (2001) done a gender
differences survey on personality dimension from 26 cultures. They reported women
were reported higher score in neuroticism and agreeableness than men.
Mastor, Khairul, et al., (2000) determined that Big Five model of personality
applies to the Malaysian culture. They compared Malaysians and Australian student,
and they reported that Malaysian students showed higher score in Agreeableness and a
low score in extroversion and openness. Indeed, the current study does not represent the
complete word on cross-cultural consistencies in sex differences in personality.
However, it does provide new knowledge that can be used in future studies on this
topic, and it offers new data from broader participant populations than have typically
been assessed. The results presented here suggest that there may be biological
components to some sex differences in personality and that the power of cultural and
social structural factors to moderate sex differences in personality may be limited. The
Univers
ity of
Mala
ya

198
further cross-cultural research will be necessary to sort out the reasons for these
differing patterns of results across studies and traits. This finding is intriguing and
worthy of further study.
5.2.2 Imposter Phenomenon
For imposter personality, the null hypotheses assumed that there are no
significant differences in imposter personality traits and its dimension between
Malaysian and International students by gender. Table 4.22 presents the comparison
between Malaysian and International students by gender and its interaction based on
imposter personality.
To assess whether there were significant differences between genders (Male and
Female), groups (Malaysian and International) and also their interaction (Groups*
Gender) a two-way ANOVA was applied. Based on Table 4.22 which has presented in
Chapter 4, the Total imposter is a significant difference between Male and female.
There were significant differences between Malaysian and International students for
total Imposter. Bonferroni test was applied to study the difference between Malaysian
and International students for each gender separately. The result in Table 4.23 shows
that Total Imposter is statistically different between Malaysian students for male
students while it is not statistically different between Malaysian and International
student for female students. Table 4.24 illustrates the result of comparison between
male and female students for both groups separately using family wise Bonferroni test.
The results revealed that Imposter between male students and female students was
statistically different in both Malaysian and International students.
Univers
ity of
Mala
ya

199
The result of this study was consistent with Jöstl, et al. (2012). They reported
that imposter feeling was higher whereas self-efficacy was lower in Women doctoral
students than men. The most significant finding is that the impostor phenomenon is
negatively related to research self-efficacy. Research self-efficacy is an important
indicator for successful university careers; hence, the impostor phenomenon was shown
to be a psychological barrier for female university careers. McGregor L. N., et al.
(2008) examined the relationship of IP and depression on college students. Their result
indicated the positive correlation between IP and depression, woman score higher than
men in term of IP. Kumar and Jagacinski (2006), investigated the relationship of
imposter and achievement goals on 135 college students. Women expressed greater
imposter fears than men and were also higher on ability-avoid goals. Cromwell, Brown,
Sanchez-Huceles, and Adair (1990) found out that around 20 % of student shown a high
level of IP. The Impostor Phenomenon (IP) has been identified as a contributor to
distress in some high-achieving individuals.
Clance and Imes (1978) introduced term impostor phenomenon as an internal
experience of intellectual phonies, which appears to be particularly prevalent and
intense from a select sample of high-achieving women. Individual early family
dynamics and later introjection of societal sex-role stereotyping seem to contribute
significantly to the development of the impostor phenomenon. Despite outstanding
academic and professional accomplishments, women who experience the imposter
phenomenon persists in believing that they are not bright and have fooled anyone who
thinks otherwise. Numerous achievements, which one might expect to provide ample
object evidence of superior intellectual, functioning, do not appear to affect the impostor
belief.
Univers
ity of
Mala
ya

200
L. N. McGregor, D. E. Gee, and K. E. Posey (2008) Additionally, a Multivariate
Analysis of Variance (MANOVA) using the IP scores and BDI (Beck depression
inventory) scores as the dependent variables, with sex serving as the independent
variable, revealed that men and women differ significantly on the combined dependent
variables of IP and BDI scores. More specifically, the main effect between sex and IP
score indicates that women have higher IP scores man men. However, the effect
between sex and BDI was not statistically significant.
5.2.3 Machiavellian
For Machiavellian personality, the null hypotheses assumed that there are no
significant differences in Machiavellian personality traits and its dimension between
Malaysian and International students by gender. Table 4.25 presents the comparison
between Malaysian and International students by gender and its interaction based on
Machiavellian personality.
To assess whether there were significant differences between genders (Male and
Female), groups (Malaysian and International) and also their interaction (Groups*
Gender) a two-way ANOVA was applied. Based on table 4.25 which has presented in
chapter 4, the outcomes of the study on Total Machiavellian showed that there was no
significant difference between Male and female and also between Malaysian and
international students for total Machiavellian. According to these results, there was no
significant interaction between gender and groups for total Machiavellian. Bonferroni
test was applied to study the difference between Malaysian and International students
for each sex separately in Table 4.26. The results show that the Total Machiavellian is
statistically different between Malaysian students for male students while it is not
Univers
ity of
Mala
ya

201
statistically difference between Malaysian and International student for female students.
Table 4.27 illustrates the result of comparison between male and female students for
both groups separately using family wise Bonferroni test and the result of revealed that
the Total Machiavellian between male students and female students was not statistically
different in both Malaysian and International students.
These results are in agreement with those obtained by Austin E. J. et al. (2007)
reported that males scored higher than females on Machiavellian. Paulhus and Williams
(2002) findings showed that Male scored significantly higher Machiavellianism. Prior
gender literature suggests that gender influences ethical decision making, with females
being more ethical than males. His result consistent with previous sex research, women
agree less with questionable activities compared to male accounting students. Further
support from Kavanagh P. S. (2013) revealed men had higher levels of Machiavellian
than women (higher but not significant). Jonason Peter K & Tost Jeremy (2010)
reported that men scoring higher in Machiavellian than women did. These results about
gender differences are consistent with those of previous studies.
5.2.4 Mental Health
For mental health, the null hypotheses assumed that there are no significant
differences in the mental health among Malaysian and International students by gender.
Table 4.28 presents the comparison between Malaysian and International students by
gender and its interaction based on mental health.
To assess whether there were significant differences between genders (Male and
Female), groups (Malaysian and International) and also their interaction (Groups*
Gender) a two-way ANOVA was applied (Table 4.28). The outcomes revealed that
Univers
ity of
Mala
ya

202
Somatization, Depression, Anxiety, Social Dysfunction, and Total GHQ showed are a
significant difference between Male and female while there is no significant difference
between Malaysian and International students for Somatization, Depression, Anxiety,
Social Dysfunction, and Total GHQ. According to these results, there are no significant
interaction between gender and groups for Somatization, Depression, Anxiety, Social
Dysfunction, and Total GHQ. Bonferroni test was applied first to study the difference
between Malaysian and International students for each gender separately and the results
(Table 4.29) showed that the Somatization, Depression, Anxiety, social dysfunction,
and Total GHG between Malaysian students and International student for both male and
female students was not statistically different (p>0.05). Table 4.30 illustrates the result
of comparison between male and female students for both groups separately using
family wise Bonferroni test and the results revealed that the Somatization, Depression,
Anxiety, Social Dysfunction, and total GHQ between male students and female students
was statistically different in both Malaysian and International students (p>0.05).
The results are in line with those of previous studies. Du Preez, Cassimjee,
Lauritz, Ghazinour, and Richter (2011) showed that men have less level of
somatization, anxiety, depression, and anxiety symptoms, harm avoidance than women.
Assadi, et al. (2007) reported that women showed higher score in GHQ rather than men
in their study. Emami, et al., Richter (2007) demonstrated the considerable prevalence
of mental health disorder among high school students also girls were shown to
experiencing mental illness more often than boys. Makaremi (1989) survey results
indicated that depression was significantly different between genders and groups (high
school, college student). Song et al. (2008) analyzed the relationship between
depression and three personality factors in college freshmen from Beijing and Hong
Kong. There was no sex difference in prevalence in Beijing while the prevalence was
Univers
ity of
Mala
ya

203
significantly different between sexes in Hong Kong.Li et al. (2008) their results
revealed that ethnicity, gender, age, and level of satisfaction with significant influence
the level of student’s mental health.
The Relationship between Personality Traits and Mental Health 5.3
(H02) there is no relationship between personality traits and mental health
among Malaysian and international.
5.3.1 The Relationship between Big Five Personality and Imposter
The null hypothesis assumed there is no connection between Big Five
Personality Dimension and Imposter Phenomenon and its Sub-Scales. The correlations
between big five (neuroticism, extroversion, openness, agreeableness,
conscientiousness) and an imposter (luck, discount, fake, and total imposter) among
international students are presented in Table 4.32. Pearson product-moment correlation
coefficient analyses showed that there is a significantly strong correlation between
neuroticism and discount, luck, fake, and a total imposter (P<0.001). Meanwhile,
various associations have observed between agreeableness and fake, discount, and total
imposter. Results among Malaysian students are presented in Table 4.33. Pearson
product-moment correlation coefficient analyses showed that there is a significantly
strong correlation between neuroticism and discount, luck, fake, and a total imposter
(P<0.001). There are significant positive correlations between extroversion discount,
luck, fake, and total imposter.
Consistent with other studies regarding the Big Five traits impostor tendencies
are positively related to Neuroticism and negatively to Agreeableness. Bernard et al.
2002; Chae et al. 1995; Ross et al. 2001 stated that The Five-Factor Model of
Univers
ity of
Mala
ya
204
personality is currently the most widely used framework for investigating of the general
personality traits. Studies examining student samples have consistently found a positive
correlation with Neuroticism and a negative correlation with Conscientiousness. Also,
some of this research has indicated a negative relationship with Extraversion and/or
Agreeableness (e.g., Chae et al. 1995; Ross et al. 2001), although these associations are
much weaker and inconsistent across studies. For reasons of generalizability, it is
crucial that these relationships between the IP and traits of the FFM obtained in students
are replicated in settings where stakes are much higher, such as the work context.
Lester & Moderski, (1995) found that the IP was related to a history of prior suicidal
ideation and attempts, psychoticism, neuroticism, irrational thinking, and manic and
depressive tendencies as assessed with the Eysenck Personality Questionnaire.
The impostor phenomenon (IP) discusses the intense feelings of intellectual
fraudulence, often experienced by high-achieving individuals. Vergauwe. Jasmine
(2014) Personality traits refer to ‘‘dimensions of individual differences in tendencies to
show consistent patterns of thoughts, feelings, and actions’’ (McCrae and Costa 2003,
p. 25). IP is defined regarding pervasive patterns of dysfunctional thoughts and feelings.
Ross and Krukowaski (2003) described the IP as a maladaptive personality style, which
can be the product of a combination of traits, including the Big Five traits (e.g., Watson
2012). Clearly, the on-going fear of being exposed as incompetent is a prominent
emotion in the IP. Besides the central role of anxiety (e.g., Oriel et al. 2004),
associations with other facets of Neuroticism, such as depression (McGregor et al.
2008) and shame (Cowman and Ferrari 2002), substantiate the importance of
Neuroticism as a dispositional source of impostor tendencies. The persistent feelings of
incompetence are resided at the heart of the impostor construct.
Univers
ity of
Mala
ya

205
5.3.2 The Relationship between Big Five Personality and Machiavellian
The null hypothesis assumed there is no relationship between Big Five
personality dimension and Machiavellian traits and its sub-scales. The correlations
between big five (neuroticism, extroversion, openness, agreeableness,
conscientiousness) and Total Machiavellian are presented in Table 4.34 and Table 4.35.
Pearson product-moment correlation coefficient analyses have shown that there is a
significantly strong correlation between Neuroticism and Total Machiavellian among
international students. Among Malaysian students, the Pearson product-moment
correlation coefficient analyses have shown that there is a significant correlation
between Neuroticism and Total Machiavellian. There is a significant relationship
between Extroversion and Total Machiavellian (P<0.001).
The result was consistent with Stead, et al., (2012) which indicated that
Neuroticism and extraversion were positively correlated with Machiavellianism while
conscientiousness was negatively associated with Machiavellianism. Jakobwitz and
Egan (2006) indicated that Machiavellianism is associated with a moderate level of
neuroticism, and low levels of conscientiousness. Lee and Ashton (2005) reported that
moderate negative correlations between Big Five Agreeableness and Machiavellianism.
E. J. Austin, Farrelly, Black, and Moore (2007) found that Mach is negatively correlated
with Agreeableness and Conscientiousness, but positively correlated with Emotional
manipulation. Elson Jerome (1989) found that High Machs were significantly more
extroverted. Skinner (1983) revealed that the Machiavellian personality tends to be
extroverted. Philip A. Vernon & Leanne C. Vickers a (2007) claimed that
Machiavellianism correlates positively with neuroticism.
Univers
ity of
Mala
ya

206
Philip A. Vernon a and Leanne C. Vickers a (2007) studied the relationship of
Machiavellianism and Big 5 personality dimensions on 278 adult twins. Participant
completed measures Mach-IV inventory and Big 5 (NEO-PI-R). Machiavellianism
correlates positively with neuroticism. Consistent with previous works, they found a
significant correlation between each big five dimensions Machiavellianism was
negatively correlated with agreeableness and conscientiousness and positively
correlated with neuroticism. E. J. Austin, Farrelly, Black, and Moore (2007) examined
the associations between Machiavellianism (Mach) and emotional manipulation with
personality dimensions on the samples of 199 Edinburg University’s students. They
found, that Mach is negatively correlated with Agreeableness and Conscientiousness,
but positively correlated with Emotional manipulation.
5.3.3 The Relationship between Mental Health and Machiavellian
The null hypothesis assumed there is no Relationship between Mental Health
and Machiavellian Traits and its sub-scales. The correlations between Mental Health
(Somatization, Depression, Anxiety, Social dysfunction) and Machiavellian is presented
in Table 4.36 and Table 4.37. Among international students, Pearson product-moment
correlation coefficient analyses have shown that there is a significant positive
correlation between Social Dysfunction, Somatization, Depression, Anxiety and Total
mental health with Total Machiavellian (P<0.001). Among Malaysian students result
have shown that there is a significant positive correlation between Somatization,
Anxiety, and Total mental health with Total Machiavellian (P<0.001).
Nigro and Galli (1985) stated that there is a positive correlation between Mach
score and both states of anxiety and trait anxiety were found in both sexes. They
Univers
ity of
Mala
ya

207
hypothesized that moderate anxiety may be associated with high Machiavellian. Fehr,
Samsom, and Paulhus (1992) in their review of the literature on Machiavellianism from
1971 to 1987 found that Machiavellianism was consistently associated with anxiety.
Gurtman (1992) reported that Machiavellianism has been related to greater problems
with intimacy, sociability, and being too controlling in interpersonal relationships.
Given that the unethical acts committed by Machiavellians can include a wide range of
behaviors(e.g., stealing, lying, and cheating), it seems logical that Machiavellianism has
a multidimensional effect on well-being, affecting not only the targets or victims of the
behaviors but also work teams and the organization in a much more general sense
(ibid.). Interestingly, because Machiavellianism is a personality construct, the
perpetrator (i.e., the Machiavellian) should also experience significant detrimental
effects on his/her own well-being resulting from this innate, amoral orientation and the
actual execution of unethical acts. Machiavellian may suffer more than they benefit
from their orientation toward others on lower satisfaction, higher anxiety, and
compromised psychological well-being. (Jones, D. N., &Paulhus, D. L. (2009).
Latorre and McLeoad (1978) found no clear link between Machiavellianism and
depression. Together, these findings suggest that Machiavellians can generally be
psychologically stable individuals who nevertheless may be dissatisfied with their
accomplishments, prone to high anxiety, and often disconnected from their emotions in
ways that greatly compromise their overall well-being.
Machiavellianism has been described as a dispositional tendency to manipulate
and exploit others (Christie &Geis, 1970). These authors have conceptualized
Machiavellianism as a normal dimension of personality and have observed that
respondents endorsing Machiavellian traits were more likely to behave in a cold and
Univers
ity of
Mala
ya
208
manipulative way in the laboratory and real word studies. Machiavellianism has been
recently linked to juvenile delinquency (Hadjar, Baier, Boehnke, & Hagan, 2007).
Research also indicates a negative relationship between Machiavellianism and self-
esteem (Austin et al., 2007; Dahling, Whitaker, and Levy, 2009; Jones and Paulhus,
2009; McHoskey et al., 1999).McHoskey et al. (1999) found that Machiavellianism was
negatively associated with self-reports of subjective well-being. Naser Aghababaei
(2015) Machiavellian traits do not particularly live a long and happy life.
The links between psychopathology and Machiavellianism can be first discussed
by the distinction between Axis I and Axis II disorders. Axis I contains primarily mood
and anxiety disorders while Axis II consist of personality disorders. The 1992 review
indicated a consistent positive association between Machiavellianism and anxiety. Even
Christie and Geis (1970) were suspicious that this counterintuitive relationship was
artifactual, resulting from the willingness of Machs to disclose negative feelings.
Wrightsman (1991) agreed that high anxiety was at odds with the concept of
Machiavellianism, especially their detachment in situations of interpersonal conflict.
More recent research has failed to resolve this paradox, with some studies finding no
correlation (Allsopp, Eysenck, &Eysenck, 1991; McNamara, Durso, & Harris, 2007;
Paulhus& Williams, 2002) and others finding a positive correlation (Jakobowitz &
Egan, 2006; Ramanaiah, Byravan, & Detwiler, 1994). The findings of guilt are also
inconsistent: Some research indicates that Machs are more guilt prone (Drake, 1995),
whereas others report that Machs are less guilt-prone (Wastell & Booth, 2003).
Scattered research indicates some positive correlations with other forms of
psychopathology, for example, depression (Bakir, Yilmaz, & Yavas, 1996), paranoia
(Christoffersen & Stamp, 1995), alexithymia (Wastell & Booth, 2003), socially
prescribed perfectionism (Sherry, Hewitt, Besser, Flett, & Klein, 2006), and low self-
Univers
ity of
Mala
ya

209
esteem (Valentine & Fleischman, 2003; Yong, 1994). Overall links between Mach
scales and psychopathology measures appear to be weak and sample-specific.
Interpersonal adjustment (Axis IV) concerns whether individuals have harmonious
relations with other people. Although clearly relevant to the psychological adjustment
of Machiavellians, the Axis IV diagnosis is, once again, mixed. On the one hand, Machs
sometimes harm those around them, as we describe later. On the contrary, as noted,
Machs can earn liking and respect under select circumstances and time frames
(presumably when they deem it to be in their interest) (Hawley, 2006).
5.3.4 The Relationship between Mental Health and Imposter
The null hypothesis assumed there is no relationship between mental health and
imposter traits and its sub-scales. The correlations between Mental Health
(Somatization, Depression, Anxiety, and Social dysfunction) and Total Imposter are
presented in Table 4.38 and 4.39. Pearson product-moment correlation coefficient
analyses have shown that there is a significantly strong correlation between Social
Dysfunction, Somatization, Depression, Anxiety, Total Mental Health and Total
imposter among international students (P<0.001). Results have shown that there is a
high significant correlation between, Somatization, Depression, Anxiety, Total Mental
Health and Total imposter among local students (P<0.001).
The result was consistent with Loretta Neal McGregor, Damon E Gee, and K
Elizabeth Posey (2008). Results of a Pearson product-moment correlation yielded a
positive relationship between the Imposter and depression. The results of the study of
September et al. (2001) showed impostors scored lower on individual indicators of
health, particularly on self-acceptance and mastery of the environment. Cokley,
Univers
ity of
Mala
ya
210
McClain, Enciso, and Martinez (2013) had found that minority status stress and
impostor feelings were predictors of mental health (stress). Impostor feelings were
stronger predictors of mental health than minority status stress. L. N. McGregor, D. E.
Gee, and K. E. Posey (2008) indicated that there is the positive correlation between
Imposter and depression, woman score higher than men in term of Imposter.
Ives (2010) reported an inverse relationship between the IP and Self-efficiency.
Also, they concluded that participants who diagnosed as imposters had reported poorer
mental health in compare with non-imposters. They have found that imposters are
suffering from low mental health. Clance and O’Toole (1998) claimed that high score in
IP is experiencing higher levels of anxiety, fear, doubt, and psychosomatic symptoms.
Sonnak & Towell, (2001) stated that poorer mental health was significantly related to
increasing levels of imposter score. Also, subjects classified as imposter were found to
report significantly poorer mental health (higher GHQ score) that non-imposters.
(Chrisman, Pieper, Clance, Holland, & Glickauf-Hughes, 1995; McGregor, Gee, &
Posey, 2008) The imposter phenomenon has been tied to clinically significant mental
health symptoms of depression, generalized anxiety, and low-esteem. Bernard, et al.,
(2002) said that Depression, anxiety, perceived competence, and self-discipline were to
found be correlated with imposter feelings.
Bernard et al., (2002) Found a close relationship between imposter with
depression so it seems that depression plays a crucial role within the impostor construct.
Also, other, often found associated constructs of the impostor phenomenon with anxiety
(e.g. Bernard et al., 2002; Oriel et al., 2004) and low self-esteem (e.g. Ross &
Krukowski, 2003; Sonnak & Towell, 2001). Also, also self-handicapping, self-doubt,
and negative affect found as correlates (Leary et al., 2000; for & Kleitman, 2006).
Univers
ity of
Mala
ya
211
Sonnak and Towell (2001) found in a sample of British students impostors reported
significantly higher scores on the General Health Questionnaire (GHQ; Goldberg,
1978), indicating a weaker mental health than non-impostors.
5.3.5 The Relationship between Mental Health and Big Five
The null hypothesis assumed there is no relationship between mental health and
Big Five personality traits and its sub-scales. The correlations between Mental Health
(Somatization, Depression, Anxiety, Social dysfunction) and Big Five (Neuroticism,
Extroversion, Openness, Agreeableness, Conscientiousness) are presented in Table 4.40
and Table 4.41. Pearson product-moment correlation coefficient analyses have shown
that there are a significantly strong correlation between Neuroticism and Agreeableness
with total mental health among international students (P<0.001). Among local students,
there was a significantly strong correlation between Neuroticism, Extroversion, and
conscientiousness with total mental health.
The result of the study was consistent with MdNordin, Abu Talib, and Yaacob
(2009). They examined the relations of personality and loneliness and its effect on
mental health of Malaysian undergraduate students. Their result showed that 34.4
percentages of students are at risk of mental health problems. Also, extroversion,
agreeableness, conscientiousness, openness, and loneliness showed to have a significant
relationship on mental health. There was a significant difference in mental health
between the year of study, the field of study, ethnicity, and religion. Finally, they
reported that loneliness, neuroticism, and extraversion were significant predictors of
mental health. Shirazi, Khan, and Ansari (2012) showed that mental health and
personality traits are significantly correlated. Mental health was significantly predicted
Univers
ity of
Mala
ya

212
by agreeableness, neuroticism, and openness and there were no significant differences
between professional and non-professional mental health and personality among both
genders. Lamers, et al., (2012) released that Neuroticism was shown to be the main
correlations psychopathology. Ahadi, B., & Basharpoor, S. (2010) stated that
Neuroticism had a significant negative relationship with extroversion, agreeableness,
and conscientiousness. However, it had a significant positive correlation with physical
symptoms, anxiety, social dysfunction, depression and low mental health. Extroversion
had a positive relationship with openness to experience, and negative correlation with
physical symptoms, anxiety, depression, and low mental health. Openness to experience
had a positive relationship with conscientiousness. Agreeableness had a significant
negative correlation with social functioning. Conscientiousness didn't have a great
association with any of the mental health indices.
Ed Diener, Oishi, and Lucas (2003) reviewed past literature about the
associations of well-being and personality with regards to different cultural contexts.
They concluded that personality traits such as extroversion, neuroticism, and self-
esteem were effective on the levels of well-being. Besides personality, life events and
environments also have a large effect on the well-being of people. Cultural variables
found to explain and moderate well-being differences among different societies. It’s
very challenging to assess well-being across different societies, yet this kind of cross-
cultural measures it valuable and still so many unanswered questions need to be
answered. Joshanloo, Rastegar, and Bakhshipour (2012) showed a negative correlation
between neuroticism and aspects of social well-being. Furthermore, Conscientiousness,
openness, and agreeableness were positively associated with aspects of social well-
being. Finally, there was no association between extroversion and social well-being.
Univers
ity of
Mala
ya

213
Prediction of Mental Health by Personality 5.4
(H03) Assumed that the students’ mental health is not affected by personality
traits. The null hypothesis assumed that the mental health cannot be assessed by
knowing personality traits. To investigate about the main objective of this multiple
research regressions was applied to examine what extent the proposed multiple linear
regression models is supported by the research data. The regression tested how well the
mental health scores could be predicted by determined Big Five, Imposter, and
Machiavellian. In the multiple regression models, age and gender and level of
education, Neuroticism, Extroversion, Agreeableness, Openness, Conscientiousness,
Total Machiavellian, and Total Imposter were set as the independent variables and Total
Mental Health was considered as the dependent variable. Results of regression
coefficients among international students are presented in Table 4.44. According to
these results, it was found that among all personality traits Neuroticism, Openness,
Agreeableness and Total Imposter were significantly effected on the mental health.
Results of regression coefficients among international students are presented in Table
4.45. According to these results, it was found that among all personality traits
Neuroticism, Extroversion, and Total Imposter were significantly influence on the
mental health of Malaysian students.
The result was consistent with Loretta Neal McGregor, Damon E Gee, and K
Elizabeth Posey (2008) Results of a Pearson product-moment correlation yielded a
positive correlation between the Imposter and depression. The results of the study of
September et al. (2001) showed impostors scored lower on certain indicators of health,
particularly on self-acceptance and mastery of the environment. Cokley, McClain,
Enciso, and Martinez (2013) had found that minority status stress and impostor feelings
Univers
ity of
Mala
ya

214
were predictors of mental health (stress). Impostor feelings were stronger predictors of
mental health than minority status stress. L. N. McGregor, D. E. Gee, and K. E. Posey
(2008) indicated that there is the positive correlation between Imposter and depression,
woman score higher than men in term of Imposter.
Vincent Egan 2014, Meta-analyses using the Five Factor Model of personality
found Neuroticism strongly predicts lower life satisfaction, less happiness, and more
negative emotions, whereas Agreeableness (A) and Extraversion (E) predict positive
emotions (DeNeve& Cooper, 1998; Steel, Schmidt, & Shultz, 2008). MdNordin, Abu
Talib, and Yaacob (2009) examined the relations of personality and loneliness and its
effect on mental health of Malaysian undergraduate students. Their result showed that
34.4 percentages of students are at risk of mental health problems. Also, extroversion,
agreeableness, conscientiousness, openness, and loneliness showed to have a significant
relationship with mental health. There was a significant difference in mental health
between the year of study, the field of study, ethnicity, and religion. Finally, they
reported that loneliness, neuroticism, and extraversion were significant predictors of
mental health. Shirazi, Khan, and Ansari (2012) showed that mental health and
personality traits are significantly correlated. Mental health was significantly predicted
by agreeableness, neuroticism, and openness and there were no significant differences
between professional and non-professional mental health and personality amongst both
genders.
Limitation and Recommendation for Future Research 5.5
i. Due to the high level of neuroticism among female students, it is
recommended to provide training and consulting services to develop and
Univers
ity of
Mala
ya

215
improve emotional stability and mental health among female university
students.
ii. Due to the low level of extroversion characteristics between male
students, it is recommended to provide counselling and educational
services, to enhance communication skills and self-confidence among
male university students.
iii. With regard to the low level of mental health among International
Students, it is suggested to include life skills ( such as problem solving,
creative and lateral thinking, critical thinking, effective communication,
interpersonal relationships, self-awareness and mindfulness,
assertiveness, empathy, equanimity, coping with stress, resilience, and
attitude ) as a subject in between university courses to provide education
of the life skills to students and also to be considered as an important
training subject in the level of the society and development of the
consultation services in this field is recommended.
iv. Concerning the low level of mental health among students, it is
suggested to provide problem-solving skills as a subject for the Students.
v. With regard to the low level of mental health among the female students,
it is suggested to provide the training on emotional self-regulation skill to
female students.
vi. With regard to the low level of mental health among the students, it is
suggested to establish more close interaction and communication
between governmental institutions and the universities.
vii. The data in this study came entirely from a single method, i.e., Likert-
scale based, self-report questionnaires. Future research into this area
Univers
ity of
Mala
ya

216
should consider adding at least one additional type of data collection
method to avoid method effect.
viii. The proposed tool can be employ as a periodic assessment tool for
University of Malay students along their study.
ix. The proposed tool can be used to assess mental health in other
educational institution and to compare local with international students.
Univers
ity of
Mala
ya
217
REFERENCES
Abdel-Khalek, A. M. (2012). Personality and mental health: Arabic scale of mental
health, eysenck personality questionnaire, and neo five factor inventory.
Psychological reports, 111(1), 75-82.
Abela, B. (2008). Handbook of Depression in Children and Adolescents. Psychological
medicine, 38(12), 1816.
Ahadi, B., & Basharpoor, S. (2010). Relationship between sensory processing
sensitivity, personality dimensions and mental health. Journal of Applied
Sciences, 10(7), 570-574.
Ahmed, S., & Stewart, R. (1981). Factor analysis of the Machiavellian scale. Social
Behavior and Personality: an international journal, 9(1), 113-115.
Akif, T., Basım, H. N., & Çetin, İ. T. v. F. (2010). The Role of Five-Factor Personality
Traits in Impression Management Tactics. Ege Akademik Bakış, 10 (2), 539-557.
Al-Dubai, S. A. R., Al-Naggar, R. A., Alshagga, M. A., & Rampal, K. G. (2011). Stress
and coping strategies of students in a medical faculty in Malaysia. The
Malaysian journal of medical sciences: MJMS, 18(3), 57.
Allik, J., & McCrae, R. R. (2004). Toward a Geography of Personality Traits Patterns of
Profiles across 36 Cultures. J Cross Cult Psychol, 35(1), 13-28.
Allport, G. W., & Odbert, H. S. (1936). Trait-names: A psycho-lexical study.
Psychological monographs, 47(1), 1-17.
Andriola, E., Di Trani, M., Grimaldi, A., & Donfrancesco, R. (2011). The relationship
between personality and depression in expectant parents. Depression research
and treatment, Volume 2011, 1-5.
Anthony, A. J. (2001). Relationship of a multidimensional well-being measure to broad
dimensions of personality, affect, thinking, optimism, and social hopelessness.
(NQ67916 Ph.D.), York University (Canada), Ann Arbor. ProQuest
Dissertations & Theses Full Text database.
Ary, D., Jacobs, L., Sorensen, C., & Walker, D. (2013). Introduction to research in
education: Cengage Learning.
Univers
ity of
Mala
ya
218
Arya, R., Antonisamy, B., & Kumar, S. (2012). Sample size estimation in prevalence
studies. The Indian Journal of Pediatrics, 79(11), 1482-1488.
Association, A. C. H. (2007). American college health association national college
health assessment spring 2006 reference group data report (abridged). Journal of
American College Health, 55(4), 195.
Association, A. P. (2000). Diagnostic and Statistical Manual of Mental Disorders. 4th
text revision ed. Washington, DC: American Psychiatric Association.
Association, D.-A. P. (2013). Diagnostic and statistical manual of mental disorders.
Arlington: American Psychiatric Publishing.
Austin, E. J., Farrelly, D., Black, C., & Moore, H. (2007). Emotional intelligence,
Machiavellianism and emotional manipulation: Does EI have a dark side?
Personality and Individual Differences, 43(1), 179-189.
Bakir, B., Yilmaz, U. R., & Yavas, I. (1996). Relating depressive symptoms to
Machiavellianism in a Turkish sample. Psychological reports, 78(3), 1011-1014.
Barrett, L., & Salovey, P. (2002). The wisdom in feeling: Processes underlying
emotional intelligence. New York: Guilford.
Beavers, A. S., Lounsbury, J. W., Richards, J. K., Huck, S. W., Skolits, G. J., &
Esquivel, S. L. (2013). Practical considerations for using exploratory factor
analysis in educational research. Practical assessment, research & evaluation,
18(6), 1-13.
Benson, J., & Clark, F. (1982). A guide for instrument development and validation.
American Journal of Occupational Therapy, 36(12), 789-800.
Bernard, N. S., Dollinger, S. J., & Ramaniah, N. V. (2002). Applying the Big Five
Personality Factors to the Impostor Phenomenon. Journal of personality
assessment, 78(2), 321-333.
Bollen, K. A., & Long, J. S. (1993). Testing structural equation models (Vol. 154):
Sage.
Brown, J. D., Riley, A. W., & Wissow, L. S. (2007). Identification of youth
psychosocial problems during pediatric primary care visits. Administration and
Policy in Mental Health and Mental Health Services Research, 34(3), 269-281.
Univers
ity of
Mala
ya

219
Burger, J. (2015). Personality. USA: Cengage Learning
Burger, J. M. (2011). Personality (8th Ed ed.). Australia Wadsworth Cengage Learning
Buss, A. H., & Plomin, R. (2014). Temperament (PLE: Emotion): Early Developing
Personality Traits: Psychology Press.
Byrne, B. M. (2013). Structural equation modeling with AMOS: Basic concepts,
applications, and programming. Routledge.
Calvete, E., & Corral, S. (2000). Machiavellianism: Dimensionality of the Mach IV and
its relation to self-monitoring in a Spanish sample. The Spanish journal of
psychology, 3, (3).
Chae, J.-H., Piedmont, R. L., Estadt, B. K., & Wicks, R. J. (1995). Personological
evaluation of Clance's Imposter Phenomenon Scale in a Korean sample. Journal
of Personality Assessment, 65(3), 468-485.
Chamorro-Premuzic, T., Swami, V., Furnham, A., & Maakip, I. (2009). The Big Five
personality traits and uses of music: A replication in Malaysia using structural
equation modeling. Journal of Individual Differences, 30(1), 20-27.
Chang, S.-M., Law, D. W., & Chang, H.-K. (2011). The impact of personality on
depression among university students in Taiwan. Chang Gung Med. J, 34(5),
528-535.
Chapman, B. P., Weiss, A., Barrett, P., & Duberstein, P. (2012). Hierarchical structure
of the Eysenck Personality Inventory in a large population sample: Goldberg’s
trait-tier mapping procedure. Personality and Individual Differences, 54(4), 479-
484.
Cheng, H., & Furnham, A. (2003). Personality, self-esteem, and demographic
predictions of happiness and depression. Personality and Individual Differences,
34(6), 921-942.
Chioqueta, A. P., & Stiles, T. C. (2005). Personality traits and the development of
depression, hopelessness, and suicide ideation. Personality and Individual
Differences, 38(6), 1283-1291.
Chrisman, S. M., Pieper, W., Clance, P. R., Holland, C., & Glickauf-Hughes, C. (1995).
Validation of the Clance imposter phenomenon scale. Journal of Personality
Assessment, 65(3), 456-467.
Univers
ity of
Mala
ya

220
Christie, R. (1970). Studies in machiavellianism. Academic Press.
Christie, R., & Geis, F. (1999). How devious are you? Take the Machiavelli test to find
out. Journal of Management in Engineering, 15(4), 17-19.
Christie, R., & Geis, F. L. (2013). Studies in machiavellianism: Academic Press.
Christoffersen, D., & Stamp, C. (1995). Examining the relationship between
Machiavellianism and paranoia. Psychological reports, 76(1), 67-70.
Clance, P. R. (1985). The impostor phenomenon: Overcoming the fear that haunts your
success. Peachtree Pub Ltd.
Clance, P. R., & Imes, S. A. (1978a). The imposter phenomenon in high achieving
women: Dynamics and therapeutic intervention. Psychotherapy: Theory,
Research & Practice, 15(3), 241.
Clance, P. R., & Imes, S. A. (1978b). The imposter phenomenon in high achieving
women: Dynamics and therapeutic intervention. Psychotherapy: Theory,
Research & Practice; Psychotherapy: Theory, Research & Practice, 15(3), 241.
Cokley, K., McClain, S., Enciso, A., & Martinez, M. (2013). An examination of the
impact of minority status stress and impostor feelings on the mental health of
diverse ethnic minority college students. Journal of Multicultural Counseling
and Development, 41(2), 82-95.
Corzine, J. B. (1997). Machiavellianism and management: A review of single-nation
studies exclusive of the USA and cross-national studies. Psychological reports,
80(1), 291-304.
Costa, P. T., & McCrae, R. R. (1992). Four ways five factors are basic. Personality and
Individual Differences, 13(6), 653-665.
Costello, E. J., Egger, H., & Angold, A. (2005). 10-year research update review: the
epidemiology of child and adolescent psychiatric disorders: I. Methods and
public health burden. Journal of the American Academy of Child & Adolescent
Psychiatry, 44(10), 972-986.
Costello, E. J., Egger, H., & Angold, A. (2005). 10-Year research update review: The
epidemiology of child and adolescent psychiatric disorders: I. Methods and
Univers
ity of
Mala
ya

221
public health burden. Journal of the American Academy of Child and Adolescent
Psychiatry, 44(10), 972-986.
Cromwell, B., Brown, N. W., Sanchez-Huceles, J., & Adair, F. L. (1990). The Impostor
Phenomenon and personality characteristics of high school honor students.
Journal of Social Behavior & Personality , 5(6), 563.
Dahling, J. J., Whitaker, B. G., & Levy, P. E. (2009). The development and validation
of a new Machiavellianism scale. Journal of management, 35(2), 219-257.
De Clercq, B., & De Fruyt, F. (2012). A Five‐Factor Model Framework for
Understanding Childhood Personality Disorder Antecedents. Journal of
Personality, 80(6), 1533-1563.
DeRenzo, E., & Moss, J. (2005). Writing clinical research protocols: Ethical
considerations. Academic Press.
Diener, E., Oishi, S., & Lucas, R. E. (2003). Personality, culture, and subjective well-
being: Emotional and cognitive evaluations of life. Annual review of psychology,
54(1), 403-425.
Digman, J. M., & Takemoto-Chock, N. K. (1990). Factors in the natural language of
personality: Re-analysis, comparison, and interpretation of six major studies.
Multivariate behavioral research, 16(2), 149-170.
Draper, N. R., & Smith, H. (2014). Applied regression analysis. John Wiley & Sons.
Drum, D. J., Brownson, C., Burton Denmark, A., & Smith, S. E. (2009). New data on
the nature of suicidal crises in college students: Shifting the paradigm.
Professional Psychology: Research and Practice, 40(3), 213.
du Preez, E., Cassimjee, N., Lauritz, L. E., Ghazinour, M., & Richter, J. (2011).
Personality and mental health: An investigation of south african police trainees
1, 2. Psychological reports, 108(1), 301-316.
Durand, V., & Barlow, D. (2012). Essentials of abnormal psychology. Cengage
Learning.
Eap, S., Degarmo, D. S., Kawakami, A., Hara, S. N., Hall, G. C., & Teten, A. L. (2008).
Culture and Personality Among European American and Asian American Men.
J Cross Cult Psychol, 39(5), 630-643.
Univers
ity of
Mala
ya

222
Egan, V., Austin, E., Elliot, D., Patel, D., & Charlesworth, P. (2003). Personality traits,
personality disorders and sensational interests in mentally disordered offenders.
Legal and Criminological Psychology, 8(1), 51-62.
Exline, R., Thibaut, J., Hickey, C., Gumpert, P., Christie, R., & Geis, F. (1970). Studies
in Machiavellianism. Academic Press.
Eysenck, H. J. (1990). The biological basis of personality (Vol. 689). Transaction
publishers.
Eysenck, H. J. (1990). Dimensions of personality (Vol. 5). Transaction Publishers.
Fabrigar, L. R., Wegener, D. T., MacCallum, R. C., & Strahan, E. J. (1999). Evaluating
the use of exploratory factor analysis in psychological research. Psychological
methods, 4(3), 272.
Farnam, A., Farhang, S., Bakhshipour, A., & Niknam, E. (2011). The five factor model
of personality in mixed anxiety-depressive disorder and effect on therapeutic
response. Asian journal of psychiatry, 4(4), 255-257.
Faul, F., Erdfelder, E., Lang, A.-G., & Buchner, A. (2007). G* Power 3: A flexible
statistical power analysis program for the social, behavioral, and biomedical
sciences. Behavior research methods, 39(2), 175-191.
Fehr, B., & Samsom, D. (2013). The Construct of Machiavellianism: Twenty Years
Later. Advances in personality assessment, 9, 77.
Fehr, B., Samsom, D., & Paulhus, D. L. (1992). The construct of Machiavellianism:
Twenty years later. Advances in personality assessment, 9, 77-116.
Fiske, S. T., Gilbert, D. T., & Lindzey, G. (2010). Handbook of social psychology (Vol.
2). John Wiley & Sons.
Fornell, C., & Larcker, D. F. (1981). Evaluating structural equation models with
unobservable variables and measurement error. Journal of marketing research,
39-50.
Fowler Jr, F. J. (2013). Survey research methods. Sage publications.
French, B. F., Ullrich-French, S. C., & Follman, D. (2008). The psychometric properties
of the Clance Impostor Scale. Personality and Individual Differences, 44(5),
1270-1278.
Univers
ity of
Mala
ya

223
Funder, D. (2012). The Personality Puzzle (Sixth Edition ed.). University of California
W. W. Norton & Company.
Funder, D. C. (2004). The personality puzzle. WW Norton & Co.
Furnham, A., & Cheng, H. (1999). Personality as predictor of mental health and
happiness in the East and West. Personality and Individual Differences, 27(3),
395-403.
Gallagher, R. P. (2014). National survey of college counseling centers 2014 (Vol. 30).
University of Pittsburgh. Retrieved June.
Garcia, D. (2011). Two models of personality and well-being among adolescents.
Personality and Individual Differences, 50(8), 1208-1212.
Garcia, D. (2012). The Affective Temperaments: Differences between Adolescents in
the Big Five Model and Cloninger’s Psychobiological Model of Personality.
Journal of Happiness Studies, 13(6), 999-1017.
Gay, L., & Airasian, P. (2011). Education research: Competencies for Analysis and
Applications. New Jersey.
Ghazinour, M., Lauritz, L. E., Du Preez, E., Cassimjee, N., & Richter, J. (2010). An
investigation of mental health and personality in Swedish police trainees upon
entry to the police academy. Journal of Police and Criminal Psychology, 25(1),
34-42.
Ghazinour, M., & Richter, J. (2013). An investigation of mental health and personality
in Swedish social work students upon entry to university training. European
Journal of Social Work, 1-15.
Ghorbani, N., Watson, P., & Morris, R. J. (2000). Personality, stress and mental health:
evidence of relationships in a sample of Iranian managers. Personality and
Individual Differences, 28(4), 647-657.
GhorbaniAmir, H. A., AhmadiGatab, T., & Shayan, N. (2011). Relationship between
type a personality and mental health. Procedia-Social and Behavioral Sciences,
30, 2010-2018.
Gignac, G. E., Bates, T. C., & Jang, K. L. (2007). Implications relevant to CFA model
misfit, reliability, and the five-factor model as measured by the NEO-FFI.
Personality and Individual Differences, 43(5), 1051-1062.
Univers
ity of
Mala
ya
224
Goldberg, D. (1978). Manual of the GHQ. NFER: Windsor.
Goldberg, D. P., & Hillier, V. F. (1979). A scaled version of the General Health
Questionnaire. Psychological medicine, 9(01), 139-145.
Guilford, J., & Fruchter, B. (1973). Fundamental Statistics in Psychology and
Education. New York, McGraw-Hill.
Gunnthorsdottir, A., McCabe, K., & Smith, V. (2002). Using the Machiavellianism
instrument to predict trustworthiness in a bargaining game. Journal of Economic
Psychology, 23(1), 49-66.
Gunzerath, L., Faden, V., Zakhari, S., & Warren, K. (2014). National Institute on
Alcohol Abuse and Alcoholism report on moderate drinking. Alcoholism:
Clinical and Experimental Research, 28(6), 829-847.
Habibi, Z., Sadeghi, H., Haghrangbar, F., Madanipour, K., & Azarnoosh, A. (2013a).
The Study of Personality Characteristics and Mental Health in Addicts.
Procedia-Social and Behavioral Sciences, 84, 509-513.
Habibi, Z., Sadeghi, H., Haghrangbar, F., Madanipour, K., & Azarnoosh, A. (2013b).
The Study of Personality Characteristics and Mental Health in Addicts. Procedia
- Social and Behavioral Sciences, 84, 509-513.
Hair, J. F. (2010). Multivariate data analysis. Kennesaw State University.
Hair, J. F., Anderson, R. E., Tatham, R. L., & William, C. (1998). Black (1998),
Multivariate data analysis. Upper Saddle River, NJ: Prentice Hall.
Hair, J. F., Black, W. C., Babin, B. J., & RolphE, A. (2006). Multivariate data analysis.
New Jersey: Prentice Hall.
Heine, S. J., & Buchtel, E. E. (2009). Personality: the universal and the culturally
specific. Annu Rev Psychol, 60, 369-394.
Henning, K., Ey, S., & Shaw, D. (1998). Perfectionism, the impostor phenomenon and
psychological adjustment in medical, dental, nursing and pharmacy students.
Medical Education, 32(5), 456-464.
Henseler, J., Ringle, C. M., & Sinkovics, R. R. (2009). The use of partial least squares
path modeling in international marketing. Advances in International Marketing
(AIM), 20, 277-320.
Univers
ity of
Mala
ya
225
Hill, T. D., & Needham, B. L. (2013). Rethinking gender and mental health: A critical
analysis of three propositions. Social Science & Medicine, 92(0), 83-91.
Ho, R. (2006). Handbook of univariate and multivariate data analysis and
interpretation with SPSS. Rockhampton, Australia: Chapman & Hall/CRC and
Taylor & Francis Group.
Hui-min, L. (2006). Relationship between personality and mental health in
undergraduates. Chinese Journal of Clinical Rehabilitation, 2.
Hunter, J. E., Gerbing, D. W., & Boster, F. J. (1982). Machiavellian beliefs and
personality: Construct invalidity of the Machiavellianism dimension. Journal of
Personality and Social Psychology, 43(6), 1293.
Ickes, W., Reidhead, S., & Patterson, M. (1986). Machiavellianism and self-monitoring:
As different as “me” and “you”. Social Cognition, 4(1), 58-74.
IPH, I. f. P. H. (2008). The Third National Health and Morbidity Survey (NHMS III)
Malaysia. Institute for Public Health (IPH).
Ives, S. K. (2010). The Impact of an Online Orientation Program on the Impostor
Phenomenon, Self-Efficacy, and Anxiety. ProQuest LLC.
Jakobwitz, S., & Egan, V. (2006). The dark triad and normal personality traits.
Personality and Individual Differences, 40(2), 331-339.
John, O. P. (1999). The Big Five trait taxonomy: History, measurement, and theoretical
perspectives. Handbook of personality: Theory and research.University of
California, Berkely.
Jonason, P. K., & Tost, J. (2010). I just cannot control myself: The Dark Triad and self-
control. Personality and Individual Differences, 49(6), 611-615.
Jones, D. N., & Paulhus, D. L. (2009). Machiavellianism. Handbook of individual
differences in social behavior. Guilford Press.
Josefsson, K., Cloninger, C. R., Hintsanen, M., Jokela, M., Pulkki-Råback, L., &
Keltikangas-Järvinen, L. (2011). Associations of personality profiles with
various aspects of well-being: A population-based study. Journal of affective
disorders, 133(1), 265-273.
Univers
ity of
Mala
ya
226
Joshanloo, M., & Afshari, S. (2011). Big five personality traits and self-esteem as
predictors of life satisfaction in Iranian Muslim University students. Journal of
Happiness Studies, 12(1), 105-113.
Jöstl, G., Bergsmann, E., Lüftenegger, M., Schober, B., & Spiel, C. (2012). When Will
They Blow My Cover? Zeitschrift für Psychologie, 220(2), 109-120.
Jylhä, P., & Isometsä, E. (2006). The relationship of neuroticism and extraversion to
symptoms of anxiety and depression in the general population. Depression and
anxiety, 23(5), 281-289.
Kalliath, T. J., O'Driscoll, M. P., & Brough, P. (2004). A confirmatory factor analysis of
the General Health Questionnaire‐12. Stress and Health, 20(1), 11-20.
Kertay, L., Clance, P. R., & Holland, C. L. (1991). A factor study of the Clance
Imposter Phenomenon Scale. Unpublished manuscript. Georgia State
University. Atlanta.
Kjell, O. N., Nima, A. A., Sikström, S., Archer, T., & Garcia, D. (2013). Iranian and
Swedish adolescents: differences in personality traits and well-being. PeerJ, 1,
e197.
Kock, F., Görgens-Ekermans, G., & Dhladhla, T. J. (2014). A confirmatory factor
analysis of the General Health Questionnaire–28 in a Black South African
sample. Journal of Health Psychology, 19(10), 1222-1231.
Kokko, K., Tolvanen, A., & Pulkkinen, L. (2013). Associations between personality
traits and psychological well-being across time in middle adulthood. Journal of
Research in Personality, 47(6), 748-756.
Kotov, R., Gamez, W., Schmidt, F., & Watson, D. (2010). Linking “big” personality
traits to anxiety, depressive, and substance use disorders: a meta-analysis.
Psychological bulletin, 136(5), 768.
Kumar, R. (2010). Research methodology: A step-by-step guide for beginners: Sage
Publications Ltd.
Kumar, S., & Jagacinski, C. M. (2006). Imposters have goals too: The imposter
phenomenon and its relationship to achievement goal theory. Personality and
Individual Differences, 40(1), 147-157.
Univers
ity of
Mala
ya
227
Lală, A., Bobîrnac, G., & Tipa, R. (2010). Stress levels, alexithymia, type A and type C
personality patterns in undergraduate students. Journal of medicine and life,
3(2), 200.
Lamers, S., Westerhof, G. J., Kovács, V., & Bohlmeijer, E. T. (2012). Differential
relationships in the association of the Big Five personality traits with positive
mental health and psychopathology. Journal of Research in Personality, 46(5),
517-524.
Lamers, S. M., Westerhof, G. J., Kovács, V., & Bohlmeijer, E. T. (2012). Differential
relationships in the association of the Big Five personality traits with positive
mental health and psychopathology. Journal of Research in Personality, 46(5),
517-524.
Latorre, R. A., & McLeoad, E. (1978). Machiavellianism and clinical depression in a
geriatric sample. Journal of clinical psychology, 34(3), 659-660.
Laursen, L. (2008). No, You’re Not an Impostor. Science Careers, 15.
Leandro, P. G., & Castillo, M. D. (2010). Coping with stress and its relationship with
personality dimensions, anxiety, and depression. Procedia-Social and
Behavioral Sciences, 5, 1562-1573.
Lee, K., & Ashton, M. C. (2005). Psychopathy, Machiavellianism, and narcissism in the
Five-Factor Model and the HEXACO model of personality structure.
Personality and Individual Differences, 38(7), 1571-1582.
Lester, D., & Moderski, T. (1995). The impostor phenomenon in adolescents.
Psychological reports, 76(2), 466-466.
Li, H., Li, W., Liu, Q., Zhao, A., Prevatt, F., & Yang, J. (2008). Variables predicting the
mental health status of Chinese college students. Asian journal of psychiatry,
1(2), 37-41.
Liu, H. H., Zhang, X. Y., Xiao, R., & Feng, X. G. (2004). [Mental health and
personality characteristics of military medical college students with different
major satisfactions]. Di Yi Jun Yi Da Xue Xue Bao, 24(8), 960-962.
Lobo, A., Pérez-Echeverría, M. J., & Artal, J. (1986). Validity of the scaled version of
the General Health Questionnaire (GHQ-28) in a Spanish population.
Psychological medicine, 16(01), 135-140.
Univers
ity of
Mala
ya
228
Lu, L. (1994). University transition: Major and minor life stressors, personality
characteristics and mental health. Psychological medicine, 24(1), 81-87.
Malouff, J., Thorsteinsson, E., & Schutte, N. (2005). The Relationship Between the
Five-Factor Model of Personality and Symptoms of Clinical Disorders: A Meta-
Analysis. Journal of Psychopathology and Behavioral Assessment, 27(2), 101-
114.
Mandelli, L., Nearchou, F. A., Vaiopoulos, C., Stefanis, C. N., Vitoratou, S., Serretti,
A., & Stefanis, N. C. (2015). Neuroticism, social network, stressful life events:
Association with mood disorders, depressive symptoms and suicidal ideation in
a community sample of women. Psychiatry Research, 226(1), 38-44.
Marel, C., Teesson, M., Mills, K., Darke, S., Ross, J., Slade, T., . . . Lynskey, M.
(2015). Long-term patterns of heroin use and mental health: 11-Year follow-up
of the Australian treatment outcome study. Drug & Alcohol Dependence, 146,
193.
McCrae, & Costa, P. (1997). Personality trait structure as a human universal. American
Psychologist, 52(5), 509-516.
McCrae, R. R., & Costa, P. T. (1991). Adding Liebe und Arbeit: The full five-factor
model and well-being. Personality and social psychology bulletin, 17(2), 227-
232.
McCrae, R. R., & Costa, P. T. (2003). Personality in adulthood: A five-factor theory
perspective: Guilford Press.
McGregor, L. N., Gee, D. E., & Posey, K. E. (2008). I feel like a fraud and it depresses
me: The relation between the imposter phenomenon and depression. Social
Behavior and Personality, 36(1), 43-48.
McGregor, L. N., Gee, D. E., & Posey, K. E. (2008). I feel like a fraud and it depresses
me: The relation between the imposter phenomenon and depression. Social
Behavior and Personality: an international journal, 36(1), 43-48.
McHoskey, J. W. (1999). Machiavellianism, intrinsic versus extrinsic goals, and social
interest: A self-determination theory analysis. Motivation and Emotion, 23(4),
267-283.
McHoskey, J. W., Hicks, B., Betris, T., Szyarto, C., Worzel, W., Kelly, K., . . . Suggs,
T. (1999). Machiavellianism, Adjustment, And Ethics. Psychological reports,
85(1), 138-142.
Univers
ity of
Mala
ya
229
McIlwain, D. (2003). Bypassing empathy: A Machiavellian theory of mind and sneaky
power. New York, NY, US: Psychology Press.
Md Nordin, N., Abu Talib, M., & Yaacob, S. N. (2009). Personality, loneliness and
mental health among undergraduates at Malaysian Universities. European
journal of scientific research, 36(2), 285-298.
Mohammed, E.-n. F., Unher, M., & Sugawara, M. (2009). Big Five Personality Factors:
Cross Cultural Comparison between Japanese and Egyptian Students. The
Journal of Clinical Research Center for Child Development and Educational
Practices (8), 135-141, 2009
Mohd Sidik, S., Rampal, L., & Kaneson, N. (2003). Prevalence of emotional disorders
among medical students in a Malaysian university. Asia Pacific Family
Medicine, 2(4), 213-217.
Moosavi, S. J., Ghotnian, S., & Torabzadeh, L. (2012). Relationship between
personality traits and mental health with emotional intelligence of female
student athletes. Age, 57(23), 18-20.
Morse, J. M. (2000). Determining sample size. Qualitative health research, 10(1), 3-5.
Moshki, M., Atarodi, B. A., Moslem, A., & Taheri, M. (2012). Applying an
Educational-participatory Program based on the PRECEDE Model for
Promoting Self-esteem and Mental Health of Students in Iran. International
journal of preventive medicine, 3(4), 241.
Murray, H. A. (2007). Explorations in personality: Oxford University Press.
. NHMS. (2011) National Health and Morbidity Survey. Malaysia.
Nigro, G., & Galli, I. (1985). on the relationship between machiavellianism and anxiety
among italian undergraduates. Psychological reports, 56(1), 37-38.
Nordin, N., Talib, M., & Yaacob, S. N. (2009). Personality, loneliness and mental
health among undergraduates at Malaysian Universities. European journal of
scientific research, 36(2), 285-298.
Norris, M., & Lecavalier, L. (2010). Evaluating the use of exploratory factor analysis in
developmental disability psychological research. Journal of autism and
developmental disorders, 40(1), 8-20.
Univers
ity of
Mala
ya
230
O'Boyle, Ernest, Forsyth, Donelson, Banks, George, Michael. (2012). A meta-analysis
of the Dark Triad and work behavior: A social exchange perspective. Journal of
Applied Psychology, Vol 97(3), , 557-579.
Organization, W. H. (2010). Global tuberculosis control: WHO report 2010: World
Health Organization.
Ormel, J., Koeter, M., Brink, W., & Giel, R. (1989). Concurrent validity of GHQ-28
and PSE as measures of change. Psychological medicine, 19(04), 1007-1013.
Paterson, H., Reniers, R., & Völlm, B. (2009). Personality types and mental health
experiences of those who volunteer for helplines. British Journal of Guidance &
Counselling, 37(4), 459-471.
Paulhus, D. L., & Williams, K. M. (2002). The dark triad of personality: Narcissism,
Machiavellianism, and psychopathy. Journal of Research in Personality, 36(6),
556-563.
Philip A. Vernon a, Vanessa C. Villani a,, & Leanne C. Vickers a, J. A. H. (2007). A
behavioral genetic investigation of the Dark Triad and the Big 5. Personality
and Individual Differences, 44 (2008), 445–452.
Polit, D., Beck, T., & Owen, S. (2007). Focus on Research Methods Is the CVI an
Acceptable Indicator of Content Validity. Res Nurs Health, 30, 459-467.
Popkins, N. C. (1998). The five-factor model: Emergence of a taxonomic model for
personality psychology. Great Ideas in Personality, Northwestern University.
Powell, G. E. (1979). Brain and personality. Saxon House.
Punch, K. F., & Punch, K. (2009). Introduction to research methods in education. Sage
Publications Ltd.
Richards, C. S., & O'Hara, M. W. (2014). The Oxford handbook of depression and
comorbidity: Oxford University Press.
Richmond, K. A. (2001). Ethical reasoning, Machiavellian behavior, and gender: the
impact on accounting students’ ethical decision making. Citeseer.
Roccas, S., Sagiv, L., Schwartz, S. H., & Knafo, A. (2002). The big five personality
factors and personal values. Personality and social psychology bulletin, 28(6),
789-801.
Univers
ity of
Mala
ya

231
Ross, S. R., & Krukowski, R. A. (2003). The imposter phenomenon and maladaptive
personality: type and trait characteristics. Personality and Individual
Differences, 34(3), 477-484.
Ross, S. R., Stewart, J., Mugge, M., & Fultz, B. (2001). The imposter phenomenon,
achievement dispositions, and the five factor model. Personality and Individual
Differences, 31(8), 1347-1355.
Sabri, B. (2012). Severity of victimization and co-occurring mental health disorders
among substance using adolescents. Paper presented at the Child & youth care
forum.
Sakulku, J. (2011). The Impostor Phenomenon. International Journal of Behavioral
Science, 6(1).
Satcher, D. (2000). Report of the surgeon general’s conference on children’s mental
health: A national action agenda: Taylor & Francis.
Schreiber, J. B., Nora, A., Stage, F. K., Barlow, E. A., & King, J. (2006). Reporting
structural equation modeling and confirmatory factor analysis results: A review.
The Journal of educational research, 99(6), 323-338.
Seifert, K. (2011). Youth violence: Theory, prevention, and intervention: Springer
Publishing Company.
September, A. N., McCarrey, M., Baranowsky, A., Parent, C., & Schindler, D. (2001).
The relation between well-being, impostor feelings, and gender role orientation
among Canadian university students. The Journal of Social Psychology, 141(2),
218-232.
Shamsuddin, K., Fadzil, F., Ismail, W. S. W., Shah, S. A., Omar, K., Muhammad, N.
A., . . . Mahadevan, R. (2013). Correlates of depression, anxiety and stress
among Malaysian university students. Asian journal of psychiatry, 6(4), 318-
323.
Sherina, M. (2004). Psychological stress among undergraduate medical students.
Medical Journal of Malaysia, 59(2), 207-211.
Sherry, S. B., Hewitt, P. L., Besser, A., Flett, G. L., & Klein, C. (2006).
Machiavellianism, trait perfectionism, and perfectionistic self-presentation.
Personality and Individual Differences, 40(4), 829-839.
Univers
ity of
Mala
ya
232
Shirazi, M., Khan, M. A., & Ansari, M. F. A. (2012). Mental health in relation to
personality characteristics among professional and non-professional students.
Researchers World: Journal of Arts, Science & Commerce, 3(1), 8-15.
Siu, A. M., & Shek, D. T. (2010). Social problem solving as a predictor of well-being in
adolescents and young adults. Social Indicators Research, 95(3), 393-406.
Skalski, A. K., & Smith, M. J. (2006). Responding to the mental health needs of
students. Principal Leadership, 7(1), 12-15.
Skinner, N. F. (1982). Personality correlates of Machiavellianism: IV.
Machiavellianism and psychopathology. Social Behavior and Personality: an
international journal, 10(2), 201-203.
Smillie, L. D., Bhairo, Y., Gray, J., Gunasinghe, C., Elkin, A., McGuffin, P., & Farmer,
A. (2009). Personality and the bipolar spectrum: normative and classification
data for the Eysenck Personality Questionnaire–Revised. Comprehensive
psychiatry, 50(1), 48-53.
Song, Y., Huang, Y., Liu, D., Kwan, J. S., Zhang, F., Sham, P. C., & Tang, S. W.
(2008). Depression in college: depressive symptoms and personality factors in
Beijing and Hong Kong college freshmen. Comprehensive psychiatry, 49(5),
496-502.
Sonnak, C., & Towell, T. (2001). The impostor phenomenon in British university
students: Relationships between self-esteem, mental health, parental rearing
style and socioeconomic status. Personality and Individual Differences, 31(6),
863-874.
Srivastava, S., John, O. P., Gosling, S. D., & Potter, J. (2003). Development of
personality in early and middle adulthood: set like plaster or persistent change?
Journal of Personality and Social Psychology, 84(5), 1041.
Statistics, G. B. O. f. N. (2004). Living in Britain: results from the 2002 general
household survey (Vol. 31): The Stationery Office.
Steel, P., Schmidt, J., & Shultz, J. (2008). Refining the relationship between personality
and subjective well-being. Psychological bulletin, 134(1), 138.
Stewart, M. E., Ebmeier, K. P., & Deary, I. J. (2005). Personality correlates of
happiness and sadness: EPQ-R and TPQ compared. Personality and Individual
Differences, 38(5), 1085-1096.
Univers
ity of
Mala
ya
233
Strelau, J. (1983). Temperament personality activity. Academic Press.
Tabachnick, B. G., & Fidell, L. S. (2001). Using multivariate statistics.
Tomarken, A. J., & Waller, N. G. (2005). Structural equation modeling: Strengths,
limitations, and misconceptions. Annu. Rev. Clin. Psychol., 1, 31-65.
Tosevski, D. L., Milovancevic, M. P., & Gajic, S. D. (2010). Personality and
psychopathology of university students. Curr Opin Psychiatry, 23(1), 48-52.
Touhey, J. C. (1973). Intelligence, Machiavellianism and social mobility. British
Journal of Social and Clinical Psychology, 12(1), 34-37.
Tse, W. S., Rochelle, T. L., & Cheung, J. C. (2011). The relationship between
personality, social functioning, and depression: A structural equation modeling
analysis. International Journal of Psychology, 46(3), 234-240.
Ullman, J. B., & Bentler, P. M. (2003). Structural equation modeling. Wiley Online
Library.
Valentine, S., & Fleischman, G. (2003). The impact of self-esteem, Machiavellianism,
and social capital on attorneys' traditional gender outlook. Journal of Business
Ethics, 43(4), 323-335.
Vandenberg, R. J., & Lance, C. E. (2000). A review and synthesis of the measurement
invariance literature: Suggestions, practices, and recommendations for
organizational research. Organizational research methods, 3(1), 4-70.
Vecchione, M., Alessandri, G., Barbaranelli, C., & Caprara, G. (2012). Gender
differences in the Big Five personality development: A longitudinal
investigation from late adolescence to emerging adulthood. Personality and
Individual Differences, 53(6), 740-746.
Vianello, M., Schnabel, K., Sriram, N., & Nosek, B. (2013). Gender differences in
implicit and explicit personality traits. Personality and Individual Differences,
55(8), 994-999.
Wang, W., & Miao, D. (2009). The relationships among coping styles, personality traits
and mental health of chinese medical students. Social Behavior and Personality,
37(2), 163-172.
Univers
ity of
Mala
ya

234
Wastell, C., & Booth, A. (2003). Machiavellianism: An alexithymic perspective.
Journal of Social and Clinical Psychology, 22(6), 730-744.
Werneke, U., Goldberg, D. P., Yalcin, I., & Üstün, B. (2000). The stability of the factor
structure of the General Health Questionnaire. Psychological medicine, 30(04),
823-829.
Whitcomb, S., & Merrell, K. W. (2013). Behavioral, social, and emotional assessment
of children and adolescents. Routledge.
Whitlock, J., Eckenrode, J., & Silverman, D. (2006). Self-injurious behaviors in a
college population. Pediatrics, 117(6), 1939-1948.
Widiger, T. A., & Anderson, K. G. (2003). Personality and depression in women.
Journal of affective disorders, 74(1), 59-66.
Wilson, D. S., Near, D., & Miller, R. R. (1996). Machiavellianism: a synthesis of the
evolutionary and psychological literatures. Psychological bulletin, 119(2), 285.
Yang, P. (2005). Personality and mental health characteristics of junior medics. Chinese
Journal of Clinical Rehabilitation, 9(8), 234-235.
Yusoff, M. S. B., Rahim, A. F. A., & Yaacob, M. J. (2010). Prevalence and sources of
stress among Universiti Sains Malaysia medical students. The Malaysian journal
of medical sciences: MJMS, 17(1), 30.
Zaid, Z., Chan, S., & Ho, J. (2007). Emotional disorders among medical students in a
Malaysian private medical school. Singapore medical journal, 48(10), 895.
Zuckerman, M. (2005). Psychobiology of personality. Cambridge University Press.
Univers
ity of
Mala
ya