Personal Exposures to Inorganic and Organic Dust in Manual Harvest of California Citrus and Table...
10
Journal of Occupational and Environmental Hygiene, 1: 505–514 ISSN: 1545-9624 print / 1545-9632 online DOI: 10.1080/15459620490471616 Personal Exposures to Inorganic and Organic Dust in Manual Harvest of California Citrus and Table Grapes Kiyoung Lee, 1,2 Robert J. Lawson, 2 Stephen A. Olenchock, 3 Val Vallyathan, 3 Randal J. Southard, 4 Peter S. Thorne, 5 Cathy Saiki, 1,2 and Marc B. Schenker 1,2 1 Department of Epidemiology and Preventive Medicine, University of California, Davis, Calif. 2 Western Center for Agricultural Health and Safety, University of California, Davis, Calif. 3 National Institute for Occupational Safety and Health, Morgantown, W. Va. 4 Department of Land, Air and Water Resources, University of California, Davis, Calif. 5 Department of Occupational and Environmental Health, University of Iowa, Iowa City, Iowa The aim of this study was to determine characteristics of personal exposure to inorganic and organic dust during man- ual harvest operations of California citrus and table grapes. Personal exposures to inhalable dust and respirable dust were measured five times over a 4-month period of harvesting sea- son. We analyzed components of the dust samples for miner- alogy, respirable quartz, endotoxin, and total and culturable microorganisms. Workers manually harvesting were exposed to a complex mixture of inorganic and organic dust. Exposures for citrus harvest had geometric means of 39.7 mg/m 3 for inhalable dust and 1.14 mg/m 3 for respirable dust. These exposures were significantly higher than those for table grape opera- tions and exceeded the threshold limit value for inhalable dust and respirable quartz. Exposures for table grape operations were lower than the threshold limit value, except inhalable dust exposure during leaf pulling. Considered independently, exposures to inhalable dust and respirable quartz in citrus harvest may be high enough to cause respiratory health ef- fects. The degree of vigorous contact with foliage appeared to be a significant determining factor of exposures in manual harvesting. Keywords agricultural dust, bioaerosols, endotoxin, harvest, inor- ganic dust Address correspondence to: Kiyoung Lee, Epidemiology and Pre- ventive Medicine, University of California, One Shields Avenue, Davis, CA 95616; e-mail: [email protected]. INTRODUCTION E pidemiologic studies provide clear evidence of increased incidence and prevalence of respiratory symptoms and disease in agricultural populations. (1) The increase in respira- tory disease morbidity and mortality in agricultural workers is of particular concern because cigarette smoking prevalence is lower among farming than nonfarming populations. (2,3) Stud- ies of agricultural workers in numerous specific commodities (e.g., swine, grain, dairy, poultry, and grapes) have similarly shown increased respiratory disease prevalence or incidence attributable to workplace dust exposure. (1) We have previously reported a reduced vital capacity among grape workers, con- sistent with restrictive pulmonary function from mixed-dust exposure in agricultural worker population. (4) The study sug- gested that inorganic dust exposures to grape workers caused the respiratory effects, but no measurements of dust were made. Agricultural workers are exposed to multiple pollutants, and the exposure levels can exceed exposure standards. (1) The agricultural workplace is a source of occupational exposure of farmers and farm workers to mixed dust. These components include inorganic dust, pesticides, organic dust, disinfectants, fertilizers, feed additives, and combustion products. (1) Organic dust includes pollen, grain dust, bits of plant debris, animal manure and animal bedding, and bioaerosols of microorgan- isms such as bacteria and fungi. Exposure levels vary greatly depending on crop, climate, and the specific activity. One of the dustiest conditions occurs during soil preparation for field crops. The dry climate in much of California aggravates dust emission. Various operations generate a wide range of respirable dust concentrations in the dust plume, ranging be- tween 0.33 mg/m 3 from disking corn stubble to 10.3 mg/m 3 from ripping soil. (6) Harvest is another major activity for farmers and agricul- tural workers. Mechanical harvesting of certain crops may result in substantial dust production. Mechanical harvest of almonds generated 26,513 mg/m 3 of inhalable dust and 154 mg/m 3 of respirable dust when dust levels were measured in the dust plume. (7) Personal exposure in mechanical harvest- ing of tree crops averaged 52.7 mg/m 3 of inhalable dust and Journal of Occupational and Environmental Hygiene August 2004 505
-
Upload
independent -
Category
Documents
-
view
0 -
download
0
Transcript of Personal Exposures to Inorganic and Organic Dust in Manual Harvest of California Citrus and Table...
Journal of Occupational and Environmental Hygiene, 1: 505–514ISSN: 1545-9624 print / 1545-9632 onlineDOI: 10.1080/15459620490471616
Personal Exposures to Inorganic and Organic Dustin Manual Harvest of California Citrus and Table Grapes
Kiyoung Lee,1,2 Robert J. Lawson,2 Stephen A. Olenchock,3
Val Vallyathan,3 Randal J. Southard,4 Peter S. Thorne,5 Cathy Saiki,1,2
and Marc B. Schenker1,2
1Department of Epidemiology and Preventive Medicine, University of California, Davis, Calif.2Western Center for Agricultural Health and Safety, University of California, Davis, Calif.3National Institute for Occupational Safety and Health, Morgantown, W. Va.4Department of Land, Air and Water Resources, University of California, Davis, Calif.5Department of Occupational and Environmental Health, University of Iowa, Iowa City, Iowa
The aim of this study was to determine characteristics ofpersonal exposure to inorganic and organic dust during man-ual harvest operations of California citrus and table grapes.Personal exposures to inhalable dust and respirable dust weremeasured five times over a 4-month period of harvesting sea-son. We analyzed components of the dust samples for miner-alogy, respirable quartz, endotoxin, and total and culturablemicroorganisms. Workers manually harvesting were exposed toa complex mixture of inorganic and organic dust. Exposures forcitrus harvest had geometric means of 39.7 mg/m3 for inhalabledust and 1.14 mg/m3 for respirable dust. These exposureswere significantly higher than those for table grape opera-tions and exceeded the threshold limit value for inhalable dustand respirable quartz. Exposures for table grape operationswere lower than the threshold limit value, except inhalabledust exposure during leaf pulling. Considered independently,exposures to inhalable dust and respirable quartz in citrusharvest may be high enough to cause respiratory health ef-fects. The degree of vigorous contact with foliage appearedto be a significant determining factor of exposures in manualharvesting.
Keywords agricultural dust, bioaerosols, endotoxin, harvest, inor-ganic dust
Address correspondence to: Kiyoung Lee, Epidemiology and Pre-ventive Medicine, University of California, One Shields Avenue,Davis, CA 95616; e-mail: [email protected].
INTRODUCTION
E pidemiologic studies provide clear evidence of increasedincidence and prevalence of respiratory symptoms and
disease in agricultural populations.(1) The increase in respira-tory disease morbidity and mortality in agricultural workers is
of particular concern because cigarette smoking prevalence islower among farming than nonfarming populations.(2,3) Stud-ies of agricultural workers in numerous specific commodities(e.g., swine, grain, dairy, poultry, and grapes) have similarlyshown increased respiratory disease prevalence or incidenceattributable to workplace dust exposure.(1) We have previouslyreported a reduced vital capacity among grape workers, con-sistent with restrictive pulmonary function from mixed-dustexposure in agricultural worker population.(4) The study sug-gested that inorganic dust exposures to grape workers causedthe respiratory effects, but no measurements of dust were made.
Agricultural workers are exposed to multiple pollutants,and the exposure levels can exceed exposure standards.(1) Theagricultural workplace is a source of occupational exposure offarmers and farm workers to mixed dust. These componentsinclude inorganic dust, pesticides, organic dust, disinfectants,fertilizers, feed additives, and combustion products.(1) Organicdust includes pollen, grain dust, bits of plant debris, animalmanure and animal bedding, and bioaerosols of microorgan-isms such as bacteria and fungi. Exposure levels vary greatlydepending on crop, climate, and the specific activity. Oneof the dustiest conditions occurs during soil preparation forfield crops. The dry climate in much of California aggravatesdust emission. Various operations generate a wide range ofrespirable dust concentrations in the dust plume, ranging be-tween 0.33 mg/m3 from disking corn stubble to 10.3 mg/m3
from ripping soil.(6)
Harvest is another major activity for farmers and agricul-tural workers. Mechanical harvesting of certain crops mayresult in substantial dust production. Mechanical harvest ofalmonds generated 26,513 mg/m3 of inhalable dust and154 mg/m3 of respirable dust when dust levels were measuredin the dust plume.(7) Personal exposure in mechanical harvest-ing of tree crops averaged 52.7 mg/m3of inhalable dust and
Journal of Occupational and Environmental Hygiene August 2004 505
4.5 mg/m3 of respirable dust.(8) High levels of exposure werealso observed in mechanical harvesting of other crops, and theexposures were significantly lower in enclosed-cab tractors.
Although total emission amounts are less and plume size issmaller from manual harvest than from mechanical harvest, thedistance between the dust source and the worker is also less.Agricultural workers can be exposed to a significant amount ofdust during manual harvest. Means of workers’ respirable dustexposure during manual harvest of tree crops and vegetableswere 1.82 and 0.73 mg/m3, respectively, and inhalable dust ex-posures were 1.91 and 2.61 mg/m3, respectively.(8) Respirabledust exposure in peach manual harvest was 0.5 mg/m3.(9)
Manual harvest was one of the major contributors to chronicrespirable dust exposure, but not to inhalable dust, when annualexposure of farmers was estimated by exposure during tasks,task duration, and task frequency.(10)
The purpose of this study was to examine inorganic andorganic fractions of dust to which farm workers were exposedin the production of summer citrus and table grapes in the SanJoaquin Valley of California. We characterized the inorganicfraction of the dust from personal exposure samples, dust dis-lodged from foliar surfaces, and samples taken directly fromthe soil. We also evaluated organic dust exposures includingendotoxin, bacteria and fungi.
METHODS
Experimental DesignPersonal exposure samples were collected and analyzed
from two groups of agricultural field workers in the San JoaquinValley of California. The first group was involved in citrus har-vest in Tulare County. The second group was involved in tablegrape operations in Kern County. Airborne dust exposures weremeasured for a total of 5 working days for each crop over thepeak labor months of June through September 1992. Samplingdates were approximately 1 month apart, except in September,when 2 consecutive days were monitored for each crop. Taskswere selected to be representative of those performed by laborcrews throughout the summer months. For citrus, harvestingwas the task measured for all five sampling visits. For tablegrapes, the task on the first sampling visit was leaf pulling;harvesting table grapes was conducted for the remaining foursampling visits. For both crops, 14 workers were monitoredduring each visit. Ten workers were fitted with respirable dustsamplers to measure respirable dust and respirable quartz expo-sures. Four workers were fitted with inhalable dust samplers tomeasure inhalable dust, endotoxin, and total bacteria and fungiexposures.
Selection of Farm Locationsand Worker Participants
A fruit packing company in Tulare County provided accessto all the citrus harvest sites. A producer of table grapes inKern County provided access to all the sites visited for tablegrape production. Tulare and Kern counties were chosen be-
cause they are very significant producers of citrus and tablegrapes, and because they were the main field locations in aprevious epidemiologic study that had found reduced forcedvital capacity in grape harvest workers.(4) From each farmlocation, and on each sampling date, a convenience sampleof individual farm workers was used, based on the willingnessof individuals to participate. No attempt was made to followthe same individuals throughout the study.
Collection of SamplesWe collected inhalable dust, endotoxin, and total bacteria
and fungi samples with an open face polystyrene cassette of37 mm diameter with a 0.4 µm pore size polycarbonate filter,and a pump flow rate of 2.0 L/min. The samples were collectedin the breathing zone. Sampling times for endotoxin, totalbacteria and fungi, and inhalable dust were regulated with thegoal of collecting approximately 1 mg of total mass. On thefirst sampling day, eight of nine inhalable samples exceeded atotal mass of 2 mg. The concentrations for that day are probablyconservative because some of the sampled material may havenot adhered to the filters. Except on the first sampling day,samples were less than 2 mg of total mass. About half of thesamples had less than 1 mg of total mass. For citrus harvest atypical sample time was 15 min. For table grape operationsa typical sample time was 1 hour. For respirable dust andrespirable quartz samples, a 10-mm nylon cyclone was usedwith a 5 µm pore size PVC filter, and a pump flow rate of1.7 L/min. Respirable fraction samples were typically collectedfor 6 to 8 hours.
A two-stage Andersen sampler (Graseby Andersen, Atlanta,Ga.) was used to collect culturable airborne bioaerosol sampleswithin 2 feet of employees. Fungal samples were collected onSabouraud media. Bacterial samples were collected on trypti-case soy agar with 5% sheep’s blood (TSA II). Sampling timesaveraged 30 sec. One sample and one duplicate (consistingof two plates each) were collected daily for bacteria and forfungi. Field blanks were generated daily, and one laboratoryblank was generated per medium batch.
We collected dust from leaf surfaces by agitating the foliagein front of a canopy connected to a high-volume pump (GastModel 1532, SKC, Fullerton, Calif.). This approach was usedto provide sufficient dust samples for chemical characterizationof the bulk dust. The pump was operated at 30 L/min and wasfitted with a 20 cm × 25 cm polycarbonate filter with 0.4 µmpore size. All dust shaken off the leaves was collected on thefilter. Sampling time was approximately 90 min per sample,with two samples collected from each farm.
Four surface soil samples were collected daily. Two sampleseach were collected from under plants and from rows betweenplants. Sample locations were selected to represent the limitsof the area worked by employees on that day. For example,samples would be collected from the northeast corner andthe southwest corner of the section of orchard or vineyardbeing harvested. Samples were collected with a stainless steeltrowel from approximately 0–3 inches below the soil surfaceand placed in plastic bags.
506 Journal of Occupational and Environmental Hygiene August 2004
Analysis of SamplesInhalable Dust, Respirable Dust, and Respirable Quartz
The filters were pre- and postweighed, controlling for mois-ture effects, to determine sample weight and dust concentra-tion. Quantitative analyses of respirable quartz were performedusing powder X-ray diffraction. Filters for respirable dust wereashed in a muffle furnace, and the residue from the filter wastransferred to a 25 mm diameter silver membrane filter. Thesilver membrane was step-scanned from about 26 to 27 degrees2 theta (quartz diffraction maximum) using a Diano XRD-8000(Waburn, Mass.). The diffraction peak area for each samplewas compared with the quartz peak area from a set of preparedstandards (20 to 200 µg quartz per filter) to determine the massof quartz and the corresponding percentage in the original dust(Method 7500).(11)
Dust from Foliage and SoilTwo samples each of the citrus dust and the grape dust
were analyzed for total sulfur content by inductively coupledplasma spectrometry (Perkin Elmer Optima 3000 DV ICP,Perkin Elmer, Shelton, Conn.). The mineral composition of thefoliar total dusts was determined by X-ray diffraction (SiemensD5000 X-Ray Diffractometer, Bruker AXS, Madison, Wis.)after the dusts were ashed in a muffle furnace and transferred tosilver membranes. Total foliar dust samples were dry-sieved toobtain a <10 µm diameter size fraction for particle componentanalysis.
For particle component analysis, an aliquot of the samplewas ashed in a Denton PE-120 Plasma Asher (Cherry Hill,N.J.) for 24 hours to remove all organic matter, and the residuewas made up to 100 mL with double distilled water with adrop of Aerosol OT. After sonication, aliquots were filteredthrough 0.1 µm pore size polycarbonate filters and mountedon carbon planchettes. Using a scanning electron microscopein back-scattered electronic-imaging mode an average of 1000or more particles in each sample were randomly analyzed forelemental analysis using an energy dispersive X-ray analyzer(Kevex 7000 EDXA System, Kevex International, Foster City,Calif.) at 1000× according to the methods described by Stettleret al.(12)
Soil particle size-distribution (% sand, silt, and clay) of Na-dispersed samples was determined by the standard pipette andsieving method.(13)
Airborne EndotoxinFilters with collected dusts were analyzed for endotoxin
content by means of the kinetic chromogenic modificationof the Limulus amebocyte lysate assay (Kinetic-QCL;BioWhittaker, Walkersville, Md.) as previously described.(14)
Sterile nonpyrogenic plasticware was used throughout the anal-yses. Each filter was extracted separately in 10 mL of sterilenonpyrogenic water (LAL Reagent Water; BioWhittaker) byrocking at room temperature for 60 min. The extracts weredecanted into separate plastic tubes, centrifuged for 10 min at1000 × g, and the resulting supernatant fluids were assayedin duplicate for the presence of endotoxin. The results are
reported in terms of endotoxin units (EU) per milligram ofdust, and calculations were made to express the airborne levelsin terms of EU per cubic meter of air.
Airborne Total Bacteria and FungiTotal culturable and nonculturable bacteria and fungi were
quantified using the fluorescence microscopy NFE method.(15)
For each filter collected for total fungi and bacteria, the col-lected microorganisms were extracted by washing three timeswith a filter sterilized aqueous solution of 0.01% Tween 80 and1% formaldehyde. For each washing, 1.5 mL of wash solutionwas injected into the support pad through the outlet connec-tion of the cassette, after which the connection was plugged.Five mL of the wash solution was pipetted into the inlet hold,after which the cassette was replugged and vigorously shakenon a shaking table for 5 min. The cassette was then openedand the suspension removed with a syringe. The three washsuspensions were pooled, and serial dilutions of this solutionwere filtered through black polycarbonate filters. The filterand the adhered microorganisms were stained for 2 min usinga filtered acridine orange solution (0.1 mg/mL, pH = 7.2 inphosphate buffer).
The filters were removed, dried in a laminar flow hood,and mounted on a microscope slide with Cargile A immersionoil and a cover-slip. The number of microorganisms on thefilter surface was counted at a magnification of 1000× with anepifluorescence microscope. Spores and bacteria were counteduntil all organisms in 40 high-power fields had been evaluated.
Airborne Culturable Bacteria and FungiThe collected culture plates were incubated at 30◦C and
25◦C for bacterial plates and fungal plates, respectively.Colonies were counted using a colony counter. Results wereexpressed as colony forming units and were adjusted for coin-cident collection.
RESULTS
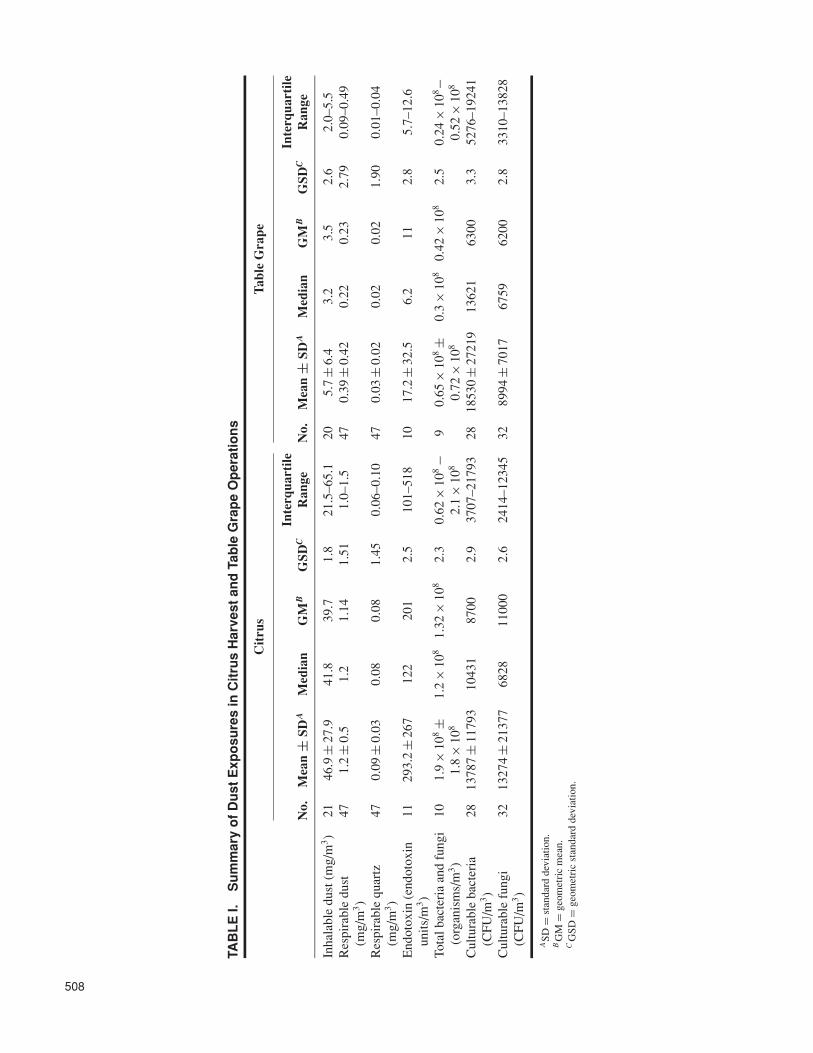
I norganic and organic dust exposures were obtained for bothcitrus harvest and table grape operations (see Table I). In-
halable dust exposures in citrus harvest had a geometric meanof 39.7 mg/m3, whereas inhalable dust exposure in table grapeoperations had a geometric mean of 3.5 mg/m3. Table II showsinhalable dust exposures for citrus harvest and table grapeharvest. The inhalable dust exposures in citrus harvest appearedto increase through the season. Exposures for table grape op-erations on June 17 were higher than the other days, despitepotential loss due to overloading. Exposure on that day wasmeasured during leaf pulling, which causes significant contactbetween the workers and foliage.
Geometric means of respirable dust exposures were1.14 mg/m3 for citrus harvest and 0.23 mg/m3 for table grapeoperation (Table III). Geometric means of respirable quartzexposures were 0.08 mg/m3 for citrus harvest and 0.02 mg/m3
for table grape operations. The proportion of respirable quartzto respirable dust was similar in both crops. The percentage of
Journal of Occupational and Environmental Hygiene August 2004 507
TAB
LE
I.S
um
mar
yo
fD
ust
Exp
osu
res
inC
itru
sH
arve
stan
dTa
ble
Gra
pe
Op
erat
ion
s
Cit
rus
Tabl
eG
rape
Inte
rqua
rtile
Inte
rqua
rtile
No.
Mea
n±
SDA
Med
ian
GM
BG
SDC
Ran
geN
o.M
ean
±SD
AM
edia
nG
MB
GSD
CR
ange
Inha
labl
edu
st(m
g/m
3)
2146
.9±
27.9
41.8
39.7
1.8
21.5
–65.
120
5.7
±6.
43.
23.
52.
62.
0–5.
5R
espi
rabl
edu
st(m
g/m
3)
471.
2±
0.5
1.2
1.14
1.51
1.0–
1.5
470.
39±
0.42
0.22
0.23
2.79
0.09
–0.4
9
Res
pira
ble
quar
tz(m
g/m
3)
470.
09±
0.03
0.08
0.08
1.45
0.06
–0.1
047
0.03
±0.
020.
020.
021.
900.
01–0
.04
End
otox
in(e
ndot
oxin
units
/m3)
1129
3.2
±26
712
220
12.
510
1–51
810
17.2
±32
.56.
211
2.8
5.7–
12.6
Tota
lbac
teri
aan
dfu
ngi
101.
9×
108±
1.2
×10
81.
32×
108
2.3
0.62
×10
8−
90.
65×
108±
0.3
×10
80.
42×
108
2.5
0.24
×10
8−
(org
anis
ms/
m3)
1.8
×10
82.
1×
108
0.72
×10
80.
52×
108
Cul
tura
ble
bact
eria
(CFU
/m3)
2813
787
±11
793
1043
187
002.
937
07–2
1793
2818
530
±27
219
1362
163
003.
352
76–1
9241
Cul
tura
ble
fung
i(C
FU/m
3)
3213
274
±21
377
6828
1100
02.
624
14–1
2345
3289
94±
7017
6759
6200
2.8
3310
–138
28
ASD
=st
anda
rdde
viat
ion.
BG
M=
geom
etri
cm
ean.
CG
SD=
geom
etri
cst
anda
rdde
viat
ion.
508
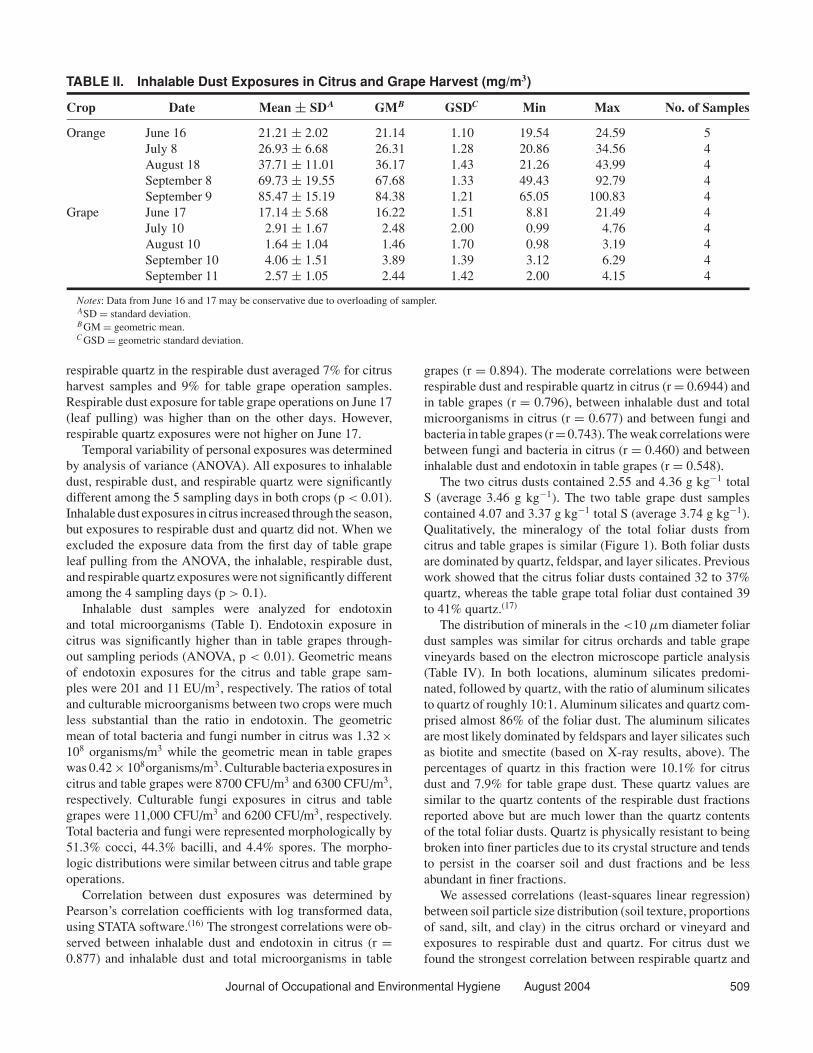
TABLE II. Inhalable Dust Exposures in Citrus and Grape Harvest (mg/m3)
Crop Date Mean ± SDA GMB GSDC Min Max No. of Samples
Orange June 16 21.21 ± 2.02 21.14 1.10 19.54 24.59 5July 8 26.93 ± 6.68 26.31 1.28 20.86 34.56 4August 18 37.71 ± 11.01 36.17 1.43 21.26 43.99 4September 8 69.73 ± 19.55 67.68 1.33 49.43 92.79 4September 9 85.47 ± 15.19 84.38 1.21 65.05 100.83 4
Grape June 17 17.14 ± 5.68 16.22 1.51 8.81 21.49 4July 10 2.91 ± 1.67 2.48 2.00 0.99 4.76 4August 10 1.64 ± 1.04 1.46 1.70 0.98 3.19 4September 10 4.06 ± 1.51 3.89 1.39 3.12 6.29 4September 11 2.57 ± 1.05 2.44 1.42 2.00 4.15 4
Notes: Data from June 16 and 17 may be conservative due to overloading of sampler.ASD = standard deviation.B GM = geometric mean.C GSD = geometric standard deviation.
respirable quartz in the respirable dust averaged 7% for citrusharvest samples and 9% for table grape operation samples.Respirable dust exposure for table grape operations on June 17(leaf pulling) was higher than on the other days. However,respirable quartz exposures were not higher on June 17.
Temporal variability of personal exposures was determinedby analysis of variance (ANOVA). All exposures to inhalabledust, respirable dust, and respirable quartz were significantlydifferent among the 5 sampling days in both crops (p < 0.01).Inhalable dust exposures in citrus increased through the season,but exposures to respirable dust and quartz did not. When weexcluded the exposure data from the first day of table grapeleaf pulling from the ANOVA, the inhalable, respirable dust,and respirable quartz exposures were not significantly differentamong the 4 sampling days (p > 0.1).
Inhalable dust samples were analyzed for endotoxinand total microorganisms (Table I). Endotoxin exposure incitrus was significantly higher than in table grapes through-out sampling periods (ANOVA, p < 0.01). Geometric meansof endotoxin exposures for the citrus and table grape sam-ples were 201 and 11 EU/m3, respectively. The ratios of totaland culturable microorganisms between two crops were muchless substantial than the ratio in endotoxin. The geometricmean of total bacteria and fungi number in citrus was 1.32 ×10⁸ organisms/m3 while the geometric mean in table grapeswas 0.42 × 10⁸organisms/m3. Culturable bacteria exposures incitrus and table grapes were 8700 CFU/m3 and 6300 CFU/m3,respectively. Culturable fungi exposures in citrus and tablegrapes were 11,000 CFU/m3 and 6200 CFU/m3, respectively.Total bacteria and fungi were represented morphologically by51.3% cocci, 44.3% bacilli, and 4.4% spores. The morpho-logic distributions were similar between citrus and table grapeoperations.
Correlation between dust exposures was determined byPearson’s correlation coefficients with log transformed data,using STATA software.(16) The strongest correlations were ob-served between inhalable dust and endotoxin in citrus (r =0.877) and inhalable dust and total microorganisms in table
grapes (r = 0.894). The moderate correlations were betweenrespirable dust and respirable quartz in citrus (r = 0.6944) andin table grapes (r = 0.796), between inhalable dust and totalmicroorganisms in citrus (r = 0.677) and between fungi andbacteria in table grapes (r = 0.743). The weak correlations werebetween fungi and bacteria in citrus (r = 0.460) and betweeninhalable dust and endotoxin in table grapes (r = 0.548).
The two citrus dusts contained 2.55 and 4.36 g kg−1 totalS (average 3.46 g kg−1). The two table grape dust samplescontained 4.07 and 3.37 g kg−1 total S (average 3.74 g kg−1).Qualitatively, the mineralogy of the total foliar dusts fromcitrus and table grapes is similar (Figure 1). Both foliar dustsare dominated by quartz, feldspar, and layer silicates. Previouswork showed that the citrus foliar dusts contained 32 to 37%quartz, whereas the table grape total foliar dust contained 39to 41% quartz.(17)
The distribution of minerals in the <10 µm diameter foliardust samples was similar for citrus orchards and table grapevineyards based on the electron microscope particle analysis(Table IV). In both locations, aluminum silicates predomi-nated, followed by quartz, with the ratio of aluminum silicatesto quartz of roughly 10:1. Aluminum silicates and quartz com-prised almost 86% of the foliar dust. The aluminum silicatesare most likely dominated by feldspars and layer silicates suchas biotite and smectite (based on X-ray results, above). Thepercentages of quartz in this fraction were 10.1% for citrusdust and 7.9% for table grape dust. These quartz values aresimilar to the quartz contents of the respirable dust fractionsreported above but are much lower than the quartz contentsof the total foliar dusts. Quartz is physically resistant to beingbroken into finer particles due to its crystal structure and tendsto persist in the coarser soil and dust fractions and be lessabundant in finer fractions.
We assessed correlations (least-squares linear regression)between soil particle size distribution (soil texture, proportionsof sand, silt, and clay) in the citrus orchard or vineyard andexposures to respirable dust and quartz. For citrus dust wefound the strongest correlation between respirable quartz and
Journal of Occupational and Environmental Hygiene August 2004 509

TAB
LE
III.
Res
pir
able
Du
stan
dQ
uar
tzE
xpo
sure
inC
itru
san
dTa
ble
Gra
pe
Har
vest
Res
pira
ble
Dus
t(m
g/m
3 )R
espi
rabl
eQ
uart
z(m
g/m
3 )
No.
ofN
o.of
Cro
pD
ate
Mea
n±
SDA
GM
BG
SDC
Min
Max
Sam
ples
Mea
n±
SDA
GM
BG
SDC
Min
Max
Sam
ples
Ora
nge
June
161.
04±
0.28
1.00
1.33
0.63
1.53
90.
068
±0.
020
0.06
51.
351
0.04
00.
100
9Ju
ly8
1.08
±0.
341.
021.
450.
441.
6110
0.06
6±
0.01
80.
064
1.33
40.
040
0.09
010
Aug
ust1
81.
62±
0.51
1.54
1.40
0.88
2.39
100.
118
±0.
038
0.11
21.
422
0.06
00.
180
10Se
ptem
ber
81.
04±
0.49
0.92
1.74
0.30
1.95
100.
089
±0.
035
0.08
31.
478
0.05
00.
160
10Se
ptem
ber
91.
35±
0.30
1.32
1.24
0.99
1.87
80.
088
±0.
017
0.08
61.
200
0.07
00.
120
8G
rape
June
171.
01±
0.29
0.97
1.39
0.49
1.36
100.
048
±0.
016
0.04
61.
416
0.03
00.
070
10Ju
ly10
0.12
±0.
100.
091.
980.
050.
3610
0.02
0±
0.00
60.
019
1.42
70.
010
0.03
06D
Aug
ust1
00.
35±
0.51
0.19
3.01
0.04
1.73
100.
026
±0.
023
0.02
02.
067
0.01
00.
080
8E
Sept
embe
r10
0.29
±0.
150.
261.
590.
150.
6010
0.02
4±
0.01
20.
022
1.71
90.
010
0.04
09F
Sept
embe
r11
0.16
±0.
080.
151.
640.
090.
2810
0.01
3±
0.00
50.
013
1.41
40.
010
0.02
09F
ASD
=st
anda
rdde
viat
ion.
BG
M=
geom
etri
cm
ean.
CG
SD=
geom
etri
cst
anda
rdde
viat
ion.
DFo
ursa
mpl
esw
ere
<L
OD
.E
Two
sam
ples
wer
e<
LO
D.
FO
nesa
mpl
ew
as<
LO
D.
510
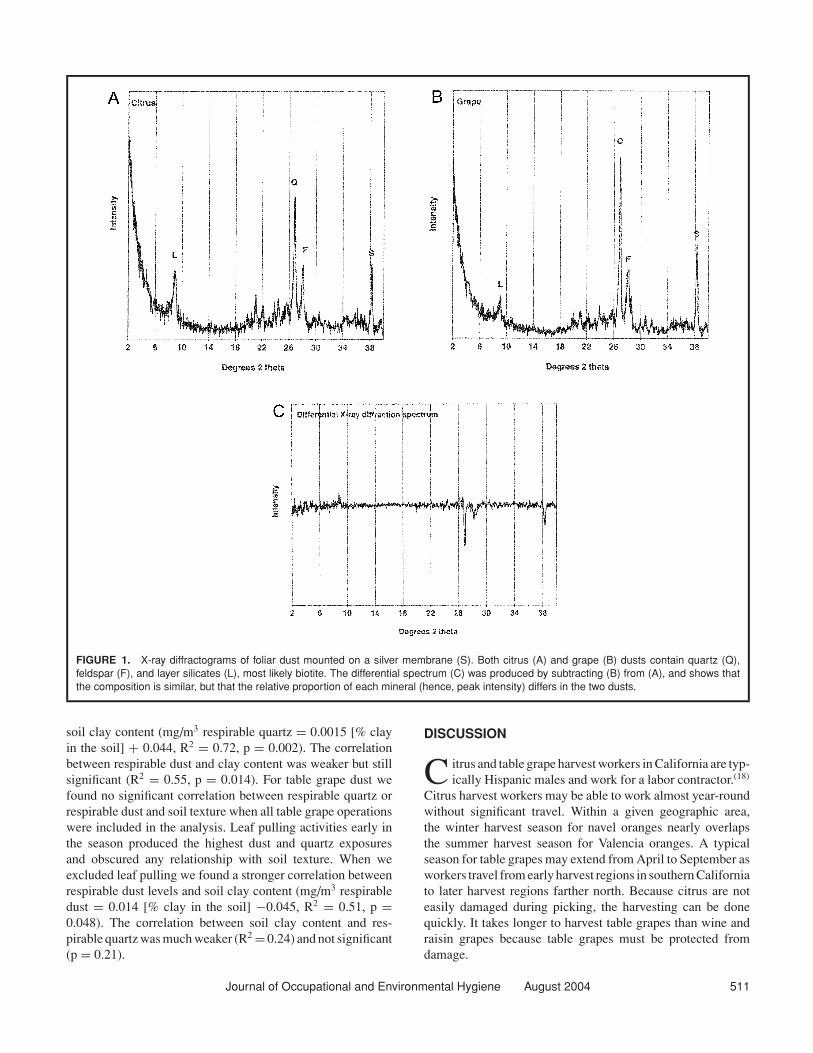
FIGURE 1. X-ray diffractograms of foliar dust mounted on a silver membrane (S). Both citrus (A) and grape (B) dusts contain quartz (Q),feldspar (F), and layer silicates (L), most likely biotite. The differential spectrum (C) was produced by subtracting (B) from (A), and shows thatthe composition is similar, but that the relative proportion of each mineral (hence, peak intensity) differs in the two dusts.
soil clay content (mg/m3 respirable quartz = 0.0015 [% clayin the soil] + 0.044, R2 = 0.72, p = 0.002). The correlationbetween respirable dust and clay content was weaker but stillsignificant (R2 = 0.55, p = 0.014). For table grape dust wefound no significant correlation between respirable quartz orrespirable dust and soil texture when all table grape operationswere included in the analysis. Leaf pulling activities early inthe season produced the highest dust and quartz exposuresand obscured any relationship with soil texture. When weexcluded leaf pulling we found a stronger correlation betweenrespirable dust levels and soil clay content (mg/m3 respirabledust = 0.014 [% clay in the soil] −0.045, R2 = 0.51, p =0.048). The correlation between soil clay content and res-pirable quartz was much weaker (R2 = 0.24) and not significant(p = 0.21).
DISCUSSION
C itrus and table grape harvest workers in California are typ-ically Hispanic males and work for a labor contractor.(18)
Citrus harvest workers may be able to work almost year-roundwithout significant travel. Within a given geographic area,the winter harvest season for navel oranges nearly overlapsthe summer harvest season for Valencia oranges. A typicalseason for table grapes may extend from April to September asworkers travel from early harvest regions in southern Californiato later harvest regions farther north. Because citrus are noteasily damaged during picking, the harvesting can be donequickly. It takes longer to harvest table grapes than wine andraisin grapes because table grapes must be protected fromdamage.
Journal of Occupational and Environmental Hygiene August 2004 511
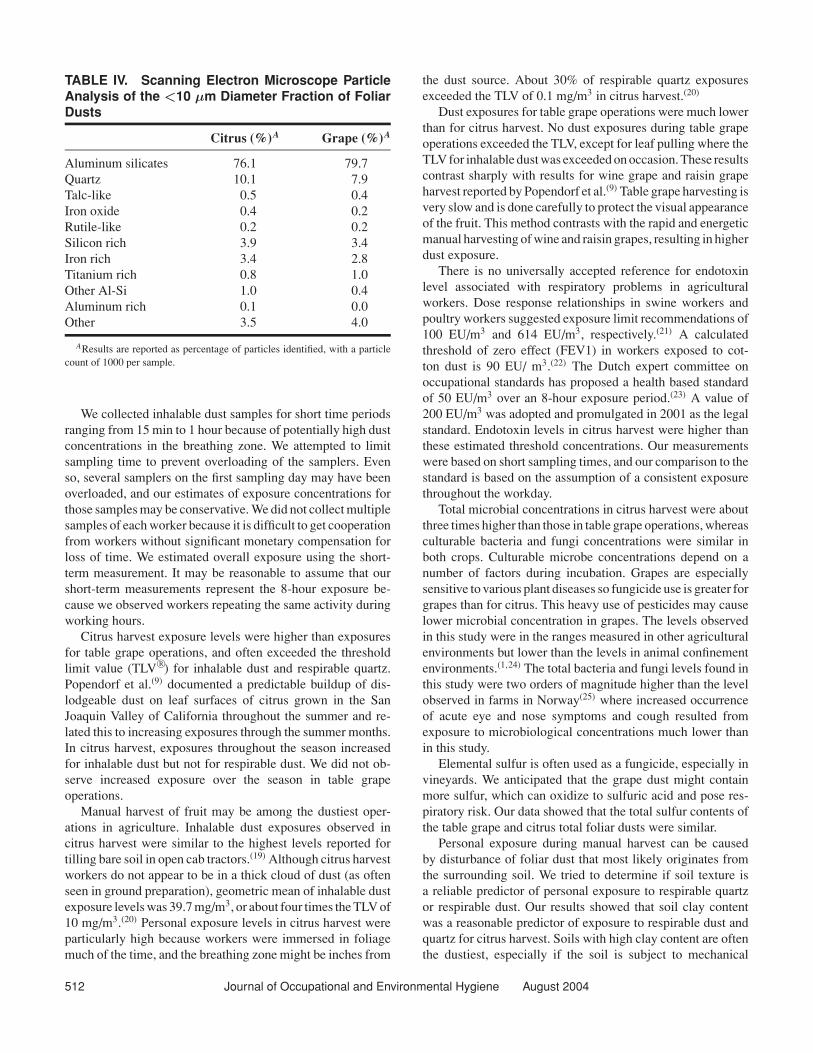
TABLE IV. Scanning Electron Microscope ParticleAnalysis of the <10 µm Diameter Fraction of FoliarDusts
Citrus (%)A Grape (%)A
Aluminum silicates 76.1 79.7Quartz 10.1 7.9Talc-like 0.5 0.4Iron oxide 0.4 0.2Rutile-like 0.2 0.2Silicon rich 3.9 3.4Iron rich 3.4 2.8Titanium rich 0.8 1.0Other Al-Si 1.0 0.4Aluminum rich 0.1 0.0Other 3.5 4.0
AResults are reported as percentage of particles identified, with a particlecount of 1000 per sample.
We collected inhalable dust samples for short time periodsranging from 15 min to 1 hour because of potentially high dustconcentrations in the breathing zone. We attempted to limitsampling time to prevent overloading of the samplers. Evenso, several samplers on the first sampling day may have beenoverloaded, and our estimates of exposure concentrations forthose samples may be conservative. We did not collect multiplesamples of each worker because it is difficult to get cooperationfrom workers without significant monetary compensation forloss of time. We estimated overall exposure using the short-term measurement. It may be reasonable to assume that ourshort-term measurements represent the 8-hour exposure be-cause we observed workers repeating the same activity duringworking hours.
Citrus harvest exposure levels were higher than exposuresfor table grape operations, and often exceeded the thresholdlimit value (TLV©R) for inhalable dust and respirable quartz.Popendorf et al.(9) documented a predictable buildup of dis-lodgeable dust on leaf surfaces of citrus grown in the SanJoaquin Valley of California throughout the summer and re-lated this to increasing exposures through the summer months.In citrus harvest, exposures throughout the season increasedfor inhalable dust but not for respirable dust. We did not ob-serve increased exposure over the season in table grapeoperations.
Manual harvest of fruit may be among the dustiest oper-ations in agriculture. Inhalable dust exposures observed incitrus harvest were similar to the highest levels reported fortilling bare soil in open cab tractors.(19) Although citrus harvestworkers do not appear to be in a thick cloud of dust (as oftenseen in ground preparation), geometric mean of inhalable dustexposure levels was 39.7 mg/m3, or about four times the TLV of10 mg/m3.(20) Personal exposure levels in citrus harvest wereparticularly high because workers were immersed in foliagemuch of the time, and the breathing zone might be inches from
the dust source. About 30% of respirable quartz exposuresexceeded the TLV of 0.1 mg/m3 in citrus harvest.(20)
Dust exposures for table grape operations were much lowerthan for citrus harvest. No dust exposures during table grapeoperations exceeded the TLV, except for leaf pulling where theTLV for inhalable dust was exceeded on occasion. These resultscontrast sharply with results for wine grape and raisin grapeharvest reported by Popendorf et al.(9) Table grape harvesting isvery slow and is done carefully to protect the visual appearanceof the fruit. This method contrasts with the rapid and energeticmanual harvesting of wine and raisin grapes, resulting in higherdust exposure.
There is no universally accepted reference for endotoxinlevel associated with respiratory problems in agriculturalworkers. Dose response relationships in swine workers andpoultry workers suggested exposure limit recommendations of100 EU/m3 and 614 EU/m3, respectively.(21) A calculatedthreshold of zero effect (FEV1) in workers exposed to cot-ton dust is 90 EU/ m3.(22) The Dutch expert committee onoccupational standards has proposed a health based standardof 50 EU/m3 over an 8-hour exposure period.(23) A value of200 EU/m3 was adopted and promulgated in 2001 as the legalstandard. Endotoxin levels in citrus harvest were higher thanthese estimated threshold concentrations. Our measurementswere based on short sampling times, and our comparison to thestandard is based on the assumption of a consistent exposurethroughout the workday.
Total microbial concentrations in citrus harvest were aboutthree times higher than those in table grape operations, whereasculturable bacteria and fungi concentrations were similar inboth crops. Culturable microbe concentrations depend on anumber of factors during incubation. Grapes are especiallysensitive to various plant diseases so fungicide use is greater forgrapes than for citrus. This heavy use of pesticides may causelower microbial concentration in grapes. The levels observedin this study were in the ranges measured in other agriculturalenvironments but lower than the levels in animal confinementenvironments.(1,24) The total bacteria and fungi levels found inthis study were two orders of magnitude higher than the levelobserved in farms in Norway(25) where increased occurrenceof acute eye and nose symptoms and cough resulted fromexposure to microbiological concentrations much lower thanin this study.
Elemental sulfur is often used as a fungicide, especially invineyards. We anticipated that the grape dust might containmore sulfur, which can oxidize to sulfuric acid and pose res-piratory risk. Our data showed that the total sulfur contents ofthe table grape and citrus total foliar dusts were similar.
Personal exposure during manual harvest can be causedby disturbance of foliar dust that most likely originates fromthe surrounding soil. We tried to determine if soil texture isa reliable predictor of personal exposure to respirable quartzor respirable dust. Our results showed that soil clay contentwas a reasonable predictor of exposure to respirable dust andquartz for citrus harvest. Soils with high clay content are oftenthe dustiest, especially if the soil is subject to mechanical
512 Journal of Occupational and Environmental Hygiene August 2004

disturbances by tractors and other mechanical tillage imple-ments. Soil surface disturbance within the orchard probablygenerates most of the dust, which may be of clay size (2 µmdiameter or smaller) and ultimately ends up on the foliage.Foliar dust may also originate from upwind sources and beunrelated to the soils within the orchards or vineyards. Thecorrelations between soil particle size distribution and res-pirable dust or quartz exposures for table grape operationswere weaker, probably because of low concentrations of dustproduced by the low energy contact with the foliage duringmanual harvest and the fairly narrow range of soil textures wesampled. To develop more significant relationships betweensoil properties and dust exposures for table grapes, a broaderarray of soil textures and grape harvest operations would haveto be investigated.
Predictive factors of high dust exposure in manual harvestpreviously identified include the crop being harvested, dustloading of leaf surfaces, and rainfall.(9) Our study suggeststhat the nature of the harvest tasks is also a critical factor,particularly the proximity to the foliage and the extent of vig-orous foliage disturbance during harvesting. Although manualharvesting of California fruit has the potential for very highexposure, the actual tasks involved must be analyzed when thepotential for exposure is evaluated. Results from table grapeharvest show that it is inaccurate to assume that all manualharvest operations in California result in high dust exposure.One likely factor related to elevated exposure is a high degreeof contact with vigorous foliage disturbance. These conditionsare common to citrus harvest but not to all table grape fieldoperations.
Dust exposures during manual harvesting were complexand varied by at least an order of magnitude. As in many otheragricultural settings, exposures included significant levels ofculturable and nonculturable bacteria as well as fungi andendotoxin. These organic components were only one elementof the exposure. Inorganic dust exposures were also very high,frequently exceeding the levels commonly associated with res-piratory problems in workers for inhalable dust and respirablequartz. An obvious limitation of this study was the lack ofpesticide analysis of the dust samples. It is possible that thevarious dusts contained different constituents and levels ofpesticides. Exposure during other operations could have beenan order of magnitude higher than the exposures in harvest, asshown in the high exposure in leaf pulling of table grapes. Thesheer magnitude and complexity of the observed exposuresprovides a challenge to our ability to predict possible healtheffects of the exposures.
CONCLUSION
W orkers performing manual harvesting of citrus and tablegrapes in California were exposed to a complex mixture
of inorganic and organic dusts. Exposures for citrus harvestwere high, particularly for inhalable dust and quartz, and ex-ceeded those for table grape operations by factors rangingfrom 2 to 20. We concluded that agricultural workers in man-
ual harvesting of some fruits in California could be exposedto inhalable dust and respirable quartz exceeding the TLV.Exposure levels to quartz and to endotoxin in citrus harvestwere high enough to raise concern about potential respiratoryhealth effects. The degree of vigorous contact with foliageappeared to be a significant determinant of exposure level.Soil clay content may have significant predictive value forrespirable dust exposure, especially in harvest activities thatinvolve significant contact with the foliage.
ACKNOWLEDGMENTS
W e appreciate Mark Nieuwenhuijsen’s assistance inmanuscript preparation and review, Laurel Beckett’s
statistical assistance, and Jeannine A. DeKoster’s evaluationof total bacteria and fungi.
Funding for this study was provided by the Western Centerfor Agricultural Health and Safety at UC Davis, funded bya grant from the National Institute for Occupational Safetyand Health, Cooperative Agreement # U07/CCU9061202; theCenter for Environmental Health Sciences, funded by a grantfrom the National Institute of Environmental Health Sciences,grant #P30ES05707; and Hatch Project CA-D*-LAW-4525-H, California Agricultural Experiment Station. Analyses per-formed at the University of Iowa were supported by the NIEHS-sponsored Environmental Health Science Research Center,grant # NIH/NIEHS P30ES05605.
REFERENCES
1. Schenker, M.: Respiratory health hazards in agriculture. Am. J. Respir.Crit. Care Med. 158:S1–S76 (1998).
2. Gillum, R.F.: Prevalence of cardiovascular and pulmonary diseases andrisk factors by region and urbanization in the United States. J. Natl. Med.Assoc. 86:105–112 (1994).
3. Stellman, S.D., P. Boffetta, and L. Garfinkel: Smoking habits of 800,000American men and women in relation to their occupations. Am. J. Ind.Med. 13:43–58 (1988).
4. Gamsky, T.E., S.A. McCurdy, S.J. Samuels, and M.B. Schenker:Reduced FVC among California grape workers. Am. Rev. Respir. Dis.145:257–262 (1992).
5. Schenker, M.B.: Exposures and health effects from inorganic agriculturaldusts. Environ. Health Perspect. 108 (Suppl. 4):661–664 (2000).
6. Clausnitzer H., and M. Singer: Respirable-dust production from agri-cultural operations in the Sacramento Valley, California. J. Environ. Qual.25:877–884 (1996).
7. Southard, R.J., R.J. Lawson, H.E. Studer, and M. Brown: Modifiedalmond harvester reduces orchard dust, California Agr. 51(5):10–13(1997).
8. Nieuwenhuijsen, M.J., N.S. Noderer, M.B. Schenker, V. Vallyathan,and S. Olenchock: Personal exposure to dust, endotoxin and crys-talline silica in California agriculture. Ann. Occup. Hyg. 43(1):35–42(1999).
9. Popendorf, W.J., A. Pryor, and H.R. Wenk: Mineral dust in manualharvest operations. Ann. Am. Conf. Gov. Ind. Hyg. 2:101–115. (1982).
10. Wu, J., M.J. Nieuwenhuijsen, S.J. Samuels, K. Lee, and M.B.Schenker: Identification of agricultural tasks important to cumulativeexposures to inhalable and respirable dust in California. Am. Ind. Hyg.Assoc. J. 64:830–836 (2003).
Journal of Occupational and Environmental Hygiene August 2004 513
11. National Institute for Occupational Safety and Health (NIOSH):Method 7500. In NIOSH Manual of Analytical Methods (NMAM©R), 4thed., P.C Schlecht and P.F. O’Connor (eds.) DHHS (NIOSH) Publicationno. 94-113. Cincinnati, Ohio: NIOSH, 1994.
12. Stettler, L.E., S.F. Platek, R.D. Riley, J.P. Mastin, and S.D. Simon:Lung particulate burdens of subjects from the Cincinnati, Ohio urbanarea. Scanning Microsc. 5:85–92 (1991).
13. U.S. Dept. of Agriculture, Soil Conservation Service: Soil Survey Lab-oratory Manual, Soil Survey Investigation Report, No. 42, Washington,D.C.: USDA, 1992.
14. Thorne, P.S.: Inhalation toxicology models of endotoxin- and bioaerosol-induced inflammation. Toxicology 152:13–23 (2000).
15. Thorne, P.S., M.S. Kiekhaefer, P. Whitten, and K.J. Donham: Com-parison of bioaerosol sampling methods in barns housing swine. Appl.Environ. Microbiol. 58:2543–2551 (1992).
16. StataCorp.: Stata Statistical Software, Release 7.0, 2001. College Station,Texas: Stata Corporation.
17. Rajini, P., J.A. Last, S.A. McCurdy, et al.: Lung injury and fibrogenicresponse to dusts from citrus and grape harvesters. Inhal. Toxicol. 7:363–376 (1995).
18. Villarejo, D., and S.L. Baron: The occupational health status of hiredfarm workers. Occup. Med. 14:613–635 (1999).
19. Louhelainen, K., J. Kangas, K. Husman, and E.O. Terho: Totalconcentrations of dust in the air during farm work. Eur. J. Respir. Dis.Suppl. 152:73–79 (1987).
20. American Conference of Governmental Industrial Hygienists(ACGIH
©R): ACGIH TLVs©R and BEIs©R: Threshold Limit Values for
Chemical Substances and Physical Agents; Biological Exposure Indices.Cincinnati, Ohio: ACGIH, 2002.
21. Donham, K.J., D. Cumro, S.J. Reynolds, and J.A. Merchant: Dose-response relationships between occupational aerosol exposures and cross-shift declines of lung function in poultry workers: Recommendations forexposure limits. J. Occup. Environ. Med. 42:260–269 (2000).
22. Castellan, R.M., S.A. Olenchock, K.B. Kinsley, and J.L. Hankinson:Inhaled endotoxin and decreased spirometric values: An exposure-response relation for cotton dust. N. Engl. J. Med. 317:605–610 (1987).
23. Heederik, D., and J. Douwes: Towards an occupational exposure limitfor endotoxins? Ann. Agric. Environ. Med. 4:17–19 (1997).
24. Kullman, G.J., P.S. Thorne, P.F. Waldron, et al.: Organic dust exposuresfrom work in dairy barns. Am. Ind. Hyg. Assoc. J. 59:403–413 (1998).
25. Eduard, W., J. Douwes, R. Mehl, D. Heederik, and E. Melbostad: Shortterm exposure to airborne microbial agents during farm work: Exposure-response relations with eye and respiratory symptoms. Occup. Environ.Med. 58(2):113–118 (2001).
514 Journal of Occupational and Environmental Hygiene August 2004