Nanotechnology Research and Innovation in Russia: A Bibliometric Analysis
Upload
khangminh22Category
view
4download
0
University of Nebraska - LincolnDigitalCommons@University of Nebraska - Lincoln
Library Philosophy and Practice (e-journal) Libraries at University of Nebraska-Lincoln
April 2016
Periodical Literature Bibliometric Analysis: A casestudy of four International JournalsBIPIN BIHARI SETHISambalpur University,ODISHA,INDIA, [email protected]
Follow this and additional works at: http://digitalcommons.unl.edu/libphilprac
Part of the Library and Information Science Commons
SETHI, BIPIN BIHARI, "Periodical Literature Bibliometric Analysis: A case study of four International Journals" (2016). LibraryPhilosophy and Practice (e-journal). 1353.http://digitalcommons.unl.edu/libphilprac/1353
brought to you by COREView metadata, citation and similar papers at core.ac.uk
provided by DigitalCommons@University of Nebraska
Periodical Literature Bibliometric Analysis: A case study of
four International Journals
Bipin Bihari Sethi
Sambalpur University, Odisha, India
Dr. Bulu Maharana
Sambalpur University, Odisha, India
Barada Kanta Mohanty
Librarian, KIIMS, Cuttack, Odisha, India
∗ Corresponding author. 917377136122 (M) ;. E-mail address: [email protected] (B. B.Sethi).
Abstract
Bibliometrics is most popular among the scholars, researchers and academics in the faculty of
Library and Information Science research. The current study is a bibliometrics analysis of four
international journals such as: 1st “Language Sciences” (LS) and 2nd “Linguistics and Education”
(L&E), 3rd ‘Political Geography’ (PG), and 4th ‘Religion’ (Rgn).The present paper attempts to
evaluate the publications indexed under the database of Science Direct Top 25 hottest Papers
journal literature to understand the global approach of research output in four core journals.
This is a comprehensive survey work rendering bibliographic records from Science Direct top 25
hottest papers database during 2005-2013, and this paper strenuously tries to give a complete
sketch of the evaluation of research outputs. The key findings of the research divulge that, out
of a total number of 3300 papers undertaken for the present research work, 900 were taken from 1st
three journals and 600 shared by the 4th journal “Religion”. It is indicated from the study that
top 15 authors of all four journals identically contributed 349 (38.77%), 281 (31.22%), 384
(42.66 %) and 239 (39.83 %) papers to their credit which counts more than one third of the whole
contribution except 2nd journal. In all journals the greater number 79, 76, 72, and 85 percent
papers were produced by single authors, while the collaborated papers were only 21, 24, 28, and
15 percent the study unmasks. Considering the authors’ institutional affiliation it is
ascertained that, the authors’ contributed to the journals was affiliated to 153, 152, 169 and 80
unique institutions encompassing intercontinental regions, which again determines maximum number
of institutional contributors are involved in 3rd journal, while minimum institutional
contributors in 4th journal respectively. Besides, the geographical analysis indicates the
involvement of cross national regions in the research practices is well found considerably
benchmarking. Moreover, the study evidently shows that the overwhelming and most productive
geographical region contributors’ USA shared 208 (23.11%), 354 (39.33%) and 231 (38.5 %) papers
in 1st ,2nd and 4th journal with posed 1st rank, while UK achieved 1st rank having contribution 396
(44%) to the 3rd journal respectively. Resultantly, it could be professed here that, the both
regions (USA and UK) are considerably granted as leading productive nations and prolific in the
realm of global research.
Keywords: Bibliometrics; Research output; Authors productivity; Degree of
collaboration; Authorship pattern; Citation pattern; Productive
countries and Institutions; Prolific Authors; Science Direct;
Scholarly Publications; Research Excellence; LS; L&E; PG; Rgn.
1. Background Study
The examination of the research publication and its contributions is a
buzzing area of research in the field of library and information science.
Bibliometrics, Scientometrics, Citation Study, and Content analysis are the
concepts supplementary and complementary to each other in their respective
applications in the field in the domain of research which are most familiar
tools extremely and extensively used by the scholars, researchers and
academics across the globe. This technique has been put forth over the
present study to evaluate research productivity at a global context to induce
necessary inferences.
To avoid confusion it would be worthwhile to point out here that,
though the data undertaken from papers indexed in Science Direct
Bibliographic Database top 25 hottest papers of journals such as: 1st
“Language Sciences” (LS), 2nd “Linguistics and Education” (L&E), and 3rd
‘Political Geography’ (PG), under the time period 2005-2013, while the
journal “Religion” (Rgn) covers the time period 2005-2010, but the table no.
2 indicates the actual year of publication of these papers in concerned
source journals.
2. Introduction:
Bibliometrics and scientometrics are the two closely related approaches
for measuring scientific publications and science in general, respectively.
In practice, much of the work that fall under this header involves various
types of citation analysis, which looks at how scholars cite one another in
publications. In the context of this toolkit, bibliometrics are also one of
the key ways of measuring the impact of scholarly publications.
‘Scientometrics’ is often done using bibliometrics which is a measurement of
the impact of (scientific) publications. Modern scientometrics is mostly
based on the work of Derek J. de Solla Price and Eugene Garfield. The latter
founded the Institute for Scientific Information which is heavily used for
scientometric analysis. Methods of research include qualitative, quantitative
and computational approaches.
(http://en.wikipedia.org/wiki/Scientometrics/ accessed on 15.12.11).
Bibliometrics is a type of research method being used in LIS. It is an
emerging area of research in the LIS field. The quantitative analysis and
statistics to describe patterns of publication within a given field of
literature are utilized. Researchers use bibliometric methods of evaluation
to determine the influence of a single author or to describe the relationship
between two or more authors or works. Bibliometric studies can also be used
to study the regional patterns of research, the extent of cooperation between
research groups and national research profiles. The main derivatives of
bibliometrics are: publication counts, citation counts, co-citation analysis,
co-word analysis, scientific 'mapping' and citations in patents. The word
'bibliometric' has been derived from the Latin and Greek words 'biblio' and
'metrics' which refer to the application of mathematics to the study of
bibliography (Thanuskodi, 2010, p.78).
The term bibliometrics was coined by Alan Pritchard in a paper
published in 1969, titled Statistical Bibliography or Bibliometrics? He
defined the term as "the application of mathematics and statistical methods
to books and other media of communication".
Bibliometrics is statistical analysis of written publications, such as
books or articles. Bibliometric methods are frequently used in the field
of library and information science, including scientometrics. For instance,
bibliometrics are used to provide quantitative analysis of academic
literature. Analysis and content analysis are commonly used bibliometric
methods. Many research fields use bibliometric methods to explore the impact
of their field,[3] the impact of a set of researchers, or the impact of a
particular paper. Bibliometrics also has a wide range of other applications,
such as in descriptive linguistics, the development of thesauri, and
evaluation of reader usage.
Historically bibliometric methods have been used to trace relationships
amongst academic journal citations. Citation analysis, which involves
examining an item's referring documents, is used in searching for materials
and analyzing their merit.[4] Citation indices, such as Institute for
Scientific Information's Web of Science, allow users to search forward in
time from a known article to more recent publications which cite the known
item. (Retrieved from http://en.wikipedia.org/wiki/Bibliometrics)
3. Scope & Objective of the Study:
The scope of the study encompasses four international journals viz., 1st
“Language Sciences” (LS), 2nd “Linguistics and Education” (L&E), and 3rd
‘Political Geography’ (PG), and 4th “Religion (Rgn)” indexed at Science Direct
Database under the heading Top 25 Hottest Articles. The study accounts a
total of 3300 papers adding 900 (Nine hundred) each from three journals, and
600 (Six hundred) from journal ‘Religion’ categorically. For clarity it may
be noted here that, data on the papers of journal “Religion” from the year
2011-2013 are not available under the heading top 25 hottest papers site of
Science Direct Bibliographic Database, for which the researcher excluded the
period from the study. The key objectives of the present study holds to
acclaim the following issues are as follows:
i. Nature of Authorship pattern of publication;
ii. Single Vs Multiple authored papers;
iii. Trace the Geographical Distribution/scattering of research
publication;
iv. Chronological Growth pattern of literature;
v. Most productive authors of top countries;
vi. Degree of collaboration of authors;
vii. Degree of citation of articles;
viii. Study of length of the papers and
ix. Understanding the changing trends in scholarly research output
4. Methodology Employed
The study specifically concentrates on the Bibliometric analysis is one
of the most widely used methods in Library and information science research.
It is an examination of the frequency, patterns, and graphs of citations in
articles. This study is aimed to discuss about the analysis of the research
output of four international journals indexed under Science Direct on-line
Database. The relevant sources and data are collected from top 25 hottest
papers site of above mentioned database. Based on the available sources the
following discussions were made.
Data on papers published in four journals such as: 1st “Language
Sciences” (LS), 2nd “Linguistics and Education” (L&E), and 3rd ‘Political
Geography’ (PG), and 4th “Religion (Rgn)” were collected from each downloaded
records from Science Direct on-line Bibliographic Database and each data were
examined identically to find out the result. All papers included in the
analyses which are indexed under the top twenty five hottest papers site of
1st three journals accounting 900 papers each, whereas the 4th journal with 600
papers identically. Further, each items of information processed by
developing a database of 3300 down loaded records adding essential fields
viz. journal title, article title, 1st author, number of authors, affiliation
with institutions, country of origin (considering 1st author), year of
publication in source journal, number of citations, length of papers and
ranking pattern, etc. using the MS-Excel spread sheet. It may be noticed here
that, in case of 4th journal “Religion” due to non-availability of data on
papers period from 2011-2015 in top 25 hottest papers site 300 records have
been excluded which caused a total 600 records considered under the gamut of
the present study. Since, reference counts are not freely available with the
abstract site the investigator did not able to analyze the reference pattern
of the papers. Finally, all relevant data are then sorted, tabulated, and
assimilated in a logical order to draw inferences for the present research.
5. Review of Literature
Lipetz (1999) studied many bibliometric aspects of papers in JASIS by
examining volume of 1955, 1965, 1975, 1985 and 1995. One of his findings
revealed that the number of scholarly papers published per year in JASIS has
grown exponentially from 21 to 68.
Dutt, Garg & Bali (2003) analyzed 1317 papers published in the first
fifty volumes of the international journal of Scientometrics during 1978 to
2001. They found that the U.S.A share of papers is constantly declining while
that of the Netherlands, India, France and Japan is on the rise. The research
output is highly scattered as indicated by the average number of papers per
institution.
Mukherjee (2008) analyzed the authorship pattern of scientific
productions of the four most productive Indian academic institutions for the
eight-year –period from 2000 to 2007. The results show that among four
universities, the authors of Delhi University contributed the highest
number of articles, followed by Banaras Hindu University. There is also an
increasing tendency toward collaborative research among Indian authors as
well as more frequent collaboration with international authors. Biochemistry
and Molecular Biology are two of the most prolific research areas in these
four Indian universities. The average rate of references per item is 28 and
the citations received per item are 3.56.
Tian, Wen & Hong (2008) conducted a bibliometric analysis to evaluate
global scientific production of Geographic Information System (GIS) papers
from 1997 to 2006 in Science Citation Index. Results indicated that GIS
research steadily increased over the period and the annual paper production
in 2006 was about three times higher comparing to 1997s paper productions.
6. Need of the study
There have been incessant studies on bibliometrics, scientometrics,
content analysis etc. which is most familiar among the researchers, scholars,
and academicians all over the globe in the field of Library and information
science (LIS). The trend has given new dimensions and understanding to the
domain of LIS research. However, the very study trace this trend and aims at
highlighting the aspects which would be most useful and further encourage the
researchers’, scholars and library practitioners in enriching their
respective research activities and professional exercises with designing a
nuance platform to the hub of given research.
7. Analysis and Interpretation of Data
The present study is based on the analysis of the collected data of
four international journals indexed under science direct database top 25
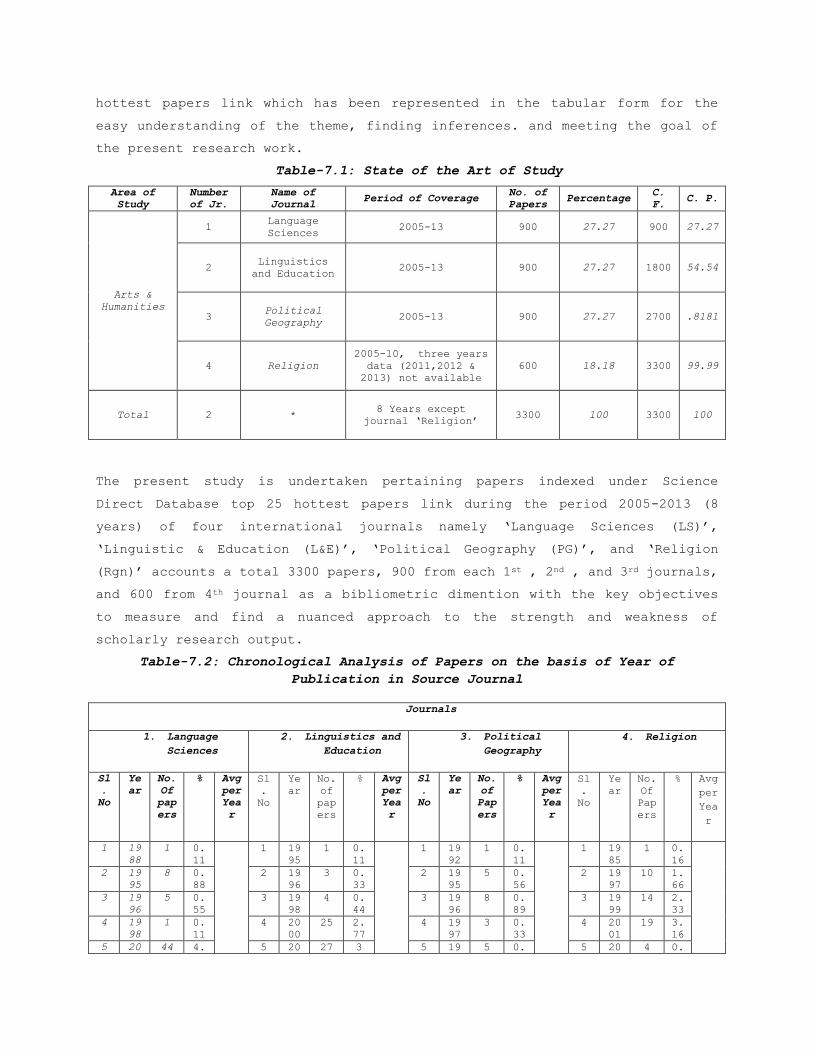
hottest papers link which has been represented in the tabular form for the
easy understanding of the theme, finding inferences. and meeting the goal of
the present research work.
Table-7.1: State of the Art of Study
Area of
Study
Number
of Jr.
Name of
Journal Period of Coverage
No. of
Papers Percentage
C.
F. C. P.
Arts &
Humanities
1 Language
Sciences 2005-13 900 27.27 900 27.27
2 Linguistics
and Education 2005-13 900 27.27 1800 54.54
3 Political
Geography 2005-13 900 27.27 2700 .8181
4 Religion
2005-10, three years
data (2011,2012 &
2013) not available
600 18.18 3300 99.99
Total 2 * 8 Years except
journal ‘Religion’ 3300 100 3300 100
The present study is undertaken pertaining papers indexed under Science
Direct Database top 25 hottest papers link during the period 2005-2013 (8
years) of four international journals namely ‘Language Sciences (LS)’,
‘Linguistic & Education (L&E)’, ‘Political Geography (PG)’, and ‘Religion
(Rgn)’ accounts a total 3300 papers, 900 from each 1st , 2nd , and 3rd journals,
and 600 from 4th journal as a bibliometric dimention with the key objectives
to measure and find a nuanced approach to the strength and weakness of
scholarly research output.
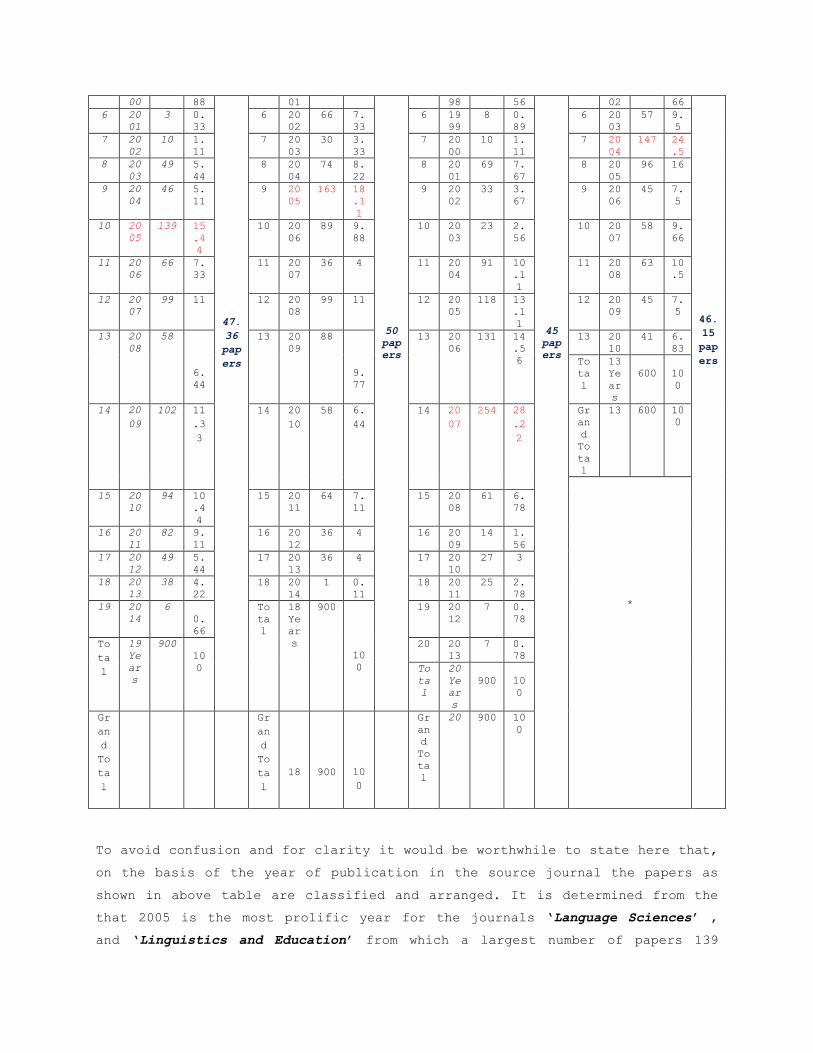
Table-7.2: Chronological Analysis of Papers on the basis of Year of
Publication in Source Journal
Journals
1. Language
Sciences
2. Linguistics and
Education
3. Political
Geography
4. Religion
Sl
.
No
Ye
ar
No.
Of
pap
ers
% Avg
per
Yea
r
Sl
.
No
Ye
ar
No.
of
pap
ers
% Avg
per
Yea
r
Sl
.
No
Ye
ar
No.
of
Pap
ers
% Avg
per
Yea
r
Sl
.
No
Ye
ar
No.
Of
Pap
ers
% Avg
per
Yea
r
1 19
88
1 0.
11
1 19
95
1 0.
11
1 19
92
1 0.
11
1 19
85
1 0.
16
2 19
95
8 0.
88
2 19
96
3 0.
33
2 19
95
5 0.
56
2 19
97
10 1.
66
3 19
96
5 0.
55
3 19
98
4 0.
44
3 19
96
8 0.
89
3 19
99
14 2.
33
4 19
98
1 0.
11
4 20
00
25 2.
77
4 19
97
3 0.
33
4 20
01
19 3.
16
5 20 44 4. 5 20 27 3 5 19 5 0. 5 20 4 0.
00 88
47.
36
pap
ers
01
50
pap
ers
98 56
45
pap
ers
02 66
46.
15
pap
ers
6 20
01
3 0.
33
6 20
02
66 7.
33
6 19
99
8 0.
89
6 20
03
57 9.
5
7 20
02
10 1.
11
7 20
03
30 3.
33
7 20
00
10 1.
11
7 20
04
147 24
.5
8 20
03
49 5.
44
8 20
04
74 8.
22
8 20
01
69 7.
67
8 20
05
96 16
9 20
04
46 5.
11
9 20
05
163 18
.1
1
9 20
02
33 3.
67
9 20
06
45 7.
5
10 20
05
139 15
.4
4
10 20
06
89 9.
88
10 20
03
23 2.
56
10 20
07
58 9.
66
11 20
06
66 7.
33
11 20
07
36 4 11 20
04
91 10
.1
1
11 20
08
63 10
.5
12 20
07
99 11 12 20
08
99 11 12 20
05
118 13
.1
1
12 20
09
45 7.
5
13 20
08
58
6.
44
13 20
09
88
9.
77
13 20
06
131 14
.5
6
13 20
10
41 6.
83
To
ta
l
13
Ye
ar
s
600
10
0
14 20
09
102 11
.3
3
14 20
10
58 6.
44
14 20
07
254 28
.2
2
Gr
an
d
To
ta
l
13 600 10
0
*
15 20
10
94 10
.4
4
15 20
11
64 7.
11
15 20
08
61 6.
78
16 20
11
82 9.
11
16 20
12
36 4 16 20
09
14 1.
56
17 20
12
49 5.
44
17 20
13
36 4 17 20
10
27 3
18 20
13
38 4.
22
18 20
14
1 0.
11
18 20
11
25 2.
78
19 20
14
6
0.
66
To
ta
l
18
Ye
ar
s
900
10
0
19 20
12
7 0.
78
To
ta
l
19
Ye
ar
s
900
10
0
20 20
13
7 0.
78
To
ta
l
20
Ye
ar
s
900
10
0
Gr
an
d
To
ta
l
Gr
an
d
To
ta
l
18
900
10
0
Gr
an
d
To
ta
l
20 900 10
0
To avoid confusion and for clarity it would be worthwhile to state here that,
on the basis of the year of publication in the source journal the papers as
shown in above table are classified and arranged. It is determined from the
that 2005 is the most prolific year for the journals ‘Language Sciences’ ,
and ‘Linguistics and Education’ from which a largest number of papers 139
(15.44%) , 163 (18.11%) are indexed under top 25 hottest papers site, while
the papers of journal ‘Political Geography’ 254 (28.22%) of the year 2007 and
the journal ‘Religion’ 147 (24.5%) papers of the year 2004 took place under
top 25 hottest papers link are found quite significant. Moreover, it is also
explored that, the papers indexed under top 25 hottest papers link of all
four journals covers the period of publication in original journal
categorically 19, 18, 20 and 13 years, accounting papers 900 each as
individual share in three journals, except the journal ‘Religion’ which adds
600 papers to the domain. The above table shows that the maximum number of
papers published in the 1st , 2nd , 3rd , and 4th journals, 139 (15.44%) , 163
(18.11%), 254 (28.22%), and 147 (24.5%) during the years 2005, 2005, 2007,
and 2004 and the minimum papers (one) in the years 1988, 1995, 1992, and 1985
respectively. The journals on an average has contributed to the top 25
hottest papers domain 47.36, 50, 45 and 46.15 research papers per year.
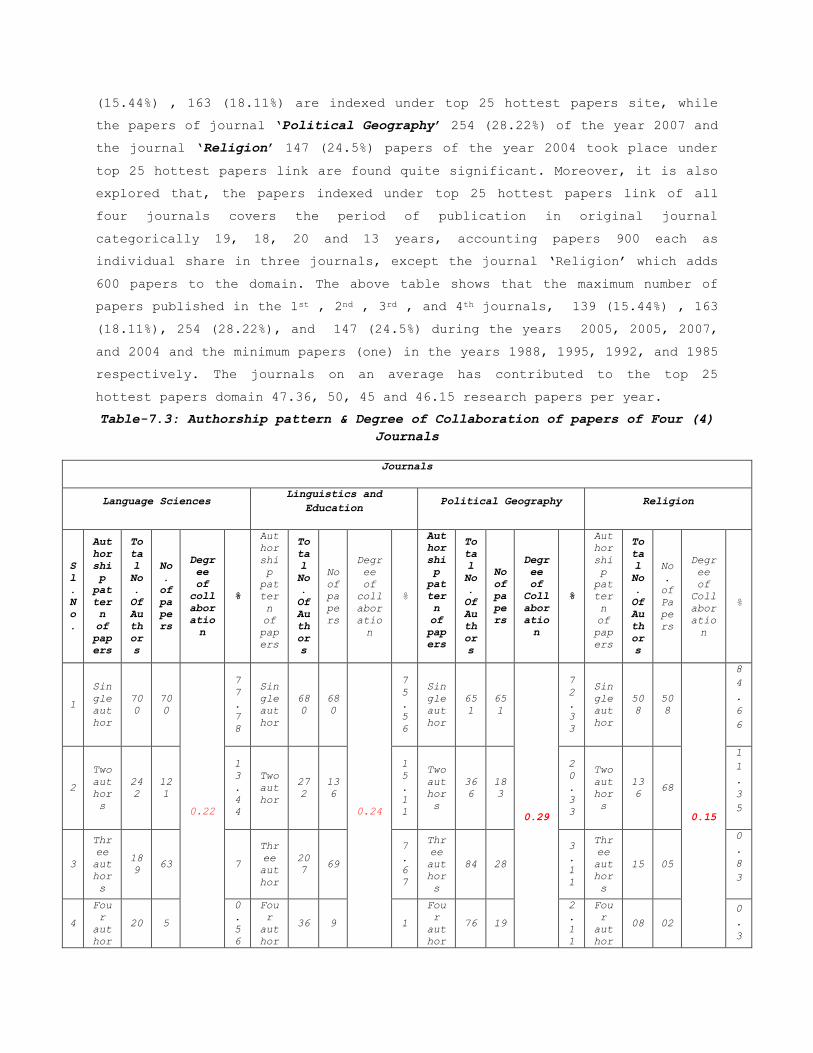
Table-7.3: Authorship pattern & Degree of Collaboration of papers of Four (4)
Journals
Journals
Language Sciences Linguistics and
Education Political Geography Religion
S
l
.
N
o
.
Aut
hor
shi
p
pat
ter
n
of
pap
ers
To
ta
l
No
.
Of
Au
th
or
s
No
.
of
pa
pe
rs
Degr
ee
of
coll
abor
atio
n
%
Aut
hor
shi
p
pat
ter
n
of
pap
ers
To
ta
l
No
.
Of
Au
th
or
s
No
of
pa
pe
rs
Degr
ee
of
coll
abor
atio
n
%
Aut
hor
shi
p
pat
ter
n
of
pap
ers
To
ta
l
No
.
Of
Au
th
or
s
No
of
pa
pe
rs
Degr
ee
of
Coll
abor
atio
n
%
Aut
hor
shi
p
pat
ter
n
of
pap
ers
To
ta
l
No
.
Of
Au
th
or
s
No
.
of
Pa
pe
rs
Degr
ee
of
Coll
abor
atio
n
%
1
Sin
gle
aut
hor
70
0
70
0
0.22
7
7
.
7
8
Sin
gle
aut
hor
68
0
68
0
0.24
7
5
.
5
6
Sin
gle
aut
hor
65
1
65
1
0.29
7
2
.
3
3
Sin
gle
aut
hor
50
8
50
8
0.15
8
4
.
6
6
2
Two
aut
hor
s
24
2
12
1
1
3
.
4
4
Two
aut
hor
27
2
13
6
1
5
.
1
1
Two
aut
hor
s
36
6
18
3
2
0
.
3
3
Two
aut
hor
s
13
6 68
1
1
.
3
5
3
Thr
ee
aut
hor
s
18
9 63 7
Thr
ee
aut
hor
20
7 69
7
.
6
7
Thr
ee
aut
hor
s
84 28
3
.
1
1
Thr
ee
aut
hor
s
15 05
0
.
8
3
4
Fou
r
aut
hor
20 5
0
.
5
6
Fou
r
aut
hor
36 9 1
Fou
r
aut
hor
76 19
2
.
1
1
Fou
r
aut
hor
08 02
0
.
3
s s s 3
5
Fiv
e
aut
hor
s
25 5
0
.
5
6
Fiv
e
aut
hor
25 5
0
.
5
6
Fiv
e
aut
hor
s
50 10
1
.
1
1
Fiv
e
aut
hor
s
05 01
0
.
1
6
6
Six
aut
hor
s &
Mor
e
38 6
0
.
6
7
Six
aut
hor
s &
Mor
e
9 1
0
.
1
1
Mor
e
tha
n
fiv
e
aut
hor
s
52 9 1
Mor
e
tha
n
fiv
e
aut
hor
s
12
3 16
2
.
6
6
Grand
Total
12
14
90
0
1
0
0
Gra
nd
Tot
al
12
29
90
0
1
0
0
Gra
nd
Tot
al
12
79
90
0
1
0
0
Gra
nd
Tot
al
79
5
60
0
1
0
0
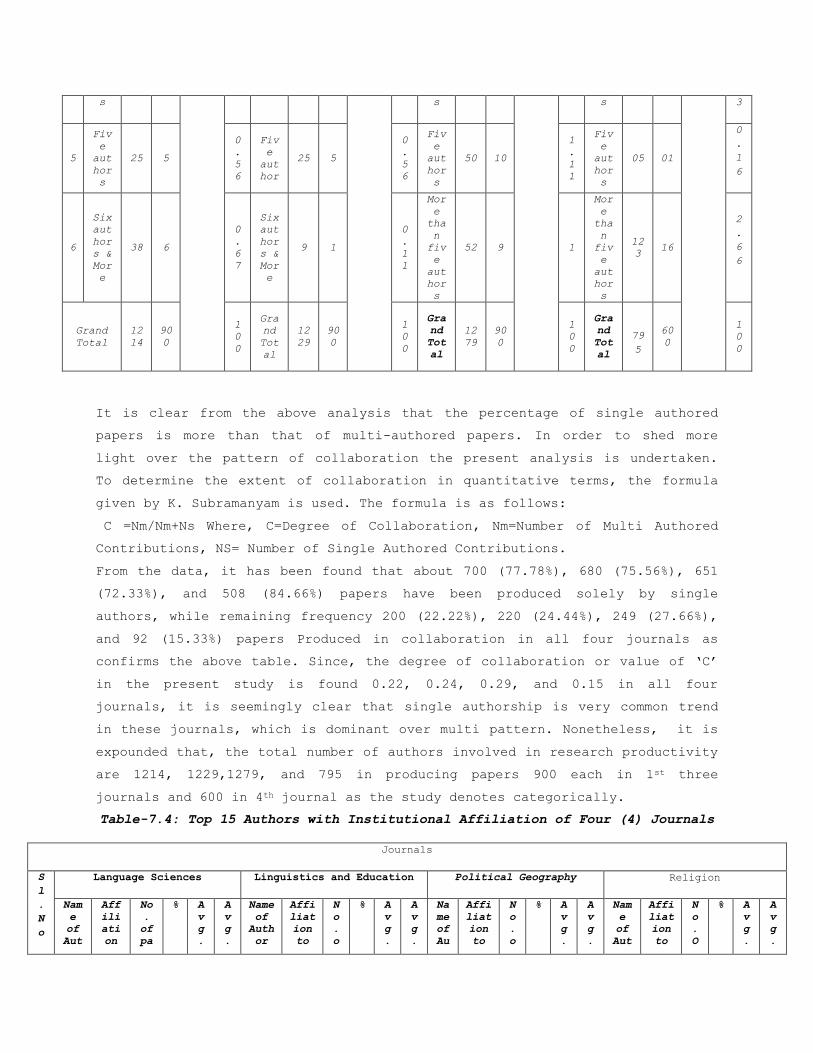
It is clear from the above analysis that the percentage of single authored
papers is more than that of multi-authored papers. In order to shed more
light over the pattern of collaboration the present analysis is undertaken.
To determine the extent of collaboration in quantitative terms, the formula
given by K. Subramanyam is used. The formula is as follows:
C =Nm/Nm+Ns Where, C=Degree of Collaboration, Nm=Number of Multi Authored
Contributions, NS= Number of Single Authored Contributions.
From the data, it has been found that about 700 (77.78%), 680 (75.56%), 651
(72.33%), and 508 (84.66%) papers have been produced solely by single
authors, while remaining frequency 200 (22.22%), 220 (24.44%), 249 (27.66%),
and 92 (15.33%) papers Produced in collaboration in all four journals as
confirms the above table. Since, the degree of collaboration or value of ‘C’
in the present study is found 0.22, 0.24, 0.29, and 0.15 in all four
journals, it is seemingly clear that single authorship is very common trend
in these journals, which is dominant over multi pattern. Nonetheless, it is
expounded that, the total number of authors involved in research productivity
are 1214, 1229,1279, and 795 in producing papers 900 each in 1st three
journals and 600 in 4th journal as the study denotes categorically.
Table-7.4: Top 15 Authors with Institutional Affiliation of Four (4) Journals
Journals
S
l
.
N
o
Language Sciences Linguistics and Education Political Geography Religion
Nam
e
of
Aut
Aff
ili
ati
on
No
.
of
pa
% A
v
g
.
A
v
g
.
Name
of
Auth
or
Affi
liat
ion
to
N
o
.
o
% A
v
g
.
A
v
g
.
Na
me
of
Au
Affi
liat
ion
to
N
o
.
o
% A
v
g
.
A
v
g
.
Nam
e
of
Aut
Affi
liat
ion
to
N
o
.
O
% A
v
g
.
A
v
g
.
hor to
Ins
tit
uti
on
pe
rs
P
a
p
e
r
s
p
e
r
A
u
t
h
o
r
P
a
p
e
r
s
p
e
r
I
n
s
t
Inst
itut
ion
f
p
a
p
e
r
s
P
a
p
e
r
s
p
e
r
A
u
t
h
o
r
P
a
p
e
r
s
p
e
r
I
n
s
t
.
th
or
Inst
itut
ion
f
p
a
p
e
r
s
P
a
p
e
r
s
p
e
r
A
u
t
h
o
r
P
a
p
e
r
s
p
e
r
I
n
s
t
.
hor Inst
itut
ion
f
p
a
p
e
r
s
P
a
p
e
r
s
p
e
r
A
u
t
h
o
r
P
a
p
e
r
s
p
e
r
I
n
s
t
.
1 Yuh
-
Fan
g
Cha
ng
Nat
ion
al
Chu
ng
Hsi
ng
Uni
ver
sit
y
47 5
.
2
2
4
.
2
0
5
.
8
8
Ange
la
Cree
se
Univ
ersi
ty
of
Birm
ingh
am
2
7
3
4
.
3
6
5
.
9
2
Ar
tu
ro
Es
co
ba
r
Univ
ersi
ty
of
Nort
h
Caro
lina
3
5
3
.
8
8
4
.
5
4
5
.
3
2
Hen
ry
Mun
son
Univ
ersi
ty
of
Main
e
2
9
4
.
8
3
3
.
8
9
7
.
5 2 Cli
ff
God
dar
d
Uni
ver
sit
y
of
New
Eng
lan
d
42 4
.
6
7
Vera
F
utié
rrez
-
Clel
len
San
Dieg
o
Stat
e
Univ
ersi
ty
2
5
2
.
7
8
Mi
ch
ae
l
K.
Go
od
ma
n
Univ
ersi
ty
of
Cali
forn
ia
3
4
3
.
7
7
Phi
lip
A.
Mel
lor
Univ
ersi
ty
of
Leed
s
2
5
4
.
1
6
3 Lyl
e
Cam
pbe
ll
Uni
ver
sit
y
of
Can
ter
bur
y
41 4
.
5
6
Cons
tant
Leun
g
King
's
Coll
ege
Lond
on
2
4
2
.
6
7
Ph
il
ip
pe
Le
Bi
ll
on
Scho
ol
of
Geog
raph
y
3
4
3
.
7
7
Ste
ven
Eng
ler
Moun
t
Roya
l
Coll
ege
2
4
4
4 Pau
l
Mat
ych
u
And
rew
s
Uni
ver
sit
y
33 3
.
6
7
J.R.
Mart
in
Univ
ersi
ty
of
Sydn
ey
2
2
2
.
4
4
Ha
rr
ie
t
Bu
lk
el
ey
Univ
ersi
ty
of
Durh
am
3
2
3
.
5
5
Ter
ry
Rey
Flor
ida
Inte
rnat
iona
l
Univ
ersi
ty
2
2
3
.
6
6
5 Chr
ist
oph
e
Par
iss
e
LEA
PLE
,
UMR
23 2
.
5
5
Rich
ard
Barw
ell
Univ
ersi
ty
of
Bris
tol
2
1
2
.
3
3
Ma
tt
he
w
B.
Sp
ar
ke
Univ
ersi
ty
of
Wash
ingt
on,
2
7
3 Bil
l
Ash
cro
ft
Scho
ol
of
Engl
ish,
1
6
2
.
6
6
6 Ann
a
Wie
rzb
ick
a
Aus
tra
lia
n
Nat
ion
al
Uni
20 2
.
2
2
Mary
J
Schl
eppe
grel
l
Univ
ersi
ty
of
Cali
forn
ia
2
0
2
.
2
2
Jo
n
Ba
rn
et
t
Univ
ersi
ty
of
Melb
ourn
e,
2
5
2
.
7
7
Chr
ist
oph
er
Par
tri
dge
Univ
ersi
ty
Coll
ege
Ches
ter,
1
5
2
.
5
ver
sit
y
7 Ana
Deu
mer
t
Mon
ash
Uni
ver
sit
y
19 2
.
1
1
Ross
Form
an
Univ
ersi
ty
of
Tech
nolo
gy
2
0
2
.
2
2
Lo
ui
se
Am
oo
re
Univ
ersi
ty
of
Durh
am,
2
5
2
.
7
7
Bro
n
Tay
lor
Univ
ersi
ty
of
Wisc
onsi
n,
1
3
2
.
1
6
8 Chr
ist
oph
er
S.
But
ler
Uni
ver
sit
y
of
Wal
es
Swa
nse
a,
18 2
.
0
0
Tina
Shar
pe
Shar
pe
Cons
ulti
ng
(NSW
)
1
9
2
.
1
1
Ra
fa
el
Re
uv
en
y
,
Indi
ana
Univ
ersi
ty
2
5
2
.
8
5
Mic
hae
l
Sta
usb
erg
Univ
ersi
ty
of
Berg
en,
1
3
2
.
1
6
9 Tal
bot
J.
Tay
lor
Col
leg
e
of
Wil
lia
m
and
Mar
y,
17 1
.
8
9
Jame
s
Paul
Gee
Univ
ersi
ty
of
Wisc
onsi
n at
Madi
son
1
7
1
.
8
9
Cl
io
na
dh
Ra
le
ig
h
Univ
ersi
ty
of
Esse
x,
2
4
2
.
7
7
Sus
an
Rai
ne
,
Univ
ersi
ty
of
Albe
rta,
1
3
2
.
1
6
1
0
Nao
mi
S
Bar
on
Ame
ric
an
Uni
ver
sit
y,
16 1
.
7
7
Tarj
a
Niku
la
Univ
ersi
ty
of
Jyvä
skyl
ä
1
7
1
.
8
9
Ra
gn
hi
ld
No
rd
ås
Inte
rnat
iona
l
Peac
e
Rese
arch
Inst
itut
e,
2
4
2
.
6
6
Win
nif
red
Fal
ler
s
Sul
liv
an
Univ
ersi
ty
of
Chic
ago,
1
3
2
.
1
6
1
1
Ewa
Dąb
row
ska
Uni
ver
sit
y
of
She
ffi
eld
,
15 1
.
6
6
Susa
n
Hood
Univ
ersi
ty
of
Tech
nolo
gy
1
6
1
.
7
8
No
el
Ca
st
re
e
Manc
hest
er
Univ
ersi
ty,
2
1
2
.
3
8
Eli
zab
eth
Moh
kam
sin
g-
den
Boe
r
Univ
ersi
ty
of
Nijm
egen
1
2
2
1
2
Fie
ke
Van
der
Guc
ht
Ghe
nt
Uni
ver
sit
y,
15 1
.
6
6
Vale
rie
Hobb
s
Univ
ersi
ty
of
Shef
fiel
d,
1
6
1
.
7
8
Ja
so
n
Ac
kl
es
on
New
Mexi
co
Stat
e
Univ
ersi
ty
2
0
2
.
2
5
Ian
Rea
der
Univ
ersi
ty
of
Manc
hest
er,
1
2
2
1
3
Mig
uel
Cas
as
Góm
ez
Uni
ver
sid
ad
de
Cád
iz,
15 1
.
6
6
Patr
icia
A
Duff
Univ
ersi
ty
of
Brit
ish
Colu
mbia
1
3
1
.
4
4
Pá
dr
ai
g
R.
Ca
rm
od
Dubl
in
City
Univ
ersi
ty,
2
0
2
.
2
5
Yuv
al
Ner
ia
Colu
mbia
Univ
ersi
ty
and
New
York
1
2
2
y
Stat
e
Psyc
hiat
ric
Inst
itut
e,
1
4
Nig
el
Lov
e
Uni
ver
sit
y
of
Cap
e
Tow
n
14 1
.
5
5
Aria
Razf
a
Univ
ersi
ty
of
Illi
nois
1
2
1
.
3
3
Li
ly
Ko
ng
Nati
onal
Univ
ersi
ty
of
Sing
apor
e
1
9
2
.
1
8
E.
Tyl
er
Gra
ham
101
Nort
h
Univ
ersi
ty
Aven
ue
1
0
1
.
6
6
1
5
Phi
lip
Sea
rge
ant
The
Ope
n
Uni
ver
sit
y
14 1
.
5
5
Jame
s
Coll
ins
Stat
e
Univ
ersi
ty
of
New
York
1
2
1
.
3
3
Ma
xw
el
l
T.
Bo
yk
of
f
Univ
ersi
ty
of
Oxfo
rd
1
9
2
.
1
8
Jus
tin
L.
Bar
ret
t
Oxfo
rd
Univ
ersi
ty
1
0
1
.
6
6
T
o
t
a
l
15
Aut
hor
s
15
Aff
ili
ate
d
Ins
tit
uti
ons
34
9
3
8
.
7
7
15
Auth
ors
15
Affi
liat
ed
Inst
itut
ions
2
8
1
3
1
.
2
2
15
Au
th
or
s
15
Affi
liat
ed
Inst
itut
ions
3
8
4
4
2
.
6
6
15
Aut
hor
s
15
Affi
liat
ed
Inst
itut
ions
2
3
9
3
9
.
8
3
O
t
h
e
r
s
197
Aut
hor
s
136
Aff
ili
ate
d
Ins
tit
uti
ons
54
9
6
1
191
Auth
ors
137A
ffil
iate
d
Inst
itut
ions
6
1
9
6
8
.
7
7
18
3
Au
th
or
s
154
Affi
liat
ed
Inst
itut
ions
5
1
6
5
7
.
3
3
139
Aut
hor
s
65
Affi
liat
ed
Inst
itut
ions
3
6
1
6
0
.
1
6
G
r
a
n
d
T
o
t
a
l
212
+Da
ta
not
ava
ila
ble
02=
214
*(U
niq
ue
Aut
hor
s)
151
+Da
ta
abo
ut
Ins
t.
not
ava
ila
ble
in
02
pap
ers
=15
3
89
8+
2=
90
0
1
0
0
206
Auth
ors
*(Un
ique
Auth
ors)
152
Affi
liat
ed
Inst
itut
ions
9
0
0
1
0
0
19
8
Au
th
or
s
169
Affi
liat
ed
Inst
itut
ions
9
0
0
1
0
0
154
Aut
hor
s
80
Affi
liat
ed
Inst
itut
ions
6
0
0
1
0
0
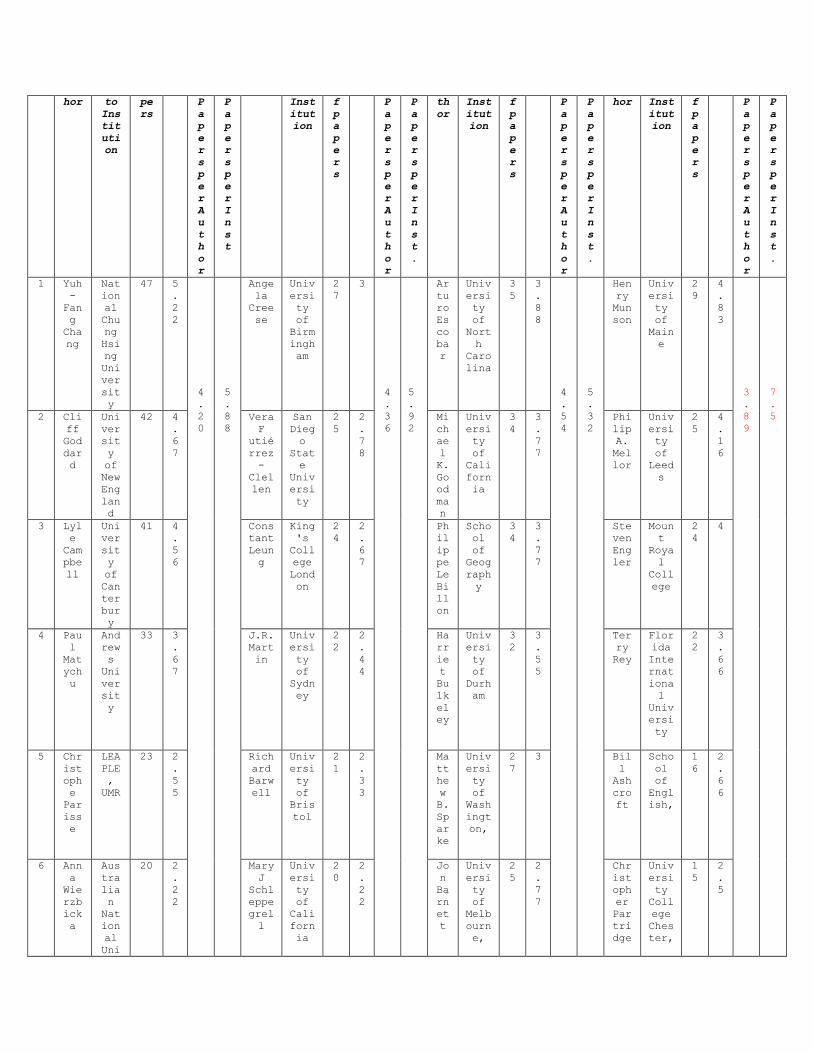
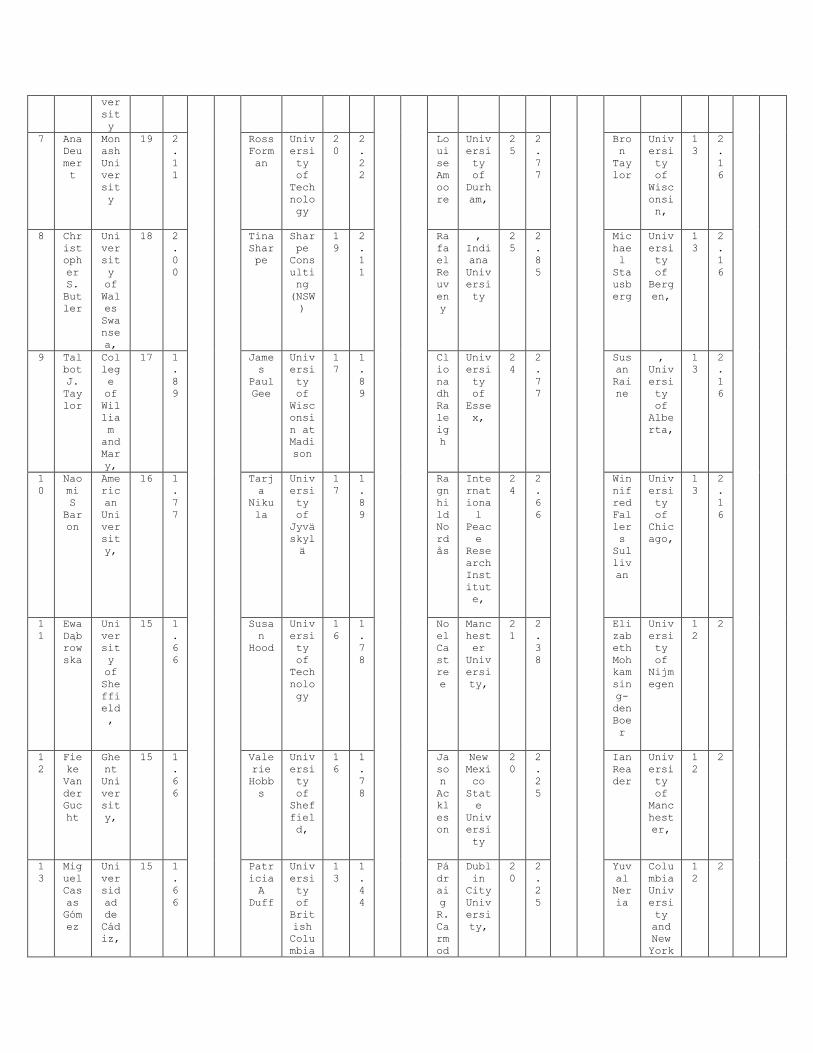
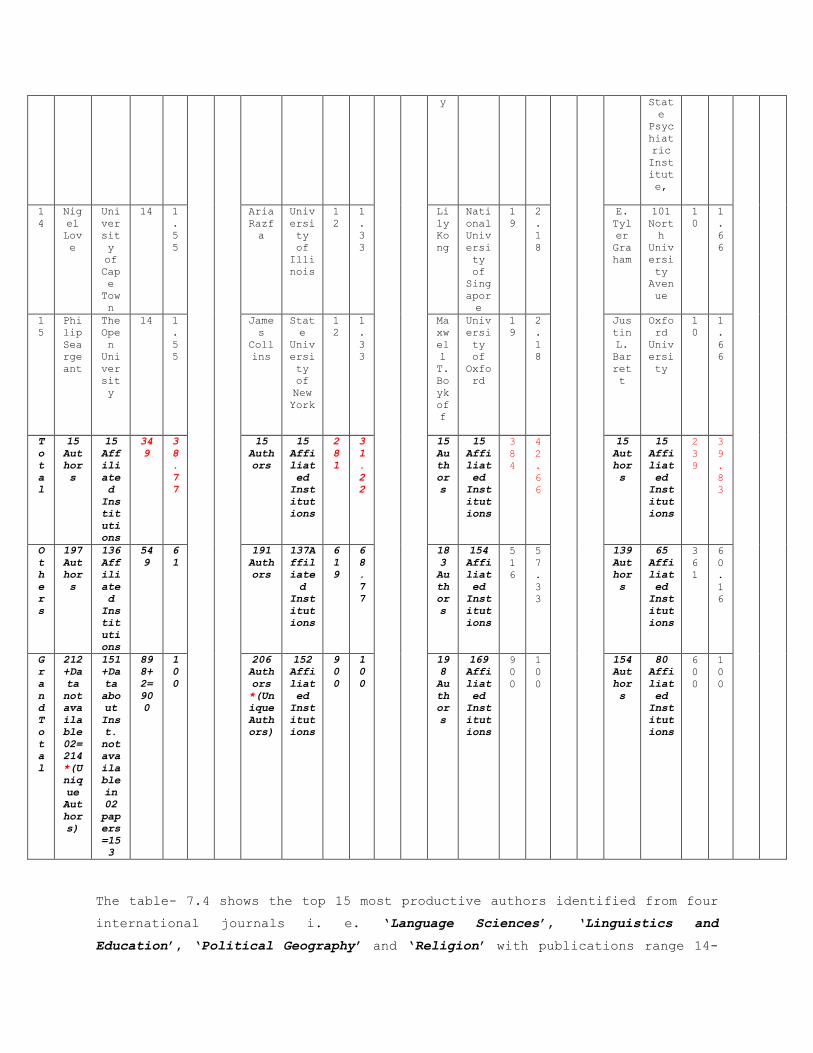
The table- 7.4 shows the top 15 most productive authors identified from four
international journals i. e. ‘Language Sciences’, ‘Linguistics and
Education’, ‘Political Geography’ and ‘Religion’ with publications range 14-
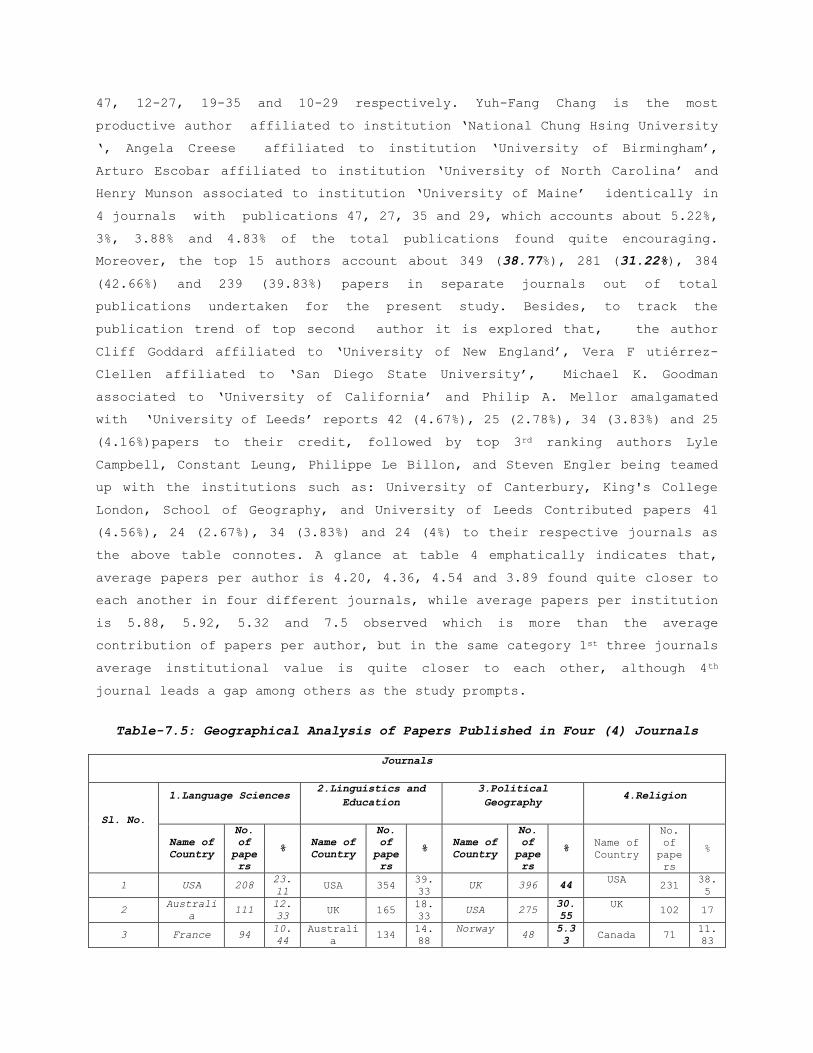
47, 12-27, 19-35 and 10-29 respectively. Yuh-Fang Chang is the most
productive author affiliated to institution ‘National Chung Hsing University
‘, Angela Creese affiliated to institution ‘University of Birmingham’,
Arturo Escobar affiliated to institution ‘University of North Carolina’ and
Henry Munson associated to institution ‘University of Maine’ identically in
4 journals with publications 47, 27, 35 and 29, which accounts about 5.22%,
3%, 3.88% and 4.83% of the total publications found quite encouraging.
Moreover, the top 15 authors account about 349 (38.77%), 281 (31.22%), 384
(42.66%) and 239 (39.83%) papers in separate journals out of total
publications undertaken for the present study. Besides, to track the
publication trend of top second author it is explored that, the author
Cliff Goddard affiliated to ‘University of New England’, Vera F utiérrez-
Clellen affiliated to ‘San Diego State University’, Michael K. Goodman
associated to ‘University of California’ and Philip A. Mellor amalgamated
with ‘University of Leeds’ reports 42 (4.67%), 25 (2.78%), 34 (3.83%) and 25
(4.16%)papers to their credit, followed by top 3rd ranking authors Lyle
Campbell, Constant Leung, Philippe Le Billon, and Steven Engler being teamed
up with the institutions such as: University of Canterbury, King's College
London, School of Geography, and University of Leeds Contributed papers 41
(4.56%), 24 (2.67%), 34 (3.83%) and 24 (4%) to their respective journals as
the above table connotes. A glance at table 4 emphatically indicates that,
average papers per author is 4.20, 4.36, 4.54 and 3.89 found quite closer to
each another in four different journals, while average papers per institution
is 5.88, 5.92, 5.32 and 7.5 observed which is more than the average
contribution of papers per author, but in the same category 1st three journals
average institutional value is quite closer to each other, although 4th
journal leads a gap among others as the study prompts.
Table-7.5: Geographical Analysis of Papers Published in Four (4) Journals
Journals
Sl. No.
1.Language Sciences 2.Linguistics and
Education
3.Political
Geography 4.Religion
Name of
Country
No.
of
pape
rs
% Name of
Country
No.
of
pape
rs
% Name of
Country
No.
of
pape
rs
% Name of
Country
No.
of
pape
rs
%
1 USA 208 23.
11 USA 354
39.
33 UK 396 44
USA
231
38.
5
2 Australi
a 111
12.
33 UK 165
18.
33 USA 275
30.
55
UK
102 17
3 France 94 10.
44
Australi
a 134
14.
88
Norway
48
5.3
3 Canada 71
11.
83
4 UK 83 9.2
2 Canada 52
5.7
7
Australi
a
33 3.6
7
The
Netherla
nds
48 8
5 Taiwan 55 6.1
1 Spain 37
4.1
1
Ireland
32
3.5
6
Norway
20
3.3
3
6 South
Africa 41
4.5
5 China 32
3.5
5 Canada 29
3.2
2
Australi
a 18 3
7 Belgium 38 4.2
2
Singapor
e 26
2.8
8
Singapor
e
29 3.2
2
Italy
11
1.8
3
8 Spain 29 3.2
2 Finland 18 2
Israel
7
0.7
8
Denmark
10
1.6
6
9
The
Netherla
nds
28 3.1
1
The
Netherla
nds
14 1.5
5
Switzerl
and
6 0.6
7
Egypt
9 1.5
10 Hong
Kong 24
2.6
6
New
Zealand 11
1.2
2
Sweden
3
0.3
3
Israel
8
1.3
3
11 Germany 18 2 Hungary 11 1.2
2 Turkey 3
0.3
3
Wales
8
1.3
3
12 Israel 18 2 Hong
Kong 10
1.1
1 Germany 2
0.2
2
Finland
5
0.8
3
13 Singapor
e 16
1.7
7 Belgium 8
0.8
8
Netherla
nds
2 0.2
2
Switzerl
and
4 0.6
6
14 Iran 16 1.7
7 Africa 2
0.2
2
Estonia
1
0.1
1
Germany
3 0.5
15 Canada 12 1.3
3 Sweden 1
0.1
1
Hong
Kong 1
0.1
1
News
land
3 0.5
16 * * * * * *
news
land
1 0.1
1
Philippi
nes
3 0.5
17 * * * * * *
Russian
Federati
on
1 0.1
1
Sweden
3 0.5
18 * * * * * * * * * Taiwan
2
0.3
3
19 * * * * * * * * *
Czech
Republic
1 0.1
6
20 * * * * * * * * * France
1
0.1
6
21 * * * * * * * * * Japan
1
0.1
6
Top
Countrie
s with
correspo
nding
papers
15
Countrie
s
collecti
vely
contribu
te
791 87.
88
15
Countrie
s
collecti
vely
contribu
te
875 97.
22
17
Countrie
s
collecti
vely
contribu
te
869 96.
55
21
Countrie
s
collecti
vely
contribu
te
562 93.
66
Other
Data on
country
of
origin
of
papers
not
availabl
e
109 12.
11
Data on
country
of
origin
not
availabl
e
25 2.7
8
Data on
country
of
origin
not
availabl
e
31 3.4
4
Data on
country
of
origin
not
availabl
e
38 6.3
3
Total * 900 100 * 900 100 * 900 100 * 600 100
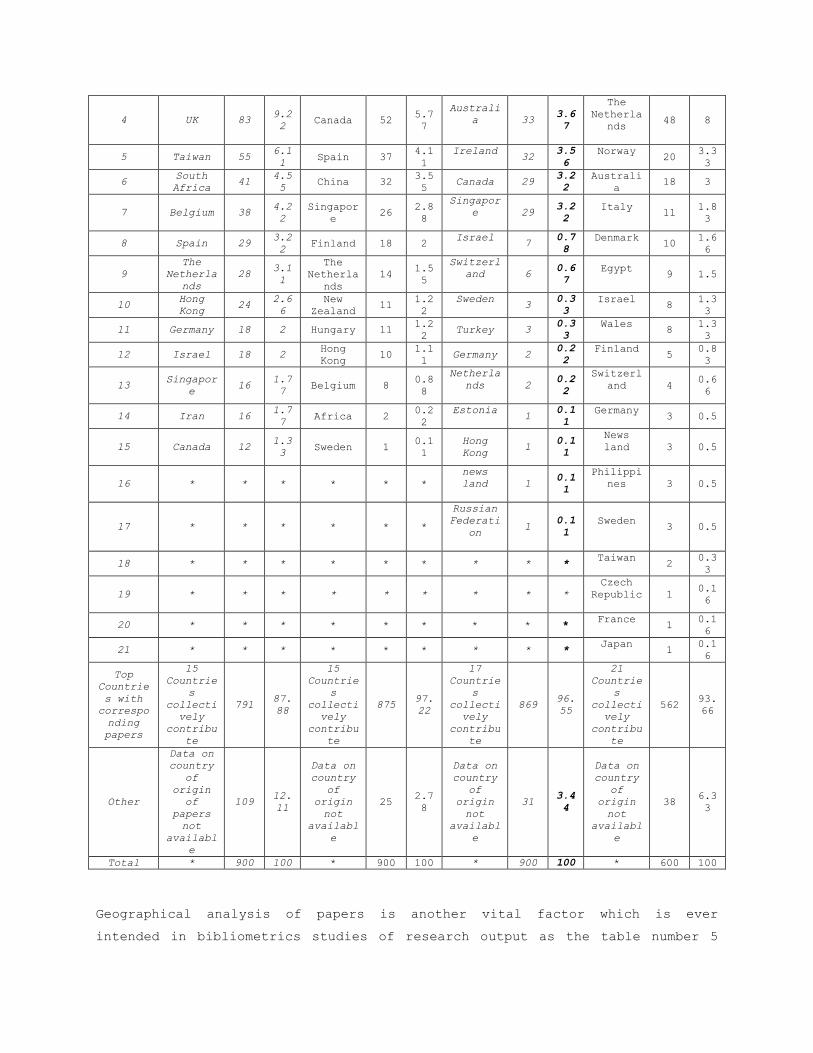
Geographical analysis of papers is another vital factor which is ever
intended in bibliometrics studies of research output as the table number 5
discloses above is undertaken for the present work. Out of four, in three
journals i. e. 1st ‘Language Sciences’, 2nd ‘Linguistics and Education’, and
4th ‘Religion’ the highest number 208 (23.11%), 354 (39.33%), and 231
(38.5%)papers has been contributed by USA, while in the journal ‘Political
Geography’ major contributor is UK with 396 (44%) papers. Hence, it is
ascertained that, USA is the most productive country in the field of research
output across the globe. In 1st journal Australia, UK, France, Taiwan, posed
second, third, fourth and fifth place having 111 (12.33%),94 (10.44%),83
(9.22%),and 55 (6.11%) contributions respectively. As regard to 2nd journal
the countries such as: UK, Australia, Canada, and Spain achieved second,
third, fourth and fifth rank contributing 165 (18.33%), 134 (14.88%), 52
(5.77%), 37 (4.11%) to their credit. With respect to 3rd journal it is noticed
that USA, Norway, Australia, and Ireland got second, third, fourth and fifth
rank with 275 (30.55%), 48 (5.33%), 33 (3.67%), and 32 (3.56%) papers as
their research output. Moreover, in concern to 4th journal it is found that
UK, Canada, Netherlands, and Norway schedules their rank producing 102 (17%),
71 (11.83%), 48 (8%), and 20 (3.33%) research papers in the respective
journal. Although, UK achieved 1st rank in 3rd journal it might be moot having
2nd rank, in 2nd and 4th journals following USA. However, resultantly it might
be worthwhile to say here that USA and UK both are most prolific countries
among other top contributors of the globe. In concluding phase the
researchers would like to focus over the number of country contributors in
different journals as the table shows that, fifteen countries involved in
research contribution in 1st two journals, followed by seventeen countries in
3rd journal, while the highest twenty one countries associated with 4th journal
respectively.
Table-7.6: Top 20 Productive Institutions/Institutional Contributors’
Journals
Sl.
No.
1.Language Sciences 2.Linguistics and
Education 3.Political Geography 4.Religion
Name of
Institut
ion
Name
of
Count
ry
No.
of
Pap
ers
%
Name
of
Instit
ution
Name
of
Coun
try
No.
Of
Pap
ers
%
Name
of
Instit
ution
Name
of
Countr
y
No.
of
Pap
ers
%
Name
of
Instit
ution
Name
of
Count
ry
No.
Of
Pap
ers
%
1
National
Chung
Hsing
Universi
ty
Taiwa
n 47
5.
40
Univer
sity
of
Califo
rnia
Cana
da 62
6.
89
Univer
sity
of
Durham
UK 65 7.
48
Univer
sity
of
Maine
USA 30 5
2
Universi
ty of
New
England
Austr
alia 42
4.
83
Univer
sity
of
Britis
h
Columb
ia
USA 36 4
Univer
sity
of
Califo
rnia
USA 51 5.
89
Univer
sity
of
Leeds
UK 28 4.
66
3 Universi New 41 4. Univer Chin 36 4 Durham UK 39 4. Mount Canad 24 4
ty of
Canterbu
ry
Zeala
nd
71 sity
of
Techno
logy
a Univer
sity
49 Royal
Colleg
e
a
4
Andrews
Universi
ty
USA 32 3.
68
King's
Colleg
e
London
Cana
da 35
3.
89
School
of
Geogra
phy
UK 39 4.
49
Florid
a
Intern
ationa
l
Univer
sity
USA 22 3.
66
5
Ghent
Universi
ty
Belgi
um 28
3.
22
San
Diego
State
Univer
sity
Spai
n 31
3.
44
Intern
ationa
l
Peace
Resear
ch
Instit
ute
Norway
36
4.
18
Facult
y of
Humani
ties
The
Nethe
rland
s
19 3.
16
6
Monash
Universi
ty
Austr
alia 27
3.
10
Univer
sity
of
Sydney
USA 28 3.
11
Univer
sity
of
North
Caroli
na
USA 35 4.
09
School
of
Englis
h
Austr
alia
16 2.
66
7
Universi
ty of
Cape
Town
South
Afric
a
25 2.
87
Univer
sity
of
Birmin
gham
USA 27 3
Univer
sity
of
Washin
gton
USA 34 3.
94
Univer
sity
of
Bergen
Norwa
y
16 2.
66
8 Leaple,
UMR
Franc
e 23
2.
64
Univer
sity
of
Bristo
l
USA 25 2.
78
Manche
ster
Univer
sity
UK 29 3.
34
Univer
sity
Colleg
e
Cheste
r
UK 15 2.
5
9
Max
Planck
Institut
e for
Psycholi
nguistic
s
The
Nethe
rland
s
22 2.
53
Univer
sity
of
London
Aust
rali
a
23 2.
56
Nation
al
Univer
sity
of
Singap
ore
Singap
ore
29 3.
34
Univer
sity
of
Amster
dam
The
Nethe
rland
s
14 2.
33
10
The
Universi
ty of
Hong
Kong
Hong
Kong 20
2.
30
Univer
sity
of
Sheffi
eld
USA 22 2.
44
Univer
sity
of
Essex
UK 26 2.
99
Univer
sity
of
Chicag
o
USA 14 2.
33
11
Australi
an
National
Universi
ty
Austr
alia 19
5.
14
Sharpe
Consul
ting
(NSW),
USA 19 2.
11
Indian
a
Univer
sity
USA 25 2.
88
Univer
sity
of
Wiscon
sin
USA 13 2.
16
12
College
of
William
and Mary
USA 18 3.
22
Univer
sity
of
Jyvask
yla
Spai
n 18 2
Univer
sity
of
Melbou
rne
Austra
lia
25 2.
88
Columb
ia
Univer
sity
and
New
York
State
USA 12 2
Psychi
atric
Instit
ute
13
Universi
ty of
Wales
Swansea
UK 18 3.
22
Univer
sity
of
Wiscon
sin at
Madiso
n
USA 17 1.
89
Dublin
City
Univer
sity
Irelan
d
23 2.
64
Univer
sity
of
Albert
a
Canad
a
12 2
14
American
Universi
ty
USA 16 1.
84
Arizon
a
State
Univer
sity,
USA
14
1.
56
Univer
sity
of
Oxford
UK 23 2.
64
Univer
sity
of
Manche
ster
UK 12 2
15
Baikal
National
Universi
ty of
Economic
s and
Law
Russi
a 16
1.
84
Nation
al
Instit
ute of
Educat
ion
USA 14 1.
56
New
Mexico
State
Univer
sity
USA 21 2.
47
Univer
sity
of
Nijmeg
en
The
Nethe
rland
s
12 2
16
Universi
ty of
Sheffiel
d
UK 16 1.
84
Univer
sity
of
Leeds
UK 14 1.
56
Lancas
ter
Univer
sity
UK 19 2.
19
North
Univer
sity
Avenue
Canad
a 10
1.
66
17
The Open
Universi
ty
UK 14 1.
61
Univer
sity
of New
Englan
d
UK 14 1.
56
Univer
sity
of
Portsm
outh
UK 15 1.
72
Oxford
Univer
sity
UK 10 1.
66
18
Universi
dad de
Cádiz
Spain 14 1.
61
Columb
ia
Univer
sity
Cana
da 13
1.
44
Univer
sity
of
London
UK 14 1.
62
Univer
sity
of
Califo
rnia
Rivers
ide
USA 10 1.
66
19
Universi
ty of
Californ
ia
USA 14 1.
61
Northe
rn
Arizon
a
Univer
sity
UK 13 1.
44
Univer
sity
of
Southa
mpton
UK 14 1.
62
Univer
sity
of
Ottawa
Canad
a
10 1.
66
20
National
Universi
ty of
Singapor
e
Singa
pore 13
1.
49
Univer
sitat
Autòno
ma de
Barcel
ona
USA 13 1.
44
Univer
sity
of
Wiscon
sin
USA 13 1.
49
Univer
sity
of
Tennes
see
USA 10 1.
66
Total Publication of
20 Institutions 465
51
.6
6
Total
Publication
of 20
Institutions
474
52
.6
6
Total
Publication of
20 Institutions
575
63
.8
8
Total
Publication of
20
Institutions
309 51
.5
Oth
ers
130
Institut
ions
*
432 48
107
Instit
utions
* 401
44
.5
5
136
Instit
utions
* 293
32
.5
5
51
Instit
utions
* 245
40
.8
3
Tot
al
Data not
Availabl
e on
Inst.
*
03
0.
33
Total
Data
not
Avai
labl
e on
Inst
25
2.
77
Data
not
Availa
ble on
Inst.(
13)
* 32 3.
55
Data
not
availa
ble on
Inst.(
9)
* 46 7.
66
.
Gra
nd
Tot
al
* 900 10
0
Grand
Total * 900
10
0
Grand
Total
Instit
utions
(169)
900 10
0
Grand
Total:
Instit
utions
(80)
* 600 10
0
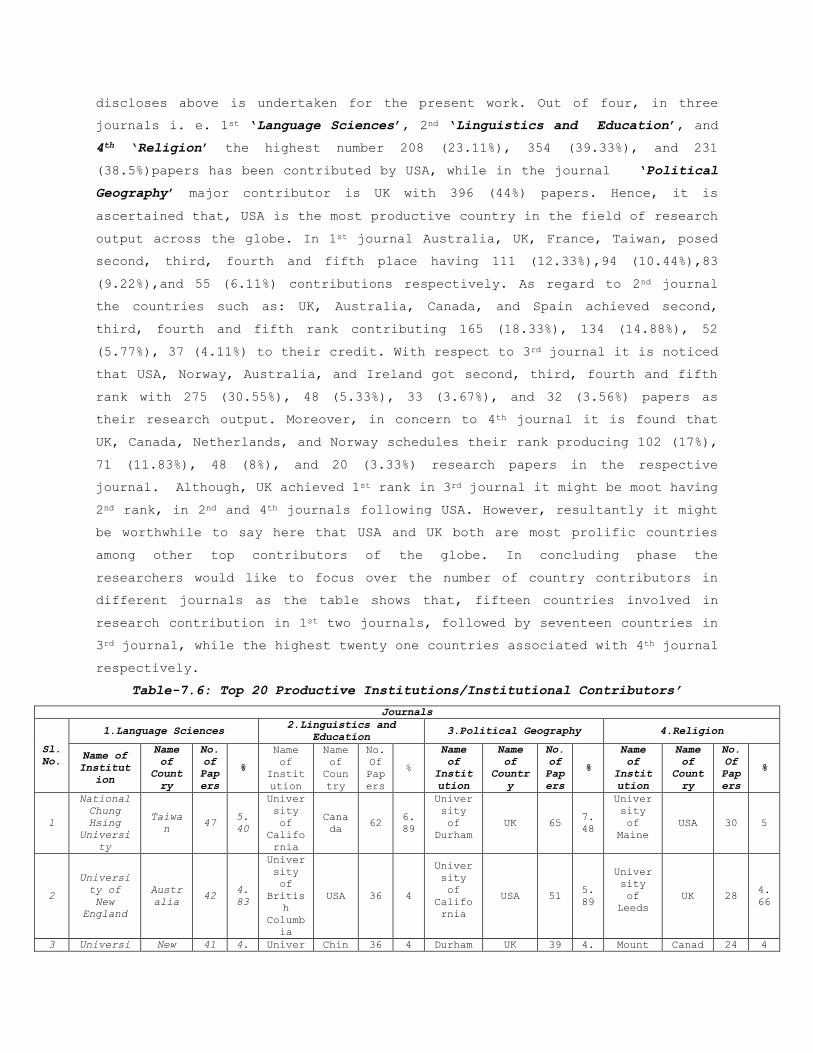
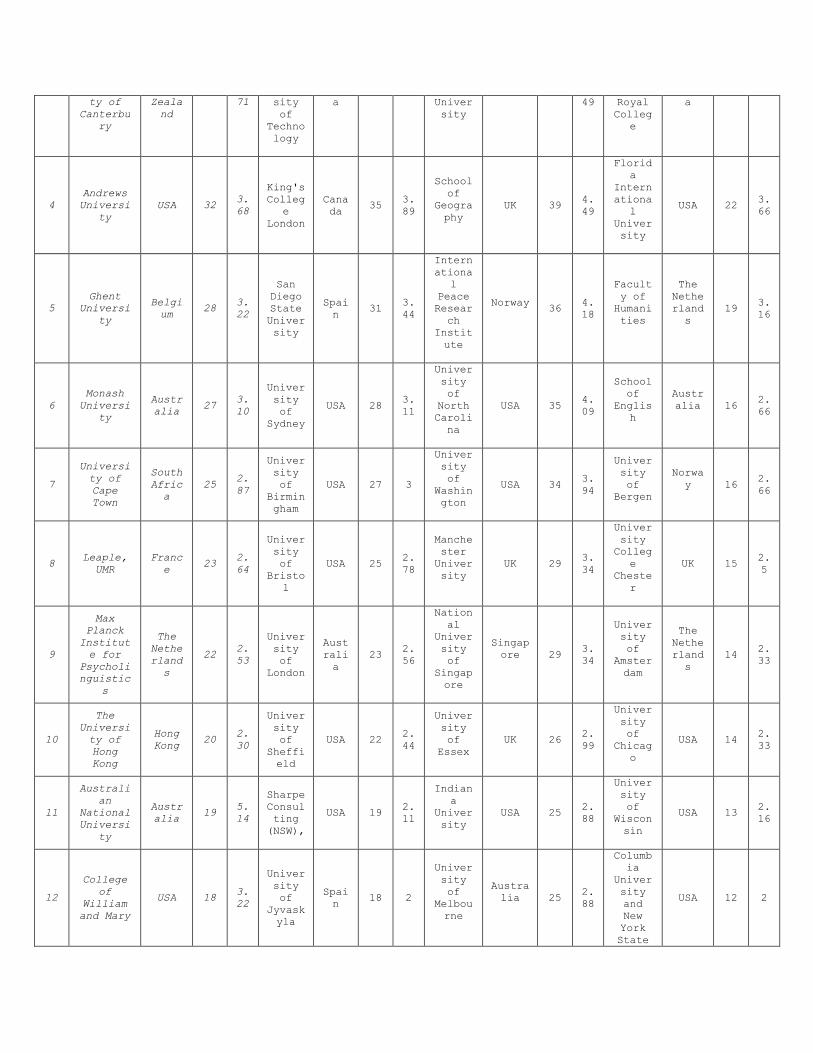
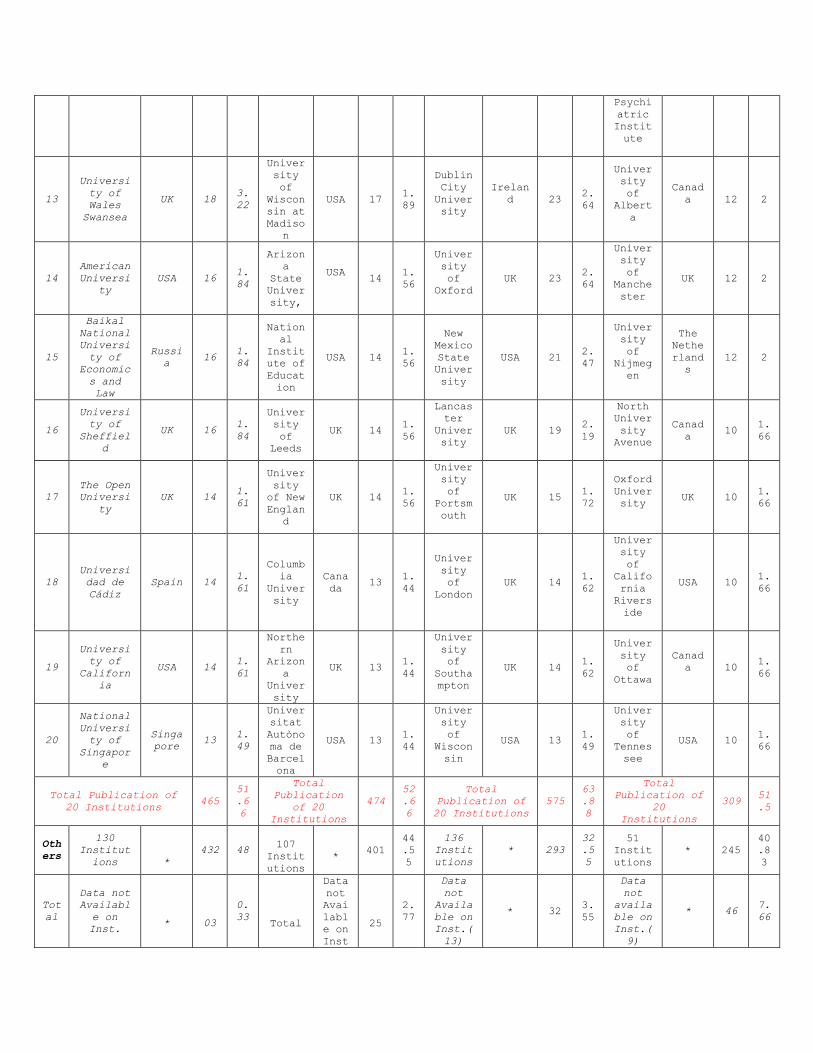
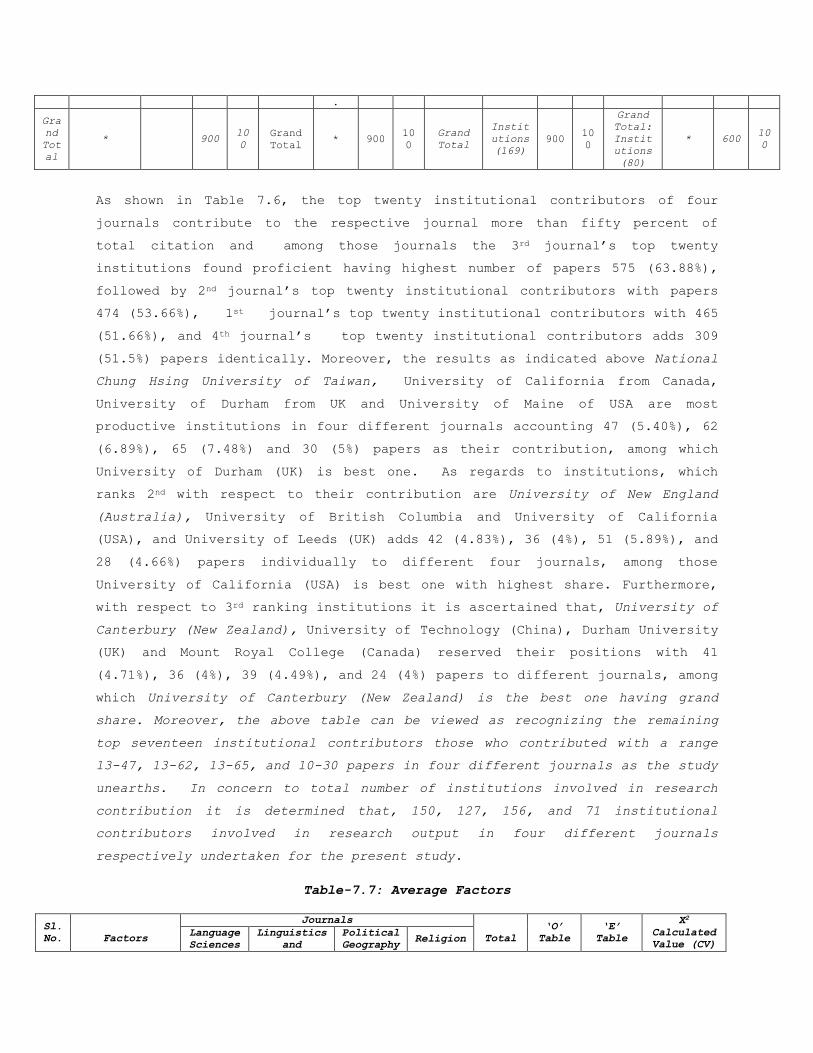
As shown in Table 7.6, the top twenty institutional contributors of four
journals contribute to the respective journal more than fifty percent of
total citation and among those journals the 3rd journal’s top twenty
institutions found proficient having highest number of papers 575 (63.88%),
followed by 2nd journal’s top twenty institutional contributors with papers
474 (53.66%), 1st journal’s top twenty institutional contributors with 465
(51.66%), and 4th journal’s top twenty institutional contributors adds 309
(51.5%) papers identically. Moreover, the results as indicated above National
Chung Hsing University of Taiwan, University of California from Canada,
University of Durham from UK and University of Maine of USA are most
productive institutions in four different journals accounting 47 (5.40%), 62
(6.89%), 65 (7.48%) and 30 (5%) papers as their contribution, among which
University of Durham (UK) is best one. As regards to institutions, which
ranks 2nd with respect to their contribution are University of New England
(Australia), University of British Columbia and University of California
(USA), and University of Leeds (UK) adds 42 (4.83%), 36 (4%), 51 (5.89%), and
28 (4.66%) papers individually to different four journals, among those
University of California (USA) is best one with highest share. Furthermore,
with respect to 3rd ranking institutions it is ascertained that, University of
Canterbury (New Zealand), University of Technology (China), Durham University
(UK) and Mount Royal College (Canada) reserved their positions with 41
(4.71%), 36 (4%), 39 (4.49%), and 24 (4%) papers to different journals, among
which University of Canterbury (New Zealand) is the best one having grand
share. Moreover, the above table can be viewed as recognizing the remaining
top seventeen institutional contributors those who contributed with a range
13-47, 13-62, 13-65, and 10-30 papers in four different journals as the study
unearths. In concern to total number of institutions involved in research
contribution it is determined that, 150, 127, 156, and 71 institutional
contributors involved in research output in four different journals
respectively undertaken for the present study.
Table-7.7: Average Factors
Sl.
No.
Factors
Journals
Total
‘O’
Table
‘E’
Table
X2
Calculated
Value (CV)
Language
Sciences
Linguistics
and
Political
Geography Religion
Education
1 Avg. Citations
per Paper 08 10.12 94.77 28.26 141.15 08 26.39 12.81
2
Avg. Papers
per Unique
Author
4.20 4.36 4.61 4.08 17.25 4.20 3.22 0.29
3
Avg. Authors
per Paper (All
Authors)
1.34 1.36 1.42 1.28 5.4 1.34 1.00 0.11
4
Avg. Authors
per Paper
(Unique
Authors)
0.22 0.22 0.21 0.24 0.89 0.22 0.16 0.02
5
Avg. Page
length per
paper
23.70 19.35 21.33 17.28 81.66 23.70 15.26 4.66
6
Avg. Papers
per Year
(considering
year of
publication of
papers in
source
journal)
47.36
50
45
46.15 188.51
47.36
35.24 4.16
7
Avg. Papers
per
Institution
(Unique)
5.88 5.92 5.32 7.5 24.62 5.88 4.60 0.35
8
Avg. Papers
per Country
(Unique)
23.07 47.36 50 28.57 149 23.07 27.85 0.82
Total 113.77 138.69 222.66 133.36 608.48 10.12 32.17 15.11
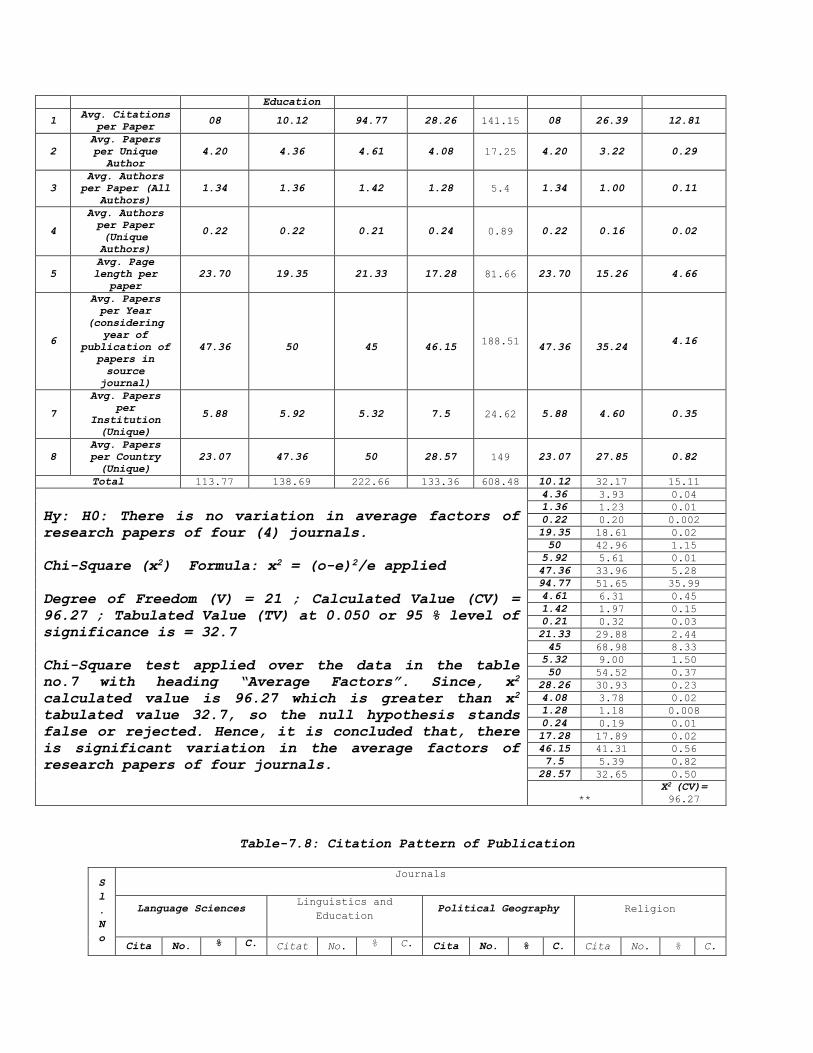
Hy: H0: There is no variation in average factors of
research papers of four (4) journals.
Chi-Square (x2) Formula: x2 = (o-e)2/e applied
Degree of Freedom (V) = 21 ; Calculated Value (CV) =
96.27 ; Tabulated Value (TV) at 0.050 or 95 % level of
significance is = 32.7
Chi-Square test applied over the data in the table
no.7 with heading “Average Factors”. Since, x2
calculated value is 96.27 which is greater than x2
tabulated value 32.7, so the null hypothesis stands
false or rejected. Hence, it is concluded that, there
is significant variation in the average factors of
research papers of four journals.
4.36 3.93 0.04
1.36 1.23 0.01
0.22 0.20 0.002
19.35 18.61 0.02
50 42.96 1.15
5.92 5.61 0.01
47.36 33.96 5.28
94.77 51.65 35.99
4.61 6.31 0.45
1.42 1.97 0.15
0.21 0.32 0.03
21.33 29.88 2.44
45 68.98 8.33
5.32 9.00 1.50
50 54.52 0.37
28.26 30.93 0.23
4.08 3.78 0.02
1.28 1.18 0.008
0.24 0.19 0.01
17.28 17.89 0.02
46.15 41.31 0.56
7.5 5.39 0.82
28.57 32.65 0.50
**
X2 (CV)=
96.27
Table-7.8: Citation Pattern of Publication
S
l
.
N
o
Journals
Language Sciences Linguistics and
Education Political Geography Religion
Cita No. % C. Citat No. % C. Cita No. % C. Cita No. % C.
. tion
Patt
ern
of
pap
ers
F. ion
Patte
rn
of
pap
ers
F. tion
Patt
ern
of
pap
ers
F. tion
Patt
ern
Of
pap
ers
F.
1 1-25 853 94.
78
85
3 1-25 734
81.
56
73
4 1-25 167
18.
56
16
7 1-25 508
64.
66
50
8
2 26-
50 37
4.1
1
89
0 26-50 57
6.3
3
79
1
26-
50 191
21.
22
35
8
26-
50 5
0.8
3
51
3
3 51-
75 10
1.1
1
90
0 51-75 22
2.4
4
81
3
51-
75 176
19.
56
53
4
51-
75 4
0.6
6
51
7
4
Gran
d
Tota
l
900 100 90
0
Data
not
avail
able
87 9.6
7
90
0
76-
100 94
10.
44
62
8
76-
100 11
1.8
3
52
8
5 Grand
Total 900 100
90
0
101-
125 59
6.5
6
68
7
101-
125 3 0.5
53
1
6 126-
150 7
0.7
8 64
126-
150 * * *
7 151-
175 53
5.8
9
74
7
151-
175 1
0.1
6
53
2
8 176-
200 * * *
176-
200 * * *
9
201
and
abov
e
130 14.
44
87
7
201
and
abov
e
6 1 53
8
No
Cita
tion
Data
23 2.5
6
90
0
No
Cita
tion
Data
62 10.
33
60
0
Gran
d
Tota
l
900 100 90
0
Gran
d
Tota
l
600 100 60
0
Table-7.8.1: Application of Chi-Square (x2) test over table (8)
“O”
Table
“E”
Table
X2 Calculated
Value (CV)
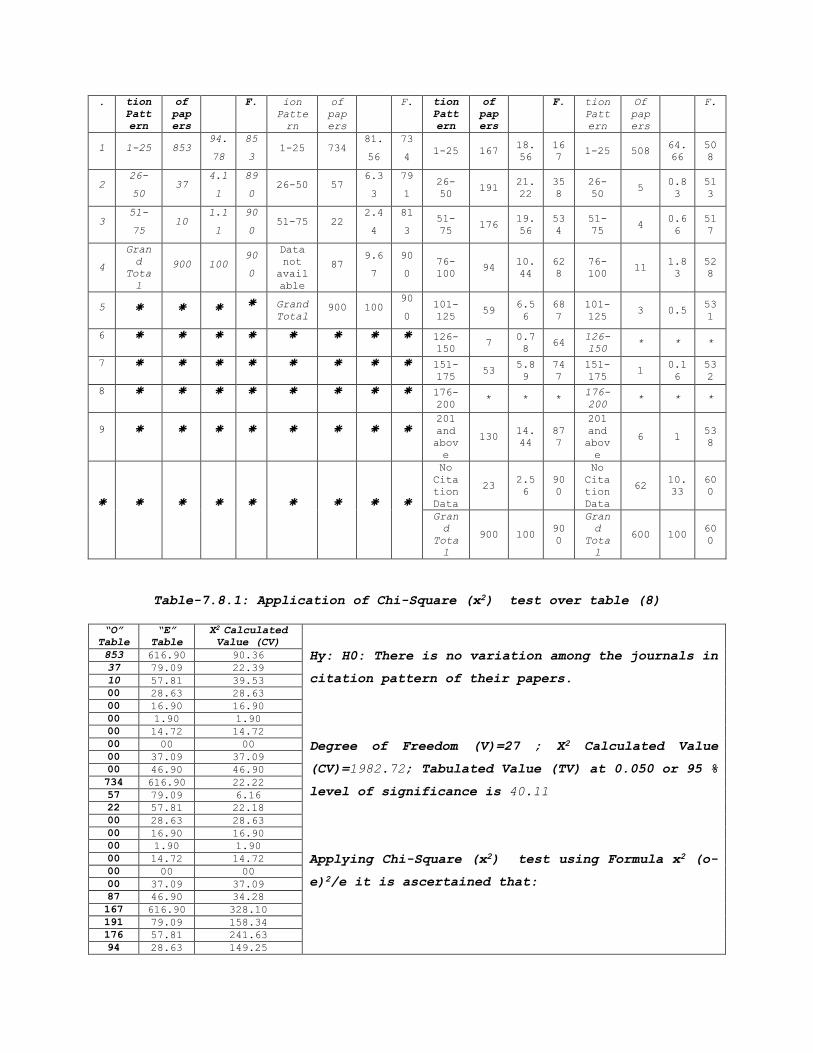
Hy: H0: There is no variation among the journals in
citation pattern of their papers.
Degree of Freedom (V)=27 ; X2 Calculated Value
(CV)=1982.72; Tabulated Value (TV) at 0.050 or 95 %
level of significance is 40.11
Applying Chi-Square (x2) test using Formula x2 (o-
e)2/e it is ascertained that:
853 616.90 90.36
37 79.09 22.39
10 57.81 39.53
00 28.63 28.63
00 16.90 16.90
00 1.90 1.90
00 14.72 14.72
00 00 00
00 37.09 37.09
00 46.90 46.90
734 616.90 22.22
57 79.09 6.16
22 57.81 22.18
00 28.63 28.63
00 16.90 16.90
00 1.90 1.90
00 14.72 14.72
00 00 00
00 37.09 37.09
87 46.90 34.28
167 616.90 328.10
191 79.09 158.34
176 57.81 241.63
94 28.63 149.25
59 16.90 104.87 At (0.050) 95% level of significance X2 tabulated
value is 40.11, while calculated value is 1982.72.
As calculated value of X2 is greater than tabulated
value the hypothesis stands false or rejected which
means the citation pattern of papers of all four
journals are significantly varied from each other.
07 1.90 13.68
53 14.72 99.54
00 00 00
130 37.09 232.73
23 46.90 12.17
508 411.27 22.75
05 52.72 43.19
04 38.54 30.95
11 19.09 3.42
03 11.27 6.06
00 1.27 1.27
01 9.81 7.91
00 00 00
06 24.72 14.17
62 31.27 30.19
Calculated
Value
(CV)=1982.72
Table-7.9: Pagination Pattern of Papers
Sl.
No.
L a n g u a g e S c i e n c e s Linguistics and Education P o l i t i c a l G e o g r a p h y R e l i g i o n
Pattern of Pagination No. of papers % C.F. Pattern of Pagination No. of papers % C.F. Pattern of Pagination No. of papers % C.F. Pattern of Pagination No. of papers % C.F.
1 1 - 5 2 0 2.22 2 0 1 - 5 1 8 2 1 8 1 - 5 1 8 2 1 8 1 - 5 3 8 6.33 3 8
2 6 - 1 0 6 0 6.67 8 0 6 - 1 0 1 5 1.67 3 3 6 - 1 0 5 9 6.56 7 7 6 - 1 0 8 4 1 4 122
3 1 1 - 1 5 2 4 2 26.89 322 1 1 - 1 5 2 9 7 3 3 330 1 1 - 1 5 7 5 8.33 152 1 1 - 1 5 1 7 2 28.66 294
4 1 6 - 2 0 1 8 6 2.06 508 1 6 - 2 0 2 7 3 30.33 603 1 6 - 2 0 2 0 7 2 3 359 1 6 - 2 0 1 4 1 23.5 435
5 2 1 - 2 5 1 4 0 15.56 648 2 1 - 2 5 1 5 0 16.67 753 2 1 - 2 5 3 1 0 34.44 669 2 1 - 2 5 9 9 16.5 534
6 2 6 - 3 0 8 3 9.22 731 2 6 - 3 0 6 6 7.33 819 2 6 - 3 0 1 6 6 18.44 835 2 6 - 3 0 4 7 7.83 581
7 31 and above 1 6 9 18.78 900 31 and above 8 1 3.44 900 31 and above 6 5 7.22 900 31 and above 1 9 3.16 600
G r a n d T o t a l 9 0 0 100 900 Grand Total 9 0 0 100 900 Grand Total 9 0 0 100 900 Grand Total 6 0 0 100 600
Table-7.9.1: Application of Chi-Square (x2) test over table (9)
“O”
Table
“E”
Table
X2 Calculated
Value (CV)
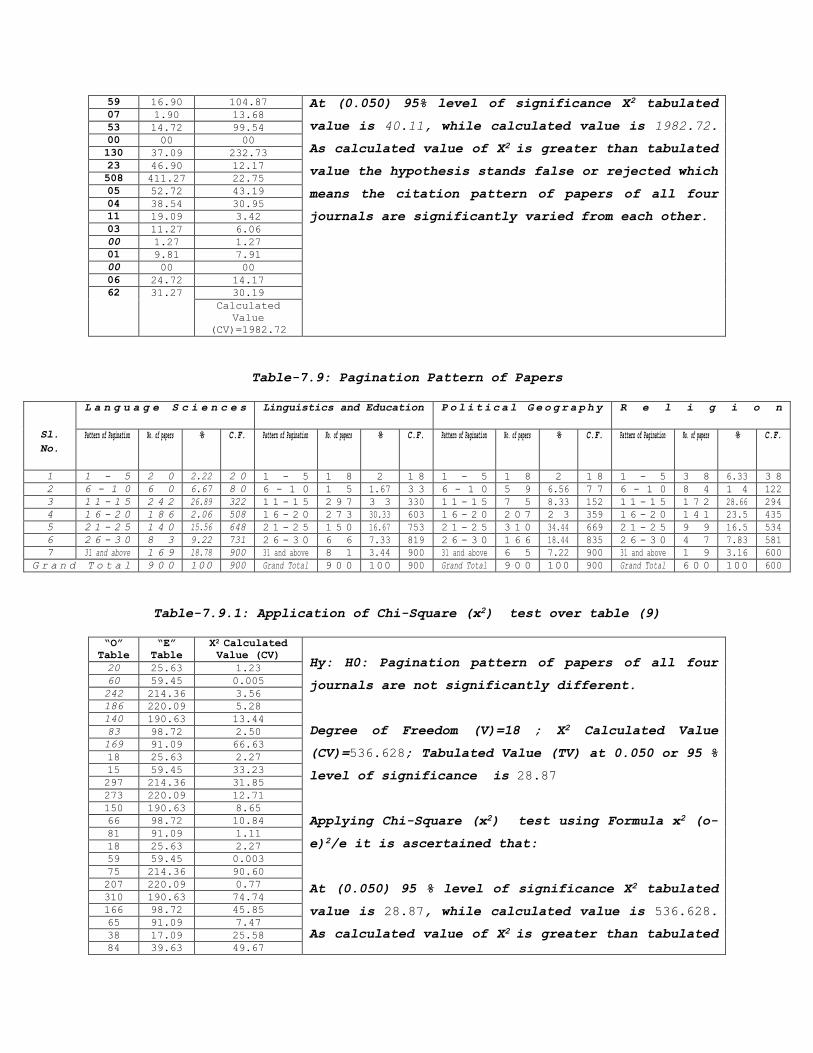
Hy: H0: Pagination pattern of papers of all four
journals are not significantly different.
Degree of Freedom (V)=18 ; X2 Calculated Value
(CV)=536.628; Tabulated Value (TV) at 0.050 or 95 %
level of significance is 28.87
Applying Chi-Square (x2) test using Formula x2 (o-
e)2/e it is ascertained that:
At (0.050) 95 % level of significance X2 tabulated
value is 28.87, while calculated value is 536.628.
As calculated value of X2 is greater than tabulated
20 25.63 1.23
60 59.45 0.005
242 214.36 3.56
186 220.09 5.28
140 190.63 13.44
83 98.72 2.50
169 91.09 66.63
18 25.63 2.27
15 59.45 33.23
297 214.36 31.85
273 220.09 12.71
150 190.63 8.65
66 98.72 10.84
81 91.09 1.11
18 25.63 2.27
59 59.45 0.003
75 214.36 90.60
207 220.09 0.77
310 190.63 74.74
166 98.72 45.85
65 91.09 7.47
38 17.09 25.58
84 39.63 49.67
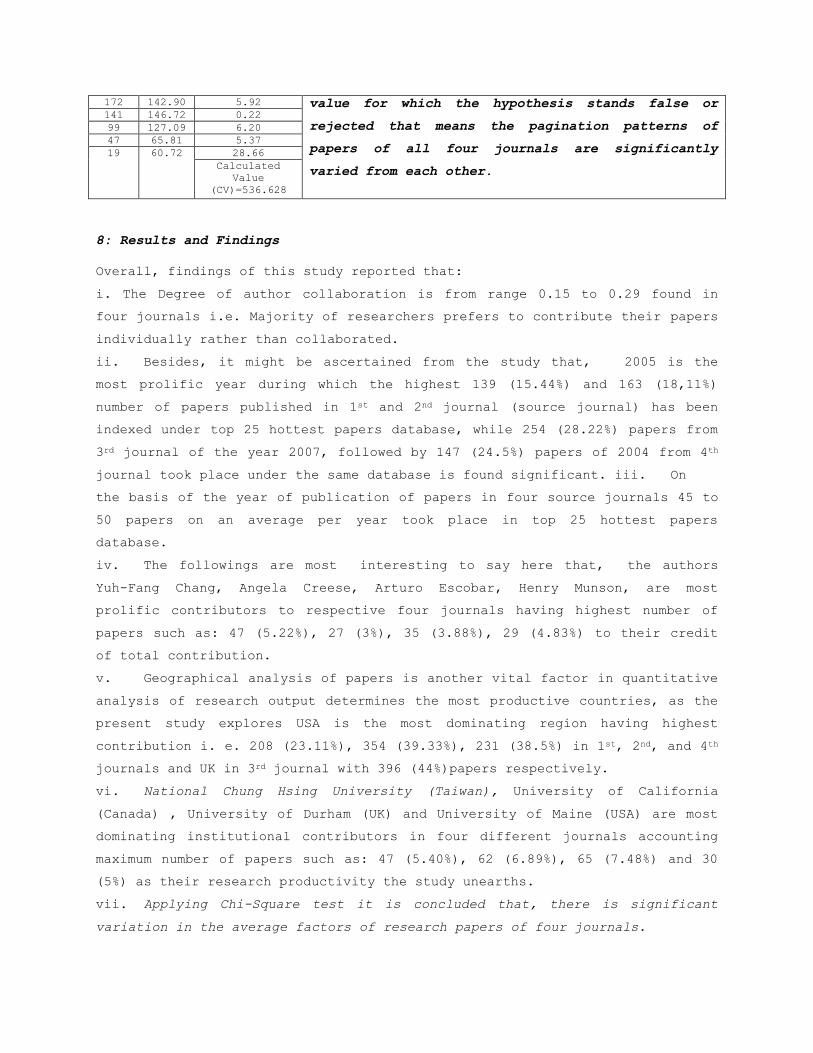
172 142.90 5.92 value for which the hypothesis stands false or
rejected that means the pagination patterns of
papers of all four journals are significantly
varied from each other.
141 146.72 0.22
99 127.09 6.20
47 65.81 5.37
19 60.72 28.66
Calculated
Value
(CV)=536.628
8: Results and Findings
Overall, findings of this study reported that:
i. The Degree of author collaboration is from range 0.15 to 0.29 found in
four journals i.e. Majority of researchers prefers to contribute their papers
individually rather than collaborated.
ii. Besides, it might be ascertained from the study that, 2005 is the
most prolific year during which the highest 139 (15.44%) and 163 (18,11%)
number of papers published in 1st and 2nd journal (source journal) has been
indexed under top 25 hottest papers database, while 254 (28.22%) papers from
3rd journal of the year 2007, followed by 147 (24.5%) papers of 2004 from 4th
journal took place under the same database is found significant. iii. On
the basis of the year of publication of papers in four source journals 45 to
50 papers on an average per year took place in top 25 hottest papers
database.
iv. The followings are most interesting to say here that, the authors
Yuh-Fang Chang, Angela Creese, Arturo Escobar, Henry Munson, are most
prolific contributors to respective four journals having highest number of
papers such as: 47 (5.22%), 27 (3%), 35 (3.88%), 29 (4.83%) to their credit
of total contribution.
v. Geographical analysis of papers is another vital factor in quantitative
analysis of research output determines the most productive countries, as the
present study explores USA is the most dominating region having highest
contribution i. e. 208 (23.11%), 354 (39.33%), 231 (38.5%) in 1st, 2nd, and 4th
journals and UK in 3rd journal with 396 (44%)papers respectively.
vi. National Chung Hsing University (Taiwan), University of California
(Canada) , University of Durham (UK) and University of Maine (USA) are most
dominating institutional contributors in four different journals accounting
maximum number of papers such as: 47 (5.40%), 62 (6.89%), 65 (7.48%) and 30
(5%) as their research productivity the study unearths.
vii. Applying Chi-Square test it is concluded that, there is significant
variation in the average factors of research papers of four journals.
viii. Applying Chi-Square (x2) test using Formula x2 (o-e)2/e it is
ascertained that: the citation pattern of papers of all four journals are
significantly varied from each other.
ix. Chi-Square (x2) test applied over Pagination pattern of papers and
resultantly found that, the pagination patterns of papers of all four
journals are significantly varied from each other.
9: Conclusion
This study served to develop a greater understanding of the characteristics
of scholarly publications over multiple years. Additionally, by comparing the
four different journals’ research output, the present study confirms the
characteristics, features, and patterns of research papers from various
angles to reflect the strength and weakness at the arena of global research.
Since the vast majority of papers are found single authored, the authors’
collaboration is dominated in research practices the study explores.
Furthermore, the study discovers, USA is the most productive geographical
region, followed by UK from the geographical and institutional contributors’
point of view. As the data collected for the present research encompasses a
definite period requires further research all over the globe in succeeding
decades adding more journals and years of publication of papers under the
gamut of new research work. As a concluding remark the investigators
earnestly hope and expect the study would be a promising platform for the
forthcoming researchers, scholars and library practitioners for their
research and day-to-day library activities to promote and support the
practices.
References:
1. Dutt, B., Garg, K.C., & Bali, A. 2003. Scientometrics of the
international journal Scientometrics.Scientometrics, Vol. 56, no.1: 81-
93.
2. Sethi, B B and Panda, K. C. 2014. Measuring Research Excellence with
two journals in Social Sciences: A Scientometric sketch. Library
Philosophy and Practice, paper 1051. (Available at:
http://digitalcommons.unl.edu/libphilprac/1051)
3. Lipetz, B-A. 1999. Aspects of JASIS authorship through five decades.
Journal of the American Society for Information Science and Technology,
Vol.50, no. 11: 994-1003.
4. Mukherjee, B. 2008. Scholarly literature from selected universities of
Delhi and Uttar Pradesh: A pilot study. LIBRES, Vol.18, no. 1.
Retrieved from
http://libres.curtin.edu.au/libres18n1/Mukherjee_Final_rev.pdf
5. Subramanyam, K. 1982. Bibliometric Study of Research Collaboration: A
Review. Journal of Information Science, Vol.6, no.1: 33-38.
6. Thanuskodi, S.2010. Journal of Social Science: A Bibliometric Study.
Journal of Social Science, Vol.24, no. 2: 77-80.
7. Tian, Y., Wen, C., & Hong, S. 2008. Global scientific production on GIS
research by bibliometric analysis from 1997 to 2006. Journal of
Informetrics,Vol. 2: 65–74. Available online at www.sciencedirect.com
8. http://en.wikipedia.org/wiki/Bibliometrics
9. http://en.wikipedia.org/wiki/Scientometrics/
Copyright © 2022 FDOKUMEN