reading the periodical essay in - RUcore - Rutgers University
Upload
independentCategory
view
1download
0
Condensed Matter Physics 2007, Vol. 10, No 2(50), pp. 129–141
Towards journalometrical analysis of a scientificperiodical: a case study
O.Mryglod1,2, Yu.Holovatch2,3
1 Lviv Polytechnic National University, 12 Bandery Str., 79013 Lviv, Ukraine2 Institute for Condensed Matter Physics of the National Academy of Sciences of Ukraine,
1 Svientsitskii Str., 79011 Lviv, Ukraine3 Institut fur Theoretische Physik, Johannes Kepler Universitat Linz, 69 Altenbergerstr., 4040 Linz, Austria
Received May 29, 2007
In this paper we use several approaches to analyse a scientific journal as a complex system and to make apossibly more complete description of its current state and evolution. Methods of complex networks theory,statistics, and queueing theory are used in this study. As a subject of the analysis we have chosen the journal“Condensed Matter Physics” (http://www.icmp.lviv.ua). In particular, based on the statistical data regarding thepapers published in this journal since its foundation in 1993 up to now we have composed the co-authorshipnetwork and extracted its main quantitative characteristics. Further, we analyse the priorities of scientific trendsreflected in the journal and its impact on the publications in other editions (the citation ratings). Moreover, tocharacterize an efficiency of the paper processing, we study the time dynamics of editorial processing in termsof queueing theory and human activity analysis.
Key words: complex systems, complex networks, co-authorship network, journal evaluation, humandynamics
PACS: 02.10.Ox, 02.50.-r, 07.05.Kf, 89.75.-k
1. Introduction
It is a honor and pleasure for us to contribute by our paper to the jubilant fiftieth issue ofthe journal “Condensed Matter Physics” (CMP) [1]. The history of this journal began in 1993when it was founded by the Institute for Condensed Matter Physics of the National Academyof Sciences of Ukraine. Soon the journal transformed into an international periodical, which iscurrently recognized by the European Physical Society (since 2003) and is covered by ISI MasterJournal List (since August, 2005). Since the time of its foundation, 671 papers by authors from44 countries have been published in the journal, see figure 1. The jubilee of the CMP is a goodincentive to present the results of the statistical analysis of its publications, paying attentionto their different features, ranging from their content, collaboration trends of the authors to theefficiency of the paper processing procedure. Recently, a new term, journalometry, has appeared forthe complex quantitative analysis of scientific periodicals [2]. In particular, this complex approachmakes it possible to take into account different types of information about the journal, rangingfrom the quantitative to the qualitative ones [3].
Another reason for analysing the statistics of publications in a scientific journal is that such ananalysis permits to shed light on different features of human activities as well as to quantify them.To give an example, applying a complex network theory [4] to the analysis of co-authorship of thepapers published, one deals with a collaboration network, a subject of interest in social disciplines.Similar tools applied to the analysis of the distribution of references that appear in the paperspublished, lead to the so-called citation network, an example of information networks. Moreover,as we shall discuss in our paper, the analysis of distribution of the waiting times of the paperssubmitted to the journal is useful in understanding the origin of particular features of humandynamics [5–10]. Although the analysed database allows us to make certain conclusions about
c© O.Mryglod, Yu.Holovatch 129
O.Mryglod, Yu.Holovatch
the statistical properties of the values considered, one should be aware of the natural limitationsimposed by the finiteness of data set – a typical situation, when a particular periodical is studied.
Figure 1. An international collaboration of authors in “Condensed Matter Physics”. During theperiod of 1993–2007 the authors from 44 countries contributed to the journal.
The structure of our paper is as follows. In the rest of this section we shall describe the databaseof CMP publications we constructed. Section 2 is devoted to the analysis of the content of paperspublished in CMP. First, we address the authors of the papers and construct the co-authorshipnetwork, measuring its main characteristics. Then, we briefly discuss the main thematic trendsof the papers published and the way these papers are cited in other periodicals. In section 3 weapproach the analysis of the journal from another viewpoint. Here, the subject of our analysisis not the content of a given paper but rather the way the paper is processed by the editorialboard. In particular, we analyse the statistics of time intervals between submission of a paperand its acceptance and interpret the obtained results in terms of queuing theory. Conclusions andoutcome are given in section 3.
Before passing to a more detailed analysis of publications in CMP, let us briefly describe thestructure of the database we used as well as display several general characteristics that follow fromthe database analysis. The structure of the database is shown in figure 2. It contains informationabout (i) the authors and their affiliation, (ii) the content of the papers published in CMP, as wellas (iii) the data regarding the papers cited in CMP. In what follows, we shall make use of the twofirst parts of the database, the last one, (iii), will be considered elsewhere.
During the period analysed, 892 authors published 671 papers in 49 issues of CMP, 477 authorsbeing from Ukraine (where the publishing institution is located) and 415 being from other countries.The international cooperation increased with time. More than a half of all papers during the last3 years were written by at least one foreign author (figure 3). The decreasing rank of internationalco-authorship in CMP journal is as follows: Germany (39 common papers), Poland (27), Japan(23), Russia (22), USA (22), Austria (15), France(12) etc. However, the data from the ISI database(Web of Science, [11]) about the external citation of CMP journal between 1993 and 2006 showed1
that the authors from other countries cited the papers from CMP in the following decreasing order:USA (13.45% of all citations), Germany (12.48%), France (9.75%), Italy (8.58%), Poland (8%),Austria (4.68%), England (4.1%), Russia (4.1%) etc. The maximum number of all coauthors inCMP per one person is 25 and the most active author has 29 publications here. 67 authors had no
1The analysis was performed in October, 2006
130

Analysis of a scientific periodical: a case study
Figure 2. The structure of “Condensed Matter Physics” journal’s database.
Figure 3. The number of papers published in CMP by only Ukrainian, only foreign author(s)and joint publications.
coauthors in CMP at all.
Now, with the above described database at hand we shall perform a more detailed analysis ofthe statistical parameters of the CMP publications trying to find internal relationships betweendifferent parameters and their time dynamics.
2. Analysis of the content of the papers: co-authorship and fi eldsof research
In this section, we shall analyse several features connected with the content of the paperspublished in CMP. Let us start from the analysis of the authorship of the papers. To this end it is
131
O.Mryglod, Yu.Holovatch
reasonable to apply the tools of the complex networks theory [4], a field that originates from (andstill may be considered as a part of) graph theory. Complex networks were paid much attentionat the end of 1990-ies, when it appeared that many network-like structures that exist in nature orresult from human activities possess remarkable properties which were not explained within thethen available mathematical framework. The most striking ones were the so-called small-world andscale-free features. In many networks the average distance between any pair of nodes 〈`〉 appearedto be very small compared to the network size N (more precisely, the network is said to possesssmall-world properties when 〈`〉 grows with N slower than Na, a > 0). Correspondingly, if thenode degree distribution P (k) of a network is governed by a power law, the network is said to bescale-free.
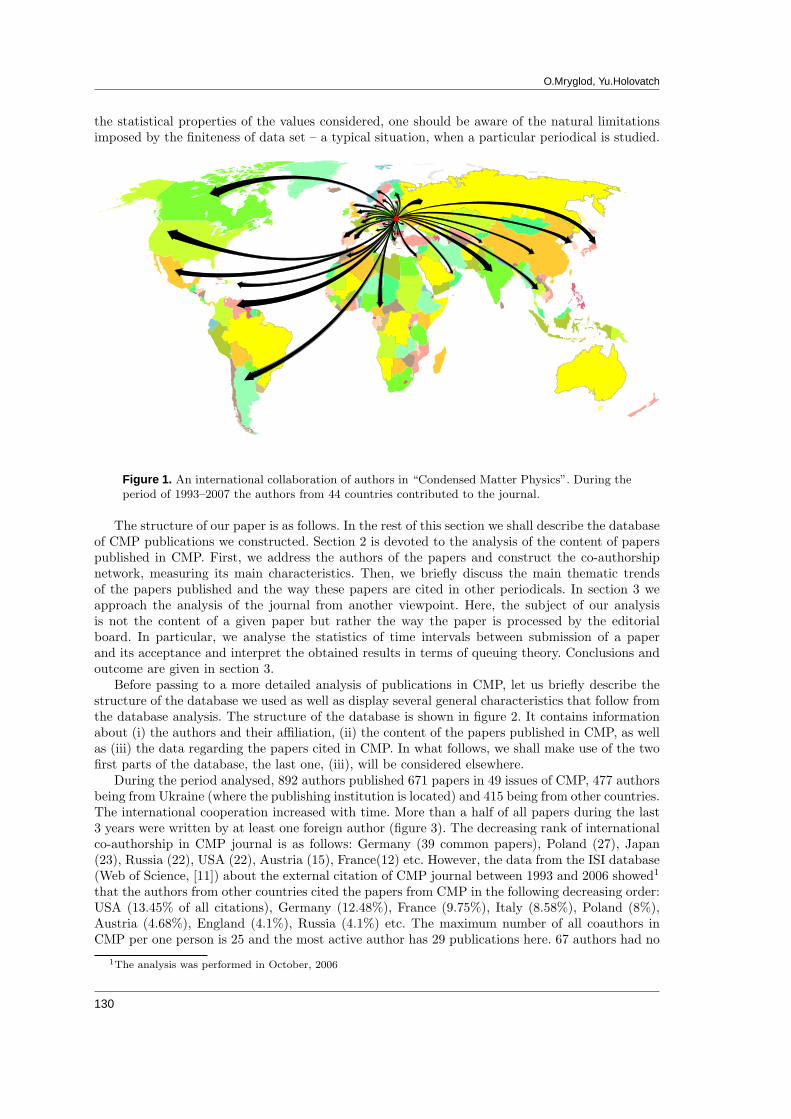
Figure 4. An example of a co-authorship graph. In this cluster adegree of (number of links attachedto) the central node is equal to six.Lines of different thickness representthe number of common papers.
The co-authorship network we are going to consider isone of the examples of collaboration networks. In turn, thelatter belong to a special kind of social networks whichrepresent human collaboration patterns. Though social net-works have a large history, the collaboration networks havea more precise definition of connectivity and much moredata [12]. A special feature of collaboration networks isthe possibility of documenting all the facts of collabora-tion. In a collaboration network, the particular individu-als, groups of people or even organizations can be repre-sented by nodes, which are connected by links (differenttypes of interactions between people). An example of a co-authorship graph from CMP is given in figure 4. The nodesof the graph correspond to the authors and a link betweentwo nodes means that the two scientists represented havecoauthored a paper in CMP. Different ways of links weighting can be performed: in non-weighednetworks link means at least one common paper for two authors; multiple lines or lines of differentthickness can represent the number of common papers, as it is done in figure 4; in addition, the col-laboration strength of a link can be considered (for example, the strength of collaboration betweentwo authors is taken to be stronger than between three authors) [13]. The results of investigationsof scientific co-authorship networks have been presented in numerous papers. Collaboration graphsfor scientists were constructed for a variety of fields based on the large databases: MEDLINE(published papers on biomedical research), the Los Alamos e-Print Archive (preprints in theoreti-cal physics), databases maintained by the Mathematical Reviews journal (mathematical papers),NCSTRL (preprints in computer science) [12,13], SPIRES (papers and preprints in high-energyphysics) [14] etc. The sizes of these databases range from 2 million papers to 13,000. The analysisshowed that co-authorship networks have the features of scale-free small-worlds: they have a shortmean distance between any two nodes, a large clustering coefficient, and node-degree distributionsclose to a power law. Actually, the distributions of such networks are well fitted by power lawswith an exponential cutoff. One of the possible explanations of this cutoff is the finite set of dataand the natural limitations on the active working lifetime of a professional scientist [12].
The general number of nodes in co-authorship networks varies between scientific fields, theirwide or narrow specializations and periods of existence [12]. On the other hand, the average numberof co-authors per one paper to a greater degree depends on its type (experimental or theoretical).Naturally, theoretical papers usually have a rather small numbers of coauthors, compared with theexperimental papers [14]. Besides, in the experimental science the general number of collaboratorsis larger. As regards the CMP, we can clearly see the theoretical character of the journal: theaverage number of co-authors per paper is equal to 2 and its maximum value is 8.
The co-authorship network based on the relatively small database consists of separate groupsof connected nodes (clusters). These fragments of the network can group the authors that work inthe same field of science. In each cluster every node can be reached from any other node. With thegrowth of the size of the network, separate clusters tend to join. At some moment, there appearsa giant cluster which includes almost all the nodes (a giant component). The analysis of different
132

Analysis of a scientific periodical: a case study
Figure 5. Visualization of the co-authorship network (892 nodes) of the CMP journal (1993–2007). Three different fragments can be distinguished: the main cluster with 219 nodes (at theupper left), the next-largest clusters with 15 nodes (top right and bottom left). The rest ofthe nodes are collected on the right below. The network was generated using Pajek networkvisualization software [15].
co-authorship networks showed that the main cluster includes approximately 80% or 90% of allthe nodes [12,13]. The existence of such a cluster allows us to connect almost all the authors byone or several chains of intermediate collaborators. The high level of connectedness provides a fastspread of new scientific information and shows intensive private interactions between scientists. It isinteresting that the second-largest connected cluster is far smaller than the largest one. In figure 5we show the co-authorship network of the CMP journal. The intensity of each co-authorship, definedby the number of common papers, is shown by lines of different thickness. The main co-authorshipcluster of the CMP journal is shown in figure 6.
Hight clustering is one of the main features of social networks. The clustering of co-authorshipnetworks greatly depends on the number of papers with a few authors which automatically createscycles. Special parameters of a network may characterize its clustering level. To proceed further,let us define the main observables used for a quantitative description of networks [4]. As notedbefore, the degree ki of a node i is the number of the attached edges (see figure 4). The mean nodedegree 〈k〉 characterizes the whole network:
〈k〉 =1
N
N∑
i=1
ki , (1)
where the summation is performed over all N nodes of a network. For a non-weighed co-authorshipnetwork, the mean node degree is the average number of coauthors of a particular scientist. Thenode degree distribution P (k) provides a probability for a node to have a degree equal to k. Theform of the node degree distribution determines the network type. As noted above, the network is
133

O.Mryglod, Yu.Holovatch
Figure 6. The non-weighed main co-authorship cluster of the CMP journal has 219 nodes (ge-neral number of nodes is 892). Nodes with different degree (different number of coauthors inCMP) are denoted by circles of different colours and radii. The visualization was carried outusing Himmeli software [16].
said to be scale-free when its node degree distribution follows a power-law:
P (k) ∼ k−γ , γ > 0. (2)
In our case the node degree distribution is the distribution of the number of collaborators of ascientist. The analysis of co-authorship based on biomedical, physical and mathematical databasesshowed that the corresponding distributions are fat-tailed [13]. The node degree distribution forthe CMP journal is shown in figure 7. In spite of a small number of data points one definitely seesa tendency towards a power law behaviour (2) with an exponent γ ' 3.25. Therefore, we conclude
134

Analysis of a scientific periodical: a case study
that the corresponding network is scale-free.
Figure 7. The node degree distribution of the co-authorship network of the CMP journal.
The clustering coefficient Ci of a node i shows the probability of the nearest neighbours of thisnode to be connected. It is defined as:
Ci =2Ei
ki(ki − 1), (3)
where Ei is the number of the existing connections between the nearest neighbors of the node iof ki degree. Respectively, the mean clustering coefficient 〈C〉 characterizing the whole network isdefined as:
〈C〉 =1
N
N∑
i=1
Ci . (4)
The clustering reflects a special way of network correlation. The clustering coefficient of a completegraph is equal to one, whereas the clustering coefficient of a tree is zero. For the Erdos-Renyiclassical random graph (constituted by N nodes randomly connected by L links) the clusteringcoefficient is equal to:
Cr =2L
N2. (5)
Compared to a random graph, the scale-free networks have a significantly larger value of themean clustering coefficient which proves their high correlation. In table 1 we give the mean value〈C〉 of the CMP journal co-authorship network compared to Cr of the random graph of an equiv-alent size. The clustering coefficient, found for the co-authorship network in physics (based onthe publication in Los Alamos E-print Archive [17]) between the years 1995 and 1999 is equalto 0.43 [13]; for its cond-mat part (2000–2005) 〈C〉 ≈ 0.73 [18]. The mathematical co-authorshipnetwork of the Mathematical Reviews journal has a clustering coefficient equal to 0.15 [13]. Thesmallest value of 〈C〉, 0.066, characterizes the biomedical field (1995–1999) [13]. The clusteringcoefficient of the CMP journal is 0.607 (see table 1).
Table 1. The numerical characteristics of the co-authorship network of the CMP journal. N :number of nodes; L: number of links; 〈k〉, kmax: the mean and maximal node degree, respectively;〈C〉, 〈C〉/Cr: the mean clustering coefficient and the ratio between clustering coefficients of agiven network and of a random graph of the same size; 〈l〉, lmax: the mean and maximal shortestpath length.
Parameter N L kmax 〈k〉 〈C〉 〈C〉/Cr 〈l〉 lmax
Value 892 1300 25 2.915 0.607 185.3 4.783 10
135

O.Mryglod, Yu.Holovatch
In any connected fragment of the co-authorship network it is possible to find the chains ofintermediate collaborators between any two authors. The results of calculations show a very smalllengths of the shortest paths between any two nodes: its average value is close to 6 [12]. The lengthof the shortest path lij between the nodes i and j is equal to the minimal number of links whichshould be passed to reach the j from i. For a connected network, the mean shortest path length isdefined as:
〈l〉 =2
N(N − 1)
∑
i>j
lij . (6)
For well-connected networks the value of 〈l〉 is not large: for the above mentioned database inphysics [17] 〈l〉 ≈ 5.9 for all data and 〈l〉 ≈ 6.4 for its cond-mat part [12]. Measurements of themean shortest path of the papers submitted during 2000–2005 to the cond-mat part of the LosAlamos E-print Archive resulted in the value 〈l〉 ≈ 3.62 [18]. Our value of 〈l〉 for CMP does notdiffer essentially (see table 1). For small-world networks the value of 〈l〉 scales logarithmically orslower with network size [4]. Figure 8 shows how 〈l〉 changes with an increasing size of the CMPco-authorship network. Starting from a certain value of N (approximately after N = 550) newnodes continue to appear but the mean distance between them remains 〈l〉 ≈ 4.7.
Figure 8. The change of the mean shortest path length 〈l〉 with an increase of the network sizeN in the log-linear scale.
Another value that characterizes the network size is the maximal shortest path length, lmax.For our network, the maximal shortest path lmax = 10 connects the nodes of M.R. Tuzyak andM. Weigel, see table 1. Let us note that the average value of lmax for collaboration networksdiscussed above is between 20 and 30 and it depends on the field of science [13]; for physics〈lmax〉 ≈ 20.
The problems connected with the shortest paths in collaboration networks were the subject ofthe analysis in [13]. It was shown that on average 64% of an individual’s shortest paths run throughthe best-connected of the nearest collaborators. This fact shows the existence of very importantnodes in co-authorship networks, which can represent the most communicative and active scientists.Another interesting parameter is “transitivity” which shows the probability that two coauthors ofa scientist have themselves coauthored a paper [13]. In other words, if two scientists have at leastone common coauthor, they have a high probability of becoming coauthors in future.
A careful observation of the main co-authorship cluster of CMP (figure 6) makes it possible tosingle out its strongly-connected fragments. The possible reason for the existence of such connectedgroups is the common scientific interest of these authors. In other words, one can visually recognizethe thematic trends of the CMP journal. Another numerical data showing the priority fields ofresearch in the CMP is the statistics of PACS numbers. Table 2 represents the top of the 10most frequent PACS number in the papers of the CMP journal. Finally, the data from the ISIdatabase (Web of Science, [11]) regarding the external citations can show which thematic fields ofthe CMP journal are most useful for the scientists. The decreasing rank of subject categories that
136
Analysis of a scientific periodical: a case study
Table 2. The top of the 10 most frequent PACS numbers in the papers of CMP journal.
The name of the field PACS number Frequency
Statistical physics, thermodynamics, and nonlinear dynamical sys-tems
05 259
Structure of solids and liquids; crystallography 61 154Electronic structure of bulk materials 71 139Equations of state, phase equilibria, and phase transitions 64 124Dielectrics, piezoelectrics, and ferroelectrics and their properties 77 116Magnetic properties and materials 75 73Physical chemistry and chemical physics 82 66Superconductivity 74 58Surfaces and interfaces; thin films and low-dimensional systems (struc-ture and nonelectronic properties)
68 49
Physics of plasmas and electric discharges 52 39
cited CMP: physics, condensed matter (33.92% of all citations), physics, mathematical (14.43%),physics, multidisciplinary (14.04%), physics, atomic, molecular & chemical (12.87%), chemistry,physical (10.72%), physics, applied (9.75%), physics, fluids & plasmas (9.36%), materials science,multidisciplinary (7.21%), electrochemistry (5.26%), chemistry, analytical (2.92%), polymer science(2.53%).
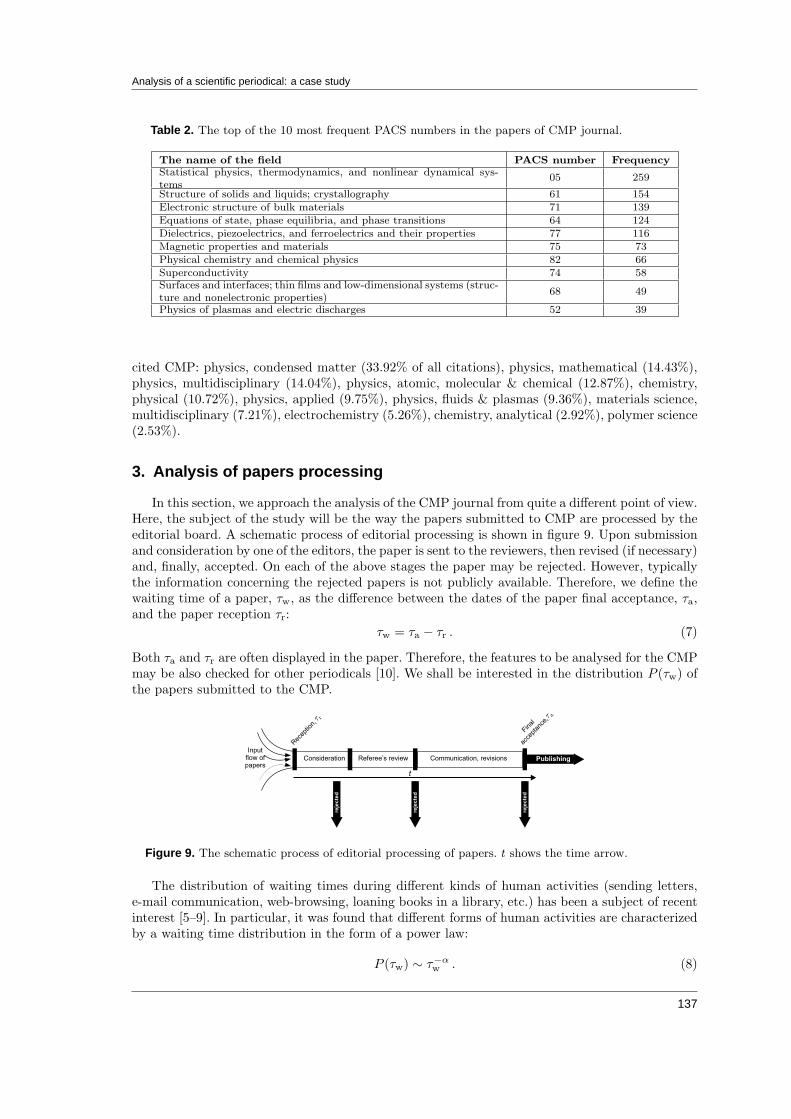
3. Analysis of papers processing
In this section, we approach the analysis of the CMP journal from quite a different point of view.Here, the subject of the study will be the way the papers submitted to CMP are processed by theeditorial board. A schematic process of editorial processing is shown in figure 9. Upon submissionand consideration by one of the editors, the paper is sent to the reviewers, then revised (if necessary)and, finally, accepted. On each of the above stages the paper may be rejected. However, typicallythe information concerning the rejected papers is not publicly available. Therefore, we define thewaiting time of a paper, τw, as the difference between the dates of the paper final acceptance, τa,and the paper reception τr:
τw = τa − τr . (7)
Both τa and τr are often displayed in the paper. Therefore, the features to be analysed for the CMPmay be also checked for other periodicals [10]. We shall be interested in the distribution P (τw) ofthe papers submitted to the CMP.
Figure 9. The schematic process of editorial processing of papers. t shows the time arrow.
The distribution of waiting times during different kinds of human activities (sending letters,e-mail communication, web-browsing, loaning books in a library, etc.) has been a subject of recentinterest [5–9]. In particular, it was found that different forms of human activities are characterizedby a waiting time distribution in the form of a power law:
P (τw) ∼ τ−αw
. (8)
137

O.Mryglod, Yu.Holovatch
Moreover, the dynamics of different processes appear to be governed by different values of theexponent α. The value α = 1 governs the waiting time distribution for web-browsing, e-mailcommunication and library loans [7,8]; α = 3/2 for sending letters (obtained concerning the analysisof correspondence of Einstein, Darwin, and Freud) [6,8]; α = 1.3 for stock broker activities [8]. Toexplain this phenomenon, a model of the queuing process based on the priority principle has beenused [5,6,8]. Note, however, the existing disagreement between the predictions of [5–8] on the onehand, and the assumption of a log-normal distribution P (τw) for e-mail communication patterns[9], on the other hand.
In a recent study [10] we proposed to analyse the forms of waiting time distributions to charac-terize editorial processing of scientific papers. To simplify the analysis we represented each processof editorial consideration, referee review, communication between the participants and the modifi-cation of materials being one service action. The analysis of the waiting time distributions of 2667and 2692 papers published, respectively, in the journals “Physica A: Statistical Mechanics and itsApplications” (during the period 1975 – 2006) and “Physica B: Condensed Matter” (during theperiod 1988 – early 2007) lead to the conclusions about two possible forms of the distribution [10]:
• power law with an exponential cutoff [8]:
P (τw) ∼ τ−bw
e−τw
τ0 , τ0 > 0, b = 1, (9)
where τ0 is the characteristic waiting time that depends on the rates of submission and taskexecution [8];
• log-normal [9]:
P (τw) ∼ 1√2πωτw
e−[ln( τw
τc)]
2
2ω2 , ω > 0. (10)
where ln τc and ω are the mean and standard deviation of the ln τw.
Both distributions predict the same behaviour τ−1, differing only in the functional form of theexponential correction.
Figure 10. Waiting time of the papers publi-shed in CMP between years 1995–2007. Differ-ent data points correspond to waiting times ofdifferent papers. The mean waiting time (solidline) has a tendency to decrease.
In figure 10 by the solid line we display thetime dynamics of the average waiting time of thepapers submitted to the CMP during the pe-riod 1995–2007. Different data points correspondto waiting times of different papers. The max-imal time of the paper processing is equal toτmax = 600 days (volume 9, No. 1(21), p. 175–182), the minimal one is equal to 4 days (vol-ume 7, No. 4, p. 829–844; volume 7, No. 4, p. 845–858). As one can see from the figure, the meanwaiting time tends to decrease. Unfortunately,only 159 out of all the papers published in CMPcontain the information on the dates of the pa-pers final acceptance, τa, and the paper recep-tion τr. Because of the poor statistics our resultsshow a significant data fluctuation. To obtain asmoother curve, we analysed the correspondingintegral distribution:
P int(τw) =
τmax∑
t=τw
P (t). (11)
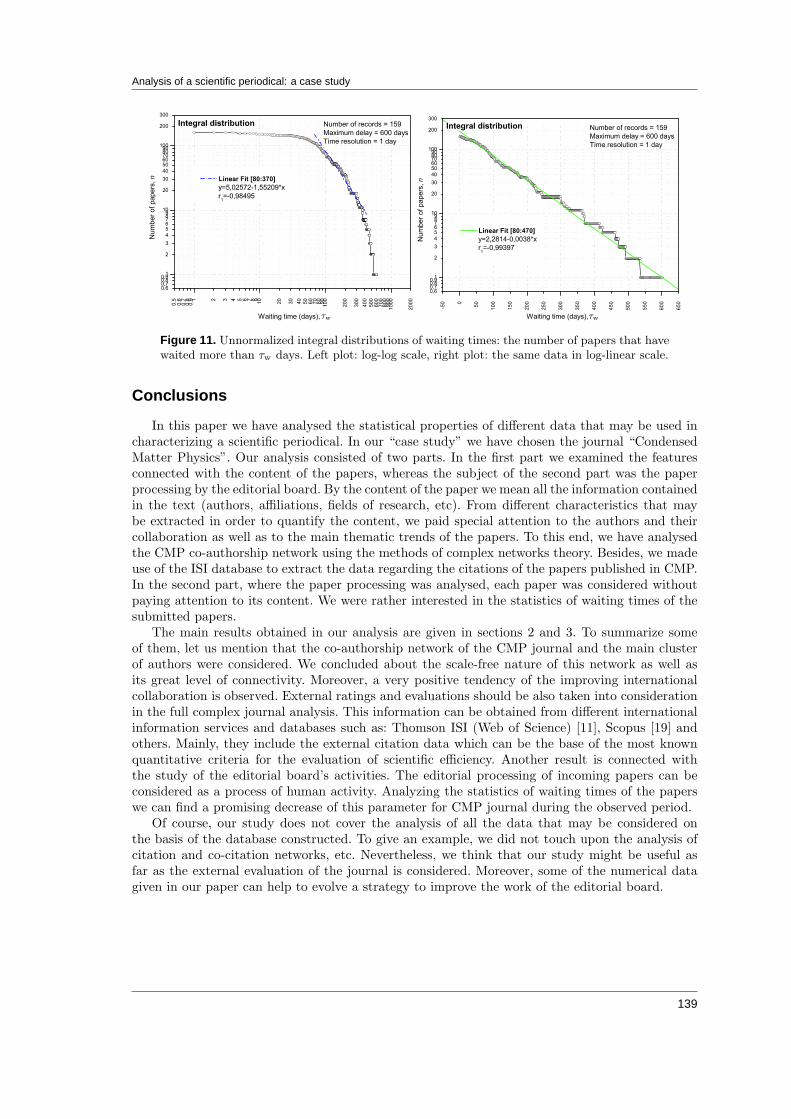
The corresponding curves (without normalization) are shown in figure 11 in the double logarithmicand log-linear scales. A better linear fit (the absolute value of Pearson’s coefficient r is closer to 1)on a log-linear scale suggests a rather exponential behaviour of the integral distribution curve.
138
Analysis of a scientific periodical: a case study
Figure 11. Unnormalized integral distributions of waiting times: the number of papers that havewaited more than τw days. Left plot: log-log scale, right plot: the same data in log-linear scale.
Conclusions
In this paper we have analysed the statistical properties of different data that may be used incharacterizing a scientific periodical. In our “case study” we have chosen the journal “CondensedMatter Physics”. Our analysis consisted of two parts. In the first part we examined the featuresconnected with the content of the papers, whereas the subject of the second part was the paperprocessing by the editorial board. By the content of the paper we mean all the information containedin the text (authors, affiliations, fields of research, etc). From different characteristics that maybe extracted in order to quantify the content, we paid special attention to the authors and theircollaboration as well as to the main thematic trends of the papers. To this end, we have analysedthe CMP co-authorship network using the methods of complex networks theory. Besides, we madeuse of the ISI database to extract the data regarding the citations of the papers published in CMP.In the second part, where the paper processing was analysed, each paper was considered withoutpaying attention to its content. We were rather interested in the statistics of waiting times of thesubmitted papers.
The main results obtained in our analysis are given in sections 2 and 3. To summarize someof them, let us mention that the co-authorship network of the CMP journal and the main clusterof authors were considered. We concluded about the scale-free nature of this network as well asits great level of connectivity. Moreover, a very positive tendency of the improving internationalcollaboration is observed. External ratings and evaluations should be also taken into considerationin the full complex journal analysis. This information can be obtained from different internationalinformation services and databases such as: Thomson ISI (Web of Science) [11], Scopus [19] andothers. Mainly, they include the external citation data which can be the base of the most knownquantitative criteria for the evaluation of scientific efficiency. Another result is connected withthe study of the editorial board’s activities. The editorial processing of incoming papers can beconsidered as a process of human activity. Analyzing the statistics of waiting times of the paperswe can find a promising decrease of this parameter for CMP journal during the observed period.
Of course, our study does not cover the analysis of all the data that may be considered onthe basis of the database constructed. To give an example, we did not touch upon the analysis ofcitation and co-citation networks, etc. Nevertheless, we think that our study might be useful asfar as the external evaluation of the journal is considered. Moreover, some of the numerical datagiven in our paper can help to evolve a strategy to improve the work of the editorial board.
139
O.Mryglod, Yu.Holovatch
Acknowledgements
O.M. thanks the Johannes Kepler Universitat Linz (Austria) for the possibility of getting infor-mation from the ISI database and to Ihor Mryglod for the help rendered. We acknowledge usefuldiscussions with Christian von Ferber and Reinhard Folk.
References
1. The ISSN number of the journal “Condensed Matter Physics” is ISSN 1607–324X and the http addressreads: http://www.icmp.lviv.ua/journal/index.html
2. Jeannin P., Devillard J. Towards a demographic approach to scientific journals, Scientometrics, 1994,30, 83–95. Note however that this reference analyses an evolution of a set of scientific journals, whereasin our analysis we are rather interested in ’measuring’ a single journal.
3. Garfield E. How ISI selects journals for coverage: Quantitative and qualitative considerations. Currentcontents, 1990, No. 22, 5–13.
4. Albert R., Barabasi A.-L. Statistical mechanics of complex networks, Rev. Mod. Phys., 2002, 74, 47;Dorogovtsev S.N., Mendes J.F.F. Evolution of networks, Adv. Phys., 2002, 51, 1079; Newman M.E.J.The Structure and Function of Complex Networks, SIAM Review, 2003, 45, 167; Dorogovtsev S.N.,Mendes S.N. Evolution of Networks: From Biological Nets to the Internet and WWW. Oxford Uni-versity Press, Oxford, 2003; Holovatch Yu., Olemskoi O., von Ferber C., Holovatch T., Mryglod O.,Olemskoi I., Palchykov V. Complex networks, J. Phys. Stud., 2006, 10, in press (in Ukrainian).
5. Barabasi A. The origin of bursts and heavy tails in human dynamics, Nature, 2005, 435, 207–211.6. Olivera J.G., Barabasi A. Darwin and Einstein correspondence patterns, Nature, 2005, 437, 1251.7. Johansen A. Probing human response times, Physica A, 2004, 338, No. 1–2, 286–291.8. Vazquez A., Oliveira J.G., Dezso Z., Goh K.-I., Kondor I., Barabasi A. Modeling bursts and heavy
tails in human dynamics. Phys. Rev. E, 2006, 73, 036127.9. Stouffer D.B., Malmgren R.D., Amaral L.A.N. Log-normal statistics in e-mail communication patterns,
arXiv:physics/0605027, v1 3 May 2006.10. Mryglod O., Holovatch Yu. The patterns of natural human dynamics at tasks execution in queue:
statistics of waiting times for scientific articles. – In: MECO32, Poland, Ladek Zdroj, April 16–18,2007, and unpublished.
11. The product of Thomson Scientific, Web of Science: http://scientific.thomson.com/products/wos/12. Newman M.E.J. The structure of scientific collaboration networks, Proc. of the Nat. Acad. of Sciences,
USA, 2001, 98, No. 2, 404–409.13. Newman M.E.J. Coauthorship networks and patterns of scientific collaboration, Proc. of the Nat.
Acad. of Sciences, USA, 2004, 101, 5200–5205.14. Lehmann S. Spires on the Building of Science: Complex Networks and Scientific Excellence. Cand.
Scient. Thesis, 2003. The Niels Bohr Institute.15. A. Vlado. Pajek: Program for large network analysis. http://vlado.fmf.unilj. si/pub/networks/pajek/.16. V.-P. Makinen. Himmeli: Graph drawing software. http://www.artemis.kll.helsinki.fi/himmeli/.17. ArXiv.org: open access to 420,559 e-prints in Physics, Mathematics, Computer Science and Quantita-
tive Biology, http://arxiv.org/18. Cardillo A., Scellato S., Latora V. A topological analysis of scientific co-authorship networks, Physica A,
2006, 372, 333–339.19. http://www.scopus.com/
140

Analysis of a scientific periodical: a case study
Журналометричний аналiз наукового видання: дослiдження
часткового випадку
О.Мриглод1,2, Ю.Головач2,3
1 Нацiональний унiверситет “Львiвська полiтехнiка”, вул. Бандери 12, 79013 Львiв, Україна2 Iнститут фiзики конденсованих систем НАН України,
вул. Свєнцiцького 1, 79011 Львiв, Україна3 Iнститут теоретичної фiзики унiверситету Йогана Кеплера, Альтенбергерштрасе 69, 4040, Лiнц,
Австрiя
Отримано 29 травня 2007 р.
У цiй статтi ми використовуємо рiзнi пiдходи для аналiзу наукового журналу як складної системита якомога вичерпнiшого опису її поточного стану та еволюцiї. Для вирiшення поставлених задачзокрема застосовними є методи теорiї складних мереж, статистики та теорiї черг. Об’єктом дослi-джень ми обрали журнал “Condensed Matter Physics” (http://www.icmp.lviv.ua). Зокрема, на основi ста-тистичних даних про статтi, опублiкованi у цьому виданнi вiд його заснування у 1993 роцi i дотепер,ми побудували мережу спiвавторства та визначили її основнi кiлькiснi характеристики. Ми провелианалiз прiоритетностi наукових напрямкiв, що вiдображенi в публiкацiях журналу, та рейтинг їх циту-вання в iнших виданнях. Для додаткової характеристики ефективностi редакцiйної обробки статей,ми вивчили її часову динамiку в рамках теорiї черг та аналiзу людської активностi.
Ключовi слова: складнi системи, складнi мережi, мережi спiвавторства, оцiнювання видань,людська динамiка
PACS: 02.10.Ox, 02.50.-r, 07.05.Kf, 89.75.-k
141

142
Copyright © 2022 FDOKUMEN