PERIODIC REPORT FOR THE YEAR 2018 - ADAMA
247
Adama Agricultural Solutions Ltd. PERIODIC REPORT FOR THE YEAR 2018 The information contained herein constitutes an unofficial translation of the Annual Report for the year 2018 published by the Company in Hebrew. The Hebrew version is the binding version.
-
Upload
khangminh22 -
Category
Documents
-
view
0 -
download
0
Transcript of PERIODIC REPORT FOR THE YEAR 2018 - ADAMA

Adama Agricultural Solutions Ltd.
PERIODIC REPORT
FOR THE YEAR 2018
The information contained herein constitutes an unofficial translation of the
Annual Report for the year 2018 published by the Company in Hebrew.
The Hebrew version is the binding version.

Periodic Report for the Year 2018
Chapter A – Description of the Company’s Business Chapter B – Board of Directors' Report on the State of
the Company's Affairs Chapter C – Financial Statements as at December 31,
2018 Chapter D – Additional Information on the Corporation Chapter E – Report regarding the Effectiveness of the
Internal Auditing of Financial Reporting and Disclosure

INTRODUCTION
In this Report, the following terms have the meaning appearing alongside
them:
ADAMA Solutions - Adama Agricultural Solutions Ltd.
The Company or the Group or Adama Group
- Adama, including all its subsidiaries, unless expressly stated otherwise.
Listed Entity or ADAMA Ltd.
ADAMA Ltd., the Company's shareholder
CNAC - China National Agrochemical Co., Ltd., a Chinese Entity, member of the ChemChina Group.
ChemChina - China National Chemical Co., Ltd.
Adama Makhteshim - Adama Makhteshim Ltd.
Adama Agan - Adama Agan Ltd.
TASE - Tel Aviv Stock Exchange.
Financial Statements - The Company’s consolidated financial statements as of December 31, 2018 attached to this Periodic Report.
Securities Law - Israel Securities Law, 1968
Unless expressly stated otherwise, all financial data in this report are
denominated in USD.
Translation of financial data in various currencies to USD: Transactions in foreign
currency are translated to USD, the Group's functional currency, at the exchange rate
effective on the transaction dates. Assets and liabilities denominated in foreign
currency on the reporting date are translated to the functional currency at the exchange
rate effective on that date.
Interest rates: The interest rates referred to in this chapter are annual interest rates.
Unless expressly stated otherwise, the Company's operations and financial data
are described on a consolidated basis. The Company's separate financial report
is attached to this Report.

Chapter A
Description of the Company's
Business

Chapter A
Page
Part 1 –General Development of the Company's Business 1
(1) The Company's Activities and General Business Development 1
(2) The Company's Areas of Operation 4
(3) Investments in Company's Equity and Dealings in its Shares 4
(4) Dividend Distribution 4
Part 2 - Additional Information
(5) Financial Data 6
(6) General Environment and the Effect of External Factors on the Company's Operations
7
Part 3 - Description of the Company's Businesses
A.1. Crop Protection Products (Agrochemicals) 12
(7) General Information 12
(8) The Company's Products 17
(9) New Products 20
(10) Product Revenue Segmentation 21
(11) Customers 22
(12) Distribution and Marketing 23
(13) Competition 24
(14) Seasonality and Weather 27
(15) Innovation, Development Research and Registration 29
(16) Intangible Assets and Intellectual Property 33
(17) Raw Materials and Suppliers 33
A.2. Other Activities
35
(18) Dietary Supplements, Color, Texture and Taste Enhancement Ingredients and Food Fortification Ingredient
35
(19) Aroma Products for the Cosmetics and Flavors & Fragrances (F&F) Industries 38
(20) Industrial Products 40
B. Issues Relevant to the Entire Group 41
(21) Fixed Assets, Real Estate and Facilities 41
(22) Production Capacity 43
(23) People 44
(24) Working Capital 47
(25) Financing and Credit 50
(26) Taxation 53
(27) Environmental Risks and Regulations 56
(28) Restrictions and Regulatory Arrangements 59
(29) Material Agreements 60
(30) Collaboration Agreements 60
(31) Corporate Governance 61
(32) Legal Proceedings 61
(33) The Company's Growth Strategy 61
(34) Risk Factors
65

1
Part I - General Development of the Company's Business
1. THE COMPANY'S ACTIVITIES AND GENERAL BUSINESS
DEVELOPMENT The Company engages in the development, manufacturing and marketing of crop protection
products, that are mainly off-patent, and is one of the leading companies in the world in this field.
The Company supplies solutions to farmers in approximately 100 countries, through approximately
60 subsidiary companies throughout the world.
In 2018, the Company was the world’s leading company in off-patent crop protection solutions (by
sales), and is ranked sixth in the world among companies engaged in the field of crop protection.
The Company's business model integrates end-customer access, regulatory expertise, global R&D
and production capacities, thereby providing the Company a significant competitive edge and
allowing it to launch new and differentiated products that provide farmers’ needs in key markets.
In addition, the Company is active in a number of additional areas unrelated to agriculture; these
activities are based on its core capabilities in the agricultural and chemical fields and are insignificant
in scope.
Since October 2011, the Company has been a member of the ChemChina Group, which is a major
economic conglomerate controlled by the Chinese Government with extensive operations in China
and around the world, that engages in the fields of chemicals and agrochemicals.
As of July 2017, the entire share capital of the Company is owned, directly, by ADAMA Ltd., a
Chinese Company which shares are traded on the Shenzhen Stock Exchange, and is fully controlled
by ChemChina (the “Combination Transaction”), which is consolidating the Company’s financial
statements as of the third quarter 2017. The Company's global management leads also ADAMA Ltd.,
and in this context, the Company's CEO, CFO and GLC were each appointed to corresponding
positions in ADAMA Ltd.
In December 2018 the final milestone of the Combination Transaction was achieved with the name
of the controlling company changed to ADAMA Ltd., demonstrating their coming together under
ADAMA as a single global brand, reflecting the group’s farmer-centric focus and its commitment to
advancing agriculture in markets around the world.
The Company continues to advance collaboration opportunities with other ChemChina group
entities, as well as other entities in China, to make the most of its positioning.

2
The Company has been working together with Syngenta and other key agriculture-related
businesses in China, to identify opportunities for closer collaboration. In this context, the companies
are exploring various initiatives, including the potential provision of reciprocal access to certain
products in specific territories, as well as exploiting opportunities aimed at optimizing the utilization
of the companies’ operational facilities.
Overview of the Company’s Operational Structure:1
1 This diagram does not include all the Group’s companies, but rather only those most significant to its operations. For a complete list
of the Company's subsidiaries and affiliates, see Appendix to the Company's Financial Statements.
ADAMA Agricultural Solutions Ltd.
Crop Protection
Additional activities executed directly or indirectly, through
additional subsidiaries
ADAMA Makhteshim ADAMA Agan
Israeli and Non-Israeli
subsidiaries
100%
Lycored
ADAMA China
Combined with activity
under ADAMA Ltd.
ADAMA Brazil
Marketing & distribution
companies in key European
countries
ADAMA India
Other marketing & distribution companies worldwide
ADAMA North
America
Agan Aroma
Other Activities

3
Description of the Structural Changes; Material Mergers and Acquisitions
The Company was incorporated as a public company in Israel in December 1997, as part of the
execution of scheme of arrangement for the change of the holdings structure of the Makhteshim-
Agan group (as it was named then). As part of its operating method and strategic goals, the Company
reviews and executes, from time to time, collaborations with or acquisitions of companies,
operations, registrations and distribution rights for existing and additional products in the areas of its
activity. These acquisitions are contributing to the Company's growth alongside the Company's own
organic growth, which has been the prime growth factor in recent years.
Transfers & Divestments relating to ChemChina’s acquisition of Syngenta
In the context of developing its business and to facilitate the obtaining by ChemChina of the
regulatory approvals for the acquisition of Syngenta Ag (“SYN”), the Company agreed with
ChemChina and SYN to affect the divestment of a number of its products, while receiving products
of similar nature and economic value from SYN. The receipt of the transferred products from SYN
and concurrent divestment of the Company’s products in the US were concluded in 2017, whereas
the receipt and divestment of the relevant products in Europe were concluded in the first quarter of
2018.2
Straightening the Company's position in non-agricultural fields
In January 2019 the Company concluded, through an affiliated company in the US, the acquisition
of Bonide Products Inc. ("Bonide"), a company which provides solutions mainly for the consumer
products market for home and garden use, allowing the Company to bring its advance formulation
technologies and its differentiated portfolio for home and garden pest control, directly to the
consumers.
The acquisition of Bonide, which owns wide national distribution platform that provides improved
access to the domestic consumers market estimated in approximately USD 1.5 billion, together with
the Company’s additional activity in non-agricultural fields in the US, strengthens the Company's
position in the US in these areas.
2 For details regarding the sale of products of the Company in the US to a third party and the receipt of certain products and rights from
SYN in the US, see immediate reports dated February 5, 2017 (ref: 2017-01-010690), April 5 2017 (ref: 2017-01-030721) and May 21 2017 (ref: 2017-01-051024). For details regarding the sale of products by the Company in Europe to a third party and the receipt of products portfolio from SYN in Europe, see immediate reports dated February 5, 2017 (ref: 2017-01-010690), April 5 2017 (ref: 2017-01-030721), May 21 2017 (ref: 2017-01-051024) and October 24 2017 (ref: 2017-01-093166).

4
2. THE COMPANY’S AREAS OF OPERATION
Crop Protection
The Company is focused on the development, manufacturing and marketing of mainly off-patent
crop protection products, which are in general herbicides, fungicides and insecticides that protect
agricultural and other crops from weeds, diseases and insects respectively. In addition, the Company
utilizes its expertise for the development, production and commercialization of similar products for
non-agricultural purposes (Consumer and Professional Solutions). In 2018, crop protection
(including the sale of these substances for non-agricultural uses) represented approximately 94% of
the Company's sales.
For additional information and a description of the field, see chapter A.1 of this chapter.
Other Activities
The Company leverages its core capabilities in the agricultural and chemical fields and operates in
several other non-agricultural areas, none of which, individually, is material for the Company, and
which together accounted in 2018 for approximately 6% of the Company's sales. These activities
include primarily, (a) the manufacturing and marketing of dietary supplements, food colors, texture
and flavor enhancers, and food fortification ingredients; (b) fragrance products for the perfume,
cosmetics, body care and detergents industries; (c) the manufacturing of industrial products; and (d)
other non-material activities.
For further information and a description of these aforementioned activities, see chapter A.2 below.
3. INVESTMENTS IN THE COMPANY’S EQUITY AND TRANSACTIONS
IN ITS SHARES
The Company is a private company which bonds are listed for trade at the Stock Exchange and
accordingly is a “Reporting Entity” in accordance with the provisions of the securities law.
On July 4, 2017, the entire share capital of the Company was transferred from CNAC to ADAMA
Ltd., such that the Company is a wholly owned subsidiary of ADAMA Ltd., controlled by CNAC.
4. DIVIDEND DISTRIBUTION
To the date of this report, the Company’s Articles of Association do not include dividend distribution
policy.
On October 30, 2017, following the approval of the Company's Board of Directors and at the request

5
of the Company's direct controlling shareholder at that time, CNAC, the Company paid to CNAC the
remaining amount of approximately USD 22 million, out of the dividend of approximately USD 40
million, which was declared and partially paid by the Company in September 2016.
Except for the aforesaid, no additional dividend distributions were made during 2017-2018.
The balance of retained earnings available for distribution as per the Company's financial statements
as of December 31, 2018 is approximately USD 1.6 billion (less retired treasury stock).3
3 For details on the tax considerations applicable to the distribution of part of these earnings, see Section 26 of this chapter.

6
Part II - Additional Information
5. FINANCIAL DATA
The following is the split of the Company's consolidated revenues by segment, from its primary area
of operation, being crop protection products, together with income from its other activities (in a format
identical to the segmentation in the financial statements and without adjustments to the consolidated
financial statements4) in the three years prior to the date of the report (in million USD):
2018
Segment of Operation
Segment Revenues
Segment
Costs5
Profit from Regular Activities (Operating Profit) Operating
Profit Margin (in %)
Total Assets
Total Liabilities
Attributed to owners of Parent Company
Attributed to non-controlling rights
Crop Protection 33,3 9 69,2 8 642 - %19.2 596,3 467
Other Activities 197 193 4 - %2.2 184 34
Total 653,3 890,2 664 - %18.3 149,4 708
2016
Segment of Operation
Segment Revenues
Segment
Costs5
Profit from Regular Activities (Operating Profit) Operating
Profit Margin (in %)
Total Assets
Total Liabilities
Attributed to owners of Parent Company
Attributed to non-controlling rights
Crop Protection 2,877 2,540 340 (2) 11.7% 3,305 493
Other Activities 193 186 7 - 3.5% 187 49
Total 3,070 2,726 347 (2) 11.2% 3,492 543
For explanations of the developments in the figures presented in the Financial Statements, see the
Board of Directors’ Report, attached to this Report.
4
At the report date, revenues and income from inter-segment sales within the Group are negligible. 5 At the report date, the Company’s management believes that segmenting the core activity area's costs into fixed and variable costs
(as required by the Securities (Prospectus Details and Prospectus Draft – Structure and Format) Regulations, 1969, is not relevant to
the Company's operations; therefore, the management does not analyze this data and it is unavailable.
2017
Segment of Operation
Segment Revenues
Segment Costs5
Profit from Regular Activities (Operating Profit) Operating
Profit Margin (in %)
Total Assets
Total Liabilities
Attributed to owners of Parent Company
Attributed to non-controlling rights
Crop Protection 2,946 2,577 369 - 12.5% 3,380 591
Other Activities 191 189 2 - 1.2% 174 30
Total 3,137 2,766 372 - 11.8% 3,560 621

7
6. GENERAL ENVIRONMENT AND THE EFFECT OF EXTERNAL
FACTORS ON THE COMPANY’S OPERATIONS
Trends, events and key developments in the Company's macro-economic environment may have a
material impact on its business results and development. The influence of these factors may differ
depending on the geographic region and the different products of the Company. Since the Company
maintains a wide product portfolio and since it is active in many geographic regions, the aggregate
effect of these factors in any given year and the course thereof is not uniform and may sometimes
even be mitigated by counterbalancing influences.6
Global Factors
Demographic changes, economic growth and rising standards of living
Multi-year global economic growth, population increase, urbanization and rising standards of living
in various populations in the world, particularly in emerging economies, such as Brazil, China and
India, have led to a general increase in food consumption, particularly in the consumption of animal-
derived foods. Accordingly, there has been a clear trend of increasing demand for agricultural crops
to satisfy this rising food consumption, as well as increasing demand for crops containing vegetable
derived proteins that are intended for the food industry (for use in cereals, corn and soybean
primarily), and for grains utilized in animal feed.
An additional trend that has been observed is that of development of energy sources other than fuel
and its derivatives, which are considered less harmful to the environment. As a result, many countries
maintain advanced industries for the manufacture of biofuels that are produced from certain
agricultural products such as corn, sugarbeet and sugarcane.
The abovementioned increase in demand has served to drive the growth of the agricultural sector,
combined with the concurrent stabilization of planting areas (whose maximum global area is limited)
and the reduction of arable land (inter alia, due to the demand for space to build new urban areas),
encourage farmers to optimize the amount of crop production per unit land area, to maximize the
yield of each individual farmer and to enhance the quality of its crops, which has positively impacted
the demand for the Company's products.
Agricultural commodity prices
High prices for agricultural commodities encourage farmers to reach maximum yield from their
existing planting areas. As their profitability increases, the farmers’ incentive to increase the
6 The Company's estimates presented in this section and in this report are based, among other things, on published data that was not
independently assessed by the Company, as follows: (1) Phillips McDougall– an independent consulting and research firm specializing in agriculture, crop protection and biotechnology
https://phillipsmcdougall.agribusinessintelligence.informa.com; (2) The website of the US Department of Agriculture (USDA) (http://www.usda.gov/wps/portal/usdahome); (3) AgBio Investor - independent consulting and research firm in the field of agriculture, corp protection and biotechnology
https://agbioinvestor.com (“AgBio Investor”).

8
protection of their crops from disease and pests also increases, and accordingly the demand for crop
protection products rises. However, the price levels of agricultural commodities in recent years were
relatively lower primarily due to an increase in agricultural output and an increase in the inventories
of the major crops (corn, soy, cotton and wheat), thus significantly impacted farmer incomes in many
countries. Therefore, the demand for crop protection products in 2018 remained low in comparison
to the first half of the decade. The agricultural commodities prices are expected to remain low also
in 2019, although a recovery is expected this year in comparison to 2018.
Significant fluctuations in raw material costs and global energy prices
The most significant constituent of the cost of goods of companies in this field is the cost of the raw
materials utilized in the manufacturing of the products. Therefore, significant increases or decreases
in the costs of raw material affect the cost of goods sold, which is generally observable a number of
months following the change in the costs of the raw material.
Since the raw materials are chemicals produced, inter alia, as third or fourth order derivatives of oil,
extreme changes in global oil prices may influence the cost of goods sold. However, such influences
are only partial, due to the fact that these chemicals are only derivatives of oil. In addition, oil price
increase or decrease may have an impact on energy costs.
In recent years there has been a significant change in the global energy market, resulting from the
development by western countries, primarily the US., of capabilities for the independent production
of energy, with the aim of decreasing their dependence on certain oil exporters. During the second
half of 2017 oil prices began to increase, a trend that continued until the third quarter of 2018.
However, in the last quarter of 2018 oil prices significantly decreased. The Company estimates that
the mentioned increase (although moderated) in oil prices, may have a negative effect on its
production costs going forward, as well as on its sea and land transportation costs and on the prices
of raw material and intermediates that it procures.
Also, developments in the natural gas market (which functions as one of the Company’s energy
sources since 2014) impacted the price and availability of natural gas, leading to a decrease in the
Company’s energy costs.
Development of new crop protection technologies
The majority of seeds sold in the genetically modified seed market are seeds with characteristics
designed, among other things, to protect the crop against non-selective herbicides (substances that
are not designed to eliminate specific types of weeds and thus may also harm the crop), and against
insects (together known as “Input Traits”). These characteristics may save farmers related expenses
of purchasing several selective herbicides for crop protection or purchasing a variety of different
insecticides.
The use of genetically modified seeds in a specific country affects the selection of crop protection

9
products used by farmers. Accordingly, expansion of the use of genetically modified seeds directly
influences supply and demand, and therefore the prices, of the various crop protection products.
This effect often leads to price fluctuations of these products on the global level, and as such there
is also an indirect effect on the supply and demand for crop protection products in other countries,
even if they do not allow the use of genetically modified seeds.
Concurrently, in recent years, there has been an increase in the use of natural and/or biological
substances that attack weeds, pests and diseases for crop protection purposes. The Company
believes that despite the increase in the use of these products, the demand for these products is still
small compared to the use of chemical crop protection products.
Patent expiry and growth in volumes of off-patent products
In recent years, the market share of original patent-protected crop protection products has been
consistently shrinking due to ongoing patent expiries and the reduced rate of introduction of new
original products. The Company expects this trend to continue in the coming years. Consequently,
this has created growth potential for off-patent focused companies developing new off-patent
products to compete with the original products whose patents have expired. Nevertheless, the
growth potential for off-patent products creates increased competition for market share, including on
the part of research-based companies, and may even ultimately lead to the erosion of product prices.
The chemical and agrochemical industry in China
Since 2000, a chemicals industry has developed in China that the Company believes to be the largest
in the world. Within this industry, an agrochemicals industry has also developed, including thousands
of companies who have invested in manufacturing infrastructure, of which roughly most of their
production capacity is currently aimed at exports, intended for sale through small and large
companies, including the Company and its competitors. The growth in production capacity, on one
hand, and the price levels and competitiveness of the products produced in China on the other, affect
the structure of competition in the entire industry. However, price levels of the products manufactured
in China have started to rise and has risen significantly in 2017, mainly in light of the trend of rising
manufacturing costs in China. This trend mainly stems from the increase of costs relating to
environment protection, as well as from increased regulatory in China, including by way of limited
granting of production permits, shutting down of plants, fines, etc. Due to shutting down some of the
plants and cessation of production in others, in 2018 shortages of agrochemicals products, including
those of the Company’s products were created. The high prices level and the decrease in availability
of products is expected to continue to 2019.

10
Localized Factors
The agricultural market and severe weather conditions
Weather conditions during the agricultural season in each country where the Company operates
directly impact the demand for its products.7
Regulatory changes
Registrations - The Company's core field of operation is subject to product registration requirements
pursuant to the policy in each country of operation, with these registration processes being
characteristic of the crop protection industry and constitutes a barrier of entry to the market.
Moreover, the Company is required, from time to time, to renew or modify such registrations by
conducting new tests and studies, and required to comply with additional regulatory requirements.8
Environmental protection and other quality standards - The production processes and
manufacturing environment of the products in the Company's core area of operations are subject to
strict and rigorous regulatory requirements in the environmental protection area which vary according
to the policies of each country. In addition, use of the Company's products is subject to regulation by
health, environmental protection and agriculture agencies in the various countries.9
Government policies
In recent years, government subsidization for encouragement of agriculture activity in many
countries in which the Company operates has been relatively high, which has had a positive impact
on the profitability of farming, thereby indirectly increasing demand for the Company's products. To
the best of the Company’s knowledge, the scope of government subsidization in different regions
decreased in 2018 and is expected to decrease in the coming years.
In addition, since the Company operates globally, its export and import activities are subject, inter
alia, to a variety of requirements and standards related to permits and to processes vis-à-vis the
customs and port authorities in different countries.
World ports
Imports and exports of products and raw materials by multinational companies in the Company's
field of operations are heavily reliant on the international ports services.10
7 For further information see Note 1A(2) to the Financial Statements and Section 34 of this chapter, “Decline in scope of agricultural
activities; Exceptional changes in weather.” 8 For further information see Section 15 of this chapter and Section 34 of this chapter, “Changes in legislation, standards and regulation
for registration of the Company’s products.” 9 For further information see Section 27 of this chapter. 10 For further information see Section 34 of this chapter, "Disruptions in supply of raw materials and/or disruptions in shipping and port
services.”

11
Monetary Policy and the Financial Market
The Company is exposed to both currency exchange rate volatility and consumer price index
fluctuations.11
Note that the Company's business activities and results may be affected in the future by the above-
mentioned factors, either positively or negatively. The extent of such effects, if any, depends, inter
alia, on the intensity of said events, their duration and the Company's ability to manage them. For
further details on the risk factors relevant to the Company's operations. see Section 34 of this
chapter.
The Company's assessments regarding demographic changes, economic growth, the rising standards
of living, commodity prices, supply and demand, raw material prices, effects of oil prices, developments
in the industry and the different markets, developments in the genetically modified seeds market and
their effect, rate of patent expiry and its effect on market share, scope of governmental subsidies,
macro-economic, legislative and regulatory developments, changes in government policies, and their
effects on Company results contains forward looking statements, which relies on information and data
held by the Company, studies and other publications as detailed in this Chapter, as well as on the
Company's own estimates at the reporting date of the effects of market trends on supply and demand
for its products.
This information is inherently uncertain and depends, inter alia, on additional factors beyond the
Company's control, including activities by its existing and potential competitors, regulatory and
economic processes in the world and in different countries and the economic situation in these
countries. Company estimates may thus not materialize should it become apparent that such data
were incorrect or should other factors beyond the Company's control affect supply and demand.
11 In this matter see section 34 of this chapter under the titles “Currency Risks” and “Exposure to CPI Indexation” Exchange rate
fluctuations”” and Exposure to Interest rate, CPI and NIS exchange rate fluctuations””.

12
Part III - Description of the Company's Business
A.1. CROP PROTECTION PRODUCTS
(AGROCHEMICALS)
7. GENERAL INFORMATION
The crop protection market fulfills a central role in meeting the increasing demand for food.
Crop protection products assist in improving the quantity and quality of crop yields by protecting
crops against the damaging and destructive effects of a variety of weeds, pests and disease. In the
absence of these products, farmers may lose approximately 30%-70% of their crop yields
(depending on the type of crop and geographic region).
Crop protection products are also used in non-agricultural fields (“Consumer and Professional
Solutions”), to protect against weeds, pests and disease, inter alia, in roadworks, forests, lawns,
parks, institutions, the wood and paint industry, facilities and private residential gardens.
Crop protection products include three main product groups: (1) herbicides, (2) insecticides, and (3)
fungicides. In addition, the sector includes seed treatment products.
Furthermore, crop protection products in the global market are divided into two categories: (1)
original products wherein the active ingredient is still patent-protected, developed by leading
research-based companies in the field; and (2) off-patent products that are similar in their chemical
composition and mode of action to the original product whose patent has expired. These products
are manufactured both by off-patent companies, such as the Company, as well as by research-based
companies.
Legislative restrictions, regulations and special constraints
For details of these respective aspects regarding the Company's operations and the various
restrictions, see Sections 15 and 28 of this chapter.
Volume and profitability trends and changes
Total global sales of the crop protection industry for both the agricultural and the non-agricultural
markets is estimated at USD 64,179 million in 2018, an increase of approximately 2% from the USD
62,923 million in 201712. It is expected that the overall size of the global crop protection industry for
12 See footnote 19 below.

13
(in $ millions)Sales
both the agricultural and non-agricultural markets will increase to approximately USD 70,923 million
by 2022.13
Over 60% of the international market for crop protection products is controlled by four multinational
research-based companies (RBCs) that develop, produce and sell the original products and patent
the research rights in most of the world’s countries (the "Originator Companies")14. A significant
portion of the products sold by these Originator Companies are original products whose patents have
expired.
In the past three years, several mergers and acquisitions between large companies in the sector
have been announced, as well as a number of additional transactions, including the acquisition of
the Swiss company Syngenta by ChemChina (as mentioned in section 1 of the first part of this
report). These transactions may have an impact on the profitability of the sector.15
The sales of the leading companies in the crop protection segment for 2018:16
17
13 Based on preliminary estimates the Company received from AgBio Investor in December 2018 and January 2019. 14 Based on the published 2017 Financial Statements of these companies and the preliminary estimates the Company received from
AgBio Investor. The aforesaid statements updated, among other things, the total global sales volume of crop protection field for the agriculture market and the non-agriculture market in 2017 in comparison to pervious estimations.
15 For information regarding the competition in the market of crop protection see section 13 of this chapter. 16 Agrochemicals’ sales only (and without engineered seeds). 17 The sales of Bayer are presented on a pro-forma basis, as if Bayer consolidated Monsanto since the 1st of January 2018 while
Monsanto acquisition by Bayer was completed on August 2018. The sales of BASF are presented after exclusion of sales deriving from the portfolio acquired from Bayer in August 2018, which includes material activity in the engineered seeds section. The presented sales of ADAMA refer to the ADAMA Ltd. sales, of which, $3,536 million are sales of the Company.

14
Market Scope Distribution (Agriculture Market), in $ millions
The growth rates in the crop protection sector for the agricultural market alone, by geographic region
(in current prices, in terms of sales to the distributor) in 2018 compared to 2017:18
2018 vs 2017 (%)
North America +2.4
Latin America +4.0
Europe +1.5
Asia +1.6
Middle east and Africa +0.8
Increase rate in the market +2.3
The Company operates in both developed and emerging markets.19 The Company has a particularly
prominent presence in emerging markets, where it expects the growth rate to be generally higher
than in developed markets. Long-term increases in standards of living in the developed countries in
the Western world also increase demand for crop protection products in non-agricultural spheres
(Consumer and Professional Solutions).
For further information regarding the trends that occurred in 2018 and their effects on the Company's
results, see the Board of Directors' Report.
18 Estimates the Company received from AgBio Investor in January 2019. 19 As defined in the MSCI Developed Markets Index
North america9,80717%
Latin America14,829
26%Europe13,070
23%
Asia17,581
30%
Middle east and Africa2,357
4%
Total57,644

15
Technological changes
For information concerning the effect on the Company of the development of new technologies,
including developments in the genetically modified seeds market, see Section 6 of this chapter.
Critical success factors
General:
▪ Reputation, branding and expertise and accumulated knowledge in the sector in the various
countries and among customers and suppliers;
▪ Financial strength and resilience combined with consistent growth, allowing the Company to
realize a corporate development strategy including the potential for mergers and acquisitions
with other companies in the sphere, and provide immediate response to attractive business
opportunities to expand its product portfolio and the volume of its operations;
▪ Access to funding sources and reasonable funding terms allowing the Company to make
investments and ensure positive ROI;
Development stage:
▪ Dedicated knowledge and technologies, financial investments, skilled manpower resources in
the sphere and the required registration expertise to develop and utilize the designated product;
▪ Successful completion of off-patent product development such that its effectiveness and quality
compared to the original product is proven, as well as timely market entry;
▪ Consistent and continued development of additional products, including unique formulations,
based on the Company's accumulated technological expertise;
▪ Development of a wide and varied product portfolio;
Raw material procurement stage:
▪ Raw material availability and supply chain efficiency;
▪ Fitting raw material costs, prices, quality and quantities, and operational flexibility for meeting
actual demand;
▪ Flexible procurement system, including infrastructures in China;
Production stage:
▪ Efficient production costs structure combined with appropriate and efficient global deployment;
▪ Obtaining regulatory approvals and permits for the product's commercial production and
marketing in relevant markets;
▪ The Company's extensive technological knowledge accumulated over years of industrial
production of its products, particularly in chemical synthesis and formulation, which ensures its
products are high quality, effective and safe;
16
▪ Appropriate dedicated manufacturing facilities and efficient and well-controlled production
operations, at minimal health risks to Company employees, while complying with the relevant
operational quality and safety standards;
Commercial marketing stage:
▪ An efficient and broad commercial organization, allowing the Company to distribute its products
to a maximum number of prospective customers, as well as entering into commercial
agreements for production and marketing of products at competitive terms, with the aid of, inter
alia, the Group Companies, thereby allowing the forging of close local relationships and
development of new marketing niches in these and other countries;
▪ A global marketing and distribution network, including by means of the Group Companies, that
offer an advantage over off-patent competitors active in only some of the Company's markets,
enabling the Company to sell its products throughout the year in accordance with the seasons
of each individual geographic region;
▪ Ability to utilize marketing and sales management knowledge, expertise and experience in target
countries, thereby allowing the Company to enter markets at the right time and to secure a
competitive edge;
▪ Stable and ongoing relationships with strategic customers which builds trust in the quality of the
Company's products and its dependable supply, which enables the Company to forecast its
estimated future sales volumes with reasonable probability;
▪ A broad and diverse product portfolio, including unique products such as unique mixtures and
formulations, for every agricultural season and crop, thereby providing a comprehensive
response to farmer requirements;
▪ Expertise in registering its products in various countries, in a manner that hastens the
penetration process of a new product into a market, thereby providing the Company with a
marketing edge.
Entry and exit barriers
The crop protection sector is characterized by high entry barriers requiring capital and significant
financial resources, together with relevant knowledge and expertise. These entry barriers include,
inter alia, high development costs (particularly for Originator Companies), payments for use of
knowledge for registration purposes, and significant investments in the establishment and
maintenance of production facilities, together with extensive technological knowledge in the fields of
the industrial production by chemical synthesis and formulation that are dependent on professional
and skilled human resources or external consultants, significant marketing and distribution costs,
compliance with strict regulatory requirements pursuant to the existing regulations in each country,
a good reputation and strong customer loyalty.

17
Notwithstanding the above, in those markets where the regulatory requirements are relatively lenient
the entry barriers are lower, and thus allow smaller companies to become active in this sphere to a
limited extent, while outsourcing aspects of their manufacturing operations.
The Company estimates that there are no material exit barriers in the crop protection market, apart
for those related to future uses of fixed assets and dedicated facilities used by companies engaged
in the industry, since, inter alia, the industry is not characterized by long-term customer relationships.
Substitute products
To the best of the Company's knowledge, no other service or product currently exists in this sector
which is a significant real substitute for its products designed to protect plants against weeds, pests
and disease, that are not of the same type of products produced by the Company or parallel original
products. Nevertheless, some view genetically modified seeds and non-selective herbicides such as
Glyphosate as products which may partially substitute for the Company's selective products in
certain territories and for certain crops. Additionally, natural and/or biological materials that attack
weeds, insects and diseases constitute a potential substitute for the use of the Company’s products,
but which currently are only commercialized in relatively modest volumes.
8. THE COMPANY’S PRODUCTS
Crop Protection Products
In recent years, the Company has been acting to further enhance its broad product portfolio, with an
emphasis on offering more innovative and differentiated solutions that offer increased added value,
and in so doing creating what the Company refers to as the “Hybrid Portfolio”. These innovative and
differentiated solutions are typically based on off-patent molecules or active ingredients, particularly
the more complex ones, on unique formulations and mixtures, and, on a selective basis, even on
innovative molecules or active ingredients, which the Company defends by registering patents and
other intellectual property rights. In so doing, the Company is, over time, changing its portfolio mix
by increasing the portion of innovative and differentiated products that in turn generate higher profit
margins.
The broad range of crop protection products manufactured and sold by the Company are divided
into three main categories (based on the active ingredient they contain):
Herbicides
During cultivation, crops are exposed to various weeds that grow in their environment and compete
for water, light and nutrients. Herbicides are designed to prevent or stunt the development of such
weeds to allow the cultivated crop to develop optimally throughout the different stages of its growth,
and therefore to reach optimum yield. The herbicides sold by the Company are both selective (do
18
not affect or harm the crop itself) and non-selective. The best-selling herbicides are those designed
to protect soy, corn, cereals, rice and cotton. In 2017, herbicides constituted approximately 40% of
the total global crop protection product market.20
Glyphosate, the world's most widely sold non-selective herbicide used for the basic treatment of
many crops, no longer constitutes a key product in the Company’s product portfolio. However, as it
is nevertheless remains an important product that is still one of the Company’s most sold products,
the Company ensures that it maintains minimal stocks of Glyphosate.
Insecticides
Insecticides are designed to exterminate various types of insects and pests in a selective manner
(without harming the crop itself). While the use of genetically modified seeds has the potential to
reduce the need for some of the Company's insecticides, as indicated in Section 6 of this chapter, at
the time of this report, such seeds are used to a limited extent and primarily in non-edible crops. The
best-selling insecticides are designed to protect fruits and vegetables, corn, cotton and soy.
Currently, the Company's gross margins from sales of insecticides are higher than its gross margins
from herbicide sales. In 2017, insecticides constituted approximately 28.7% of the total global crop
protection product market.20
Fungicides
Fungicides are designed to combat various diseases and parasitical fungi. When weather conditions
in the agricultural season are dry, the prevalence of crop diseases is much smaller, reducing demand
for such products. Crops in which fungicides are used most frequently are cereals, fruit, vegetables,
soy, grapevines and rice. Currently, the gross margins achieved from the Company's fungicide sales
are higher than those from herbicide sales. In 2017, fungicides constituted approximately 27.3% of
the total global crop protection product market.20
Other products
In addition, the Company produces and markets other crop-protection products, primarily
substances applied to crops that are not herbicides, insecticides or fungicides, and intermediates
used to produce active ingredients for crop protection. The Company also develops and sells
products for seed treatment and it uses its expertise to develop and adapt similar products for use
in non-agricultural areas (Consumer and Professional Solutions) to protect against weeds, disease
and pests in roadworks, forests, lawns, parks, institutions, the wood and paint industry, facilities and
private residential gardens.
For information regarding the breakdown of the Company's revenues and profit by product groups,
see Section 10 of this chapter.
20 As per the data provided to the Company by AgBio Investor. As of the date of filing the report, the Company has yet to receive data
regarding 2018; however, it should be noted that in recent years, there was no significant change in the portion of each product group within the total crop protection product market.

19
Key Markets
The Company's primary operations are focused on Europe, North America, Latin America, Asia-
Pacific and India, the Middle East and Africa, and in aggregate, the Company sells its products in
approximately 100 countries worldwide. In recent years, the Company has expanded its presence
in (i) the European market (including Eastern Europe), which represented approximately 29.9% of
the Company’s total sales in 2018; (ii) the North-American market, which constitutes an important
target for further growth and expansion of the Company’s operations, as well as (iii) the markets in
India, Asia-Pacific and Africa, which are generally characterized by high growth rates and rising
standards of living, as described in Sections 6 and 7 of this chapter above. The Company is also
continually strengthening its position in the important Latin American market, mostly in Brazil, by
focusing on expanding and diversifying its product portfolio and providing a more comprehensive
response to the variety of customers in this region, with their diverse requirements and
characteristics. In recent years, the Company has increased its presence in the Chinese market,
which is the third largest crop protection market in the world and is among the fastest growing
markets, through building its commercial and operational infrastructure in China, while the
Combination with ADAMA Ltd. supports the strengthening and expansion of its operations in said
market.
For details on the Company’s crop protection product sales in its primary markets in the years 2017-
2018, see the Board of Directors’ Report.
The Production Process
The production process of the active ingredients is executed through chemical reaction (synthesis)
of raw materials and intermediates. The Company’s entire product portfolio includes over 300 active
ingredients.
The Company also performs formulation, wherein active ingredients produced by the Company or
purchased from third parties are adapted by means of reducing the concentration of the active
ingredients and adding various additives, and sometimes by transforming the physical form of the
active ingredient (including its liquefaction or solidification, as the case may be). The Company's
entire product portfolio includes approximately 1,350 different formulations
The Company's operations include: (i) sale of products which are both synthesized and formulated
by the Company; (ii) executing various formulation activities on active ingredients purchased by the
Company prior to selling them to third parties; and (iii) commercial activity, on a smaller scale, in
purchasing end products and/or active ingredients from third parties and selling them "as is", without
any manufacturing intervention (generally to complement the Company's product portfolio).
Currently, approximately 80% of the Company’s products are manufactured and/or formulated at the
Company’s sites. Currently, the annual sales of any particular product sold by the Company do not

20
exceed 10% of total Company sales.
9. NEW PRODUCTS
The Company's strategy is to leverage its capabilities in the field of chemical industry and expand
its product portfolio to create a diverse product portfolio intended to provide efficient, effective and
simple solutions to farmers and to fulfill market needs, penetrate new markets and strengthen its
position in existing markets. In recent years, the Company has been operating to enhance its product
portfolio, by developing more value-adding products and increasing the functionality and efficacy of
the market’s most successful molecules through the development of new and unique mixtures and
formulations. Accordingly, the Company is continually developing and registering new products
alongside new mixtures and formulations of existing products.
In this respect, and in order to capitalize on future opportunities in the agrochemical market, the
Company has intensified its efforts to develop a leading pipeline of crop protection products aimed
at providing value-added solutions to farmers around the world, based on AIs that are expected to
come off-patent in the coming years. These newly off-patent AIs will be developed into new mixtures
and formulations, in combination with new formulation and delivery technologies that provide more
efficient ways to deliver the products into the plants, thereby creating truly unique and differentiated,
value-added solutions to farmers. In this way, the Company strives to achieve a double competitive
advantage – to be the first to market launching new products after the expiry of the patent on the AI,
and to capitalize on cost leadership through increased backward integration through the Company’s
global operations capabilities.
In 2018, the Company continued investing in the development and manufacturing of new products,
launched new active ingredients and formulations, and obtained 317 new registrations (excluding
re-registrations, label extensions of registered products for new crops and adding new sources) for
marketing its products. To the date of this report, the Company’s research and development activities
are aimed at the launching of additional sustainable and differentiated products.

21
10. PRODUCT REVENUE SEGMENTATION
Company revenues split by product groups (in million USD):21
2018
Product Group Revenues %
Herbicides 1,660 46.9%
Insecticides 942 26.7%
Fungicides 737 20.8%
Total crop protection 3,339 94.4%
Other operations 197 5.6%
Total 3,536 100%
2016
Product Group Revenues %
Herbicides 1,513 49.3%
Insecticides 724 23.6%
Fungicides 640 20.8%
Total crop protection 2,877 93.7%
Other operations 193 6.3%
Total 3,070 100%
Note that the volatility of insecticide and fungicide sales is higher than that of herbicide sales, since
the former are more sensitive to the presence or absence of diseases or pests affecting the crops.
It shall be further noted that Company's scope of sales of active ingredients is immaterial in
comparison to end product sales (such as mixtures and formulations).
21 In the past 3 years there was no material change in the gross margin rate of each of the aforementioned product groups in comparison
to 2014. As for the raw profit of each of the aforementioned product groups as for 2014, see section 9 of chapter A of 2014 annual report (Ref No. 056413-01-2015 )
2017
Product Group Revenues %
Herbicides 1,540 49.1%
Insecticides 782 24.9%
Fungicides 625 19.9%
Total crop protection 2,946 93.9%
Other operations 191 6.1%
Total 3,137 100%

22
11. CUSTOMERS
Characteristics and Nature of Business Relationship
The Company’s customers are numerous and are distributed across many countries throughout the
world, such that in some countries, sales are made to a relatively small number of customers.
Generally, the Company's products are primarily sold to regional and local distributors in the different
countries, that in turn market them to end customers in that country, some of which are large
cooperatives. The Company also sells, inter alia, to multinational companies and to other producers
that manufacture end-use products based on active ingredients sourced from the Company.
Currently, the Company has no single customer whose purchases exceed 10% of its turnover, and
the Company believes that it is not dependent on any single customer.
The vast majority of sales are made to regular customers, typically without long-term supply
contracts, as is customary in the industry. In most countries, purchases are made without long-term
advance orders, while in some areas they are made based on (non-binding) rolling sales forecasts
and actual orders. The Company's actual production is based on these forecasts.
The Company’s sales prices to customers are determined by, among other things, comparing with
equivalent products sold by the Company’s competitors and by the quantity ordered, with discounts
occasionally offered conditioned upon minimum order quantities. These discounts are included in
the Company's Financial Statements relatively to the progress in meeting the relevant targets, but
only when these targets are expected to be reached and the discounts may be reasonably estimated.
Supply Chain
Generally, the supply chain between the Company and the end customer who ultimately purchases
its products in the different countries around the world may be characterized as follows:
Due to the expansion of the Company's activities and the acquisition and establishment of
subsidiaries in different regions of the world, in most cases, these subsidiaries carry out the role of
the formulator and/or the importer, and occasionally also the role of the distributor and the retailer.
In the past, farmers stored the inventory in their own warehouses, but this trend has changed and
today most of the inventory is stored in the importers' warehouses.
Distributor
Importer / Formulator
Retailer
Farmer

23
Customer Credit Policy
For information regarding the Company’s customer credit policy, see Note 29B to the Financial
Statements.
For changes in the provision for doubtful debts during 2018, see Note 29B(2) to the Financial
Statements.
12. DISTRIBUTION AND MARKETING
The Company's marketing operations are global and designed to consistently increase profits and
market share. The Company markets its products directly through local representation in all of the
largest agricultural markets worldwide by means of local sales people and actions oriented toward
the distributors, agricultural consultants and farmers.
In recent years, the Company has operated to strengthen its marketing network, including by means
of:
▪ The establishment and acquisition of distribution companies in different regions in order to
decrease dependency on external distributors and increase profit margins. Within this context and
as part of the Company’s long-term strategy, in December 2015 the Company entered into a
collaboration agreement for gradually becoming the exclusive distributor in China of the
formulated agrochemical products of ADAMA Ltd. and of several agrochemical companies
controlled by CNAC. This collaboration, which was later broadened to include also active
ingredients, supports the strengthening of the Company’s position in the domestic Chinese crop
protection market by combining the sales of the Company’s products with those of the CNAC
companies, and while using the distribution platform in China, which commenced its activity at
the beginning of 2016 and since then - in the years 2017-2018 more than duplicated the
Company’s sales in China. See also section 30 of this chapter.
▪ Establishing marketing and management of product strategy, while cross applying different
growing segments.
▪ Strengthening the consolidated global brand for the entire Group and its products – “ADAMA” –
that was launched during 2014. In this context, the Company implements a global brand
architecture, which simplifies hundreds of local brands and product names by dividing them into
two main categories, “Advanced” and “Essentials”.
▪ Developing digital technologies for simplifying and enhancing direct access to farmers.
In a small number of countries where the Company does not have subsidiaries, it operates through
(mostly exclusive) networks of local agents and marketing channels. This activity is not material in

24
scope to the Company.
In some markets in which the Company operates, due to centralized marketing channels, external
distributors often will only distribute off-patent crop protection products from a limited number of
manufacturers. Since the Company’s marketing network in its main markets is based on directly
owned and controlled subsidiaries, the Company believes that it is not dependent on external
marketing channels, the loss of which could have a significant adverse impact on its operations. The
Company has a broad and diverse customer base, and as a result thereof it does not have any
external distributor whose distribution volume of the Company's products exceeded 5% of the
Company's sales in 2018.
The Company estimates that, although the termination of an engagement with a single external
distributor will not have a material adverse impact on it, should external distributors generally elect
to sell competing products and not to distribute the Company's products, this could adversely affect
its results in countries wherein the majority of commercialization activities are by means of external
distributors.
The Company's marketing and sales expenses in the crop protection segment totaled in
approximately USD 614 million in 2018, constituting 18.4% of total sales for the year.
13. COMPETITION
The crop protection market is dominated by five multinational companies, four which have annual
revenues exceeding USD six billion in the crop protection product segment (excluding seeds
activities). In the last three years, a number of mergers and acquisitions were completed among the
largest players in the crop protection industry – the merger between Dow and DuPont which created
Corteva, the acquisition of Monsanto by Bayer, and the acquisition of a large part of the DuPont
crop-protection portfolio, including products under development and infrastructure of R&D, by FMC.
As for the acquisition of Syngenta by ChemChina, see section 1 of this chapter. In addition, during
2018, UPL announced about the purchase of Arysta, a transaction that was completed on January
2019. Nonetheless, the crop protection industry as a whole is relatively decentralized with a large
number of local manufacturers competing in each country against the global multinational
companies.22 The Company believes that the entry barriers for the crop protection market are
relatively high, however, they vary from region to region.
In 2018, to the Company's best knowledge, the Company was the world’s largest company (in sales
terms) among the crop-protection companies that focused on off-patent active ingredients. The
Company was ranked sixth in the global crop-protection industry in 2018, which includes both
22 See Section 34 of this chapter, under the heading "Operating in a competitive market."

25
Originator Companies and off-patent companies, with a global market share of approximately 5.8%
in 2018, based on preliminary estimations made by AgBio investor regarding total sales in the crop
protection industry in 2018.
The Company's competitors are multinational Originator Companies that continue to produce and
market their original products after the patent expiry, as well as other crop-protection companies.
According to Company's experience, in most cases the Originator Company’s market share in a
particular product falls to approximately 60% – 70% within a number of years following the expiry of
the relevant patent, leaving the remaining market share open to competition among off-patent
companies, in addition to their competition with the Originator Company (which continues
manufacturing the product and even leads its market prices and sales terms).
The Company competes with Originator Companies as well as other international off-patent
companies in all the markets in which it operates, since these generally also have global marketing
and distribution networks. In addition, there are several smaller Originator Companies that also
create competition to the Company’s products. As a rule, other off-patent companies that do not
have international marketing and distribution networks compete with the Company locally in those
geographical markets in which they operate.
In the last few years, some new emerging trends that may affect the nature of competition in this
sector can be identified: (1) The market share of products whose patents have expired continues to
rise relative to that of patented original products, primarily due to the fact that the rate of patent expiry
exceeds that of new patent registration; (2) A trend of some off-patent companies expanding and
becoming stronger (inter alia, as a result of corporate mergers and acquisitions as well as product
acquisitions), which may lead to them competing with the Company in geographic markets which
they have not operated yet up to now; (3) Smaller companies have begun operating, in limited scale,
in certain markets with relatively lower entry barriers, as detailed in Section 7 of this chapter; (4)
Development of the agrochemicals industry in China; (5) Price competition in certain markets by
multinational Originator Companies and/or increasing the credit days to its customers; and (6)
Mergers and Acquisitions among leading companies in the sector.
The Company's expertise in successfully launching new off-patent products, as close as possible to
the expiry of the patents of the original products, represents a crucial factor in maintaining the
Company's position in the global crop protection market.
The Company believes that it currently enjoys significant competitive advantages owing to, inter alia,
the geographic deployment of its sales in more than 100 countries and the balanced distribution of
its areas of operation, which increases its growth potential; the Company's capabilities in research
and development, as well as substantial technological and chemical, enabling it to develop and
market new compounds, mixtures and applications for its products in a manner that provides a
potential competitive edge over Originator Companies; its professional knowledge; strong

26
agronomical capabilities; wide portfolio of unique products suited to the needs of the farmers; strong
brand and reputation; financial stability and the availability of financial resources for building and
upgrading production facilities; development capabilities and regulations in various markets around
the world (and the resulting ability to launch off-patent products a close as possible after patent
expiry); presence throughout the entire value chain (development, production, procurement,
marketing, sales, distribution and registration) in a manner that sets the Company apart from the
competing off-patent companies; tight quality assurance; strict observance of environmental
standards; existence of a global marketing and distribution network and production and marketing
collaborations with multinational companies; and the leading of the Company by a management with
in-depth understanding of the crop protection product industry as well as the required know-how,
skills and experience to contribute to the Company's growth and profitability, and positioning it in a
leading position in the global market. These capabilities enable the Company to respond to the
dynamic needs of farmers, changing weather conditions and changes in governmental policies and
regulation.
Moreover, in recent years, the Company has been striving to adapt its business model to the
changing conditions in the competitive environment in which it operates. The Company believes that
the combination of all its actions together with the Combination with ADAMA Ltd. and the business
integration in China, will enable the Company to use the differentiated business model that will
contribute to the continuing strengthening its competitive position and will give it a clear advantage
over its competitors, stating its unique position in the global market, so that it will become one of the
few suppliers in the crop protection industry worldwide with a significant integrated commercial and
operational foundation in China.
The Company's assessments with regard to the impact of the Combination with ADAMA Ltd. and
the business integration in China on its competitive position is forward looking information as defined
in the Securities Law, which is based on the Company's subjective assessments and those of
external entities and information relating to the crop protection industry in China. These assessments
may change, inter alia, due to changes in the operating results of the Company or the competing
companies, including as a result of the developments in the crop protection market, changes in
demand for the Company products, and global macro-economic trends.

27
14. SEASONALITY AND WEATHER
Sales of crop protection products are directly influenced by the agricultural seasons, weather and crop cycles.23 The tables below include the geographic segmentation of the Company's quarterly sales (in million USD million) and their proportion of the Company’s sales in 2017 and 2018:
23 See Note 1A(2) to the Financial Statements and Section 34 of this chapter titled “Decline in scope of agricultural activities; exceptional weather conditions changes"
2018 Q1 Q2 Q3 Q4 Full year
Europe 392 42.6% 308 33.2% 168 21.2% 188 21.0% 1,056 29.9%
North America 186 20.2% 203 21.8% 122 15.5% 204 22.7% 715 20.2%
Latin America 138 15.0% 171 18.4% 274 34.7% 344 38.4% 927 26.2%
Asia-Pacific 116 12.6% 105 11.3% 75 9.6% 82 9.2% 380 10.7%
India, Middle East and Africa 88 9.6% 142 15.3% 150 19.0% 78 8.7% 458 13.0%
Of which, Israel 26 2.8% 31 3.3% 25 3.2% 25 2.8% 107 3.0%
TOTAL 920 100% 929 100% 790 100% 896 100% 3,536 100.0%
% of annual sales 26.0% %26.3 22.4% 25.3%

28
2017 Q1 Q2 Q3 Q4 Full year
Europe 398 47.2% 268 34.5% 205 27.4% 152 %21.3 1,042 33.2%
North America 167 20.0% 190 %22.9 118 15.8% 154 %21.5 631 20.1%
Latin America 115 %13.6 147 %17.7 228 30.4% 251 35.0% 740 23.6%
Asia-Pacific 87 %10.3 91 %10.9 62 8.3% 70 9.7% 310 9.9%
India, Middle East and Africa 74 %8.7 116 14.0% 136 118.1% 89 %12.4 414 13.2%
Of which, Israel 23 2.7% 26 %3.1 23 3.1% 25 3.5% 97 3.2%
TOTAL 843 100% 830 100% 749 100% 715 100% 3,137 100%
% of annual sales 26.9% 26.5% 23.9% 22.8%

29
15. INNOVATION, DEVELOPMENT, RESEARCH AND REGISTRATION
The Company has an Innovation, Development, Research and Registration division (IDR), which
manages and coordinates all the research and development and regulative activities regarding the
Company's products.
In general, the Company, as an off-patent product manufacturer, develops production processes and
registration data for molecules present in the original product. Development and registration of off-
patent products offer a significant saving of time and costs in relation to the development costs of
the original products required from Originator Companies in a manner which allows the Company to
develop a broad and diverse offering of largely off-patent products at competitive prices.
Nonetheless, to introduce a new off-patent product to the market still requires considerable
investment in development and registration, particularly in view of the increasing regulatory
requirements globally, and the development of, and increasing competition in, the off-patent products
market.
Chemical R&D and Development
The Company's primary development and registration activities focus on the chemical-engineering
development of production processes for active ingredients and new off-patent products, biological
and agronomical tests designed to meet regulatory requirements, development of registration
dossiers for the active ingredients and formulations that make up its registration portfolio in the
various regions, development of mixtures and of innovative and unique formulations of existing
products, as well as streamlining of production processes.
The Company has also developed several innovative substances, based on molecules acquired
from external sources after a screening process proving their effectiveness. The Company develops
the product's biological uses and registers them in the target countries, as well as engages in
chemical development of the production process.
The Company recently adopted a key developing strategy. For further details see section 9 – “New
Products” to this chapter.
To the date of this report, the Company operates chemical research and development centers in
Israel, India, Brazil, and China. In addition to chemical development, the Company conducts
development activities for registration purposes through external contractors in Israel and other
countries, including China. Such development efforts may on occasion integrate knowledge
exclusively owned by the Company, knowledge jointly developed with the subcontractor, or
knowledge exclusively owned by the subcontractor.
Currently, the Company operates several analytical labs in Israel, China, India, U.S.A. and Brazil,
which inter alia, conduct Quality Assurance (QA) tests for its various products, and some of which
30
also conduct tests for registration purposes.
In 2018 the amounts recognized as research and development expenses (excluding registration
costs) totaled approximately USD 48 million, which constituted approximately 1.4% of the
Company's consolidated revenues. Research and development expenses are not recognized as
intangible assets.
The Company workplan includes research and development expenses of USD 54 million for the
twelve months following the date of this Report.
See Note 19B to the Company's Financial Reports for details regarding development grants.
Registration
The materials and products marketed by the Company require, at various stages of their production
and marketing, registration in every country where the Company intends to market them. The
Company has development and registration centers, located in Europe, Israel, Latin America, Brazil,
North America, India and Asia. The Company has gained registration expertise in over 100 countries.
For this purpose, the Company employs approximately 200 experienced professionals in the
registration of its products around the world. In addition, the Company utilizes the services of external
contractors for the development of registration data.
Crop protection products are sold worldwide under the supervision of state authorities in each
country (generally the Ministries of Agriculture, Health and Environment), with such registration
proceedings characteristic of the crop protection industry and constituting a hurdle that required
overcoming in order to enter the industry. Obtaining a registration requires meeting health, safety
and environmental standards. Registration requirements change from time to time and tend to
become more stringent over time in various countries. As a result, registration costs rise, and
preparation of registration dossiers becomes more time consuming. In some countries, registrations
have no time limit, however, development of further registration data is required every several years.
In some countries, registrations are limited to periods ranging from 5-15 years and are required to
be renewed, with additional tests and data required as a part of the process.
The registrations, in all or in part, may be revoked should new data fails to meet the updated required
criteria. The time to obtain a registration may take several years and the Company must meet the
specific registration requirements of a particular country for the sale of the product in that country. In
order to comply with these requirements, the Company continuously examines the compliance of its
products with the registration requirements in the various countries where its products are sold, and
it works to develop necessary data and supporting information, as required. Within this framework,
the Company continuously submits applications for the renewal, extension or update of registrations
of products to the registration authorities around the world. Some of these requests were approved
and some are being examined by the authorities, and such examination processes may last several

31
years.24
Generally, the EU, U.S.A., Japan and Brazil have the most stringent regulatory standards. Other
countries are gradually adjusting own requirements to reach the standards of the advanced
countries.
For information regarding new registrations obtained in 2018, see Section 9 of this chapter.
Registration costs are typically amount to several hundreds of thousands of US dollars per product,
and in countries such as the U.S.A., the EU and Japan, they may even reach several million USD
per product.
In 2018, the Company's registrations expenses were USD 88 million, including depreciation, which
constituted approximately 2.5% of the Company's annual revenues.
Registration in the United States
The registration process in the U.S.A includes federal registration by the Environmental Protection
Agency (EPA) for the active ingredient and chemical formulations, which are the end products for
sale. Moreover, every individual state requires registration of the commercial end-use formulation
that has been registered at the federal level, based on the criteria of the individual state.
There are two primary methods for obtaining federal registrations in the U.S.A.:
▪ For products containing an innovative active ingredient, the registration applicant is required to
submit a complete portfolio which includes all the relevant data and research findings in order to
obtain the registration (process duration is approximately more than two years, with an average
of 33 months).
▪ Following a registration period of 10 years, after complying with citing all the existing protected
data of another company's active ingredient (Cite All), demonstrating that the off-patent active
ingredient is chemically similar to the registered active ingredient in that country, and providing a
commitment to compensate the Originator Company, an off-patent registration may be pursued.
The process for obtaining the off-patent registration from the federal authorities may last between
ten to twelve months. After fifteen years from submitting the date for the support of the original
registration, the data constituting the basis for the registration is available to the public, and from
this point forward there is no liability for compensation.
As part of the EPA's re-registration requirements, several companies may pool their resources to
save time and money to prepare the newly required data by creating a " task force". The Company
has a reputation of a professional and reliable group, therefore international companies tend to
cooperate with it in this process.
24 For additional information on the licensing requirements applicable to the Company and the related risks, also see Section 34 of this
chapter, under “Legislative, standards and regulatory changes in the product licensing sphere”

32
Registration in Europe
All new ingredients intended for use in EU countries undergo a rigorous registration process
comprised of two main stages. The first stage enables the inclusion of the active ingredient in the list
of ingredients permitted for use in EU countries. In the second stage, the final product has to be
registered for its various uses in the EU countries in which the product will be marketed. Current
regulation is based on a hazard-based cut-off criteria approach that allows the rejection of
registration applications based on their potential hazard and not based on the risk from actual
exposure to the active ingredient.
With regard to new registrations and registration renewals in Europe, the Company collaborates with
several other companies to jointly develop the data and information required so as to reduce the
costs, labor and risks inherent to this process.
The Company estimates that due to the stringent approach of the EU and its associated institutions
in recent years, the Company’s product portfolio (along with those of competitors in the entire
industry) may be influenced in the coming years by refusals to renew registrations and/or the
rescinding of registrations as a result of the removal of certain active ingredients from the list of
ingredients permitted for use in the EU.
The Company's estimates regarding the effects of the various regulatory requirements on its product
portfolio constitutes forward-looking statements as defined in the Securities Law, which is based on
current regulatory trends and the Company's experience. These estimates may not materialize or
may be realized in a different manner, inter alia, due to factors beyond the Company's control such
as crop protection market developments, regulatory, economic, political, social and other changes,
as well as changes in demand for the Company's products.
Registration in Brazil
The registration procedure for off-patent active ingredients in Brazil is based on the equivalence of
its chemical properties to those of an active ingredient currently available in the market. The first off-
patent registration of an active ingredient can only be granted after the patent and the data protection
expires, generally, 10 years after first registration approval as a patent. The process follows
FAO/WHO general rules, divided into 3 tiers, from the physical-chemical comparison to the last tier,
full long term toxicological studies being required. Generally, if the registration applicant proves
chemical equivalence to the existing active ingredient, it may be granted a registration. For the
formulation registration, there are additional requirements. The review process in Brazil generally
lasts at least six years for formulations, five years for an off-patent active ingredient and seven to
eight years for an innovative active ingredient (first active ingredient registration).

33
16. INTANGIBLE ASSETS AND INTELLECTUAL PROPERTY
Most of the Company's crop protection products (both in absolute volume and in relative sales terms)
are off-patent products. Nevertheless, the Company has a relatively broad portfolio of patents,
trademarks and registrations protecting its intellectual property rights and production processes.
Consequently, the Company has 28 patent families that protect innovative materials and approximately
68 more patent families, relating to both off-patent and innovative materials, that protect processes,
formulations, uses and unique mixtures. The Company also relies on trademark registration to secure
its reputation for the products it manufactures and markets. Currently, the Company owns over 8,500
active trademarks with respect to its products (mostly registered and a few in registration processes).
In addition, the Company has several exclusive territorial licenses for various additional substances.
For information on patents and intangible assets of Lycored, see Section 18 of this chapter.
The Company has an intellectual property department within its legal department responsible for
protecting the Company’s intellectual property through the registering of patents for the Company's
developments and the trademarking of its products, as well as by taking action to revoke invalid
patents of third parties.25
In accordance with the generally accepted accounting principles, the amounts recognized as the
Company's intangible assets in the Financial Statements of December 31, 2018 (including subsidiary
goodwill) totaled approximately USD 902 million.
17. RAW MATERIALS AND SUPPLIERS
The Company procures a large variety of raw materials, which may not be uniformly characterized,
together with complementary raw materials required to produce the finished products and/or their
formulations.
The shelf lives of most of the raw materials are generally several years, and they remain stable over
these years. Moreover, the shelf lives of raw materials may usually be extended by simple
treatments. In view of this fact, raw material losses in Company warehouses as a result of aging are
negligible.
The most significant element of the Company's cost of sales is the cost of raw materials used in its
industrial activities, which is primarily influenced by global changes in the supply of raw materials,
and, to a certain extent, extreme fluctuations in international oil prices.26 Similarly, the cost of
purchasing finished products for marketing to third parties is also significant.
25 For further information, see also section 34 of this chapter, under "Intellectual property rights of the Company and of third-parties." 26 For further information with regard to oil price fluctuations and the possible influence on the Company results see Section 6 of this
chapter, under “Significant fluctuations in raw material costs and global energy prices.”
34
In 2018, the costs of raw materials, packaging and labeling, for the crop protection products,
amounted to approximately USD 1,460 million. This cost constituted approximately 75% of the
Company's total production costs in this segment (excluding finished products), which amount to
approximately USD 1,936 million.
The Company purchases its raw materials from various suppliers, primarily in China, Europe, the
U.S.A., and South America. The Company's supplier network has not changed significantly over the
past few years, but nevertheless, there has been a gradual increase in the volumes procured from
various suppliers in China (without a material reduction in the quantities bought from the Company's
other suppliers) due to the wide range of products and competitive prices offered by these suppliers,
together with the improved quality of the products that are examined by the Company through the
performance of product quality testing in China.
Currently, the Company believes that it is not dependent on any material supplier.27
27 For further information regarding supplier credit, see section 24 of this chapter.
35
A.2. OTHER ACTIVITIES
In addition to crop protection, the Company's primary field of operation, it is also active in various
other fields outside of crop protection. The Company's aggregate revenues from, and investments
in, these other activities do not exceed 10% of its total consolidated revenues and investments.
Currently, the Company has operations in the following other activities: 1) dietary supplements, food
color, texture and flavor enhancement ingredients, and food fortification ingredients; (2) fragrance
products; (3) industrial products and (4) additional products.
In these other activities, the Company leverages its knowledge, experience and chemical and
industrial capabilities. In view of the highly diverse nature of these other activities and products, and
since they do not represent core Company activities and they are limited in scope, they are
hereinafter reviewed and analyzed separately, to an extent commensurate with their share of the
Company’s results.
18. DIETARY SUPPLEMENTS, COLOR, TEXTURE AND TASTE
ENHANCEMENT INGREDIENTS AND FOOD FORTIFICATION
INGREDIENTS
The Company holds 100% of Lycored Ltd. ("Lycored") which engages primarily in developing,
manufacturing and marketing dietary supplements ("DS"), special ingredients for the color, texture
and taste enhancement of food, and food fortification ingredients (the "Supplements"), primarily for
non-Israeli markets.
Lycored holds development, production, marketing and distribution infrastructures. The Lycored
plants are located in Israel (in Be’er-Sheba), the U.S.A. and Ukraine.
Products
Lycopene
One of Lycored's unique products is natural Lycopene produced from tomatoes. Within this
framework, Lycored has developed a unique and innovative process for producing natural Lycopene
(the carotenoid that gives the tomato its red color), which is ascribed by some to have properties for
protecting the human body against degenerative and malignant diseases. In order to produce
Lycopene, Lycored has developed unique tomato strains (primarily intended for industrial
applications) with particularly high Lycopene content. In addition, Lycored has developed
technological capabilities for extracting, separating and formulating the products resulting from
tomato processing and adapting them to market requirements.

36
Beta-Carotene
Lycored produces and markets Beta-Carotene produced by a process of fermentation. Additionally,
Lycored possesses technological abilities to extract, separate and formulate the products resulting
from fermentation and the production of a variety of products, primarily for the DS and food industries.
Lutein
Lycored also operates in the development, formulation and marketing of Lutein-based products
primarily for the DS and food industries.
Lycored has few additional products: (1) Active formalized and coating ingredients in the DS market;
as well as (2) Mixtures, such as vitamins, minerals and other natural materials for food fortification.
Lycored's gross margins are not materially different to those of the Company's in the crop protection
segment.
Market Structure, Recent Changes and Competition
The food and nutrition industry may be characterized by retail-based competition, technological
conservatism and increasing commitment to the quality of food and supplements, health
consequences, consumer nutritional habits and changes in their tastes. These factors require the
industry players to maintain technological innovation, responsiveness to the requirements of
customers, the ability to meet high quality standards, alongside with proving the effectiveness of the
marketed products. For these reasons, this industry is characterized by consolidation, and as a result
the reduced competitiveness of small companies. Nevertheless, companies with unique products
and reputation, such as Lycored, have managed to solidify their position despite the aforementioned
trend.
The DS industry is exposed to competition that has increased considerably in recent years from
manufacturers marketing raw materials and also, recently, formulated materials. In addition,
Lycored’s products in the DS field compete with other products that are based on natural ingredients
with health properties. Other competitors are the natural Lutein producers such as Kemin Industries
Inc., formulators such as DSM Nutritional Products and manufacturers of vitamin and mineral
mixtures such as Glanbia and DSM.
Changes in Volume and Profitability
In 2018 Lycored's sales to customers outside the group totaled approximately USD 91 million,
compared to USD 92 million in 2017. Lycored's sales remained steady mainly due to including Lycord
group’s vitamins mixtures activity in the total sales in 2017. However, the decrease derived from the
sale of said activity was offset by the increase in sales which derives from the consisting focus of
Lycored’s business strategy, for the purpose of increasing the potential market share of its products
in comparison to alternate competitive products and significant growth in demands in new markets
wo which Lycored has entered in the last years.

37
Currently, Lycored's market share is not material in each of its product groups.
Barriers to Entry
As a company active in the Supplements arena, Lycored is required to obtain and maintain various
permits and licenses, as well as to meet many standards, including quality standards, required by
customers in the field in various countries. In addition, companies who operate in this field require
knowledge, specialist technologies together with vast experience. In turn, these require equity,
financial abilities and reputation.
Customers
Lycored's customers are primarily industrial companies, including those producing and selling end
products to food chains and stores, and industrial companies who formulate and package ingredients
supplied by Lycored for dietary supplements and private label products.
Marketing and Distribution
Currently, Lycored primarily sells its products in North America, Europe, Japan, Korea and other
countries in the Far East. Sales are executed through specific, current orders received shortly before
required supply date. Lycored's estimates are based on non-binding forecasts of annual order
volumes from key customers. Over the years, Lycored has developed its own marketing and
distribution channels, as well as customer and technical support services in the markets where it is
active. Lycored occasionally utilizes local agents.
R&D
The research activity focuses on cultivation of strains of tomatoes, advanced formulation capabilities,
isolation of active ingredients, food coloring and clinical research to examine the potential health
benefits of the products.
Regulatory Restrictions, Registrations and Permits
Production and marketing of dietary supplements and food additive ingredients are generally subject
to the national health agencies and the registration and quality requirements. Lycored has received
FDA approval for the use of natural Lycopene as a food coloring for the U.S. food industry, in addition
to permits to distribute the product in Europe and Japan.
In Israel, activities in this field are subject to the Public Health (Food) (Dietary Supplements)
Regulations, 5761-2001, which establish permitted supplements, their measures and amounts. Most
of the vitamins and minerals imported by Lycored require import licenses from the Ministry of Health.
Raw Materials and Suppliers
The raw materials used in Lycored's products are tomatoes, marigold flowers, algae, vitamins,

38
minerals and amino acids. Consequently, its primary suppliers in this field are farmers, hence their
supply is also dependent on factors affecting the agricultural industry. Moreover, Lycored has
contracted with a seed company for the supply of special tomato strains, as well as with growers in
Israel to whom it supplies the seeds and growing instructions for the tomatoes. In addition, Lycored
purchases active ingredients, vitamins and minerals from companies in the west and in east Asia.
Intellectual Property
All of Lycored's products are the result of original independent development. Lycored holds 28
registered (or in advance registration stages) patent families related to production and formulation
processes or the compositions and properties of active ingredients Lycored develops. Lycored also
owns several brands that are registered as trademarks.
19. AROMA PRODUCTS FOR THE COSMETICS AND FLAVORS &
FRAGRANCES (F&F) INDUSTRIES
The Company indirectly holds 100% of the shares of Agan Aroma and Fine Chemicals, Ltd. ("Agan
Aroma"), which is primarily involved in the development, manufacture and marketing of chemicals
and synthetic fragrances for the detergent industry (soaps, washing powders, laundry softeners,
cleaning agents, etc.), for the cosmetics and body care industry (lotions, shampoos and deodorants)
and for the fine fragrances industry, and recently has begun selling branded fragrance products to
end customers. The great majority of fragrance products are designated for export. Agan Aroma
owns a number of fragrance products used to produce scent extracts. Agan Aroma has several
aromatic products which are utilized as raw materials for aromatic essences. Agan Aroma's products
comprise the raw materials included in the product.
Agan Aroma's activity focuses on manufacturing of chemicals, synthetically, based on organic
synthesis of fragrances for the fragrance industry in its dedicated facilities in Ashdod. Most of the
raw materials of the fragrance products are chemicals with a high-level cleaning rating.
The Company cooperates with a Swiss company to manufacture and market fragrance and flavor
materials in its Adama Agan plant.
Market Structure and Recent Developments
The fragrance chemicals market has developed considerably over the past few years in view of rising
standards of living and changing preferences of end consumers. In 2018, the market suffered from
an increase in raw materials costs, deriving from shutdowns and suspensions of production facilities
of raw materials suppliers in China, leading to end products shortages and prices increase. In light
of this trend, Agan Aroma engaged with alternative raw materials suppliers in Europe and India, thus
increasing its market share, while avoiding costs increase and increasing prices as evidenced in the

39
increase in Agan Aroma’s sales and its improved profitability. Activity in this area requires innovation,
expertise and advanced R&D processes, as well as the technological knowledge required for
sophisticated production, low-cost manufacturing capabilities, optimal deployment and management
of an international sales network, and initial capital for investment in complex production facilities.
Customers
Approximately 20% of Agan Aroma's customers are multinational companies that are responsible for
approximately 70% of its sales volumes. Agan Aroma supplies most of the leading companies in the
fragrance industry who between them have an aggregate market share of approximately 75% of
global fragrance activity. Its major customers in this area include multinational corporations such as
Firmenich, Proctor & Gamble, Givaudan, Symrise, Takasago, Mane and Robertet. Fragrance-
compounds are usually developed in accordance with customer requirements, requiring long-term
strategic relationships with the client, as well as collaboration in development and individual product
customization.
Marketing
The majority of the sales are based on long-term contracts and orders, with the remainder arising
from current orders.
Competition
The fragrance products industry is characterized by extreme competition. Agan Aroma's primary
competitors include leading F&F multinationals with production capabilities in this field, such as IFF,
leading chemical companies and other companies in India and China. The entry of manufacturers
from China and India into the market with products of improved quality which led to a significant
reduction in prices in the past years, was confined in 2018, due to the shortages of raw materials,
resulting in price increases and improvement in profitability. Due to the aforementioned processes,
Agan Aroma is operating to create opportunities to enter new markets in which its advantages may
be realized and may yield growth and improved margins.
Regulatory Restrictions, Registrations and Permits
Agan Aroma products are subject to strict health and safety standards.
Raw Materials and Suppliers
In order to maintain high quality and availability, manufactures in the sector such as Agan Aroma
require long-term relationships with suppliers. Agan Aroma's primary raw material suppliers are
chemical suppliers based outside Israel. Currently, Agan Aroma is not dependent on any single
supplier. Finished products in the F&F sphere is usually stored for a period of six weeks on average.

40
Turnover and Profitability Developments
The group's sales of Agan Aroma's products to customers outside the group amounted to
approximately USD 50 million in 2018 compared to approximately USD 46 million in 2017. The gross
profit and operating profit trend of improvement is the result of improvements in production
processes, logistics and prices raise in most of Agan Aroma’s products in 2018.
20. INDUSTRIAL PRODUCTS
The Company manufactures and markets industrial products, which are primarily by-products of its
crop protection production processes, and on occasion raw materials, as follows:
▪ Hydrogen peroxide, used mainly in the production of detergents for the paper and chemical industries;
▪ Electrolysis products, sold by the Company to industrial companies primarily in Israel
▪ CO2 and hydrogen for industrial uses, primarily in the food industry;
The Company's industrial products operations include the manufacturing of chemicals, as well as
the import and marketing of industrial chemicals in Israel.
Industrial products sales to customers outside the group in 2018 totaled approximately USD 55
million, compared to approximately USD 51 million in 2017.
Customers
Since this area of activity involves basic chemicals, the variety and type of customers that are in
need for these products are wide. These primarily include industrial companies, including in fields
such as food, energy, textiles, plastics, construction and chemistry. As stated, the majority of the
Company's customers in this field are Israeli. Industrial chemical products are marketed by means
of dedicated distribution agreements or on an order basis, as the case may be.
Competition
The Company controls about half of the Israeli industrial chemicals market. Its primary competitors
in Israel include importers and local manufactures, such as Fertilizers and Chemicals, Ltd., Maxima
Air Separation Center Ltd., Depotchem, Ltd., Chimcol Chemicals Ltd and Sha'ar Chemicals Ltd. .
Raw Materials and Suppliers
Most of the raw material inputs in this field derive from the Company's crop protection product activity.
Inventory periods are short, usually no more than a few weeks.
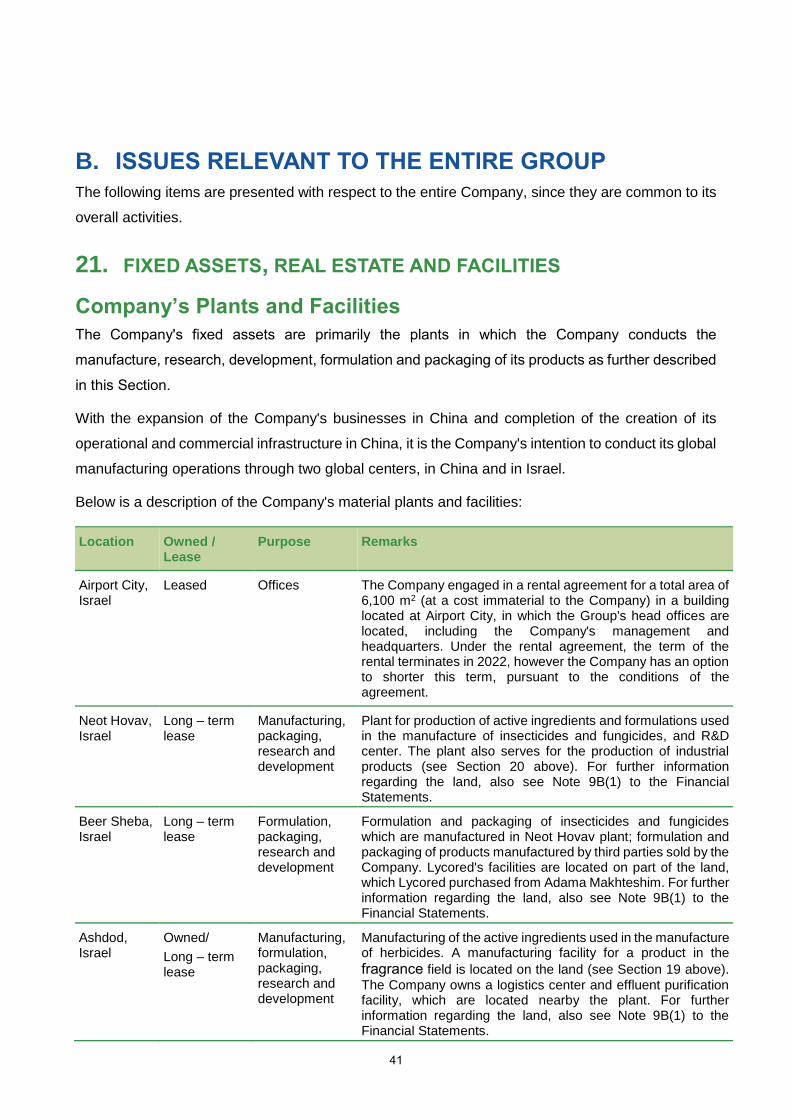
41
B. ISSUES RELEVANT TO THE ENTIRE GROUP The following items are presented with respect to the entire Company, since they are common to its
overall activities.
21. FIXED ASSETS, REAL ESTATE AND FACILITIES
Company’s Plants and Facilities
The Company's fixed assets are primarily the plants in which the Company conducts the
manufacture, research, development, formulation and packaging of its products as further described
in this Section.
With the expansion of the Company's businesses in China and completion of the creation of its
operational and commercial infrastructure in China, it is the Company's intention to conduct its global
manufacturing operations through two global centers, in China and in Israel.
Below is a description of the Company's material plants and facilities:
Location Owned / Lease
Purpose Remarks
Airport City, Israel
Leased Offices The Company engaged in a rental agreement for a total area of 6,100 m2 (at a cost immaterial to the Company) in a building located at Airport City, in which the Group's head offices are located, including the Company's management and headquarters. Under the rental agreement, the term of the rental terminates in 2022, however the Company has an option to shorter this term, pursuant to the conditions of the agreement.
Neot Hovav, Israel
Long – term lease
Manufacturing, packaging, research and development
Plant for production of active ingredients and formulations used in the manufacture of insecticides and fungicides, and R&D center. The plant also serves for the production of industrial products (see Section 20 above). For further information regarding the land, also see Note 9B(1) to the Financial Statements.
Beer Sheba, Israel
Long – term lease
Formulation, packaging, research and development
Formulation and packaging of insecticides and fungicides which are manufactured in Neot Hovav plant; formulation and packaging of products manufactured by third parties sold by the Company. Lycored's facilities are located on part of the land, which Lycored purchased from Adama Makhteshim. For further information regarding the land, also see Note 9B(1) to the Financial Statements.
Ashdod, Israel
Owned/
Long – term lease
Manufacturing, formulation, packaging, research and development
Manufacturing of the active ingredients used in the manufacture of herbicides. A manufacturing facility for a product in the
fragrance field is located on the land (see Section 19 above).
The Company owns a logistics center and effluent purification facility, which are located nearby the plant. For further information regarding the land, also see Note 9B(1) to the Financial Statements.

42
Location Owned / Lease
Purpose Remarks
Londrina, Brazil
Owned Manufacturing, formulation, packaging, research and development, offices
Real estate of approximately 241 dunam (constructed area of approximately 36,000 m2)
Taquari, Brazil
Owned Production Real estate of approximately 492 dunam (constructed area of approximately 68,000 m2)
The Company owns additional manufacturing facilities in Poland and Mexico which currently produce
a limited range of products in a relatively small volume compared to the Group's overall operations,
as well as additional facilities of the Company in other regions in which it operates worldwide,
including in the U.S.A., Columbia, Spain, Italy, Greece, Korea, Mexico, India and China. These
facilities are designed mainly for the formulation and packaging of products and ingredients produced
at the plants in Israel, however their operations currently are not significant in relation to the overall
scope of the Group's operations
Similarly, the Group has agreements with various companies worldwide for the provision of external
formulation and packaging services at their facilities.
Investments in Production Facilities
The Company acts continuously to expand its manufacturing capacity, primarily by expanding
existing synthesis, formulation and packaging facilities, by establishing new manufacturing facilities,
operating manufacturing facilities owned by acquired companies, expanding its R&D infrastructures
and extensive investments in various environmental projects.
In 2018, the Company invested a total sum of approximately USD 65 million in facilities and
equipment. The Company intends to continue expanding its manufacturing capacities by investing
in manufacturing facilities, as and to the extent required, subject to various applicable legal
restrictions and requirements.28
The balance of the depreciated cost of fixed assets in the Company's consolidated Financial
Statements as of December 31, 2018, less investment grants, totals approximately USD 856 million
(for further information see Note 9 to the Financial Statements).
28 For enumeration of the Company's investments in environmental facilities within the three years prior to the Report date, see Section
27 of this chapter. For further details regarding investment grants as a result of the purchase of fixed assets serving as the Company's plants as per the Law for the Encouragement of Capital Investments, 5719-1959, see Notes 9e and 17b to the Financial Statements.

43
22. PRODUCTION CAPACITY
The Company's production capacity is primarily affected by the location of the manufacturing,
formulation and packaging facilities in several sites in Israel and abroad, their output and each one's
area and time allocation at full capacity.
Generally, the Company's manufacturing plants operate 24 hours a day, in shifts, aside from self-
initiated stops for periodic maintenance work, during which the Company primarily sells inventoried
products. The average number of actual production stops due to such maintenance work, as well as
malfunctions, holidays and other such events is thirty days annually.
The Company's manufacturing sites house two types of facilities: (1) Dedicated facilities designed
to produce a single product or product family; and (2) Multi-purpose facilities – comprising over half
the Company's facilities – where several different kinds of products may be manufactured. The latter
provide the Company with manufacturing flexibility and enable it to prepare for the manufacturing of
new products, subject to maintaining and ensuring quality standards.
The Company believes that its existing sites have enough facilities and land areas to expand its
production capacity, if necessary.
In general, the Company's average output is approximately 75%-80% of total capacity. Nevertheless,
the majority of its formulation facilities operate on a seasonal basis, and therefore periodically the
facilities operate at higher outputs (exceeding 90% of total capacity).
The Company estimates that expanding a manufacturing facility may require between six to eighteen
months following regulatory approval.
This Section includes forward-looking statements, as defined in the Securities law, based on
subjective Company estimates as to the output of its manufacturing facilities, facility expansion
timeframes, and the availability of its existing locations and facilities. Such estimates may not
necessarily materialize due, inter alia, to the risk factors described in Section 34 of this chapter as
well as to failure to complete facility expansion on schedule owing to dependence on subcontractors,
and machinery and equipment wear and tear.
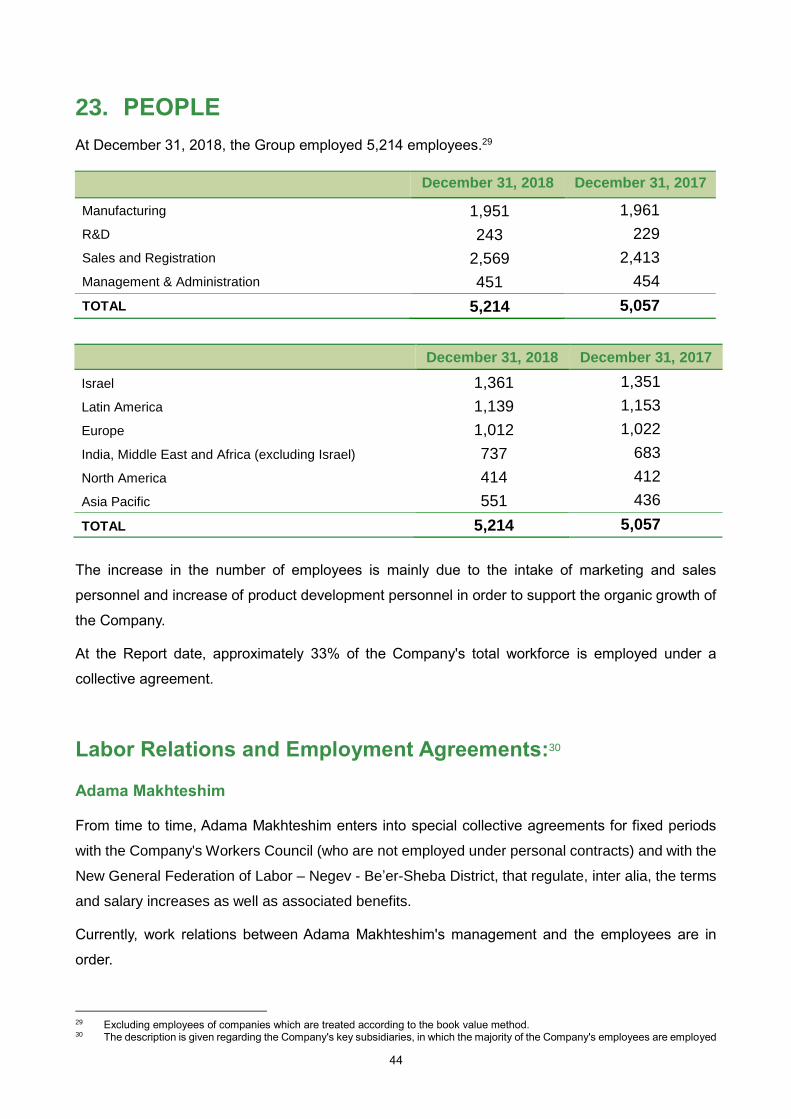
44
23. PEOPLE
At December 31, 2018, the Group employed 5,214 employees.29
December 31, 2018 December 31, 2017
Israel 1,361 1,351
Latin America 1,139 1,153
Europe 1,012 1,022
India, Middle East and Africa (excluding Israel) 737 683
North America 414 412
Asia Pacific 551 436
TOTAL 5,214 5,057
The increase in the number of employees is mainly due to the intake of marketing and sales
personnel and increase of product development personnel in order to support the organic growth of
the Company.
At the Report date, approximately 33% of the Company's total workforce is employed under a
collective agreement.
Labor Relations and Employment Agreements:30
Adama Makhteshim
From time to time, Adama Makhteshim enters into special collective agreements for fixed periods
with the Company's Workers Council (who are not employed under personal contracts) and with the
New General Federation of Labor – Negev - Be’er-Sheba District, that regulate, inter alia, the terms
and salary increases as well as associated benefits.
Currently, work relations between Adama Makhteshim's management and the employees are in
order.
29 Excluding employees of companies which are treated according to the book value method. 30 The description is given regarding the Company's key subsidiaries, in which the majority of the Company's employees are employed
December 31, 2018 December 31, 2017
Manufacturing 1,951 1,961
R&D 243 229
Sales and Registration 2,569 2,413
Management & Administration 451 454
TOTAL 5,214 5,057

45
Adama Agan
Labor relations in Adama Agan are governed by a special collective agreement signed in 1973 on
behalf of the employees (who are not employed under personal contracts) by the Ashdod Workers'
Council. From from that point forward, Adama Agan and the New General Federation of Labor -
Ashdod District and the Workers’ Council enter into special collective agreements, usually for periods
of two years at a time, which update different topics included in the historical agreement and add
new arrangements.
Currently, work relations between Adama Agan’s management and the employees are in order.
Adama Brazil
The employment conditions of the employees of the Group’s Company in Brazil, Adama Brasil S.A.
("Adama Brazil"), are subject to federal legislation relating to employment (CLT), which include
demands regarding labor relations that all private companies in Brazil are obligated to meet.
The employment terms of the employees of Adama Brazil, including its senior management, are
governed by a collective agreement which is renewed every two years between Adama Brazil and
the labor union. Adama Brazil’s CEO is employed in accordance with the Brazilian Corporation Act.
Currently, Adama Brazil complies with all these regulations and its labor relations are in order. To the
best of the Company's knowledge, no significant labor disputes have arisen in Adama Brazil in recent
years.
Adama India
The employment terms of the employees of Adama India comply with the labor and welfare laws in
India, and the regulations prescribed by the relevant authorities.
Adama India does not have a labor union and currently its labor relations are in order.
Officers and Senior Management of the Company
The Company's senior management team comprises eight members, employed in its offices in Israel
and abroad.
For details regarding nomination of officers of the Company to parallel positions in ADAMA Ltd. see
section 1 of this chapter and an immediate report dated October 1, 2017 (ref: 2017-01-086269). For
details regarding the terms of office and employment of senior officers of the Company see details
according to regulation 21 in the chapter D of this report as well as note 28 of the Financial
Statements.
For details regarding the remuneration policy of the Company see immediate report dated January
22, 2017 (ref: 2017-01-007357).
For details regarding long term remuneration plans which are in effect as of the date of this report
see notes 21d and 28 of the Financial Statements and details according to regulation 21 in the

46
chapter D of this report.
For details regarding terms of officers’ insurance and letters of indemnification and release see note
19A(1)-(2) of the Financial Statements.
Currently, the Company estimates that it is not dependent on any one individual employee.
For information regarding the Company’s obligations on the termination of employment, see Note
18 to the Financial Statements.
The Company's Organizational Structure:
Provision of Management Services to ADAMA Ltd.
Following the completion of the Combination Transaction, according to which, inter alia, the
Company's global management leads ADAMA Ltd., on December 28, 2017, to facilitate the business
integration and the operational merger within its framework, between the Company and ADAMA Ltd.,
the authorized organs of the Company approved the engagement of the Company in services
agreements with ADAMA Ltd. (as a transaction with a controlling shareholder), according to which
the Company provides ADAMA Ltd. the following services: (a) senior management services, to be
performed by officers of the Company, to an extent of up to 20% of a full-time office; (b) headquarters
services, including operational, administrative, legal, commercial, finance and other services with
respect to the activities of ADAMA Ltd., including due to its being a listed company; (c) a grant of a
license to ADAMA Ltd. for the use of the brand “ADAMA” (together the “Agreements”). The total
consideration with respect to the Agreements is not material. The initial term of the Agreements
commenced as of October 1, 2017 and shall continue for three years. The Agreements shall be
renewed for successive three-year terms.
President & CEO
CCO Global Operations CFO CCO Strategy &
Resources Legal & CSR
China Cluster
China Integration & Corporate Development
Innovation, Development, Research & Registration
Strategy Commercial Clusters
Marketing & Product Strategy Israel Operations People
Executive Committee
Commercial Clusters
China Operations

47
For the fulfilment of the business combination, the competent organs of the Company approved the
adjustment to the volume of the aforementioned officers’ employment as well as the grant of
indemnification for the provision of the services to ADAMA Ltd. and for double-tax exposure, if there
will be one.31
24. WORKING CAPITAL
The Working Capital of the Company in 2018:
Working capital balance
(million USD) Current ratio Quick ratio
1,611 2.02 1.18
Customer Credit
Generally, the Company follows a customer credit control procedure which establishes conditions
for providing customer credit limits, as well as the procedures for collection follow-up. The Company
generally offers its customers credit of between several months and one year, such that a separate
liability is managed for each customer by individual profile, its specific requirements and the type of
business relationship. For additional information regarding this procedure see Note 29B to the
Financial Statements.
The credit period extended to customers varies and is a function of the competition in each of the
Company's markets, the types of crops in the region in question, the number of parties involved in
the supply chain, and other such factors that may affect the credit period at any given time. In certain
regions, primarily South America, the credit period is long (compared, for example, to that for west
European customers), and sometimes, inter alia, due to difficult crop seasons or the economic
conditions in the respective country, the Company may find it difficult to collect its debts, possibly
prolonging the collection period for up to several years. This risk also exists in emerging countries
where the Company may be less familiar with its customers, their collaterals may be of questionable
quality and there may be no certainty as to the existence of customer insurance coverage.32
The Company extends credit periods to its customers according to the credit terms common in each
respective market. Accordingly, the increase in Company sales in developing countries where the
average length of credit periods is greater, has led to, and may continue to involve, an increase in
the total credit period extended by the Company. Furthermore, in view of the challenging agricultural
market conditions in recent years, the large Originator Companies have begun increasing the credit
periods offered to customers, which have compelled and will continue to compel the Company to
31 See immediate report dated December 31, 2017 (ref: 2017-01-119299). 32 For information in this regard see also Note 29B(2) to the Financial Statements in reference to provisions for estimated credit losses.

48
also increase the credit periods it extends to its customers in certain regions.
The average customer credit days extended in the three years preceding the Report date33:
2018 2017 2016
Average customer credit days 111 121 126
Crop protection sales are directly dependent on the agricultural seasons and crop cycles. Therefore,
the Company's sales are not divided equally over the year, and accordingly, there is variation
between the first and second half of the year in customer characteristics and the average credit
periods. Countries in the northern hemisphere are characterized by similar timing of agricultural
seasons, with these countries generally having their highest sales in the first half of the calendar
year, whereas the agricultural season is the opposite in the southern hemisphere (except for
Australia), where most sales occur in the second half of the year.
The customer credit period in the northern hemisphere countries is generally lower than the
Company average, while the customer credit period in southern hemisphere countries is generally
higher than the Company average. Sales in Brazil, which accounted for approximately 18.2% of the
Company's sales in 2018, occur mainly in the third and fourth quarters, and collections are made
primarily in the second quarter of the subsequent year.
The Company's trade receivables balance at December 31, 2018 totaled approximately USD 941
million. For additional information see Note 4 to the Financial Statements.
The Company's estimated credit losses expenses totaled approximately USD 7 million in 2018.
Receivables Financing Facility
The Company has undertaken ongoing customer debt securitization whereby a foreign company
(not owned by the Company) which is funded by international financial institutions purchases certain
of the Company subsidiaries' customer debts (the “Receivables Financing Facility”).34 During
2016, the Company engaged in an additional receivables financing facility for customer debt
securitization of a subsidiary of the Company.
Inventory and Raw Materials
Due to the seasonal nature of the Company’s sales, the relative distance of the production plants
from its various markets and the high importance the Company ascribes to the quality of its customer
33 The data refer to the annual average (rather than the number of credit days as of the end of the reporting period). The average
calculation includes current and non-current customers and in 2016 includes a deferred promissory note for the sale of customer debts.
34 For information regarding the Receivables Financing Facility, including the credit thereof, its general terms, period, and maximum limit of the credit facility as well as with regard to the above receivables financing facility, see Note 4 to the Financial Statements, and also see Notes 20D and 20E to the Financial Statements regarding the restrictions applicable to the Company resulting from the Receivables Financing Facility.

49
service, the Company usually follows a flexible inventory policy with regard to raw materials and
finished goods.
The Company's production plan is based on a forecast of periodic (seasonal) orders, which is
updated on a continual basis, predominantly according to updated forecasts as well as actual orders.
Under this plan, the Company generally orders its raw materials from suppliers in view of their
expected future availability and logistical considerations, and subject to the various production limits,
if any. However, in order to reduce funding requirements and maximize efficiency, the Company
endeavors, to the extent possible, to take delivery of the raw materials in close proximity to the
planned production deadlines. The Company usually stores an inventory of raw materials in line with
such forecasts in its plants. The shelf lives of most of the raw materials are several years as they
remain stable over the years and may even be extended by simple treatments.
The Company has a dedicated inventory policy for each finished product, based on its profitability
as well as production deadlines and expected orders. In addition, the Company ascribes great
importance to managing its current inventory efficiently and to curtailing its global supply chain. Due
to the fact that the Company's customer sales are based on orders submitted on short notice, its
inventory policy enables it to maintain product availability throughout each season and its different
phases.
Average inventory and inventory periods in the three years prior to the Report date is as follows:35
2018 2017 2016
Average inventory ($million) 1,243 1,080 1,106
Inventory days (relative to historical sales) 189 195 198
At every period, the Company evaluates the need for recording inventory impairment provisions.
Total current inventory as at December 31, 2018 was approximately USD 1,323 million, an increase
of approximately USD 220 million compared with approximately USD 1,103 million in 2017.
Supplier Credit
Generally, the Company receives supplier credit of 30 to 180 days. The Company continuously
endeavors to increase the credit period it receives from various suppliers.
The average trade payables and average supplier credit days in the three years prior to the Report
date:36
2018 2017 2016
Average trade payables ($millions) 651 550 516
Supplier credit days 103 109 110
35 The average inventory calculation includes current and non-current inventory. 36 Excluding suppliers of fixed assets.
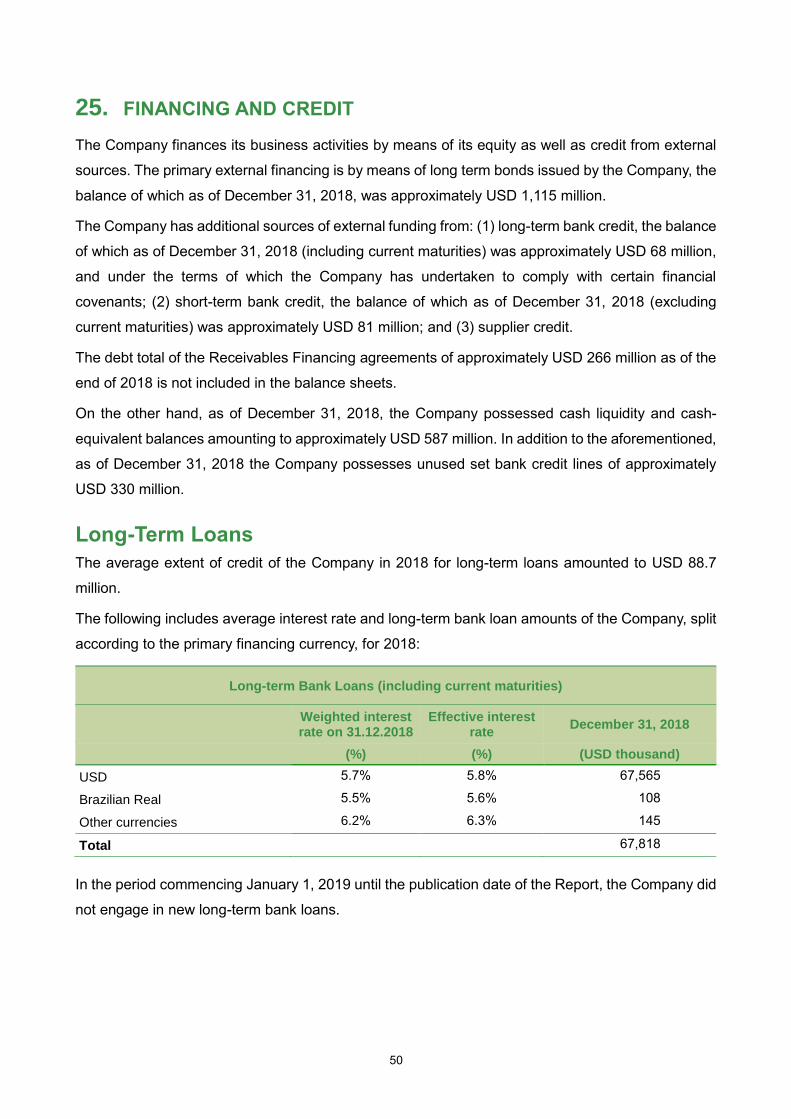
50
25. FINANCING AND CREDIT
The Company finances its business activities by means of its equity as well as credit from external
sources. The primary external financing is by means of long term bonds issued by the Company, the
balance of which as of December 31, 2018, was approximately USD 1,115 million.
The Company has additional sources of external funding from: (1) long-term bank credit, the balance
of which as of December 31, 2018 (including current maturities) was approximately USD 68 million,
and under the terms of which the Company has undertaken to comply with certain financial
covenants; (2) short-term bank credit, the balance of which as of December 31, 2018 (excluding
current maturities) was approximately USD 81 million; and (3) supplier credit.
The debt total of the Receivables Financing agreements of approximately USD 266 million as of the
end of 2018 is not included in the balance sheets.
On the other hand, as of December 31, 2018, the Company possessed cash liquidity and cash-
equivalent balances amounting to approximately USD 587 million. In addition to the aforementioned,
as of December 31, 2018 the Company possesses unused set bank credit lines of approximately
USD 330 million.
Long-Term Loans
The average extent of credit of the Company in 2018 for long-term loans amounted to USD 88.7
million.
The following includes average interest rate and long-term bank loan amounts of the Company, split
according to the primary financing currency, for 2018:
Long-term Bank Loans (including current maturities)
Weighted interest rate on 31.12.2018
Effective interest rate
December 31, 2018
(%) (%) (USD thousand)
USD %5.7 %5.8 67,565
Brazilian Real %5.5 %5.6 108
Other currencies 6.2% %6.3 145
Total 67,818
In the period commencing January 1, 2019 until the publication date of the Report, the Company did
not engage in new long-term bank loans.

51
Short-Term Loans and Variable Interest Credit
The average extent of credit in 2018 for short-term loans amounted to USD 81 million.
The average interest rate and extent of short-term bank loans distributed according to the primary
financing currency, for 2018:
Short-term Bank Credit
Weighted interest
rate 31.12.2018
Effective interest rate
December 31, 2018
(%) (%) USD thousand
Overdraft:
INR 8.5% %8.8 925
Total 8.5% %8.8 925
Short-term credit:
USD 5.5% 5.6% 6,019
TRY 29.6% 34.5% 13,189
INR 8.1% 8.5% 49,195
UHA 21.0% 23.4% 9,932
Other currencies 14.2% 15.2% 1,282
Total 79,617
In the period commencing January 1, 2019 until the publication date of the Report, the Company did
not engage in new short – term loans.
Bonds issued by the Company
The Company's primary external source of financing is the long-term bonds it has issued. The
Company does not have commitments to meet financial covenants with respect to such bonds. For
information regarding the bonds issued by the Company, see Note 15 to the Financial Statements
and the appendix to the Board of Directors' Report.
Financing Restrictions
Restrictions by virtue of long-term bank credit documents
The financing documents for the long-term bank credit assumed by the Company and its
consolidated subsidiaries ("Finance Documents") include undertakings by the Company to
maintain certain financial ratios ("Financial Covenants"), and restrictions relating to changes in
control. For further details regarding the restrictions which apply to the Company by virtue of Finance
Documents see note 20 of the Financial Statements.
Restrictions by virtue of the Receivables Financing Facility
The Receivables Financing Facility (including its updates) includes undertakings by the Company to
comply with Financial Covenants. For details regarding the Company’s Receivables Financing
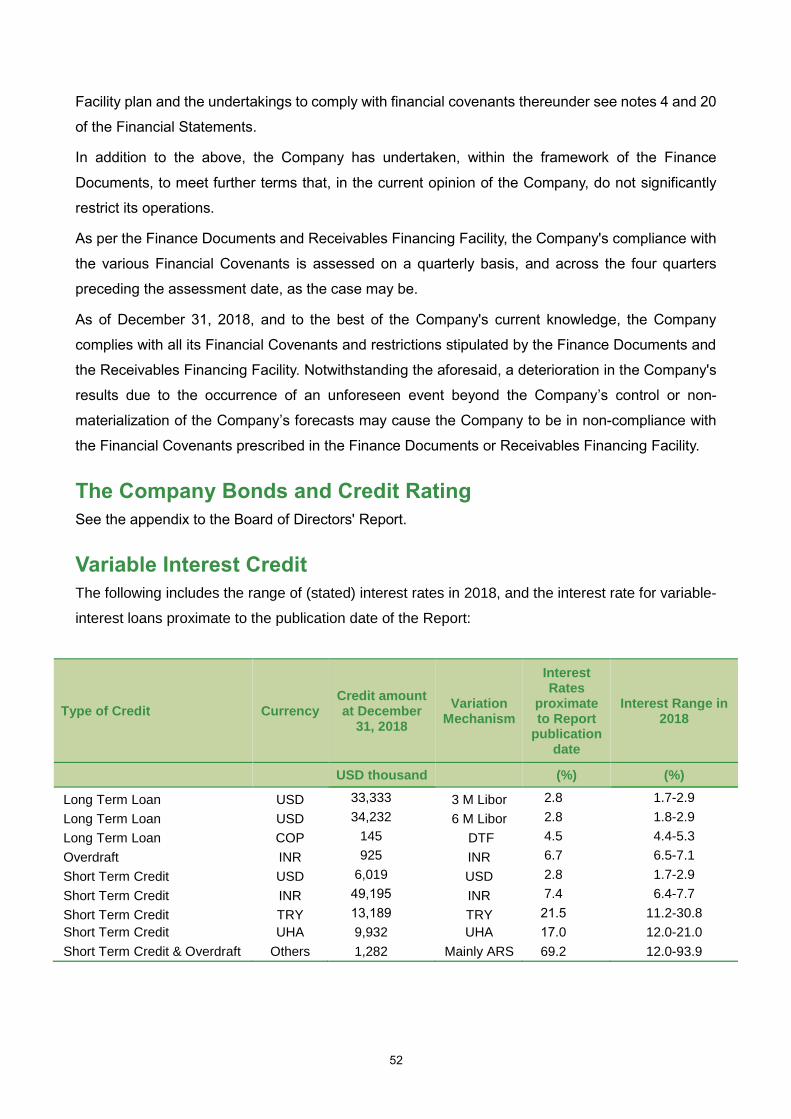
52
Facility plan and the undertakings to comply with financial covenants thereunder see notes 4 and 20
of the Financial Statements.
In addition to the above, the Company has undertaken, within the framework of the Finance
Documents, to meet further terms that, in the current opinion of the Company, do not significantly
restrict its operations.
As per the Finance Documents and Receivables Financing Facility, the Company's compliance with
the various Financial Covenants is assessed on a quarterly basis, and across the four quarters
preceding the assessment date, as the case may be.
As of December 31, 2018, and to the best of the Company's current knowledge, the Company
complies with all its Financial Covenants and restrictions stipulated by the Finance Documents and
the Receivables Financing Facility. Notwithstanding the aforesaid, a deterioration in the Company's
results due to the occurrence of an unforeseen event beyond the Company’s control or non-
materialization of the Company’s forecasts may cause the Company to be in non-compliance with
the Financial Covenants prescribed in the Finance Documents or Receivables Financing Facility.
The Company Bonds and Credit Rating
See the appendix to the Board of Directors' Report.
Variable Interest Credit
The following includes the range of (stated) interest rates in 2018, and the interest rate for variable-
interest loans proximate to the publication date of the Report:
Type of Credit Currency Credit amount at December
31, 2018
Variation Mechanism
Interest Rates
proximate to Report
publication date
Interest Range in 2018
USD thousand (%) (%)
Long Term Loan USD 33,333 3 M Libor 2.8 1.7-2.9
Long Term Loan USD 34,232 6 M Libor 2.8 1.8-2.9
Long Term Loan COP 145 DTF 4.5 4.4-5.3
Overdraft INR 925 INR 6.7 6.5-7.1
Short Term Credit USD 6,019 USD 2.8 1.7-2.9
Short Term Credit INR 49,195 INR 7.4 6.4-7.7
Short Term Credit TRY 13,189 TRY 21.5 11.2-30.8
Short Term Credit UHA 9,932 UHA 17.0 12.0-21.0
Short Term Credit & Overdraft Others 1,282 Mainly ARS 69.2 12.0-93.9

53
26. TAXATION
Tax Laws Applicable to the Company
The Group develops, purchases, manufactures and markets its products through many companies
worldwide. Approximately 97% of the Group's sales in 2018 occurred in international markets outside
of Israel and therefore, the Group operates through approximately 60 subsidiaries, with each of the
Group companies being independent and fulfilling a different role and different contribution to the
Group's operations, and they are assessed according to the tax laws in their specific localities, as
described below. The Group’s effective tax rate could be significantly affected by different
classification or attribution of the profits arise from the share of value earned of the companies in the
Group in the various countries, as shall be recognized in each tax jurisdiction
The Company is assessed according to the Israeli tax law in accordance with the Income Tax
Ordinance (New Version), 5721-1961 (the “Ordinance" or the “Income Tax Ordinance") and its
regulations. The Israeli tax base is territorial and personal, thus applicable to companies defined as
Israeli residents as per the provisions of the Income Tax Ordinance and to non-Israeli residents who
have income in Israel.
Pursuant to Section 1 of the Tax Ordinance, a Company is deemed an Israeli resident for income
taxation purposes if it was incorporated in Israel or if it is controlled and governed from Israel. The
term "control and governance" is not defined in the Ordinance. To the best of the Company's
knowledge, the foreign subsidiaries held by the Company are controlled and governed outside Israel,
and therefore, they are not deemed Israel residents for income taxation purposes. Note that the
Israeli and/or foreign tax authorities may not accept the taxation results as generally described in
this section.
For information regarding the corporate tax rates applicable to the Company in Israel and regarding
the tax environment in which the Company operates in Israel, see Note 17 to the Financial
Statements.
Israeli taxation of foreign income
Income in Israel deriving from dividends distributed by foreign companies abroad is taxable in Israel,
less the amount of the tax paid overseas, including by means of an indirect credit, subject to the
provisions of the Ordinance.
Transfer prices
As per Section 85a of the Income Tax Ordinance and the Income Tax Regulations (Market Terms
Determination), 5767-2006, ("Transfer Price Regulations"), a cross-border transaction (in which
one of the parties involved is not an Israeli resident), in which the two parties have a "special
relationship" as defined therein, is required to be reported in accordance with market conditions and
to be taxed accordingly. The Transfer Price Regulations apply to various cross-border transactions,

54
including the various stages of product manufacture to its sale. Rules for ongoing reports have been
formulated by virtue of these regulations, and the assessment authorities have also been authorized
to demand a market study.
Section 85a and the Transfer Price Regulations adopt the “market conditions” pricing principle by
stating that price appropriateness and the terms of cross-border transactions between parties who
have a special relationship will be evaluated by comparing them to similar transactions between
parties with no such relationship.
Company services or products are priced based on transfer pricing studies conducted to reflect the
market price that would have been determined for these services or products were they to be
provided to non-group members.
Due to the Company’s international activity, the pre-tax income is distributed among many countries
with varying tax rates. At the Report date, the various double taxation treaties have no material effect
on the Company. Different classification or categorization of the proceeds for the value elements of
each Group member in the various countries, or of their characteristics, affect the amounts of income
accrued and assessed for taxation purposes in each country, and this may indeed have a material
effect on the Group taxation and results. See also the Group Risk Factors in Section 34 of this
chapter.
As per the tax laws in countries wherein deferred taxes are recognized, there is, generally, no time
limit on the utilization of the tax losses and of the temporary differences that may be deducted.
However, in certain countries there is a time limit on utilization of tax loss carry forwards and in Brazil,
there is a limit on the level of loss carry forwards that may be offset each year (30% of annual taxable
income).
Effective Tax Rate
As per the Financial Statements as of December 31, 2018 and Note 17 thereto, in 2018, the Company's
pre-tax income amounted to approximately USD 507 million. For details regarding the theoretical tax
expenses considering the statutory tax rate compared to the actual tax expenses see Note 17G. of the
Financial Statements.
To the best of the Company's knowledge, the statutory corporate tax rates in effect on December 31,
2018 were approximately 43% in Italy; approximately 25% in Spain;, approximately 33% in France;
approximately 24% in the US; approximately 32% in Germany; approximately 33% in India;
approximately 34% in Brazil; and in other central Latin American countries the rates vary between 25%
and 35%. In other countries where the Group operates, the tax rates range between 16% and 40%, while
some Group companies are incorporated in foreign territories where the rates are less than 5%.
Forwarded tax losses which may be used in the following years totals in approximately USD 101
million as of balance sheet date (resulting primarily from operations in Israel), can be realized over

55
a period of several years. The Company’s deferred tax asset for accrued losses totaling
approximately USD 12 million, according to the Company's estimate of a high likelihood for the
realization in the upcoming years of the losses regarding which it has a deferred tax asset. The
(consolidated) effective tax rate in 2018 was 25%.
A portion of the Company's surpluses result from income of Approved Enterprises in Israel (see Note
17 to the Financial Statements) and of its foreign subsidiaries. Distributing these surpluses could,
under certain conditions, create a tax liability at distribution. Since the Group's policy is to use the
majority of the operational surpluses to expand the Group’s operations, and as stated in Note 3o to
the Financial Statement, when calculating the deferred taxes, those taxes that may have been levied
had investments in the consolidated companies be realized were not taken into account, since at the
time of this Report, the Company intends to hold these investments rather than realize them.
Moreover, the Group may be liable to additional tax in case of a dividend distribution among Group
companies. This additional tax was also not taken into account when calculating the deferred taxes
in the Financial Statements, due to the policy of not allocating dividends if this entails a material
increase in tax. At the time of the Report, the Company does not have information about the extent
of liability, if any, for said dividend distributions, but based on its preliminary estimation, should the
Company be required to distribute said surpluses (contrary to its aforementioned policy and as a
function of the amounts involved), this liability may prove material. See Note 17G to the Financial
Statements for further details and explanations about the tax provisions applicable to the Company
and the difference between its statutory and effective tax rates.
Tax Assessments
See Note 17I to the Financial Statements.
International Taxation - BEPS
The Base Erosion and Profit Shifting Project (BEPS) is an international project promoted by the
OECD together with the G20 forum with the aim of adjusting the tax structure of international
companies to their actual activity.
Within the framework of BEPS, base fundamental principles were established with the objective of
preventing the grant of inappropriate tax benefits while emphasizing the preference for the
fundamental approach as opposed to the formal approach, simultaneously ensuring the taxation of
the profits in the jurisdiction wherein the financial activity of the corporation and value creation
transpired.
Israel has begun the procedure of adopting the BEPS instructions by means of a temporary order
proposed law amending the Income Tax Ordinance (No. 238) 5777-2017.
In recent years, the commencement of a trend of local taxation in different countries, which takes
into consideration in some cases, the results of all ChemChina group’s entities in the relevant country

56
can be seen. Currently, this trend does not have a significant effect.
The Company continues its planning for the anticipated changes and is examining the required
adjustments. At this stage, the Company is incapable of assessing whether said changes will
influence its future taxation results.
27. ENVIRONMENTAL RISKS AND REGULATION
The Company is exposed to various environmental risks as a result of its activities, including with
regard to atmospheric emissions, storage and use of hazardous materials, soil and water pollution,
creation of industrial sewage, and others. Therefore, the Company’s activities are subject to
extensive environmental regulation in the different countries where it has operations. In recent years,
the requirements of the environmental laws in force (or being advanced in the legislative process)
have become more stringent, as has the supervision and enforcement of these requirements. The
Company expects this trend to continue in the coming years.
The Company holds, as required by law, various permits and licenses, such as business licenses,
toxic permits, air emission permits and permits to discharge into the sea. To the best of the
Company's knowledge, the Company’s environmental permits and licenses are currently valid and
in force.
For additional information regarding the risks related to environmental regulation imposed on the
Company, see Section 34, "Legislation, standards, regulation and environmental, health and safety
exposure".
Israel
Among the primary environmental laws governing the Company's activities are, inter alia, the
Abatement of Nuisances Law, 5721-1961; Business Licensing Law, 5728-1968; Water Law, 5719-1959,
Prevention of Sea Pollution from Land-Based Sources Law, 5748-1988 (“Prevention of Sea Pollution
from Land-Based Sources Law”); Hazardous Materials Law, 5753-1993; Clean Air Law, 5768-2008
("Clean Air Law"), and the respective regulations.
The Company continually examines the implications of the environmental laws, taking actions to prevent
or mitigate the environmental risks and to reduce the environmental effects that may result from its
activities, and investing extensive resources to fulfill those legal provisions that are, and are anticipated
to, affect it.
Air quality
The Company’s plants are subject to atmospheric emissions regulations, whether by virtue of the
stipulations provided in the business licenses or under the Clean Air Law. The Company’s plants that
are subject to the Clean Air Law possess emission permits valid until 2023.

57
Sewage and discharge into the sea
The Prevention of Sea Pollution from Land-Based Sources Law requires obtaining a permit from the
Ministry of Environmental Protection to discharge waste or sewage into the sea from land-based
sources. The Adama Agan plant holds such a permit, valid through June 2021, the terms of which
are becoming more stringent during its term, as part of the generally more rigorous trend adopted
by the Ministry of Environmental Protection in the issuance and terms of permits for discharging into
the sea.
Soil and ground water
Hazardous materials are stored and utilized in the Company's plants, together with infrastructures
and facilities containing fuels and hazardous materials. The Company takes actions to prevent soil
and water pollution by these materials and treats them, if revealed.
The Company’s Israeli plants conduct various soil surveys, risk surveys and tests with regard to
treatment of the soil or ground water at the plants, according to the instructions of the Ministry of
Environmental Protection and the Water Authority.
As part of the future planning of the Company, the Company intends to relocate the formulation
activities carried out in the Be’er-Sheba plant to the Neot-Hovav plant in the coming years. According
to the toxic permits of the Company's plants and the Ministry of Environmental Protection’s policy,
when relocating or discontinuing of production activity it is required to conduct soil survey, and
according to its findings restoration or cleaning action may be required. To the date of this report,
due to the expected relocation of the said plant, it is in the process of conducting land survey, in
coordination with the relevant authorities. Currently, the Company is unable to assess the final
findings of the survey.
Environmental Investments
Million USD
2016 2017 2018
Total investment in environmental facilities, approx. 13 15 12
Current costs (before depreciation), approx. 38 45 48
The Company intends to continue investing in environmental protection, to the extent required and
beyond this, whether on its own volition or in compliance with contractual commitments, regulatory
or legal standards relating to environmental protection, so as to realize its best available policy and
comply with any legal requirements. The Company currently expects environmental costs in each of
the years 2019-2021 to total approximately USD 60 million (this is solely an estimation that assumes
increased maintenance of new facilities, maintenance and other costs).
According to the Company’s analysis, the primary use of the environmental costs that it incurred in

58
the period of this report was for the investment in the prevention and mitigation of future
environmental damage.
The Company’s estimates concerning the amount of environmental-related investments constitutes
forward-looking statements based on the Company's budget and operating plans. The Company’s
estimates regarding the amount of projected environmental investment may not materialize, whether
in whole or in part, due to factors that are beyond the Company's control, including changes to the
regulatory requirements applicable to the Company and other events including those resulting from
realization of the Company's risk assessments, as described in section 34 of this report.
Brazil
Adama Brazil – the Group’s subsidiary in Brazil – operates two main plants: the larger one, is near
Taquari, and the other is in Londrina, both in southern Brazil. To the best of the Company's
knowledge, as of the Report date, no environmental permits or licenses held by Adama Brazil have
been revoked.
Adama Brazil invests in safety and ecological facilities in its two plants, further conducting
independent environmental tests for the ensuring of its compliance with its licenses, tests of the
surrounding underground water sources and monitoring atmospheric emissions by means of
advanced technologies. Periodic testing of the atmospheric emissions and water sources are
performed to prove that Adama Brazil meets the requirements set forth by the state Ministry of
Environment.
As part of its policy of ecological process improvement, Adama Brazil also invests in remediation,
changes in production processes, establishment of sewage facilities, as well as in byproduct storage
and recycling. Adama Brazil is also a member of an organization comprising a group of plants that
take voluntary action to treat and dispose of empty used crop protection packaging.
Corporate Policy
The Company attributes great importance to protecting the environment, out of a sense of
responsibility to society and the environment and strives to meet the relevant regulatory
requirements and to even go beyond mere compliance, engaging in constant dialogue with
stakeholders, including the authorities and the community. Adama Makhteshim and Adama Agan
are certified under Environmental Management Regulations (ISO 14001) and Industrial Safety and
Hygiene Management (OHSAS 18001). The Company has appointed designated employees
responsible for safety and environmental matters in the different plants.
The Company is insured against sudden, unexpected events of environmental pollution in Israel and
overseas. The Company believes, based on the counsel of its insurance consultants, that the scope
of insurance coverage for such events is appropriate.
The information concerning expected investments, future requirements of authorities, implications of

59
legislation, completion and relocation of facilities and deadlines expected to be met as detailed in
this Section constitutes forward-looking statements as defined in the Securities Law, and thus may
not materialize, whether in whole or in part, or may materialize in a manner different than expected
by the Company, as it essentially relies on Company estimates and expectations, based on past
experience and subjective assessments. These assessments may change, in whole or in part, from
time to time, inter alia due to developments in the Company's area of operations and regulatory
changes regarding environmental matters. There is therefore no certainty that the Company's
intentions will be realized or its strategy implemented.
28. RESTRICTIONS AND REGULATORY ARRANGEMENTS
As an integral part of the Company's business activities, it is subject to certain legal and regulatory
controls. The following is a summary of the main legal and regulatory restrictions and arrangements
relevant to the Company's operations:
▪ Registering active ingredients, products and dietary supplements – The Company’s
operations involve the production and marketing of active ingredients and crop protection
chemical substances. Producing and marketing these products and materials generally require
undergoing a statutory registration process. See Section 15 above for details.
▪ Environmental laws and related quality standards – The Company’s operations involve
chemical-industrial processes and are therefore subject to certain environmental laws and related
quality standards. See Section 27 above for details.
▪ Crop protection laws – The Company’s products manufactured or sold in Israel must be
registered according to the Crop Protection Law, 5716-1956, and its related regulations; the
purpose of the registration requirement of the Company’s products is to protect public health and
the environment from potential adverse effects of certain substances contained in crop protection
products.
▪ Business licenses – All Company plants require business licenses in their respective locations.
▪ Quality control – The Adama Makhteshim and Adama Agan plants (Israel) and the Adama Brazil
plants (Brazil) qualify for the ISO 9002 quality control standard, which specifies uniform production
process standards, as well as overseeing all ancillary processes. Moreover, Adama Makhteshim
and Adama Agan qualify for the Occupational Health and Safety Standard (OHSAS 18001), which
is similar to the Israeli ISO 14001 standard. As of October 2001, Adama Brazil has qualified for
standard 14 of the International ISO 14001.
▪ The Law for the Encouragement of Capital Investments - The provisions of the Law for the
Encouragement of Capital Investments and its related regulations, as well as approvals granted

60
for the Company's various investments. For further information, see note 17 of the Financial
Statements.
▪ The Israel Land Authority – Approximately 90% of Israel's real estate is owned by the
government of the State of Israel by means of the Israel Land Authority (ILA). Most of the lands
on which Company plants are located are leased from the ILA on a long-term basis. Hence, the
rights to these lands and related transactions are subject to contractual provisions and regulations
regarding change of land designation and land usage rights. Accordingly, the Group may be
required to bear certain payments to the ILA.
▪ Amendment 17 to the Companies Law - The provisions of the amendment are applicable to the
Company as a "debentures company."
29. MATERIAL AGREEMENTS
▪ See Section 24 of this chapter for information regarding the Receivables Financing Facility for the
securitization of customer receivables.
▪ See Section 25 of this chapter for information regarding the Company’s debentures.
30. COLLABORATION AGREEMENTS
▪ The Company has a large number of collaboration agreements with leading multinational
companies for the development of product registration data and their submission to regulatory
authorities.
▪ The Company is a party to a commercial collaboration agreement with ADAMA Ltd. According to
the agreement, the Company and ADAMA Ltd. collaborate on crop protection production,
distribution, marketing and technologies, including the global distribution of ADAMA Ltd.'s
products by the Company, the establishment of a distribution platform for selling products of the
Company and of ADAMA Ltd. in the Chinese domestic market, and sharing knowledge to improve
and develop processes and technologies. Subsequently, and as part of the realization of the
Company’s strategy, the Company has further entered into a number of commercial collaboration
agreements with ADAMA Ltd. and various CNAC-controlled companies, whereby the Company
will, gradually become the exclusive distributor in China of formulated crop protection products
and active ingredients of these companies, and the exclusive agent for certain of these companies
outside of China.
▪ For further details regarding the collaboration of the Company with Syngenta and other
companies in China, see section number 1.

61
31. CORPORATE GOVERNANCE
The Company abides by the principles of corporate governance to ensure checks and balances in
the conduct of its affairs and adopted a code of conduct which applies to its workers and internal
enforcement programs in relevant fields of activity.
Additionally, the Company’s practice is to publish a corporate social responsibility report which
includes data beyond the requirements of the law.
For information regarding the negligible transactions procedure, see Note 28A to the Financial
Statements.
In February 2019, the Audit Committee approved the criteria for the classification of transactions with
interested parties and the criteria for the classification and approval of transactions with controlling
shareholders.
32. LEGAL PROCEEDINGS
For information about the pending material legal proceedings and material legal proceedings which
have concluded as of the date of the Report, see Note 19.d to the Financial Statements.
33. THE COMPANY’S GROWTH STRATEGY
The Company strives to be a global leader in the Crop Protection industry, and intends to achieve
this aim by execution of the following strategies:
▪ Utilize the Company’s Differentiated Offering to Strengthen and Grow its Market Position.
The Company intends to continue to drive the growth of its business through effective
commercialization of differentiated, high quality products that meet farmers’ needs efficiently. To
that end, the Company will leverage its extensive R&D and registration capabilities to continue to
provide unique yet simple solutions to farmers. In addition, the Company adds value by enhancing
the functionality and efficacy of the industry’s most successful and commercially proven
molecules, by developing new and unique mixtures and formulations. These new products are
designed to provide farmers with better solutions to the challenges they face, including weeds,
insects and disease, increasing resistance and insufficient pest control related to the use of
genetically modified seeds.
Aiming to provide distinct benefit to farmers and enhance the sustainability of the business, in
addition to the ongoing efforts to expand existing product registrations to additional crops and
regions, a key portion of the Company’s strategy involves the deliberate shift of its product offering

62
towards more innovative and value-added solutions. Such solutions include higher-margin,
higher-value complex off-patent products, unique mixtures and formulations as well as innovative,
novel products that are protected by patents and other intellectual property rights. As evidence of
this effort, the Company has significantly increased the proportion of unique mixtures and
formulations in its R&D pipeline over the last several years. Over the coming years, as this shift
in the pipeline towards more differentiated and innovative solutions starts to be reflected in the
Company’s commercial offering, it is expected to be a significant driver of growth, both in
revenues and in profitability. In light of the abovementioned, while identifying future opportunities
in the agrochemical market, the Company adopted a strategic plan, named the “Core Leap”. For
details regarding the “Core Leap” strategy, see section 9 – new products.
▪ Bridge China and the World. The Company is striving to become a leading global crop protection
company in China, both commercially and operationally, and in so doing, to drive its global growth
in the future.
China is currently the third largest, and one of the fastest growing, agricultural markets in the
world. Furthermore, the Company believes that over time, China has the potential to grow into
the world’s largest crop protection market. Also, as the Chinese domestic market is highly
fragmented, with limited penetration by the global chemical companies, the Company believes
that there is a unique opportunity for it to capitalize on the significant untapped potential of the
Chinese market. Moreover, in recent decades, China has become the leading manufacturing
center for the global crop protection industry – from the sourcing of raw materials and chemical
intermediates to the synthesizing of active ingredients and the formulation of finished products.
The Company intends to utilize its status in China and its relationship with ChemChina, as well
as the combination with ADAMA Ltd., to increase its presence in the country, where it is already
building additional infrastructure. The Company commenced commercial collaborations with
ADAMA Ltd. as well as other CNAC-controlled companies in the Crop Protection and related fields
in China. Through the Combination with ADAMA Ltd. and the completion of the aforementioned
commercial collaborations, the Company has an operational infrastructure and commercial
foundation upon which a leading Chinese domestic distribution network was built, and which the
Company believes will make it one of the only global crop protection providers with significant
integrated commercial and operational infrastructure both within and outside of China.
Through the establishment of a significant operational presence in China and the combination
with ADAMA Ltd., the Company intends to achieve cost savings and improved margins and
efficiencies through a vertical integration of manufacturing and formulation together with global
supply chain and logistics capabilities. In particular, the Company’s global R&D efforts will be
supported by a new R&D center in Nanjing to service the Company’s expanded product
development needs and enable the introduction of advanced technologies into China and globally.

63
The Company expects to drive significant demand for its products by launching new and
advanced active ingredients and intermediates with higher R&D content. In addition, the
advanced formulation center in Jiangsu Province will serve as a platform to introduce cost-
advantaged crop protection solutions into China and globally.
The Company expects that its unique positioning and profile in China, including the relationship
with ChemChina, should establish it as a partner of choice for companies outside China seeking
to access its domestic market, as well as for Chinese companies looking to expand their global
footprint. In addition to the Combination and the commercial collaboration, the Company is
assessing strategic joint ventures and selected acquisitions to further bolster its commercial and
operational platform in China.
▪ Collaboration of the Company with Syngenta and other companies in China. See section 1
to this chapter.
▪ Continue to Strengthen Position in Emerging Markets. In addition to developing its China
platform, the Company enjoys strong and leading positions in key emerging agricultural markets
in Latin America, India, Asia and Eastern Europe, with over half of its global sales achieved in
these markets. Over the last several years, in order to establish direct market access and
distribution capabilities in these markets, the Company has successfully integrated acquisitions
in Mexico, Colombia, Chile, Poland, Serbia, the Czech Republic, Slovakia, and South Korea.
Similarly, the Company has implemented a direct go-to-market strategy in many high-growth
markets including India, Indonesia, Vietnam and South Africa, leveraging a direct sales force and
driving demand at the retail and farmer level. The Company intends to continue to invest in its
growth in the key emerging markets with high growth potential. The Company’s strong global
platform and leading commercial infrastructure in such markets will allow it to capitalize on
worldwide growth opportunities and continue to drive its profitable growth.
▪ Grow Revenues and Increase Profitability. The Company believes that it has the capacity and
operational leverage to increase profitability through focused execution of its strategy within the
framework of prudent working capital management. The Company expects to grow revenues and
margins over time as it shifts to a more differentiated, higher-margin product portfolio and
continues to strengthen its product pipeline with a significant number of higher added-value
products, unique mixtures and formulations, as well as innovative and patent protected products.
Similarly, the Company intends to drive revenue growth through increased penetration of high-
growth markets including China, Brazil and other key markets in Latin America, India, Russia,
Ukraine and other key markets in Eastern Europe. The Company believes that its investment in
developing a manufacturing footprint in China will lower costs, improve manufacturing efficiency
and distribution logistics and reduce inventory requirements in many markets worldwide.
In recent years, the Company has focused on growing and improving its business, infrastructure

64
and brand. Other than investments with respect to further development of its China operations,
the Company believes that its existing global infrastructure is largely of sufficient scale to support
higher revenues, allowing it to enjoy economies of scale and continually improve profitability over
time.
▪ Continue to Capitalize on the Global Portfolio Integration and Rebranding Initiative. As part
of the Company’s efforts to “Create Simplicity in Agriculture”, considerable investments have been
made to integrate the business across the globe, streamlining sales and distribution efforts under
the “ADAMA” brand. In connection with this global brand, a unified brand architecture has been
implemented simplifying hundreds of local brands and product names by migrating to two distinct
product umbrellas, “Advanced” and “Essentials,” which are further characterized and
differentiated through innovative and unique packaging, enhancing the recognition of the
"ADAMA" brand. Through these initiatives, the Company is simplifying its product portfolio for
farmers and improving its market positioning.
Over the longer term, the Company aims to increasingly offer digital solutions that will enhance
direct communication and interaction with distributors and farmers globally. The Company
believes that the farmer-centric approach, while building on a modern, global brand and utilizing
cutting-edge technology, will provide a strong foundation for its continued profitable growth.
▪ Opportunistically Pursue Acquisitions to Enhance Market Access and Strengthen the
Product Portfolio. Throughout its history, the Company has successfully completed and
integrated several add-on acquisitions across the globe. The Company intends to continue to
pursue bolt-on acquisitions, in-licensing agreements and joint ventures that offer attractive
opportunities to enhance its market access and position, as well as strengthen and further
differentiate its product portfolio. The Company plans to focus these efforts largely in high-growth
geographies, particularly in emerging markets where it aims to gain market share, as well as in
gaining access to select sources of innovation. The Company has a strong track record of
integrating acquisitions and believes that future acquisitions will play an important role in
continuing to make the Company a leader in the crop protection industry.
The strategy and objectives detailed in this Section are based on the Company's management’s
assessments and rely on its accumulated experience with economic (global, local and industry-
specific), technological, social and other developments, as well as on estimates of the effects of
each development on the others. Hence, these aforementioned developments may change or not
materialize, in whole or in part, or materialize in a manner different than anticipated by the
Company, from time to time, inter alia, due to developments in the markets where the Company
operates, in its area of operations and in the demand for its products. There is therefore no
certainty that the Company's intentions will be realized or that its strategy will be successfully
implemented. In such eventualities, the Company's management will review the strategy detailed

65
above and its main objectives and assess its compatibility with future developments.
34. RISK FACTORS
The Company believes that it is exposed to several major risk factors, resulting from its economic
environment, the industry and the Company's unique characteristics, as follows (the order below
does not indicate priority):
Macroeconomic Risk Factors
Exchange rate fluctuations
The Company reports its consolidated financial statements in US dollars, which is its functional
currency, while its operations, sales and purchases of raw materials are carried out in various
currencies. Therefore, fluctuations in the exchange rate of the selling currency against the
purchasing currency impact the Company’s results. In the Company's assessment, the Group's most
significant exposures are to the Euro, the Israeli Shekel and the Brazilian Real. The Company has
lesser exposures to other currencies. The strengthening of the US dollar against the other currencies
in which the Company operates reduces the scope of the Company's dollar sales and vice versa.
On an annual perspective, 29.9% of the Company's sales are to the European market and therefore
the impact of long-term trends on the Euro may affect the Company's results and profitability.
Concentration of currency exposure from foreign currency exchange rate fluctuations against assets,
including inventory of finished products in countries of sale, liabilities and cash flow denominated in
foreign currencies are done constantly. High volatility of the exchange rates of these currencies could
increase the costs of transactions to hedge against currency exposure, thereby increasing the
Company's financing costs.
The Company uses commonly accepted financial instruments to hedge most of its substantial net
balance sheet exposure to any particular currency. Nonetheless, since as part of these operations
the Company hedges against most of its balance sheet exposure and only against part of its
economic exposure, exchange rate volatility might impact the Company's results and profitability. As
of the date of approval of the financial statements, the Company has hedged most of its balance
sheet exposure for 2018 as it is on the date of publication of this report.
In addition, as the Company’s product sales depend directly on the cyclical nature of the agricultural
seasons, therefore the Company’s income and its exposure to the various currencies is not evenly
distributed over the year. Countries in the northern hemisphere have similar agricultural seasons
and therefore, in these countries, the highest sales are usually during the first half of the calendar
year. During this period, the Company is most exposed to the Euro and the Polish Zloty. In the
southern hemisphere, the seasons are opposite and most of the local sales are carried out during

66
the second half of the year. During these months, most of the Company's exposure pertains to the
Brazilian Real. The Company has more sales in markets in the northern hemisphere and therefore,
the Company's sales volume during the first half of the year is higher than the sales volume during
the second half of the year.37
Exposure to Interest rate, CPI and NIS exchange rate fluctuations
The debentures issued by the Company are Israeli Shekel based and linked to the Israel
Consumer Price Index (CPI) and therefore an increase in the CPI and an appreciation of the
shekel rate against the dollar might lead to a significant increase in the Company's financing
expenses. As of the date of approval of the financial statements, the Company hedged most
of its exposure to these risks on an ongoing basis, through CPI hedging, and dollar-shekel
exchange rate hedging transactions.
The Company is exposed to changes in the US dollar LIBOR interest rate as the Company
has dollar denominated liabilities, which bear variable LIBOR interest. The Company
prepares a quarterly summary of its exposure to changes in the LIBOR interest rate and
periodically examines hedging the variable interest rate by converting it to a fixed rate. As
of the date of approval of the financial statements, the Company has not carried out hedging
for such exposure, since US dollar interest rates have been relatively stable.
The Company maintains internal documentation regarding the designation of financial
instruments for exposures, reflecting the link between the instruments and the exposure. At
least once every quarter, the Company's Board of Directors and its Financial Statements
Review Committee discuss the Company's exposure to market risks and the actions taken
by the Company's management in this regard. The Company's management examines the
control procedures on an ongoing basis and updates them according to the scope of
operations and the risk arising from these operations.
Business operations in emerging markets
The Company conducts business – mainly product sales and raw material procurement – inter alia,
in emerging markets such as Latin America (particularly in Brazil, the largest market (country wise)
in which the Company operates), Eastern Europe, South East Asia and Africa. The Company's
activity in emerging markets is exposed to risks typical of those markets, including: political and
regulatory instability; volatile currency value and exchange rates; economic and fiscal instability and
frequent revisions of economic legislation; relatively high inflation and interest rates; terrorism or war;
restrictions on import and trade; differing business cultures; uncertainty as to the ability to enforce
contractual and intellectual property rights; foreign currency controls; governmental price controls;

67
restrictions on the withdrawal of money from the country; barter deals and potential entry of
international competitors and accelerated consolidations by large-scale competitors in these
markets. Developments in these regions may have a significant effect on the Company's operations.
Distress to the economies of these markets could impair the ability of the Company's customers to
purchase its products or the ability to market them at international market prices, as well as harm
the Company's ability to collect customer debts, in a way that could have a significant adverse effect
on the Company's operating results.
The Group’s operations in multiple regions allows for the diversification of such risks and for the
reduction of its dependency on particular economies. In addition, changes in registration
requirements or customers' preferences in developed western countries, which may limit the use of
raw materials purchased from emerging economies, may require redeployment of the Company's
procurement organization, which might negatively affect its profitability for a certain period.
Industry Risk Factors
Operating in a competitive market
The crop protection products industry is highly competitive. Currently, approximately 60% of the
industry's global market is shared by four leading Originator Companies, which are based in Europe
or North America, these being Corteva, Bayer, BASF and Syngenta, which develop, manufacture
and market both patent-protected as well as off-patent products. The Company competes with the
original products with the aim of maintaining and increasing its market share. For details regarding
the Company’s competitive advantages see Section 13 of this chapter.
The Originator Companies possess resources enabling them to compete aggressively, in the short-
to-medium term, on price and profit margins, so as to protect their market share. Loss of market
share or inability to acquire additional market share from the Originator Companies can affect the
Company's position in the market and adversely affect its financial results.
Similarly, the Company also competes in the more decentralized off-patent market, with other off-
patent companies and smaller-scale Originator Companies, which have significantly grown in
number in recent years and are materially changing the face of the crop protection products industry,
the majority of whom have not yet deployed global distribution networks, and are only active locally.
These companies price their products aggressively and at times have lower profit margins than the
Company, which may harm the volume of the Company's sales and product prices. The Company's
ability to maintain its revenues and profitability from a specific product in the long term is affected by
the number of companies producing and selling comparable off-patent products and the time of their
entrance to the relevant market.
Any delay in developing or obtaining registrations for products and/or delayed penetration into
markets and/or growth of competitors that focus on off-patent active ingredients (whether by the
68
expansion of their product portfolio, granting registrations to other manufacturers (including
manufacturers in China and India) to operate in additional markets, transforming their distribution
network to a global scale or increasing the competition for distribution access), and/or difficulty in
purchasing low cost raw materials, may harm the Company’s sales volumes in this sector, affect its
global position and lead to price erosion. For further information about competition in the Company’s
main area of activity, see Section 13 of this chapter.
Decline in scope of agricultural activities; exceptional changes in weather conditions
The scope of agricultural activities may be negatively affected by many exogenous factors, such as
extreme weather conditions, natural disasters, a significant decrease in agricultural commodity
prices, government policies and the economic condition of farmers. A decline in the scope of
agricultural activities necessarily would cause a decline in the demand for the Company’s products,
erosion of its prices and collection difficulties, which may have a significant adverse effect on the
Company's results. Extreme weather conditions as well as damages caused by nature have an
impact on the demand for the Company's products. The Company believes that, should a number
of such bad seasons occur in succession, without favorable seasons in the interim, its results may
sustain significant harm.
Environmental, health and safety legislation, standards, regulation and exposure
Many aspects of the Company's operations are strictly regulated, including in relation to production
and trading, and particularly in relation to the storage, treatment, manufacturing, transport, usage
and disposal of its products, their ingredients and byproducts, some of which are considered
hazardous. The Company's activities involve hazardous materials, as defined in the Hazardous
Materials Law, 5753-1993. Defective storage or handling of hazardous materials may cause harm
to human life or to the environment in which the Company operates. The regulatory requirements
regarding the environment, health and safety could, inter alia, include soil and groundwater clean-
up requirements; as well as restrictions on the volume and type of emissions the Company is
permitted to release into the air, water and soil.
The regulatory requirements applicable to the Company vary from product to product and from
market to market and tend to become stricter with time. In recent years, both government authorities
and environmental protection organizations have been applying growing pressure, including through
investigations and indictments as well as increasingly stricter legislative proposals and class action
suits related to companies and products that may potentially pollute the environment. Compliance
with the foregoing legislative and regulatory requirements and protection against such legal actions
requires the Company to spend considerable financial resources (both in terms of substantial
ongoing costs and in terms of material one-time investments) as well as human resources in order
to meet mandatory environmental standards. In some instances, this may result in delaying the
introduction of products into new markets or in adverse effects on the Company’s profitability.
69
In addition, the toughening, material alteration or revocation of environmental licenses or permits, or
their stipulations, or the inability to obtain such licenses and permits, may significantly affect the
Company's ability to operate its production plants, which in turn may have a material adverse effect
on the financial and business results of the Company. The Company may be required to bear
significant civil liability (including due to class actions) or criminal liability (including high penalties
and/or high compensation payments and/or costs of environmental monitoring and rehabilitation),
resulting from violation of environmental, health and safety regulations, while some of the existing
legislation may impose obligations on the Company for strict liability, regardless of proof of
negligence or malice.
While the Company invests material sums in adapting its facilities and in constructing special
facilities in accordance with environmental requirements, it is currently unable to assess with any
certainty whether these investments (current and future) and their outcomes may satisfy or meet
future requirements, should these be significantly increased or adjusted. In addition, the Company
is unable to predict with any certainty the extent of future costs and investments it may incur so as
to meet the requirements of the environmental authorities in Israel or in other countries in which it
operates since, inter alia, the Company is unable to estimate the extent of potential pollutions, their
length, the extent of the measures required to be taken by the Company in handling them, the
division of responsibility among other parties and the amounts recoverable from third parties.
Furthermore, the Company may be the target of bodily injury claims and property damage claims
caused by exposure to hazardous materials, which are predominantly covered under the Company’s
insurance policies.
Legislative, standard and regulatory changes in product registration
Most of the substances and products marketed by the Company require registration at various
stages of their development, production, import, utilization and marketing, and are also subject to
strict regulatory supervision by the regulatory authorities in each country. Compliance with the
registration requirements that vary from country to country and which are becoming more stringent
with time, involves significant time and costs, and rigorous compliance with individual registration
requirements for each product. Noncompliance with these regulatory requirements might materially
adversely affect the scope of the Company’s expenses, cost structure and profit margins, as well as
penetration of its products in the relevant market, and may even lead to suspension of sales of the
relevant product, and recall of those products already sold, or to legal action. Moreover, to the extent
new regulatory requirements are imposed on existing registered products (requiring additional
investment or leading to the existing registration's revocation) and/or the Company is required to
compensate another company for its use of the latter's product registration data, these might amount
to significant sums, considerably increasing the Company's costs and adversely affecting its results
and reputation.
70
Nevertheless, the Company believes that, in countries where the Company maintains a competitive
edge, any toughening of registration requirements may actually increase this edge, since this will
make it difficult for its competitors to penetrate the same market, whereas in countries in which the
Company possesses a small market share, if any, such toughening may make further penetration of
the Company's products into that market more difficult. See Section 15 of this chapter for further
information on product registration.
Product liability
Product and producer liability present a risk factor to the Company. Regardless of their prospects or
actual results, product liability lawsuits might involve considerable costs as well as tarnish the
Company's reputation, thus impacting its profits. The Company has a third-party and defective
product liability insurance cover of up to USD 350 million in aggregate annual damages. However,
there is no certainty that the scope of insurance cover is sufficient. Any future product liability lawsuit
or series of lawsuits could materially affect the Company’s operations and results, should the
Company lose the lawsuit, or should its insurance cover not suffice or apply in a particular instance.
In addition, while currently the Company has not encountered any difficulty renewing such insurance
policy, it is possible that it will encounter future difficulties in renewing an insurance policy for third
party liability and defective products on terms acceptable to the Company.
Successful market penetration and product diversification
The Company’s growth and profit margins are affected, inter alia, by the extent of its success in
developing differentiated products and obtaining registrations for them, so as to enable it to gain
market share prior to its competitors. Generally, being the first to launch a certain off-patent product
affords the Company continuing advantage, even after other competitors penetrate the same market.
Thus, the Company's revenues and profit margins from a certain product could be materially affected
by its ability to launch such product ahead of the launch of a comparable product by its competitors.
Should new products fail to meet registration requirements in the different countries or should it take
a long period of time to obtain such registrations, the Company's ability to successfully introduce a
new product to the market in question in the future would be affected, since entry into the market
prior to other competitors is important for successful market penetration. Furthermore, successful
market penetration involves, inter alia, product diversification in order to suit each market's changing
needs. Therefore, if the Company fails to adapt its product mix by developing new products and
obtaining the required regulatory approvals, its future ability to penetrate that market and to maintain
its existing market share could be affected. Failure to introduce new products to given markets and
meet Company objectives (given the considerable time and resources invested in their development
and registration) might affect the sales of the product in question in the relevant market, the
Company’s results and margins.

71
Intellectual property rights of the Company and of third parties
The Company's ability to develop off-patent products is dependent, inter alia, on its ability to oppose
patents of an Originator Company or other third parties, or to develop products that do not otherwise
infringe intellectual property rights (in a manner that may involve significant legal and other costs).
Originator Companies tend to vigorously defend their products and may attempt to delay the launch
of competing off-patent products by registering patents on slightly different versions of products for
which the original patent protection is about to expire or has expired, with the aim of competing
against the off-patent versions of the original product. The Originator Companies may also change
the branding and marketing method of their products. Such actions may increase the Company's
costs and the risk it entails, and harm or even prevent its ability to launch new products.
The Company is also exposed to legal claims that its products or production processes infringe on
third-party intellectual property rights. Such claims may involve time, costs, substantial damages
and management resources, impair the value of the Company's brands and its sales and adversely
affect its results. To the best of the Company’s current knowledge, such lawsuits that were concluded
involved non-material amounts.
Furthermore, the Company protects its brands and trade secrets with patents, trademarks and other
methods of intellectual property protection, however these protective means may not be sufficient
for safeguarding its intellectual property. Any unlawful or other unauthorized use of the Company's
intellectual property rights could adversely affect the value of its intellectual property and reputation.
In addition, the Company may be required to take legal action involving financial costs and resources
to safeguard its intellectual property rights.
Fluctuations in raw material inputs and prices, and in sales costs
Approximately 75% of the cost of the Company’s sales derives from raw material costs. Hence,
significant increases or decreases in raw material cost affect the cost of goods sold, which is
generally expressed a number of months following such cost fluctuation. Most of the Company's raw
materials are distant derivatives of oil prices and therefore, extreme increase or decrease in oil prices
may affect the costs of raw materials, yet only partially.
To reduce exposure to fluctuations in the prices of raw materials, the Company customarily engages
in long-term purchase contracts for key raw materials, wherever possible. Similarly, the Company
acts to adjust its sales prices, if possible, to reflect the changes in the costs of raw materials.
As at the date of approval of the financial statements, the Company has not engaged in any hedging
transactions against increases in oil and other raw material costs.
Exposure due to recent developments in the genetically modified seeds market
Any further significant development in the market of genetically modified seeds for agricultural crops,
including as a result of regulatory changes in certain countries currently prohibiting the use of

72
genetically modified seeds, and/or any significant increase in the sales of genetically modified seeds
or Glyphosate and/or to the extent new crop protection products are developed for further crops that
would be widely used (substituting for traditional products), will affect demand for crop protection
products, requiring the Company to respond by adapting its product portfolio to the new demand
structure. Consequently, to the extent that the Company fails to adapt its product mix accordingly,
this may reduce demand for its products, erode their sales price and necessarily affect the
Company’s results and market share.
Nevertheless, the fact that the Company itself markets Glyphosate acts to mitigate this exposure
(albeit only in terms of marketing margins).
Operational risks
The Company’s operations, including its manufacturing activities, rely, inter alia, on state-of-the-art
computer systems. The Company continually invests in upgrading and protecting these systems
from malfunctions. Any unexpected failure of these systems, as well as the integration of new
systems, could involve substantial costs and adversely affect the Company's operations until
completion of the repair or integration. The potential occurrence of a substantial failure that cannot
be repaired within a reasonable time frame may also affect the Company's operations and its results.
Currently, the Company has a property and loss-of-profit insurance policy in the scope of
approximately USD 1.4 billion in aggregate annual damages.
Data protection and Cyber
During their activity, the Company and/or its subsidiaries, may be exposed to risks and threats,
related to the stability of their information technologies systems, data protection and cyber, which
could appear in many different forms (such as service denial, misleading employees, malfunction,
encryption or data erasing and other cyber-attacks via E-mail or malicious software). An attack on
such computerized systems, mainly network based systems, may cause the group material damages
and expenses and even partial suspension and disruption of their proper functioning. In order to
minimize the abovementioned risks, the group invests resources in its technological strength and in
proper protection of its systems.
Unique Risk Factors
Raw material supply and/or shipping and port services disruptions
Lack of raw materials or other inputs utilized in the manufacture of Company products may prevent
the Company from supplying its products or significantly increase production costs. Moreover, the
Company imports raw materials to its production facilities in Israel and/or abroad, from where it
exports the products to its subsidiaries abroad for formulation and/or commercialization purposes.
Disruptions in the supply of raw materials from regular suppliers may adversely affect operations
until an alternative supplier is engaged. If any of the Company's suppliers are unable to supply raw

73
materials for a prolonged period, including due to ongoing disruptions and/or prolonged strikes
and/or infrastructure defects in the operating of a relevant port, and the Company is unable to engage
with an alternative supplier at similar terms and in accordance with product registration requirements,
this may adversely affect the Company's results, significantly affect its ability to obtain raw materials
in general, or obtain them at reasonable prices, as well as limit its ability to supply products and/or
meet customer supply deadlines. These might negatively affect the Company, its finances and
operating results. In order to reduce this risk, it is the Company's practice to occasionally adjust the
volume of its product inventories and at times utilize air freight.
Failed mergers and acquisitions; difficulties in integrating acquired operations
The Company's strategy includes growth through mergers, acquisitions, investments and
collaborations designed, in a calculated manner, to expand its product portfolio and deepen its
presence in certain geographical markets.
Growth through mergers and acquisitions requires assimilation of acquired operations and their
effective integration in the Group, including realization of certain forecasts, profitability, market
conditions and competition.
Failure to successfully implement the above and/or non-realization of the said forecasts may result
in not achieving the additional value forecasted, losing customers, exposure to unexpected liabilities,
reduced value of the intangible assets included in the merger or acquisition as well as the loss of
professional and skilled human resources.
Production concentration in limited plants
A large portion of the Company’s production operations is concentrated in a small number of
locations. Natural disasters, hostilities, labor disputes, substantial operational malfunction or any
other material damage might significantly affect Company operations, as a result of the difficulty, the
time and investment required for relocating the production operation or any other activity.
International taxation
97% of the Company’s sales are in markets outside Israel, through several subsidiaries worldwide.
These individual companies are assessed in accordance with the tax laws effective in each
respective location. The Group’s effective tax rate could be affected by a significantly different
classification or attribution of the proceeds arise from the value the share of components of each of
the companies in the Group in the various countries, as shall be recognized in each tax jurisdiction;
changes in the characteristics (including regarding the location of control and management) of these
companies; changes in the breakdown of the Company's profits into regions where differing tax rates
apply; changes in statutory tax rates and other legislative changes; changes in assessment of the
Company's deferred tax assets or deferred tax liabilities; changes in determining the areas in which
the Company is taxed; and potential changes in the Company's organizational structure.
74
Changes in tax regulations and the manner of their implementation, including with regard to the
implementation of BEPS, may lead to a substantial increase in the Company's applicable tax rates
and have a material adverse effect on its financial state, results and cash flows.
For further information and for enumeration description of the tax laws applicable to the Company,
see Section 26 of this chapter. The Company’s Financial Statements do not include a material
provision for exposure for international taxation, as stated above, based on professional counsel it
has received.
Risks arising from the Company’s debt
The Company finances its business operations by means of its own equity and loans from external
sources (primarily debentures and bank credit). The Company's main source for servicing the debt
and its operating expenses is by means of the profits from the Group companies’ operations.
Restrictions applying to the Group companies regarding distribution of dividends to the Company, or
the tax rate applicable on these dividends, may affect the Company's ability to finance its operations
and service its debt.
In addition, the Company's Finance Documents require it to meet certain Financial Covenants, as
detailed in Note 20 of the Financial Statements. Failure to meet these covenants due to an
exogenous event or non-materialization of Company forecasts, and insofar as the financing parties
refuse to extend or update these Financial Covenants as per the Company’s capabilities, may lead
the financing parties to demand the immediate payment of these liabilities (or part thereof).
Exposure to customer credit risks
The Company’s sales to customers in Israel and abroad usually involve customer credit as is
customary in each market. A portion of these credit lines are insured, while the remainder are
exposed to risk, particularly during economic slowdowns in the relevant markets. The Group’s
aggregate credit, however, is diversified among many customers in multiple countries, mitigating this
risk. In addition, in certain regions, particularly in South America, credit days are particularly long
(compared to those extended to customers in regions such as Europe), and on occasion, inter alia,
owing to agricultural seasons or economic downturns in those countries, the Company may
encounter difficulty in collection of customer debts, with the collection period being extended over
several years.
Generally, such issues arise more often in developing countries where the Company is less familiar
with its customers, the collaterals are of doubtful value and the insurance cover of these customers
is likely to be limited. For additional information, see the explanations of the Board of Directors
Report and the Company Financial Statements. Credit default by any of the customers may
negatively impact the Company's cash flow and financial results.

75
The Company’s working capital and cash flow needs
Similar to other companies operating in the crop protection industry, the Company has substantial
cash flow and working capital requirements in the ordinary course of operations. In view of the
Company's growth and considering its primary growth regions, the Company’s broad product
portfolio and the Company’s investments in manufacturing infrastructures, the Company has
significant financing and investment needs. The Company acts continually to improve the state and
management of its working capital. While currently the Company is in compliance with all its Financial
Covenants, significant deterioration of its operating results may in the future lead the Company to
fail to comply with its Financial Covenants and fail to meet its financial needs. As a result, the
Company's ability to meet its goals and growth plans, and its ability to meet its financial obligations,
may be harmed.
Risks of the business integration and operations in China
The Company believes that it may be exposed to several unique risks relating to the business
combination and operations in China, the primary of these being:
▪ Chinese economic, political and social environment and governmental policies - the
business environment in China is different from the business environment in western countries,
inter alia owing to the country’s political structure, extent of government intervention, growth
rates, foreign currency controls and the manner of resource allocation. The Chinese government
adopts various measures for the encouragement of economic growth and the allocation of
resources, some of which may in the future adversely affect the results of the Company’s
operations in China.
▪ Legislation, standards and regulations changes in China - Companies in China are subject
to extensive regulation, including with regard to registration, production, distribution, pricing,
taxation, import and export, environmental matters, health and safety. Historically, the chemical
industry in China was subject to preferential government policy, however it is not certain that
this policy will remain unchanged, or that the legal and economic environment (including with
regard to required registrations and permits) that affects the Company’s operations in China and
the industry, will remain unchanged.
▪ Foreign currency controls - the Company may be required, for the purposes of its operations,
to convert income received from its operations in China from RMB to other currencies. According
to the law in China, certain foreign currency transactions, including payment of foreign currency
denominated liabilities, are subject to the requirements of the State Administration for Foreign
Exchange.

76
The Company’s assessment of risk factors and degree of their influence (should they be realized)
on the Company’s operations:
Risk Factor Extent of impact on Company
overall operations
High Medium Low
Macro risks
Exchange rate fluctuations +
Interest rate, CPI and NIS exchange rate fluctuations +
Business operations in emerging markets +
Industry risks
Activities in competitive markets +
Decline in scope of agricultural activities; extraordinary changes in weather conditions
+
Legislation, standards and regulatory changes with regard to environment, health and safety
+
Legislation, standards and regulatory changes with regard to product licensing
+
Product liability +
Successful market penetration and product diversification +
IP rights of the Company and of third-parties +
Fluctuations in raw material inputs and prices, and in costs of sales +
Developments in the genetically modified seeds market +
Operational risks +
Data security and Cyber +
Unique risks
Disruptions in raw material supply, shipping & port services +
Failed M&As; difficulties in integrating acquired operations +
Production concentrated in limited plants +
International taxation +
Risks arising from the Company’s debt +
Exposure to customer credit risks +
Working capital requirements and cash flow +
Risks resulting from the business combination and operations in China
+

Chapter B
Board of Directors Report

1
Adama Agricultural Solutions Ltd.
Board of Directors' Report for the Quarter and
Year Ended December 31, 2018

2
Performance in Context of Market Environment
The Company delivered record sales in the quarter and full year, significantly exceeding all of its fourth quarter 2017 record sales and adjusted profit metrics, driven by a combination of robust business growth as well as higher prices and the introduction of new and differentiated products, which have supported penetration and continued clear share gains in markets across the globe, despite uneven AgChem market conditions.
The global crop protection market grew somewhat in 2018 due to stronger demand conditions and normalized inventory levels, alongside higher procurement costs emanating from China. This growth was partially offset by challenging weather conditions, especially in Europe, as well as uncertainty surrounding the US-China trade tensions, which weighed on agricultural commodity prices, continuing to impact farmers’ incomes for the fourth consecutive year.
In some regions, inventory levels in the crop protection distribution channels were lower compared to 2017, which allowed customary market activity levels to resume.
Softness of many currencies in the quarter, when compared to the same quarter last year, most notably in Brazil and India, impacted sales and profit contribution, yet was more than offset by volume growth and price increases.
As previously reported, the negative impact of 2017 European hedge positions largely ended in the first half of the year and had negligible impact on the second half of 2018. There was still, however, a marked effect over the full year period, with a negative impact of almost $40 million on sales and profits.
The Company continues to maintain manufacturing cost discipline and mitigate the impact of shortages in certain raw materials and intermediates, mostly owing to increased environmental focus in China. The supply-constrained environment further contributed to overall stronger pricing.
Corporate Development
The Company continues with its track record of making and integrating selective acquisitions.
Bonide: On January 2019, the Company acquired Bonide Products Inc., a US provider of pest-control solutions for the consumer Home & Garden market, allowing the Company to bring its advanced technologies and differentiated portfolio of pest-control and turf solutions directly to the benefit of the consumer.
Collaborations
In December 2018 the final milestone in the combination between the Company and Hubei Sanonda Ltd. (“Sanonda") was achieved with the name of Sanonda being changed to ADAMA Ltd., demonstrating their coming together under ADAMA as a single global brand, reflecting the group’s farmer-centric focus and its commitment to advancing agriculture in markets around the world.
The Company continues to advance collaboration opportunities with other ChemChina group entities, as well as other entities in China, to make the most of its positioning.
The Company has been working together with Syngenta and other key agriculture-related businesses in China, to identify opportunities for closer collaboration. In this context, the companies are exploring various initiatives, including the potential provision of reciprocal

3
access to certain products in specific territories, as well as exploiting opportunities aimed at optimizing the utilization of the companies’ operational facilities.
The Company's assessments referred to in this report are forward-looking statements, as defined in the Securities Law, 1968. These assessments may not be realized or be realized in a different manner than the Company estimates, inter alia, due to factors that are not in the Company's control, amongst which, are developments in the crop protection market, changes in demand for the Company's products, in currencies and in oil prices, and other macroeconomic trends as well as decisions of regulatory authorities.

4
Results of Operations – Adjusted Income Statement
Income Statement for the Quarter
Q4 2018
$m Q4 2017
$m Change
$m % Change
CER % Change
USD
Revenues 896 715 181 +31.5% +25.4%
Gross profit 281 231 50 +21.5%
% of revenue 31.3% %32.4
Operating expenses 207 201 6
Operating income (EBIT) 74 30 44 +146.3%
% of revenue 8.2% %4.2
Finance expenses, net 34 34
Profit before taxes 39 0 39
Net income 34 9 25 +262.8%
% of revenue 3.8% %1.3
EBITDA 121 76 45 +58.3%
% of revenue 13.5% %10.7
Income Statement for the Year
2018 $m
2017 $m
Change $m
% Change
CER
% Change USD
20181 (ex. ‘17 EU
hedge)
Revenues 3,536 3,137 398 +15.5% +12.7% 3,575
Gross profit 1,142 1,115 27 +2.5% 1,181
% of revenue 32.3% %35.5 33.0%
Operating expenses 776 747 29 776
Operating income (EBIT) 366 368 -2 -0.5% 405
% of revenue 10.3% %11.7 11.3%
Finance expenses, net 140 121 19 140
Profit before taxes 227 255 -28 266
Net income 175 234 -59 -25.2% 214
% of revenue 4.9% %7.4 6.0%
EBITDA 551 546 5 +1.0% 590
% of revenue 15.6% %17.4 16.5%
Income Statement items adjusted in the above table, as presented in the financial statements/on a reported basis (in USD million):2
For Q4 2018: Operating expenses 222 (24.7%), operating income (EBIT) 59 (6.6%), profit before taxes 25 (2.7%), net income 12 (1.4%) and EBITDA 117 (13.1%).
For Q4 2017: Operating expenses 208 ( %29.1 ), operating income (EBIT) 23 ( %3.3 ), loss before taxes 8 (- %1.2 ), net income
5 (0.6%) and EBITDA 66 ( %9.3 ).
For 2018: Gross profit 401,1 ( %2.33 ), operating expenses 495 (14.0%), operating profit (EBIT) 646 ( %8.31 ), profit before taxes 507 (14.3%), net profit 377 ( %710. ) and EBITDA 859 (24.3%).
For 2017: Gross profit 1,113 ( %35.5 ), operating expenses 741 ( %23.6 ), operating profit (EBIT) 372 ( %11.8 ), profit before taxes 256 ( %8.2 ), net profit 236 (7.5 %) and EBITDA 542 ( %17.3 ).
1 The 2017 Europe hedge impact on the fourth quarter results was negligible. 2 For a detailed description and analysis of the differences between the adjusted income statement items and the items as reported in the
financial statements, see Appendix A.

5
Analysis of the Company's Adjusted Results
Revenues
Revenues grew by 25.4% in the quarter to a record $896 million and by 12.7% over the full year to a record $3,536 million in US dollar terms, compared to the corresponding periods last year. In constant currency terms, revenues grew by 31.5% in the quarter and by 15.5% in the full year.
This robust performance was driven by strong business growth of the Company's increasingly differentiated product portfolio, with volumes up by 24.1% in the quarter and 11.7% in the full year. In the quarter, the Company recorded particularly strong performance in Latin America, led by Brazil, as well as in North America, Europe and Asia-Pacific, while sales in India were impacted by severe drought.
In addition to the strong business growth, improved demand conditions facilitated a stronger pricing environment, compensating for the softer currencies and allowing the passing on of some of the impact of the constrained supply and higher procurement costs.
Revenue split by region
Fourth quarter sales split:
Q4 2018
$m Q4 2017
$m % change in CER3
% change in $
Europe 188 152 +25.0% +23.3%
North America 204 154 +32.5% +32.4%
Latin America 344 251 +49.7% +37.2%
Asia-Pacific 82 70 +22.0% +18.9%
India, Middle East and Africa 78 89 -3.4% -11.7%
of which, Israel 25 25 +6.9% +1.2%
Total 896 715 %31.5+ +25.4%
Full year sales split:
2018 $m
2017 $m
% change in CER3
% change in $
Europe 1,056 1,042 -0.6% +1.3%
North America 715 631 13.1% +13.3%
Latin America 927 740 37.5% +25.3%
Asia-Pacific 380 310 21.2% +22.3%
India, Middle East and Africa 458 414 16.1% +10.7%
of which, Israel 107 97 10.8% +10.6%
Total 3,536 3,137 %15.5 +12.7%
3 CER – Constant Exchange Rates

6
Noteworthy trends and developments in the various geographies affecting the Company’s activities
Europe
Closed 2018 in line with 2017, a significant achievement in the face of several challenges during the year – severe drought, 2017 hedge loss, supply shortages and a notable change in portfolio due to the completion of the divestments and transfers of products related to ChemChina’s acquisition of Syngenta.
Sales increased by 25.0% in the quarter and were flat over the full year in constant currency terms, compared with the corresponding periods last year.
The strong increase in the quarter was driven by significant business growth of 24.7% and a small price increase, which more than offset the negative impact of currency moves.
This strong result in the quarter brought the performance in Europe over the full year to be only marginally lower than last year, despite the challenging weather conditions that persisted for significant parts of the year. This performance over the year, against the backdrop of a decline in the overall European market, saw the Company continue to grow its market share in the region.
Following the unprecedented drought earlier in the year, Northern Europe grew strongly in the quarter. The late sowing and favorable rainfall, which started in early October, facilitated continuous planting, extending the herbicide treatment period and allowing for the recovery of herbicide sales mainly in wheat, cereals and oilseed rape.
In Southern Europe, sales grew in the quarter compared with the corresponding period last year despite ongoing challenging weather conditions, with the summer drought only breaking in early November. This resulted in delayed herbicide consumption and reduction of grass treatment due to lower oilseed rape planted areas, as well as lower demand for insecticides due to the late emergence of wheat.
In US dollar terms, sales increased by 23.3% in the quarter and by 1.3% over the full year compared with the corresponding periods last year. Excluding the 2017 European hedge impact, sales in the region increased by 5.1% to $1,095 million over the full year.
North America
Sales increased by a strong 32.5% in the quarter in constant currency terms, compared with the corresponding period last year, driven by significant business growth and higher prices. The marked performance in the quarter brought growth in the full year to 13.1% in constant currency terms.
The Company’s robust business growth in the quarter was driven by strong demand for its increasingly differentiated portfolio from both distributors and retail customers. In the US, the Company benefited from the stronger pricing environment, which continued in the face of industry-wide supply shortages, compensating for the higher procurement costs.
Double-digit growth was recorded in Consumer and Professional Solutions, with continued strong momentum in both professional pest and industrial vegetation management.
In US dollar terms, sales in North America increased by 32.4% in the quarter and by 13.3% in the full year, compared to the corresponding periods last year.

7
Latin America
Sales increased by a significant 49.7% in the quarter and by 37.5% in the full year in constant currency terms, compared with the corresponding periods last year.
The robust growth in the quarter was driven by a strong performance in Brazil, alongside growth in most other major markets throughout the region.
The Company continues to develop its differentiated portfolio in the region. In Brazil, CRONNOS TOV®, the novel, three-way mixture fungicide for soybean rust, outperformed expectations in its first half-year of launch and led a strong performance across the Company’s differentiated portfolio.
In US dollar terms, sales in Latin America increased by 37.2% in the quarter and by 25.3% in the full year, compared with the corresponding periods last year, reflecting softer local currencies.
Asia Pacific
Sales increased by 22.0% in the quarter and by 21.2% in the full year in constant currency terms, compared with the corresponding period last year. The robust performance was driven by solid business growth and the introduction of new, differentiated products alongside higher prices, resulting in the Company continuing to gain market share in the region.
In China, sales of branded and formulated products continued to grow strongly over the full year, as the Company continues to expand its product portfolio and geographic reach.
The Company is markedly increasing its sourcing from its parent company and other companies in the ChemChina group, driving the sale of these backward-integrated, branded, formulated products through its domestic and global commercial networks.
In US dollar terms, sales increased by 18.9% in the quarter, while sales increased by 22.3% over the full year, compared to the corresponding periods last year.
India, Middle East and Africa
Sales were lower by 3.4% in the quarter in constant currency terms, compared with the corresponding period last year, with extremely dry weather conditions in India and South Africa negatively impacting sales.
However, despite the subdued performance in the quarter, the Company delivered strong double-digit growth in the full year, with sales increasing by 16.1% in constant currency terms. This significant growth was driven by continued business growth alongside higher prices, supported by robust demand for the Company’s differentiated portfolio and generally favorable weather conditions in the first nine months of the year. Over the full year, the Company grew strongly in most markets across the region, most notably in India, Turkey, Israel and West Africa.
In US dollar terms, sales were lower by 11.7% in the quarter while sales increased by 10.7% in the full year, compared to the corresponding periods last year, reflecting softer local currencies, most notably the Indian Rupee and Turkish Lira, against the US dollar.

8
Gross profit
Gross profit in the quarter increased by 21.5% to $281 million (with gross margin of 31.3%) and by 2.5% to $1,142 million (gross margin of 32.3%) in the full year, compared to the corresponding periods last year.
The higher gross profit in both the quarter and the full year was achieved due to the strong growth and higher pricing, as well as improved mix during the quarter, which more than offset the impact of higher procurement costs of raw materials and intermediates, supply shortages and the softer currencies, most notably the Brazilian Real and the Indian Rupee, as well as the impact of missed high-margin sales in Europe in the third quarter as a result of the extreme drought in the region.
Operating expenses
The Company continues to maintain strong operating cost discipline while accommodating significantly higher sales, with total operating expenses of $207 million (23.1% of sales) in the quarter and $776 million (22.0% of sales) over the full year, compared to $201 million (28.2% of sales) and $747 million (23.8% of sales) in the corresponding periods last year, respectively.
Sales and Marketing expenses in the quarter were $159 million (17.7% of sales), in line with $159 million (22.2% of sales) in the corresponding quarter last year. Sales and Marketing expenses over the full year were $608 million (17.2% of sales), compared to $580 million (18.5% of sales) in the corresponding period last year. The moderate increase over the full year reflects primarily an increase in sales, marketing and product development teams in growing geographies and higher other variable expenses as a result of the increased sales.
General and Administrative expenses in the quarter were $33 million (3.7% of sales), compared to $30 million (4.2% of sales) in the corresponding quarter last year reflecting the adoption of a new accounting standard relating to customers’ expected credit loss. General and Administrative expenses over the full year were $119 million (3.4% of sales) compared to $127 million (4.0% of sales) in the corresponding period last year, reflecting lower personnel-related expenses.
Research and Development expenses in the quarter were $12 million (1.4% of sales), compared to $12 million (1.7% of sales) in the corresponding quarter last year. Research and Development expenses over the full year were $48 million (1.4% of sales) compared to $40 million (1.3% of sales) in the corresponding period last year. The increase over the full year resulted primarily from higher spend on strategic research and development projects.
In addition to these factors, operating expenses in the quarter and the full year benefited somewhat from the softer currencies against the US dollar.

9
Financing expenses
Net Financing expenses in the quarter were $34 million, in line with the corresponding quarter last year. Adjusting for the impact of the adoption of a new accounting standard which classifies interest income on sales as revenue, financial expenses decreased, driven by lower interest costs due to reduced debt levels and a decrease in costs of the shekel-denominated bonds as a result of the depreciation of the currency over the quarter, compared to the corresponding quarter last year.
Net financial expenses over the full year were $140 million compared to $121 million in the corresponding period last year. The increase over the year reflects the adoption of the new accounting standard. Adjusting for the impact of the change in accounting standard, financial expenses decreased over the year, reflecting reduced interest costs due to lower debt levels, somewhat offset by an increase in costs of the CPI-linked bonds as a result of an increase in the Israeli CPI over the period.
Taxation
Net tax expenses were $5 million in the quarter, compared to a net tax income of $10 million recorded in the corresponding quarter last year, which benefited from the creation of deferred tax assets in 2017 in respect of losses carried-forward and timing differences, in anticipation of their expected utilization in the subsequent periods, as well as lower taxable income generated in that period.
Net tax expenses over the full year were $52 million compared to $21 million in the corresponding period last year. The increase reflects higher taxable income worldwide, most notably in Brazil, as well as the impact of the devaluation of net, non-cash tax assets as a result of the weakening of the Brazilian Real against the US dollar. The relatively low tax expenses recorded last year reflect the mentioned creation of deferred tax assets in respect of losses carried-forward in the fourth quarter of 2017.
Revenue split by operating segment
Fourth quarter
Q4 2018 $m
% Q4 2017 $m
% Change $m
Change %
Crop protection (Agro) 847 94.5% 668 93.5% 179 26.8%
Other (Non-Agro) 49 5.5% 47 6.5% 2 5.1%
Total 896 %100 715 100% 181 25.4%
Full year
2018 $m
% 2017 $m
% Change $m
Change %
Crop protection (Agro) 93,33 94.4% 2,946 93.9% 393 13.3%
Other (Non-Agro) 719 %5.6 191 6.1% 6 2.9%
Total 3,536 %100 3,137 100% 399 12.7%

10
Financial Condition and Liquidity
Working capital
Working capital at December 31, 2018 was higher by $295 million compared to the corresponding point last year, supporting the significant momentum generating a $398 million increase in sales over the year.
In spite of strong supply chain discipline, inventory levels were higher due the building of a higher inventory level in preparation for the upcoming season, as well as absorbing the higher procurement costs.
The significant increase in sales over the quarter and the full year saw trade receivables higher in comparison to the same point last year, despite ongoing tight control of credit ensuring receivable days remain close to their record-best levels for this time of year. The higher receivables were partially offset by increased trade payables.
Cash flow and investment in fixed assets
Despite the strong sales growth and associated need for higher working capital, the Company generated operating cash flow of $3 million in the quarter. This compares to $164 million in the corresponding quarter last year, during which the Company grew at a somewhat more moderate rate. Over the full year, operating cash flow of $88 million was generated, compared to $434 million last year. This reflects mainly the increase in the working capital accommodating the strong sales growth.
Net cash used in investing activities was $48 million in the quarter and $58 million over the full year, compared to $61 million and $173 million used for investment activities in the corresponding periods last year, respectively.
Additions to assets include investments in product registrations and other intangible and fixed assets, including the transfer of products in Europe from Syngenta in the first quarter of 2018 (see note 28a(1)(e) to the financial statements - significant and independent valuation made by Ernst & Young (Israel) relating to the proceeds attribution of the transferred assets (PPA)). Proceeds from disposal of assets include the divestment of certain products in Europe in the first quarter of 2018 in connection with the approval of the European Commission for ChemChina’s acquisition of Syngenta and the proceeds from the repurchase of the ADAMA Ltd. B-shares in the second quarter, while 2017 similarly includes one-time proceeds resulting from the divestment of certain products in the US in the second quarter of 2017 in connection with the approval of the US FTC for ChemChina’s acquisition of Syngenta, as well as the sale of non-core assets.
Investments in fixed assets, net of investment grants, amounted to $23 million in the quarter and $89 million over the full year, compared to $32 million and $97 million invested in the corresponding periods last year, respectively.
While free cash flow of $45 million was consumed in the quarter compared to the $103 million generated in the corresponding period last year, the Company generated continued free cash flow of $29 million in the full year compared to $260 million last year, despite the Company's strong growth and higher procurement cost environment.

11
Current assets
Total current assets at the end of 2018 amounted to $3,196 million compared to $3,175 million at the end of 2017.
Cash, current liabilities and long-term loans
The Company's total financial liabilities, including bank credit and debentures, were $1,263 million as at December 31, 2018 (of which 9.0% was short term), compared to $1,646 million (of which 23.6% was short term) as at December 31, 2017.
The Company's balances of cash and short-term investments as at December 31, 2018 were $594 million, compared to $873 million as at December 31, 2017.
The Company's net debt, including credit, the impact of hedging transactions attributed to debt, and net of cash and short-term investments, was $765 million as at December 31, 2018 compared to $736 million as of December 31, 2017.
As of December 31, 2018, and on the date of publication of this report, the Company complied with the financial covenants included in its financing documents and the Receivables Financing Facility Program.4
Shareholders' equity
The Company's shareholders' equity was $2,266 million as of December 31, 2018, compared to $1,855 million as of December 31, 2017. Equity as a proportion of total assets was 44.1% as of December 31, 2018 and 38.0% as of December 31, 2017.
The Company's issued and paid-up share capital for December 31, 2018 is 137,990,881 ordinary shares of NIS 3.12 par value each.
Financial ratios
2017 2018 As at December 31:
1.93 2.02 Ratio of current assets to current liabilities (current ratio)
1.26 1.18 Ratio of current assets, excluding inventory, to current liabilities (quick ratio)
33.7% 24.6% Ratio of financial liabilities to total assets, gross
88.7% 55.7% Ratio of financial liabilities to total equity, gross
Financing sources
The Company finances its business operations from its own equity and external funding sources.5
Warning signs
The Company has an ongoing positive cash flow from operating activities, and therefore, as of the date of this report, the Company has no warning signs.
4 For more information about the Financial Covenants and additional limitations that apply to the Company pursuant to the provisions of
the financing agreements and the Receivables Financing Facility Program, see Section 26 of Chapter A to the Periodic Report, and Note 20 to the financial statements as at December 31, 2018.
5 For details, see Section 26, Credit Financing, and Section 25, under the titles “Receivables Credit” and “Payables Credit” of Chapter A to the Periodic Report.

12
Corporate governance
Directors with accounting and financial expertise
As of the date of publication of this report, there are four directors in the Company approved by the Board of Directors as having accounting and financial expertise:6 Ms. Dalit Braun (external director), Mr. Gustavo Traiber (external director), Mr. Jiashu Cheng (independent director) and Mr. Gaoning Ning.
Independent directors
The Company's Articles of Association do not contain provisions concerning the number of independent directors.
The Internal Auditor
▪ Mr. Yehoshua Hazenfratz, CPA, serves as internal auditor of the Company, as of November 6, 20077, and is an external service provider of the Company on behalf of the accounting firm Shiff Hazenfratz & Co., Risk Control and Management Consultancy.
▪ Mr. Hazenfratz was appointed as internal auditor at the recommendation of the Company's Audit Committee and the resolution of the Board of Directors, after his qualifications and experience were examined. Mr. Hazenfratz was found suitable to serve as the Company's internal auditor, inter alia considering the scope and complexity of the Company's operations.
▪ Other than his position as the internal auditor of the Company, the internal auditor is not employed by the Company nor performs any other function that creates or is likely to create a conflict of interest with his position as internal auditor of the Company. In addition, the internal auditor is not an interested party of the Company, an officer of the Company, a relative of any of the above, and does not act as the auditor of the Company or anyone on his behalf.
▪ To the best of the Company's knowledge, based on the declaration of the internal auditor, the internal auditor complies with the applicable legal provisions.8
▪ The person within the organization who is in charge of the internal auditor is the CFO.
▪ The internal auditor's audit plan is an annual plan that is derived from a multi-year work plan, prepared by the internal auditor, in coordination with, and with the approval of, the Board of Directors (including changes thereto), under the supervision of the CEO, after receiving the recommendations of the Company's Audit Committee. The considerations guiding the preparation of the plan are risk level, for the purpose of locating deficiencies, streamlining systems, guaranteeing protection of the Company's assets, and ensuring compliance with its procedures and the laws of the countries in which it operates. This
6 In accordance with the Board of Director’s decision, the minimum number of directors with accounting and financial expertise in the
Company is two. For additional details about the aforementioned directors, see Regulation 26 of Chapter D to the Periodic Report. 7 On February 2012, the Company's Board of Directors approved the continuation of Mr. Hazenfratz's service as internal auditor of the
Company. 8 The internal auditor complies with the provisions of Section 146 to the Companies Law - 1999 and with the provisions of Section 8 to the
Internal Audit Law - 1992 ("Internal Audit Law").

13
plan is adapted to the developments and findings of the audit. If necessary, the internal auditor may exercise discretion and deviate from the work plan.
▪ The internal audit work plan also includes auditing the follow-up of implementation of the recommendations of the internal auditor and the Audit Committee by the Company's management, or by the internal auditor. In addition, the internal auditor participates in the review process and discussions of the Audit Committee in connection with material transactions.9
▪ The internal auditor also serves as the internal auditor of the Group companies in Israel, ADAMA Makhteshim and ADAMA Agan. As of April 10, 2017, the auditing of the group companies outside Israel is carried out by PKF International.
▪ Material investees of the Company are audited according to a multi-year audit plan that includes a range of auditing topics, once every several years for each investee.
▪ The scope of the internal auditor's service is determined by the Audit Committee based on the audit plan that is approved by the Board of Directors. In 2018, the number of internal audit work hours at the Company and its subsidiaries totaled approximately 3,299 hours. The scope of the work is set according to the needs of the audit plan and is not limited by the Company.
Work hours
Internal audit in the Company and its investees 3,299
Internal audit in the Company's investees 2,472
Internal audit of operations in Israel 2,475
Internal audit of operations outside of Israel 824*
* Not including a total of 512 audit hours of activities outside of Israel, which were carried out in practice by an employee of the Company, approved and supervised by PKF.
The scope of the auditing work hours in the Company and its investees is set based on the audit plan proposed by the internal auditor in conjunction with the management and approved by the Audit Committees of the various boards of directors.
▪ The internal auditor and the team of employees under him are required to carry out the audit while strictly complying with the criteria prescribed for conducting a professional, reliable, independent audit that is not dependent on the audited body. The Board of Directors relied on the internal auditor's reports concerning his compliance with the professional standards according to which the audit is carried out.
▪ The internal auditor of the Company was given free access10, including constant and unmediated access to relevant information systems of the Company and of the subsidiaries, including financial information. With regard to the subsidiaries outside Israel, the internal auditor examines whether audits have been conducted in each subsidiary and whether there is a work plan for the following year, based on reports from the auditors of the relevant companies.
▪ At the meetings of the Audit Committee in 2018 and up to the date of this report the internal audit reports which were submitted in writing to the Chairman of the Audit Committee and to the Company's CEO were discussed.11
9 As the term is defined in Section 5 to the fourth amendment to the Securities Regulations (Periodic and Immediate Reports) - 1970. 10 As specified in section 9 of the Internal Audit Law. 11 On January 14, 2018, the Audit Committee discussed a report issued in January 2018; on February 20, 2018 the Audit Committee
discussed two reports issued in February 2018; on July 11, 2018 the Audit Committee discussed a report issued in July 2018; on July 26, 2018 the Audit Committee discussed a report issued in July 2018; on August 9, 2018, the Audit Committee discussed a report issued in

14
▪ In the opinion of the Company's Board of Directors, the scope, nature and continuity of the internal auditor’s activities and his work plan are reasonable and fulfill the Company’s internal audit goals.
▪ The remuneration paid to the internal auditor is based on working hours and according to the work plan that is approved by the Board of Directors. At the beginning of each year, the auditor submits a proposal for the annual audit plan which includes the planned number of work hours. The Board of Directors determines the audit work plan and the number of work hours. The auditor does not exceed the number of work hours without the consent of the Board of Directors. In the event that additional tasks are allocated to the auditor during the course of the audit year, the Board of Directors determines the number of work hours for the additional tasks. In 2018, the internal auditor's remuneration for his work in Israel amounted to approximately $138 thousand. The total payment for audit activities outside of Israel amounted to approximately $122 thousand. The Company estimates that since the remuneration is based on working hours, such remuneration does not affect the professional considerations of the internal auditor.
Donations
The Company sees contribution and assistance to the community in Israel and in the countries in which it operates as an integral component of its activities. This contribution and assistance to the community in Israel, particularly in the south of the country and in communities/areas close to the locations of the Company's plants, and worldwide with regard to communities in the vicinity of its sites of operation, constitute a key component of the Company’s vision and objectives. The Company recognizes that business leadership goes together with social-value leadership.
Social responsibility, involvement with, and contribution to, the community are strategic goals that constitute part of the Company's work plan, which allocates financial resources to this goal annually. Community activities are carried out also with the involvement of Company’s employees, while instilling values of social responsibility and environmental protection.
The Company focuses on activities for the benefit of the community in education and in a variety of excellence programs, as well as on bridging gaps and strengthening at-risk populations, in accordance with the Sustainable Development Goals (SDGs) defined by the UN. The Company places special emphasis on the promotion of education in subjects like chemistry, agriculture and sustainability, which are fields that are aligned with the core of the Company’s business activities, as well as on investments connected to health, culture, sport, heritage and welfare.
In 2018, the Company made aggregate donations of approximately $1.9 million, of which approximately $ 61. million in Israel.
July 2018 and a report issued in August 2018; On October 31, 2018 the Audit Committee discussed a report issued in August 2018; On December 24, 2018 the Audit Committee discussed a report issued in December 2018; On January 31, 2019, the Audit Committee discussed a report issued in January 2019; and on February 28, 2019, the Audit Committee discussed a report issued in February 2019.

15
Company's Auditor
The primary auditors of the Company and its investee companies are the accounting firm Deloitte (as of August 15, 2017).
Fees paid to Deloitte in 2018 for auditing services, services connected to the audit, including auditing the effectiveness of the internal control, and tax consultancy services concerning the Company's financial statements in Israel amounted to approximately $855 thousand, for approximately 20 thousand work hours (said fees amounted in 2017 to approximately $480 thousand, for approximately 14, thousand work hours, as of August 15, 2017). Deloitte did not provide other services to the Company in Israel during 2018.
Fees paid to Deloitte in 2018 for auditing services outside of Israel amounted to approximately $2,211 thousand, for approximately 31 thousand working hours (said fees amounted in 2017 to approximately $1,413 thousand, for approximately 21, thousand working hours, as of August 15, 2017). Deloitte did not provide other services to the Company outside Israel during 2018.
The fees for auditing services constitute more than half of the total paid to the auditors by the Company in the reporting year. The fees are paid on the basis of working hours. The Company's Board of Directors approves the auditors’ fees.
Securities repurchase
The Company did not repurchase any Company securities in 2018.
For information concerning CPI and foreign currency exposure, see Note 29 to the Company’s financial statements for 2018. For information about the debentures held by the public at the reporting date, see Appendix B.

16
The Company's Board of Directors and management express their gratitude to the Company's management and employees, and thank them for their significant contribution, willingness and ability to successfully cope with the goals and challenges the Company faced in 2018.
Yang Xingqiang Chen Lichtenstein Aviram Lahav
Chairman of the Board President & CEO CFO
March 19, 2019

17
Appendixes
Appendix A – Analysis of the Gaps between the Adjusted Income Statement Items and the Income Statement Items in the Financial Statements
$m Adjusted Adjustments Reported
Q4 2018 Q4 2017 Q4 2018 Q42017 Q4 2018 Q42017
Revenues 896 715 - - 896 715
Gross profit 281 231 - - 281 231
Operating expenses 207 201 14 6 222 208
Operating income (EBIT) 74 30 -14 -7 59 23
Finance expenses, net 34 34 - - 34 34
Pre-tax income 39 0 -14 -8 25 8-
Net income 34 9 -22 -5 12 5
EBITDA 121 76 -4 -10 117 66
$m Adjusted Adjustments Reported
2018 2017 2018 2017 2018 2017
Revenues 3,536 3,137 - - 3,536 3,137
Gross profit 1,142 1,115 -2 -2 1,140 1,113
Operating expenses 776 747 -281 -6 495 741
Operating income (EBIT) 366 368 280 4 646 372
Finance expenses, net 140 121 - - 140 121
Pre-tax income 227 255 280 1 507 256
Net income 175 234 203 2 377 236
EBITDA 551 546 308 -4 859 542
Income Statement Adjustments
Q4 2018 USD (m)
Q4 2017 USD (m)
FY 2018 USD (m)
FY 2017 USD (m)
Net Income (as Reported) 12.3 4.6 377.5 235.6
Non-cash amortization of Transfer assets received from Syngenta related to the 2017 ChemChina-Syngenta acquisition
10.6 - 30.9 -
One-time capital gain from sale of EU and US registrations, related to the 2017 ChemChina acquisition of Syngenta, net of taxes
3.1 - -241.7 -8.6
Historical tax expenses resulting from the finalization of tax assessments 8.4 25.4 8.4 28.2
Reinstatement of depreciation expenses due to classification of to-be-divested European registrations as “Held-for-Sale”, related to 2017 ChemChina acquisition of Syngenta
- -3.5 -2.6 -4.9
Creation of deferred tax asset on losses carried forward in anticipation of their expected utilization, due to expected capital gain on ChemChina-Syngenta related divestments
- -28.7 - -28.7
Adjustment of 2017 LTI provision made in Q4 to accrual over the full year - 6.3 - -
One-time award to employees in connection with the combination transaction between the Company and Sanonda
- - - 5.8
Non-core asset disposal - - 2.3 -
Adjustments related to Sanonda B shares realization - 5.3 - 6.3
Total adjustments 22.1 4.8 -202.7 -1.9
Net Income (as Adjusted) 434. 9.4 174.8 233.7

18
Appendix B – Details of the Company's Debentures as at the end of the reported Year
Fair value at
December 31, 2018 (in USD millions)
Carrying value of interest
payable on December 31, 2018 (in USD millions)
Carrying value of
debenture balances at December 31, 2018 (in USD millions)
CPI-linked nominal par value
at December
31, 2018 (in NIS
millions)
Nominal par value
at December 31, 2018 (in NIS
millions)
Linkage basis
Dates of principal payments
Dates of interest
payments
Market value on December 31, 2018 (in
NIS millions)
Effective interest rate at
reporting date
Nominal interest
rate
Type of interest
Total par value on date of
issue (in NIS millions)
Rating Date of issue
Series
1,308.8 (2) 4.9 (2) 1,114.5 (2) 4,212 (2) 4,212.1 (2) CPI for October
2006
Nov. 30 of each of the years 2020-
2036
Twice a year on May 31
and on Nov, 30 in each of
the years 2006-2036
4,905.3 (2) 3.2% 5.15% CPI-linked
annual interest
1,650
ilAA- (3)
Dec. 06
Series B (1)
514 Jan. 12
600 Jan. 13
533 Feb. 15
267 Feb-May
15
Notes: (a) As of January 3, 2017, the trustee for debentures (Series B) is Mishmeret trust company Ltd., 48 Menachem Begin Road, Tel Aviv (Tel: 03-6374351; Fax: 03-6374344). Contact
person: Rami Sebti, C.P.A. VP, E-mail: [email protected]. The replacing of the trustee for debentures (Series B) was done due to decision of the Board of Aurora Fidelity Trust Company Ltd. to cease its operation in the field of debenture trustee (for details see the Company's immediate report of January 4, 2017 (Ref. 2017-01-001357).
(b) Series B is considered a material liability of the Company.
(c) At the date of the report, the Company was in compliance with all the terms and undertakings under the Deed of Trust, and no conditions existed giving rise to a cause of action for immediate repayment of the debentures.
(d) On January 16, 2012 the Company issued, by way of series expansion under a shelf prospectus published by the Company in May 2010, NIS 513,527,000 par value debentures (Series B).
(e) On January 9, 2013 the Company issued, in a private placement by way of series expansion, NIS 600,000,000 par value of debentures (Series B).
(f) On February 1, 2015, the Company issued, in a private placement by way of series expansion, NIS 533,330,000 par value of debentures (Series B). For more details, see the Company's immediate report of February 2, 2015 (Ref: 2015-01-023371). In addition, within the scope of the said private placement, the Company issued 2,666,650 options convertible to up to NIS 266,666,650 par value of debentures (Series B), which, were exercised in full.
(1) On September 15, 2013, S&P Maalot confirmed a rating of ilA+ for the Company’s debentures. On July 1, 2014, S&P Maalot announced that it has raised the rating for the
Company’s debentures (B series) from ilA+ to a rating of ilAA- with stable outlook (Ref. 2014-01-104136). On January 22, 2015, S&P Maalot confirmed a rating of ilAA- for the Company’s debentures (series B) issued upon a private placement of up to NIS 800 million (Ref. 2015-01-017026). On July 6, 2015, S&P Maalot ratified the aforementioned rating for the Company (Ref. 2015-01-066279). On August 18, 2015, S&P Maalot notified that there is no immediate change in the Company’s rating following the possible transaction by the Company’s shareholders to exchange their Company shares for shares of Hubei Sanonda Co. Ltd. (Ref. 2015-01-098901). On July 7, 2016, S&P Maalot ratified the rating (iIAA-/Stable) (reference: 2016-15-077449); On July 5, 2017, S&P Maalot ratified the rating (iIAA-/Stable) (reference: 2017-01-057265); On June 19, 2018, S&P Maalot ratified the (iIAA-) rating of the debentures (Series B) (reference: 2018-15-058969; 2018-01-058975).
(2) Net of debentures purchased by a wholly-owned subsidiary, which holds 67,909,858 debentures (Series B), which as to the end of the reported year, accounts for 1.91% of total issued debentures (Series B).

19
Appendix C - Exchange Rate Data for the Company's Principal
Functional Currencies
December 31 Q4 Average Annual Average
2018 2017 Change 2018 2017 Change 2018 2017 Change
EUR/USD 1.145 1.198 -4.4% 1.141 1.178 -3.1% 1.180 1.127 4.7%
USD/BRL 3.875 3.308 -17.1% 3.810 3.248 -17.3% 3.655 3.192 -14.5%
USD/PLN 3.760 3.481 -8.0% 3.768 3.594 -4.9% 3.612 3.779 4.4%
USD/ZAR 14.428 12.380 -16.5% 14.284 13.580 -5.2% 13.239 13.264 0.2%
AUD/USD 0.706 0.781 -9.6% 0.717 0.769 -6.7% 0.747 0.766 -2.5%
GBP/USD 1.279 1.350 -5.3% 1.287 1.328 -3.1% 1.334 1.287 3.6%
USD/ILS 3.748 3.467 -8.1% 3.705 3.507 -5.6% 3.591 3.596 0.1%
USD L 3M 2.81% 1.69% 65.7% 2.62% 1.46% 79.7% 2.30% 1.26% 82.1%
Chapter C
Financial Statements as at December
31, 2018

Adama Agricultural Solutions Ltd.
Consolidated Financial Statements
as of December 31, 2018
in US Dollars

Adama Agricultural Solutions Ltd.
Consolidated Financial Statements
as of December 31, 2018
in US Dollars
CONTENTS
Page
Financial statements:
Auditors’ Report - Internal control over financial reporting 2-3
Auditors' Report - Consolidated Financial Statements as of December 31, 2018 4
Consolidated Statements of Financial Position 5-6
Consolidated Statements of Income 7
Consolidated Statements of Comprehensive Income 8
Consolidated Statements of Changes in Equity 9-11
Consolidated Statements of Cash Flows 12-13
Notes to the Consolidated Financial Statements 14-89
Appendix to the Financial Statements - Schedule of Investee Companies 99-103

2
Auditors' Report to the Shareholders of
Adama Agricultural Solutions Ltd. Regarding the Audit of Internal Control Components
over Financial Reporting in accordance with paragraph 9b(c)
of the Israeli Securities Regulations (Periodic and Immediate Reports), 1970
We have audited internal control components over financial reporting of Adama Agricultural Solutions Ltd. and
its subsidiaries (hereinafter “the Company”) as of December 31, 2018. These control components were
determined as explained in the following paragraph. The Company's Board of Directors and Management are
responsible for maintaining effective internal control over financial reporting and for their assessment of the
effectiveness of the Company’s internal control components over financial reporting accompanying the
periodic report as of the above date. Our responsibility is to express an opinion on the Company’s internal
control components over financial reporting based on our audit.
Audited Internal control components over financial reporting were determined in accordance with Auditing
Standard 104 of the Institute of Certified Public Accountants in Israel “Audit of Internal Control Components
over Financial Reporting” and its amendments (hereinafter “Auditing Standard 104”). These components are:
(1) Entity level controls, including controls over the preparation and closure of the financial reporting process
and information technology general controls; (2) controls over sales; (3) controls over purchase; (4) controls
over inventory; (5) controls over financial derivatives (all these hereinafter are named together - “audited
control components”).
We conducted our audit in accordance with Auditing Standard 104. This standard requires us to plan and
perform the audit to identify the audited control components and to obtain reasonable assurance about whether
these control components were effective in all material respects. Our audit included obtaining an understanding
of internal control over financial reporting, identifying the audited control components, assessing the risk that
a material weakness exists in the audited control components, and testing and evaluating the design and
operating effectiveness of those control components based on the assessed risk. Our audit, regarding those
control components, also included performing such other procedures as we considered necessary in the
circumstances. Our audit referred only to the audited control components, as opposed to internal control over
all significant processes related to financial reporting, therefore our opinion refers to the audited control
components only. Our audit also did not refer to mutual effects between audited control components and non
audited control components, therefore our opinion does not take into account these possible effects. We
believe that our audit provides a reasonable basis for our opinion in the context described above.
Because of its inherent limitations, internal control over financial reporting as a whole, and internal control
components in particular, may not prevent or detect misstatements. Also, projections of any current evaluation
of effectiveness to future periods are subject to the risk that controls may become inadequate because of
changes in conditions, or that the degree of compliance with the policies or procedures may deteriorate.

3
In our opinion, the Company maintained, in all material respects, effective audited control components as of
December 31, 2018.
We have also audited, in accordance with generally accepted auditing standards in Israel, the Company’s
consolidated financial statements as of December 31, 2018 our report dated March 19, 2019 expressed an
unqualified opinion on those financial statements, based on our audit and on the reports of other auditors.
Brightman Almagor Zohar & Co.
Certified Public Accountants
Member of Deloitte Touche Tohmatsu Limited
Tel Aviv, March 19, 2019

4
Auditors' Report to the Shareholders of
Adama Agricultural Solutions Ltd.
We have audited the accompanying consolidated statements of financial position of Adama Agricultural
Solutions Ltd. (hereafter – "the Company") as of December 31, 2018 and 2017, and the consolidated
statements of other comprehensive income, comprehensive income, changes in equity and cash flows for
each of the two years in the period ended December 31, 2018. These financial statements are the responsibility
of the Company's board of directors and management. Our responsibility is to express an opinion on these
financial statements based on our audit.
The financial statements of the Company as of December 31, 2016 were audited by another auditors whose
report as of March 30, 2017 included a disqualified opinion.
We conducted our audits in accordance with Generally Accepted Auditing Standards in Israel, including
standards prescribed by the Auditors' Regulations (Auditor's Mode of Performance) – 1973. Those standards
require that we plan and perform the audit to obtain reasonable assurance about whether the financial
statements are free of material misstatement. An audit includes examining, on a test basis, evidence
supporting the amounts and disclosures in the financial statements. An audit also includes assessing the
accounting principles used and significant estimates made by the board of directors and management, as well
as evaluating the overall financial statements presentation. We believe that our audit and the reports of other
auditors provide a reasonable basis for our opinion.
In our opinion, the financial statements referred to above present fairly, in all material respects, the financial
position of the Company and its consolidated companies as of December 31, 2018 and December 31, 2017,
and the results of their operations, changes in equity and their cash flows for each of the two years in the
period ended in December 31, 2018, in conformity with International Financial Reporting Standards (IFRS)
and with the provisions of the Securities Regulations (Annual Financial Statements) – 2010.
We have also audited, in accordance with Auditing Standard 104 of the Institute of Certified Public Accountants
in Israel, "An Audit of Components of Internal Control over Financial Reporting", as amended, the Company's
components of internal control over financial reporting as of December 31, 2018 and our report dated March
19, 2019 included an unqualified opinion on the effective maintenance of those components.
Brightman Almagor Zohar & Co.
Certified Public Accountants
Member of Deloitte Touche Tohmatsu Limited
Tel Aviv, March 19, 2019

The accompanying notes are an integral part of these financial statements.
5
Adama Agricultural Solutions Ltd. Consolidated Statements as of Financial Position
December 31
2 0 1 8 2 0 1 7
Note $ thousands
Current assets
Cash and cash equivalents 87,3135 869,499
Short-term investments 6,716 3,520
Trade receivables 4 899,565 722,927
Trade receivable as part of securitization transaction not yet eliminated 4 18,926 34,876
Subordinated note in respect of sale of trade receivables 4 90,681 89,398
Prepaid expenses 20,829 21,676
Financial and other assets, including derivatives 5 228,786 254,914
Tax deposits less provision for taxes 17 20,749 13,622
Inventories 6 641,221,3 1,103,175
Assets held for sale 10 - 61,721
Total current assets 3,196,206 3,175,328
Long-term investments, loans and receivables
Investments in equity-accounted investee companies 15,787 15,669
Other financial investments and receivables 7 44,799 58,807
Non-financial assets, including non-current inventory 8 21,590 17,308
82,176 91,784
Fixed assets
Cost 9 1,884,594 1,815,604
Less - accumulated depreciation 1,028,402 967,728
856,192 847,876
Deferred tax assets 17 96,852 129,250
Intangible assets
Cost 10 2,073,781 1,705,050
Less - accumulated amortization 1,171,858 1,066,352
901,923 638,698
Total non-current assets 1,937,143 1,707,608
Total assets 5,133,349 4,882,936
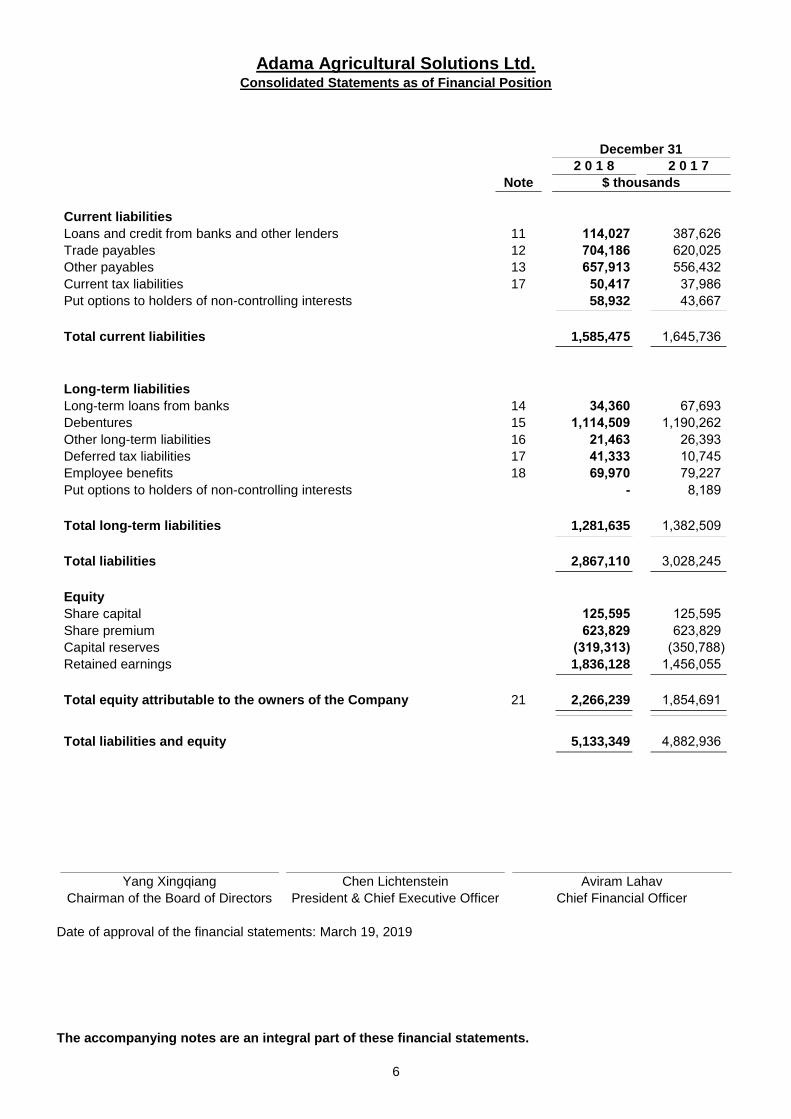
The accompanying notes are an integral part of these financial statements.
6
Adama Agricultural Solutions Ltd. Consolidated Statements as of Financial Position
December 31
2 0 1 8 2 0 1 7
Note $ thousands
Current liabilities
Loans and credit from banks and other lenders 11 114,027 387,626
Trade payables 12 704,186 620,025
Other payables 13 3657,91 556,432
Current tax liabilities 17 50,417 37,986
Put options to holders of non-controlling interests 58,932 43,667
Total current liabilities 1,585,475 1,645,736
Long-term liabilities
Long-term loans from banks 14 34,360 67,693
Debentures 15 1,114,509 1,190,262
Other long-term liabilities 16 21,463 26,393
Deferred tax liabilities 17 41,333 10,745
Employee benefits 18 69,970 79,227
Put options to holders of non-controlling interests - 8,189
Total long-term liabilities 1,281,635 1,382,509
Total liabilities 2,867,110 3,028,245
Equity
Share capital 125,595 125,595
Share premium 623,829 623,829
Capital reserves (319,313) (350,788)
Retained earnings 1,836,128 1,456,055
Total equity attributable to the owners of the Company 21 2,266,239 1,854,691
Total liabilities and equity 5,133,349 4,882,936
Yang Xingqiang Chen Lichtenstein Aviram Lahav
Chairman of the Board of Directors President & Chief Executive Officer Chief Financial Officer
Date of approval of the financial statements: March 19, 2019

The accompanying notes are an integral part of these financial statements.
7
Adama Agricultural Solutions Ltd. Consolidated Statements of Income
for the year ended December 31
2 0 1 8 2 0 1 7 2 0 1 6
Note $ thousands
Revenues 22 3,535,653 3,137,377 3,070,165
Cost of sales 23 2,395,232 2,024,399 2,036,858
Gross profit 1,140,421 1,112,978 1,033,307
Other income 28A(1)(e) (340,276) (15,750) (9,738)
Selling and marketing expenses 24 636,768 573,164 549,731
General and administrative expenses 25 118,782 132,652 111,665
Research and development expenses 26 48,475 40,265 32,684
Other expenses 28A(1)(e) 31,159 11,054 4,803
494,908 741,385 689,145
Operating income 645,513 371,593 344,162
Financing expenses 238,759 283,266 260,962
Financing income (98,593) (162,249) (120,612)
Financing expenses, net 27 140,166 121,017 140,350
Share of income (losses) of equity-accounted
investee companies
19A(7) 1,173 5,578 (16,622)
Profit before taxes on income 506,520 256,154 187,190
Income taxes 17 129,035 20,544 22,520
Profit for the year 377,485 235,610 164,670
Attributable to:
The owners of the Company 377,485 235,610 162,328
Holders of non-controlling interests - - 2,342
Profit for the year 377,485 235,610 164,670

The accompanying notes are an integral part of these financial statements.
8
Adama Agricultural Solutions Ltd. Consolidated Statements of Comprehensive Income
for the year ended December 31
2 0 1 8 2 0 1 7 2 0 1 6
$ thousands
Profit for the year 377,485 235,610 164,670
Other comprehensive income items that after initial
recognition in comprehensive income were or will be
transferred to the statement of income
Foreign currency translation differences for foreign operations (22,115) 24,063 (13,865)
Foreign currency translation differences for foreign operations
transferred to the statement of income (211) 9,530 (82)
Effective portion of changes in fair value of cash flow hedges 17,665 (61,784) 14,310
Net change in fair value of cash flow hedges transferred to profit
or loss 43,260 (8,070) (14,237)
Taxes in respect of other comprehensive income items that were
or will be transferred to the statement of income in succeeding
periods (7,384) 7,927 539
Total other comprehensive income (loss) for the year that
after initial recognition in comprehensive income were or
will be transferred to the statement of income, net of tax 31,215 (28,334) (13,335)
Other comprehensive income that will not be transferred to
the statement of income
Re-measurement of defined benefit plan 5,177 (1,563) 84
Taxes in respect of other comprehensive income items that will
not be transferred to the statement of income (479) (570) 52
Total other comprehensive income for the year that will not
be transferred to the statement of income, net of tax 4,698 (2,133) 136
Total comprehensive income for the year 413,398 205,143 151,471
Total comprehensive income attributable to:
The owners of the Company 413,398 205,143 149,040
Holders of non-controlling interests - - 2,431
Total comprehensive income for the year 413,398 205,143 151,471

The accompanying notes are an integral part of these financial statements.
9
Adama Agricultural Solutions Ltd. Condensed Consolidated Interim Statement of Changes in Equity
for the year ended December 31 2018
Share Share Capital Retained
Total equity attributable
to the owners of
the capital premium reserves (1) earnings Company $ thousands
Balance as of January 1, 2018 125,595 623,829 (350,788) 1,456,055 1,854,691
Adoption of new accounting standards (See Note 3S) - - - 2,266 2,266
Balance as at January 1, 2018 after the Adoption of new accounting standards 125,595 623,829 (350,788) 1,458,321 1,856,957
Total comprehensive income for the year
Profit for the year - - - 377,485 377,485
Components of other comprehensive income
Foreign currency translation differences for foreign operations - - (22,115) - (22,115)
Foreign currency translation differences for foreign operation recognized in
statement of income (211) - (211)
Effective portion of change in fair value of cash flow hedges - - 17,665 - 17,665
Net change in fair value of cash flow hedges transferred to statement of income - - 43,260 - 43,260
Re-measurement of defined benefit plan - - - 5,177 5,177
Taxes on other comprehensive income - - (7,384) (479) (7,863)
Other comprehensive income for the year, net of tax - - 31,215 4,698 35,913 Total comprehensive income for the year - - 31,215 382,183 413,398
Acquisition of non-controlling interests 260 - 260
Dividends to holders of non-controlling interests holding a put option - - - (4,376) (4,376)
Balance as of December 31, 2018 125,595 623,829 (319,313) 1,836,128 2,266,239
(1) Including treasury shares that were cancelled in the amount of $245,548 thousand.

The accompanying notes are an integral part of these financial statements.
10
Adama Agricultural Solutions Ltd. Condensed Consolidated Interim Statement of Changes in Equity
for the year ended December 31 2017
Share Share Capital Retained
Total equity attributable
to the owners of
the capital premium reserves (1) earnings Company $ thousands
Balance as of January 1, 2017 125,595 623,829 (322,454) 1,227,310 1,654,280
Total comprehensive income for the year
Profit for the year - - - 235,610 235,610
Components of other comprehensive income
Foreign currency translation differences for foreign operations - - 24,063 - 24,063
Foreign currency translation differences for foreign operation recognized in
statement of income 9,530 - 9,530
Effective portion of change in fair value of cash flow hedges - - (61,784) - (61,784)
Net change in fair value of cash flow hedges transferred to statement of income - - (8,070) - (8,070)
Re-measurement of defined benefit plan - - - (1,563) (1,563)
Taxes on other comprehensive income - - 7,927 (570) 7,357
Other comprehensive loss for the year, net of tax - - (28,334) (2,133) (30,467) Total comprehensive income (loss) for the year - - (28,334) 233,477 205,143
Dividends to holders of non-controlling interests holding a put option - - - (4,732) (4,732)
Balance as of December 31, 2017 125,595 623,829 (350,788) 1,456,055 1,854,691
(1) Including treasury shares that were cancelled in the amount of $ 245,548 thousand.

The accompanying notes are an integral part of these financial statements.
11
Adama Agricultural Solutions Ltd. Condensed Consolidated Interim Statement of Changes in Equity
for the year ended December 31 2016 Total equity attributable to Non- Share Share Capital Retained the owners of controlling capital premium reserves (1) earnings the Company interests Total equity $ thousands
Balance as of January 1, 2016 125,595 623,829 (309,030) 1,126,239 1,566,633 207 1,566,840
Total comprehensive income for the year Profit for the year - - - 162,328 162,328 2,342 164,670
Components of other comprehensive income Foreign currency translation differences for foreign
operations - - (13,954) - (13,954) 89 (13,865) Foreign currency translation differences for foreign
operation recognized in statement of income - - (82) - (82) - (82) Effective portion of change in fair value of cash flow
hedges - - 14,310 - 14,310 - 14,310 Net change in fair value of cash flow hedges
transferred to statement of income - - (14,237) - (14,237) - (14,237) Re-measurement of defined benefit plan - - - 84 84 - 84 Taxes on other comprehensive income - - 539 52 591 - 591
Other comprehensive income (loss) for the year, net of tax - - (13,424) 136 (13,288) 89 (13,199)
Total comprehensive income (loss) for the year - - (13,424) 162,464 149,040 2,431 151,471
Dividends to holders of non-controlling interests
holding a put option - - (4,149) (4,149) - (4,149)
De-recognition of non-controlling interest due to loss of control in subsidiaries - - - - - 2,638 (2,638)
Share-based payments - - - (16,981) (16,981) - (16,981)
Dividends to owners of the Company - - - (40,263) (40,263) - (40,263) Balance as of December 31, 2016 125,595 623,829 (322,454) 1,227,310 1,654,280 - 1,654,280
(1) Including treasury shares that were cancelled in the amount of $245,548 thousand.

The accompanying notes are an integral part of these financial statements.
12
Adama Agricultural Solutions Ltd. Consolidated Statement as of Cash Flows
for the year ended December 31
2 0 1 8 2 0 1 7 2 0 1 6
$ thousands
Cash flows from operating activities
Profit for the year 377,485 235,610 164,670
Adjustments
Depreciation and amortization 211,234 169,581 175,294
Loss (gain) on realization of fixed and intangible assets, net (309,925) (3,022) (6,883)
Amortization of discount/premium and debt issuance costs 532 497 (824)
Impairment of assets 2,642 885 8,703
Share of losses (income) of equity-accounted investee
companies (1,173) (5,578) 16,622
Share-based payments 572 8,228 (16,981)
Revaluation of put and call options to holders of non-controlling
interests 1,449 1,280 (811)
Adjustment of long-term liabilities (78,217) 115,488 15,939
SWAP transaction - (480) (481)
Change in provision for income tax and tax advances, net 1,804 14,166 (364)
Decrease (increase) in deferred taxes, net 52,787 (34,238) (22,884)
Changes in assets and liabilities
Decrease (increase) in trade and other receivables (749181,) (47,158) 6,786
Decrease (increase) in inventories (248,017) (54,950) 135,348
Increase (decrease) in trade and other payables 267,109 17,854 24,381
Change in employee benefits (9,032) 15,398 3,663
Net cash from operating activities 87,501 433,561 502,178
Cash flows from investing activities
Acquisition of fixed assets (89,454) (101,421) (94,061)
Additions to intangible assets (413,282) (103,018) (93,854)
Proceeds from sale of fixed and intangible assets 380,755 14,112 6,223
Sale of equity-accounted investee company 61,435 - -
Short-term investments, net 820 1,730 (431)
Long-term investments, net 58 (3,546) (9,147)
Investment grant received - 4,254 1,436
Dividend from equity-accounted investee company 1,208 219 1,112
Disposal of subsidiaries - 14,603 (1,430)
Deferred payment for business combination - - (600)
Net cash used in investing activities (58,460) (173,067) (190,752)

The accompanying notes are an integral part of these financial statements.
13
Adama Agricultural Solutions Ltd. Consolidated Statement as of Cash Flows
for the year ended December 31
2 0 1 8 2 0 1 7 2 0 1 6
$ thousands
Cash flows from financing activities
Receipt of long-term loans from banks 145 50,000 12,700
Repayment of long-term loans and liabilities from banks and
others (49,791) (119,635) (104,165)
Increase (decrease) in short-term liabilities to banks, net (255,742) 230,229 (9,028)
Dividend paid to holders of non-controlling interests (4,376) (4,732) (4,149)
Payment of contingent consideration in respect of business
combination (1,463) - (7,520)
Repayment of debentures - - (101,210)
Dividend paid to owners of the Company - (21,742) (18,521)
Net cash from (used in) financing activities (311,227) 134,120 (231,893)
Net increase (decrease) in cash and cash equivalents (282,186) 394,614 79,533
Cash and cash equivalents at the beginning of the year 869,499 474,885 395,352
Cash and cash equivalents at the end of the year 587,313 869,499 474,885
Additional information for Cash flows from operating
activities:
Interest paid in cash (79,097) (85,118) (93,605)
Interest received in cash 5,357 37,503 35,009
Taxes paid in cash, net (74,873) (41,829) (43,836)

Adama Agricultural Solutions Ltd. Notes to the Financial Statements as of December 31, 2018
14
Note 1 - General
A. Description of the Company and its activities:
(1) Adama Agricultural Solutions Ltd. is an Israel-resident company that was incorporated in
Israel, and its official address is at Golan Street in Airport City Park. The Group’s
consolidated financial statements as of December 31, 2018, include those of the Company
and its subsidiaries (hereinafter together - “the Group”) as well as the Company’s interest
in associated companies and in joint arrangements. The Group operates in and outside of
Israel and is engaged in development, manufacturing and marketing of agrochemicals,
intermediate materials for other industries, food additives and synthetic aromatic products,
mainly for export.
As of December 31, 2018, the Company is 100% held by ADAMA Ltd. (formerly known as
Hubei Sanonda Co. Ltd.) as Regarding the change in holding in the Company's share
capital see Note 28A(1)(b). The Company is a Reporting corporation.
(2) Sales of agrochemical products are directly impacted by the timing of the agricultural
seasons (in each of the various markets), the weather in every region and the cyclical
pattern of the harvests. Therefore, the Company’s income is not uniform or spread evenly
throughout the quarters of the year. The agricultural seasons in countries located in the
northern hemisphere (mainly the United States and Europe) take place in the first two
quarters of the year and, accordingly, in these countries the sales are usually highest in the
first half of the year. On the other hand, in the southern hemisphere, the seasonal trends
are the opposite and most of the local sales are made in the second half of the year, except
for Australia where most of the sales are made in April through July.
In the Company’s estimation, the Group's global activity and the market diversification in
which it operates mitigates the inherent seasonality in the business to some extent, even
though the Group’s sales are higher in the northern hemisphere.
B. Definitions:
In these financial statements:
The Company - Adama Agricultural Solutions Ltd.
The Group - Adama Agricultural Solutions Ltd. and its investee companies.
Subsidiaries - Companies of which the financial statements are fully consolidated,
directly or indirectly, with the financial statements of the Company.
Investee Companies - Subsidiaries and associated companies or joint arrangements that
the Company’s investment in which is stated, directly or indirectly,
using the equity method of accounting.
Related party - As defined in IAS 24 (2009) “Relating Party Disclosures”.
Interested parties - As defined in Paragraph (1) of the definition of an “Interested
Party” in Section 1 of the Israeli Securities Law, 1968.
CPI - The Consumer Price Index in Israel as published by the Central
Bureau of Statistics.
Dollar - The United States dollar.
NIS - The New Israeli Shekel.

Adama Agricultural Solutions Ltd. Notes to the Financial Statements as of December 31, 2018
15
Note 2 - Basis for Financial Statement Preparation
A. Declaration of compliance with International Financial Reporting Standards:
The consolidated financial statements have been prepared in accordance with International
Financial Reporting Standards (hereinafter - “IFRS”) and in accordance with the Israeli Securities
Regulations (Annual Financial Statements), 2010.
The consolidated financial statements were authorized for issue by the Company’s Board of
Directors on March 19, 2019.
B. Basis of measurement:
The consolidated financial statements have been prepared on the historical cost basis except for
the following assets and liabilities:
- Financial instruments, derivative and other assets and liabilities measured at fair value
- Deferred tax assets and liabilities.
- Provisions.
- Assets and liabilities relating to employee benefits.
- Investments in associated companies and joint ventures.
For additional information regarding the measurement of these assets and liabilities see Note 3 -
Significant Accounting Policies.
C. Use of estimates and judgment:
The preparation of financial statements in accordance with IFRS requires management to use
judgments, estimates and assumptions that affect the implementation of the accounting policies
and the reported amounts of assets, liabilities, income and expenses. Actual results may differ
from these estimates.
The preparation of accounting estimates used in the preparation of the Group’s financial
statements requires the Company’s management to make assumptions regarding circumstances
and events that involve considerable uncertainty. Management of the Company prepares the
estimates on the basis of past experience, various facts, external circumstances, and reasonable
assumptions according to the pertinent circumstances to each estimate.
Estimates and underlying assumptions are reviewed on an ongoing basis. Revisions to
accounting estimates are recognized in the period in which the estimates are revised and in any
future periods affected.
Information regarding assumptions made by the Group with respect to the future and other
significant reasons for uncertainty with respect to the estimates, that have a significant risk that
they may result in a material adjustment to the carrying amounts of assets and liabilities in the
next financial year, is included in the following notes:

Adama Agricultural Solutions Ltd. Notes to the Financial Statements as of December 31, 2018
16
Note 2 - Basis for Financial Statement Preparation (cont’d)
C. Use of estimates and judgment: (cont’d)
• Contingent liabilities - when assessing the possible outcomes of legal claims filed against
the Company and its Investee companies, the companies relied on the opinions of their
legal advisors. These assessments by the legal advisors are based on their professional
judgment, considering the stage of the proceedings and the legal experience accumulated
regarding the various matters. Since the results of the claims will be determined by the
courts, the outcomes could be different from the assessments.
In addition to the said claims, the Group is exposed to unasserted claims, inter alia, where
there is doubt as to interpretation of the agreement and/or legal provision and/or the
manner of their implementation. This exposure is brought to the Company’s attention in
several ways, among others, by means of contacts made to Company personnel. In
assessing the risk deriving from the unasserted claims, the Company relies on internal
assessments by the parties dealing with these matters and by management, who weigh
assessment of the prospects of a claim being filed, and the chances of its success, if filed.
The assessment is based on experience gained with respect to the filing of claims and the
analysis of the allegations on their merits. Naturally, in view of the preliminary stage of the
clarification of the legal claim, the actual outcome could be different from the assessment
made before the claim was filed.
For further information regarding the Company’s exposure to claims - see Note 19
regarding contingent liabilities.
• Impairment of assets - the Company evaluates the need for recording a provision for
impairment of goodwill at least annually, on a fixed date. In addition, each reporting date,
the Company evaluates whether events have occurred or whether there have been
changes in circumstances that indicate that impairment has occurred in one or more of the
other non-monetary assets. If there are signs of impairment, an examination is made as to
whether the amount at which the investment in the asset is stated can be recovered from
the discounted cash flows expected from that asset and, if necessary, an impairment
provision is recorded up to the recoverable amount. The discounted cash flows are
calculated using a pre-tax discount rate that represents the market's assessment of the
time value of money and the specific risks attributed to the asset. Determination of the
estimated cash flows is based on past experience of this asset or similar assets, and the
Company’s best assessment of the economic conditions that will prevail during the
remaining estimated useful life of the asset. Changes in the Company’s assessments, as
noted, could lead to material changes in the book value of the assets and the operating
results.
• Estimated useful life of intangible assets - intangible assets that have a defined useful life
are amortized systematically over their estimated useful life. The amortization period
reflects the best estimate of the period in which future economic benefits are expected to
accrue to the Company. Use of other assumptions could lead to a different assessment of
the estimated period in which future economic benefits are expected to be received.
• Allowance for doubtful debts - the Company’s trade receivables are stated net of allowance
for doubtful debts. The allowance for doubtful debts is examined regularly by the
Company’s management and is determined mostly according to familiarity with the
customer, its quality and the collateral amount the customer provides. Changes in the
assumptions used to calculate the allowance could lead to material changes in the
allowance required.
Adama Agricultural Solutions Ltd. Notes to the Financial Statements as of December 31, 2018
17
Note 2 - Basis for Financial Statement Preparation (cont’d)
C. Use of estimates and judgment: (cont’d)
• Income taxes - the Company and Group companies are assessed for income tax purposes
in a large number of jurisdictions and, therefore, Company management is required to use
considerable judgment in determining the total provision for taxes and attribution of income,
calculated according to the best estimate of the amounts expected to be paid to the relevant
tax authorities in each jurisdictions. Deferred taxes are calculated at the tax rates expected
to be in effect when they are realized. Some of the Group companies create deferred tax
assets in respect of losses carried forward for tax purposes in cases where it is expected
to utilize these losses in the foreseeable future. Changes in these assumptions could lead
to material changes in the book values of the tax assets and tax liabilities and in the
operating results.
For additional information regarding deferred taxes and taxes on income - see Note 17.
• Employee benefits - the Group’s liabilities for long-term post-employment and other
benefits are calculated according to the estimated future amount of the benefit to which the
employee will be entitled in consideration for his services during the current period and
prior periods. The benefit is stated at present value net of the fair value of the plan’s assets,
based on actuarial assumptions. Changes in the actuarial assumptions could lead to
material changes in the book value of the liabilities and in the operating results.
For additional information regarding employee benefits - see Note 18.
• Derivative financial instruments - the Group enters into transactions in derivative financial
instruments for the purpose of hedging risks related to foreign currency and inflationary
risks. The derivatives are recorded at their fair value. The fair value of derivative financial
instruments is based on quotes from financial institutions. The reasonableness of the
quotes is examined by discounting the future cash flows, based on the terms and time to
maturity of each contract, while using market interest rates of a similar instrument as of the
measurement date. Changes in the assumptions and the calculation model could lead to
material changes in the fair value of the assets and liabilities and in the operating results.
• Inventories - inventories are measured in the financial statements at the lower of cost or
net realizable value. Net realizable value is an estimate of the selling price in the ordinary
course of business, net of the estimated cost to completion and the costs required for
executing the sale. The selling price is estimated on the basis of the expected selling price
at the time of realization of inventories. A reduction in the expected selling price could lead
to an impairment of the inventories and the operating results accordingly.

Adama Agricultural Solutions Ltd. Notes to the Financial Statements as of December 31, 2018
18
Note 3 - Significant Accounting Policies
The accounting policies set out below have been applied consistently for all periods presented in these
consolidated financial statements, and have been applied consistently by Group entities. In this Note,
matters have been marked in bold with respect to which the Group has chosen accounting alternatives
permitted in the accounting standards.
A. Basis for Consolidation:
(1) Business combinations:
The Group applies the acquisition method with respect to all business combinations. The
acquisition date is the date on which the acquirer obtains control over the acquiree. Control
exists where the Group is exposed or has rights to variable returns from its involvement
with the acquiree and it has the ability to affect those returns through its power over the
acquiree. Substantive rights held by the Group and others are taken into account when
assessing control.
The Group recognizes goodwill on acquisition according to the fair value of the
consideration transferred including any amounts recognized in respect of non-controlling
interests in the acquiree as well as the fair value on the acquisition date of any pre-existing
equity right of the Group in the acquiree, less the net amount attributed in the acquisition
to the identifiable assets acquired and the liabilities assumed.
On the acquisition date, the Group recognizes a contingent liability assumed in a business
combination if there is a present obligation resulting from past events and its fair value can
be reliably measured.
The consideration transferred includes the fair value of any contingent consideration. After
the acquisition date, the Group recognizes changes in the fair value of contingent
consideration classified as a financial liability in profit or loss.
Costs associated with the acquisition incurred by the acquirer in the business combination,
such as, legal, valuation and other professional or consulting fees, are recognized as an
expense in the period in which the services are received.
(2) Subsidiaries:
Subsidiaries are entities that are controlled by the Company. The financial statements of
the subsidiaries are included in the consolidated financial statements from the date control
was acquired and up to the date control ceases to exist. The accounting policies of the
subsidiaries are consistent with the accounting policies adopted by the Group.
(3) Transactions eliminated on consolidation:
Intercompany balances within the Group and unrealized income and expenses derived
from intercompany transactions are eliminated as part of the preparation of the
consolidated financial statements.
(4) Structured entities which are not consolidated:
The Group operates with structured entities for purposes of securitization trade receivables.
For details see note 4.

Adama Agricultural Solutions Ltd. Notes to the Financial Statements as of December 31, 2018
19
Note 3 - Significant Accounting Policies (cont’d)
A. Basis for Consolidation: (cont’d)
(5) Investment in affiliated companies and joint ventures:
Affiliated companies are those companies in which the Group has significant influence over
the financial and operating policies, but where control or joint control over them has not
been achieved. There is a rebuttable presumption whereby a holding at the rate of 20%
to 50% in the investee entity confers significant influence. When examining the existence
of significant influence, account is taken of potential voting rights that may be exercised or
converted immediately for shares of the investee company.
Joint ventures are joint arrangements wherein the Group has rights in the arrangement’s
net assets.
Investments in affiliated companies and joint arrangements are accounted for using the
equity method of accounting and are initially recognized at cost. The cost of the investment
includes transaction costs. The consolidated financial statements include the Group’s
share in the revenues and expenses in the income or loss and other comprehensive income
of investee companies accounted for using the equity method of accounting, from the date
on which the significant influence or joint control exists until the date that significant
influence or joint control ceases.
When the group's share in losses exceeds the group's value of rights in a Company
accounted at equity, the carrying value of such rights is reduced to zero. The group
recognizes additional losses when the group has another liability to support an investee.
(6) Non-controlling interests:
Non-controlling interests constitute the equity of a subsidiary that cannot be attributed,
directly or indirectly, to the parent company.
Measurement of non-controlling interests on the date of the business combination:
Non-controlling interests, which are instruments that confer a present ownership interest
and entitle their holders to a share of net assets in the event of liquidation (for example:
ordinary shares), are measured at the date of the business combination at their
proportionate interest in the identifiable assets and liabilities of the acquiree.
Allocation of profit or loss and other comprehensive income among the
shareholders:
Profit or loss and any component of other comprehensive income are allocated to the
owners of the Company and to the non-controlling interests. The total profit or loss and
other comprehensive income is allocated to the owners of the Company and to the non-
controlling interests even if as a result the balance of the non-controlling interests will be
negative.
Transactions with non-controlling interests, while retaining control:
Transactions with non-controlling interests while retaining control are accounted for as
equity transactions. Any difference between the consideration paid or received and
the change in the non-controlling interests is recognized in the owners’ share in the
equity of the Company directly in a capital reserve.

Adama Agricultural Solutions Ltd. Notes to the Financial Statements as of December 31, 2018
20
Note 3 - Significant Accounting Policies (cont’d)
A. Basis for Consolidation: (cont’d)
(6) Non-controlling interests: (cont’d)
For an increase in the holding rate, the amount of the adjustment to the non-
controlling interests is calculated according to the proportionate share acquired
from the balance of the non-controlling interests in the consolidated financial
statements prior to the transaction.
Furthermore, when the holding rate of the subsidiary changes, while retaining control, the
Group re-attributes the accumulated amounts that were recognized in other comprehensive
income to the owners of the Company and the non-controlling interests.
Issuance of a put option to non-controlling interests:
A put option issued by the Group to holders of non-controlling interests that is settled in
cash or another financial instrument is recognized as a liability at the present value of the
exercise price. In subsequent periods, changes in the value of the liability in respect of a
put option issued commencing from January 1, 2010 are recognized in profit or loss
according to the effective interest method. Changes in re-measurements of liabilities in
respect of a put option issued by the Group to non-controlling interests before January 1,
2010, continue to be recognized in goodwill and are not recognized in profit or loss. The
Group’s share of a subsidiary’s profits includes the share of non-controlling
interests to which the Group issued a put option, even where the non-controlling
interests have access to the returns arising from the interests in the investee.
Dividends distributed to non-controlling interests in a subsidiary that hold a put
option are recognized in equity.
(7) Loss of control:
Upon the loss of control, the group derecognizes the assets and liabilities of the subsidiary,
any non-controlling interests and other components of equity related to the subsidiary
B. Functional currency and presentation currency:
(1) General:
The Dollar is the currency that represents the principal economic environment in which the
Group operates. Accordingly, the dollar is the functional and presentation currency in these
financial statements.
(2) Foreign currency transactions:
Transactions in foreign currency are translated into the Group’s functional currency
according to the exchange rate in effect on the transaction dates. Monetary assets and
liabilities denominated in foreign currency on the reporting date are translated into the
functional currency according to the exchange rate prevailing on that date. Exchange rate
differences in respect of monetary items are the difference between the amortized cost in
the functional currency at the beginning of the year, adjusted for the effective interest and
for payments during the period, and the amortized cost in foreign currency translated
according to the exchange rate at the end of the period. Exchange rate differences are
recognized directly in “financing expenses” in the consolidated statement of income.

Adama Agricultural Solutions Ltd. Notes to the Financial Statements as of December 31, 2018
21
Note 3 - Significant Accounting Policies (cont’d)
B. Functional currency and presentation currency: (cont'd)
(2) Foreign currency transactions (cont'd)
Non-monetary items denominated in foreign currency and measured based on historical
cost are translated using the exchange rate in effect on the date of the transaction.
(3) Foreign Operations
The assets and liabilities of foreign operations, including goodwill and adjustments to fair
value recorded at acquisition, are translated into Dollars according to the exchange rates
prevailing on the date of the report. Income and expenses of foreign operations are
translated into Dollars according to the exchange rates that were in effect on the dates of
the transactions.
Foreign currency differences in respect of the translation are recognized in other
comprehensive income and are presented in equity as part of capital reserve.
When a foreign operation is a subsidiary that is not wholly owned by the Company, the
proportionate share of the foreign currency differences in respect of the foreign operations
is allocated to the non-controlling interests.
When a foreign operation is disposed of such that control, significant influence or joint
control is lost, the cumulative amount in the Translation Reserve related to that foreign
operation is reclassified to profit or loss as a part of the gain or loss on the disposal.
Generally, exchange rate differences in respect of loans received from or provided to
foreign operations, including foreign operations that are subsidiaries, are recognized in
profit and loss in the consolidated financial statements. Where settlement of loans received
from or provided to the foreign operations is not planned and is not expected in the
foreseeable future, these monetary items are included as part of a net investment in the
foreign operations, and gains and losses deriving from exchange rate differences are
recognized in other comprehensive income, and are presented within equity as part of the
Translation Reserve.
C. Financial Instruments:
(1) Non-derivative financial instruments:
(a) Initial recognition of financial assets:
The Group initially recognizes loans, trade receivables and deposits on the date that they
are created. All other financial assets acquired in a regular way purchase, including assets
designated at fair value through profit or loss, are recognized initially on the trade date on
which the Group becomes a party to the contractual terms of the instrument, meaning on
the date the Group undertook to purchase the asset. Non-derivative financial instruments
include mainly trade and other receivables and cash and cash equivalents.
All financial assets initially recognized at their fair value with transaction costs, except
financial instruments that are classified as fair value through profit or loss, which recognize
at their fair value. Transaction costs related to those financial instruments are recognize
directly as expense in the profit or loss.
Classification of financial assets into categories and the accounting treatment of
each category:
Debt instruments that meet the following conditions are measured subsequently at
amortized cost:

Adama Agricultural Solutions Ltd. Notes to the Financial Statements as of December 31, 2018
22
Note 3 - Significant Accounting Policies (cont’d)
C. Financial Instruments: (cont'd)
(1) Non-derivative financial instruments: (cont'd)
(a) Initial recognition of financial assets: (cont'd)
• The financial asset is held within a business model whose objective is to hold financial
assets in order to collect contractual cash flows; and
• The contractual terms of the financial asset give rise on specified dates to cash flows
that are solely payments of principal and interest on the principal amount outstanding.
Debt instruments that meet the following conditions are measured subsequently at fair
value through other comprehensive income (FVTOCI):
• The financial asset is held within a business model whose objective is achieved by both
collecting contractual cash flows and selling the financial assets; and
• The contractual terms of the financial asset give rise on specified dates to cash flows
that are solely payments of principal and interest on the principal amount outstanding
By default, all other financial assets are measured subsequently at fair value through profit
or loss (FVTPL). Despite the foregoing, the Group may make the following irrevocable
designation at initial recognition of investment in equity instrument, which are not held for
trading or part of contingent consideration, at fair value through other comprehensive
income. This designation could be made to each investment separately.
(b) Amortized cost and effective interest method
The amortized cost of a financial asset is the amount at which the financial asset is
measured at initial recognition minus the principal repayments, plus the cumulative
amortization using the effective interest method of any difference between that initial
amount and the maturity amount, adjusted for any loss allowance. The gross carrying
amount of a financial asset is the amortized cost of a financial asset before adjusting for
any loss allowance (see also note I(1)).
The effective interest method is a method of calculating the amortized cost of a debt
instrument and of allocating interest income over the relevant period.
(c) Financial assets at FVTPL
Financial assets at FVTPL are measured at fair value at the end of each reporting period,
with any fair value gains or losses recognized in profit or loss to the extent they are not part
of a designated hedging relationship (see hedge accounting policy). The net gain or loss
recognized in profit or loss includes any dividend or interest earned on the financial asset.
Fair value is determined in the manner described in note 29(e).
(d) Derecognition of financial assets
The Group derecognises a financial asset only when the contractual rights to the cash flows
from the asset expire, or when it transfers the financial asset and substantially all the risks
and rewards of ownership of the asset to another entity.
Regular way sale of financial assets recognize on the date when the company undertook
to sell the asset.

Adama Agricultural Solutions Ltd. Notes to the Financial Statements as of December 31, 2018
23
Note 3 - Significant Accounting Policies (cont’d)
C. Financial Instruments: (cont'd)
(2) Non-derivative financial liabilities:
Non-derivative financial liabilities include bank overdrafts, loans and borrowings from banks
and others, marketable debt instruments, finance lease liabilities and trade and other
payables.
Financial liabilities are presented and measured at amortized cost or at fair value through
profit or loss.
Financial liabilities at amortized cost
Those financial liabilities are recognized initially at fair value less transaction costs.
Subsequent to the initial recognition, financial liabilities are measured at amortized cost
using the effective interest method.
Derecognition of financial liabilities
Financial liabilities are derecognized when the obligation of the Group, as specified in the
agreement, expires or when it is settled or cancelled.
Offset of financial assets and liabilities
A financial asset and a financial liability are offset and the amounts are presented net in
the statement of financial position when the Group has a currently enforceable legal right
to offset the amounts and intends to settle the asset and the liability on a net basis or to
realize the asset and settle the liability concurrently.
The Group uses derivative financial instruments to hedge its risks related to foreign
currency and inflation risks and derivatives that are not used for hedging.
Hedge accounting:
On the commencement date of the accounting hedge, the Group formally documents the
relationship between the hedging instrument and hedged item, including the Group’s risk
management objectives and strategy in executing the hedge transaction, together with the
methods that will be used by the Group to assess the effectiveness of the hedging
relationship.
The Group makes an assessment, both at the inception of the hedge relationship as well
as on an ongoing basis, whether the hedge is expected to be effective in offsetting the
changes in the fair value of cash flows that can be attributed to the hedged risk during the
period for which the hedge is designated.
Hedging is effective when hedging relationships meet all of the following hedge
effectiveness requirements:
• There is an economic relationship between the hedged item and the hedging
instrument;
• The effect of credit risk does not dominate the value changes that result from that
economic relationship; and
• The hedge ratio of the hedging relationship is the same as that resulting from the
quantity of the hedged item that the Group actually hedges and the quantity of the
hedging instrument that the Group actually uses to hedge that quantity of hedged item.

Adama Agricultural Solutions Ltd. Notes to the Financial Statements as of December 31, 2018
24
Note 3 - Significant Accounting Policies (cont’d)
C. Financial Instruments: (cont’d)
(3) Derivative financial instruments, including hedge accounting:
Cash-flow Hedges:
With respect to a cash-flow hedge, a forecasted transaction that constitutes a hedged item
must be highly probable and must give rise to exposure to changes in cash flows that could
ultimately affect profit or loss.
Measurement:
Derivative financial instruments are recognized initially at fair value; attributable transaction
costs are recognized in profit or loss as incurred.
Subsequent to the initial recognition, changes in the fair value of derivatives used to hedge
cash flows are recognized through other comprehensive income directly in a hedging
reserve, with respect to the part of the hedge that is effective. Regarding the portion of the
hedge that is not effective, the changes in fair value are recognized in profit and loss. The
amount accumulated in the hedging reserve is reclassified to profit and loss in the period
in which the hedged cash flows impact profit or loss and is presented in the same line item
in the statement of income as the hedged item.
If the hedging instrument no longer meets the criteria for hedge accounting, expires or is
sold, terminated or exercised, the hedge accounting is discontinued. The cumulative gain
or loss previously recognized in a hedging reserve through other comprehensive income
remains in the reserve until the forecasted transaction occurs or is no longer expected to
occur. If the forecasted transaction is no longer expected to occur, the cumulative gain or
loss in respect of the hedging instrument in the hedging reserve is reclassified to profit or
loss.
Economic hedge
Hedge accounting is not applied with respect to derivative instruments used to
economically hedge financial assets and liabilities denominated in foreign currency or CPI
linked. Changes in the fair value of such derivatives are recognized in profit or loss as
financing income or expenses.
Derivatives that are not used for hedging:
Changes in the fair value of derivatives that are not used for hedging are recognized in
profit or loss as financing income or expenses.
(4) CPI-linked assets and liabilities measure at amortized cost:
The value of CPI-linked financial assets and liabilities that are measure at amortized cost
are revalued in every period, according to the actual rate of increase/decrease in the CPI.
For details regarding the effect of the initial implementation of IFRS 9 (2014), Financial
Instruments, see Note 3S(1).

Adama Agricultural Solutions Ltd. Notes to the Financial Statements as of December 31, 2018
25
Note 3 - Significant Accounting Policies (cont’d)
C. Financial Instruments: (cont’d)
(5) Share capital:
Ordinary shares
Ordinary shares are classified as equity. Incremental costs directly attributable to the
issuance of ordinary shares and options for shares are recognized as a deduction from
equity.
Incremental costs directly attributable to an expected issuance of an instrument that will be
classified as an equity instrument are recognized as an asset in deferred expenses in the
statement of financial position. The costs are deducted from the equity upon the initial
recognition of the equity instruments, or are deducted as financing expenses in the
statement of income when the issuance is no longer expected to take place.
Treasury shares
When share capital recognized in equity is repurchased by the Group, the amount of the
consideration paid, including direct costs, net of the tax effect, is deducted from equity and
classified as treasury shares.
Upon cancellation of the treasury shares, the amount of the consideration paid for
them is deducted from the capital reserves.
D. Fixed assets:
(1) Recognition and measurement:
Fixed-asset items are measured at cost less accumulated depreciation and accrued
impairment losses. Cost includes expenditures that can be directly attributed to purchase
of the asset. The cost of self-constructed assets includes the cost of the materials and
direct labor costs, as well as additional costs that are directly attributable to bringing the
asset to the position and condition necessary for it to function as management intended,
as well as an estimate of the costs to dismantle and remove the item, to restore its location
and capitalized borrowing costs. The cost of purchased software, which is an integral part
of operating the related equipment, is recognized as part of the cost of such equipment.
Spare parts, servicing equipment and stand-by equipment are classified as fixed assets
when they meet the definition of fixed assets in IAS 16; otherwise, they are classified as
inventory.
When major parts of a fixed asset item (including costs of major periodic inspections) have
different useful lives, they are accounted for as separate items (major components) of fixed
assets.
Changes in the obligation to dismantle and remove the items and to restore the site on
which they are located, other than changes deriving from the passing of time, are added to
or deducted from the cost of the asset in the period in which they occur. The amount
deducted from the cost of the asset shall not exceed the carrying amount, and the balance,
if any, is recognized immediately in profit or loss.
The gain or loss from disposal of a fixed-asset item is determined by comparing the
consideration from disposal of the asset to its book value, and is recognized net in the
“other income” or “other expenses” items, as applicable, in the statement of income.

Adama Agricultural Solutions Ltd. Notes to the Financial Statements as of December 31, 2018
26
Note 3 - Significant Accounting Policies (cont’d)
D. Fixed assets: (cont’d)
(2) Subsequent costs:
The cost of replacing part of a fixed-asset item and other subsequent expenses are
recognized if it is probable that the future economic benefits associated with them will flow
to the Group and if their cost can be measured reliably. The carrying amount of the replaced
part of a fixed asset item is derecognized. Current maintenance costs of fixed-asset items
are recognized in profit or loss as incurred.
(3) Depreciation:
Depreciation is a systematic allocation of the depreciable amount of an asset over its useful
life. The depreciable amount is the cost of the asset, or other amount substituted for cost,
less its residual value.
An asset is depreciated from the date it is ready for use, meaning the date it reaches the
location and condition required for it to operate in the manner intended by management.
Depreciation is recognized in profit or loss on a straight-line basis over the estimated useful
lives of each part of every fixed-asset item, since this most closely reflects the expected
pattern of consumption of the future economic benefits embodied in the asset. Freehold
lands are not depreciated.
The estimated useful life for the current period and comparative periods is as follows:
Buildings 25-50 years
Facilities and equipment 22 years
Furniture, equipment and accessories 7-17 years - mainly 14 years
Motor vehicles 5-7 years
Computers and auxiliary equipment 3-5 years
The estimates regarding the depreciation method, useful lives and residual values are
reviewed at least at the end of each reporting year and adjusted where necessary.
E. Intangible Assets:
(1) Goodwill:
Goodwill that arises upon the acquisition of subsidiaries is presented as part of intangible
assets. For information regarding measurement of goodwill upon initial recognition - see
Paragraph A(1) of this Note.
In subsequent periods, goodwill is measured at cost less accrued impairment losses.
(2) Research and development:
Expenditures related to research activities undertaken for the purpose of acquiring know-
how and new scientific or technical knowledge are recognized in profit and loss as incurred.

Adama Agricultural Solutions Ltd. Notes to the Financial Statements as of December 31, 2018
27
Note 3 - Significant Accounting Policies (cont’d)
E. Intangible Assets: (cont’d)
(2) Research and development: (cont’d)
Development activities relate to a plan for the production of new products or processes or
significant improvement of existing products or processes. Expenditures for development
activities are recognized as an intangible asset only if: it is possible to reliably measure the
development costs; it is technically and commercially possible to implement the product or
process; future economic benefit is expected from the product and the Group has intentions
and sufficient resources to complete development of the asset and then use or sell it. The
expenditures capitalized in respect of development activities include the cost of materials
and overhead expenses that can be directly attributed to preparing the asset for its intended
use. Other costs for development activities are recognized in profit and loss as incurred.
In subsequent periods, capitalized development costs are measured at cost less
accumulated amortization and accrued impairment losses.
(3) Other intangible assets:
Other intangible assets that are acquired by the Group, which have finite useful lives, are
measured at cost less accumulated amortization and accrued impairment losses.
(4) Subsequent costs:
Subsequent costs are recognized as an intangible asset only where they increase the
future economic benefit embodied in the asset in respect of which they were expended. All
other costs are recognized in profit or loss as incurred.
(5) Amortization:
Amortization is a systematic allocation of the amortizable amount of an intangible asset
over its useful life. The amortizable amount is the cost of the asset, less its residual value.
Amortization is recognized in profit or loss on a straight-line basis over the estimated useful
lives of the intangible assets from the date they are available for use, since this method
most closely reflects the expected pattern of consumption of the future economic benefits
embodied in the asset. Goodwill is not systematically amortized, but is tested at least
annually for impairment since it has an indefinite useful life.
Intangible assets generated within the Group are not systematically amortized as long as
they are not available for use, i.e. they are not yet in the condition required in order that
they will be able to be used as intended by Management.
The estimated useful life for the current period and comparative periods is as follows:
• Product registration - mainly 8 years.
• Intangible assets on purchase of products - mainly 7-11, 20 years.
• Marketing rights - 5 to 10 years.
• Rights to use trademarks - mainly 4 years.
• Non-compete - up to 5 years.
Registration costs incurred for products that can be identified and separated, and which in
the Company’s estimation will produce future economic benefit, are recognized as an asset
in the “intangible assets” category and are amortized over the period of economic benefit
they are expected to provide.

Adama Agricultural Solutions Ltd. Notes to the Financial Statements as of December 31, 2018
28
Note 3 - Significant Accounting Policies (cont’d)
E. Intangible Assets: (cont’d)
(5) Amortization (cont’d)
The amortization methods, useful lives and residual values are reviewed at least at the end
of each reporting year and are adjusted where necessary.
F. Leased Assets:
Leases, including leases of lands from Israel Lands Authority or from other third parties, wherein
the Group assumes substantially all the risks and rewards of ownership of the asset are classified
as financing leases. Upon initial recognition, the leased asset is measured at an amount equal to
the lower of its fair value and the present value of the future minimum lease payments. Future
payments for exercising an option to extend the lease from Israel Lands Administration are not
recognized as part of the asset and the corresponding liability since they constitute contingent
lease payments that are derived from the fair value of the land on the future renewal dates of the
lease agreement. Subsequent to the initial recognition, the asset is accounted for in accordance
with the accounting policy applicable to that asset.
Other leases are classified as operating leases when the leased assets are not recognized in the
financial report of the group. Operating lease payments are recorded in profit or loss on a straight-
line basis over the lease term.
In a lease of land and buildings, the land and buildings components are examined separately for
purposes of classifying the lease, where a significant consideration in classification of the land
component is the fact that land normally has an indefinite useful life.
For details regarding IFRS 16, Leases, which is to be applied for annual periods beginning on
January 1, 2019, see Note 3T.
G. Inventory:
Inventory is measured at the lower of cost or net realizable value. The cost of the inventories
of raw materials, packaging materials, spare parts, maintenance materials and purchased
materials is determined according to a weighted-average formula, which includes the costs
of acquiring the inventory and bringing it to its current location and condition. The cost of finished
products and of products in process is determined on the basis of average production costs,
including materials, labor and factory expenses. The cost includes the allocable part of the
production overhead, based on normal capacity. Net realizable value is the estimated selling price
during the ordinary course of business, after deduction of the estimated completion costs and the
estimated costs required to execute the sale.
Long-term inventory is inventory the Company expects to realize in a period of more than the
upcoming 12 months.
H. Capitalization of Borrowing Costs:
The costs of specific and non-specific borrowing are capitalized to qualified assets during the
period required for completion and construction until they are ready for their intended use. Non-
specific borrowing costs were capitalized in the same manner to the investment in qualified assets
or to the part thereof that was not financed by specific borrowing, using an interest rate that is the
weighted-average of the cost rates for those borrowing sources, the cost of which was not
capitalized specifically. Other borrowing costs are recorded in profit and loss as incurred.

Adama Agricultural Solutions Ltd. Notes to the Financial Statements as of December 31, 2018
29
Note 3 - Significant Accounting Policies (cont’d)
I. Impairment:
(1) Non-derivative financial assets:
As for trade receivables which are not measured in FVTPL according to IFRS 9, The Group
chose to estimate the Expected Credit Losses (ECL) on these financial assets using a
provision matrix based on the Group’s historical credit loss experience throughout the
instrument lifetime adjusted for factors that are specific to the debtors, general economic
conditions and an assessment of both the current as well as the forecast direction of
conditions at the reporting date, including time value of money where appropriate.
For all other financial instruments, the Group recognizes lifetime ECL when there has been
a significant increase in credit risk since initial recognition. However, if the credit risk on the
financial instrument has not increased significantly since initial recognition, the Group
measures the loss allowance for that financial instrument at an amount equal to 12‑month
ECL.
The examination whether to recognize ECL bases on the risk (probability) for default from
the initial recognition in the financial instrument and not only when there is objective
evidence for impairment in the reporting date or when the default occurs.
Significant increase in credit risk
In assessing whether the credit risk on a financial instrument has increased significantly
since initial recognition, the Group compares the risk of a default occurring on the financial
instrument at the reporting date with the risk of a default occurring on the financial
instrument at the date of initial recognition and considers both quantitative and qualitative
information that is reasonable and supportable, including historical experience and
forward‑looking information. See also Note 29(b).
Measurement and recognition of expected credit losses
The measurement of expected credit losses is a function of the probability of default, loss
given default (i.e. the magnitude of the loss if there is a default) and the exposure at default.
The assessment of the probability of default and loss given default is based on historical
data adjusted by forward‑looking information as described above.
As for the exposure at default, for financial assets, this is represented by the assets’ gross
carrying amount at the reporting date; for financial guarantee contracts, the exposure
includes the amount drawn down as at the reporting date, together with any additional
amounts expected to be drawn down in the future by default discounted at the original
effective interest rate.
When the group measured provision for loss related to financial instrument which is not
trade receivable in previous periods, in the amount equal to the lifetime ECL, but
determined that the conditions for measurement of lifetime ECL does not apply in current
period, the ECL is measure according to the expected ECL in the upcoming 12 months.
The group recognize impairment losses (gain from reversal of impairment) in profit or loss
to all financial instruments, while adjusted book value through impairment account.
(2) Non-financial assets:
Timing of impairment testing
The carrying amounts of the Group’s non-financial assets, other than inventories and deferred tax
assets are reviewed at each reporting date to determine whether there are indications of
impairment.

Adama Agricultural Solutions Ltd. Notes to the Financial Statements as of December 31, 2018
30
Note 3 - Significant Accounting Policies (cont’d)
I. Impairment: (cont’d)
(2) Non-financial assets: (cont’d)
Timing of impairment testing (cont’d)
If such indications exist, the asset’s recoverable amount is calculated. Once a year and on
the same date, or more frequently if there are indications of impairment, the Group estimates
the recoverable amount of each cash generating unit that contains goodwill, or intangible
assets that have indefinite useful lives or are unavailable for use.
Determining cash-generating units
For purposes of impairment testing, assets that cannot be tested individually are grouped
together into the smallest group of assets that generates cash inflows from continuing use
that are largely independent of the cash inflows of other assets or groups of assets
(“cash-generating unit”).
Measurement of recoverable amount
The recoverable amount of an asset or cash-generating unit is the greater of its value in
use and its fair value less costs to sell. In assessing value in use, the estimated future cash
flows are discounted to their present value using a pre-tax discount rate that reflects current
market participant assessments of the time value of money and the specific risks attributed
to the asset or cash generating unit, for which the estimated future cash flows expected to
derive from the asset or cash generating unit were not adjusted.
Allocation of goodwill to cash-generating units
Cash generating units to which goodwill has been allocated are aggregated so that the level
at which the goodwill impairment testing is performed reflects the lowest level at which
goodwill is monitored for internal reporting purposes. In cases where goodwill is not
monitored for internal reporting purposes, it is allocated to operating segments (before the
aggregation of similar segments) and not to a cash generating unit (or group of cash
generating units) lower in level than an operating segment.
Goodwill acquired in a business combination is allocated to cash generating units, including
those existing in the Group before the business combination, that are expected to benefit
from synergies of the combination.
Recognition of impairment loss
Impairment losses are recognized if the carrying amount of an asset or the cash generating
unit exceeds its estimated recoverable amount and such losses are recognized in profit
and loss. Regarding cash generating units that include goodwill, an impairment loss is
recognized when the carrying amount of the cash generating unit, after that the gross-up
of the goodwill, exceeds its recoverable amount. Impairment losses recognized in respect
of cash-generating units are allocated first to reduce the carrying amount of any goodwill
allocated to these units and then to reduce the carrying amounts of the other assets in the
cash generating unit, on a pro rata basis.
Reversal of impairment loss
An impairment loss in respect of goodwill is not reversed. In respect of other assets, for
which impairment losses were recognized in prior periods, at every reporting date an
examination is made as to whether there are indications that the losses have decreased or
no longer exist. An impairment loss is reversed if there has been a change in the estimates
used to determine the recoverable amount, but only to the extent that the asset’s carrying
amount does not exceed the carrying amount that would have been determined, net of
depreciation or amortization, if no impairment loss had been recognized.

Adama Agricultural Solutions Ltd. Notes to the Financial Statements as of December 31, 2018
31
Note 3 - Significant Accounting Policies (cont’d)
I. Impairment: (cont’d)
(3) Investments in affiliated companies and joint ventures:
An investment in an affiliated companies and a joint venture is tested for impairment when
objective evidence indicates there has been an impairment.
Goodwill that constitutes part of the carrying amount of an investment in an associated
company or joint venture is not recognized as a separate asset and, therefore, is not tested
for impairment separately.
If objective evidence indicates that the value of the investment may have been impaired,
the Group estimates the recoverable amount of the investment, which is the greater of its
value in use and its net selling price. In assessing value in use of an investment in an
affiliated company or joint venture, the Group either estimates its share of the present value
of the estimated future cash flows that are expected to be generated by the affiliate or joint
venture, including cash flows from operations of the associate or joint venture and the
consideration from the final realization of the investment, or estimates the present value of
the estimated future cash flows that are expected to be derived from dividends that will be
received and from the final disposal.
J. Employee Benefits:
(1) Post-employment benefits:
The Group has a number of post-employment benefit plans. The plans are generally funded
by deposits with insurance companies or in funds managed by a trustee, and they are
classified either as defined contribution plans or as defined benefit plans.
a. Defined contribution plans:
A defined contribution plan is a post-employment benefit plan under which the Group
pays fixed contributions to a separate entity and has no legal or constructive
obligation to pay further amounts. Obligations for contributions to defined
contribution plans are recognized as an expense in profit or loss in the periods during
which related services are rendered by employees.
b. Defined benefit plans:
A defined benefit plan is a post-employment benefit plan other than a defined
contribution plan. The Group’s net obligation, in respect of defined benefit plans for
post-employment benefits, is calculated separately for each plan by estimating the
future amount of the benefit to which an employee will be entitled as compensation
for his services during the current and past periods. This benefit is presented
according to present value after deducting the fair value of the plan assets. The
Group determines the net interest on the net defined benefit liability (asset) in respect
of a defined benefit by multiplying the net liability (asset) in respect of a defined
benefit by the discount rate used to measure the defined benefit obligation as they
were determined at the beginning of the annual reporting period.

Adama Agricultural Solutions Ltd. Notes to the Financial Statements as of December 31, 2018
32
Note 3 - Significant Accounting Policies (cont’d)
J. Employee Benefits: (cont'd)
(1) Post-employment benefits: (cont'd)
b. Defined benefit plans:" (cont'd)
The discount rate is determined according to the yield as of the date of the report on
high quality, CPI-linked corporate debentures, which are denominated in NIS and
the maturity dates of which approximate the terms of the Group’s obligation. The
calculations are performed by a licensed actuary using the “projected unit credit
method”.
When on the basis of the calculations a net asset is created for the Group, the asset
is not recognized as an asset of the Group, since the Group is not entitled to refunds
or a reduction in future deposits.
Remeasurement of the net defined benefit liability (assets) includes actuarial gains
and losses and the return on plan assets (excluding interest). Remeasurements are
recognized immediately, directly in retained earnings through other comprehensive
income and are not remeasured in the following periods through profit or loss.
Interest costs on a defined benefit obligation and interest income on plan assets that
were recognized in profit or loss are presented under financing income and
expenses, respectively.
(2) Other long-term employee benefits:
The Group’s net obligation for long-term employee benefits, which are not attributable to
post-employment benefit plans, is for the amount of the future benefit to which employees
are entitled for services that were provided during the current and prior periods. The amount
of these benefits is discounted to its present value and the fair value of the assets related
to these obligations is deducted therefrom. The discount rate is determined according to
the yield as of the date of the report on high quality, CPI-linked corporate debentures, which
are denominated in NIS and the maturity dates of which approximate the terms of the
Group’s obligation. The calculations use the “projected unit credit” method. Actuarial gains
and losses are recorded in income and loss in the period in which they arise.
(3) Termination benefits:
Termination benefits to employees are recognized as an expense when the Group has
clearly undertaken, with no real chance of cancellation, to terminate employees before they
reach the customary retirement age according to a formal, detailed plan. The benefits given
to employees upon voluntary retirement are charged when the Group proposes a plan to
the employees encouraging voluntary retirement, it is expected that the proposal will be
accepted and the number of employees that will accept the proposal can be reliably
estimated. If the benefits are payable more than 12 months after the end of the reporting
period, they are discounted to their present value. The discount rate used is the yield on
the reporting date on highly rated corporate debentures denominated in the same currency,
that have maturity dates approximating the terms of the Group’s obligation.

Adama Agricultural Solutions Ltd. Notes to the Financial Statements as of December 31, 2018
33
Note 3 - Significant Accounting Policies (cont’d)
J. Employee Benefits: (cont'd)
(4) Short-term benefits:
Obligations for short-term employee benefits are measured on a non-discounted basis, and
the expense is recorded when the related service is provided. A provision for short-term
employee benefits in respect of cash bonuses is recognized in the amount expected to be
paid where the Group has a current legal or constructive obligation to pay the said amount
for services provided by the employee in the past and the amount can be estimated reliably.
Classification of employee benefits for measurement purposes as short-term benefits or as
other long-term benefits is determined based on the Company’s forecast with respect to
full settlement of the benefits.
(5) Share-based payment:
The fair value of share-based payment awards granted to employees is recognized as a
salary expense, with a corresponding increase in liability, settled with cash over the period
wherein unconditional entitlement to the awards is obtained. The liability is remeasured
according to fair value at each reporting date, until the date of settlement and the change
is recorded as a salary expense in profit or loss. The fair value of the liability is measured
using the binomial model.
K. Provisions:
A provision is recognized if, as a result of a past event, the Group has a present legal or
constructive obligation that can be estimated reliably and it is probable that an outflow of economic
benefits will be required to settle the obligation.
The Group recognizes an indemnification asset if, and only if, it is virtually certain that the
indemnification will be received if the Group settles the obligation. The amount recognized in
respect of the indemnification does not exceed the amount of the provision.
Legal claims:
A provision for claims is recognized if, as a result of a past event, the Group has a present legal
or constructive obligation and it is more likely than not that the Group will be required to use its
economic resources to settle the obligation and the amount of obligation can be reliably estimated.
Where the impact of the time value is material, the provision is measured at its present value.
L. Assets held for sale:
Non-current assets are classified as held for sale if their book value is mainly settled through their
sale and not through their continued use. This condition exists only when the asset is available
for immediate sale in the current state and its sale is highly probable. The Group classifies non-
current assets as held for sale when management is required to make the sale and the sale is
expected to qualify for recognition as a sale completed within one year from the date of
classification of the non-current asset.
From the period in which a non-current asset is designated for sale, it is presented in the financial
statements under "asset held for sale". The depreciation in respect of a non-current asset held
for sale is discontinued on the classification date as held for sale. The recognition of a portion of
the profits (losses) of associated companies or joint ventures in the statement of profit or loss is
discontinued as of the date of classifying the investment in an associate or a joint venture as held
for sale.

Adama Agricultural Solutions Ltd. Notes to the Financial Statements as of December 31, 2018
34
Note 3 - Significant Accounting Policies (cont’d)
M. Revenues:
(1) Sale of goods:
Revenue of the Group is mainly from sale of goods.
The Group recognises revenue when transferring goods to a customer (transfer risks and
rewards), at the amount of the transaction price. Transaction price is the amount of
consideration to which an entity expects to be entitled in exchange for transferring goods
to a customer, excluding amounts collected on behalf of third parties.
The timing of transferring the risks and rewards changes according to the specific terms of
the sale contract. Regarding sales of products in Israel, transfer of the risks and rewards
generally exists when the products arrive at the customer’s warehouse, although regarding
certain international shipments the transfer occurs when the products are loaded on the
shipper’s transport vehicles.
Significant financing component
For a contract with a significant financing component, the Group recognize revenue at an
amount that reflects the price that a customer would have paid for the goods if the customer
had paid cash for those goods when they transfer to the customer. The difference between
the amount of consideration and the cash selling price of the goods, is amortized in the
contract period with the effective interest rate. The Group does not adjust the amount of
consideration for the effects of a significant financing component if the Group expects, at
contract inception, that the period between when the entity transfers a good to a customer
and when the customer pays for that good will be one year or less.
Sale with a right of return
For sale with a right if return, the Group recognize revenue at the amount of consideration
to which the Group expects to be entitled (ie excluding the products expected to be
returned). For any amounts received (or receivable) for which an entity does not expect to
be entitled, the entity shall not recognize revenue when it transfers products to customers
but shall recognize those amounts received (or receivable) as a refund liability. An asset
recognized for the Group’s right to recover products from a customer on settling a refund
liability shall initially be measured by reference to the former carrying amount of the product
less any expected costs to recover those products.
(2) Commissions:
When the Group acts as an agent and not as a primary supplier, the revenue is recognized
in the amount of the net commission.
For details regarding the effect of the initial implementation of IFRS 15, Revenue from
Contracts with Customers, see Note 3S(2).
N. Financing Income and Expenses:
Financing income includes interest income on funds invested, interest income from defined
benefit plan assets, changes in the fair value of financial assets presented at fair value through
profit or loss and gains on hedging instruments recognized in profit or loss. Interest income is
recognized as it is accrued, using the effective interest method.

Adama Agricultural Solutions Ltd. Notes to the Financial Statements as of December 31, 2018
35
Note 3 - Significant Accounting Policies (cont’d)
N. Financing Income and Expenses: (cont’d)
Financing expenses include interest expenses, linkage differences and exchange rate differences
on loans received and debentures issued, changes in the time value of provisions, interest cost
for defined benefit plan liability, changes in the fair value of contingent considerations from a
business combination, changes in the fair value of financial assets presented at fair value through
profit or loss, impairment losses on financial assets (other than losses on trade receivables that
are presented as part of general and administrative expenses) and losses from hedging
instruments recognized in profit or loss. Credit costs, which are not capitalized to qualifying
assets, are recognized in profit or loss using the effective interest method.
Exchange rate gains and losses in respect of financial assets and liabilities are reported
on a net basis.
Results of derivatives transactions which are not used for hedging are reported in net
amounts.
O. Income Taxes Expense:
Taxes on income include current and deferred taxes. Current tax and deferred taxes are
recognized in profit or loss except to the extent that they relate to a business combination, or are
recognized directly in equity or in other comprehensive income to the extent they relate to items
recognized directly in equity or in other comprehensive income.
Current taxes
Current tax is the amount of tax expected to be paid (or received) on the taxable income for the
year, calculated using the applicable tax rates based on the laws enacted or substantively enacted
as of the date of the report. Current taxes also include taxes in respect of prior years.
Offset of current tax assets and liabilities
The Group offsets current tax assets and liabilities if there is a legally enforceable right to offset
current tax liabilities and assets, and intends either to settle the current tax liabilities and assets
on a net basis or to realize the asset and settle the liability simultaneously.
Uncertain tax positions
A provision for uncertain tax positions, including additional tax and interest expenses, is
recognized when it is more probable than not that the Group will have to use its economic
resources to settle the obligation.
Deferred taxes
Deferred taxes are recognized in respect of temporary differences between the carrying amounts
of assets and liabilities for financial reporting purposes and the amounts used for tax purposes.
The Group does not recognize deferred taxes for the following temporary differences:
• The initial recognition of goodwill;
• The initial recognition of assets and liabilities in a transaction that is not a business
combination and that affects neither accounting nor taxable income; and
• Differences deriving from investments in subsidiaries, joint arrangements and associates, to
the extent that the Group is able to control the timing of the reversal of the temporary
differences and it is probable that they will not reverse in the foreseeable future, either by
way of selling the investment or by way of distributing dividends in respect of the investment.
The measurement of deferred taxes reflects the tax implications deriving from the way the group
expects, at the end of the reporting period, to recover or settle the carrying value of assets and
liabilities.

Adama Agricultural Solutions Ltd. Notes to the Financial Statements as of December 31, 2018
36
Note 3 - Significant Accounting Policies (cont’d)
O. Income Taxes Expense: (cont’d)
Deferred taxes (cont’d)
Deferred taxes are measured at the tax rates expected to apply to the temporary differences when
they are utilized, based on the laws that have been enacted or substantively enacted as of the
reporting date.
A deferred tax asset is recognized in respect of tax loss carryforwards, tax benefits and deductible
temporary differences, where it is expected that in the future there will be taxable income against
which they can be utilized. Deferred tax assets are reviewed at every reporting date and to the
extent it is not expected that the related tax benefits will be realized, they are reduced.
Deferred tax assets that were not recognized are reevaluated at each reporting date and
recognized if it has become probable that future taxable profits will be available against which
they can be utilized.
When calculating the deferred taxes, taxes that would have applied in the event of realizing
investments in Subsidiaries were not taken into account since it is the Company’s intention to
hold these investments and not realize them.
Offset of deferred tax assets and liabilities
The Group offsets deferred tax assets and liabilities if there is a legally enforceable right to offset
current tax liabilities and assets, and they relate to the same taxable income taxed by the same
tax authority for the same taxable entity, or on different taxable entities, where they intend to settle
current tax assets and liabilities on a net basis or their tax assets and liabilities will be settled
concurrently.
Additional tax on dividend distribution
The Group may be required to pay additional tax in case of distribution of dividends by the Group
companies. This additional tax was not included in the financial statements, since the policy of
the Group is not to distribute in the foreseeable future a dividend which creates an additional tax
liability.
Inter-company transactions
Deferred tax in respect of inter-company transactions in the consolidated financial statements is
recorded according to the tax rate applicable to the procuring company.
P. Government Grants:
Grants received from the Chief Scientist in respect of research and development projects are
treated as forgivable loans, according to IAS 20. Grants received from the Chief Scientist are
recognized as liabilities according to their fair value on the date the grants were received unless
it was reasonably certain on that date that the amount received will not be repaid. The difference
between the amount received and the fair value on the date the grant is received, is recognized
as a reduction of research and development expenses. The amount of the liability is reexamined
in each period and any changes in the present value of the cash flows, discounted at the original
interest rate of the grant, are recognized in the profit or loss.
Government grants received for the purchase of the asset are presented as a deduction from
the related assets and are recognized in profit or loss on a systematic basis over the useful life
of the asset.

Adama Agricultural Solutions Ltd. Notes to the Financial Statements as of December 31, 2018
37
Note 3 - Significant Accounting Policies (cont’d)
Q. Segment Reporting:
An operating segment is a component of the Group that meets the following three conditions:
(1) It engages in business activities from which it may earn revenues and incur expenses,
including revenues and expenses that relate to transactions between the Group
companies;
(2) Its operating results are reviewed regularly by the Group’s chief operating decision maker
in order to make decisions regarding resources to be allocated to the segment and to
assess its performance; and
(3) Separate financial information is available in respect thereof.
R. Environmental Costs:
The current costs for operation and maintenance of facilities for the prevention of environmental
pollution and projected provisions, for environmental rehabilitation costs stemming from current
or past activities, are recorded in the statement of income. The costs of constructing facilities to
prevent environmental pollution, which increase the life expectancy of a facility or its efficiency,
or decrease or prevent the environmental pollution, are added to the cost of the fixed assets and
are depreciated according to the Group’s regular depreciation policies.
S. Initial implementation of new standards, amendments to standards and interpretations:
Commencing from January 1, 2018, the Group applies the new standards and the amendments
to the standards as follows:
(1) IFRS 9, Financial Instruments
The Group has initially adopted IFRS 9 Financial Instruments, which replaced IAS 39
Financial Instruments: Recognition and Measurement. The Group has adopted the
standard, with the effect of initially applying this standard recognized at the date of initial
application (i.e. January 1, 2018), without adjusting the comparative figures, while adjusting
the retained earnings balance as of the initial application date.
The effects and changes of the initial implementation on the Company's financial
statements are as follows:
(a) According to the Standard, the classification of financial assets that constitute debt
instruments is generally based on the business model in which a financial asset is
managed and its contractual cash flow characteristics. As a result, trade receivables
that are included in the securitization transaction for which consideration has not yet
been received, are measured at fair value through profit or loss.
As a result of the implementation of the Standard, as at January 1, 2018, the balance
of Subordinated note decreased by $1,267 thousand against a corresponding
decrease in retained earnings.
(b) The Standard includes a new model for the recognition of expected credit loss
('expected credit loss’ model) for financial debt assets that are not measured at fair
value through profit or loss. As a result of the implementation of the Standard, as of
January 1, 2018, the provision for impairment of trade receivables increased by
$5,447 thousand, the deferred tax assets increased by $1,700 thousand against a
decrease of $3,747 thousand in retained earnings.

Adama Agricultural Solutions Ltd. Notes to the Financial Statements as of December 31, 2018
38
Note 3 - Significant Accounting Policies (cont’d)
S. Initial implementation of new standards, amendments to standards and interpretations
(cont’d):
(2) IFRS 15, Revenue from Contracts with Customers:
The Group has initially adopted IFRS 15, which prescribes guidelines regarding revenue
recognition.
The Group has adopted IFRS 15 using the cumulative effect method, with the effect of
initially applying this standard recognized at the date of initial application (i.e. 1 January
2018), while adjusting the retained earnings as of January 1, 2018 and without restating
comparative figures. The effects and changes of the initial implementation on the
Company's financial statements are as follows:
In order to measure a transaction price, the Group adjusts the amount of the consideration
guaranteed against the effects of the time value of the money if the timing of the payments
agreed between the parties provides the customer or the group with a significant financing
benefit. In these cases the contract contains a significant financing component. In
assessing whether a contract contains a significant financing component, the Group
examines, among other things, the expected length of time between the date on which the
Group transfers the goods guaranteed to the customer and the date on which the customer
pays for the goods and the difference, if any, between the amount of the guaranteed
consideration and the sale price in cash of the guaranteed goods.
In cases where the difference between the date of receipt of the payment and the date of
transfer of the goods or service to the customer is one year or less, the Group applies the
practical relief prescribed in the Standard and does not separate the significant financing
component.
As a result of the implementation of the Standard, as of January 1, 2018, the balance of
trade receivables increased by $10,928 thousand and deferred tax assets decreased by
$3,648 thousand, against an increase of $7,280 thousand in retained earnings.
T. New and revised IFRS Standards in issue but not yet effective:
IFRS 16 – Leases:
The new Standard, which was published in January 2016, will cancel IAS 17 "Leases" and the
related interpretations, and establishes the rules for the recognition, measurement, presentation
and disclosure of leases with respect to both parties to the transaction, i.e. the customer (lessee)
and the supplier (lessor).
The new standard will eliminate the current distinction between lessee, between financing leases
and operating leases and establishes a uniform accounting model for all types of leases.
According to the new model, for each leased asset, the lessee is required on the one hand to
recognize an asset in respect of the usage right and on the other hand a financial liability in
respect of the lease fees.
The Group elected to apply the transitional provision of recognizing a lease liability at the date of
initial application, for all the leases that award it control over the use of identified assets for a
specified period of time, according to the present value of the future lease payments discounted
at the incremental borrowing rate of the lessee at that date, and concurrently recognizing a right-
of-use asset at the same amount of the liability, adjusted for any prepaid or accrued lease
payments that were recognized as an asset or liability before the date of initial application.
Therefore, application of the standard is not expected to have an effect on the balance of retained
earnings at the date of initial application.

Adama Agricultural Solutions Ltd. Notes to the Financial Statements as of December 31, 2018
39
Note 3 - Significant Accounting Policies (cont’d)
T. New and revised IFRS Standards in issue but not yet effective: (cont’d)
IFRS 16 – Leases: (cont’d)
Following are details of the main expected effects, as estimated for the time being:
• An increase in the volume of assets and liabilities of the Company, due to the recording of
all of the Company's lease transactions as acquisition of usage rights as assets against a
commitment to pay the leasing fees, as liabilities.
• The new standard is also expected to have an effect on the statement of profit or loss of the
Company at the time of recognizing expenses since the use of effective interest leads to
recognizing a higher expense at the beginning of the lease period.
A decrease in the lease expenses currently included in the statement of profit or loss against
an increase in depreciation and amortization expenses (amortization of the usage right) and
an increase in financing expenses due to the embedded interest in the lease payments will
result in an increase in the Company's gross profit, operating profit and EBITDA.
• An increase in cash flows from operating activities of the Company, due to the classification
of the principal and interest component of lease payments as cash flows to financing
activities.
The Company will adopt the provisions of the standard on its binding implementation date, i.e. in
the financial statements for the first quarter of 2019.
The Group examined the implications of implementing the standard and its application has no
material effect on the financial statements.
As a result of implementing the standard and based on the leases in force as of 1.1.2019, the
balances of assets and liabilities will increase in approximately 70 USD million. The main effects
on profit and loss report are decrease in lease expenses of approximately 22 USD million and
increase in depreciation expenses and finance expenses of approximately 20 USD millions and
3 USD million, respectively. Cash flow from operating activity expect to increase in 22 USD
million and cash flow from financing activity expect to decrease in the same amount.
The nominal discount rates used for measuring the lease liability are in the range of 1.8% to
6.9%. This range is affected by differences in the length of the lease term, and the currency in
which the leases are denominated.

Adama Agricultural Solutions Ltd. Notes to the Financial Statements as of December 31, 2018
40
Note 4 - Trade Receivables
Composition:
December 31
2 0 1 8 2 0 1 7
$ thousands
Foreign 944,352 761,863
Domestic (Israel) 14,099 15,203
958,451 777,066
Less - provision for doubtful accounts (58,886) (54,139)
899,565 722,927
Current trade receivables 958,451 777,066
Non-current trade receivables 22,963 29,532
Trade receivable as part of securitization transaction not yet
eliminated 18,926 34,876
Less - provision for doubtful accounts (58,886) (54,139)
941,454 787,335
For details regarding credit risk in respect of the customers, see Note 29B.
A. The Company and certain of its subsidiaries entered into a securitization transaction with
Rabobank International for sale of trade receivables (hereinafter - “the Securitization Program”
and/or “the Securitization Transaction”).
Pursuant to the Securitization Program, the companies will sell their customer receivables, in
various different currencies, to a foreign company that was set up for this purpose and that is not
owned by the Adama Agricultural Solutions Group (hereinafter - “the Acquiring Company”).
Acquisition of the trade receivables by the Acquiring Company is financed by a U.S. company,
Nieuw Amsterdam Receivables Corporation for the Rabobank International Group.
The trade receivables included as part of the Securitization Transaction are trade receivables that
meet the criteria provided in the agreement.
Every year the credit facility is re-approved in accordance with the Securitization Program. As at
the date of the report, the Securitization Agreement was approved up to July 16, 2019.
The maximum scope of the securitization is adjusted for the seasonal changes in the scope of
the Company’s activities, as follows: during the months March through June the maximum scope
of the securitization is $350 million, during the months July through September the maximum
scope of the securitization is $300 million and during the months October through February the
maximum scope of the securitization is $250 million. The proceeds received from those customers
whose debts were sold are used for acquisition of new customer receivables.

Adama Agricultural Solutions Ltd. Notes to the Financial Statements as of December 31, 2018
41
Note 4 - Trade Receivables (cont'd)
A. (cont'd)
The price at which the trade receivables are sold is the amount of the debt sold less a discount
calculated based on, among other things, the expected length of the period between the date of
sale of the customer receivable and its anticipated repayment date.
In the month following acquisition of the debt, the Acquiring Company pays in cash most of the
debt while the remainder is recorded as a subordinated liability that is paid after collection of the
debt sold. If the customer does not pay its debt on the anticipated repayment date, the Company
bears interest up to the earlier of the date on which the debt is actually repaid or the date on which
the treatment is transferred to the insurance company (the actual costs are not significant and are
not expected to be significant).
The Acquiring Company bears 95% of the credit risk in respect of the customers whose debts
were sold and will not have a right of recourse to the Companies in respect of the amounts paid
in cash, except regarding debts with respect to which a commercial dispute arises between the
companies and their customers, that is, a dispute the source of which is a claim of non-fulfillment
of an obligation of the seller in the supply agreement covering the product, such as: a failure to
supply the correct product, a defect in the product, delinquency in the supply date, and the like.
The Acquiring Company appointed a policy manager who will manage for it the credit risks
involved with the trade receivables sold, including an undertaking with an insurance company.
Pursuant to the Receivables Servicing Agreement, the Group companies handle collection of the
trade receivables as part of the Securitization Transaction for the benefit of the Acquiring
Company.
As part of the agreement, the Company committed to comply with certain financial covenants,
mainly the ratio of the liabilities to equity and profit ratios (see Note 20E).
The accounting treatment of sale of the trade receivables included as part of the Securitization
Program is:
The Company is not controlling the Acquiring Company, therefore is not consolidated the
Acquiring Company in its financial statements.
The Company continues to recognize the trade receivables included in the Securitization Program
based on the extent of its continuing involvement therein.
In respect of the part of the trade receivables included in the securitization Program with respect
to which cash proceeds were not yet received, however regarding which the Company has
transferred the credit risk, a subordinated note is recorded.
The loss from sale of the trade receivables is recorded at the time of the sale in the statement of
income in the “financing expenses” category.
B. In the fourth quarter of 2016, a subsidiary in Brazil (hereinafter - “the subsidiary”) entered into a 3
years securitization transaction with Rabobank Brazil for sale of customer receivables. Under the
agreement, the subsidiary will sell its receivables to a securitization structure (hereinafter - “the
entity”) that was formed for this purpose where the subsidiary has subordinate rights of 5% of the
entity's capital.
The maximum securitization scope amounts to BRL 200 million (as of December 31, 2018 - $52
million).

Adama Agricultural Solutions Ltd. Notes to the Financial Statements as of December 31, 2018
42
Note 4 - Trade Receivables (cont'd)
B. (cont'd)
On the date of the sale of the customer receivables, the entity pays the full amount which is the
debt amount sold net of discount calculated, among others, over the expected length of the period
between the date of sale of the customer receivable and its anticipated repayment date.
The entity bears 90% of the credit risk in respect of the customers whose debts were sold such
that the entity has the right of recourse of 10% of the unpaid amount. The subsidiary should make
a pledged deposit equal to the amount the entity’s right of recourse.
The subsidiary handles the collection of receivables included in the securitization for the entity.
The subsidiary does not control the entity and therefore the entity is not consolidated in the group's
financial statements.
The subsidiary continues to recognize the trade receivables sold to the entity based on the extent
of its continuing involvement therein (10% right of recourse) and also recognizes an associated
liability in the same amount.
The loss from the sale of the trade receivables is recorded at the time of sale in the statement of
income in the “financing expenses” category.
Note 5 - Financial and Other Assets, Including Derivatives (*)
Composition:
December 31
2 0 1 8 2 0 1 7
$ thousands
Receivables in respect of transactions in derivatives 75,435 69,657
Claims from the government in respect of participations and tax
refunds 75,036 80,274
Advances to suppliers 29,123 5,393
Financial institutions 14,401 9,296
Receivables in respect of realization of an affiliated company
(see Note 28A(1)(a)) - 62,025
Other 34,791 28,269
228,786 254,914
(*) The remaining items are classified in the “amortized cost” category, Except for derivative
transactions presented at fair value and non-financial.

Adama Agricultural Solutions Ltd. Notes to the Financial Statements as of December 31, 2018
43
Note 6 - Inventories
Composition:
December 31
2 0 1 8 2 0 1 7
$ thousands
Finished goods and commercial inventory 742,407 660,610
Work in progress 72,759 67,613
Raw materials 469,199 339,589
Packaging materials 18,059 15,616
Spare parts and maintenance materials 20,217 19,747
1,322,641 1,103,175
Additional information:
Merchandise in transit (included in the inventories balance) 53,913 35,804
Current inventory 1,322,641 1,103,175
Non-current inventory 20,372 15,754
1,343,013 1,118,929
The Group wrote-down inventory mainly due to slow moving and defective inventory and inventory for
which the net realizable value is less than its cost.
The balance of the write-down was $26 million and $25 million as of December 31, 2018 and 2017,
respectively.
Note 7 - Other Financial Investments and Receivables
Composition:
December 31
2 0 1 8 2 0 1 7
$ thousands
Long-term investments, loans and receivables 20,112 27,209
Non-current trade receivables 22,963 29,532
Call option in respect of business combination transaction 1,731 2,073
44,806 58,814
Less - current maturities 7 7
44,799 58,807

Adama Agricultural Solutions Ltd. Notes to the Financial Statements as of December 31, 2018
44
Note 8 - Non-Financial Assets, including Non-Current Inventory
Composition:
December 31
2 0 1 8 2 0 1 7
$ thousands
Non-current inventory 20,372 15,754
Non-financial assets 1,218 1,554
21,590 17,308
Note 9 - Fixed Assets
A. Movement in the carrying amount:
Land and buildings
Facilities and
equipment Motor
vehicles
computers and office equipment Total
$ thousands
Cost
Balance as of
January 1, 2018 274,635 1,480,332 13,913 46,724 1,815,604
Additions (**) 13,624 58,897 2,976 2,735 78,232
Disposals (196) (2,510) (4,025) (2,511) (9,242)
Balance as of
December 31, 2018 288,063 1,536,719 12,864 46,948 1,884,594
Accumulated depreciation
Balance as of
January 1, 2018 (*) 125,550 801,327 7,072 33,779 967,728
Additions** 7,333 54,911 2,065 3,962 68,271
Disposals (196) (1,938) (3,120) (2,343) (7,597)
Balance as of
December 31, 2018 132,687 854,300 6,017 35,398 1,028,402 Depreciated value as of
December 31, 2018 155,376 682,419 6,847 11,550 856,192

Adama Agricultural Solutions Ltd. Notes to the Financial Statements as of December 31, 2018
45
Note 9 - Fixed Assets (cont'd)
A. Movement in the carrying amount: (cont'd)
Land and buildings
Facilities and
equipment Motor
vehicles
computers and office equipment Total
$ thousands
Cost
Balance as of
January 1, 2017 257,849 1,398,638 13,622 41,103 1,711,212
Additions (**) 23,870 88,637 2,958 7,636 123,101
Disposals (690) (3,599) (2,613) (1,203) (8,105)
Disposal of subsidiaries (6,394) (3,344) (54) (812) (10,604)
Balance as of
December 31, 2017 274,635 1,480,332 13,913 46,724 1,815,604
Accumulated depreciation
Balance as of
January 1, 2017 (*) 121,859 748,015 7,089 30,699 907,662
Additions** 971,7 4458,3 2,204 314,9 45073,
Disposals (961) (3,370) (2,167) (1,115) (17,27)
Losses from impairment - 958 - - 895
Disposal of subsidiaries (3,661) (2,557) (54) (367) (008,7)
Balance as of
December 31, 2017 125,550 801,327 7,072 33,779 967,728 Depreciated value as of
December 31, 2017 149,085 679,005 6,841 12,945 847,876
(*) Including an impairment provision of $14 million, of which $11.5 million is for facilities and
equipment.
(**) Includes effect of foreign currency translation differences in respect of foreign operations.
B. Additional information:
(1) The facilities of Adama Makhteshim are situated on lands in Naot Hovav (including
structures, offices, facilities and warehouses) by virtue of lease agreements for various
periods ending between the years 2023-2029 with a renewal option and on a land in Beer
Sheva which is leased from the Israel Land Authority (ILA) on which a built area is erected
thereon that includes structures, offices, facilities and warehouses. In addition, on the real
estate complex in Beer Sheva a facility of Lycored is situated, a subsidiary of the Company.
The facilities of Adama Agan are located in Ashdod. A large portion of the land is owned
by the company and the minority of which is leased from ILA for lease periods ending
between the years 2050-2054.
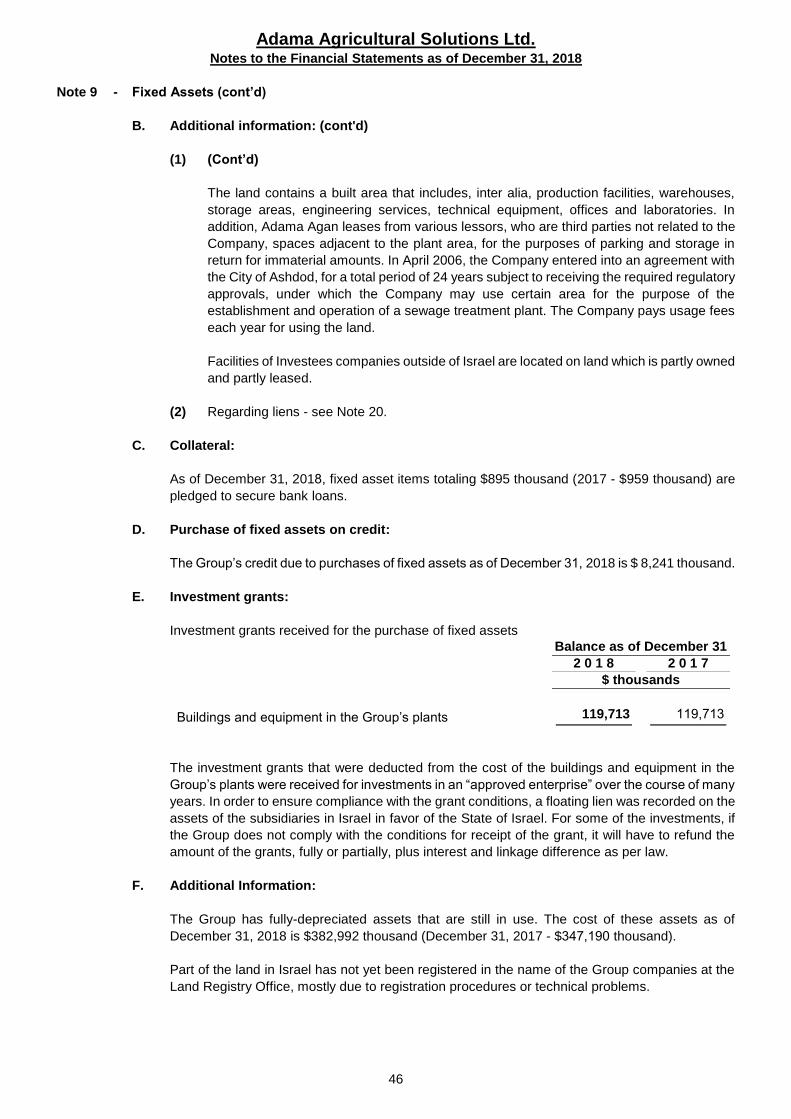
Adama Agricultural Solutions Ltd. Notes to the Financial Statements as of December 31, 2018
46
Note 9 - Fixed Assets (cont’d)
B. Additional information: (cont'd)
(1) (Cont’d)
The land contains a built area that includes, inter alia, production facilities, warehouses,
storage areas, engineering services, technical equipment, offices and laboratories. In
addition, Adama Agan leases from various lessors, who are third parties not related to the
Company, spaces adjacent to the plant area, for the purposes of parking and storage in
return for immaterial amounts. In April 2006, the Company entered into an agreement with
the City of Ashdod, for a total period of 24 years subject to receiving the required regulatory
approvals, under which the Company may use certain area for the purpose of the
establishment and operation of a sewage treatment plant. The Company pays usage fees
each year for using the land.
Facilities of Investees companies outside of Israel are located on land which is partly owned
and partly leased.
(2) Regarding liens - see Note 20.
C. Collateral:
As of December 31, 2018, fixed asset items totaling $895 thousand (2017 - $959 thousand) are
pledged to secure bank loans.
D. Purchase of fixed assets on credit:
The Group’s credit due to purchases of fixed assets as of December 31, 2018 is $ 8,241 thousand.
E. Investment grants:
Investment grants received for the purchase of fixed assets
Balance as of December 31
2 0 1 8 2 0 1 7
$ thousands
Buildings and equipment in the Group’s plants 119,713 119,713
The investment grants that were deducted from the cost of the buildings and equipment in the
Group’s plants were received for investments in an “approved enterprise” over the course of many
years. In order to ensure compliance with the grant conditions, a floating lien was recorded on the
assets of the subsidiaries in Israel in favor of the State of Israel. For some of the investments, if
the Group does not comply with the conditions for receipt of the grant, it will have to refund the
amount of the grants, fully or partially, plus interest and linkage difference as per law.
F. Additional Information:
The Group has fully-depreciated assets that are still in use. The cost of these assets as of
December 31, 2018 is $382,992 thousand (December 31, 2017 - $347,190 thousand).
Part of the land in Israel has not yet been registered in the name of the Group companies at the
Land Registry Office, mostly due to registration procedures or technical problems.

Adama Agricultural Solutions Ltd. Notes to the Financial Statements as of December 31, 2018
47
Note 10 - Intangible Assets
Composition:
Product registration Goodwill
Intangible assets on
purchase of products(*) Software
Marketing rights and
trademarks Other Total
$ thousands
Cost
Balance as of January 1, 2018 966,427 243,049 306,748 85,638 60,263 42,925 1,705,050
Additions (**) 64,526 3,646 309,376 9,773 (38) 19,305 406,588
Disposal (15,870) - (15,594) (1,060) (5,109) (224) (37,857)
Balance as of December 31, 2018 1,015,083 246,695 600,530 94,351 55,116 62,006 2,073,781
Accumulated amortization
Balance as of January 1, 2018 641,630 46,236 239,824 55,972 55,131 27,559 1,066,352
Additions (**) 72,640 (376) 50,868 8,842 1,974 5,828 139,776
Disposal (16,498) - (11,694) (859) (5,104) (115) (34,270)
Balance as of December 31, 2018 697,772 45,860 278,998 63,955 52,001 33,272 1,171,858 Amortized balance as of
December 31, 2018 317,311 200,835 321,532 30,396 3,115 28,734 901,923

Adama Agricultural Solutions Ltd. Notes to the Financial Statements as of December 31, 2018
48
Note 10 - Intangible Assets (cont'd.)
Composition:
Product registration Goodwill
Intangible assets on
purchase of products(*) Software
Marketing rights and
trademarks Other Total
$ thousands
Cost
Balance as of January 1, 2017 1,026,743 233,576 314,592 76,107 60,391 43,790 1,755,199
Additions (**) 92,424 9,473 - 11,497 140 1,238 114,772
Disposals (15,836) - (906) (1,038) (268) (2,103) (20,151)
Classified as held for sale (***) (143,842) - - - - - (143,842)
Disposal of subsidiaries - - - (928) - - (928)
Balance as of December 31, 2017 959,489 243,049 313,686 85,638 60,263 42,925 1,705,050
Accumulated amortization
Balance as of January 1, 2017 649,347 46,218 238,144 48,560 53,336 27,166 1,062,771
Additions (**) 75,479 18 14,163 8,944 1,961 2,496 103,061
Disposals (912,82) - (729) (960) (166) (2,103) (716,78)
Classified as held for sale (***) (182,12) - - - - - (182,12)
Disposal of subsidiaries - - - (572) - - (572)
Balance as of December 31, 2017 629,876 46,236 251,578 55,972 55,131 27,559 1,066,352 Amortized balance as of
December 31, 2017 329,613 196,813 62,108 29,666 5,132 15,366 638,698
(*) Intangible assets on purchase of products includes mainly consideration paid pursuant to agreements from 2001 and 2002 attributed to rights in intellectual
property, trademarks, trade name, technological know-how, and information with respect to customers and suppliers of raw materials, and consideration
paid in a transaction with Syngenta in 2017 and 2018. See Note 28A(1)(e).
(**) Including effect of foreign currency translation differences in respect of foreign operations.
(***) For details see Note 28A(1)(e).

Adama Agricultural Solutions Ltd. Notes to the Financial Statements as of December 31, 2018
49
Note 11 - Loans and Credit from Banks and Other Lenders
A. Composition:
December 31
2 0 1 8 2 0 1 7
$ thousands
Credit from banks
Overdrafts 925 2,597
Short-term credit 79,617 335,763
80,542 338,360
Current maturities of long-term loans from banks 33,458 49,155
Current maturities - other 27 111
114,027 387,626
B. Regarding financial covenants - see Note 20C.
Note 12 - Trade Payables
Composition:
December 31
2 0 1 8 2 0 1 7
$ thousands
Open accounts 669,824 575,864
Post-dated checks 34,362 44,161
704,186 620,025
Note 13 - Other Payables
Composition:
December 31
2 0 1 8 2 0 1 7
$ thousands
Payables in respect of transactions in derivatives 211,515 120,757
Liabilities to employees and other liabilities in respect of
salaries and wages 134,073 151,947
Liabilities for discounts 76,638 77,035
Accrued expenses 72,658 68,979
Advances from customers 31,388 22,365
Government institutions 25,500 20,814
Provision for refunds 21,810 24,738
Payables in respect of intangibles assets 19,145 26,993
Deferred income 10,241 2,526
Financial institutions 6,460 3,189
Accrued interest expenses 6,740 7,099
Provisions for legal claims 3,445 2,864
Liability in respect of investment in equity-accounted investee
company* - 1,171
Other 38,300 25,955
657,913 556,432
(*) For further details, see Note 19A(7).

Adama Agricultural Solutions Ltd. Notes to the Financial Statements as of December 31, 2018
50
Note 14 - Long-Term Loans from Banks
A. Composition
December 31
2 0 1 8 2 0 1 7
$ thousands
Loans from banks 67,818 116,848
Less - current maturities 33,458 49,155
34,360 67,693
B. Regarding the commitment of the Company and certain subsidiaries to banks to maintain certain
financial covenants, mainly debt-equity and profitability ratios - see Note 20C.
Note 15 - Debentures
A. Linkage base and interest rates:
Linkage terms
Interest rate
Effective interest
rate* Par value Total
% % NIS
thousands $ thousands
Debentures - Series B CPI 5.15 5.30 3,483,117 1,114,509
Total
3,483,117 1,114,509
*Effective interest rate with respect of series B extensions.
Series B debentures, in the amount of NIS 3,563.5 million par value, linked to the CPI and bearing
interest at the base annual rate of 5.15%. The debenture principal is to be repaid in 17 equal
payments in the years 2020 through 2036. The issuance costs for this series amounted to $4,144
thousand.
During 2008, the Company purchased by itself and through a wholly-owned subsidiary, a
cumulative total of NIS 80.4 million par value debentures (Series B), at a total cost of $16,425
thousand. Due to the Company's purchase, debentures with a par value of NIS 12.5 million were
de-listed from trading.
B. Repayment dates:
$ thousands
First year (current maturities) -
Second year 65,559
Third year 65,559
Fourth year 65,559
Fifth year and thereafter 917,832
1,114,509

Adama Agricultural Solutions Ltd. Notes to the Financial Statements as of December 31, 2018
51
Note 16 - Other Long-Term Liabilities
Composition:
December 31
2 0 1 8 2 0 1 7
$ thousands
Liabilities in respect of claims 3,852 6,130
Liability in respect of payments to the Chief Scientist 480 618
Other provisions and liabilities 17,131 19,645
21,463 26,393
Note 17 - Income Taxes
Details regarding the tax environment of the Group
A. Corporate Tax Rates:
(1) Set forth below are the tax rates in Israel relevant to the Company for 2016-2018:
2018 - 23%
2017 - 24%
2016 - 25%
On December 22, 2016 the Knesset plenum passed the Economic Efficiency Law
(Legislative Amendments for Achieving Budget Objectives in the Years 2017 and 2018) -
2016, by which:
(a) The corporate tax rate would be reduced from 25% to 23% in two steps. The first
step will be to a rate of 24% as from January 2017 and the second step will be to
a rate of 23% as from January 2018.
(b) Reduction of the tax rate on preferred income for a preferred enterprise in
Development Area A, under the Law for the Encouragement of Capital Investments
- 1959, from 9% to 7.5% as from 2017.
As a result of the reduction in the tax rate to 23% in two steps, the deferred tax balances
as at December 31, 2017 were calculated according to the new tax rate specified in the
Economic Efficiency Law (Legislative Amendments for Achieving Budget Objectives in the
Years 2017 and 2018), at the tax rate expected to apply on the date of reversal.
(2) In January 12, 2012 Amendment 188 to the Income Tax Ordinance (New Version) - 1961
(hereinafter - “the Ordinance”) was published in the Official Gazette. The amendment
amended Section 87A to the Ordinance, and provides a temporary order whereby
Accounting Standard No. 29 “Adoption of International Financial Reporting Standards
(IFRS)” that was issued by the Israel Accounting Standards Board shall not apply when
determining the taxable income for the tax years 2010-2011 even if this standard was
applied when preparing the financial statements (hereinafter - “the Temporary Order”). On
July 31, 2014 Amendment 202 to the Ordinance was issued, by which the Temporary Order
was extended to the 2012 and 2013 tax years. Taxable income for the years 2014-2016,
was also calculated by the Temporary Order above.

Adama Agricultural Solutions Ltd. Notes to the Financial Statements as of December 31, 2018
52
Note 17 - Income Taxes (cont'd)
Details regarding the tax environment of the Group (cont'd)
A. Corporate Tax Rates: (cont'd)
(3) On December 22, 2017, the President of the United States signed a tax reform, in which
the corporate tax rate will be reduced to 21% from 2018. Accordingly, the relevant deferred
tax balances have been updated according to the new tax rate as of December 31, 2017.
(4) The subsidiaries outside of Israel are assessed based on the tax laws in the country of their
residence.
B. Benefits under the Law for the Encouragement of Capital Investments:
Industrial enterprises of companies in Israel were granted “Approved Enterprise” or “Beneficiary
Enterprise” status under the Israeli Law for the Encouragement of Capital Investments, 1959. Part
of the income deriving from the “Approved Enterprise” or “Beneficiary Enterprise” during the
benefit period is subject to tax at the rate of up to 25% (the total benefit period is seven years and
in certain circumstances up to ten years, but may not exceed 14 years from the date of the Letter
of Approval and 12 years from the date the “Approved Enterprise” commenced operations or not
more than 12 years from the election year for a “Benefitted Enterprise”).
Some industrial enterprises of subsidiaries in Israel are entitled to a tax exemption for periods of
between two and six years and a tax rate of up to 25% for the remainder of the benefit period.
Should a dividend be distributed from the tax-exempt income, the subsidiaries will be liable for
tax on the income from which the dividend was distributed at a rate of 25%.
The aforementioned benefits are conditional upon compliance with certain conditions specified in
the Law, related Regulations and the Letters of Approval, in accordance with which the
investments in the Approved Enterprises were made. Failure to meet these conditions may lead
to cancellation of the benefits, in whole or in part, and to repayment of any benefits already
received, together with interest. Management believes that the companies are in compliance with
these conditions.
C. Amendment to the Law for the Encouragement of Capital Investments, 1959:
On December 29, 2010 the Knesset approved the Economic Policy Law for 2011-2012, which
includes an amendment to the Law for the Encouragement of Capital Investments - 1959
(hereinafter - “the Amendment”). The Amendment is effective from January 1, 2011 and its
provisions apply to preferred income derived or accrued in 2011 and thereafter by a preferred
company, per the definition of these terms in the Amendment. Companies can choose not to be
included in the scope of the amendment to the Encouragement Law and to stay in the scope of
the law before its amendment until the end of the benefits period of its approved/beneficiary
enterprise.
As of the date of the report, all subsidiaries in Israel adopted the amendment and the deferred
taxes were calculated accordingly
Adama Agricultural Solutions Ltd. Notes to the Financial Statements as of December 31, 2018
53
Note 17 - Income Taxes (cont'd)
C. Amendment to the Law for the Encouragement of Capital Investments, 1959: (cont'd)
The Amendment provides that only companies in Development Area A will be entitled to the
grants track and that they will be entitled to receive benefits under this track and under the tax
benefits track at the same time. In addition, the existing tax benefit tracks were eliminated (the
tax exempt track, the “Ireland” track and the “Strategic” track) and two new tax tracks were
introduced in their place, a preferred enterprise and a special preferred enterprise, which mainly
provide a uniform and reduced tax rate for all the company’s income entitled to benefits. On
August 5, 2013 the Knesset passed the Law for Changes in National Priorities (Legislative
Amendments for Achieving Budget Objectives in the Years 2013 and 2014) - 2013, which raised
the tax rates on preferred income as from the 2014 tax year as follows: 7.5% for Development
Area A and 16% for the rest of the country.
The amendment further determined that no tax shall apply to dividend distributed out of preferred
income to shareholder who is Israel resident company. On dividend distributed out of preferred
income to a single shareholder or a foreign resident subject to double taxation treaties, tax of 20%
shall apply.
D. Benefits under the Law for the Encouragement of Industry (Taxes), 1969:
Under the Israeli Law for the Encouragement of Industry (Taxes) 1969, the Company is an
Industrial Holding Company and some of the subsidiaries in Israel are “Industrial Companies”.
The main benefit under this law is the filing of consolidated income tax returns (the Company files
a consolidated income tax return with Adama Makhteshim and submission of a consolidated
report together with Adama Agan as of 2017), amortization of know-how over 8 years, higher
rates of depreciation.

Adama Agricultural Solutions Ltd. Notes to the Financial Statements as of December 31, 2018
54
Note 17 - Income Taxes (cont'd)
E. Deferred tax assets and liabilities:
(1) Deferred tax assets and liabilities recognized:
Deferred taxes are calculated at the tax rate expected to be in effect on the date of the reversal, as
stated above. Deferred taxes for subsidiaries operating outside of Israel were calculated according to
the relevant tax rates in each country.
The movement in deferred tax assets and liabilities is attributed to the following items:
Fixed
assets
and
intangible
assets
Employee
benefits
Tax loss
carry
forwards Inventories Other Total
$ thousands
Deferred tax asset
(liability) balance as at
January 1, 2017 (80,620) 14,662 44,201 58,103 39,662 76,008
Changes recognized in the
statement of income 8,991 1,221 26,510 (5,104) 2,609 34,227
Changes recognized in
other comprehensive
income (275) (533) 22 162 8,430 7,806
Disposal of subsidiaries 464 - - - - 464
Deferred tax asset
(liability) balance as at
December 31, 2017 (71,440) 15,350 70,733 53,161 50,701 118,505
Effect of first-time
implementation of
International Accounting
Standards (see Note 3s) - - - - (1,948) (1,948)
Changes recognized in the
statement of income (7,570) (445) (58,710) 5,780 8,150 (52,795)
Changes recognized in
other comprehensive
income 290 (479) - (72) (7,982) (8,243)
Deferred tax asset
(liability) balance as at
December 31, 2018 (78,720) 14,426 12,023 58,869 48,921 55,519

Adama Agricultural Solutions Ltd. Notes to the Financial Statements as of December 31, 2018
55
Note 17 - Income Taxes (cont'd)
E. Deferred tax assets and liabilities: (cont'd)
(1) Deferred tax assets and liabilities recognized: (cont'd)
December 31
2 0 1 8 2 0 1 7
$ thousands
Presented in:
Deferred tax assets 96,852 129,250
Deferred tax liabilities (41,333) (10,745)
Total 55,519 118,505
Deferred tax assets in respect of losses carried forward for tax purposes are mainly in
respect of subsidiaries in Israel. Since 2017 Deferred tax assets were recognized because
future taxable income is expected, against which tax losses can be utilized, mainly due to
the expected capital gain from the closing of the transaction for selling certain products in
Europe during the first quarter of 2018, as described in Note 28A(1)(e), or up to the balance
of the tax reserves.
(2) Unrecognized deferred tax assets:
Deferred tax assets have not been recognized in respect of the following items:
December 31
2 0 1 8 2 0 1 7
$ thousands
Tax losses 18,229 11,651
Deferred tax assets have not been recognized in respect of part of these items, since it is
not probable that foreseeable future taxable profit will be available against which the Group
can use the benefits.
F. Components of income taxes expenses (income):
For the year ended December 31
2 0 1 8 2 0 1 7 2 0 1 6
$ thousands
Current tax expenses (income)
Current year 65,873 644,92 45,581
Adjustments for previous years, net 10,367 9,845 (177)
76,240 54,771 45,404
Deferred tax expenses (income)
Creation and reversal of temporary
differences 52,626 (40,229) (21,349)
Change in the tax rate 169 6,002 (1,535)
52,795 (34,227) (22,884)
Total income taxes expenses 129,035 20,544 22,520

Adama Agricultural Solutions Ltd. Notes to the Financial Statements as of December 31, 2018
56
Note 17 - Income Taxes (cont'd)
G. Reconciliation between the theoretical tax and the tax expense:
Following is reconciliation between the theoretical tax and the tax expense included in the
statement of income:
For the year ended December 31
2 0 1 8 2 0 1 7 2 0 1 6
$ thousands
Profit before taxes on income 506,520 256,154 187,190
Company’s main tax rate 23% %24 25%
Tax calculated according to the main tax rate 116,500 61,477 46,798
Tax benefits from Approved Enterprises (4,183) (5,117) (8,362)
Difference between measurement basis of
income for financial statement and for tax
purposes 17,112 (3,176) (7,490)
Taxable income and temporary differences at
other tax rates (5,149) (19,879) (11,577)
Taxes in respect of prior years 10,367 9,845 (177)
Temporary differences and losses in the
report year for which deferred taxes were
not created 963 812 1,155
Utilization of tax losses from prior years for
which deferred taxes were not created (8,811) (4,152) (1,611)
Creation/ Reversal of deferred taxes
regarding losses carry forward and
temporary differences from previous years 2,622 (27,906) (8,560)
Non-deductible expenses and other, net
differences (111) 3,985 9,754
Neutralization of tax calculated in respect of
the Company’s share in results of equity
accounted investees (444) (1,347) 4,125
Effect of change in tax rate in respect of
deferred taxes 169 6,002 (1,535)
129,035 ,54402 22,520
Effective tax rate 25.5% %8.0 12.0%

Adama Agricultural Solutions Ltd. Notes to the Financial Statements as of December 31, 2018
57
Note 17 - Income Taxes (cont'd)
H. Income taxes in respect of other comprehensive income:
Net of tax Tax benefit (expense) Before tax
For the year ended December 31 2018
15,508 (2,157) 17,665
Effective portion of changes in fair value of cash
flow hedges
38,033 (5,227) 43,260
Net changes in fair value of cash flow hedges
transferred to the statement of income
4,698 (479) 5,177 Re-measurement of defined benefit plan
58,239 7,863 66,102
For the year ended December 31 2017
(54,583) 7,201 (61,784)
Effective portion of changes in fair value of cash
flow hedges
(7,344) 726 (8,070)
Net changes in fair value of cash flow hedges
transferred to the statement of income
(2,133) (570) (1,563) Re-measurement of defined benefit plan
(64,060) 7,357 (71,417)
For the year ended December 31 2016
13,066 (1,244) 14,310
Effective portion of changes in fair value of cash
flow hedges
(12,454) 1,783 (14,237)
Net changes in fair value of cash flow hedges
transferred to the statement of income
136 52 84 Re-measurement of defined benefit plan
748 591 157

Adama Agricultural Solutions Ltd. Notes to the Financial Statements as of December 31, 2018
58
Note 17 - Income Taxes (cont'd)
I. Final tax assessments:
Final tax assessments - Adama Agan, Adama Makhteshim, Lycored Bio and the Company up to
and including the year ended 2016.
J. Losses and deductions available for carryforward to future years:
The amount of the carryforward tax losses that can be utilize as at the balance sheet date is $101
million.
The Group has recognized a deferred tax asset of approximately $12 million with respect of
carryforward unutilized tax losses, based on management's assessment that it is probable that
these losses will be utilize in future years.
K. Additional Information:
Tax demands in an immaterial amount were filed against the Company. These tax demands has
not provided a provision in the financial statements since the group companies estimates that
their chances to be accepted are lower than the chances to be rejected.
During the reporting period, the Company created a provision in respect of tax exposures which
the probability of realization is more likely than not.
Note 18 - Employee Benefits
Employee benefits include post-employment benefits, other long-term benefits, short-term benefits,
termination benefits and share-based payments. Likewise, the Company has a defined contribution plan
for some of its employees, which is subject to Section 14 of the Israeli Severance Pay Law, 1963.
Severance pay and retirement grants in Israel:
The Company and its subsidiaries in Israel make regular deposits with “Nativ” (the Pension Fund of the
Workers and Employees of the Histadrut Ltd.) and insurance companies, conferring pension rights or
severance pay upon reaching retirement age. Amounts deposited in the pension fund are not included
in the balance sheet because they are not managed or controlled by the companies.
Employees dismissed before reaching retirement age, to which Section 14 of the Severance Pay Law
does not apply, will be eligible for severance benefits, calculated on the basis of their most recent salary.
In cases that the amounts accumulated in the pension fund are not sufficient to cover the calculated
severance benefits, the companies will cover the deficit.
In addition to their above mentioned pension rights, most employees are entitled to receive retirement
grants at the rate of 2.33% of their salary at retirement age. The accrual in the balance sheet covers the
companies’ obligations to pay retirement grants as mentioned above, as well as the full projected liability
to pay severance benefits to some of their employees for the period prior to the date on which these
employees joined the pension plan, during which period no deposits had been made in the fund in the
name of the employee.
Early retirement pension:
The financial statements include a liability for payment of pension benefits to a number of employees
whose work was terminated before they reached retirement age. The liability was calculated on actuarial
basis taking into account the period from the date their employment was terminated until the date
stipulated in the agreement, on the basis of the present value of the pension payments.

Adama Agricultural Solutions Ltd. Notes to the Financial Statements as of December 31, 2018
59
Note 18 - Employee Benefits (cont'd)
Employee Benefits:
December 31
2 0 1 8 2 0 1 7
$ thousands
Present value of unfunded obligations 27,212 31,095
Present value of funded obligations 32,754 37,195
Total present value of obligations 59,966 68,290
Less - fair value of plan's assets (12,748) (14,939)
Total recognized liability for defined benefit plan, net 47,218 53,351
Liability in respect of early retirement 13,648 19,900
Liability for other short-term benefits 22,918 37,838
Liability for other long-term benefits 20,259 21,241
Total employee benefits, net 104,043 132,330
Presented as part of the following items:
Other payables 43,101 61,560
Long-term employees benefits 60,942 70,770
104,043 132,330
Liabilities in respect of salaries, accompanying benefits and bonuses are included in the “other payables”
category.

Adama Agricultural Solutions Ltd. Notes to the Financial Statements as of December 31, 2018
60
Note 18 - Employee Benefits (cont'd)
Post-employment benefit plans - defined benefit plan
A. Movement in the net liability and assets, net in respect of defined benefit plans and their components:
Defined benefit obligation
Fair value of plan assets Total
2 0 1 8 2 0 1 7 2 0 1 8 2 0 1 7 2 0 1 8 2 0 1 7
$ thousands
Balance as of January 1 68,290 64,740 14,939 18,885 53,351 45,855
Expense/income
recognized in profit and
loss:
Current service cost 3,036 4,518 - 177 3,036 4,341
Interest costs 2,221 2,399 497 596 1,724 1,803
Settlements - (7,309) - (5,839) - (1,470)
Changes in exchange rates
and others (4,561) 5,896 (1,076) 1,394 (3,485) 4,502
Included in other
comprehensive income:
Actuarial losses from
changes in the
demographic assumptions (1,482) (238) - - (1,482) (238)
Actuarial gains (losses) from
changes in the financial
assumptions (4,303) 2,415 - - (4,303) 2,415
Other actuarial gains (losses) (102) (525) (516) 130 414 (655)
Actual return less interest
income (20) (35) (214) (77) 194 42
Foreign currency translation
differences in respect of
foreign operations (122) 167 (45) 22 (77) 145
Additional movements:
Benefits paid (2,991) (3,738) (1,710) (1,331) (1,281) (2,407)
Contributions paid by the
Group - - 873 982 (873) (982)
Balance as of December 31 59,966 68,290 12,748 14,939 47,218 53,351

Adama Agricultural Solutions Ltd. Notes to the Financial Statements as of December 31, 2018
61
Note 18 - Employee Benefits (cont'd)
Post-employment benefit plans - defined benefit plan (cont'd)
B. Actuarial assumptions and sensitivity analysis:
The principal actuarial assumptions at the reporting date (weighted average)
For the year ended December 31,
2 0 1 8 2 0 1 7 2 0 1 6
% % %
Discount rate on December 31 1.6 1.2 1.6
The assumptions regarding the future mortality rate are based on published statistical data and
acceptable mortality rates.
Possible reasonable changes as of the date of the report in the discount rate assuming the other
assumptions remain unchanged, would have affected the defined benefit obligation as follows:
As of December 31 2018
Increase of 1%
Decrease of 1%
$ thousands
Discount rate (4,247) (5,160)
As of December 31 2017
Increase of 1%
Decrease of 1%
$ thousands
Discount rate (5,286) 6,472
C. Impact of the plan on the Group’s future cash flows:
The Company’s estimation for expected deposit to defined benefit plan in 2019 is $853 thousand.
D. Post-employment benefit plans - defined contribution plans:
For the year ended December 31
2 0 1 8 2 0 1 7 2 0 1 6
$ thousands
Amount recognized as an expense in respect
of defined contribution plan 4,977 4,297 3,583

Adama Agricultural Solutions Ltd. Notes to the Financial Statements as of December 31, 2018
62
Note 19 - Commitments and Contingent Liabilities
A. Commitments:
(1) On December 30, 2015, the Company's general meeting of shareholders resolved (after
obtaining the approval of the board of directors from December 30, 2015 and the approval
of the Remuneration Committee and the Audit Committee from December 29, 2015) to
approve as a framework decision, the Company’s engagement in annual directors and
officers liability insurance policies for directors and officers, under which the liability of
directors and officers of the Company and its subsidiaries in Israel and abroad, as may be
from time to time will be insured, including directors and officers who are controlling
shareholders of the Company (hereinafter - "Insurance Policies") provided that said
agreements meet the conditions set forth in the framework decision. The Insurance Policies
will be for several insurance periods which shall not exceed five (5) years cumulatively (i.e.
for five annual insurance periods the last of which to end on December 31, 2020).
The liability of directors and officers of the Company and its subsidiaries (including officers
who might be considered as controlling shareholders) is covered by an insurance policy,
of which the liability limit is $100 million for each insurance occurrence and for the insurance
period plus reasonable legal defense expenses in accordance with the terms of the policy.
On November 21, 2018, the Company entered into an insurance policy agreement with
Clal Insurance Company Ltd. for another one year period in accordance with the terms of
the framework decision as specified above and according to the Company's remuneration
policy.
(2) On October 8, 2007, the General Meeting of the shareholders of the Company approved a
commitment to indemnify in advance officers by granting letters of indemnity to Company
officers (including officers who might be considered controlling shareholders).
Simultaneously, at the same time, the Company’s General Meeting approved an
amendment to the sections of the Articles of Association dealing with exemption, insurance
and indemnity of Company officers. On November 7, 2011, the Company’s Board of
Directors resolved to approve an amendment to the letters of indemnity given in the past
by the Company to the directors and officers that serve and/or will serve from time to time
in the Company and/or companies it controls, whereby it includes provisions designed to
accommodate the letters of indemnity to the amendments made to the legislation regarding
exemption, indemnity and insurance of officers and to the provisions of the Efficiency in
Enforcement Processes in the Securities Authority (Legislative Amendments), 2011
(hereinafter - “Amendment of Letters of Indemnity”). Further to the resolution of the
Company’s Board of Directors, on November 17, 2011 the Company’s General Meeting
approved the Amendment of Letters of Indemnity that were issued and will be issued to
directors.
On August 10, 2015 the Company's general meeting of shareholders, after obtaining the
approval of the board of directors dated August 10, 2015 and the approval of the
Remuneration Committee from August 6, 2015, approved a commitment to exempt officers
and directors serving in the Company and to officers and directors who will serve on the
Company from time to time. The conditions of the commitment for exemption are identical
for all officers and directors of the Company and in accordance with the provisions of the
Companies Law, 1999 (hereinafter - the "Companies Law"), the Company's articles of
association and its remuneration policy.
(3) For details regarding undertakings of the Company and its subsidiaries as part of a
securitization agreement - see Note 4.
(4) For details regarding undertakings with interested parties, see Note 28.

Adama Agricultural Solutions Ltd. Notes to the Financial Statements as of December 31, 2018
63
Note 19 - Commitments and Contingent Liabilities (cont'd)
A. Commitments: (cont'd)
(5) In July 2006, Adama Agan entered into an agreement with Ashdod Energy Ltd. (hereinafter
- “Ashdod Energy”), which was amended from time to time, for the construction and
operation of a power plant for the production of electricity and steam, based on the use of
natural gas.
As of the report date the construction of the power plant has been completed and it is
operating. According to the agreement, Ashdod Energy will supply electricity and steam to
Adama Agan for a period of 24 years and 11 months from the date of financial closing or
until the end of the rental period of the adjacent real estate (as defined in the agreement),
whichever is earlier and in any case for a period that will not end before 24 years and 11
months from October 10, 2010.
(6) In May 2007, Adama Makhteshim entered into an agreement with Ramat Hanegev Energy
Ltd. (hereinafter - “Negev Energy”), a third party that is not related to the Company, which
was amended from time to time, for the construction, operation, own and delivery of a
power plant for the production of electricity and steam, based on the use of natural gas in
Naot Hovav (hereinafter - “the Agreement”). As of the report date, the construction of the
power plant has been completed and it is operating.
Pursuant to the Agreement, Negev Energy will supply electricity, steam, gas emissions for
creation of carbon dioxide, soft water, distilled water and compressed air to Adama
Makhteshim’s facilities in Naot Hovav for a period of 24 years and 11 months from the date
of which the area was made available to Negev Energy and thereafter, the power plant will
be transferred to Adama Makhteshim’s ownership.
(7) The fourth quarter of 2016 includes losses of $17.8 million in respect of a provision for
impairment of a production facility in Negev Aroma (Neot Hovav) Ltd. (hereinafter - "Negev
Aroma"), which is a joint venture equity-accounted investee, due to The Group's
commitment to support Negev Aroma and the provision in the Group's financial statements
in respect of a loan granted to Negev Aroma in the past.
The losses are included in the items: Share of income (losses) of equity-accounted investee
companies and financing expenses, net.
During the years 2017 and 2018, the entire obligation was repaid in cash.
B. Contingent liabilities:
In accordance with the Israeli Law for the Encouragement of Capital Investments, 1959,
Company’s subsidiaries received grants from the State of Israel in respect of investments in fixed
assets made as part of plant expansion plans approved by the Investments Center. Receipt of
the grants is conditional upon fulfilment of the terms of the Letter of Approval that include, among
others, exports at certain rates. If the companies do not comply with the required terms, they will
have to refund the amounts of the grants, together with interest from the date of their receipt.
Managements of the subsidiaries believe that they are in compliance with the conditions of the
approval. See also Note 9E.

Adama Agricultural Solutions Ltd. Notes to the Financial Statements as of December 31, 2018
64
Note 19 - Commitments and Contingent Liabilities (cont'd)
C. Environmental protection:
(1) The manufacturing processes of the Company, and the products it produces and markets,
entail environmental risks that impact the environment. The Company invests substantial
resources in order to comply with the applicable environmental laws and attempts to
prevent or minimize the environmental risks that could occur as a result of its activities. To
the best of the Company’s knowledge, at the balance sheet date, none of its applicable
permits and licenses with respect to environmental issues have been revoked. The
Company has insurance coverage for sudden, unexpected environmental contamination in
Israel and abroad. The Company estimates, based on the opinion of its insurance
consultants, that the extent of its insurance coverage for said events is reasonable.
(2) The Company's Israel plants conduct various soil surveys, risk surveys and tests regarding
the treatment of soil or ground water at the plants, according to the instructions of the
Ministry of Environmental Protection and the Water Authority.
D. Claims against subsidiaries:
In the ordinary course of business, legal claims were filed against subsidiaries, including lawsuits,
regarding claims for patent infringement. Inter alia, from time to time, the Company, similar to
other companies operating in the market of products for plant protection is exposed to class
actions for large amounts, which it must defend against while incurring considerable costs, even
if these claims, from the start, have no basis. In the estimation of the Company’s management,
based, inter alia, on opinions of its legal counsel regarding the prospects of the proceedings, the
financial statements include appropriate provisions where necessary to cover the exposure
resulting from the claims.
Various immaterial claims have been filed against Group companies in courts throughout the
world, in immaterial amounts, for causes of action involving mainly employee-employer relations
and various civil claims, for which the Company did not record a provision in the financial
statements. The total of the claims that in the estimation of Company’s management, based on
its legal advisors’ opinion, the chances of them succeeding is lower than the chances they will be
rejected, amounts to approximately $10.5 million. Furthermore, claims were filed for product
liability damages, for which the Company has appropriate insurance coverage, such that the
Company’s exposure in respect thereof is limited to the amount its deductible requirement or the
amount thereof does not exceed the deductible amount.
Note 20 - Liens and Financial Covenants
A. Liabilities to banks secured by liens:
The Company and its subsidiaries have made commitments to banks not to register liens on their
assets in favor of other parties, except for specific liens in the amount of about $0.9 million, for
securing liabilities in the amount of about $108 thousand, to the benefit of the party financing the
acquisition on certain terms, except for creation of liens related to receipt of investment grants,
as stated in Paragraph B. below, and except for liens within the scope of the securitization
agreement - see Note 4.
B. In order to secure fulfilment of the conditions of investment grants received (see Note 9E), the
Company’s subsidiaries have registered floating liens in unlimited amounts on all of their assets.

Adama Agricultural Solutions Ltd. Notes to the Financial Statements as of December 31, 2018
65
Note 20 - Liens and Financial Covenants (cont'd)
C. The main financial covenants included in the financing agreements as of December 31, 2018, are
as follows:
(1) The ratio of the interest-bearing financial liabilities (net debt) to the Company’s equity shall
not exceed 1.25. As of December 31, 2018 the ratio was 0.3.
(2) The ratio of the interest-bearing financial liabilities (net debt) to earnings before financing
expenses, taxes, depreciation and amortization (EBITDA) for 12 months shall not exceed
a ratio 4.
As of December 31, 2018, the ratio of the Company’s interest-bearing financial liabilities
(net debt) to the EBITDA for 12 months was 0.9.
(3) The Company’s equity will not be less than $1.22 billion. As of December 31, 2018, the
Company's equity amounted to $2,266 million.
(4) The financing documents of one of the banks further require that the retained earnings,
according to the financial statements on every date, shall not be less than $700 million. As
of December 31, 2018, the retained earnings were $1,836 million.
D. (1) Pursuant to agreements the Company reached with the bank with which it signed the
securitization agreement and with the banks to which the Company is required to maintain
financial covenants by virtue of the financing agreements, the balance of the debt under
the securitization agreement is not included as part of the financial liabilities for purposes
of examining the financial covenants.
(2) The financing agreements also include sections providing that a transfer of control (as this
term is defined in the relevant financing agreements), in the Company and/or in the
subsidiaries Adama Makhteshim and Adama Agan that is made without obtaining the
advance written consents of the relevant banks, will constitute grounds for calling the full
amount of the relevant liabilities for immediate repayment.
E. The securitization agreement of trade receivables of the Company and its subsidiaries (as
described in Note 4B) include the Company’s commitment to maintain financial ratios, of which
the key commitments are below:
(1) The ratio between the Company’s interest bearing financial liabilities (net debt) and its
equity will not exceed 1.25. As of December 31, 2018, the ratio was 0.3.
(2) The ratio between the Company’s interest bearing financial liabilities (net debt) and the
EBITDA for 12 months will not exceed 4. As of December 31, 2018, this ratio was 0.9.
The securitization agreement and the agreements with banks contain Cross Default clauses,
whereby the party opposite which the Company has undertaken in the agreement will be allowed
to demand immediate repayment of the debts under circumstances wherein an event took place
entitling another lender of the Company and/or its subsidiaries to call its debts for immediate
repayment, in full or part, provided that the amount of the debts and obligations of the Company
and/or subsidiaries toward that other financing parties exceeds the minimum amount as
prescribed in various financing agreements.
Furthermore, as stated above, the Company has undertaken, under the terms of the letters of
consent opposite financing parties to comply with additional criteria which the Company believes,
at the report date, does not significantly restrict the Company's activities.

Adama Agricultural Solutions Ltd. Notes to the Financial Statements as of December 31, 2018
66
Note 20 - Liens and Financial Covenants (cont'd)
E. (cont'd)
At December 31, 2018, the Company was in compliance with the financial covenants prescribed
by the financing banks under the terms of the financing documents and the securitization
agreement, and during the report period, complied with all the financial covenants and the
limitations applicable to it prescribed in the financing documents and in the securitization
agreement.
Note 21 - Equity
A. Share capital and premium on shares:
Ordinary shares
2 0 1 8 2 0 1 7
Share capital issued and paid-up at December 31, in
thousands of shares of NIS 3.12 par value 137,991 137,991
Authorized share capital, in thousands of shares 300,000 300,000
The holders of the ordinary shares have the right to receive dividends as they will be declared
from time to time and the right to vote at the Company’s General Meetings, based one vote per
share.
On November 9, 2014, the Company’s Board of Directors and the Company’s shareholders
approved a reverse split of the Company’s ordinary share capital, in a ratio of 3.12:1 (i.e., each
3.12 ordinary shares of the Company will become 1 ordinary share of NIS 3.12 par value of the
Company), effective as of the date of the Board Resolution.
In addition, the Company’s Board of Directors and the Company’s shareholders approved an
increase in the Company’s authorized share capital to 300,000,000 shares of NIS 3.12 par value
each, effective from the approval date of the Board of Directors.
B. Translation reserve of foreign operations:
The translation reserve comprises all foreign currency differences arising from the translation of
the financial statements of foreign operations.
C. Hedging reserve:
The hedging reserve comprises the effective portion of the net cumulative change in the fair value
of cash flow hedging instruments that relate to hedged transactions that have not yet occurred.
D. Share-based payments:
(1) In December 2017, the remuneration committee and the Company's Board of Directors
(and the General Meeting with respect to the CEO) approved the allocation of 49,042,146
phantom warrants to officers and employees in accordance with the long-term phantom
compensation plan ("the Plan"). The allocation date is December 28, 2017.

Adama Agricultural Solutions Ltd. Notes to the Financial Statements as of December 31, 2018
67
Note 21 - Equity (cont'd)
D. Share-based payments: (cont’d)
(1) (Cont’d)
The warrants will vest in four equal portions, where the first and second quarters are
exercisable after one year, the third quarter after two years and the fourth quarter after
three years from January 1, 2018. The warrants will be exercisable, in whole or in part, in
accordance with the terms of the plan, and subject to achieving financial targets as
determined in the plan. The warrants may be exercised until the end of 2023.
Upon exercise of each warrant, the offeree will be entitled to receive cash payment equal
to the difference between the base price as determined at the time of the grant and the
closing price of one share of the parent company on the Shenzhen Stock Exchange, as it
will be on the exercise date up to the ceiling that was determined under the plan.
The fair value of the granted warrants as aforesaid was estimated using the binomial pricing
model.
The cost of the benefit embodied in the warrants that were allocated as aforesaid, based
on the fair value at the end of the reporting period, amounted to a total of $ 12.5 million.
The liability at the end of the reporting period was recorded according to the vesting period
as determined in the plan, taking into account the extent of the service that the employees
provided until that date.
Following is the movement in the phantom warrants in 2018:
phantom warrants
Balance as of January 1, 2018 49,042,146
Granted during the year 198,417
Forfeited during the year (1,139,172)
Total existing options in cycle as of December 31, 2018 48,101,391
The parameters used in implementing the model are as follows:
Stock price (RMB) 9.13
Exercise increment (RMB) 15.13-15.07
Expected volatility 45.47%
Risk-free interest rate 2.968%
Economic value as of December 31, 2018 ($ in thousands) 12,526
The total salary expenses in respect of share-based payment settled with cash, which were
recorded as salary expenses in 2018, is $572 thousand.
(2) During 2014, after the required approvals by the Company’s Remuneration Committee and
Board of Directors, the Company issued 12,471,721 options to Group officers and
employees, in accordance with the Company’s options plan (hereinafter - “the Plan”).

Adama Agricultural Solutions Ltd. Notes to the Financial Statements as of December 31, 2018
68
Note 21 - Equity (cont'd)
D. Share-based payments: (cont'd)
(2) (Cont’d)
The cost of the benefit embedded in the options issued, as stated, based on the fair value
on the date of their issuance, amounted to a total of approximately $28.7 million. The cost
benefit in respect of share based payments recognized in the statement of income over the
vesting period of each portion, subject to compliance with the expected performance of the
program.
In view of the progress of the Combination Transaction with ADAMA Ltd as described in
Note 28A(1)(b), as of December 31, 2016, the listing for trading of the Company’s shares
which constitutes a performance condition that is not a market condition under the
Company’s option plan, was not expected. As a result, during the fourth quarter of 2016
the expenses recorded in regards with the plan commencing from 2014 were reversed.
The total effect of this reversal is approximately $17 million. In parallel, due to certain
provisions of the plan, a liability for compensation to the plan’s grantees was created which
the Company estimate in the total amount of approximately $12 million. Due to this liability
an expense was recorded in the fourth quarter of 2016. This liability was repaid during
2017.
E. Buy-Back of Shares:
Under the conditions precedent for the closing of the merger with CC (hereinafter - “the merger
transaction”), the Company’s Board of Directors resolved on August 7, 2011, to purchase
1,415,246 shares of the Company that were held by subsidiaries, which constituted all of the
Company’s shares held by subsidiaries, for consideration that is immaterial.
In view of the Company's commitment under the terms of the merger agreement, that on the
closing date there will be no dormant shares in the Company's capital (a commitment that
constituted a condition precedent for closing the merger transaction), on October 9, 2011, the
Company’s Board of Directors approved the cancellation of all the shares in Company capital that
were owned by the Company, i.e., 14,198,095 shares (hereinafter - “the dormant shares”), so that
following the cancellation, and at the report date, there are no dormant shares in the Company's
capital.
Following cancellation of the treasury shares, the cost of the Company’s shares held by the
Company and a subsidiary, totalling $245,548 thousand, is presented in capital reserves in the
statement of changes in equity, the balance of distributable earning according to the Company’s
financial statement as of December 31, 2018 is $1,590,580 thousand.
F. Dividend declared:
In December 2015, the Company’s general meeting of shareholders, the board and the audit
committee have resolved to distribute a dividend in the amount of $100 million. On December 7,
2015, the Company had distributed such dividend.
On September 15, 2016, after obtaining the approval of the Company’s general meeting of
shareholders, the board and the audit committee, the Company declared a dividend of $40.3
million. The dividend was distributed in 2016 - 2017.

Adama Agricultural Solutions Ltd. Notes to the Financial Statements as of December 31, 2018
69
Note 22 - Revenues
Composition:
For the year ended December 31
2 0 1 8 2 0 1 7 2 0 1 6
$ thousands
Sales outside of Israel 3,428,631 3,040,462 2,972,476
Sales in Israel 107,022 96,915 97,689
3,535,653 3,137,377 3,070,165
Note 23 - Cost of Sales
Composition:
For the year ended December 31
2 0 1 8 2 0 1 7 2 0 1 6
$ thousands
Materials and commercial inventory 055,9012, 1,607,834 1,493,098
Other production expenses 159,023 148,565 137,996
Salaries and related expenses 130,808 124,586 120,956
Outsourcing 91,438 85,643 85,986
Depreciation 65,930 63,267 61,745
2,503,100 2,029,895 1,899,781
Change in finished goods, commercial inventory
and work in process (107,868) (5,496) 137,077
2,395,232 2,024,399 2,036,858
Note 24 - Selling and Marketing Expenses
Composition:
For the year ended December 31
2 0 1 8 2 0 1 7 2 0 1 6
$ thousands
Salaries and related expenses 222,791 212,506 188,453
Depreciation and amortization 135,357 97,158 104,958
Commissions and delivery costs 93,302 88,920 83,267
Advertising and sales promotion 49,381 48,341 46,584
Registration 16,381 16,426 15,362
Professional services 11,454 9,945 12,459
Insurance 11,333 11,453 12,790
Royalties 2,235 3,200 2,496
Other 94,534 85,215 83,362
636,768 573,164 549,731

Adama Agricultural Solutions Ltd. Notes to the Financial Statements as of December 31, 2018
70
Note 25 - General and Administrative Expenses
Composition:
For the year ended December 31
2 0 1 8 2 0 1 7 2 0 1 6
$ thousands
Salaries and related expenses 54,079 64,831 48,463
Professional services 17,377 16,100 13,497
Depreciation and amortization 7,481 7,048 6,531
Bad and doubtful debts 6,922 8,765 12,960
Insurance, tax and fees 3,277 2,816 2,691
Other 29,646 33,092 27,523
118,782 132,652 111,665
Note 26 - Research and Development Expenses
Composition:
For the year ended December 31
2 0 1 8 2 0 1 7 2 0 1 6
$ thousands
Salaries and related expenses 21,818 20,070 17,069
Field tests 8,131 2,845 2,401
Professional services 7,940 7,579 4,790
Materials 901 431 303
Other 9,685 9,340 8,121
48,475 40,265 32,684

Adama Agricultural Solutions Ltd. Notes to the Financial Statements as of December 31, 2018
71
Note 27 - Financing Expenses (Income), Net
Composition:
For the year ended December 31
2 0 1 8 2 0 1 7 2 0 1 6
$ thousands
Financing Income:
Exchange rate differences, net 58,330 29,319 47,037
Net change in fair value of derivative 27,619 90,311 18,448
Interest income on investments from banks
and others 7,999 7,755 7,786
CPI income in respect of debentures 3,528 8,204 13,223
Interest income in respect of plan assets 497 596 587
Revaluation of put/call options for non-controlling
interests 195 1,594 2,556
Interest income on trade receivables 280 24,384 30,832
Other income 145 86 143
Financing income recorded in the income statement 98,593 162,249 120,612
Financing expenses:
Net change in fair value of derivative 80,087 42,219 85,308
Interest expenses on debentures 59,935 61,718 60,898
Exchange rate differences, net 37,983 116,848 38,582
Interest expenses on short and long-term loans 27,096 34,147 45,331
CPI expenses on debentures 16,714 11,779 9,970
Loss in respect of sale of trade receivables 11,892 7,037 8,780
Interest expenses on post-employment benefits 2,221 2,399 2,180
Revaluation of put/call options for non-controlling
interests 1,644 2,487 1,930
Loss from impairment of financial asset - - 5,348
Other expenses 1,187 4,632 2,635
Financing expenses recorded in the income statement 238,759 283,266 260,962 Financing expenses, net recorded in the income
statement 140,166 121,017 140,350

Adama Agricultural Solutions Ltd. Notes to the Financial Statements as of December 31, 2018
72
Note 28 - Transactions and Balances with Related and Interested Parties
A. Transactions with interested parties:
On July 2017, the Company became a wholly owned subsidiary of the ADAMA Ltd., which is
controlled by CNAC, from the China National Chemical Corporation group (hereinafter- “CC”).
Negligible transactions:
As determined by Regulation 41(a3)(1) of the Securities Regulations (Annual Financial Reports),
2010 (hereinafter - “the Financial Reports Regulations”), on March 10, 2009, the Company’s
Board of Directors adopted for the first time guidelines and regulations, for classifying transactions
of the Company or its subsidiary (hereinafter - “the Group”) with interested parties as negligible
transactions, and those are updated from time to time and approved in advance, annually, as
detailed below.
.
These guidelines and regulations, as shall be updated from time to time, will also function to
examine the extent of the scope of disclosure in the periodic report and in the prospectus
(including in a shelf offering reports) regarding transactions by the Company, corporations under
its controls and related companies, with a controlling shareholder, or transactions in which a
controlling shareholder has a personal interest in its approval, as provided in Regulation 22 of the
Securities Regulations (Periodic and Immediate Reports) 1970 (hereinafter - “the Periodic
Reports Regulations”) and in Regulation 54 of the Securities Regulations (Prospectus Details and
Prospectus Drafts - Structure and Form), 1969 (hereinafter - “the Prospectus Details
Regulations”), (the types of transactions determined by the Financial Reports Regulations, the
Periodic Reports Regulations and the Prospectus Details Regulations mentioned above,
hereinafter - “Interested Party Transactions.”
It is hereby clarified that according to the Company’s opinion, transactions executed by the
Company or companies in its Group with companies controlled by the government of China, which
are not part of the CC group, that are executed in the ordinary and ongoing course of the
Company’s business, do not constitute transactions in which the controlling shareholder in the
Company has a personal interest in and are therefore are excluded from these Regulations.
Types of transactions that might constitute negligible transactions:
During their regular course of business, the Company and its subsidiaries, especially in light of
the branched out holdings structure of the Group and its varied activities, implement or may
implement Interested Party Transactions, including engagements with companies under CNAC’s
control, as part of the business combination in China and the Company's commercial and
manufacturing activities in China (mainly with ADAMA Ltd.) as well as transactions aimed to
promote the Company's global commercial activity (including through engagements with
Syngenta), mainly in the form of registration, marketing, sales, purchase, distribution and agency
transactions of crop protection products, raw materials, active ingredients, intermediate materials,
mixtures and formulations used in the Company's products production process in the field of its
activity, contractual engagements with suppliers for the development, production and marketing
of ingredients and products in the field of the Company's activity, supply agreements for the
purchase or sale of active ingredients, intermediates, mixtures and formulations and/or end
products, registration support, distribution agreements, Data Compensation agreements,
information sharing agreements, Task Force agreements; as well as transactions for the grant
and/or receipt of various types of services (such as logistic services, engineering planning,
construction and infrastructure contracting, legal, financial and other headquarters services,
marketing and advertisement engagements and professional consultancy services in the
Company’s field of activity(, purchase or rental of goods, chattels or real estate (such as insurance
products and packaging). In most cases these are transactions that are not material to the

Adama Agricultural Solutions Ltd. Notes to the Financial Statements as of December 31, 2018
73
Note 28 - Transactions and Balances with Related and Interested Parties (cont’d)
A. Transactions with interested parties: (cont’d)
Types of transactions that might constitute negligible transactions: (cont’d)
Company, both in quantitative and in qualitative terms, and are usually made on the same terms
as business transactions with third parties.
Quantitative and qualitative criteria for classification of a transaction as negligible:
Accordingly an Interested Party Transaction that is not extraordinary (as the term is defined in
the Companies Law) shall be considered negligible transaction if it meets the following two-stage
test: (1) a qualitative test - if in terms of its character, essence and effect on the Company it is not
material to the Company and there are no special considerations arising from the circumstances
of the matter that attest to the material nature of the transaction; (2) quantitative test (which was
updated by the Company’s Board of Directors on December 5, 2017) - (a) for the purposes of
immediate reporting: the amount of each individual transaction shall not exceed 0.1% of the
Company's consolidated capital equity according to its latest financial statements, and in respect
of continuing transactions- the transaction shall be examined according to the annual transaction
amount or the total transaction amount for the entire period of the engagement, whichever is
lower; (b) for the purpose of periodic reports - if total amount of transactions of the same type (in
annual terms) (hereinafter - "transactions aggregate") is less than 0.5% of the Company's capital
equity according to its latest financial statements (the aggregate of transactions for
purchasing/selling products, raw materials, active ingredients and formulations will be examined
per each supplier/client separately).
With respect to multi-year transactions, the amount of the transaction for purposes of evaluating
negligibility will be calculated on an annual basis.
It should be noted that, even if the Interested Party Transaction conforms to the quantitative test
above, such transaction will not be considered negligible if qualitative considerations attest to its
material nature, whether due to its effect on the Company or due to the importance of its
disclosure to the investing public.
For the purpose of periodic reports, financial reports and prospectus (including shelf offering
reports), the negligibility of the aggregate of transactions will be examined on an annual basis
(that is while combining all transactions of the interest holder of the same type, and subject to the
aforementioned with regards to the method of examination of the aggregate of transactions for
the purchase /sale of products, raw materials, active ingredients and formulations).
If the Company does not have available information that enables an examination of the
classification of Interested Party Transactions as negligible transactions, then the cumulative total
of all the transactions of that type as a negligible transaction will be deemed a negligible
transaction, unless one of the following two conditions are met: (a) the transaction itself, as an
individual transaction, is not negligible; or (b) the cumulative total of the transactions is material
for the Company.
Separate transactions that are inter-dependent, so that in effect they are part of the same
transaction (for example, management of concentrated negotiations regarding the entirety of
transactions), will be examined as one transaction.
The total transactions classified as negligible by corporations held by the Company will be
deemed negligible also at the Company level. Transactions by corporations which are held by the
Company that were classified by said corporations as negligible, will be examined according to
the relevant criteria on the Company level.

Adama Agricultural Solutions Ltd. Notes to the Financial Statements as of December 31, 2018
74
Note 28 - Transactions and Balances with Related and Interested Parties (cont’d)
A. Transactions with interested parties: (cont’d)
Quantitative and qualitative criteria for classification of a transaction as negligible: (cont’d)
It is clarified that a transaction that is not in the Company’s ordinary course of business, or that is
not on market terms, or that may have a significant impact on the Company’s profits, assets or
liabilities, will not be classified as a negligible transaction.
Every year, the Audit Committee will survey the implementation methods of this regulation by the
Company, and will conduct a sample examination of the transactions classified as negligible
according to the regulations. During this sample examination, the Audit Committee will, among
other things, examine the pricing methods and other terms of the transaction, as the case may
be, and will check the effect of the transaction on the business status of the Company and the
results of its activities. The actions of the Audit Committee according to this clause, including the
said sample examination, its implementation method and the summary of its findings and
conclusions will be disclosed in the Company's periodic report. The Company’s Board of Directors
shall be updated regarding the procedure and its principles as part of the financial statements
approval process.
The Company's Audit Committee will examine the need to update the provisions of these
regulations from time to time taking into account the Interested Party Transactions made by the
Company and changes in the relevant statutes.
Based on the Company’s consolidated financial statements for 2018, the incomes and expenses
involved with interested party transactions, as stated, which were classified as negligible in
accordance with the provisions of this procedure, amounted to about $3,670 and $1,683
thousand, respectively.
Transactions included in Sections 270(4) and 270(4A) of the Companies Law, 1999 (“the
Companies Law”) (see Regulation 21A and 22 to Part D of the Periodic Report)
(1) Transactions included in Section 270(4A) to the Companies Law:
(a) On May 2018, the Company completed the sale process of Class B shares of
ADAMA Ltd., held by the Company, in accordance with the repurchase agreement
signed in September 2016 between the Company and ADAMA Ltd. (as well as its
amendment signed due to PRC regulatory requirements), for a total of HK $ 7.70 per
share and a total of HK $ 485 million (US $ 62 million).
(b) To facilitate the business integration and the operational merger within its framework,
between the Company and ADAMA Ltd., on December 28, 2017, the authorized
organs of the Company approved the engagement of the Company in services
agreements with the ADAMA Ltd. (as a transaction with a controlling shareholder),
according to which the Company shall provide ADAMA Ltd. the following services:
(a) senior management services, to be performed by officers of the Company, to an
extent of up to 20% of a full-time office; (b) headquarters services, including
operational, administrative, legal, commercial, finance and other services with
respect to the activities of ADAMA Ltd., including due to its being a listed company;
(c) a grant of a license to ADAMA ltd. for the use of the brand “ADAMA” (hereinafter
- "the Agreements").

Adama Agricultural Solutions Ltd. Notes to the Financial Statements as of December 31, 2018
75
Note 28 - Transactions and Balances with Related and Interested Parties (cont’d)
A. Transactions with interested parties: (cont’d)
Transactions included in Sections 270(4) and 270(4A) of the Companies Law, 1999 (“the
Companies Law”) (see Regulation 21A and 22 to Part D of the Periodic Report) (cont'd)
(1) Transactions included in Section 270(4A) to the Companies Law: (cont'd)
(b) (Cont'd)
The total consideration in respect of the agreements is not material. The first period
of the Agreements is from October 1, 2017 and will last for three years. The
Agreements will be renewed for additional periods of three years each. For the
fulfilment of the business combination, the competent organs of the Company
approved the adjustment to the volume of the aforementioned officers’ employment
as well as the grant of indemnification for the provision of the services to ADAMA
Ltd. and for double-tax exposure, if there will be one. It should be noted that the
senior officers who provide the senior management services are entitled to additional
remuneration paid by ADAMA Ltd. for their position as officeholders thereof, which
is paid in practice by the Company against repayment of and full indemnification from
ADAMA Ltd..
(c) On December 3, 2015, the shareholders of the Company (after the approval of the
board of directors from December 3, 2015, and the approval of the audit committee
from December 1, 2015) approved an engagement of the Company's subsidiary's in
China (indirectly) in a commercial collaboration agreement with several
agrochemical companies controlled by CNAC including ADAMA Ltd. (hereinafter -
"CNAC companies") under which the Company, by the Company’s subsidiary shall
gradually become the exclusive distributor of formalized agrochemical products of
CNAC companies in China. At the end of 2016, the above agreement was extended
to include active ingredients in addition to formalized products.
(d) On December 30, 2015 the shareholders of the Company (after the approval of the
board of directors dated December 30, 2015 and the audit committee from
December 29, 2015) approved the Company's joining as a party to the Cash pooling
agreement, the parties to which are: (1) CC; (2) Companies held directly and
indirectly by CC (hereinafter together with CC and the Company. "the Settlement
Companies"); (3) a foreign bank (hereinafter -the "Bank"), in addition the audit
committee, the board of directors and the shareholders approved an additional
agreement of the Company with CC, which regulates other aspects relating to the
Cash pooling agreement (hereinafter - "the Intercompany Agreement").
To secure the obligations of the Settlement Companies towards the bank, each of
the Settlement Companies created a first ranking charge on the rights in the
designated account in favour of the Bank. CC, extended simultaneously a guarantee
to secure the obligations of the Settlement Companies. In the event of a debt of any
of the Settlement Companies towards the Bank excluding an event of insolvency,
the Bank may be repaid according to the repayment preference as follows: (1) by
exercising the charge of the Settlement Company; (2) by exercising CC guarantee;
(3) by exercising the charge of another Settlement Company. In the event of
insolvency, the provisions of the above repayment preference are not applicable.
Under the Intercompany Agreement, CC committed that upon an insolvency event,
it will do its utmost efforts so that amounts are not offset from the Company's
accounts or that the charge is not exercised on the Company's accounts only after
the bank or the Settlement Companies (as the case may be) exhausted all other

Adama Agricultural Solutions Ltd. Notes to the Financial Statements as of December 31, 2018
76
Note 28 - Transactions and Balances with Related and Interested Parties (cont’d)
A. Transactions with interested parties: (cont’d)
Transactions included in Sections 270(4) and 270(4A) of the Companies Law, 1999 (“the
Companies Law”) (see Regulation 21A and 22 to Part D of the Periodic Report) (cont'd)
(1) Transactions included in Section 270(4A) to the Companies Law: (cont'd)
(d) (Cont’d)
sources according to the Cash pooling agreement including CC guarantee and the
charges extended by all of the Settlement Companies.
Simultaneously with entering into the Cash pooling agreement, CC and the
Company entered into an Intercompany Agreement under which mechanisms were
set to assure that the Company's transactions in the account and activities relating
to the Company are approved in advance, the Company was granted information
rights regarding the Settlement Companies and their financial position and CC
commitment was granted to fully indemnify the Company if any amounts are offset
from its account or if the charge is exercised on its account which is subject to the
settlement.
The Company's audit committee, board of directors and shareholders determined an
immaterial amount for the Company as the maximum amount to be deposited in the
Company's accounts that are subject to the settlement (hereinafter - the "Maximum
Amount"). The Maximum Amount may be changed by a resolution of the Company's
competent organs.
(e) In the context of developing its business and to facilitate the obtaining by CNAC, part
of CC group, of the regulatory approvals for the acquisition of Syngenta AG
(hereinafter -“Syngenta”), the Company agreed with CC and Syngenta to effect the
divestment of a number of its products, while receiving products of similar nature and
economic value from Syngenta, including the bearing, by Syngenta, of taxes and
expenses which the Company will be charged with, due to the receiving of the
products.
Respectively, During 2017, the Company received certain Syngenta products and
rights in the U.S, in exchange for the Company's divestiture of certain products there
to Amvac Chemical Corporation. The consideration received for the sold products
and the cost of the acquired assets in the US are not material.
On March 16, 2018, a transaction of selling registration assets in few European
countries to Nufarm Limited (hereinafter - “Nufarm”) was completed, while the
Company maintained its ability to continue to sell such products in other countries
outside Europe, and in some cases within Europe as well, In addition to the signing
on supply and formulation agreements for the period of two years. The consideration
received from Nufarm for the assets’ sale and for the supply and formulation
agreements (which recorded as deferred income of $15 million) amounts to
approximately $395 million. the capital gain generated amounts to approximately
$310 million. Tax expenses for the capital gain were amount to approximately $69
million.
Concurrently with the above assets sale in Europe, registration assets and some
marketing rights acquisition agreement, in Europe, from Syngenta, was concluded
by the Company. The acquired intangible assets cost amounts to $326 million.
As a result of those transactions, addition to intangible assets amounts to
approximately $336 million, recorded as other property.
Sum of approximately $318 million for registration assets and marketing rights
acquisition, recorded as assets under products acquisition, and is amortized over

Adama Agricultural Solutions Ltd. Notes to the Financial Statements as of December 31, 2018
77
Note 28 - Transactions and Balances with Related and Interested Parties (cont’d)
A. Transactions with interested parties: (cont’d)
Transactions included in Sections 270(4) and 270(4A) of the Companies Law, 1999 (“the
Companies Law”) (see Regulation 21A and 22 to Part D of the Periodic Report) (cont'd)
(1) Transactions included in Section 270(4A) to the Companies Law: (cont'd)
(e) (Cont’d)
the economic life of the assets, ranging from 1 to 14 years (and mainly between 7
and 11 years).
Sum of $18 million recorded as non-competition and amortized during the non-
competition period of 5 years or during the assets economic life period in case it is
shorter than 5 years.
The valuation method for the consideration attribution of the acquired assets is DCF.
(2) Transactions not included in Sections 270(4A) of the Companies Law and that are
not negligible:
(a) During 2018 and in the ordinary course of business, the Company acquired from
ADAMA Ltd. And/or other companies in the CC group raw materials and/or products
on market terms and in cumulative amounts that are not significant to the Company.
Starting from the second half of 2016, the Company purchases raw materials and/or
products under a supply agreement for export that was approved for 5 years under
which ADAMA Ltd. and Jiangsu Anpon Electrochemical Co., Ltd, from the CC group
(hereinafter "Anpon") will supply all the products that the Company purchases in
China for export, all under market terms and in amounts which are not material for
the Company. The agreement was classified by the audit committee as a non-
extraordinary transaction.
In January 2018, the Company entered into an agreement with Anpon for the
production and supply, lease and management of the formulation facility built by the
Company in Huai'an. The engagement in the agreement was classified by the
Company's Audit Committee as a non-extraordinary transaction.
(b) During 2018, the Company and Syngenta entered into various transactions such as
agreements for the purchase or sale of raw materials, products and/or data, in the
ordinary course of business, at market terms and in cumulative amounts that are not
material to the Company. Those transactions were classified by the Company's Audit
Committee as non-extraordinary transactions.
Provided below are details of transactions with related and interested parties:
For the year ended December 31
2 0 1 8 2 0 1 7 2 0 1 6
$ thousands
Interested Parties
Revenues 81,540 24,062 1,314
Expenses 356,510 110,194 38,508
Equity-Accounted Investee
Companies*
Revenues 23,865 26,668 24,945
Expenses 1,202 752 1,284

Adama Agricultural Solutions Ltd. Notes to the Financial Statements as of December 31, 2018
78
Note 28 - Transactions and Balances with Related and Interested Parties (cont’d)
B. Benefits to interested parties:
For the year ended December 31
2 0 1 8 2 0 1 7 2 0 1 6
$ thousands
Salaries and related benefits to interested
party employed by the Group 2,409 3,700 3,401
Number of interested parties 1 1 1
Share based payments to interested party
employed by the Group (*) 230 990 (764)
Number of interested parties 1 1 1
Fees to other directors 217 266 224
Number of directors 3 3 4
(*) For details regarding the share-based payments net of liability for compensation in 2016,
see Note 21D(2).
C. Balances with related and interested parties:
December 31
2 0 1 8 2 0 1 7
$ thousands
Interested Parties
Trade and other receivables 26,497 74,099
Trade and other payables 83,579 26,835
Equity-Accounted Investee Companies
Trade receivables 4,953 5,159
Loans granted 1,099 1,150
Trade payables 62 49

Adama Agricultural Solutions Ltd. Notes to the Financial Statements as of December 31, 2018
79
Note 28 - Transactions and Balances with Related and Interested Parties (cont’d)
D. Benefits to a group of officers and senior management in Israel and abroad:
In addition to salary, senior executives in the Group are entitled to benefits beyond regular salary.
These benefits include: annual bonuses, long-term incentive, social and salary-related benefits
and options granted.
The benefits attributed to the key management personnel are comprised as follows:
For the year ended December 31
2 0 1 8 2 0 1 7 2 0 1 6
$ thousands
Direct salary 2,672 3,011 2,892
Short-term bonuses and long-term incentive (*) 5,035 7,628 6,914
Post-employment benefits and others 1,594 1,272 1,138
Share-based payments (**) 687 3,178 (1,604)
9,988 15,089 9,340
(*) The bonuses are based on the operating results of the Group.
(**) For details regarding the share-based payments net of liability for compensation in 2016,
see Note 21D(2).
Note 29 - Financial Instruments
A. General:
The Group has extensive international operations, and, therefore, it is exposed to credit risks,
liquidity risks and market risks (including currency risk, interest risk and other price risk). In order
to reduce the exposure to these risks, the Group uses financial derivatives instruments, including
forward transactions, swaps and options (hereinafter - “derivatives”).
Transactions in derivatives are undertaken with major financial institutions in and outside of Israel
and, therefore, in the opinion of Group Management the credit risk in respect thereof is low.
This note provides information on the Group’s exposure to each of the above risks, the Group’s
objectives, policies and processes regarding the measurement and management of the risk.
Additional quantitative disclosure is included throughout the consolidated financial statements.
The Board of Directors has overall responsibility for establishing and monitoring the framework of
the Group's risk management policy. The Finance Committee is responsible for establishing and
monitoring the Group's actual risk management policy. The Chief Financial Officer reports to the
Finance Committee on a regular basis regarding these risks.
The Group’s risk management policy are established to identify and analyze the risks facing the
Group, to set appropriate risk limits and controls and monitoring of the risks and to monitor risks
and adherence to limits. The policy and methods for managing the risks are reviewed regularly,
in order to reflect changes in market conditions and the Group's activities. The Group, through
training, and management standards and procedures, aims to develop a disciplined and
constructive control environment in which all the employees understand their roles and
obligations.

Adama Agricultural Solutions Ltd. Notes to the Financial Statements as of December 31, 2018
80
Note 29 - Financial Instruments (cont’d)
B. Credit risk:
Credit risk is the risk of financial loss to the Group if a customer or counterparty to a financial
instrument fails to meet its contractual obligations, and derives mainly from trade receivables and
other receivables as well as from cash and deposits in financial institutions.
The Group mainly considers the following list of information in assessing changes in credit risk:
• An actual or expected significant deterioration in the financial instrument’s external (if
available) or internal credit rating;
• Significant deterioration in external market indicators of credit risk for a particular financial
instrument, e.g. a significant increase in the credit spread, the credit default swap prices for
the debtor, or the length of time or the extent to which the fair value of a financial asset has
been less than its amortized cost;
• Existing or forecast adverse changes in business, financial or economic conditions that are
expected to cause a significant decrease in the debtor’s ability to meet its debt obligations;
• An actual or expected significant deterioration in the operating results of the debtor;
Trade and other receivables
The Group’s revenues are derived from a large number of widely dispersed customers in many
countries. Customers include multi-national companies and manufacturing companies, as well as
distributors, agriculturists, agents and agrochemical manufacturers who purchase the products
either as finished goods or as intermediate products for their own requirements.
The Company entered into an agreement for the sale of trade receivables in a securitization
transactions. For details - see Note 4.
In April 2017, a two-year agreement with an international insurance company was renewed. The
amount of the insurance coverage was fixed at $150 million cumulative per year. The
indemnification is limited to about 90% of the debt.
The Group’s exposure to credit risk is influenced mainly by the personal characterization of each
customer, and by the demographic characterization of the customer’s base, including the risk of
insolvency of the industry and geographic region in which the customer operates. During 2018,
Approximately 1.6% (2017 - 1.5% and 2016 - 1.4%) of the Group’s revenues derive from sales to
an individual customer.
Company management has prescribed a credit policy, whereby the Company performs current
ongoing credit evaluations of existing and new customers, and every new customer is examined
thoroughly regarding the quality of his credit, before offering him the Group’s customary shipping
and payment terms. The examination made by the Group includes an outside credit rating, if any,
and in many cases, receipt of documents from an insurance company. A credit limit is prescribed
for each customer, setting the maximum open amount of the trade receivable balance. These
limits are examined annually. Customers that do not meet the Group’s criteria for credit quality
may do business with the Group on the basis of a prepayment or against furnishing of appropriate
collateral.
Most of the Group’s customers have been doing business with it for many years. In monitoring
customer credit risk, the customers were grouped according to a characterization of their credit,
based on geographical location, industry, aging of receivables, maturity, and existence of past
financial difficulties. Customers defined as “high risk” are classified to the restricted customer list
and are supervised by management. In certain countries, mainly, Brazil, customers are required
to provide property collaterals (such as agricultural lands and equipment) against execution of the
sales, the value of which is examined on a current ongoing basis by the Company. In these
countries, in a case of a doubtful debt, the Company records a provision for the amount of the
debt less the value of the collaterals provided and acts to realize the collaterals.

Adama Agricultural Solutions Ltd. Notes to the Financial Statements as of December 31, 2018
81
Note 29 - Financial Instruments (cont'd)
B. Credit risk: (cont'd)
Trade and other receivables (cont'd)
The Group closely monitors the economic situation in Eastern Europe and South America and, if
necessary, takes steps to limit its exposure to customers in countries where there is significant
economic instability.
The Group recognizes an impairment provision, which reflects its assessment regarding credit risks of account receivables, other receivables and investments on a lifetime expected credit loss basis.
Cash and deposits in banks
The Company holds cash and deposits in banks with a high credit rating. These banks are also
required to comply with capital adequacy or maintenance of a level of security based on different
situations.
Guarantees
The Company’s policy is to provide financial guarantees only to investee companies.
(1) Exposure to credit risk
The carrying amount of financial assets represents the maximum credit exposure
notwithstanding the carrying amount of security.
The maximum exposure to credit risk for trade receivables at the reporting date, according
to geographic regions was as follows:
December 31
2 0 1 8 2 0 1 7
$ thousands
Israel 8,065 8,271
Latin America 472,546 371,281
Europe 195,464 154,406
North America 83,276 58,277
Asia Pacific 55,652 51,319
India, Middle East and Africa 126,451 143,781
941,454 787,335
The Group's most significant customer is an agricultural corporation that constitutes
$14,234 thousand out of the total carrying value of trade receivables as of December 31,
2018 (as of December 31, 2017 - $15,264 thousand).

Adama Agricultural Solutions Ltd. Notes to the Financial Statements as of December 31, 2018
82
Note 29 - Financial Instruments (cont'd)
B. Credit risk: (cont'd)
(2) Aging of receivables and provision for credit losses:
Presented below is the aging of trade receivables:
December 31
2 0 1 8 2 0 1 7
$ thousands
Not past due 853,066 709,757
Past due by less than 90 days 68,898 49,105
Past due by more than 90 days 78,376 82,612
1,000,340 841,474
The company measure the provision for credit losses on a collective group basis, where
receivables share similar credit risk characteristics based on geographical locations. The
examination for expected credit losses is performed using model including aging analysis
and historical loss experiences, and adjusted by the observable factors reflecting current
and expected future economic conditions.
When credit risk on a receivable has increased significantly since initial recognition, the
group records specific provision or general provision, which is determined for groups of
similar assets in countries in which there are large number of customers with immaterial
balances.
The movement in the provision for credit losses during the year was as follows:
December 31
2 0 1 8 2 0 1 7
$ thousands
Balance as of January 1 54,139 45,607
First time implementation effect of IFRS 9 5,447 -
Additions during the year 6,922 8,765
Write-off of bad debts (1,351) (1,243)
Exchange rate differences (6,271) 1,010
Balance as of December 31 58,886 54,139
C. Liquidity risk:
Liquidity risk is the risk that the Group will encounter difficulty in meeting its financial obligation
when they come due. The Group's approach to managing its liquidity risk is to assure, to the
extent possible, an adequate degree of liquidity for meeting its obligations timely, under ordinary
conditions and under pressure conditions, without sustaining unwanted losses or hurting its
reputation.
The cash-flow forecast is determined both at the level of the various entities as well as of the
consolidated level. The Company examines the current forecasts of its liquidity requirements in
order to ascertain that there is sufficient cash for the operating needs, including the amounts
required in order to comply with the financial liabilities, while taking strict care that at all times
there will be unused credit frameworks so that the Company will not exceed the credit frameworks
granted to it and the financial covenants with which it is required to comply with. These forecasts
take into consideration matters such as the Company’s plans to use debt for financing its
activities, compliance with required financial covenants, compliance with certain liquidity ratios
and compliance with external requirements such as laws or regulation.
The surplus cash held by the Group companies, which is not required for financing the current
ongoing operations, is invested in short-term interest-bearing investment channels.

Adama Agricultural Solutions Ltd. Notes to the Financial Statements as of December 31, 2018
83
Note 29 - Financial Instruments (cont'd)
C. Liquidity risk: (cont'd)
Presented below are the contractual maturities of the financial liabilities at undiscounted amounts, including estimated interest payments:
As of December 31, 2018
Carrying amount
Contractual cash flow First year Second year Third year Fourth year
Fifth year and above
$ thousands
Non-derivative financial liabilities
Credit from banks 925 945 945 - - - -
Short-term loans from banks 79,617 82,244 82,244 - - - -
Trade payables 704,186 704,186 704,186 - - - -
Other payables (2) 460,256 460,256 460,256 - - - -
Debentures (1) 1,114,509 1,702,612 57,878 123,986 120,581 117,176 1,282,991
Long-term loans from banks (1) 67,818 74,270 37,478 30,577 6,215 - -
Other long-term liabilities (1)(2) 4,219 5,262 283 264 243 224 4,248
Derivative financial liabilities:
Foreign currency derivatives 211,368 211,368 211,366 2 - - -
CPI/shekel forward transactions 149 149 149 - - - -
2,643,047 3,241,292 1,554,785 154,829 127,039 117,400 1,287,239
(1) Including current maturities
(2) Including put options to holders of non-controlling interests.
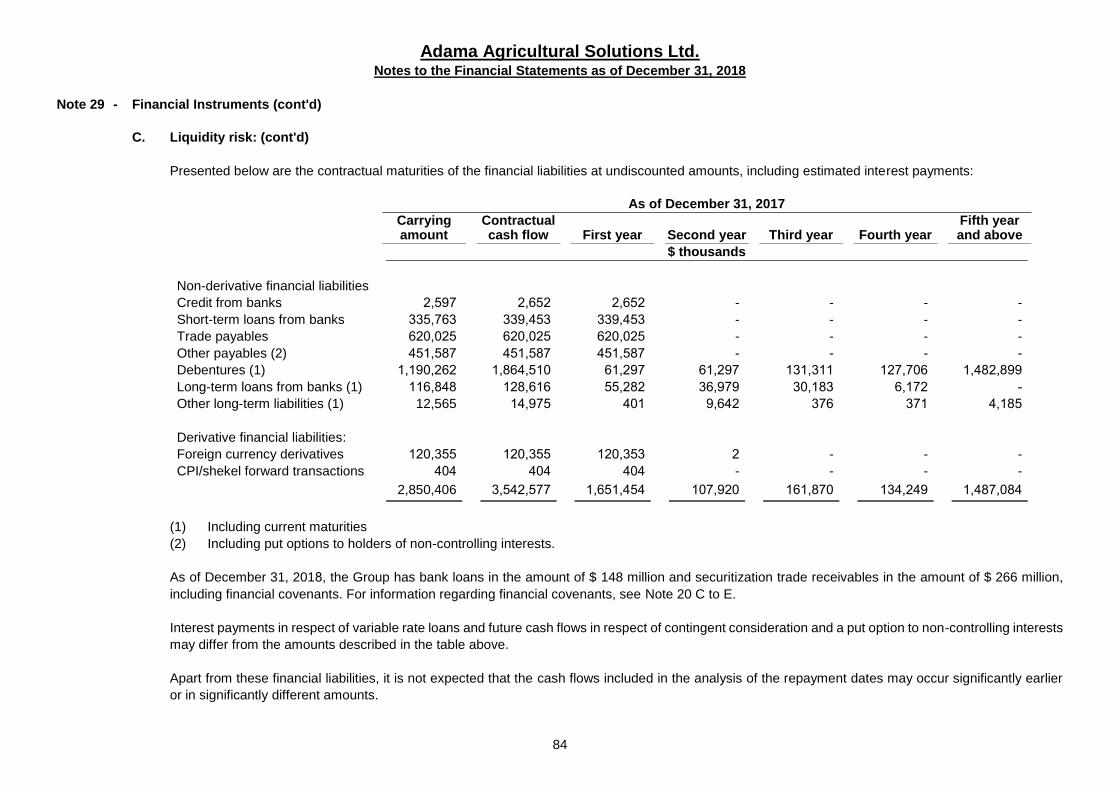
Adama Agricultural Solutions Ltd. Notes to the Financial Statements as of December 31, 2018
84
Note 29 - Financial Instruments (cont'd)
C. Liquidity risk: (cont'd)
Presented below are the contractual maturities of the financial liabilities at undiscounted amounts, including estimated interest payments:
As of December 31, 2017
Carrying amount
Contractual cash flow First year Second year Third year Fourth year
Fifth year and above
$ thousands
Non-derivative financial liabilities
Credit from banks 2,597 2,652 2,652 - - - -
Short-term loans from banks 335,763 339,453 339,453 - - - -
Trade payables 620,025 620,025 620,025 - - - -
Other payables (2) 451,587 451,587 451,587 - - - -
Debentures (1) 1,190,262 1,864,510 61,297 61,297 131,311 127,706 1,482,899
Long-term loans from banks (1) 116,848 128,616 55,282 36,979 30,183 6,172 -
Other long-term liabilities (1) 12,565 14,975 401 9,642 376 371 4,185
Derivative financial liabilities:
Foreign currency derivatives 120,355 120,355 120,353 2 - - -
CPI/shekel forward transactions 404 404 404 - - - -
2,850,406 3,542,577 1,651,454 107,920 161,870 134,249 1,487,084
(1) Including current maturities
(2) Including put options to holders of non-controlling interests.
As of December 31, 2018, the Group has bank loans in the amount of $ 148 million and securitization trade receivables in the amount of $ 266 million,
including financial covenants. For information regarding financial covenants, see Note 20 C to E.
Interest payments in respect of variable rate loans and future cash flows in respect of contingent consideration and a put option to non-controlling interests
may differ from the amounts described in the table above.
Apart from these financial liabilities, it is not expected that the cash flows included in the analysis of the repayment dates may occur significantly earlier
or in significantly different amounts.

Adama Agricultural Solutions Ltd. Notes to the Financial Statements as of December 31, 2018
85
Note 29 - Financial Instruments (cont'd)
D. Market risks:
Market risk is the risk that changes in market prices, such as foreign exchange rates, CPI, interest
rates and prices of capital instruments, will affect the Group’s revenues or the value of its holdings
in its financial instruments. The objective of market risk management is to manage and monitor
the exposure to market risks within acceptable parameters, while optimizing the return.
During the ordinary course of business, the Group purchases and sells derivatives and assumes
financial liabilities for the purpose of managing market risks. All such transactions are carried out
within the guidelines set by the Finance Committee.
(1) CPI/Linkage and foreign currency risks
Currency risk
The Group is exposed to currency risk from its sales, purchases, expenses and loans
denominated in currencies that differ from the Group’s functional currency. The main
exposure is in Euro, Brazilian real and in NIS. In addition, there are smaller exposures to
various currencies such as the British pound, Polish zloty, Australian dollar and Indian
rupee, Argentine peso, Canadian dollar, South African Rand and Ukraine Hryunia.
The Group uses foreign currency derivatives - forward transactions and currency options -
in order to hedge the risk that the Dollar cash flows, which derive from existing assets and
liabilities and anticipated sales and costs, may be affected by exchange rate fluctuations.
The Group hedged a part of the estimated currency exposure for projected sales and
purchases during the subsequent year. Likewise, the Group hedges most of its financial
balances denominated in a non-Dollar currency. The Group uses foreign currency
derivatives to hedge its currency risk, mostly with maturity dates of less than one year from
the reporting date.
The Company’s debentures are linked to the CPI and, therefore, an increase in the CPI, as
well as changes in the NIS exchange rate, could cause significant exposure with respect
to the Group's functional currency - the U.S. dollar. As of the approval date of the financial
statements, the Group had hedged most of its exposure deriving from issuance of the
debentures, in options and forward contracts.

Adama Agricultural Solutions Ltd. Notes to the Financial Statements as of December 31, 2017
86
Note 29 - Financial Instruments (cont'd)
D. Market risks: (cont'd)
(1) CPI/linkage and foreign currency risks (cont'd)
(A) The Group’s exposure to CPI/linkage and foreign currency risk, except in respect of derivative financial instruments (see hereunder) is
as follows:
As of December 31, 2018
Denominated in or linked to
the Dollar In Euro
In Brazilian
real CPI-linked
NIS Unlinked
NIS
Denominated in or linked to other foreign
currency Non-monetary
items Total
$ thousands
Assets -
Cash and cash equivalents 305,967 98,386 15,239 - 16,069 151,652 - 587,313
Short-term investments 1,001 1,099 2,360 - - 2,256 - 6,716
Trade receivables 456,603 122,489 162,223 - 13,939 253,918 - 1,009,172
Financial and other assets
including derivatives* 109,819 9,355 12,751 784 23,275 43,679 49,952 249,615
Current tax assets 6,120 9,518 - - 271 4,840 - 20,749
Inventories - - - - - - 1,322,641 1,322,641
Investments, loans and other
long-term debt balances 3,332 316 39,899 - - 1,252 37,377 82,176
Deferred tax assets - - - - - - 96,852 96,852
Fixed assets - - - - - - 856,192 856,192
Intangible assets - - - - - - 901,923 901,923
882,842 241,163 232,472 784 53,554 457,597 3,264,937 5,133,349

Adama Agricultural Solutions Ltd. Notes to the Financial Statements as of December 31, 2017
87
Note 29 - Financial Instruments (cont'd) D. Market risks: (cont'd)
(1) CPI/linkage and foreign currency risks (cont'd)
(A) The Group’s exposure to CPI/linkage and foreign currency risk, except in respect of derivative financial instruments (see hereunder) is
as follows: (cont'd)
As of December 31, 2018
Denominated in or linked to
the Dollar In Euro
In Brazilian
real CPI-linked
NIS Unlinked
NIS
Denominated in or linked to other foreign
currency Non-monetary
items Total
$ thousands
Liabilities -
Loans and credit from banks
(not including current
maturities) 6,019 - - - - 74,523 - 80,542
Trade payables 444,083 90,876 35,577 - 106,906 26,744 - 704,186
Other payables* 320,427 63,964 31,386 5,054 87,389 108,064 41,629 657,913
Current tax liabilities 2,922 8,290 2,903 22,315 - 13,987 - 50,417
Put options to holders of non-
controlling interests 52,353 6,579 - - - - - 58,932
Loans from banks (including
current maturities) 67,565 - 108 - - 145 - 67,818
Debentures - - - 1,114,509 - - - 1,114,509
Other long-term liabilities
(including current
maturities) 307 426 10,299 - 175 3,259 7,024 21,490
Deferred tax liabilities - - - - - - 41,333 41,333
Employee benefits 8,710 3,059 - - 52,361 5,840 - 69,970
902,386 173,194 80,273 1,141,878 246,831 232,562 89,986 2,867,110
(*) Regarding the group’s exposure to linkage and currency risks of financial derivatives - see Note 29D(1)(b) below.
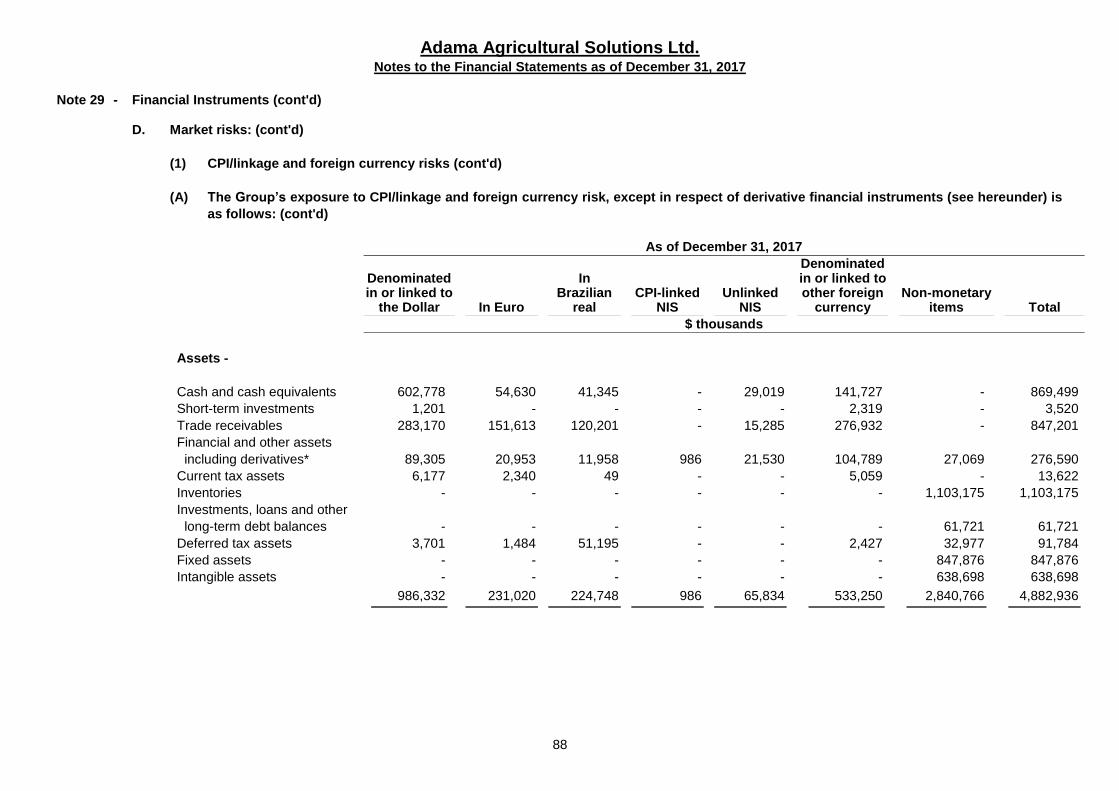
Adama Agricultural Solutions Ltd. Notes to the Financial Statements as of December 31, 2017
88
Note 29 - Financial Instruments (cont'd) D. Market risks: (cont'd)
(1) CPI/linkage and foreign currency risks (cont'd)
(A) The Group’s exposure to CPI/linkage and foreign currency risk, except in respect of derivative financial instruments (see hereunder) is
as follows: (cont'd)
As of December 31, 2017
Denominated in or linked to
the Dollar In Euro
In Brazilian
real CPI-linked
NIS Unlinked
NIS
Denominated in or linked to other foreign
currency Non-monetary
items Total
$ thousands
Assets -
Cash and cash equivalents 602,778 54,630 41,345 - 29,019 141,727 - 869,499
Short-term investments 1,201 - - - - 2,319 - 3,520
Trade receivables 283,170 151,613 120,201 - 15,285 276,932 - 847,201
Financial and other assets
including derivatives* 89,305 20,953 11,958 986 21,530 104,789 27,069 276,590
Current tax assets 6,177 2,340 49 - - 5,059 - 13,622
Inventories - - - - - - 1,103,175 1,103,175
Investments, loans and other
long-term debt balances - - - - - - 61,721 61,721
Deferred tax assets 3,701 1,484 51,195 - - 2,427 32,977 91,784
Fixed assets - - - - - - 847,876 847,876
Intangible assets - - - - - - 638,698 638,698
986,332 231,020 224,748 986 65,834 533,250 2,840,766 4,882,936
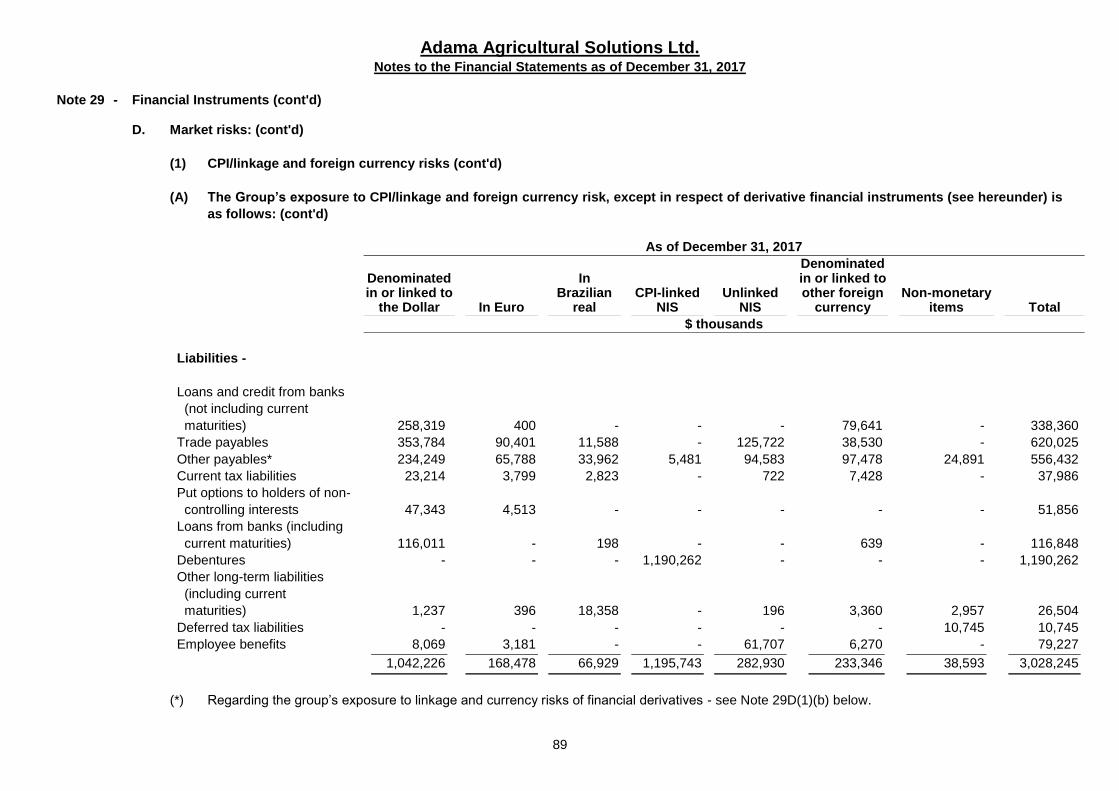
Adama Agricultural Solutions Ltd. Notes to the Financial Statements as of December 31, 2017
89
Note 29 - Financial Instruments (cont'd) D. Market risks: (cont'd)
(1) CPI/linkage and foreign currency risks (cont'd)
(A) The Group’s exposure to CPI/linkage and foreign currency risk, except in respect of derivative financial instruments (see hereunder) is
as follows: (cont'd)
As of December 31, 2017
Denominated in or linked to
the Dollar In Euro
In Brazilian
real CPI-linked
NIS Unlinked
NIS
Denominated in or linked to other foreign
currency Non-monetary
items Total
$ thousands
Liabilities -
Loans and credit from banks
(not including current
maturities) 258,319 400 - - - 79,641 - 338,360
Trade payables 353,784 90,401 11,588 - 125,722 38,530 - 620,025
Other payables* 234,249 65,788 33,962 5,481 94,583 97,478 24,891 556,432
Current tax liabilities 23,214 3,799 2,823 - 722 7,428 - 37,986
Put options to holders of non-
controlling interests 47,343 4,513 - - - - - 51,856
Loans from banks (including
current maturities) 116,011 - 198 - - 639 - 116,848
Debentures - - - 1,190,262 - - - 1,190,262
Other long-term liabilities
(including current
maturities) 1,237 396 18,358 - 196 3,360 2,957 26,504
Deferred tax liabilities - - - - - - 10,745 10,745
Employee benefits 8,069 3,181 - - 61,707 6,270 - 79,227
1,042,226 168,478 66,929 1,195,743 282,930 233,346 38,593 3,028,245
(*) Regarding the group’s exposure to linkage and currency risks of financial derivatives - see Note 29D(1)(b) below.
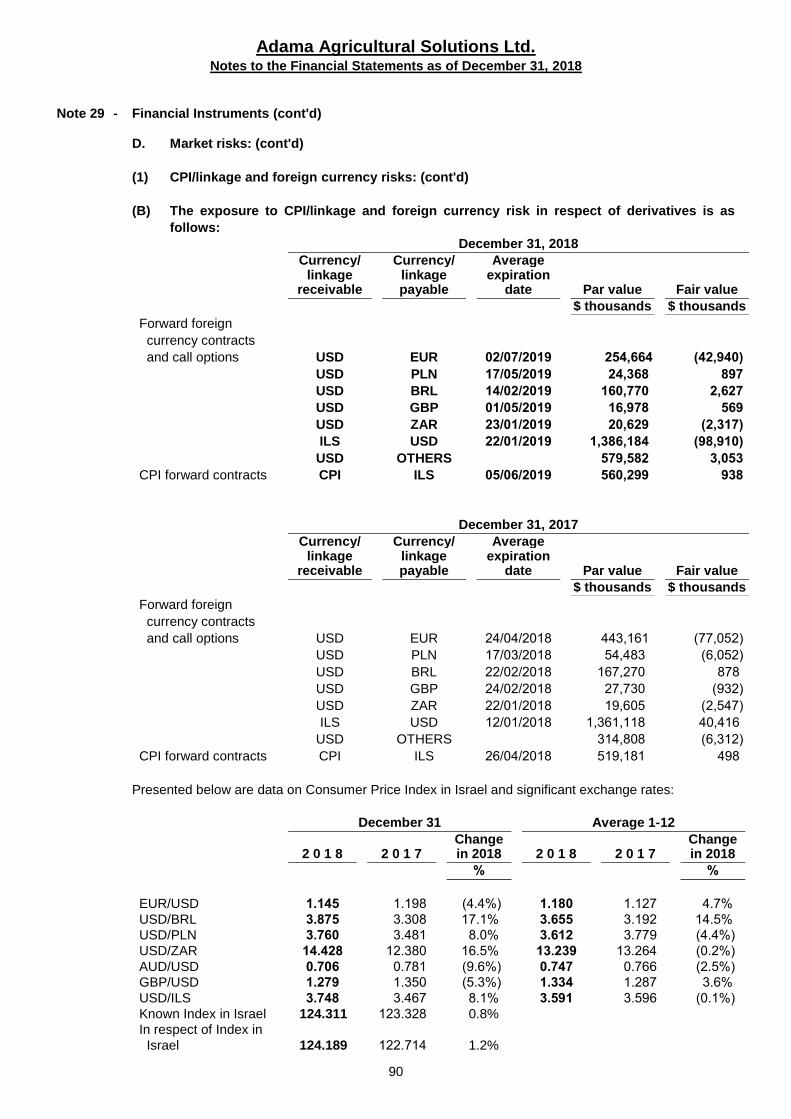
Adama Agricultural Solutions Ltd. Notes to the Financial Statements as of December 31, 2018
90
Note 29 - Financial Instruments (cont'd)
D. Market risks: (cont'd)
(1) CPI/linkage and foreign currency risks: (cont'd)
(B) The exposure to CPI/linkage and foreign currency risk in respect of derivatives is as
follows:
December 31, 2018
Currency/ Currency/ Average linkage linkage expiration receivable payable date Par value Fair value
$ thousands $ thousands
Forward foreign
currency contracts
and call options USD EUR 02/07/2019 254,664 (42,940)
USD PLN 17/05/2019 24,368 897
USD BRL 14/02/2019 160,770 2,627
USD GBP 01/05/2019 16,978 569
USD ZAR 23/01/2019 20,629 (2,317)
ILS USD 22/01/2019 1,386,184 (98,910)
USD OTHERS 579,582 3,053
CPI forward contracts CPI ILS 05/06/2019 560,299 938
December 31, 2017
Currency/ Currency/ Average linkage linkage expiration receivable payable date Par value Fair value
$ thousands $ thousands
Forward foreign
currency contracts
and call options USD EUR 24/04/2018 443,161 (77,052)
USD PLN 17/03/2018 54,483 (6,052)
USD BRL 22/02/2018 167,270 878
USD GBP 24/02/2018 27,730 (932)
USD ZAR 22/01/2018 19,605 (2,547)
ILS USD 12/01/2018 1,361,118 40,416
USD OTHERS 314,808 (6,312)
CPI forward contracts CPI ILS 26/04/2018 519,181 498
Presented below are data on Consumer Price Index in Israel and significant exchange rates:
December 31 Average 1-12
2 0 1 8 2 0 1 7
Change in 2018 2 0 1 8 2 0 1 7
Change in 2018
% %
EUR/USD 1.145 1.198 )4.4%( 1.180 1.127 4.7%
USD/BRL 3.875 3.308 17.1% 3.655 3.192 14.5%
USD/PLN 3.760 3.481 8.0% 3.612 3.779 )4.4%(
USD/ZAR 14.428 12.380 16.5% 13.239 13.264 )0.2%(
AUD/USD 0.706 0.781 )9.6%( 0.747 0.766 )2.5%(
GBP/USD 1.279 1.350 )5.3%( 1.334 1.287 3.6%
USD/ILS 3.748 3.467 8.1% 3.591 3.596 )0.1%(
Known Index in Israel 124.311 123.328 0.8%
In respect of Index in
Israel 124.189 122.714 1.2%

Adama Agricultural Solutions Ltd. Notes to the Financial Statements as of December 31, 2018
91
Note 29 - Financial Instruments (cont'd)
D. Market risks: (cont'd)
(1) CPI/linkage and foreign currency risks: (cont'd)
(C) Sensitivity analysis:
The appreciation or depreciation of the Dollar against the following currencies as of December 31
and the increase or decrease in the CPI would increase (decrease) the equity and profit or loss
by the amounts presented below. This analysis assumes that all the remaining variables, among
others interest rates, remained constant. The analysis for 2017 was done on the same basis.
December 31, 2018
Decrease of 5% Increase of 5%
Equity Profit (loss) Equity Profit (loss)
$ thousand $ thousand $ thousand $ thousand
New Israeli shekel (509,6) (5,704) 7,605 6,800
British pound (318) (83) 318 83
Euro (13,532) (662) 17,065 662
Brazilian real 915 563 (151) (347)
Polish zloty 182 1,251 282 (787)
South African Rand 137 137 (137) (137)
Consumer Price Index in Israel 31,000 31,000 (31,000) (31,000)
December 31, 2017
Decrease of 5% Increase of 5%
Equity Profit (loss) Equity Profit (loss)
$ thousand $ thousand $ thousand $ thousand
New Israeli shekel (4,887) (4,925) 4,873 4,911
British pound 694 (137) (694) 137
Euro 29,844 5,342 (29,291) (4,593)
Brazilian real 33 499 (33) (499)
Polish zloty (1,796) (293) 1,796 293
South African Rand 64 174 (64) (174)
Consumer Price Index in Israel 42,447 42,447 (42,447) (42,447)
(2) Interest rate risks
The Group has exposure to changes in the Libor interest rate on the dollar since the Group has
U.S. dollar obligations which bear variable Libor interest. The Company prepares a quarterly
summary of exposure to a change in the Libor interest rate. As at the approval date of the financial
statements, the Company had not hedged this exposure.
The Group does not enter into commodity contracts for the purpose of meeting the estimated
usage and sales needs; except for barter contracts with customers, these contracts are not settled
on a net basis.

Adama Agricultural Solutions Ltd. Notes to the Financial Statements as of December 31, 2018
92
Note 29 - Financial Instruments (cont'd)
D. Market risks: (cont'd)
(2) Interest rate risk: (cont’d)
(a) Type of interest:
The interest rate profile of the Group’s interest-bearing financial instruments was as
follows:
December 31
2 0 1 8 2 0 1 7
Carrying Carrying
amount amount
$ thousands
Fixed-rate instruments - unlinked to the CPI
Financial assets 1,260 1,313
Financial liabilities (3,858) (3,541)
(2,598) (2,228)
Fixed-rate instruments - linked to the CPI
Financial liabilities (1,114,509) (1,190,262)
Variable-rate instruments
Financial assets 79,501 549,359
Financial liabilities (148,414) (455,157)
(68,913) 94,202
The financial assets include cash equivalents with relatively low interest due to the
current market conditions.
(b) Fair value sensitivity analysis for fixed rate instruments:
The Group's fixed-interest assets and liabilities are not measured at fair value
through profit and loss. Therefore, a change in the interest rate as of the balance
sheet date would not affect profit or loss, in respect of changes in the value of the
assets and liabilities bearing fixed interest.

Adama Agricultural Solutions Ltd. Notes to the Financial Statements as of December 31, 2018
93
Note 29 - Financial Instruments (cont'd)
E. Fair value:
The fair value of forward contracts on foreign currency is based on their listed market price, if
available. In the absence of market prices, the fair value is estimated based on the discounted
difference between the stated forward price in the contract and the current forward price for the
residual period until redemption, using an appropriate interest rate.
The fair value of foreign currency options is based on bank quotes. The reasonableness of the
quotes is evaluated through discounting future cash flow estimates, based on the conditions and
duration to maturity of each contract, using the market interest rates of a similar instrument at the
measurement date and in accordance with the Black & Scholes model.
(1) Financial instruments measured at fair value for disclosure purposes only
The carrying amount of certain financial assets and liabilities, including cash and cash
equivalents, trade receivables, other receivables, other short-term investments,
derivatives, bank overdrafts, short-term loans and credit, trade payables and other
payables, are the same or proximate to their fair value.
The following table details the carrying amount in the books and the fair value of groups of
non-current financial instruments presented in the financial statements not in accordance
with their fair values:
December 31, 2018 December 31, 2017
Carrying Carrying amount Fair value amount Fair value
$ thousands
Financial assets
Long-term loans and other
receivables (a) 7,574 7,693 9,413 10,313
Financial liabilities
Long-term loans and other
receivables (b) 71,703 72,410 120,800 123,091
Debentures (c) 1,114,509 1,308,769 1,190,262 1,543,841
(a) The fair value of the long-term loans granted is based on a calculation of the present
value of cash flows, using the acceptable interest rate for similar loans having similar
characteristics (Level 2).
(b) The fair value of the long-term loans received is based on a calculation of the present
value of cash flows, using the acceptable interest rate for similar loans having similar
characteristics (Level 2).
(c) The fair value of the debentures is based on stock exchange quotes (Level 1).

Adama Agricultural Solutions Ltd. Notes to the Financial Statements as of December 31, 2018
94
Note 29 - Financial Instruments (cont'd)
E. Fair value: (cont'd)
(2) The interest rates used determining fair value
The interest rates used to discount the estimate of anticipated cash flows are:
December 31, 2018
In %
Brazilian real interest 6.16 – 7.22
U.S. dollar interest 2.97 – 3.04
Indian rupi interest 6.85 – 7.43
(3) Fair value hierarchy of financial instruments measured at fair value
The table below presents an analysis of financial instruments measured at fair value,
measured by valuation method. The various levels have been defined as follows:
Level 1: quoted prices (unadjusted) in active market for identical instrument.
Level 2: inputs other than quoted prices included within Level 1 that are observable,
either directly or indirectly.
Level 3: inputs that are not based on observable market data (unobservable inputs).
The Company’s financial instruments carried at fair value, are evaluated by observable
inputs and therefore are concurrent with the definition of level 2.
December 31
2 0 1 8 2 0 1 7
$ thousands
Derivatives used for hedging the cash flow:
Forward contracts and options 15,659 (45,596)
Derivatives used for economic hedging:
Forward contracts and options (151,742) (5,507)
Short term investment 5,617 3,520
Long term investment 4,730 8,381
Financial Instrument Fair value
Forward contracts Fair value measured on the basis of discounting the difference
between the forward price in the contract and the current
forward price for the residual period until redemption using
market interest rates appropriate for similar instruments.
Foreign currency
options
The fair value is measured based on the Black&Scholes
model.

Adama Agricultural Solutions Ltd. Notes to the Financial Statements as of December 31, 2018
95
Note 30 - Operating Segments
A. Products and services:
The Company presents its segment reporting based on a format that is based on a breakdown by business
segments:
Crop Protection (Agro):
This is the main area of the Company’s operations and includes the manufacture and marketing of
conventional agrochemical products.
Other (Non Agro):
This field of activity includes a large number of sub-fields, including: Lycopene (an oxidization retardant),
aromatic products, and other chemicals. It combines all the Company’s activities not included in the agro-
products segment.
Segment results reported to the chief operating decision maker include items directly attributable to a segment
as well as items that can be allocated on a reasonable basis. Unallocated items comprise mainly financing
expenses, net.
Information regarding the results of each reportable segment is included below:
For the year ended December 31, 2018
Crop Protection Other Reconciliations Consolidated
$ thousands
Statement of income information:
Revenues
External revenues 3,338,967 196,686 - 3,535,653
Inter-segment revenues - 109 (109) -
Total revenues 3,338,967 196,795 (109) 3,535,653
Results
Segment's results 641,407 4,106 - 645,513
Financing expenses, net (140,166)
Share of income of equity-accounted
investee companies, net 1,173
Income taxes (129,035)
Net income for the year attributable
to the owners of the Company 377,485

Adama Agricultural Solutions Ltd. Notes to the Financial Statements as of December 31, 2018
96
Note 30 - Operating Segments (cont'd)
A. Products and services: (cont'd)
For the year ended December 31, 2017
Crop Protection Other Reconciliations Consolidated
$ thousands
Statement of income information:
Revenues
External revenues 2,946,174 191,204 - 3,137,377
Inter-segment revenues - 767 (767) -
Total revenues 2,946,174 191,971 (767) 3,137,377
Results
Segment's results 369,273 2,320 - 371,593
Financing expenses, net (121,017)
Share of income of equity-accounted
investee companies, net 5,578
Income taxes (20,544)
Net income for the year attributable
to the owners of the Company 235,610
For the year ended December 31, 2016
Crop Protection Other Reconciliations Consolidated
$ thousands
Statement of income
information:
Revenues
External revenues 2,877,360 192,805 - 3,070,165
Inter-segment revenues - 1,236 (1,236) -
Total revenues 2,877,360 194,041 (1,236) 3,070,165
Results
Segment's results 377,489 6,673 - 344,162
Financing expenses, net (140,350)
Share of losses of equity-
accounted investee companies,
net (16,622)
Income taxes (22,520)
Non-controlling interests (2,342)
Net income for the year attributable
to the owners of the Company 162,328

Adama Agricultural Solutions Ltd. Notes to the Financial Statements as of December 31, 2018
97
Note 30 - Operating Segments (cont'd)
B. Sales distribution by geographic regions
Below is a breakdown of sales by geographical segments based on location of customers (sales
target).
For the year ended December 31
2 0 1 8 2 0 1 7 2 0 1 6
$ thousands
Europe 1,055,718 1,042,088 1,041,508
North America 715,120 630,969 604,316
Latin America 926,799 739,906 739,327
Asia Pacific 379,618 310,340 291,952
India, the Middle East and Africa 351,376 317,320 295,373
Israel 107,022 96,754 97,689
3,535,653 3,137,377 3,070,165
Note 31 - Investments in Investees
Additional details in respect of subsidiaries directly held by the Company:
December 31, 2018
Country of association
Company equity rights
Loans to investees Investments
$ thousands
Adama Makhteshim Ltd. Israel 100 499,562 1,093,173
Adama Agan Ltd. Israel 100 461,747 1,004,980
Lycored Ltd. Israel 100 - 111,741
961,309 2,209,894
December 31, 2017
Country of association
Company equity rights
Loans to investees Investments
$ thousands
Adama Makhteshim Ltd. Israel 100 499,562 959,050
Adama Agan Ltd. Israel 100 461,747 737,459
Lycored Ltd. Israel 100 - 109,524
961,309 1,806,034
The Company’s guaranty of the liabilities to banks of Subsidiaries is unlimited.
The balance of subsidiaries’ liabilities to banks as of balance sheet date for which the Company is
guarantor is $139 million.

Adama Agricultural Solutions Ltd. Notes to the Financial Statements as of December 31, 2018
98
Note 32 - Subsequent events
In January 2019, the Company completed, through a subsidiary in the United States, the acquisition of
the entire issued and paid share capital of Bonide Products LLC, a company that provides solutions
primarily for the consumer goods market for use in the home and garden, for a consideration of about $
122 million.

Adama Agricultural Solutions Ltd. Appendix to the Financial Statements - Schedule of Investee Companies
99
Control rate and
ownership of holding
company/ companies
Holding company/companies Investee company %
A. Domestic consolidated subsidiaries
Adama Agricultural Solutions Ltd. Adama Makhteshim Ltd. (hereinafter –
Makhteshim)
100
Adama Agan Ltd. (hereinafter – Agan) 100
Lycored Ltd. 100
Agan Agan Aroma and Fine Chemicals Ltd. 100
Adama (Agan) Chemical Marketing Ltd. 100
Lycored Ltd. Lycored Bio Ltd. 100
Dalidar Pharma Israel (1995) Ltd. 100
B. Foreign consolidated subsidiaries
Makhteshim (99.99%) and Agan (0.01%) Adama Celsius B.V. (hereinafter – Celsius) 100
Agan (99.99%) and Makhteshim (0.01%) Adama Fahrenheit B.V. (hereinafter –
Fahrenheit)
100
Lycored Ltd. Lycored Sarl 100
ALB Holdings UK 100
Lycored Corp. (USA) 100
VN Biotech Limited 100
ALB Holdings UK Protein Dynamix Limited 100
VN Biotech Limited Lycored Ukraine LLC 100
Lycored Corp (USA) Nova HueLLC. 100
Makhteshim (50%) and Agan (50%) Adama Agriculture B.V. 100
Celsius Adama Irvita N.V. 100
Adama Korea Inc. 51
Adama Vietnam Limited Company 100
Adama Agriculture Slovensko Spol s.r.o. 100
Adama (Nanjing) Agricultural Science and
Technology Company Limited
100

Adama Agricultural Solutions Ltd. Appendix to the Financial Statements - Schedule of Investee Companies
100
Control rate and
ownership of holding
company/ companies
Holding company/companies Investee company %
B. Foreign consolidated subsidiaries (cont’d)
Fahrenheit Adama Quena N.V. 100
Fahrenheit (50%) and Celsius (50%) Magan HB B.V. 100
Adama Argentina S.A. 100
Kollant s.r.l. 100
Adama Hungary z.r.t. 100
Adama Andina B.V. 100
Fahrenheit (32.09%) and Celsius (67.91%) Adama (China) Investment Company Limited 100
Fahrenheit (30%), Celsius (30%), Adama
Agriculture B.V. (39.99%), and Adama
Registrations B.V. (0.01%)
Adama Agriculture Espana S.A. 100
Magan HB B.V. (99.99%) and Agricur
Defensivos Agricolas Ltda. (0.01%)
Adama Brasil S.A. 100
Adama Andina B.V. (99.80%) and
Fahrenheit (0.10%)
Proficol Venezuela S.A. 99.9
Adama Andina B.V. (99.99%) and Celsius
(0.01%)
Adama Agriculture Peru S.A. 100
Adama Andina B.V. (99.8%) and Celsius
(0.2%)
Adama Ecuador Adamecudor S.A. 100
Adama Andina B.V. Adama Colombia S.A.S 100
Adama Agriculture B.V. (99.90%) and
Fahrenheit (0.10%)
Adama Agriculture East Africa Limited 100
Adama Agriculture B.V. (99%) and
Fahrenheit (1%)
Adama Madagascar SARL 100
Adama Guatemala SA
Adama Agriculture B.V. (99.98%), Celsius
(0.01%), and Fahrenheit (0.01%)
Agricur Defensivos Agricolas Ltd. 100
Adama Agriculture B.V. (99.93%) and
Celsius (0.07%),
Adama Paraguay S.R.L. 100
Adama Agriculture B.V. (99.90%) and
Celsius (0.10%),
Adama Dominican Republic, S.R.L. 100
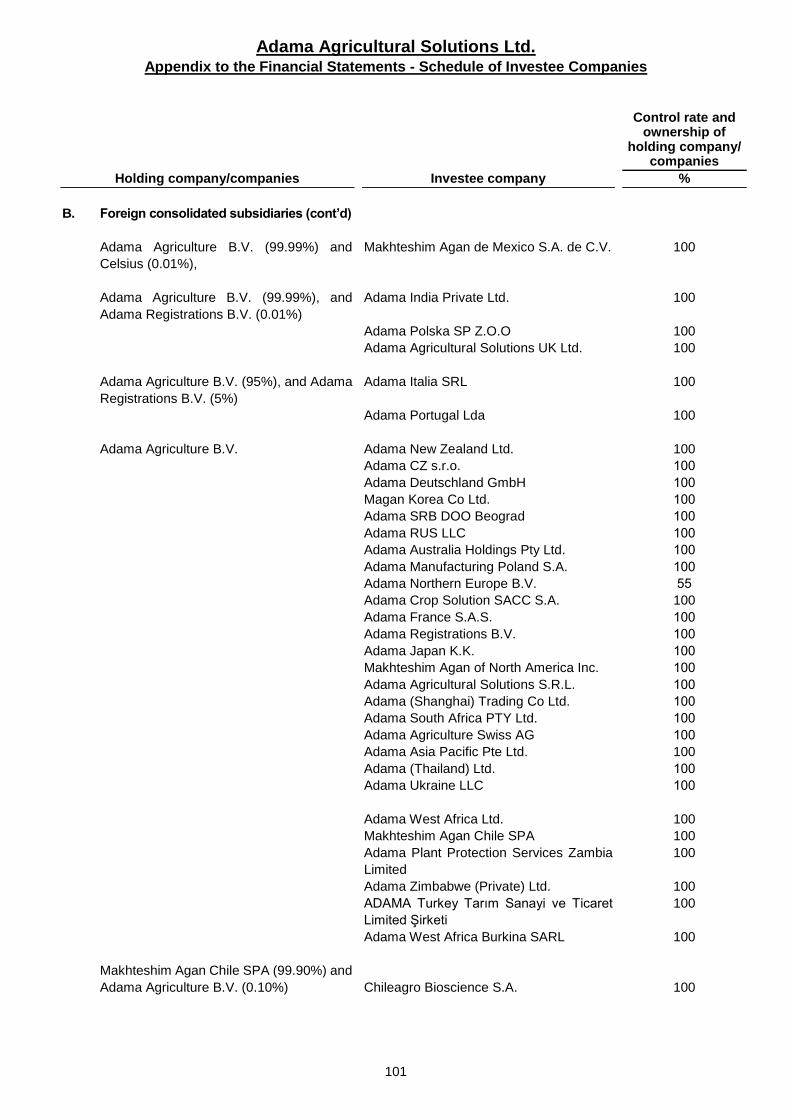
Adama Agricultural Solutions Ltd. Appendix to the Financial Statements - Schedule of Investee Companies
101
Control rate and ownership of
holding company/ companies
Holding company/companies Investee company %
B. Foreign consolidated subsidiaries (cont’d)
Adama Agriculture B.V. (99.99%) and
Celsius (0.01%),
Makhteshim Agan de Mexico S.A. de C.V. 100
Adama Agriculture B.V. (99.99%), and
Adama Registrations B.V. (0.01%)
Adama India Private Ltd. 100
Adama Polska SP Z.O.O 100
Adama Agricultural Solutions UK Ltd. 100
Adama Agriculture B.V. (95%), and Adama
Registrations B.V. (5%)
Adama Italia SRL 100
Adama Portugal Lda 100
Adama Agriculture B.V. Adama New Zealand Ltd. 100
Adama CZ s.r.o. 100
Adama Deutschland GmbH 100
Magan Korea Co Ltd. 100
Adama SRB DOO Beograd 100
Adama RUS LLC 100
Adama Australia Holdings Pty Ltd. 100
Adama Manufacturing Poland S.A. 100
Adama Northern Europe B.V. 55
Adama Crop Solution SACC S.A. 100
Adama France S.A.S. 100
Adama Registrations B.V. 100
Adama Japan K.K. 100
Makhteshim Agan of North America Inc. 100
Adama Agricultural Solutions S.R.L. 100
Adama (Shanghai) Trading Co Ltd. 100
Adama South Africa PTY Ltd. 100
Adama Agriculture Swiss AG 100
Adama Asia Pacific Pte Ltd. 100
Adama (Thailand) Ltd. 100
Adama Ukraine LLC 100
Adama West Africa Ltd. 100
Makhteshim Agan Chile SPA 100
Adama Plant Protection Services Zambia
Limited
100
Adama Zimbabwe (Private) Ltd. 100
ADAMA Turkey Tarım Sanayi ve Ticaret
Limited Şirketi
100
Adama West Africa Burkina SARL 100
Makhteshim Agan Chile SPA (99.90%) and
Adama Agriculture B.V. (0.10%) Chileagro Bioscience S.A. 100

Adama Agricultural Solutions Ltd. Appendix to the Financial Statements - Schedule of Investee Companies
102
Control rate and ownership of
holding company/ companies
Holding company/companies Investee company %
B. Foreign consolidated subsidiaries (cont’d)
Chileagro Bioscience S.A. Adama Chile SA 60
Adama India Private Ltd. PT. Royal Agro Indonesia 100
Makhteshim Agan de Mexico S.A. de C.V.
(98.6%) and Adama Agriculture B.V. (1.4%)
Adama Servicios S.A. de C.V. 100
Makhteshim Agan de Mexico S.A. de C.V. (99%)
and Adama Agriculture B.V. (1%)
Plant Protection, S.A. de C.V. 100
Makhteshim Agan de Mexico S.A. de C.V.
(99.93%) and Adama Agriculture B.V. (0.07%)
Servicios Ingold S.A. de C.V. 100
Makhteshim Agan de Mexico S.A. de C.V.
(99.99%) and Adama Agriculture B.V. (0.01%)
Ingenieria Industrial S.A. de C.V. 100
Servicios Ingold S.A. de C.V. (99.99%) and
Adama Servicios S.A. de C.V. (0.01%)
Nangaru S.A. de C.V. 100
Makhteshim Agan de Mexico S.A. de C.V.
(96.64%), Servicios Ingold S.A. de C.V. (1.12%),
Plant Protection, S.A. de C.V. (1.12%), and
Ingenieria Industrial S.A. de C.V. (1.12%)
Adama AGS, S.A. de C.V. 100
Adama Northern Europe B.V. UAB Adama Northern Europe 100
Makhteshim Agan of North America, Inc. Control Solutions Inc. 67.1
Alligare LLC 80
Adama Americas Inc. 100
Makhteshim Agan of North America, Inc. (40%)
and Adama Agriculture B.V. (60%)
Adama Agricultural Solutions
CANADA Ltd.
100
Adama Australia Holdings Pty Ltd. (50%) and
Farmoz Pty Ltd. (50%)
Adama Australia Pty Ltd. 100
Adama Australia Holdings Pty Ltd Farmoz Pty Ltd. 100
Adama West Africa Ltd. Makhteshim Agan West Africa Limited
(Nigeria)
100
Adama West Africa Cote D’lvoire Ltd. 100
Adama Cameroun SUARL 100
Adama (China) Investment Company Limited Adama (Beijing) Agricultural
Technology Company Limited
100
ADAMA (Jiangsu) Agricultural
Solutions Company Limited
100

Adama Agricultural Solutions Ltd. Appendix to the Financial Statements - Schedule of Investee Companies
103
Control rate and
ownership of holding
company/ companies
Holding company/companies Investee company %
C. Jointly-controlled associated companies
Adama Agricultural Solutions Ltd. Biotech Plant Genomic Fund L.L.P 50
Biotech M.A.H Limited Partnership 50
Biotech M.A.H Limited Partnership
Biotech Agro Ltd.
100
Agan Aroma and Fine Chemicals Ltd. Negev Aroma (Ramat Hovav) Ltd. 50
Adama Agriculture B.V. Alfa Agricultural Supplies Commercial and
Industrial S.A.
49
Alfa Agricultural Supplies Commercial and
Industrial S.A.
Agribul Ltd. 100
Fahrenheit InnovAroma S.A. 50
Adama Colombia S.A.S. Servicidas de Colombia S.A.S, in liquidation 50
D. Associated company
Makhteshim Classeed Ltd. 9.84
Energin.R Technologies 2009 Limited 11.1
Targetgene Biotechnologies Limited 5

Adama Agricultural Solutions Ltd.
Separate Financial Data
as of December 31, 2018
in US Dollars
Adama Agricultural Solutions Ltd.
Separate Financial Data
as of December 31, 2018
in US Dollars
CONTENTS
Page
Auditors’ Report - Annual Financial statements 2
Data on Financial Position 3-4
Data on Income 5
Data on Comprehensive Income 6
Data on Cash Flows 7
Additional Information to the Separate Financial Data 8-16

2
To the Shareholders of Adama Agricultural Solutions Ltd. 1st Golan St. Airport city, Israel Dear Sir/Madam,
Re: Special report of the auditor on separate financial information pursuant to Regulation 9-C of the Securities Regulations (Periodic and Immediate Reports), 1970 We have audited the separate financial information that was prepared in accordance with Regulation 9-C of the Securities Regulations (Periodic and Immediate Reports) - 1970 of Adama Agricultural Solutions Ltd. (“The Company”) as of December 31, 2018 and December 31, 2017 and for each of the two years in the period ended December 31 .The board of directors and management are responsible for the separate financial information. Our responsibility is to express an opinion on this separate financial information based on our audit. The financial statements of the Company as of December 31, 2016 and for the year ended on the same date, was audited by another auditors whose report as of March 30, 2017 included a disqualified opinion. We conducted our audit in accordance with Generally Accepted Auditing Standards in Israel. Those standards require that we plan and perform the audit to obtain reasonable assurance about whether the separate financial information is free of material misstatement. An audit includes examining, on a test basis, evidence supporting the amounts and disclosures in the separate financial information. An audit also includes assessing the accounting principles used in the preparation of the separate financial information and significant estimates made by the board of directors and management, as well as evaluating the overall separate financial information presentation. We believe that our audit and the reports of other auditors provide a reasonable basis for our opinion. In our opinion, the separate financial information is prepared, in all material respects, in accordance with the requirements of regulation 9-C of the Securities Regulations (Periodic and Immediate reports), 1970. Brightman Almagor Zohar & Co. Certified Public Accountants Member of Deloitte Touche Tohmatsu Limited Tel Aviv, March 19, 2019

3
Adama Agricultural Solutions Ltd. Separate Financial Data
Data on Financial Position
December 31
2 0 1 8 2 0 1 7
Note $ thousands
Current assets
Cash and cash equivalents 3 1,468 1,996
Other receivables 111,157 56368,
Receivables from investee companies 234,971 214,866
Tax deposits less provision for tax 385 -
Derivatives 2,487 38,332
Total current assets 350,468 323,757
Long-term investments, loans and receivables
Investments in investee companies 2,209,894 1,806,034
Loans to investee companies 961,309 961,309
3,171,203 2,767,343
Fixed assets, net 2,315 2,480
Intangible assets, net 5,020 5,282
Deferred tax assets 6 2,189 11,824
Total non-current assets 3,180,727 2,786,929
Total assets 3,531,195 3,110,686
The accompanying additional information is an integral part of the separate financial data.

4
Adama Agricultural Solutions Ltd. Separate Financial Data
Data on Financial Position
December 31
2 0 1 8 2 0 1 7
Note $ thousands
Current liabilities
Other payables 4 22,174 34,054
Derivatives 4 98,411 1,295
Total current liabilities 120,585 35,349
Long-term liabilities
Debentures 4 1,136,394 1,213,619
Employee benefits 7,977 7,027
Total non-current liabilities 1,144,371 1,220,646
Total liabilities 1,264,956 1,255,995
Equity
Share capital 125,595 125,595
Share premium 623,829 ,829623
Capital reserves (319,313) (350,788)
Retained earnings 1,836,128 1,456,055
Total equity attributable to owners of the Company 2,266,239 1,854,691
Total liabilities and equity 3,531,195 3,110,686
Yang Xingqiang Chen Lichtenstein Aviram Lahav
Chairman of the Board of Directors President & Chief Executive Officer Chief Financial Officer
Date of approval of the financial statements: March 19, 2019
The accompanying additional information is an integral part of the separate financial data.

5
Adama Agricultural Solutions Ltd. Separate Financial Data
Date on Income
for the year ended December 31
2 0 1 8 2 0 1 7 2 0 1 6
Note $ thousands
Revenues
Income from services to investee companies 59,204 60,383 39,777
Expenses
General and administrative expenses 50,817 58,051 36,307
Operating profit 8,387 2,332 3,470
Financing expenses 199,699 220,912 200,558
Financing income (199,699) (220,912) (200,558)
Financing income (expenses), net - - -
Profit after financing expenses, net 8,387 2,332 3,470
Income from investee companies 370,886 225,623 160,435
Profit before tax on income 379,273 227,955 163,905
Tax on income 5 1,788 (7,655) 1,577
Profit for the year attributable to the
owners of the Company 377,485 235,610 162,328
The accompanying additional information is an integral part of the separate financial data.

6
Adama Agricultural Solutions Ltd. Separate Financial Data
Date on Comprehensive Income
for the year ended December 31
2 0 1 8 2 0 1 7 2 0 1 6
$ thousands
Profit for the year attributable to the owners of the Company 377,485 235,610 162,328
Other comprehensive income items that after initial
recognition in comprehensive income were or will be
transferred to the statement of income
Net change in fair value of cash flow hedges transferred to profit
or loss - (480) (480)
Other comprehensive profit (loss) in respect of investee
companies, net from tax 31,215 (27,897) (12,986)
Taxes on other components of comprehensive income that were
transferred or will be transferred to the statement of income in
succeeding periods - 43 42
Total other comprehensive profit (loss) items for the year
that after initial recognition in comprehensive income were
or will be transferred to the statement of income, net of tax 31,215 (28,334) (13,424)
Other comprehensive income items that will not be
transferred to the statement of income
Re-measurement of defined benefit plan (116) 124 659
Tax in respect of other comprehensive income items that will not
be transferred to the statement of income 27 (817) -
Other comprehensive income (loss) in respect of investee
companies, net of tax 4,787 (1,440) (523)
Total other comprehensive profit (loss) for the year that will
not be transferred to the statement of income, net of tax 4,698 (2,133) 136
Total comprehensive income for the year attributable to the
owners of the Company 413,398 205,143 149,040
The accompanying additional information is an integral part of the separate financial data.
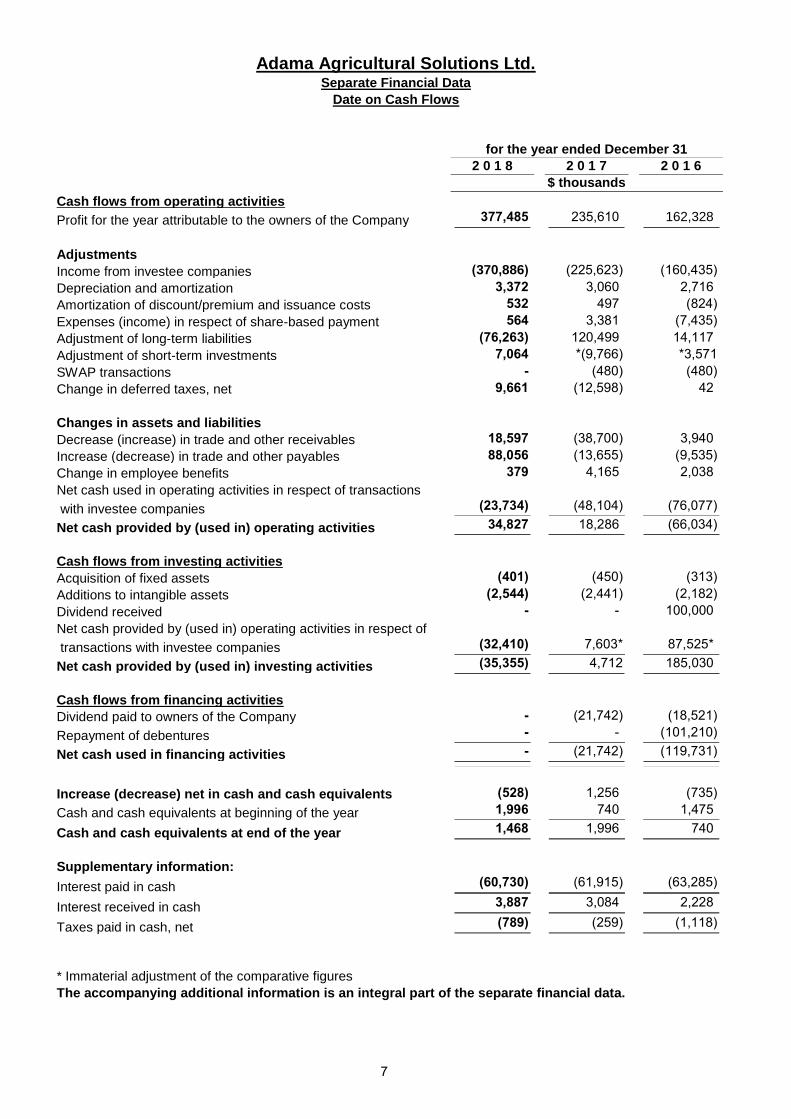
7
Adama Agricultural Solutions Ltd. Separate Financial Data
Date on Cash Flows
for the year ended December 31
2 0 1 8 2 0 1 7 2 0 1 6
$ thousands
Cash flows from operating activities
Profit for the year attributable to the owners of the Company 377,485 235,610 162,328
Adjustments
Income from investee companies (370,886) (225,623) (160,435)
Depreciation and amortization 3,372 3,060 2,716
Amortization of discount/premium and issuance costs 532 497 (824)
Expenses (income) in respect of share-based payment 564 3,381 (7,435)
Adjustment of long-term liabilities (76,263) 120,499 14,117
Adjustment of short-term investments 7,064 (9,766)* 3,571*
SWAP transactions - (480) (480)
Change in deferred taxes, net 9,661 (12,598) 42
Changes in assets and liabilities
Decrease (increase) in trade and other receivables 18,597 (38,700) 3,940
Increase )decrease) in trade and other payables 88,056 (13,655) (9,535)
Change in employee benefits 379 4,165 2,038
Net cash used in operating activities in respect of transactions
with investee companies (23,734) (48,104) (76,077)
Net cash provided by (used in) operating activities 34,827 18,286 (66,034)
Cash flows from investing activities
Acquisition of fixed assets (401) (450) (313)
Additions to intangible assets (2,544) (2,441) (2,182)
Dividend received - - 100,000
Net cash provided by (used in) operating activities in respect of
transactions with investee companies (32,410) *7,603 *87,525
Net cash provided by (used in) investing activities (35,355) 4,712 185,030
Cash flows from financing activities
Dividend paid to owners of the Company - (21,742) (18,521)
Repayment of debentures - - (101,210)
Net cash used in financing activities - (21,742) (119,731)
Increase (decrease) net in cash and cash equivalents (528) 1,256 (735)
Cash and cash equivalents at beginning of the year 1,996 740 1,475
Cash and cash equivalents at end of the year 1,468 1,996 740
Supplementary information:
Interest paid in cash (60,730) (61,915) (63,285)
Interest received in cash 3,887 3,084 2,228
Taxes paid in cash, net (789) (259) (1,118)
* Immaterial adjustment of the comparative figures
The accompanying additional information is an integral part of the separate financial data.

Adama Agricultural Solutions Ltd. Separate Financial Data
Additional Information as of December 31, 2018
8
1 General:
Presented hereunder are financial data from the Group’s consolidated financial statements of December 31,
2018 (hereinafter – the consolidated financial statements), which are issued in the framework of the periodic
reports, and which are attributed to the Company itself (hereinafter – separate financial data), and are
presented in accordance with Regulation 9C (hereinafter – the Regulation) and the tenth addendum to the
Securities Regulations (Periodic and Immediate Reports) – 1970 (hereinafter – the tenth addendum)
regarding separate financial data of an entity.
The separate financial information should be read together with the consolidated financial statements.
In this separate financial data - the Company, subsidiaries and investees as defined in Note 1B in the
consolidated financial statements.
2. Significant accounting policies applied in the separate financial data:
The accounting policies described in Note 3 to the consolidated financial statements have been applied
consistently to all periods presented in the Company’s separate financial data, including the manner by
which the financial data were classified in the consolidated financial statements, with any necessary changes
deriving from that mentioned hereunder:
A. Presentation of the financial data:
(1) Data on financial position:
Information on amounts of assets and liabilities included in the consolidated financial
statements that are attributable to the Company itself (other than in respect of investee
companies), according to categories of assets and liabilities, as well as information regarding
the net amount, on the basis of the consolidated financial statements, that is attributable to the
Company’s owners, of total assets less total liabilities, in respect of investee companies,
including goodwill.
(2) Data on comprehensive income:
Information on amounts of revenues and expenses included in the consolidated financial
statements, allocated between income and other comprehensive income, attributable to the
Company itself (other than in respect of investee companies), while specifying the categories of
revenues and expenses, as well as information regarding the net amount, on the basis of the
consolidated financial statements, that is attributable to the Company’s owners, of total
revenues less total expenses in respect of the operating results of investee companies.
(3) Data on cash flows:
Information on cash flows included in the consolidated financial statements that are attributable
to the Company itself (other than in respect of investee companies), taken from the
consolidated statement of cash flows, classified according to flow from operating activities,
investing activities and financing activities with details of their composition. Cash flows from
operating activities, investing activities and financing activities for transactions with investee
companies are presented separately on a net basis, under the relevant type of activity, in
accordance with the nature of the transaction.

Adama Agricultural Solutions Ltd. Separate Financial Data
Additional Information as of December 31, 2018
9
2. Significant accounting policies applied in the separate financial information: (cont’d)
B. Transactions between the Company and investees:
(1) Presentation:
Intra-group balances and transactions, and any income and expenses arising from intra-group
transactions, which were eliminated in preparing the consolidated financial statements, were
presented separately from the balance in respect of investee companies and the profit in
respect of investee companies, together with similar balances with third parties.
(2) Measurement:
Transactions between the Company and its subsidiaries were measured according to the
recognition and measurement principles provided in International Financial Reporting Standards
(“IFRS”) with respect for the accounting treatment for transactions of this kind that are executed
with third parties.
3. Cash and Cash Equivalents:
December 31
2 0 1 8 2 0 1 7
$ thousands
Cash and cash equivalents denominated in shekels 282 506
Cash and cash equivalents linked to the dollar 876 1,156
Cash and cash equivalents linked to other currency 310 334
Total cash and cash equivalents 1,468 1,996
4. Financial Instruments:
A. Loans and credit:
This section provides information regarding the contractual terms of the Company’s interest-
bearing loans and credit, measured at amortized cost.
Linkage terms
Nominal Interest
rate
Effective interest
rate* Par value Total
%
% NIS
thousands $
thousands
Debentures - Series B CPI 5.15 5.30 3,551,022 1,136,394
Total 3,551,022 1,136,394
*Effective interest rate with respect of series B extensions.

Adama Agricultural Solutions Ltd. Separate Financial Data
Additional Information as of December 31, 2018
10
4. Financial Instruments (cont'd)
A. Loans and credit (cont'd)
Series B debentures, in the amount of NIS 3,563.5 million par value, linked to the CPI and bearing interest at the base annual rate of 5.15%. The debenture principal is to be repaid in 17 equal payments in the years 2020 through 2036. The issuance costs for this series amounted to $4,144 thousand.
During 2008, the Company purchased a cumulative total of NIS 12.5 million par value debentures, due
to this purchase, debentures with a par value of NIS 12.5 million were de-listed from trading.
Maturities
$ thousands
First year (current maturities) -
Second year 66,847
Third year 66,847
Fourth year 66,847
Fifth year and thereafter 935,853
1,136,394
B. Other payables
December 31, 2018
In unlinked
Israeli currency
In CPI-linked Israeli
currency
Denominated
in or linked
to dollar
Denominated
in or linked
to other
currency Total
$ thousands
Other payables 12,786 5,376 2,904 1,108 22,174
December 31, 2017
In unlinked
Israeli currency
In CPI-linked Israeli
currency
Denominated
in or linked
to dollar
Denominated
in or linked
to other
currency Total
$ thousands
Other payables 13,375 5,181 15,187 311 34,054

Adama Agricultural Solutions Ltd. Separate Financial Data
Additional Information as of December 31, 2018
11
4. Financial Instruments (cont’d)
C. Liquidity risk
Presented below are the contractual maturity dates of the financial liabilities, including estimates of interest payments:
As of December 31 2018
Carrying Projected First Second Third Fourth Fifth year
amount cash flows year year year year and above
$ thousands
Non-derivative financial liabilities
Other payables 22,174 22,174 22,174 - - - -
Debentures 1,136,394 1,733,782 59,006 126,403 122,932 119,461 1,305,980
Derivative financial liabilities
Derivatives in foreign currency 98,267 98,267 98,267 - - - -
CPI/NIS forward transactions 144 144 144 - - - -
Total 1,256,979 1,854,367 179,591 126,403 122,932 119,461 1,305,980
As of December 31 2017
Carrying Projected First Second Third Fourth Fifth year
amount cash flows year year year year and above
$ thousands
Non-derivative financial liabilities
Other payables 34,054 34,054 34,054 - - - -
Debentures 1,213,619 1,901,135 62,501 62,501 133,891 130,214 1,512,027
Derivative financial liabilities
Derivatives in foreign currency 891 891 891 - - - -
CPI/NIS forward transactions 404 404 404 - - - -
Total 1,248,968 1,936,484 97,850 62,501 133,891 130,214 1,512,027

Adama Agricultural Solutions Ltd. Separate Financial Data
Additional Information as of December 31, 2018
12
4. Financial Instruments (cont’d)
D. Linkage and foreign currency risks
(1) Presented below are the company exposure to linkage and foreign currency risk in respect of
derivatives:
December 31 2018
Currency/
linkage
receivable
Currency/
linkage
payable
Average date
of expiration
Par value
(currency) Fair value
$ thousands
Forward foreign currency
contracts and purchase
options NIS USD 18/01/2019 1,117,392 (96,564)
CPI forward contract CPI NIS 09/06/2019 400,213 640
December 31 2017
Currency/
linkage
receivable
Currency/
linkage
payable
Average date
of expiration
Par value
(currency) Fair value
$ thousands
Forward foreign currency
contracts and purchase
options NIS USD 9/1/2018 1,180,152 36,540
CPI forward contract CPI NIS 26/4/2018 519,181 498

Adama Agricultural Solutions Ltd. Separate Financial Data
Additional Information as of December 31, 2018
13
4. Financial Instruments (cont’d)
E. Sensitivity analysis
A strengthening or weakening of the dollar against the shekel as of December 31 and an increase or
decrease in the CPI would have increased (decreased) the shareholders’ equity and the profit or loss
in the amounts shown below. This analysis was made on the assumption that all the other variables,
among others, the interest rates, remain constant. The analysis for 2017 was made on the same
basis.
December 31, 2018
Decrease of 5% Increase of 5%
Equity Profit (loss) Equity Profit (loss)
$ thousands
Shekel (5,257) (5,257) 5,495 5,495
CPI 38,995 38,995 (38,995) (38,995)
December 31, 2017
Decrease of 5% Increase of 5%
Equity Profit (loss) Equity Profit (loss)
$ thousands
Shekel 4,608 4,608 (6,000) (6,000)
CPI 43,620 43,620 (43,620) (43,620)
5. Income tax expenses (income)
A. Components of income tax expenses (income)
For the year ended December 31
2 0 1 8 2 0 1 7 2 0 1 6
$ thousands
Current tax expenses
For the current period 2,262 1,534 766
Adjustments for prior years, net (248) 3,409 769
2,014 4,943 1,535
Deferred tax expenses (income)
Creation and reversal of temporary differences (226) (12,598) 42
(226) (12,598) 42
Total income tax expenses (income) 1,788 (7,655) 1,577

Adama Agricultural Solutions Ltd. Separate Financial Data
Additional Information as of December 31, 2018
14
5. Income tax expenses (income) (cont’d)
B. Income taxes on components of other comprehensive income
For the year ended December 31
2 0 1 8 2 0 1 7 2 0 1 6
Before tax
Tax benefit Net of tax
Before tax
Tax benefit Net of tax
Before tax
Tax benefit Net of tax
$ thousands
Hedge of cash flows - - - (480) 43 (437) (480) 42 (438)
Actuarial gains (losses) from
defined benefit plan (116) 27 (89) 124 (817) (693) 659 - 659
Total (116) 27 (89) (356) (774) (1,130) 179 42 221
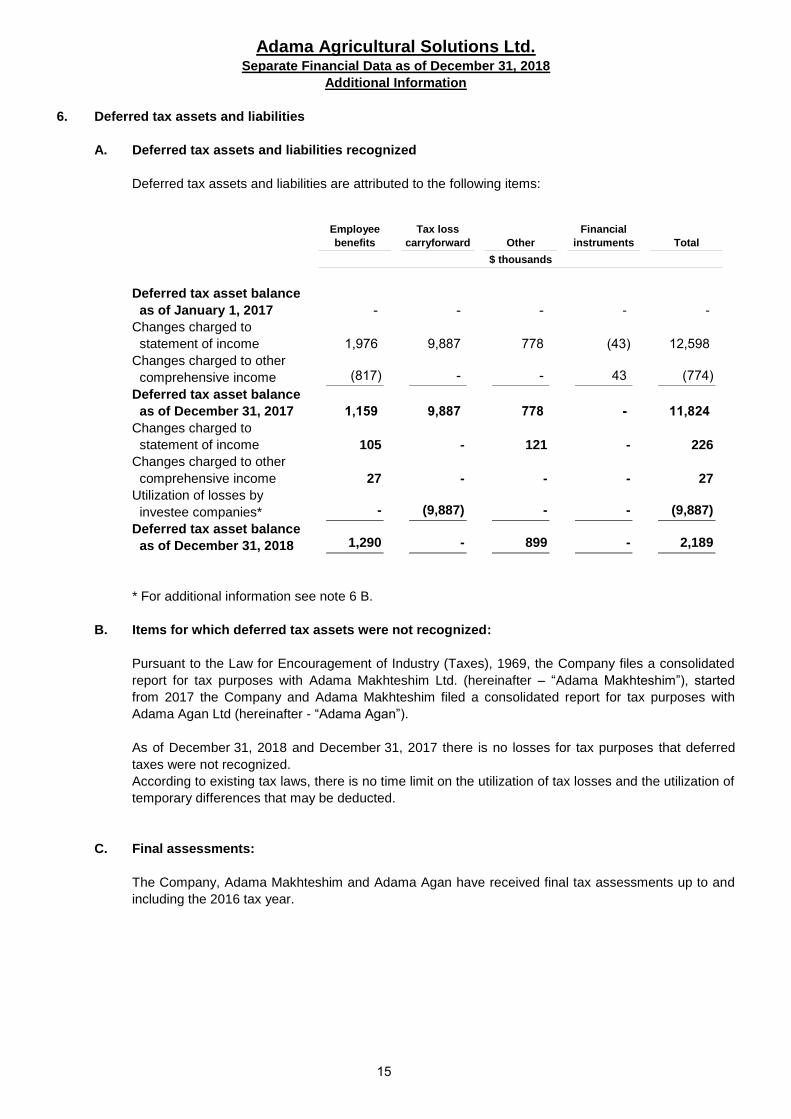
Adama Agricultural Solutions Ltd. Separate Financial Data as of December 31, 2018
Additional Information
15
6. Deferred tax assets and liabilities
A. Deferred tax assets and liabilities recognized
Deferred tax assets and liabilities are attributed to the following items:
Employee
benefits
Tax loss
carryforward Other
Financial
instruments Total
$ thousands
Deferred tax asset balance
as of January 1, 2017 - - - - -
Changes charged to
statement of income 1,976 9,887 778 (43) 12,598
Changes charged to other
comprehensive income (817) - - 43 (774)
Deferred tax asset balance
as of December 31, 2017 1,159 9,887 778 - 2411,8
Changes charged to
statement of income 105 - 121 - 226
Changes charged to other
comprehensive income 27 - - - 27
Utilization of losses by
investee companies* - (9,887) - - (9,887)
Deferred tax asset balance
as of December 31, 2018 1,290 - 899 - 2,189
* For additional information see note 6 B.
B. Items for which deferred tax assets were not recognized:
Pursuant to the Law for Encouragement of Industry (Taxes), 1969, the Company files a consolidated
report for tax purposes with Adama Makhteshim Ltd. (hereinafter – “Adama Makhteshim”), started
from 2017 the Company and Adama Makhteshim filed a consolidated report for tax purposes with
Adama Agan Ltd (hereinafter - “Adama Agan”).
As of December 31, 2018 and December 31, 2017 there is no losses for tax purposes that deferred
taxes were not recognized.
According to existing tax laws, there is no time limit on the utilization of tax losses and the utilization of
temporary differences that may be deducted.
C. Final assessments:
The Company, Adama Makhteshim and Adama Agan have received final tax assessments up to and
including the 2016 tax year.

Adama Agricultural Solutions Ltd. Separate Financial Data as of December 31, 2018
Additional Information
16
7. Commitments and material transactions with related parties:
A. Financial guarantees:
The Company has guaranteed the liabilities to banks of subsidiaries, unlimited in amount. The balance
of liabilities to banks of subsidiaries at the reporting date, for which the Company is a guarantor, is
$139 million.
B. Loans:
The loans between the Company and Israeli investee companies are given at the same terms as
those obtained by the Company ( See note 4A), provided that the loan terms will not be less than the
minimum interest required by Israeli tax law.
C. Agreement to provide services:
The Company provides services to subsidiaries in the Group, consulting services and various
headquarter services. For these services, the subsidiaries pay annual consideration, which is
calculated based on the cost of the services plus a designated margin.
D. Agreement services with the shareholders:
The Company engaged services agreements with the shareholders, according to which the Company
shall provide her the following services: (a) senior management services, to be performed by officers
of the Company, to an extent of up to 20% of a full-time office; (b) headquarters services, including
operational, administrative, legal, commercial, finance and other services with respect to the activities
of the Combined Company, including due to its being a listed company. For these services, the
subsidiaries pay annual consideration, which is calculated based on the cost of the services plus a
designated margin. For more details, see Note 28A(1)(b) in the consolidated financial statements
8. Buy-back of shares:
See Note 21E to consolidated financial statements.

Chapter D
Additional Information on the
Corporation

1
Chapter D – Additional Information on the Corporation
Company Name: ADAMA Agricultural Solutions Ltd. Company ID No.: 52-004360-5
Address: Golan St., POB 298, Airport City, 7015103 Fax: 073-2321937
Telephone: 073-2321000 Email: [email protected]
Balance Sheet Date: December 31, 2018 Report date: March 19, 2019

2
Regulation 10A – Condensed Quarterly Consolidated Statements of Income (in USD thousands)
Year Quarter 4 Quarter 3 Quarter 2 Quarter 1
Jan-Dec
2018
Oct-Dec
2018
Jul-Sep
2018
Apr-Jun
2018
Jan-Mar
2018
Sales Revenues 535,6533, 896,214 789,980 929,141 920,318
Cost of Sales 395,2322, 615,328 551,076 627,395 601,433
Gross Profit 140,4211, 280,886 238,904 301,746 318,885
Other Revenues 340,276- -1,317 -7,439 -6,585 -324,935
Sales and Marketing Expenses 636,768 169,205 150,109 162,497 154,957
General and Administrative Expenses 118,782 33,338 22,266 27,639 35,539
Research and Development Expenses 48,475 12212, 12,194 11,770 12,389
Other Expenses 31,159 8,199 8,938 6123, 10,410
Total Expenses 494,908 221,547 186,068 198,933 -111,640
Operating Profit 645,513 ,33959 52,836 102,813 430,525
Finance Expenses, Net 140,166 33,775 34,233 41,240 30,918
Profit After Finance 505,347 25,564 18,603 61,573 399,607
Share of income (losses) of equity-
accounted investee companies 1,173 -976 146 1,115 888
Profit before Income Tax 506,520 24,588 18,749 62,688 400,495
Income Tax Expenses 129,035 33912, 5,076 26,414 85,206
Profit for the Period 377,485 12,249 13,673 36,274 315,289
Attributed to:
The Company Owners 377,485 12,249 13,673 36,274 315,289
Holders of non-controlling rights - - - - -
Profit for the period 377,485 12,249 13,673 36,274 315,289

3
Condensed Quarterly Statements of Comprehensive Income (in USD thousands)
Year Quarter 4 Quarter 3 Quarter 2 Quarter 1
Jan-Dec
2018 Oct-Dec
2018 Jul-Sep
2018 Apr-Jun
2018 Jan-Mar
2018
Profit for the period 377,485 12,249 13,673 36,274 315,289
Other comprehensive income items that after initial inclusion as comprehensive income were or will be transferred to the Profit & Loss statement:
Foreign currency discrepancies from foreign operations
-22,115 -6,955 -1,744 -19,873 6,457
Foreign currency discrepancies from foreign operations transferred to the Profit & Loss statement
-211 -211 - - -
Effective portion of changes in fair value of cash flow hedges
17,665 7,266 261 24,491 -14,353
Net change in fair value of cash flow hedges transferred to the Profit & Loss statement
43,260 5781, 393 13,926 27,363
Taxes in respect of other comprehensive income items that were or will be transferred to the Profit & Loss statement in consecutive periods
-7,384 -1,071 263 -4,898 -1,678
Total other comprehensive income for the year that after initial inclusion as comprehensive income were or will be transferred to the Profit & Loss statement, net of tax
31,215 607 -827 13,646 17,789
Other comprehensive income that will not be transferred to the Profit & Loss statement:
Re-measurement of defined benefit plan 5,177 3,887 -526 1,149 667
Taxes in respect of other comprehensive income items that will not be transferred to the Profit & Loss statement
-479 -377 51 -68 -85
Total other comprehensive income for the year, that will not be transferred to the Profit & Loss statement, net of tax
4,698 3,510 -475 1,081 582
Total comprehensive income for the period
413,398 36616, 12,371 51,001 333,660
Total comprehensive income attributed to:
Company owners 413,398 36616, 12,371 51,001 333,660
Holders of non-controlling rights - - - - -
Total comprehensive income for the period
413,398 36616, 12,371 51,001 333,660

4
Regulation 11 – List of Investments in Subsidiaries and Associated Companies1
% held by the Company Value in
Company
separate
financial
statements
(in USD 000's)
Cost (in
USD 000's)
Total par
value issued
and
outstanding
held by the
Company
Number of
shares
held by the
Company
Class
of
share
Stock
exchange
number
Company
Name
In
authority
to
appoint
directors
In
voting In equity
In
security
100% 100% 100% 100% 31,093,17 219,216 132,939,834 132,939,834 Ordinary Not traded ADAMA
Makhteshim Ltd.
100% 100% 100% 100% 1,004,980 226,383 15,065,980 15,065,980 Ordinary Not traded ADAMA Agan
Ltd.
100% 100% 100% 100% 111,741 17,689 15,223,428 15,223,428 Ordinary Not traded Lycored Ltd.2
2,209,894 463,288
Total
investments in
subsidiaries
Balance of loans to subsidiaries and associated companies (in USD thousands)1
Maturity date Interest rate Linkage terms Loan amount Company name
Yet to be established %8.95 Dollar-linked 461,747 ADAMA Agan Ltd.
Yet to be established %8.95 Dollar-linked 499,562 ADAMA Makhteshim Ltd.
961,309 Total
1 The table is accurate to the financial statements date and only refers to the most significant companies. 2 Lycored Ltd. holds 2,535,870 of its shares, which according to Article 308(a) of the Companies law, do not confer any rights.
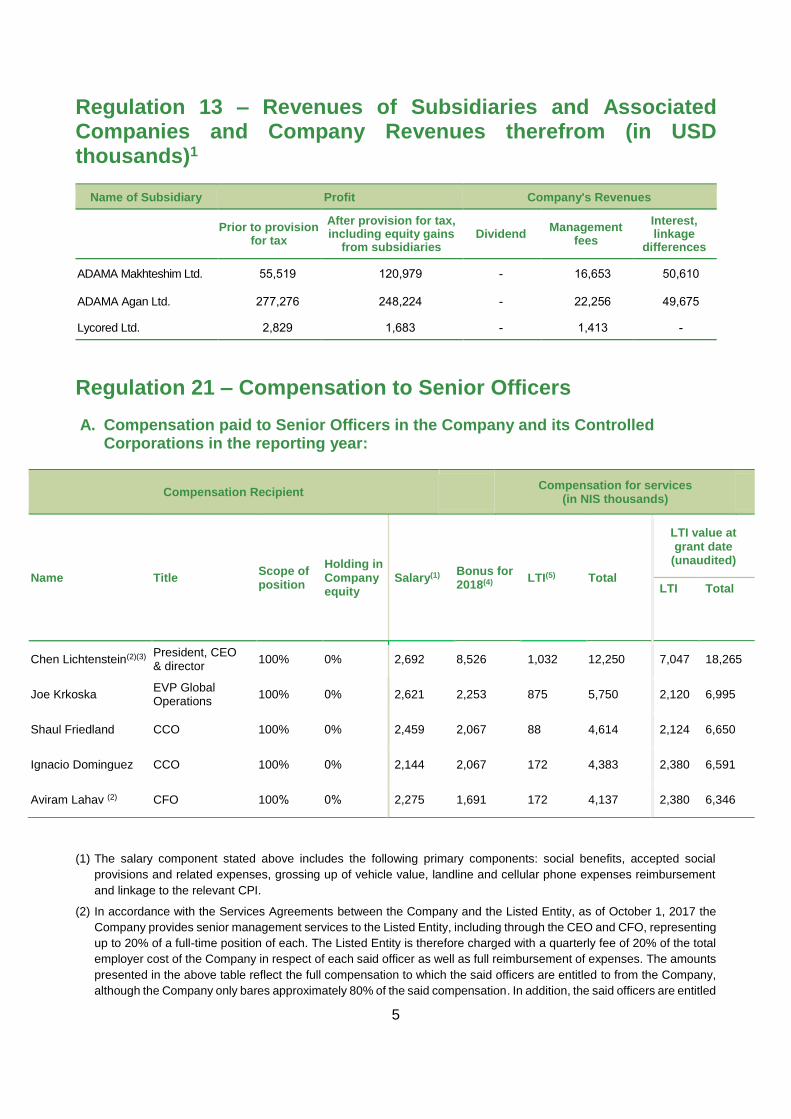
5
Regulation 13 – Revenues of Subsidiaries and Associated Companies and Company Revenues therefrom (in USD thousands)1
Company's Revenues Profit Name of Subsidiary
Interest, linkage
differences
Management fees
Dividend After provision for tax, including equity gains
from subsidiaries
Prior to provision for tax
50,610 16,653 - 979120, 55,519 ADAMA Makhteshim Ltd.
49,675 22,256 - 248,224 277,276 ADAMA Agan Ltd.
- 4131, - 1,683 2,829 Lycored Ltd.
Regulation 21 – Compensation to Senior Officers
A. Compensation paid to Senior Officers in the Company and its Controlled Corporations in the reporting year:
(1) The salary component stated above includes the following primary components: social benefits, accepted social
provisions and related expenses, grossing up of vehicle value, landline and cellular phone expenses reimbursement
and linkage to the relevant CPI.
(2) In accordance with the Services Agreements between the Company and the Listed Entity, as of October 1, 2017 the
Company provides senior management services to the Listed Entity, including through the CEO and CFO, representing
up to 20% of a full-time position of each. The Listed Entity is therefore charged with a quarterly fee of 20% of the total
employer cost of the Company in respect of each said officer as well as full reimbursement of expenses. The amounts
presented in the above table reflect the full compensation to which the said officers are entitled to from the Company,
although the Company only bares approximately 80% of the said compensation. In addition, the said officers are entitled
Compensation Recipient Compensation for services
(in NIS thousands)
Name Title Scope of position
Holding in Company equity
Salary(1) Bonus for 2018(4)
LTI(5) Total
LTI value at grant date
(unaudited)
LTI Total
Chen Lichtenstein(2)(3) President, CEO & director
100% 0% 2,692 8,526 1,032 12,250 7,047 18,265
Joe Krkoska EVP Global Operations
100% 0% 2,621 2,253 875 5,750 2,120 6,995
Shaul Friedland CCO 100% 0% 2,459 2,067 88 4,614 2,124 6,650
Ignacio Dominguez CCO 100% 0% 2,144 2,067 172 4,383 2,380 6,591
Aviram Lahav (2) CFO 100% %0 2,275 1,691 172 4,137 2,380 6,346

6
to an additional salary borne by the Listed Entity for their position as officers thereof, which is paid in actual by the
Company against full reimbursement and indemnification by the Listed Entity.
(3) In 2014 the Company's competent organs approved the employment terms of Mr. Lichtenstein, effective from the date
of commencement of employment on February 7, 2014. For details regarding the phantom options granted to the CEO
on December 2017, see note (5) below. The CEO also serves as a director since October 2017 but is not entitled to
any payment for this position.
(4) The bonus amount to the CEO includes a lifetime achievement award granted by ChemChina; The bonus amount to
the EVP Global Operations includes a sign-on bonus; The bonuses to the CFO and EVP Global Operations were
approved in accordance with Section 272(c)(2) of the Companies Law.
(5) Expenses recorded in respect of a phantom option plan from December 2017 in connection with long-term incentive,
as were actually recorded in the Company's 2018 financial statements.
(*) Compensation amounts are in terms of cost to the Company. The salary is presented according to the average 2018
NIS-USD exchange rate and the bonus is presented according to its actual rate (conversion to NIS according to the
December 31, 2018 exchange rate).
(**) On March 2018, the Company granted bonuses to officers for 2017, as detailed in Chapter D of the Periodic report for
2017 and in February 2019 the Company granted long-term incentive to its officers in accordance with a long-term
phantom option plan from the said month in a similar scope as previous plans.
B. Compensation paid to Senior Officers after the Balance Sheet Date, with regard their tenure or employment in the reporting year
See the above table.
C. Compensation paid to each of the Interested Parties in the Company Who is Not Included in the Section Above
During the course of 2018, compensation to directors that did not exceed the norm
(i.e. did not exceed the maximum amount under Regulations 4, 5 and 5a of the
Companies Regulations (Principles for Remuneration and Expenses for an External
Director), 5760-2000) (the "Remuneration Regulations"), and with regard to all
entitled directors amounted to approximately NIS 783 thousand. As per the
Company's Articles of Association, insofar as it has not been determined otherwise
by the Company's shareholder, directors in the Company are not entitled to any
compensation for their service as directors3, other than reimbursement of expenses,
to the exclusion of external directors and the independent director, who, according to
the approval of the Company's authorized organs, are entitled, as of March 2018, to
compensation in the maximum amount paid to an "expert external director" under the
Compensation Regulations.
The terms of office of the Company's directors are in accordance with the Company's
Remuneration Policy.
3 For the avoidance of doubt, it is noted that Mr. Chen Lichtenstein and Mr. An Liru are entitled to compensation for their positions
as President and CEO and VP China of the Company, respectively.

7
Regulation 21A – Control in the Company
At the report date, the controlling shareholder of the Company is ADAMA Ltd.4
Regulation 22 – Transactions with Controlling Shareholders
For details regarding transactions with the controlling shareholder or wherein the controlling
shareholder has a personal interest in the authorization thereof (with the exclusion of
negligible transactions), executed by the Company during the report period, or at a date
following the close of the report year until the report filing date, or those still in effect on the
report date, see Note 28 to the financial statements of the Company as of December 31,
2018.
Regulation 24 – Holdings of Interested Parties and Senior Officers
For information regarding the holdings of interested parties in securities of the Company as
of December 31, 2018, see the Company's immediate report of December 30, 2018 (Ref:
2018-01-119953), which is included here by way of reference.
Regulation 24A – Registered Capital, Issued Capital and Convertible Securities
See Note 21A to the Financial Statements.
Regulation 24B – Shareholders Register
As of the report date, the register of the Company's shareholders is as follows:
Shareholder Name
Corporate / ID No. Street City Residency Par value
ADAMA Ltd. 9142000076962287Q 93, East Beijing
Road Jingzhou
City,
Hubei Province,
China
137,990,881
4 On December 28th, 2018, the name of the Company's controlling shareholder was changed from Hubei Sanonda Co., Ltd. to ADAMA Ltd.

8
Regulation 26 – Corporation Directors5
Name of Director Yang Xingqiang Ning Gaoning
Passport Number SE0130853 SE0350153
Date of birth 1967 1958
Address for serving court documents c/o Gross, Kleinhendler, Hodak, Halevy, Greenberg & Co., 1, Azrieli Center (Round Tower),Tel Aviv 60721, Israel
ADAMA Agricultural Solutions Ltd., Golan Street, Airport City 7015103, Israel
Citizenship Chinese Chinese
Member of board committees No No
Independent director or an external director No No
Has accounting and financial expertise or professional qualifications
Professional Qualifications Accounting and Financial Expertise
An employee of the Company, a subsidiary, an associated company of the Company or an interested party
President of China National Chemical Co., Ltd., the indirect controlling shareholder of the Company.
Chairman of China National Chemical Co., Ltd., the indirect controlling shareholder of the Company; Chairman of Syngenta AG, a company fully owned by the Company's indirect controlling shareholder
Commencement of tenure October 17, 2011 September 12, 2018
Education B.Sc. Chemistry, Sichuan University
B.A in Economics, Shandong University MBA, University of Pittsburgh
Activities in preceding five years and service as a director in additional corporations
President of China National Chemical Co., Ltd. Chairman of China National Agrochemical Corporation Vice President of China National Chemical Corporation
Chairman of China National Chemical Co., Ltd. Chairman of Syngenta AG Director of Pirelli Chairman of Sinochem Group Co., Ltd. Chairman of COFCO Corporation
A family member of another interested party in the Company (to the best of the knowledge of the Company and its directors)
No No
A director considered by the Company to have accounting and finance expertise for the purpose of compliance with the minimum quantity established by the Board pursuant to Section 92(A)(12) of the Companies Law
No Yes
5 On July 24, 2018 Mr. Ren Jianxin ceased to serve as a director in the Company.

9
Name of director Chen Lichtenstein An Liru
Passport Number 022977631 PE0610845
Date of birth 1967 1969
Address for serving court documents ADAMA Agricultural Solutions Ltd., Golan Street, Airport City 7015103, Israel
c/o Gross, Kleinhendler, Hodak, Halevy, Greenberg & Co., 1, Azrieli Center (Round Tower), Tel Aviv 60721, Israel
Citizenship Israeli Chinese Member of board committees No No
Independent director or an external director No No
Has accounting and financial expertise or professional qualifications
Professional Qualifications Professional Qualifications
An employee of the Company, a subsidiary, an associated company of the Company or an interested party
President, CEO and director of the Company Chairman and Secretary of the Communist Party Committee of China National Agrochemical Co. Ltd.
Commencement of tenure October 10, 2017 February 27, 2014 Education Joint doctoral degrees (Ph.D. and
JSD), Graduate School of Business and School of Law, Stanford University.
B.A. in Applied Chemistry, Nanjing University. M.A in Chemical Engineering and MBA, Nanjing University
Activities in preceding five years and service as a director in additional corporations
President and CEO of China National Chemical Co., Ltd. President, CEO and director of the Company and ADAMA Ltd.
VP China and director of the Company. Chairman of China National Agrochemical Co., Ltd. Acting CEO of China National Agrochemical Co., Ltd.. Secretary of the Communist Party Committee of China National Agrochemical Co., Ltd..
A family member of another interested party in the Company (to the best of the knowledge of the Company and its directors)
No No
A director considered by the Company to have accounting and finance expertise for the purpose of compliance with the minimum quantity established by the Board pursuant to Section 92(A)(12) of the Companies Law
No No

10
Name of director Gustavo Traiber Dalit Braun
Passport Number 011148426 022416929 Date of birth 1961 1966
Address for serving court documents 39 Rupin St. Tel Aviv, 63457 8/76 Balfour St. Tel Aviv Israel
Citizenship Israeli Israeli
Member of board committees Audit Committee, Financial Statements Review Committee and Remuneration Committee.
Audit Committee, Financial Statements Review Committee and Remuneration Committee.
Independent director or an external director External Director External Director
Has accounting and financial expertise or professional qualifications
Accounting and Financial Expertise Accounting and Financial Expertise
An employee of the Company, a subsidiary, an associated company of the Company or an interested party
No No
Commencement of tenure March 12, 2015 March 12, 2015
Education MBA-Business administration specializing in finance, Interdisciplinary Center (IDC) Herzliya. B.A in Political Science and International Relations, The Hebrew University of Jerusalem.
MBA-Business administration – Tel Aviv University Master degree in European Business Law, Anglia Ruskin University` UK. B.Sc- Industrial Engineering and Management – Technion
Activities in preceding five years and service as a director in additional corporations
Owner and CEO of Spain-Israel Investments Ltd. CEO and founding Partner of Sun Team Group Ltd.
Founder and CEO of Pickn'Tell External Director in 'NETA" External Director in "Dira LeHaskir (Government company) Chairperson of the Board of Kela Foundation
A family member of another interested party in the Company (to the best of the knowledge of the Company and its directors)
No No
A director considered by the Company to have accounting and finance expertise for the purpose of compliance with the minimum quantity established by the Board pursuant to Section 92(A)(12) of the Companies Law
Yes Yes

11
Name of director Jiashu Cheng
Passport Number G39600654 Date of birth 1953
Address for serving court documents ADAMA Agricultural Solutions Ltd., Golan Street, Airport City 7015103, Israel
Citizenship Chinese
Member of board committees Audit Committee, Financial Statements Review Committee and Remuneration Committee.
Independent director or an external director Independent Director
Has accounting and financial expertise or professional qualifications
Accounting and Financial Expertise
An employee of the Company, a subsidiary, an associated company of the Company or an interested party
No
Commencement of tenure March 10, 2015
Education Master of Art in Economic Development, Stanford University; Master of Art in Economics, Stanford University; Major in Planning and Statistics, Department of Economics, Hebei University
Activities in preceding five years and service as a director in additional corporations
Executive Director of Stanford Center at Peking University President of China Operation of Celanese Corporation
A family member of another interested party in the Company (to the best of the knowledge of the Company and its directors)
No
A director considered by the Company to have accounting and finance expertise for the purpose of compliance with the minimum quantity established by the Board pursuant to Section 92(A)(12) of the Companies Law
Yes

12
Regulation 26A – Senior Officers6
Name of officer Shaul Friedland Aviram Lahav Ignacio Dominguez
Identification No. 060847746 056115876 PAD250629 (Spanish passport)
Date of birth 1952 1959 1960
Commencement of office November 1, 2003 June 1, 2010 September 5, 2007
An interested party in the Company / a family member of another senior officer or an interested party
No No No
Education B.Sc. and M.Sc. in Agronomy, Hebrew University of Jerusalem.
BA Accounting, Hebrew University of Jerusalem
Graduate of AMP, Harvard School of Business Management
Master in Automatic Calculus, Complutense University of Madrid
Position in the Company, subsidiary, associated company of the Company or of an interested party
CCO CFO of the Company and ADAMA Ltd; director of several group companies
CCO
Activities in the preceding five years CCO; SVP Sales and Marketing in the Company; CEO of subsidiary – Head of Americas and APAC Region
CFO of the Company and ADAMA Ltd.
CCO; CEO of subsidiary – Head of Europe Region
6 For details regarding Mr. Chen Lichtenstein and Mr. An Liru, who also serve as directors in the Company, see Regulation 26 above.
In January 2018 Mr. Elhanan Abramov seized to serve as a senior officer in the Company.
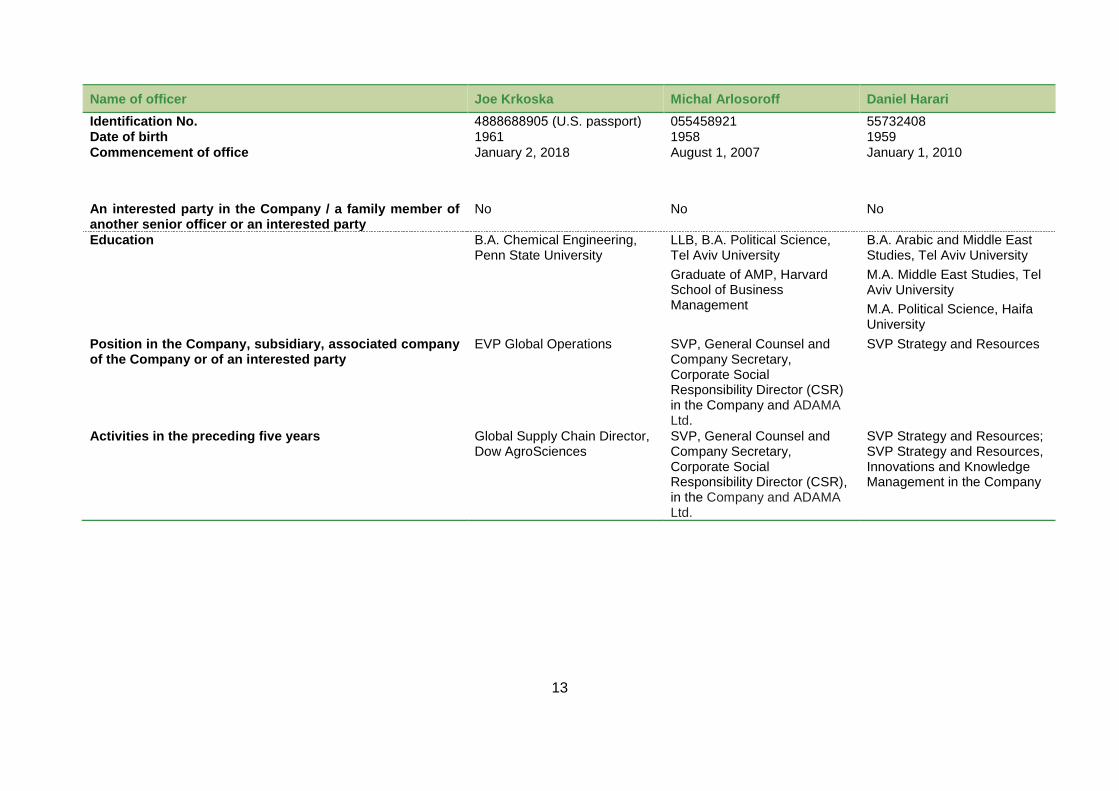
13
Name of officer Joe Krkoska Michal Arlosoroff Daniel Harari
Identification No. 4888688905 (U.S. passport) 055458921 55732408 Date of birth 1961 1958 1959
Commencement of office January 2, 2018 August 1, 2007 January 1, 2010
An interested party in the Company / a family member of another senior officer or an interested party
No No No
Education B.A. Chemical Engineering, Penn State University
LLB, B.A. Political Science, Tel Aviv University
Graduate of AMP, Harvard School of Business Management
B.A. Arabic and Middle East Studies, Tel Aviv University
M.A. Middle East Studies, Tel Aviv University
M.A. Political Science, Haifa University
Position in the Company, subsidiary, associated company of the Company or of an interested party
EVP Global Operations SVP, General Counsel and Company Secretary, Corporate Social Responsibility Director (CSR) in the Company and ADAMA Ltd.
SVP Strategy and Resources
Activities in the preceding five years Global Supply Chain Director, Dow AgroSciences
SVP, General Counsel and Company Secretary, Corporate Social Responsibility Director (CSR), in the Company and ADAMA Ltd.
SVP Strategy and Resources; SVP Strategy and Resources, Innovations and Knowledge Management in the Company

14
Name of officer Shiri Ailon
Keren Yonayov
Yehoshua Hazenfratz
Identification No. 031999816 025699950 52187966
Date of birth 1975 1974 1953
Commencement of office July 1, 2014 June 1, 2010 November 6, 2007
An interested party in the Company / a family member of another senior officer or an interested party
No No No
Education L.L.B, Tel Aviv University; MBA, Oxford Business School.
Business Management and Accounting – The College of Management, Rishon Lezion; CPA, LL.M for auditors – Bar Ilan University.
B.A. Economics and Accounting, Tel Aviv University
Position in the Company, subsidiary, associated company of the Company or of an interested party
VP China Integration and Corporate Development.
Comptroller of the Group Internal Auditor
Activities in the preceding five years Head of Corporate business development and integration with China; Head of Mergers and Acquisitions (2009-2013).
Comptroller of the Group Partner at RSM Shiff Hazenfratz & Co. Internal Auditor of the following companies: Oil and Energy Infrastructures Ltd., Cross Israel Highway Ltd., Castro Ltd., Clal Biotechnology Ltd.

15
Regulation 26B – Independent Authorized Signatories
At the report date, the Company does not have authorized signatories with the power to bind
the Company in any particular action, without requiring the signature of another authority in
the corporation.
Regulation 27 – Corporation Auditors
Accounting firm Brightman, Almagor, Zohar & Co. from the Deloitte Group ("Deloitte"),
Azrieli Center, Menachem Begin road 132, Tel Aviv-Yafo.
Regulation 28 – Adjustments to the Articles of Association or Memorandum
No amendments were made to the Company's Articles of Association during the report year.
Regulation 29 – Board of Directors Recommendations and Resolutions
A. Regulation 29(a) -
1. For details regarding transactions with the Company's controlling shareholder, see Regulation 22 above.
C. Regulation 29(c) – Resolutions of Special General Meetings
1. For details regarding transactions with the Company's controlling shareholder, see Regulation 22 above.
2. In March 2018, the general meeting of the Company approved an amendment to the senior management services agreement in connection with the actual payment of the additional salary paid to the officers under the agreement, as detailed in note (2) of regulation 21 above.
3. In March 2018, the general meeting of the Company approved resolutions in connection with the remuneration of the CEO and a senior officer of the Company, as detailed in Regulation 21 above.
4. After the balance sheet date, in February 2019, the general meeting of the shareholder of the Company approved the grant of long term incentives to the CEO and to a senior officer which serves also as a director.
5. After the balance sheet date, in February 2019, the general meeting of the shareholder of the Company approved an extension and amendment to the remuneration policy of the Company7.
6. After the balance sheet date, In March 2019, the general meeting of the Company approved resolutions with respect to the remuneration of the CEO and senior officers of the Company, including a senior officer which serves also as a director, as detailed in Regulation 21 above.
7 For further details, see immediate report dated September 21, 2019 (Ref. 2019-01-015727).

16
Regulation 29A – Company Resolutions
Listed below are resolutions of the Company Board of Directors that are not specified in the
above "Regulation 29 – Board of Directors Recommendations and Resolutions":
1. Extraordinary Transactions requiring special approval under section 270(1) of
the Companies Law: There are no such resolutions which are not mentioned in
"Regulation 29 – Board of Directors Recommendations and Resolutions" or in
"Regulation 22 – Transactions with Controlling Shareholders".
2. Officers Exemption, Indemnification and Insurance: See Note 19(a)(1) and
19(a)(2) to the financial statements.

17
Date: March 19, 2019
__________________________ ____________________________
Yang Xingqiang, Chairman Chen Lichtenstein, President and CEO

Chapter E
Report regarding the Effectiveness
of the Internal Auditing of
Financial Reporting and Disclosure

Annual report regarding the effectiveness of the internal auditing of financial reporting and disclosure according to Regulation 9B(a):
The Management, under the supervisions of the Board of Directors of ADAMA Agricultural Solutions Ltd. (hereafter: the Corporation) is responsible for determining and maintaining appropriate internal auditing of financial reporting and of disclosure in the Corporation. In this matter, the members of the Management are as follows: ▪ Chen Lichtenstein, President and CEO ▪ Aviram Lahav, CFO ▪ Ignacio Dominguez, CCO ▪ Shaul Friedland, CCO ▪ Joe Krkoska, EVP, Global Operations ▪ Michal Arlosoroff, SVP, General Legal Counsel ▪ Dani Harari, SVP, Strategy and Resources ▪ An Liru, SVP, China The internal auditing of financial reporting and disclosure includes the existing controls and procedures in the Corporation, which were designed by the Chief Executive Officer and the senior corporate financial officer or under their supervision, or by someone who in practice carries out these functions, under the supervision of the Corporation‘s Board of Directors and which are intended to provide a reasonable degree of confidence regarding the reliability of financial reporting and the preparation of the reports according to the instructions of the law and to ensure that the information which the corporation is required to disclose in the reports that it publishes according to the instructions of the law is gathered, processed, summarized and reported on the dates and in the format dictated by law. The internal auditing includes, among other things, audits and procedures that were designed to ensure that the information which the corporation is required to disclose was accumulated and submitted to the corporation‘s Management, including the Chief Executive Officer and the senior corporate financial officer or someone who in practice fulfills these functions, in order to facilitate decision making at the appropriate time, with regard to the disclosure requirements. Due to its structural constraints, internal auditing of financial reporting and disclosure is not intended to fully guarantee that a biased presentation or the omission of information in the reports will be avoided or discovered. The Management, under the supervision of the Board of Directors, has carried out an assessment of the internal auditing of financial reporting and disclosure in the corporation and its effectiveness. The assessment of the effectiveness of internal auditing of financial reporting and disclosure carried out by the Management under the supervision of the Board of Directors consisted four main components: ▪ Entity Level Controls. ▪ Financial Reporting Process and Disclosure. ▪ Information Technology General Controls (ITGC’s). ▪ Control's regarding very significant processes connected with financial reporting: Sales,
Inventories, Purchasing and Hedging transactions / derivatives. Based on the assessment of the effectiveness, carried out by the Management under the supervision of the Board of Directors as stated above, the Board of Directors and the

Management of the Corporation have reached the conclusion that the internal auditing of the financial reports and disclosure in the Corporation as of December 31, 2018 is Effective.

Officers’ Certification
Certification of CEO
I, Chen Lichtenstein, certify that: (1) I have reviewed the periodic report of Adama Agricultural Solutions Ltd. (hereinafter –
"the Company") for the year 2018 (hereinafter – “the Reports"). (2) Based on my knowledge, the Reports do not contain any untrue statement of a material
fact or omit to state a material fact necessary in order to make the statements made, in light of the circumstances under which such statements were made, not misleading with respect to the period covered by the Reports.
(3) Based on my knowledge, the financial statements and other financial information
included in the Reports, fairly present in all material respects, the financial condition, results of operations and cash flows of the Company as of the dates and for the periods presented in the Reports.
(4) I have disclosed, based on my most recent evaluation regarding internal control over
financial reporting and disclosure, to the Company's auditors, Board of Directors and audit and financial statements committees of the Board of Directors: (a) All significant deficiencies and material weaknesses in the design or operation of
internal control over financial reporting and disclosure, which could reasonably adversely affect the Company's ability to record, process, summarize and report financial data so as to cast doubt on the reliability of financial reporting and the preparation of financial statements in accordance with law; and –
(b) Any fraud, whether or not material, that involves the CEO or anyone directly subordinated to the CEO or that involves other employees who have a significant role in internal control over financial reporting and disclosure.
(5) I, alone or together with others in the Company, state that:
(a) I have designed such controls and procedures, or caused such controls and procedures to be designed under my supervision, to ensure that material information relating to the Company, including its consolidated corporations within their meaning in the Securities Law (Annual Financial Statements) – 2010, is made known to me by others in the Company and within those corporations, particularly during the period in which the Reports are being prepared; and –
(b) I have designed such controls and procedures, or caused such controls and procedures to be designed under my supervision, to provide reasonable assurance regarding the reliability of financial reporting and the preparation of financial statements in accordance with law, including in accordance with generally accepted accounting principles;
(c) I have evaluated the effectiveness of internal control over financial reporting and disclosure, and have presented in this report the conclusions of the Board of Directors and of Management about the effectiveness of internal control as at the date of the financial statements.
Nothing in the aforesaid derogates from my responsibility or from the responsibility of any other person under the law. _______________ ___________________ Date: 19.03.2019 Chen Lichtenstein President and CEO

Officers’ Certification
Certification of Chief Financial Officer
I, Aviram Lahav, certify that: (1) I have examined the financial statements and other financial information included in the
reports of Adama Agricultural Solutions Ltd. (hereinafter – "the Company") for the year 2018 (hereinafter – “the Reports").
(2) Based on my knowledge, the financial statements and other financial information
included in the Reports do not contain any untrue statement of a material fact or omit to state a material fact necessary in order to make the statements made, in light of the circumstances under which such statements were made, not misleading with respect to the period covered by the Reports.
(3) Based on my knowledge, the financial statements and other financial information
included in the Reports, fairly present in all material respects, the financial condition, results of operations and cash flows of the Company as of the dates and for the periods presented in the Reports.
(4) I have disclosed, based on my most recent evaluation regarding internal control over
financial reporting and disclosure, to the Company's auditors, Board of Directors and audit and financial statements committees of the Board of Directors:
(a) All significant deficiencies and material weaknesses in the design or operation of
internal control over financial reporting and disclosure to the extent it relates to the financial statements and other financial information included in the Reports, which could reasonably adversely affect the Company's ability to record, process, summarize and report financial data so as to cast doubt on the reliability of financial reporting and the preparation of financial statements in accordance with law; and –
(b) Any fraud, whether or not material, that involves the CEO or anyone directly
subordinated to the CEO or that involves other employees who have a significant role in internal control over financial reporting and disclosure.
(5) I, alone or together with others in the Company, state that:
(a) I have designed such controls and procedures, or caused such controls and procedures to be designed under my supervision, to ensure that material information relating to the Company, including its consolidated corporations within their meaning in the Securities Law (Annual Financial Statements) – 2010, to the extent it relates to the financial statements and other financial information included in the Reports, is made known to me by others in the Company and within those corporations, particularly during the period in which the Reports are being prepared; and –
(b) I have designed such controls and procedures, or caused such controls and
procedures to be designed under my supervision, to provide reasonable assurance regarding the reliability of financial reporting and the preparation of financial statements in accordance with law, including in accordance with generally accepted accounting principles;

(c) I have evaluated the effectiveness of internal control over financial reporting and
disclosure, to the extent it relates to the financial statements and other financial information included in the Reports. My conclusions regarding my aforesaid evaluation have been presented to the Board of Directors and Management and are combined in this Report.
Nothing in the aforesaid derogates from my responsibility or from the responsibility of any other person under the law. _______________ ___________________ Date: 19.03.2018 Aviram Lahav CFO