Periodic climate cooling enhanced natural disasters and wars in China during AD 10-1900
10
doi: 10.1098/rspb.2010.0890 published online 14 July 2010 Proc. R. Soc. B Nils Chr Stenseth Zhibin Zhang, Huidong Tian, Bernard Cazelles, Kyrre L. Kausrud, Achim Bräuning, Fang Guo and 1900 - in China during AD 10 Periodic climate cooling enhanced natural disasters and wars Supplementary data tml http://rspb.royalsocietypublishing.org/content/suppl/2010/07/13/rspb.2010.0890.DC1.h "Data Supplement" References ml#ref-list-1 http://rspb.royalsocietypublishing.org/content/early/2010/07/13/rspb.2010.0890.full.ht This article cites 25 articles, 5 of which can be accessed free P<P Published online 14 July 2010 in advance of the print journal. Subject collections (364 articles) environmental science (1600 articles) ecology Articles on similar topics can be found in the following collections Email alerting service here right-hand corner of the article or click Receive free email alerts when new articles cite this article - sign up in the box at the top publication. Citations to Advance online articles must include the digital object identifier (DOIs) and date of initial online articles are citable and establish publication priority; they are indexed by PubMed from initial publication. the paper journal (edited, typeset versions may be posted when available prior to final publication). Advance Advance online articles have been peer reviewed and accepted for publication but have not yet appeared in http://rspb.royalsocietypublishing.org/subscriptions go to: Proc. R. Soc. B To subscribe to This journal is © 2010 The Royal Society on July 14, 2010 rspb.royalsocietypublishing.org Downloaded from
Transcript of Periodic climate cooling enhanced natural disasters and wars in China during AD 10-1900
doi: 10.1098/rspb.2010.0890 published online 14 July 2010Proc. R. Soc. B
Nils Chr StensethZhibin Zhang, Huidong Tian, Bernard Cazelles, Kyrre L. Kausrud, Achim Bräuning, Fang Guo and
1900−in China during AD 10Periodic climate cooling enhanced natural disasters and wars
Supplementary data
tmlhttp://rspb.royalsocietypublishing.org/content/suppl/2010/07/13/rspb.2010.0890.DC1.h
"Data Supplement"
Referencesml#ref-list-1http://rspb.royalsocietypublishing.org/content/early/2010/07/13/rspb.2010.0890.full.ht
This article cites 25 articles, 5 of which can be accessed free
P<P Published online 14 July 2010 in advance of the print journal.
Subject collections
(364 articles)environmental science � (1600 articles)ecology �
Articles on similar topics can be found in the following collections
Email alerting service hereright-hand corner of the article or click Receive free email alerts when new articles cite this article - sign up in the box at the top
publication. Citations to Advance online articles must include the digital object identifier (DOIs) and date of initial online articles are citable and establish publication priority; they are indexed by PubMed from initial publication.the paper journal (edited, typeset versions may be posted when available prior to final publication). Advance Advance online articles have been peer reviewed and accepted for publication but have not yet appeared in
http://rspb.royalsocietypublishing.org/subscriptions go to: Proc. R. Soc. BTo subscribe to
This journal is © 2010 The Royal Society
on July 14, 2010rspb.royalsocietypublishing.orgDownloaded from
Proc. R. Soc. B
on July 14, 2010rspb.royalsocietypublishing.orgDownloaded from
* Autho
Electron1098/rsp
doi:10.1098/rspb.2010.0890
Published online
ReceivedAccepted
Periodic climate cooling enhancednatural disasters and wars in China
during AD 10–1900Zhibin Zhang1,*, Huidong Tian1,4, Bernard Cazelles3,5, Kyrre
L. Kausrud2, Achim Brauning6, Fang Guo7 and Nils Chr Stenseth2
1State Key Laboratory of Integrated Management on Pest Insects and Rodents in Agriculture, Institute of Zoology,
Chinese Academy of Sciences, Beijing 100101, People’s Republic of China2Centre for Ecological and Evolutionary Synthesis (CEES), Department of Biology, University of Oslo,
PO Box 1066, Blindern 0316, Oslo, Norway3UMR 7625, UPMC-CNRS-ENS, Ecole Normale Superieure, 46 rue d’Ulm, 75230 Paris cedex 05, France
4Graduate University of Chinese Academy of Sciences, Beijing 100049, People’s Republic of China5UMI 209, IRD-UPMC, 32 avenue Henri Varagnat, 93142 Bondy cedex, France
6Friedrich-Alexander University Erlangen-Nuremberg, Institute of Geography, Kochstrasse 4/4,
91054 Erlangen, Germany7Institute of World History, The Chinese Academy of Social Sciences, Beijing 100732, People’s Republic of China
Recent studies have linked climatic and social instabilities in ancient China; the underlying causal mech-
anisms have, however, often not been quantitatively assessed. Here, using historical records and
palaeoclimatic reconstructions during AD 10–1900, we demonstrate that war frequency, price of rice,
locust plague, drought frequency, flood frequency and temperature in China show two predominant
periodic bands around 160 and 320 years where they interact significantly with each other. Temperature
cooling shows direct positive association with the frequency of external aggression war to the Chinese
dynasties mostly from the northern pastoral nomadic societies, and indirect positive association with
the frequency of internal war within the Chinese dynasties through drought and locust plagues. The col-
lapses of the agricultural dynasties of the Han, Tang, Song and Ming are more closely associated with low
temperature. Our study suggests that food production during the last two millennia has been more
unstable during cooler periods, resulting in more social conflicts owing to rebellions within the dynasties
or/and southward aggressions from northern pastoral nomadic societies in ancient China.
Keywords: global warming; war cycle; drought/flood; locust plague;
southward migration; human ecology
1. INTRODUCTIONHistorians commonly attribute dynastic transitions or
cycles to the quality of government and class struggles
(Zhang et al. 2005). However, climatic fluctuation may
be a significant factor interacting with social structures
in affecting the rise and fall of cultures and dynasties
(Cowie 1998; Hsu 1998). When the climate worsens
beyond what the available technology and economic
system can compensate for, people are forced to move
or starve. Some authors suggest that climate cooling has
had a huge impact on the production of crops and
herds in pre-industrial Europe and China (Hinsch
1998; Atwell 2002; Zhang et al. 2007a), even triggering
mass southward migration of northern nomadic societies
(Fang & Liu 1992; Wang 1996; Hsu 1998). This ecologi-
cal and agricultural stress is likely to result in wars and
social unrest, often followed by dynastic transitions
(Zhang et al. 2005). A few recent studies have demon-
strated that wars and social unrests in the past often
r for correspondence ([email protected]).
ic supplementary material is available at http://dx.doi.org/10.b.2010.0890 or via http://rspb.royalsocietypublishing.org.
10 May 201023 June 2010 1
were associated with cold climate phases (Zhang et al.
2005, 2007a,b). Climate cooling may have increased
locust plagues through temperature-driven droughts or
floods in ancient China (Stige et al. 2007; Zhang et al.
2009). Therefore, cool temperatures may directly or
indirectly be detrimental to agriculture, and thus stimu-
late wars of rebellion within a dynasty (defined here as
the ‘internal war hypothesis’; see Zhang et al. 2005,
2007a,b). Alternatively, climate fluctuations may
force nomads of the north during cold periods, through
affecting livestock production (Fang & Liu 1992; Wang
1996; Hsu 1998), to migrate southwards, and thereby
increase the frequency of conflicts between these northern
pastoral nomadic societies and the agricultural societies
(defined here as the ‘southward aggression hypothesis’).
However, both hypotheses have not yet been
quantitatively assessed.
The purpose of this study aims to reveal the periodic
cycles of war frequency in ancient China, and the associ-
ations of external aggression war or internal war with
climatic or agricultural disasters. Our emphasis is on
testing the internal war hypothesis and the southward
aggression hypothesis. We use historical data on war fre-
quency, drought frequency and flood frequency, all of
This journal is q 2010 The Royal Society
2 Z. Zhang et al. Periodic cooling increased wars
on July 14, 2010rspb.royalsocietypublishing.orgDownloaded from
which having been complied by Chen (1939). In
addition we use a multi-proxy temperature reconstruc-
tion for the whole of China reported by Yang et al.
(2002), air temperature data for the Northern Hemi-
sphere (Mann & Jones 2003), proxy temperature data
for Beijing (Tan et al. 2003), and a historical locust data-
set reported by Stige et al. (2007) and extracted from Ma
(1958). Finally, we use historical data of rice price vari-
ations reported by Peng (2007). Chen (1939)
distinguished wars into internal wars within the Chinese
dynasties (including peasant uprisings and battles
among warring states) and external aggression wars
where the Chinese dynasties fought aggression from
external societies (predominantly southward aggressions
by northern nomads). These data on war frequencies
provide us with the unique opportunity to test the temp-
erature-associated internal war hypothesis and the
external southward aggression hypothesis separately. The
available data of rice price, drought/flood and locust
plague occurrence enable us to assess the proposed
potential causal mechanisms of how temperature vari-
ations affect war frequency. Cross-correlation function
(CCF) and wavelet analysis were used to conduct statisti-
cal analysis on associations between war frequency and
the influential factors.
2. MATERIAL AND METHODS(a) War frequency data
The decadal data of war frequency from 246 BC to AD 1913
was complied by Chen (1939) by referring to a large number
of historical books. By following the traditional view of
Chinese historians, wars were classified into three categories
by Chen (1939): internal wars (Nei Huan), external aggres-
sion wars (Wai Huan) and other wars. The internal wars were
defined as the battles within the Chinese dynasties ruled by
either Han or non-Han descendants. The internal wars
include peasant uprisings and battles among warring states
within the Chinese dynasties. The external aggression wars
were defined as battles between the Chinese dynasties and
surrounding external societies (e.g. Northern Zhou, North-
ern Qi, Former Qin, Liao, Jin, Xi Xia, Huigu, Xiongnu,
Mongolian, Qiang, Tibetan) that tried to raid or invade the
territory of the Chinese dynasties. During AD 10–1900,
the external aggression wars to the Chinese dynasties were
mostly owing to southward aggressions from northern pas-
toral nomadic societies (e.g. Xiongnu, Mongolian,
Manchurian, Nuzhen, Xianbei, Qidan). Wars that could
not be clearly defined, or wars when the Chinese dynasties
were invading the surrounding societies for expansion or as
demonstrations of force, were defined as other wars. Chen
(1939) compiled the data in decadal scale. However, in
some periods, his decadal resolution does not match the
calendarical decadal scale but is shifted for several years.
Thus, if applicable, war frequency was recalculated from
the original data of Chen (1939) by averaging the war fre-
quencies of the neighbouring two decades to produce the
best match to the calendarical decadal scale of the tempera-
ture time series. The book by Chen (1939) documents a
higher number of wars than the two-volume book entitled
Tabulation of wars in Ancient China (ECCMH 2002). The
war data in the book edited by ECCMH (2002) was not
classified into internal wars or external aggression wars,
and are therefore not suitable for our study purposes.
Proc. R. Soc. B
(b) Temperature data
Decadal mean temperature for the whole of China (T)
during AD 10–1990 was reconstructed by Yang et al.
(2002) by combining multiple area weighted palaeoclimate
proxy records obtained from ice cores, tree rings, lake
sediments and historical records. The Northern Hemisphere
air temperatures (TN) from AD 200 to present were down-
loaded from the IGBP PAGES/World Data Center for
Paleoclimatology (Data Contribution Series #2003-051) at
the ftp site ftp://ftp.ncdc.noaa.gov/pub/data/paleo/contribu-
tions_by_author/mann2003b/mann2003b.txt. The original
data are from a reference by Mann & Jones (2003). The air
temperature in the warm season (May, June, July and
August) near Beijing (TB) during 665 BC–AD 1985 is
reconstructed by Tan et al. (2003) based on a correlation
between thickness variations in annual layers of a stalagmite
from Shihua Cave (Beijing, China) and instrumental meteor-
ological records. This record represents the only site close to
northern pastoral nomadic regions having the long-term
temperature data.
(c) Flood/drought data
Chen (1939) also compiled data of decadal frequencies of
flood and drought events from 246 BC to AD 1913 covering
the whole of China. The frequency of flood/drought events
was calculated as the number of flood/drought records for
each decade within the dynastic periods during AD
10–1900. As for the war frequency data, if applicable, the
flood/drought data were also recalculated to produce the
best calendarical decadal time series of flood/drought.
(d) Locust data
The decadal locust abundance data for AD 950–1950 was
taken from Stige et al. (2007). Decadal means of locust
abundance for the period AD 957–1956 were extracted
from annual locust abundance (fig. 9a in Ma 1958). Ma
(1958) derived the series by referring to the reported
intensity and spatial extent of locust outbreaks mentioned
in various sources of the older Chinese literature (e.g.
Chen 1936, 1939).
(e) Rice price data
The decadal average of rice price is an indicator of grain or
food shortage in ancient China (also see Zhang et al.
2007a). We used the annual data of rice price for the
whole of China compiled by Peng (2007; a reprint copy of
Peng 1965) for AD 961–1900, with 12 missing values
during AD 1250–1360 and AD 1410. The missing data
were reconstructed by interpolation. The prices of rice are
different in currency unit for the periods AD 961–1250
(unit: silver) and AD 1361–1900 (unit: cent). The exchange
rate of silver : cent was about 37 : 1. To achieve a smooth time
series, the data of rice price for the period AD 961–1250
were adjusted to the same average as in the period
AD 1361–1900 (the ratio of the averages of the two periods
is 30, quite close to the silver : cent ratio).
(f ) Statistics
All data except for temperature and locust data were first
naturally log-transformed to stabilize variance. Frequencies
of wars, drought/flood and locust plagues showed increasing
trends with time, which are probably caused by better
recording with progress of the societies. All data were then
detrended by removing low-frequency components (more
than 640 years) using low-pass filtering (Shumway & Stoffer
−101
(a)
−101
(b)
−101
(c)
−101
(d)
−101
(e)
−101
( f )
−101
(g)
−101
(h)
A B C D E F G H I J
0 200 400 600 800 1000 1200 1400 1600 1800year
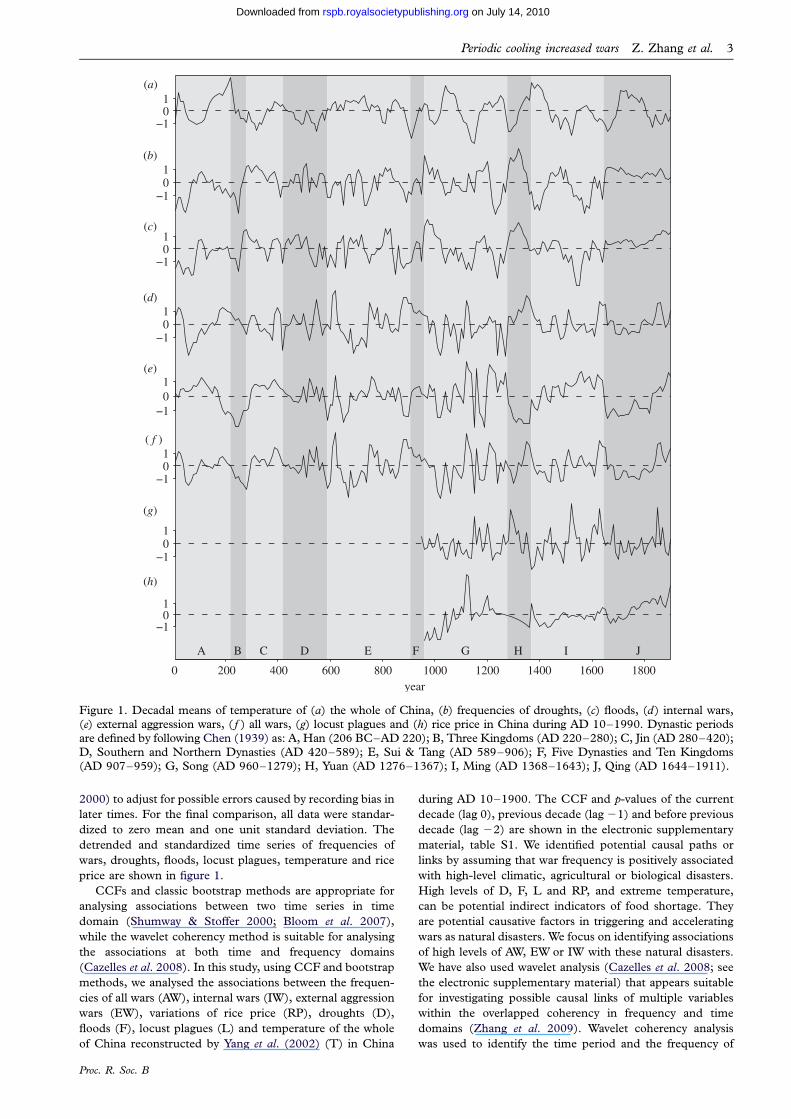
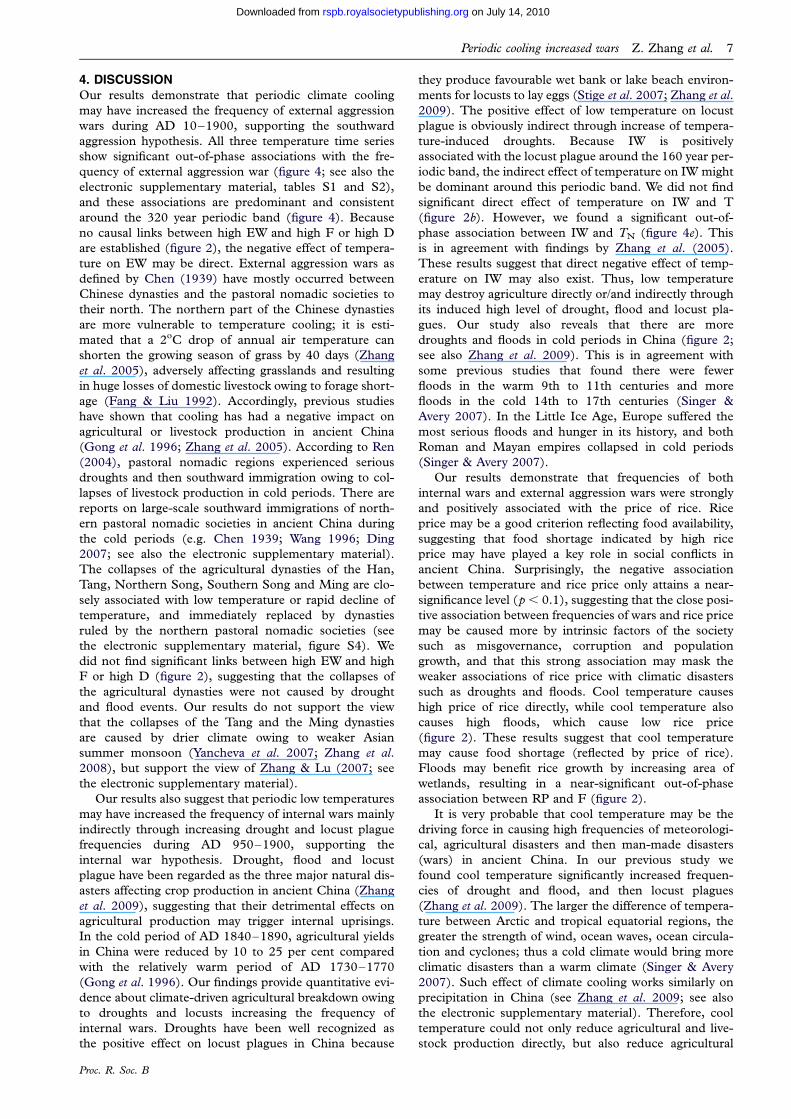
Figure 1. Decadal means of temperature of (a) the whole of China, (b) frequencies of droughts, (c) floods, (d) internal wars,(e) external aggression wars, ( f ) all wars, (g) locust plagues and (h) rice price in China during AD 10–1990. Dynastic periodsare defined by following Chen (1939) as: A, Han (206 BC–AD 220); B, Three Kingdoms (AD 220–280); C, Jin (AD 280–420);D, Southern and Northern Dynasties (AD 420–589); E, Sui & Tang (AD 589–906); F, Five Dynasties and Ten Kingdoms(AD 907–959); G, Song (AD 960–1279); H, Yuan (AD 1276–1367); I, Ming (AD 1368–1643); J, Qing (AD 1644–1911).
Periodic cooling increased wars Z. Zhang et al. 3
on July 14, 2010rspb.royalsocietypublishing.orgDownloaded from
2000) to adjust for possible errors caused by recording bias in
later times. For the final comparison, all data were standar-
dized to zero mean and one unit standard deviation. The
detrended and standardized time series of frequencies of
wars, droughts, floods, locust plagues, temperature and rice
price are shown in figure 1.
CCFs and classic bootstrap methods are appropriate for
analysing associations between two time series in time
domain (Shumway & Stoffer 2000; Bloom et al. 2007),
while the wavelet coherency method is suitable for analysing
the associations at both time and frequency domains
(Cazelles et al. 2008). In this study, using CCF and bootstrap
methods, we analysed the associations between the frequen-
cies of all wars (AW), internal wars (IW), external aggression
wars (EW), variations of rice price (RP), droughts (D),
floods (F), locust plagues (L) and temperature of the whole
of China reconstructed by Yang et al. (2002) (T) in China
Proc. R. Soc. B
during AD 10–1900. The CCF and p-values of the current
decade (lag 0), previous decade (lag 21) and before previous
decade (lag 22) are shown in the electronic supplementary
material, table S1. We identified potential causal paths or
links by assuming that war frequency is positively associated
with high-level climatic, agricultural or biological disasters.
High levels of D, F, L and RP, and extreme temperature,
can be potential indirect indicators of food shortage. They
are potential causative factors in triggering and accelerating
wars as natural disasters. We focus on identifying associations
of high levels of AW, EW or IW with these natural disasters.
We have also used wavelet analysis (Cazelles et al. 2008; see
the electronic supplementary material) that appears suitable
for investigating possible causal links of multiple variables
within the overlapped coherency in frequency and time
domains (Zhang et al. 2009). Wavelet coherency analysis
was used to identify the time period and the frequency of
temperature
flood drought
rice price locust
all wars
temperature
flood drought
rice price locust
external wars internal wars
*
*
*
*
*
*
(a) (b)
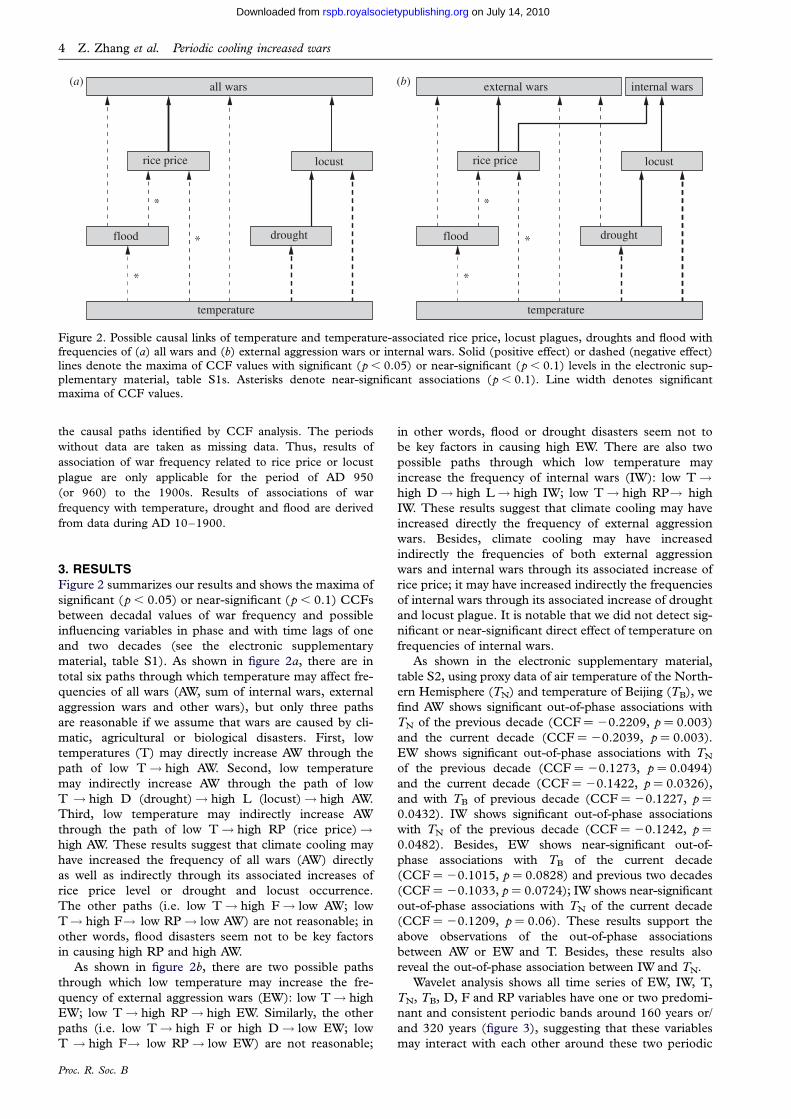
Figure 2. Possible causal links of temperature and temperature-associated rice price, locust plagues, droughts and flood withfrequencies of (a) all wars and (b) external aggression wars or internal wars. Solid (positive effect) or dashed (negative effect)lines denote the maxima of CCF values with significant (p , 0.05) or near-significant (p , 0.1) levels in the electronic sup-plementary material, table S1s. Asterisks denote near-significant associations (p , 0.1). Line width denotes significantmaxima of CCF values.
4 Z. Zhang et al. Periodic cooling increased wars
on July 14, 2010rspb.royalsocietypublishing.orgDownloaded from
the causal paths identified by CCF analysis. The periods
without data are taken as missing data. Thus, results of
association of war frequency related to rice price or locust
plague are only applicable for the period of AD 950
(or 960) to the 1900s. Results of associations of war
frequency with temperature, drought and flood are derived
from data during AD 10–1900.
3. RESULTSFigure 2 summarizes our results and shows the maxima of
significant (p , 0.05) or near-significant (p , 0.1) CCFs
between decadal values of war frequency and possible
influencing variables in phase and with time lags of one
and two decades (see the electronic supplementary
material, table S1). As shown in figure 2a, there are in
total six paths through which temperature may affect fre-
quencies of all wars (AW, sum of internal wars, external
aggression wars and other wars), but only three paths
are reasonable if we assume that wars are caused by cli-
matic, agricultural or biological disasters. First, low
temperatures (T) may directly increase AW through the
path of low T! high AW. Second, low temperature
may indirectly increase AW through the path of low
T ! high D (drought)! high L (locust)! high AW.
Third, low temperature may indirectly increase AW
through the path of low T! high RP (rice price)!high AW. These results suggest that climate cooling may
have increased the frequency of all wars (AW) directly
as well as indirectly through its associated increases of
rice price level or drought and locust occurrence.
The other paths (i.e. low T! high F! low AW; low
T! high F! low RP! low AW) are not reasonable; in
other words, flood disasters seem not to be key factors
in causing high RP and high AW.
As shown in figure 2b, there are two possible paths
through which low temperature may increase the fre-
quency of external aggression wars (EW): low T! high
EW; low T! high RP! high EW. Similarly, the other
paths (i.e. low T! high F or high D! low EW; low
T ! high F! low RP! low EW) are not reasonable;
Proc. R. Soc. B
in other words, flood or drought disasters seem not to
be key factors in causing high EW. There are also two
possible paths through which low temperature may
increase the frequency of internal wars (IW): low T!high D! high L! high IW; low T! high RP! high
IW. These results suggest that climate cooling may have
increased directly the frequency of external aggression
wars. Besides, climate cooling may have increased
indirectly the frequencies of both external aggression
wars and internal wars through its associated increase of
rice price; it may have increased indirectly the frequencies
of internal wars through its associated increase of drought
and locust plague. It is notable that we did not detect sig-
nificant or near-significant direct effect of temperature on
frequencies of internal wars.
As shown in the electronic supplementary material,
table S2, using proxy data of air temperature of the North-
ern Hemisphere (TN) and temperature of Beijing (TB), we
find AW shows significant out-of-phase associations with
TN of the previous decade (CCF¼ 20.2209, p ¼ 0.003)
and the current decade (CCF¼ 20.2039, p ¼ 0.003).
EW shows significant out-of-phase associations with TN
of the previous decade (CCF¼ 20.1273, p ¼ 0.0494)
and the current decade (CCF¼ 20.1422, p ¼ 0.0326),
and with TB of previous decade (CCF¼ 20.1227, p ¼
0.0432). IW shows significant out-of-phase associations
with TN of the previous decade (CCF¼ 20.1242, p ¼
0.0482). Besides, EW shows near-significant out-of-
phase associations with TB of the current decade
(CCF¼ 20.1015, p ¼ 0.0828) and previous two decades
(CCF¼ 20.1033, p ¼ 0.0724); IW shows near-significant
out-of-phase associations with TN of the current decade
(CCF¼ 20.1209, p ¼ 0.06). These results support the
above observations of the out-of-phase associations
between AW or EW and T. Besides, these results also
reveal the out-of-phase association between IW and TN.
Wavelet analysis shows all time series of EW, IW, T,
TN, TB, D, F and RP variables have one or two predomi-
nant and consistent periodic bands around 160 years or/
and 320 years (figure 3), suggesting that these variables
may interact with each other around these two periodic
(a)
100 300 500 700 900 1100 1300 1500 1700 190020
40
80
160
320
640pe
riod
2 4
(b)
100 300 500 700 900 1100 1300 1500 1700 190020
40
80
160
320
640
peri
od
6 10
(c)
100 300 500 700 900 1100 1300 1500 1700 190020
40
80
160
320
640
peri
od
2 4
(d)
100 300 500 700 900 1100 1300 1500 1700 190020
40
80
160
320
640
peri
od
2 4
(e)
100 300 500 700 900 1100 1300 1500 1700 190020
40
80
160
320
640
peri
od
year4 8
power
( f )
100 300 500 700 900 1100 1300 1500 1700 1900 4 8
(g)
100 300 500 700 900 1100 1300 1500 1700 1900 1 2 3
(h)
100 300 500 700 900 1100 1300 1500 1700 1900 3 5
(i)
100 300 500 700 900 1100 1300 1500 1700 1900 4 6 8
(j)
100 300 500 700 900 1100 1300 1500 1700 1900year
6 10power
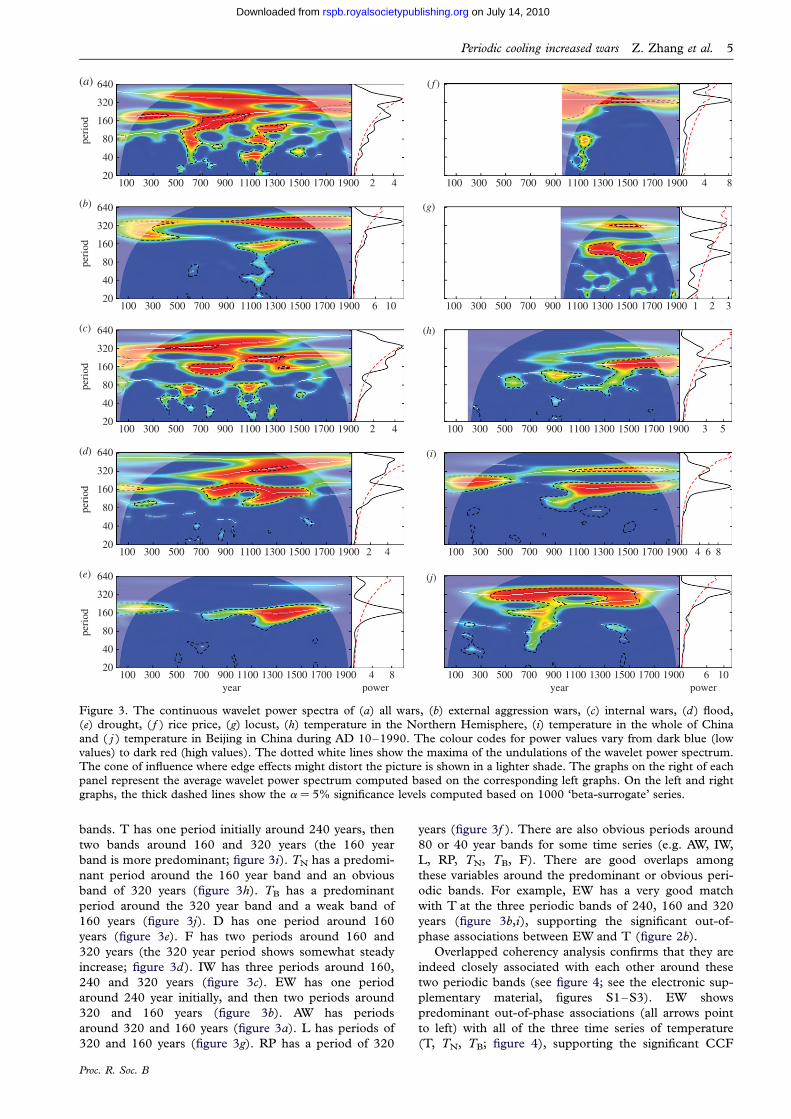
Figure 3. The continuous wavelet power spectra of (a) all wars, (b) external aggression wars, (c) internal wars, (d) flood,(e) drought, ( f ) rice price, (g) locust, (h) temperature in the Northern Hemisphere, (i) temperature in the whole of China
and ( j ) temperature in Beijing in China during AD 10–1990. The colour codes for power values vary from dark blue (lowvalues) to dark red (high values). The dotted white lines show the maxima of the undulations of the wavelet power spectrum.The cone of influence where edge effects might distort the picture is shown in a lighter shade. The graphs on the right of eachpanel represent the average wavelet power spectrum computed based on the corresponding left graphs. On the left and rightgraphs, the thick dashed lines show the a ¼ 5% significance levels computed based on 1000 ‘beta-surrogate’ series.
Periodic cooling increased wars Z. Zhang et al. 5
on July 14, 2010rspb.royalsocietypublishing.orgDownloaded from
bands. T has one period initially around 240 years, then
two bands around 160 and 320 years (the 160 year
band is more predominant; figure 3i). TN has a predomi-
nant period around the 160 year band and an obvious
band of 320 years (figure 3h). TB has a predominant
period around the 320 year band and a weak band of
160 years (figure 3j). D has one period around 160
years (figure 3e). F has two periods around 160 and
320 years (the 320 year period shows somewhat steady
increase; figure 3d). IW has three periods around 160,
240 and 320 years (figure 3c). EW has one period
around 240 year initially, and then two periods around
320 and 160 years (figure 3b). AW has periods
around 320 and 160 years (figure 3a). L has periods of
320 and 160 years (figure 3g). RP has a period of 320
Proc. R. Soc. B
years (figure 3f ). There are also obvious periods around
80 or 40 year bands for some time series (e.g. AW, IW,
L, RP, TN, TB, F). There are good overlaps among
these variables around the predominant or obvious peri-
odic bands. For example, EW has a very good match
with T at the three periodic bands of 240, 160 and 320
years (figure 3b,i), supporting the significant out-of-
phase associations between EW and T (figure 2b).
Overlapped coherency analysis confirms that they are
indeed closely associated with each other around these
two periodic bands (see figure 4; see the electronic sup-
plementary material, figures S1–S3). EW shows
predominant out-of-phase associations (all arrows point
to left) with all of the three time series of temperature
(T, TN, TB; figure 4), supporting the significant CCF
100 300 500 700 900 1100 1300 1500 1700 190020
40
80
160
320
640
peri
od
(a)
300 500 700 900 1100 1300 1500 1700 190020
40
80
160
320
640
peri
od
(b)
100 300 500 700 900 1100 1300 1500 1700 190020
40
80
160
320
640
peri
od
year
(c)
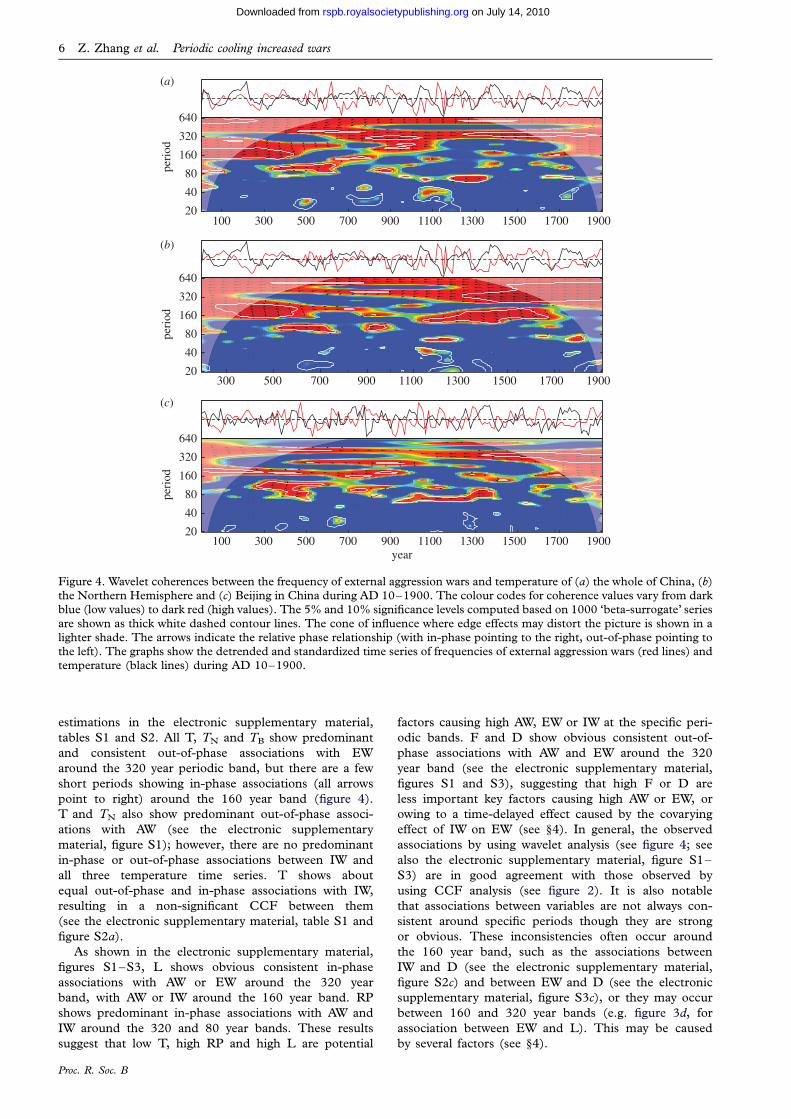
Figure 4. Wavelet coherences between the frequency of external aggression wars and temperature of (a) the whole of China, (b)the Northern Hemisphere and (c) Beijing in China during AD 10–1900. The colour codes for coherence values vary from darkblue (low values) to dark red (high values). The 5% and 10% significance levels computed based on 1000 ‘beta-surrogate’ series
are shown as thick white dashed contour lines. The cone of influence where edge effects may distort the picture is shown in alighter shade. The arrows indicate the relative phase relationship (with in-phase pointing to the right, out-of-phase pointing tothe left). The graphs show the detrended and standardized time series of frequencies of external aggression wars (red lines) andtemperature (black lines) during AD 10–1900.
6 Z. Zhang et al. Periodic cooling increased wars
on July 14, 2010rspb.royalsocietypublishing.orgDownloaded from
estimations in the electronic supplementary material,
tables S1 and S2. All T, TN and TB show predominant
and consistent out-of-phase associations with EW
around the 320 year periodic band, but there are a few
short periods showing in-phase associations (all arrows
point to right) around the 160 year band (figure 4).
T and TN also show predominant out-of-phase associ-
ations with AW (see the electronic supplementary
material, figure S1); however, there are no predominant
in-phase or out-of-phase associations between IW and
all three temperature time series. T shows about
equal out-of-phase and in-phase associations with IW,
resulting in a non-significant CCF between them
(see the electronic supplementary material, table S1 and
figure S2a).
As shown in the electronic supplementary material,
figures S1–S3, L shows obvious consistent in-phase
associations with AW or EW around the 320 year
band, with AW or IW around the 160 year band. RP
shows predominant in-phase associations with AW and
IW around the 320 and 80 year bands. These results
suggest that low T, high RP and high L are potential
Proc. R. Soc. B
factors causing high AW, EW or IW at the specific peri-
odic bands. F and D show obvious consistent out-of-
phase associations with AW and EW around the 320
year band (see the electronic supplementary material,
figures S1 and S3), suggesting that high F or D are
less important key factors causing high AW or EW, or
owing to a time-delayed effect caused by the covarying
effect of IW on EW (see §4). In general, the observed
associations by using wavelet analysis (see figure 4; see
also the electronic supplementary material, figure S1–
S3) are in good agreement with those observed by
using CCF analysis (see figure 2). It is also notable
that associations between variables are not always con-
sistent around specific periods though they are strong
or obvious. These inconsistencies often occur around
the 160 year band, such as the associations between
IW and D (see the electronic supplementary material,
figure S2c) and between EW and D (see the electronic
supplementary material, figure S3c), or they may occur
between 160 and 320 year bands (e.g. figure 3d, for
association between EW and L). This may be caused
by several factors (see §4).
Periodic cooling increased wars Z. Zhang et al. 7
on July 14, 2010rspb.royalsocietypublishing.orgDownloaded from
4. DISCUSSIONOur results demonstrate that periodic climate cooling
may have increased the frequency of external aggression
wars during AD 10–1900, supporting the southward
aggression hypothesis. All three temperature time series
show significant out-of-phase associations with the fre-
quency of external aggression war (figure 4; see also the
electronic supplementary material, tables S1 and S2),
and these associations are predominant and consistent
around the 320 year periodic band (figure 4). Because
no causal links between high EW and high F or high D
are established (figure 2), the negative effect of tempera-
ture on EW may be direct. External aggression wars as
defined by Chen (1939) have mostly occurred between
Chinese dynasties and the pastoral nomadic societies to
their north. The northern part of the Chinese dynasties
are more vulnerable to temperature cooling; it is esti-
mated that a 2oC drop of annual air temperature can
shorten the growing season of grass by 40 days (Zhang
et al. 2005), adversely affecting grasslands and resulting
in huge losses of domestic livestock owing to forage short-
age (Fang & Liu 1992). Accordingly, previous studies
have shown that cooling has had a negative impact on
agricultural or livestock production in ancient China
(Gong et al. 1996; Zhang et al. 2005). According to Ren
(2004), pastoral nomadic regions experienced serious
droughts and then southward immigration owing to col-
lapses of livestock production in cold periods. There are
reports on large-scale southward immigrations of north-
ern pastoral nomadic societies in ancient China during
the cold periods (e.g. Chen 1939; Wang 1996; Ding
2007; see also the electronic supplementary material).
The collapses of the agricultural dynasties of the Han,
Tang, Northern Song, Southern Song and Ming are clo-
sely associated with low temperature or rapid decline of
temperature, and immediately replaced by dynasties
ruled by the northern pastoral nomadic societies (see
the electronic supplementary material, figure S4). We
did not find significant links between high EW and high
F or high D (figure 2), suggesting that the collapses of
the agricultural dynasties were not caused by drought
and flood events. Our results do not support the view
that the collapses of the Tang and the Ming dynasties
are caused by drier climate owing to weaker Asian
summer monsoon (Yancheva et al. 2007; Zhang et al.
2008), but support the view of Zhang & Lu (2007; see
the electronic supplementary material).
Our results also suggest that periodic low temperatures
may have increased the frequency of internal wars mainly
indirectly through increasing drought and locust plague
frequencies during AD 950–1900, supporting the
internal war hypothesis. Drought, flood and locust
plague have been regarded as the three major natural dis-
asters affecting crop production in ancient China (Zhang
et al. 2009), suggesting that their detrimental effects on
agricultural production may trigger internal uprisings.
In the cold period of AD 1840–1890, agricultural yields
in China were reduced by 10 to 25 per cent compared
with the relatively warm period of AD 1730–1770
(Gong et al. 1996). Our findings provide quantitative evi-
dence about climate-driven agricultural breakdown owing
to droughts and locusts increasing the frequency of
internal wars. Droughts have been well recognized as
the positive effect on locust plagues in China because
Proc. R. Soc. B
they produce favourable wet bank or lake beach environ-
ments for locusts to lay eggs (Stige et al. 2007; Zhang et al.
2009). The positive effect of low temperature on locust
plague is obviously indirect through increase of tempera-
ture-induced droughts. Because IW is positively
associated with the locust plague around the 160 year per-
iodic band, the indirect effect of temperature on IW might
be dominant around this periodic band. We did not find
significant direct effect of temperature on IW and T
(figure 2b). However, we found a significant out-of-
phase association between IW and TN (figure 4e). This
is in agreement with findings by Zhang et al. (2005).
These results suggest that direct negative effect of temp-
erature on IW may also exist. Thus, low temperature
may destroy agriculture directly or/and indirectly through
its induced high level of drought, flood and locust pla-
gues. Our study also reveals that there are more
droughts and floods in cold periods in China (figure 2;
see also Zhang et al. 2009). This is in agreement with
some previous studies that found there were fewer
floods in the warm 9th to 11th centuries and more
floods in the cold 14th to 17th centuries (Singer &
Avery 2007). In the Little Ice Age, Europe suffered the
most serious floods and hunger in its history, and both
Roman and Mayan empires collapsed in cold periods
(Singer & Avery 2007).
Our results demonstrate that frequencies of both
internal wars and external aggression wars were strongly
and positively associated with the price of rice. Rice
price may be a good criterion reflecting food availability,
suggesting that food shortage indicated by high rice
price may have played a key role in social conflicts in
ancient China. Surprisingly, the negative association
between temperature and rice price only attains a near-
significance level (p , 0.1), suggesting that the close posi-
tive association between frequencies of wars and rice price
may be caused more by intrinsic factors of the society
such as misgovernance, corruption and population
growth, and that this strong association may mask the
weaker associations of rice price with climatic disasters
such as droughts and floods. Cool temperature causes
high price of rice directly, while cool temperature also
causes high floods, which cause low rice price
(figure 2). These results suggest that cool temperature
may cause food shortage (reflected by price of rice).
Floods may benefit rice growth by increasing area of
wetlands, resulting in a near-significant out-of-phase
association between RP and F (figure 2).
It is very probable that cool temperature may be the
driving force in causing high frequencies of meteorologi-
cal, agricultural disasters and then man-made disasters
(wars) in ancient China. In our previous study we
found cool temperature significantly increased frequen-
cies of drought and flood, and then locust plagues
(Zhang et al. 2009). The larger the difference of tempera-
ture between Arctic and tropical equatorial regions, the
greater the strength of wind, ocean waves, ocean circula-
tion and cyclones; thus a cold climate would bring more
climatic disasters than a warm climate (Singer & Avery
2007). Such effect of climate cooling works similarly on
precipitation in China (see Zhang et al. 2009; see also
the electronic supplementary material). Therefore, cool
temperature could not only reduce agricultural and live-
stock production directly, but also reduce agricultural
8 Z. Zhang et al. Periodic cooling increased wars
on July 14, 2010rspb.royalsocietypublishing.orgDownloaded from
production by producing more droughts, floods and
locust plagues in ancient China indirectly. The collapses
of agricultural and livestock production would cause
wars within or among different societies.
We found three temperature time series (Yang et al.
2002; Mann & Jones 2003; Tan et al. 2003) had one or
two predominant periodic bands of around 160 and/or
320 years during last two millennia (figure 3). These
periods may be related to cyclic variations of solar
activity, or cyclic changes of orbit position of the Earth
(Singer & Avery 2007). Friis-Christensen & Lassen
(1999) reported that solar activity can contribute 75 to
85 per cent of the climatic variation of the Earth. There
are 87 and 210 year cycles of solar activity based on
observations of sunspots (Braun et al. 2005). The two
predominant periods of temperature are relatively wide
owing to smooth variation of low-frequency temperature.
The initial period of T is 240 years, and then divided into
160 and 320 year band. These may be related to the 210
year solar cycle. In some periods, the 80 year periodical
band of temperature is also observed in our study,
which may be related to the 87 year solar cycle. Using
power spectral analysis, Tan et al. (2003) find the cycles
of about 206 and 325 years of Beijing temperature are
significant, and these cycles could be connected to solar
variation cycles of about 208 and 350 years (Lean
2002). It is notable that the periods we discovered (e.g.
40, 80, 160, 320 years) are well linked to the solar
cycle as predicted by the model T ¼ 11 � 2n (n ¼ 2, 3,
4, 5; see Perry & Hsu 2000; Hsu 1998). The periodic
associations between frequencies of external aggression
wars and temperature (figure 4), or between drought/
flood and temperature (Zhang et al. 2009), are predomi-
nant and consistent in phase shift, suggesting that the
periodic variations of temperature may be the direct
driving forces behind these variables. With the increase
of the levels in figure 2, the periodic associations of
temperature-driven drought/flood or locust plagues on
war frequency may become less clear, probably owing
to many reasons (e.g. time delay, frequency dependency;
see the electronic supplementary material), which need to
be investigated further in future studies.
It is generally believed that global warming is a threat
to human societies in many ways (IPCC 2007). However,
some countries or regions might also benefit from increas-
ing temperatures in some ways (Nemani et al. 2003; Stige
et al. 2007; Zhang et al. 2009). Our study suggests that
during the last two millennia, food production in ancient
China was more stable during warm periods owing to
fewer agricultural disasters, resulting in fewer social con-
flicts. However, the present ongoing global warming may
produce different effects on our industrialized societies,
which have a much higher capacity for dealing with natu-
ral disasters than pre-industrial societies. Its potential
consequence on our societies and ecosystems needs to
be carefully monitored and investigated. Data quality is
influenced by many factors, including data coverage and
time–space density of reports. Thus, it is necessary to
recover more data from additional sources for gaining
the utmost insight from such comparisons.
We are grateful to Dr Guang Yang, Nanjing Normal University,and Dr Xiaoming Liu, Institute of Zoology, for their help incollecting the data. We thank the critical and valuable
Proc. R. Soc. B
comments by two anonymous referees to our manuscript. Thiswork was partially supported by the International CooperationProject of Chinese Academy of Sciences (GJHZ200 810).
REFERENCESAtwell, W. S. 2002 Time, money and the weather:
Ming China and the great depression of the mid-fifteenth
century. J. Asia Stud. 61, 83–113. (doi:10.2307/2700190)Bloom, R. M., Buckeridge, D. L. & Cheng, K. E. 2007
Finding leading indicators for disease outbreaks: filtering,cross-correlation, and caveats. J. Am. Med. InformaticsAssoc. 14, 76–85. (doi:10.1197/jamia.M2178)
Braun, H., Christl, M., Rahmstorf, S., Ganopolski, A.,Mangini, A., Kubatzki, C., Roth, K. & Kromer, B.2005 Possible solar origin of the 1470-year glacial climatecycle demonstrated in a coupled model. Nature 438,
208–211. (doi:10.1038/nature04121)Cazelles, B., Chavez, M., Berteaux, D., Menard, F., Vik,
J. O., Jenouvrier, S. & Stenseth, N. C. 2008 Waveletanalysis of ecological time series. Oecologia 156,287–304. (doi:10.1007/s00442-008-0993-2)
Chen, J. 1936 Outbreaks of locusts recorded in Chineseliteratures. Bull. Zhejiang Entomol. Bureau 5, 188–241.
Chen, G. Y. 1939 China successive natural and manmadedisasters table. Guangzhou, China: Jinan University BookSeries.
Cowie, J. 1998 Climate and human change: disaster oropportunity? New York, NY: Parthenon Pub. Group.
Ding, H. 2007 Large-scale immigration in history. Beijing,China: China Development Press.
ECCMH 2002 Tabulation of wars in ancient China. Beijing,
China: People’s Liberation Army.Fang, J. & Liu, G. 1992 Relationship between climatic
change and the nomadic southward migrations in easternAsia during historical times. Clim. Change 22, 151–168.
(doi:10.1007/BF00142964)Friis-Christensen, E. & Lassen, K. 1999 Length of the solar
cycle: an indicator of solar activity closely associated withclimate. Science 254, 698–700. (doi:10.1126/science.254.5032.698)
Gong, G., Ge, Q. & Xu, K. 1996 Influence of climaticchanges on agriculture. In Historical climatic changes inChina (ed. P. Zhang), pp. 406–425. Jinan, China:Shandong Science and Technology Press.
Hinsch, B. 1998 Climate change and history in China.
J. Asia History 22, 131–159.Hsu, K. J. 1998 Sun, climate, hunger, and mass migration.
Sci. China Ser. D-Earth Sciences 41, 449–472. (doi:10.1007/BF02877737)
IPCC 2007 Fourth assessment report on climate change
2007: synthesis report. Geneva, Switzerland: Intergovern-mental Panel on Climate Change.
Lean, J. 2002 Solar forcing of climate change in recentmillennia. In Climate development and history of the NorthAtlantic realm (eds G. Wefer, W. H. Berger, K.-E. Behre &
E. Jansen), pp. 75–88. Berlin, Germany: Springer.Ma, S. J. 1958 The population dynamics of the oriental
migratory locust (Locusta migratoria manilensis Meyen) inChina. Acta Entomologica Sinica 8, 1–40.
Mann, M. E. & Jones, P. D. 2003 Global surfacetemperatures over the past two millennia. Geophys. Res.Lett. 30, 1820. (doi:10.1029/2003GL017814)
Nemani, R. R., Keeling, C. D., Hashimoto, H., Jolly, W. M.,Piper, S. C., Tucker, C. J., Myneni, R. B. & Running,
S. W. 2003 Climate-driven increases in global terrestrialnet primary production from 1982 to 1999. Science 300,1560–1563. (doi:10.1126/science.1082750)
Peng, X. W. 1965 History of Chinese currency. Shanghai,China: Shanghai People’s Press.
Periodic cooling increased wars Z. Zhang et al. 9
on July 14, 2010rspb.royalsocietypublishing.orgDownloaded from
Peng, X. W. 2007 History of Chinese currency. Shanghai,China: Shanghai People’s Press.
Perry, C. A. & Hsu, K. J. 2000 Geophysical, archaeological,
and historical evidence support a solar-outputmodel for climate change. Proc. Natl Acad. Sci. USA 97,12 433–12 438. (doi:10.1073/pnas.230423297)
Ren, M. E. 2004 The effect of climate changes on political,economic and social development in east China since
holocence. Adv. Earth Sci. 19, 695–698.Shumway, R. H. & Stoffer, D. S. 2000 Time series analysis and
its applications. New York, NY: Springer.Singer, S. F. & Avery, D. T. 2007 Unstoppable global warming:
every 1,500 years. Lanham, MD: Rowman and LittlefieldPublishing Group.
Stige, L. C., Chan, K. S., Zhang, Z. B., Frank, D. &Stenseth, N. C. 2007 Thousand-year-long Chinese timeseries reveals climatic forcing of decadal locust dynamics.
Proc. Natl Acad. Sci. USA 104, 16 188–16 193. (doi:10.1073/pnas.0706813104)
Tan, M., Liu, T., Hou, J., Qin, X., Zhang, H. & Li, T. 2003Cyclic rapid warming on centennial scale revealed by a2650-year stalagmite record of warm season temperature.
Geophys. Res. Lett. 30, 1617. (doi:10.1029/2003gl017352)Wang, H. C. 1996 The relationship between the southern
migrations of north nomadic tribes and climate changein China. Scient. Geogr. Sinica 16, 274–279.
Yancheva, G. et al. 2007 Influence of the intertropical con-
vergence zone on the East Asian monsoon. Nature 445,74–77. (doi:10.1038/nature05431)
Proc. R. Soc. B
Yang, B., Braeuning, A., Johnson, K. R. & Shi, Y. F. 2002General characteristics of temperature variation in Chinaduring the last two millennia. Geophys. Res. Lett. 29,
38–42.Zhang, D. & Lu, L. H. 2007 Anti-correlation of summer/
winter monsoons? Nature 450, E7–E8. (doi:10.1038/nature06338)
Zhang, D., Jim, C. Y., Lin, C. S., He, Y. Q. & Lee, F.
2005 Climate change, social unrest and dynastictransition in ancient China. Chinese Sci. Bull. 50,137–144.
Zhang, D. D., Brecke, P., Lee, H. F., He, Y. Q. & Zhang, J.
2007a Global climate change, war, and populationdecline in recent human history. Proc. Natl Acad. Sci.USA 104, 19 214–19 219. (doi:10.1073/pnas.0703073104)
Zhang, D. D., Zhang, J., Lee, H. F. & He, Y. 2007b Climate
change and war frequency in eastern China over lastmillennium. Hum. Ecol. 35, 403–414. (doi:10.1007/s10745-007-9115-8)
Zhang, P. Z. et al. 2008 A test of climate, sun, andculture relationships from an 1810-year Chinese cave
record. Science 322, 940–942. (doi:10.1126/science.1163965)
Zhang, Z. B., Cazelles, B., Tian, H. D., Stige, L. C.,Brauning, A. & Stenseth, N. C. 2009 Periodic tempera-ture-associated drought/flood drives locust plagues in
China. Proc. R. Soc. B 276, 823–831. (doi:10.1098/rspb.2008.1284)