Perikymata distribution in Homo with special reference to the Xujiayao juvenile
10
Brief Communication: Perikymata Distribution in Homo With Special Reference to the Xujiayao Juvenile Song Xing, 1 Debbie Guatelli-Steinberg, 2 * Mackie O’Hara, 2 Xiujie Wu, 1 Wu Liu, 1 and Donald J. Reid 3 1 Key Laboratory of Vertebrate Evolution and Human Origins of Chinese Academy of Sciences, Institute of Vertebrate Paleontology and Paleoanthropology, Chinese Academy of Sciences, Beijing 100044, China 2 Department of Anthropology, the Ohio State University, Columbus, OH 43210 3 Department of Anthropology, the George Washington State University, Washington, DC 20052 KEY WORDS teeth; perikymata; homo; Xujiayao ABSTRACT OBJECTIVES: This study investigates where the Xujiayao juvenile (I 1 and C 1 ) fits into the array of perikymata distribution patterns found within the genus Homo. MATERIALS AND METHODS: In addition to the I 1 and the C 1 of the Xujiayao juvenile, this study includes sam- ples of early Homo (H. rudolfensis and H. erectus), Neandertals, early modern humans (Qafzeh), and recent modern humans from Southern Africa, Newcastle (UK), and North America (Inupiaq, AK). Three sets of analyses were undertaken, including a comparison of percentage of perikymata in the cervical half of the crown, repeated measures analysis of the percentage of total perikymata in each decile, and canonical variates analysis using both total perikymata number and the percentage of perikymata in the cervical half of the crown. RESULTS: The I 1 and C 1 of early Homo and Neandertals have a lower percentage of perikymata in the cervical half of the crown than modern human samples. Repeated measures analysis reveals clear distinctions in the distri- bution of perikymata between the modern human and fossil samples. Canonical variates analysis suggests greater differences between modern humans and the fos- sil samples than within the fossil samples, and classifies the Xujiayao teeth among modern humans. DISCUSSION: The present study further clarifies varia- tion of perikymata distribution patterns within the genus Homo. The perikymata distribution of the Xujiayao juvenile tends to be more similar to that of modern humans than to either early Homo or Neander- tals. Am J Phys Anthropol 000:000–000, 2015. V C 2015 Wiley Periodicals, Inc. The early Late Pleistocene hominins from Xujiayao, northern China, have been proposed to represent an unknown hominin lineage, and as such reflect greater regional variation in Pleistocene Asia than previously recognized (Wu and Trinkaus, 2014; Xing et al., 2015). This interpretation is rooted in the specimens’ complex mosaic of dental traits (e.g., Xing et al., 2015). Some traits are as conservative as those of Homo erectus, some are traditionally considered characteristic of Neander- tals, while others are derived and shared with modern humans (Wu et al., 2012, 2014; Wu and Trinkaus, 2014; Xing et al., 2015). The Neandertal-like features are gen- erally considered part of a Eurasian pattern that can be found in other Early and Middle Pleistocene hominins, albeit at lower frequencies (Martin on-Torres et al., 2014; Wu et al., 2012, 2014; Wu and Trinkaus, 2014; Xing et al., 2015). Among the collected materials at Xujiayao is a juvenile left maxilla with six permanent teeth. Using modern human dental standards, Chia et al. (1979) estimated that this individual was between seven and nine years of age at the time of death. Until now, little research has been undertaken on dental growth and development in the Xujiayao juvenile. The distribution of perikymata on the enamel surface is one feature of enamel growth that can be studied nondestructively. Perikymata are enamel sur- face manifestations of striae of Retzius, dark lines visible in enamel ground sections that represent a rhythmic slow- ing of enamel matrix formation (Hillson, 2014). In lateral enamel, each stria of Retzius is continuous with each peri- kyma; thus, these structures form according to the same growth rhythm. In modern humans, the periodicity of this rhythm is constant within individuals (FitzGerald, 1998), but ranges among individuals from six to twelve days (Reid and Dean, 2006). Hominin species differ in their perikymata distribution patterns, but have overlapping ranges (Dean and Reid, 2001; Guatelli-Steinberg et al., 2007; Reid et al., 2008; Guatelli-Steinberg and Reid, 2010). The specific enamel growth processes influencing perikymata distribution patterns remain obscure in fossil hominins whose teeth often cannot be sectioned. In mod- ern human samples, the distribution of perikymata in the lateral enamel of anterior teeth is related to changes in enamel extension rates from cusp to cervix (Guatelli- Steinberg et al., 2012). Grant sponsor: Chinese Academy of Sciences; Grant numbers: GJHZ201314, KZZD-EW-03, XDA05130100; Grant sponsor: National Natural Science Foundation of China; Grant numbers: 41302016 and 41272034; Grant sponsor: National Science Founda- tion; Grant number: BCS-0607520; Grant sponsor: State Key Labo- ratory of Palaeobiology and Stratigraphy (Nanjing Institute of Geology and Palaeontology, CAS); Grant number: 123103. *Correspondence to: Debbie Guatelli-Steinberg, Department of Anthropology, The Ohio State University, 4034 Smith Laboratory, 174 West 18th Ave., Columbus, OH 43210. E-mail: [email protected] Received 13 December 2014; accepted 20 April 2015 DOI: 10.1002/ajpa.22760 Published online 00 Month 2015 in Wiley Online Library (wileyonlinelibrary.com). Ó 2015 WILEY PERIODICALS, INC. AMERICAN JOURNAL OF PHYSICAL ANTHROPOLOGY 00:00–00 (2015)
-
Upload
independent -
Category
Documents
-
view
2 -
download
0
Transcript of Perikymata distribution in Homo with special reference to the Xujiayao juvenile

Brief Communication: Perikymata Distribution in HomoWith Special Reference to the Xujiayao Juvenile
Song Xing,1 Debbie Guatelli-Steinberg,2* Mackie O’Hara,2 Xiujie Wu,1 Wu Liu,1 and Donald J. Reid3
1Key Laboratory of Vertebrate Evolution and Human Origins of Chinese Academy of Sciences, Institute of VertebratePaleontology and Paleoanthropology, Chinese Academy of Sciences, Beijing 100044, China2Department of Anthropology, the Ohio State University, Columbus, OH 432103Department of Anthropology, the George Washington State University, Washington, DC 20052
KEY WORDS teeth; perikymata; homo; Xujiayao
ABSTRACT OBJECTIVES: This study investigateswhere the Xujiayao juvenile (I1 and C1) fits into thearray of perikymata distribution patterns found withinthe genus Homo.MATERIALS AND METHODS: In addition to the I1 andthe C1 of the Xujiayao juvenile, this study includes sam-ples of early Homo (H. rudolfensis and H. erectus),Neandertals, early modern humans (Qafzeh), and recentmodern humans from Southern Africa, Newcastle (UK),and North America (Inupiaq, AK). Three sets of analyseswere undertaken, including a comparison of percentageof perikymata in the cervical half of the crown, repeatedmeasures analysis of the percentage of total perikymatain each decile, and canonical variates analysis usingboth total perikymata number and the percentage ofperikymata in the cervical half of the crown.
RESULTS: The I1 and C1 of early Homo and Neandertalshave a lower percentage of perikymata in the cervicalhalf of the crown than modern human samples. Repeatedmeasures analysis reveals clear distinctions in the distri-bution of perikymata between the modern human andfossil samples. Canonical variates analysis suggestsgreater differences between modern humans and the fos-sil samples than within the fossil samples, and classifiesthe Xujiayao teeth among modern humans.DISCUSSION: The present study further clarifies varia-tion of perikymata distribution patterns within thegenus Homo. The perikymata distribution of theXujiayao juvenile tends to be more similar to that ofmodern humans than to either early Homo or Neander-tals. Am J Phys Anthropol 000:000–000, 2015. VC 2015
Wiley Periodicals, Inc.
The early Late Pleistocene hominins from Xujiayao,northern China, have been proposed to represent anunknown hominin lineage, and as such reflect greaterregional variation in Pleistocene Asia than previouslyrecognized (Wu and Trinkaus, 2014; Xing et al., 2015).This interpretation is rooted in the specimens’ complexmosaic of dental traits (e.g., Xing et al., 2015). Sometraits are as conservative as those of Homo erectus, someare traditionally considered characteristic of Neander-tals, while others are derived and shared with modernhumans (Wu et al., 2012, 2014; Wu and Trinkaus, 2014;Xing et al., 2015). The Neandertal-like features are gen-erally considered part of a Eurasian pattern that can befound in other Early and Middle Pleistocene hominins,albeit at lower frequencies (Martin�on-Torres et al., 2014;Wu et al., 2012, 2014; Wu and Trinkaus, 2014; Xinget al., 2015).
Among the collected materials at Xujiayao is a juvenileleft maxilla with six permanent teeth. Using modernhuman dental standards, Chia et al. (1979) estimated thatthis individual was between seven and nine years of ageat the time of death. Until now, little research has beenundertaken on dental growth and development in theXujiayao juvenile. The distribution of perikymata on theenamel surface is one feature of enamel growth that canbe studied nondestructively. Perikymata are enamel sur-face manifestations of striae of Retzius, dark lines visiblein enamel ground sections that represent a rhythmic slow-ing of enamel matrix formation (Hillson, 2014). In lateralenamel, each stria of Retzius is continuous with each peri-kyma; thus, these structures form according to the samegrowth rhythm. In modern humans, the periodicity of this
rhythm is constant within individuals (FitzGerald, 1998),but ranges among individuals from six to twelve days(Reid and Dean, 2006). Hominin species differ in theirperikymata distribution patterns, but have overlappingranges (Dean and Reid, 2001; Guatelli-Steinberg et al.,2007; Reid et al., 2008; Guatelli-Steinberg and Reid,2010). The specific enamel growth processes influencingperikymata distribution patterns remain obscure in fossilhominins whose teeth often cannot be sectioned. In mod-ern human samples, the distribution of perikymata in thelateral enamel of anterior teeth is related to changes inenamel extension rates from cusp to cervix (Guatelli-Steinberg et al., 2012).
Grant sponsor: Chinese Academy of Sciences; Grant numbers:GJHZ201314, KZZD-EW-03, XDA05130100; Grant sponsor:National Natural Science Foundation of China; Grant numbers:41302016 and 41272034; Grant sponsor: National Science Founda-tion; Grant number: BCS-0607520; Grant sponsor: State Key Labo-ratory of Palaeobiology and Stratigraphy (Nanjing Institute ofGeology and Palaeontology, CAS); Grant number: 123103.
*Correspondence to: Debbie Guatelli-Steinberg, Department ofAnthropology, The Ohio State University, 4034 Smith Laboratory,174 West 18th Ave., Columbus, OH 43210.E-mail: [email protected]
Received 13 December 2014; accepted 20 April 2015
DOI: 10.1002/ajpa.22760Published online 00 Month 2015 in Wiley Online Library
(wileyonlinelibrary.com).
� 2015 WILEY PERIODICALS, INC.
AMERICAN JOURNAL OF PHYSICAL ANTHROPOLOGY 00:00–00 (2015)

Dean and Reid (2001) performed the first comparativestudy of perikymata distribution in hominin anteriorteeth, plotting the number of days of enamel formation(based on perikymata counts and assumed periodicity)for each decile of crown height in several species. Formodern humans, the number of days it took to formeach decile increased steeply beginning with the thirddecile and then decreased in the last decile. Comparedto modern humans, the anterior teeth of Homo erectus/rudolfensis (KNM WT 15000, KNM ER 1590, andSangiran 4) were marked by a more gradual growthcurve following the third decile. Homo habilis (OH 7);however, was similar to modern humans in increasingfrom the third decile onward and then decreasing in thelast decile.
Guatelli-Steinberg et al. (2007) compared perikymatadistributions in Neandertals to three different modernhuman population samples. In plots of perikymata bydecile, Neandertals showed a more gradual increase inperikymata than modern humans. Neandertals weretherefore predicted to have a lower percentage of periky-mata in the cervical halves of their crowns than modernhumans, and this prediction was borne out in multiplecomparisons. Modesto et al. (2013) showed that theSima de los Huesos hominins (500–600 ka) were similarto Neanderthals in perikymata distribution. Finally,Guatelli-Steinberg and Reid (2010) compared Neandertaland modern human samples to a small sample of teethfrom Qafzeh. They found that the teeth from Qafzehgenerally fell in the lower half of the modern humanrange for the percentage of perikymata found in the cer-vical half of the crown. Yet, for the lower incisors (I1 andI2), lower canines (C1), and upper lateral incisors (I2),the percentage of perikymata in the cervical halves ofQafzeh teeth fell closer to the means for Neandertals
than to those of modern humans. The single upper canine(C1) fell between modern human and Neandertal meansand half of the I2s clustered with modern humans.
The present study has two related aims. The first is todetermine where the Xujiayao juvenile falls within thearray of perikymata distribution patterns present inthe genus Homo. Of the teeth of the Xujiayao juvenile,the I1 and C1 were chosen because they are uneruptedand well-preserved. To determine where the Xujiayaojuvenile falls within the spectrum of perikymata distri-bution patterns, a more thorough understanding of thesepatterns was needed for tooth types I1 and C1 within thegenus Homo. Therefore, the second aim of this study isto clarify how perikymata distribution changes acrosssamples of Homo from different species and time peri-ods. Two gaps in our current knowledge about periky-mata distribution within the genus Homo are addressed.First: How do samples of early Homo compare withthose of Neandertals and modern humans in perikymatadistribution? Statistical analysis of these comparisonshas not been performed previously. Second: How do dif-ferent samples compare when perikymata distribution(percent of perikymata in the cervical region) and totalperikymata number and are considered simultaneously?This comparison has also not been performed previously,even though it has been suggested that the relationshipbetween perikymata number and perikymata distribu-tion may differ among hominin species (Guatelli-Stein-berg et al., 2007).
MATERIALS
The I1 and the C1 of the Xujiayao juvenile (PA 1480)are complete and unerupted (Fig. 1). This study includescomparative samples of early Homo, Neandertals, early
Fig. 1. SEM montage of Xujiayao I1 (left) and C1 (right). Teeth were imaged at a magnification of 73, with a voltage of 3.0 keV.
2 S. XING ET AL.
American Journal of Physical Anthropology

modern humans, and recent modern humans (Table 1).The oldest Homo specimens included are Sangiran 4,KNM ER-808, KNM ER-1590, and KNM WT-15000. Spe-cies designations for the KNM specimens are not settled(Wood, 1992; Rightmire, 1993; Lieberman et al., 1996),so all of these specimens are pooled under the rubric“early Homo.” It should be noted that these specimensdo not represent the full range of variation in periky-mata distribution in early Homo. It was not possible toinclude OH 7, and it appears that this specimen has aperikymata distribution pattern that differs from that ofHomo rudolfensis/Homo erectus (Dean and Reid, 2001).The Neandertal specimens span a temporal range from�150–40 ka BP (Guatelli-Steinberg et al., 2007). Theearly modern humans are represented by a sample fromQafzeh, which is dated from 90 to 100 ka BP (Schwarczet al., 1988; McDermott et al., 1993). Samples fromsouthern Africa, northern Europe (Newcastle, UK), andNorth America (Inupiaq, AK) provide the database forrecent modern humans. Only teeth estimated to have80% of more of their original crown heights intact wereretained for analysis. If both antimeres were present,the tooth with less occlusal wear was chosen.
METHODS
Preparation of samples
High-resolution replicas of labial surfaces were usedfor early Homo, Neandertal, Qafzeh, and Inupiaq teeth(Dean and Reid, 2001; Guatelli-Steinberg et al., 2005,2007; Guatelli-Steinberg and Reid, 2010). Histologicalsections were used for the southern African and Newcas-tle teeth (Reid and Dean, 2000, 2006). Because theymeasure the same growth rhythm, striae in the histolog-ical samples are hereafter referred to as perikymata forease of discussion. Details regarding dental cast and his-tological section preparation can be found in Reid andDean (2000, 2006); Dean and Reid (2001); Guatelli-Steinberg et al. (2005, 2007); and Guatelli-Steinberg andReid (2010). The Xujiayao teeth were cleaned using 75%ethyl alcohol, impressions of labial surfaces were madewith silicone rubber, and these impressions were cast inhigh-resolution epoxy (Struer’s Epofix).
Perikymata counting and estimation
Perikymata were counted under a light microscopeafter the replicas were orientated perpendicularly to themicroscope’s optical axis (Dean and Reid, 2001; Guatelli-Steinberg et al., 2005, 2007; Guatelli-Steinberg andReid, 2010). Perikymata on the Xujiayao replicas werecounted using a measuring microscope (OLYMPUSU-CMAD 3). For the histological sections, using trans-mitted light microscopy, the number of perikymata wasrecorded by counting striae of Retzius close to the labialsurface where they cropped out as perikymata, thusensuring comparability among data sets (Reid andDean, 2000, 2006; Guatelli-Steinberg et al., 2005, 2007;Guatelli-Steinberg and Reid, 2010). Magnificationsranged from 153 to 203 depending on the density ofperikymata.
For each tooth, the reconstructed or unworn crownheight of the labial surface was divided into 10 deciles(labeled 1–10, from cusp tip to cervix) and perikymatanumbers were recorded within each decile. DJR countedperikymata for all samples (except Xujiayao). His counts,which were done in consultation with M. Christopher
TA
BL
E1.
Sa
mp
les
offo
ssil
hom
inin
sa
nd
rece
nt
mod
ern
hu
ma
nu
sed
inth
ed
iffe
ren
ta
na
lyse
s
50%
ofto
tal
per
ikym
ata
ince
rvic
al
half
Mix
edm
odel
lin
ear
slop
ean
aly
sis
Per
iod
icit
yte
sts
Mod
ern
com
bin
edM
oder
nse
para
ted
C1
I1C
1I1
C1
I1C
1I1
Inu
pia
qn
57(5
)n
510(7
)n
52
n5
3n
52
n5
3–
–N
ewca
stle
n5
39
n5
19
n5
2n
53
n5
39
n5
19
n5
39
n5
19
Sou
ther
nA
fric
an
n=
22(1
2)
n5
20(2
)n
52
n5
3n
510
n5
18
n5
22
n5
20
Earl
yH
omo
n5
3K
NM
ER
-1590;
KN
MW
T-1
5000;
San
gir
an
4
n5
3(1
),K
NM
ER
-808,
1590;
KN
MW
T-1
5000
n5
3,
KN
ME
R-1
590;
KN
MW
T-1
5000;
San
gir
an
4
n5
2,
KN
ME
R-1
590;
KN
MW
T-1
5000
n5
3,
KN
ME
R-1
590;
KN
MW
T-1
5000;
San
gir
an
4
n5
2,
KN
ME
R-1
590;
KN
MW
T-1
5000
––
Nea
nd
erta
lsn
=14
(10),
Kra
pin
a37,
56,
76,
102,
103,
141,
142,
144,
146,
191,
Maxil
laE
;K
uln
a;
Le
Mou
stie
r1;
La
Qu
ina
5
n5
7(3
)G
ibra
ltar
II;
Kra
pin
a91,
123,
126,
155,
195;
Le
Mou
stie
r1
n5
4K
rap
ina
56,
103,
191;
Le
Mou
stie
r1
n5
4G
ibra
ltar
II;
Kra
pin
a123,
195;
Le
Mou
stie
r1
n5
4K
rap
ina
56,
103,
191;
Le
Mou
stie
r1
n5
4G
ibra
ltar
II;
Kra
pin
a123,
195;
Le
Mou
stie
r1
––
Qafz
ehn
51(1
)Q
afz
eh11
n5
4(1
)Q
afz
eh4,1
0,
12,
15
–n
53
Qafz
eh4,1
0,
15
–n
53
Qafz
eh4,1
0,
15
––
Pare
nth
eses
ind
icate
the
nu
mber
ofsl
igh
tly
wor
nte
eth
(wit
h80%
orm
ore
ofcr
own
hei
gh
tre
main
ing).
XUJIAYAO PERIKYMATA 3
American Journal of Physical Anthropology

Dean (for early Homo) and with DGS (for Neandertalsand Qafzeh), are reported here. DJR’s error is <5% forperikymata counts (Guatelli-Steinberg et al., 2005,2007). Counts for Xujiayao were made by DGS and SXseparately. Counts differed between DGS and SX wherea few perikymata bifurcated into two branches for ashort distance. The decile with the bifurcated periky-mata was recounted by DGS and SX together and a finalcount was agreed upon and reported here.
The method for estimating crown height for wornteeth is given in Guatelli-Steinberg et al. (2005, 2007)and Guatelli-Steinberg and Reid (2010). Perikymatanumbers were estimated for the first one or two decilesamong slightly worn teeth (with 80% or more crownheight) as per the practice of Guatelli-Steinberg et al.(2005, 2007) and Guatelli-Steinberg and Reid (2010).The numbers of perikymata in the first two deciles havevery low standard deviations, varying by one to two peri-kymata for each anterior tooth type and population sam-ple (Guatelli-Steinberg et al., 2005). Teeth with morethan one decile beyond the first two containing indistinctperikymata were excluded. In cases where perikymatawere indistinct in only one decile (beyond the worn dec-iles), the number was estimated from adjacent deciles(Dean and Reid, 2001). In teeth with very clear periky-mata, the number of perikymata in any one decile usu-ally lies between (or is close to) the number present inadjacent deciles, justifying the interpolation of indistinctdeciles from adjacent ones. Estimated perikymata num-bers were only used in the calculation of the percentageof perikymata in the cervical half of the crown. No esti-mates were included when calculating the percentage oftotal perikymata per decile.
Statistical Methods
Comparison of percentage of perikymata in the cer-vical half of the crown. This analysis compared themean percentage of perikymata in the cervical half ofthe crown for each of the samples. Here, we displaydirectly two standard deviations around the means forthe comparative samples to determine how the percent-age of perikymata in the cervical halves of the XujiayaoI1 and C1 relate to these ranges of variation.
Repeated measures analysis. Repeated measuresanalysis was used to analyze perikymata distribution.Repeated measures analyses were performed using SAS9.2 PROC MIXED, a likelihood-based approach (SAS Insti-tute: 2008) that is better suited for small sample sizesthan other repeated measures analyses. The variance-co-variance structure that best fit the data was heterogene-ous autoregressive. This structure takes into account thesituation in which repeated measures that are closertogether are more highly correlated (autoregressive) andhave changing variances (heterogeneous). The natural logof the percentage of total perikymata per decile was mod-eled as a quadratic function across all 10 deciles for eachtooth type and sample. Only teeth with complete periky-mata counts were included. For each sample, the PROCMIXED program returned a quadratic equation for a pre-dicted curve representing the y-intercept (sample), slope(decile*sample interaction), and quadratic curvature (deci-le*decile*sample interaction). The predicted curve gener-ated for each sample was compared to those of every othersample. Newcastle, southern Africa, and Inupiaq samples
were combined into a single “combined modern human”sample by randomly selecting a certain number of teethfrom each that was equivalent in number to the smallestgroup’s sample size. This protocol ensured that the modernhuman groups were sampled evenly.
Since there was only one Xujiayao specimen for eachtooth category, the Xujiayao teeth were not included in thePROC MIXED analysis. To allow for a visual comparisonof the Xujiayao perikymata distribution pattern to thecomparative samples, natural logs of the percentages oftotal perikymata per decile for the Xujiayao teeth weresuperimposed on the plots of the predicted curves gener-ated by PROC MIXED. Then, a polynomial regressionmethod was used to generate a curve reflecting the generaltrend of the Xujiayao perikymata distribution pattern.
Bivariate plots and canonical variates analysis.Bivariate plots of perikymata number and the percentageof perikymata occurring in the cervical half of the crownare displayed for each sample to assess differences acrosstaxa within the genus Homo In addition, a canonical vari-ates analysis was performed with total perikymata countand the percentage of perikymata in the cervical half ofthe crown as dependent variables. SPSS 20.0 statisticalsoftware was used to perform this analysis.
RESULTS
Variation in perikymata distribution patterns
Comparison of percentage of perikymata in thecervical half of the crown. Population samples arearranged on the y-axis in descending order according tomean percentage of perikymata in the cervical halves oftheir crowns in each plot (Fig. 2). Although the samplesoverlap considerably in their distributions, the earlyHomo and Neandertal specimens tend to have a lowerpercentage of perikymata in the cervical half of thecrown relative to other samples. The Xujiayao I1 fallswithin two standard deviations of modern humans,regardless of whether modern humans are separated ornot, but the Xujiayao I1 falls just outside the range oftwo standard deviations of early Homo and Neandertals.The Xujiayao C1 falls within two standard deviations ofmodern human and Early Homo means but just outsidetwo standard deviations of the Neandertal mean.
Repeated measures analysis. Tables 2 (I1) and 3 (C1)give model estimates for each sample’s predicted curvein natural log form. These can be converted to quadraticequations (e.g., the equation for the early Homo I1 wouldbe y 5 1.8935 1 0.0110x 2 0.00001x2). Significant differen-ces in the y-intercept indicate that the percentage oftotal perikymata found in decile 1 differs between twosamples. Significant differences in linear slope indicatesample differences in the rate of change from decile 1through 10 (a slope of zero would indicate that isometryin the number of perikymata occurs in each decile).Finally, significant quadratic differences between twosamples reflect differences in distribution of curvaturebetween predicted curves.
For I1s, significant differences are found among allsamples (early Homo, modern human, Neandertal andQafzeh) for the y-intercept estimate. There are signifi-cant slope differences between early Homo and modernhuman I1 samples, as well as between modern human
4 S. XING ET AL.
American Journal of Physical Anthropology

and Neandertal and modern human and Qafzeh I1 sam-ples. Modern humans also differ significantly fromNeandertals and Qafzeh in quadratic curvature. Thecombined modern human sample follows a markedlydifferent trajectory than the fossil samples (Fig. 3).Decile 1 percentages are relatively low, but percentagesincrease sharply until Decile 7, at which point they
decrease until Decile 10. Only the Qafzeh sampleapproaches such a sharp increase, but unlike modernhumans, perikymata counts do not drop in the last dec-ile. Only one significant difference is found for C1s: themodern human sample has a statistically significantlower percentage of perikymata in Decile 1 (y-intercept)than early Homo.
Fig. 2. Percentage of total perikymata in cervical half with two standard deviations in the Xujiayao and comparative samples.[Color figure can be viewed in the online issue, which is available at wileyonlinelibrary.com.]
TABLE 2. Repeated measures analyses of the natural log of the percentage of total perikymata per decile (I1)
Model estimate Model significance Early Homo Modern human Neandertal Qafzeh
Early HomoY-intercept 1.8935 <0.0001 <0.0001 0.4243 0.2713Linear slope 0.0110 0.0467 0.0089 0.1517 0.4427Quadratic curvature 20.0001 0.2174 0.1278 0.0864 0.0707
Modern humanY-intercept 1.3185 <0.0001 <0.0001 0.0006Linear slope 0.0259 <0.0001 <0.0001 <0.0001Quadratic curvature 20.0001 <0.0001 <0.0001 <0.0001
NeandertalY-intercept 2.0123 <0.0001 0.0274Linear slope 0.0021 0.5660 0.4762Quadratic curvature 0.0000 0.2175 0.8271
QafzehY-intercept 1.7208 <0.0001Linear slope 0.0060 0.1680Quadratic curvature 0.0001 0.1753
Bold lettering indicates significance at the 0.05 level.
XUJIAYAO PERIKYMATA 5
American Journal of Physical Anthropology

The trend line for the Xujiayao I1 (Fig. 3) has a y-inter-cept close to that of Neandertals and early Homo but hasa steeper linear slope than that observed among Neander-tals and early Homo (though not as steep as that of mod-ern humans). The Xujiayao C1 trend line appears mostsimilar to the predicted curve for modern humans, but asnoted there are few statistically significant sample differ-ences in the model estimates for C1 predicted curves.
Variation in perikymata distribution patterns inrelation to perikymata number
Bivariate plots. For I1s (Fig. 4), modern humans(including Qafzeh) fall in the upper half of the plots,with more perikymata in the cervical half of the crownper total number of perikymata than either early Homoor Neandertals. In fact, there is no overlap betweenearly Homo and Neandertal central incisors, with thelatter having both a larger percentage of perikymata inthe cervical half of the crown and a greater number oftotal perikymata. The Xujiayao I1 falls squarely withinthe range of southern African incisors.
Canonical variates analysis. A canonical variatesanalysis was performed to assess sample differenceswith respect to perikymata distribution and numbercombined more clearly, as well as to assess the affinitiesof the Xujiayao individual more objectively (Table 4).Using cross validation, 32.8% of I1s are correctly classi-fied. This low rate was expected given the degree ofoverlap of these two variables among the samples con-sidered. More revealing than correct classification arethe groups with which samples are or are not classified.Most of the modern human individuals stay within mod-ern human groups even if the wrong sample is identi-fied. The classification process also indicates differencesbetween southern African samples and the other twogroups of recent modern humans. There is no Inupiaq orNewcastle specimen falling into the southern Africangroup, and only recent modern humans from southernAfrica could be found within the groups of Xujiayao andEarly Homo. Qafzeh falls into either Neandertals orsouthern Africans. The three early Homo specimenscluster either with Neandertals or early Homo. Neander-tal specimens sort into Early Homo and Qafzeh, as well
TABLE 3. Repeated measures analyses of the natural log of the percentage of total perikymata per decile (C1)
Model estimate Model significance Early Homo Modern human Neandertal
Early HomoY-intercept 1.7883 <0.0001 0.0085 0.1871Linear slope 0.0114 0.0071 0.2337 0.0821Quadratic curvature 0.0000 0.2246 0.7927 0.0621
Modern humanY-intercept 1.5217 <0.0001 0.1735Linear slope 0.0164 <0.0001 0.4458Quadratic curvature 20.0001 0.0313 0.0548
NeandertalY-intercept 1.6459 <0.0001Linear slope 0.0193 <0.0001Quadratic curvature 20.0001 <0.0001
Bold lettering indicates significance at the 0.05 level.
Fig. 3. Plots of the I1 (left) and C1 (right) show the individual repeated measures (thin solid lines) and predicted curves foreach population group (thick solid lines). The individual data points are plotted for the Xujiayao I1 (black dots) and the quadratictrend line for those points is plotted as a thick black line.
6 S. XING ET AL.
American Journal of Physical Anthropology

as into Neandertals. The Xujiayao I1 is classified as south-ern African.
The bivariate plots show much greater overlapamong population samples For C1s (Fig. 4). TheXujiayao C1 falls within the limits of both the modernsouthern Africans and the Newcastle samples, just out-side the range of the Inupiaq sample, and well outsidethe range of early Homo and Neandertals. In thecanonical variates analysis of C1 (Table 5), 29.9% of the
sample is correctly assigned. The recent modernhumans could be found in different groups withoutobvious trends being detected. Apart from one specimenbeing correctly classified, Early Homo falls into Nean-dertal and southern African groups. Eight of 14 Nean-dertal specimens are assigned correctly, while theothers are sorted into Early Homo and Qafzeh. TheXujiayao C1 is classified with the recent modern humansample from Newcastle.
Fig. 4. Bivariate plots of percentage of perikymata in the cervical half of the crown versus total perikymata. The ranges foreach sample are shown as polygons. [Color figure can be viewed in the online issue, which is available at wileyonlinelibrary.com.]
TABLE 4. The cross-validated results of canonical variates analysis for total perikymata and the percentage of perikymata in thecervical half of the crown (I1)
Group
Predicted group membership
TotalXujiayao Early Homo Neandertals Qafzeh Inupiaq Newcastle Southern African
Xujiayao 0 (0.0%) 0 (0.0%) 0 (0.0%) 0 (0.0%) 0 (0.0%) 0 (0.0%) 1 (100%) 1 (100%)Early Homo 0 (0.0%) 2 (66.7%) 1 (33.3%) 0 (0.0%) 0 (0.0%) 0 (0.0%) 0 (0.0%) 3 (100%)Neandertals 0 (0.0%) 1 (14.3%) 3 (42.9%) 3 (42.9%) 0 (0.0%) 0 (0.0%) 0 (0.0%) 7 (100%)Qafzeh 0 (0.0%) 0 (0.0%) 2 (50.0%) 0 (0.0%) 0 (0.0%) 0 (0.0%) 2 (50.0%) 4 (100%)Inupiaq 0 (0.0%) 0 (0.0%) 1 (10.0%) 2 (20.0%) 4 (40%) 3 (30.0%) 0 (0.0%) 10 (100%)Newcastle 0 (0.0%) 0 (0.0%) 2 (10.5%) 4 (21.1%) 9 (47.4%) 4 (21.1%) 0 (0.0%) 19 (100%)Southern African 6 (30.0%) 2 (10.0%) 1 (5.0%) 3 (15.0%) 0 (0.0%) 0 (0.0%) 8 (40.0%) 20 (100%)
32.8% of cross-validated grouped cases correctly classified.
TABLE 5. The cross-validated results of canonical variates analysis for total perikymata and the percentage of perikymata in thecervical half of the crown (C1)
Group
Predicted group membership
TotalXujiayao Early Homo Neandertals Qafzeh Inupiaq Newcastle Southern African
Xujiayao 0 (0.0%) 0(0.0%) 0 (0.0%) 0 (0.0%) 0 (0.0%) 1 (100%) 0 (0.0%) 1 (100%)Early Homo 0 (0.0%) 1 (33.3%) 1 (33.3%) 0 (0.0%) 0 (0.0%) 0 (0.0%) 1 (33.3%) 3 (100%)Neandertals 0(0.0%) 4 (28.6%) 8 (57.1%) 2 (14.3%) 0 (0.0%) 0 (0.0%) 0 (0.0%) 14 (100%)Qafzeh 1 (100%) 0(0.0%) 0 (0.0%) 0 (0.0%) 0 (0.0%) 0 (0.0%) 0 (0.0%) 1 (100%)Inupiaq 0 (0.0%) 0 (0.0%) 0 (0.0%) 1 (14.3%) 6 (85.7%) 0 (0.0%) 0 (0.0%) 7 (100%)Newcastle 8(20.5%) 2 (5.1%) 4 (10.3%) 3 (7.7%) 6 (15.4%) 4 (10.3%) 12 (30.8%) 39 (100%)Southern African 1 (4.5%) 8(36.4%) 0 (0.0%) 0 (0.0%) 5 (22.7%) 1 (4.5%) 7 (31.8%) 22 (100%)
29.9% of cross-validated grouped cases correctly classified.
XUJIAYAO PERIKYMATA 7
American Journal of Physical Anthropology

DISCUSSION AND CONCLUSIONS
Three sets of analyses were performed to investigatethe spectrum of perikymata distribution patternswithin the genus Homo with reference to the XujiayaoI1 and C1. In the first set of analyses, means and twostandard deviations were plotted for the percentage ofperikymata in the cervical half of the crown. For bothI1 and C1, there was substantial overlap among sam-ples. Nevertheless, the Xujiayao individual fell greaterthan two standard deviations outside the means forNeandertals.
The second set of analyses consisted of repeated meas-ures regression models of the percent of perikymata perdecile. There were statistically significant differencesbetween the combined modern human sample and Nean-dertals with respect to y-intercept, linear slope, andquadratic curvature for I1. In addition, modern humans
Fig. 5. Simplified schematic of relationships generated by therepeated measures analysis between samples for each tooth type.Overlap indicates that there are no significant differences betweenthe two samples. For C1, there are no significant differences betweenEarly Homo and Neandertal, so they overlap, but there are differen-ces between Early Homo and Modern Human samples (y-intercept,Table 2), so they do not overlap. [Color figure can be viewed in theonline issue, which is available at wileyonlinelibrary.com.]
Fig. 6. Three-dimensional Barplot of percentage of perikymata in the cervical half of the tooth versus total perikymata versusperiodicity. The Scatterplot3d package for R software was used to generate it (Ligges and M€achler, 2003). Straight green lines rep-resent the unknown periodicities of early Homo. Ranges for modern humans are shown as polygons. [Color figure can be viewed inthe online issue, which is available at wileyonlinelibrary.com.]
8 S. XING ET AL.
American Journal of Physical Anthropology
differed significantly from the Qafzeh (y-intercept andslope) and early Homo samples (y-intercept and slope).Given that the only statistically significant differenceamong fossil samples was for the y-intercept, the com-bined modern human sample is interpreted to possess amore derived perikymata distribution pattern. However,although the combined modern human samples showedclear differences from the fossil samples for the I1, onlyone statistically significant difference was found for theC1 (between modern humans and early Homo for the y-intercept). For both the I1and the C1, the trend line forthe Xujiayao individual appears to be closer to the pre-dicted curves of modern humans than to those of the fos-sil samples considered here.
Figure 5 provides an illustration of the relationshipsamong samples for the repeated measures analysis.Overlapping samples indicate that no significant differ-ences were found between them for any of the modelestimates (y-intercept, slope, or curvature). The samplesare nonoverlapping if any significant differences inmodel estimates were found. In addition, the repeatedmeasurement analyses revealed an otherwise unrecog-nized trend. It is clear that across the genus Homo, thepercentage of perikymata found in the first decile of C1
decreases from the oldest temporal sample to samples oflesser antiquity (Fig. 5).
The final set of analyses considered perikymata num-ber and distribution simultaneously. For early Homo andNeandertals, bivariate plots revealed clear differencesfrom modern humans in the percentage of perikymata inthe cervical half of the crown relative to total number ofperikymata. The canonical variates analysis yieldedresults consistent with the bivariate plots in showingthat for the I1, early Homo and Neandertals were notclassified into any modern human group. These differen-ces were not as clear for the C1. Finally, the Xujiayaoindividual was classified as a modern human (the south-ern African sample for the I1 and the Newcastle samplefor the C1).
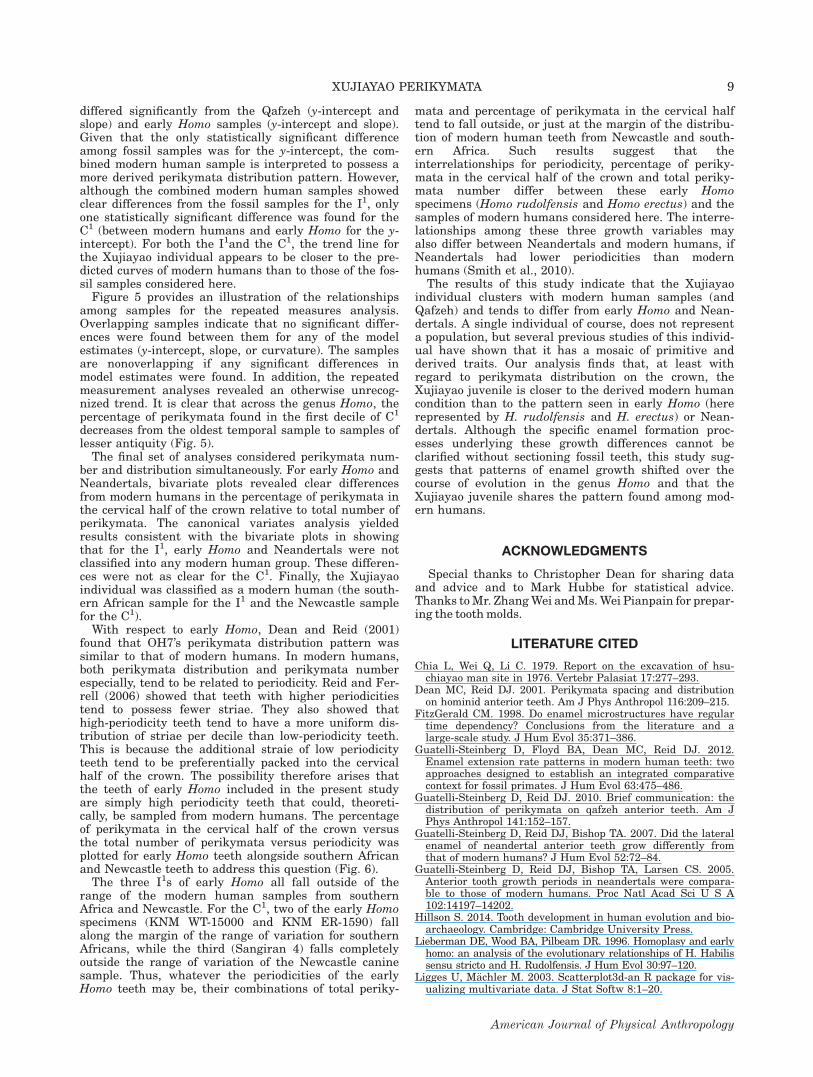
With respect to early Homo, Dean and Reid (2001)found that OH7’s perikymata distribution pattern wassimilar to that of modern humans. In modern humans,both perikymata distribution and perikymata numberespecially, tend to be related to periodicity. Reid and Fer-rell (2006) showed that teeth with higher periodicitiestend to possess fewer striae. They also showed thathigh-periodicity teeth tend to have a more uniform dis-tribution of striae per decile than low-periodicity teeth.This is because the additional straie of low periodicityteeth tend to be preferentially packed into the cervicalhalf of the crown. The possibility therefore arises thatthe teeth of early Homo included in the present studyare simply high periodicity teeth that could, theoreti-cally, be sampled from modern humans. The percentageof perikymata in the cervical half of the crown versusthe total number of perikymata versus periodicity wasplotted for early Homo teeth alongside southern Africanand Newcastle teeth to address this question (Fig. 6).
The three I1s of early Homo all fall outside of therange of the modern human samples from southernAfrica and Newcastle. For the C1, two of the early Homospecimens (KNM WT-15000 and KNM ER-1590) fallalong the margin of the range of variation for southernAfricans, while the third (Sangiran 4) falls completelyoutside the range of variation of the Newcastle caninesample. Thus, whatever the periodicities of the earlyHomo teeth may be, their combinations of total periky-
mata and percentage of perikymata in the cervical halftend to fall outside, or just at the margin of the distribu-tion of modern human teeth from Newcastle and south-ern Africa. Such results suggest that theinterrelationships for periodicity, percentage of periky-mata in the cervical half of the crown and total periky-mata number differ between these early Homospecimens (Homo rudolfensis and Homo erectus) and thesamples of modern humans considered here. The interre-lationships among these three growth variables mayalso differ between Neandertals and modern humans, ifNeandertals had lower periodicities than modernhumans (Smith et al., 2010).
The results of this study indicate that the Xujiayaoindividual clusters with modern human samples (andQafzeh) and tends to differ from early Homo and Nean-dertals. A single individual of course, does not representa population, but several previous studies of this individ-ual have shown that it has a mosaic of primitive andderived traits. Our analysis finds that, at least withregard to perikymata distribution on the crown, theXujiayao juvenile is closer to the derived modern humancondition than to the pattern seen in early Homo (hererepresented by H. rudolfensis and H. erectus) or Nean-dertals. Although the specific enamel formation proc-esses underlying these growth differences cannot beclarified without sectioning fossil teeth, this study sug-gests that patterns of enamel growth shifted over thecourse of evolution in the genus Homo and that theXujiayao juvenile shares the pattern found among mod-ern humans.
ACKNOWLEDGMENTS
Special thanks to Christopher Dean for sharing dataand advice and to Mark Hubbe for statistical advice.Thanks to Mr. Zhang Wei and Ms. Wei Pianpain for prepar-ing the tooth molds.
LITERATURE CITED
Chia L, Wei Q, Li C. 1979. Report on the excavation of hsu-chiayao man site in 1976. Vertebr Palasiat 17:277–293.
Dean MC, Reid DJ. 2001. Perikymata spacing and distributionon hominid anterior teeth. Am J Phys Anthropol 116:209–215.
FitzGerald CM. 1998. Do enamel microstructures have regulartime dependency? Conclusions from the literature and alarge-scale study. J Hum Evol 35:371–386.
Guatelli-Steinberg D, Floyd BA, Dean MC, Reid DJ. 2012.Enamel extension rate patterns in modern human teeth: twoapproaches designed to establish an integrated comparativecontext for fossil primates. J Hum Evol 63:475–486.
Guatelli-Steinberg D, Reid DJ. 2010. Brief communication: thedistribution of perikymata on qafzeh anterior teeth. Am JPhys Anthropol 141:152–157.
Guatelli-Steinberg D, Reid DJ, Bishop TA. 2007. Did the lateralenamel of neandertal anterior teeth grow differently fromthat of modern humans? J Hum Evol 52:72–84.
Guatelli-Steinberg D, Reid DJ, Bishop TA, Larsen CS. 2005.Anterior tooth growth periods in neandertals were compara-ble to those of modern humans. Proc Natl Acad Sci U S A102:14197–14202.
Hillson S. 2014. Tooth development in human evolution and bio-archaeology. Cambridge: Cambridge University Press.
Lieberman DE, Wood BA, Pilbeam DR. 1996. Homoplasy and earlyhomo: an analysis of the evolutionary relationships of H. Habilissensu stricto and H. Rudolfensis. J Hum Evol 30:97–120.
Ligges U, M€achler M. 2003. Scatterplot3d-an R package for vis-ualizing multivariate data. J Stat Softw 8:1–20.
XUJIAYAO PERIKYMATA 9
American Journal of Physical Anthropology

Martin�on-Torres M, Mart�ınez de Pinillos M, Skinner MM,Mart�ın-Franc�es L, Gracia-T�ellez A, Mart�ınez I, Arsuaga JL,Berm�udez de Castro JM. 2014. Talonid crests expression atthe enamel–dentine junction of hominin lower permanent anddeciduous molars. C R Palevol 13:223–234.
McDermott F, Grun R, Stringer CB, Hawkesworth CJ. 1993.Mass-spectrometric U-series dates for israeli neanderthal/early modern hominid sites. Nature 363:252–255.
Modesto M, Dean MC, Gracia A, Martin�on-Torres M, Mart�ın-Franc�es L, Guatelli-Steinberg D, Reid DJ, Mart�ınez I, ArsuagaJL, Berm�udez de Castro JM. 2013. Estudio comparativo de losperikymata en los dientes delhominino XVIII de la Sima de losHuesos (Sierra de Atapuerca). XVIII National Congress of theSociedad Espan~ola de Antropolog�ıa F�ısica (SEAF), Junio 2013,Bilbao, Spain. Libro de res�umenes. P�oster, p. 75.
Reid DJ, Dean MC. 2000. Brief communication: the timing oflinear hypoplasias on human anterior teeth. Am J PhysAnthropol 113:135–139.
Reid DJ, Dean MC. 2006. Variation in modern human enamelformation times. J Hum Evol 50:329–346.
Reid DJ, Ferrell RJ. 2006. The relationship between number ofstriae of retzius and their periodicity in imbricational enamelformation. J Hum Evol 50:195–202.
Reid DJ, Guatelli-Steinberg D, Walton P. 2008. Variation inmodern human premolar enamel formation times: implica-tions for neandertals. J Hum Evol 54:225–235.
Rightmire GP. 1993. Variation among early homo crania fromolduvai gorge and the koobi fora region. Am J Phys Anthropol90:1–33.
Schwarcz HP, Gr€un R, Vandermeersch B, Bar-Yosef O, ValladasH, Tchernov E. 1988. ESR dates for the hominid burial site ofqafzeh in israel. J Hum Evol 17:733–737.
Smith TM, Tafforeau P, Reid DJ, Pouech J, Lazzari V, ZermenoJP, Guatelli-Steinberg D, Olejniczak AJ, Hoffman A, RadovcicJ, Makaremi M, Toussaint M, Stringer C, Hublin J-J. 2010.Dental evidence for ontogenetic differences between modernhumans and neanderthals. Proc Natl Acad Sci U S A 107:20923–20928.
Wood B. 1992. Origin and evolution of the genus homo. Nature355:239–240.
Wu X-J, Crevecoeur I, Liu W, Xing S, Trinkaus E. 2014. Tempo-ral labyrinths of eastern eurasian pleistocene humans. ProcNatl Acad Sci U S A 111:10509–10513.
Wu X-J, Maddux SD, Pan Lei Trinkaus E. 2012. Nasal floorvariation among eastern eurasian pleistocene homo. Anthro-pol Sci 120:217–226.
Wu X-J, Trinkaus E. 2014. The xujiayao 14 mandibular ramusand pleistocene homo mandibular variation. C R Palevol 13:333–341.
Xing S, Martin�on-Torres M, Berm�udez de Castro JM, Wu X, LiuW. 2015. Hominin teeth from the early late pleistocene site ofxujiayao, Northern China. Am J Phys Anthropol 156:224–240.
10 S. XING ET AL.
American Journal of Physical Anthropology