Performances of endoscopic holography with a multicore optical fiber
8
Performances of endoscopic holography with a multicore optical fiber Olivier Coquoz, Ramiro Conde, Fatemeh Taleblou, and Christian Depeursinge A holographic setup that involves the use of a multicore optical fiber as an in situ recording medium has been developed. The hologram is transmitted to a CCD camera for electronic processing, and the image is reconstructed numerically, providing more flexibility to the holographic process. The performances of this imaging system have been evaluated in terms of the resolution limit and robustness relative to noise. The experimental cutoff frequency has been measured experimentally over a range of observation distances 14–10 mm2 and presents a very good agreement with the predictions made by simulation. The system features a resolution of 5-μm objects for a 4-mm observation distance. The different sources of noise have been analyzed, and their influence on resolution has been proved to be nonrelevant. Key words: Endoscopy, holography, multicore optical fiber. r 1995 Optical Society of America 1. Introduction When combined with endoscopy, holography offers the physician additional diagnostic capabilities for observation of the cavities in the human body. Furthermore, profiting from technological progress in multicore fiber manufacturing, the recent develop- ment of miniaturized endoscopes, or microendo- scopes, has permitted the exploration of very small channels of the body, such as coronary arteries, and has given rise to numerous medical interventions that are minimally invasive, or less invasive. Thus micro- endoscopic holography can lead to new medical appli- cations, permitting the in situ microscopic imaging of tissues or deformation analysis. The first development of endoscopic holography was performed more than 15 years ago. 1 It was shown at that time that a hologram could be recorded in situ with the use of a single-mode fiber for both the illumination and the reference beam. Another in situ holocamera was developed later to get in vivo three-dimensional photographic records of the vocal chords. 2 A special endoholoscope was then designed, in the single-beam Denisyuk configuration, 3 and was improved upon to reach a quasi-cellular resolution. 4 The main disadvantage of these setups is the inconve- niences associated with the processing of the holo- graphic film, which is placed at the distal tip of the endoscope and must be changed after each exposure. Other groups used the so-called external recording technique, in which the object wave interferes with the reference at the output of the endoscope. This setup was applied to the investigation of the tympanic membrane vibration patterns with a rigid endoscope 5 and to the measurement of remote deformations with a flexible endoscope. 6 It was demonstrated that en- doscopic holography could achieve three-dimensional imaging as well as interferometric analysis of an organ inside the body. 7 In the in situ holographic technique presented here, we keep the advantage of internal recording, i.e., phase conservation to form the hologram, while get- ting rid of its main drawback, which is the use of the holographic plate and its relatively complex handling. In our setup the hologram is collected on the tip of the multicore optical fiber 1MCF2, 8 in a quasi on-axis setting, and transmitted to a CCD camera for acquisi- tion. Eventually the reconstruction is performed numerically, 9,10 adding in this way more flexibility to the holographic process and offering new solutions to solve difficult experimental problems. 11 The first objective of our study was to evaluate the performance of the miniaturized endoholoscope. A simulation program of the entire Fresnel holo- graphic process was developed to predict the resolu- tion limit as a function of the different parameters involved. Experimental measurements performed under the conditions matched by the simulation fully confirmed the theoretical predictions. Further- The authors are with the Applied Optics Laboratory, Swiss Federal Institute of Technology in Lausanne, CH-1015 Lausanne, Switzerland. Received 13 October 1994; revised manuscript received 30 May 1995. 0003-6935@95@317186-08$06.00@0. r 1995 Optical Society of America. 7186 APPLIED OPTICS @ Vol. 34, No. 31 @ 1 November 1995
-
Upload
independent -
Category
Documents
-
view
1 -
download
0
Transcript of Performances of endoscopic holography with a multicore optical fiber

Performances of endoscopicholography with a multicore optical fiber
Olivier Coquoz, Ramiro Conde, Fatemeh Taleblou, and Christian Depeursinge
A holographic setup that involves the use of a multicore optical fiber as an in situ recording medium hasbeen developed. The hologram is transmitted to a CCD camera for electronic processing, and the imageis reconstructed numerically, providing more flexibility to the holographic process. The performances ofthis imaging system have been evaluated in terms of the resolution limit and robustness relative tonoise. The experimental cutoff frequency has beenmeasured experimentally over a range of observationdistances 14–10 mm2 and presents a very good agreement with the predictions made by simulation. Thesystem features a resolution of 5-µm objects for a 4-mm observation distance. The different sources ofnoise have been analyzed, and their influence on resolution has been proved to be nonrelevant.Key words: Endoscopy, holography, multicore optical fiber. r 1995 Optical Society of America
1. Introduction
When combined with endoscopy, holography offersthe physician additional diagnostic capabilities forobservation of the cavities in the human body.Furthermore, profiting from technological progress inmulticore fiber manufacturing, the recent develop-ment of miniaturized endoscopes, or microendo-scopes, has permitted the exploration of very smallchannels of the body, such as coronary arteries, andhas given rise to numerousmedical interventions thatareminimally invasive, or less invasive. Thusmicro-endoscopic holography can lead to new medical appli-cations, permitting the in situmicroscopic imaging oftissues or deformation analysis.The first development of endoscopic holography
was performed more than 15 years ago.1 It wasshown at that time that a hologram could be recordedin situ with the use of a single-mode fiber for both theillumination and the reference beam. Another insitu holocamera was developed later to get in vivothree-dimensional photographic records of the vocalchords.2 A special endoholoscope was then designed,in the single-beam Denisyuk configuration,3 and wasimproved upon to reach a quasi-cellular resolution.4The main disadvantage of these setups is the inconve-
The authors are with the Applied Optics Laboratory, SwissFederal Institute of Technology in Lausanne, CH-1015 Lausanne,Switzerland.Received 13 October 1994; revised manuscript received 30 May
1995.0003-6935@95@317186-08$06.00@0.
r 1995 Optical Society of America.
7186 APPLIED OPTICS @ Vol. 34, No. 31 @ 1 November 1995
niences associated with the processing of the holo-graphic film, which is placed at the distal tip of theendoscope and must be changed after each exposure.Other groups used the so-called external recording
technique, in which the object wave interferes withthe reference at the output of the endoscope. Thissetup was applied to the investigation of the tympanicmembrane vibration patterns with a rigid endoscope5and to the measurement of remote deformations witha flexible endoscope.6 It was demonstrated that en-doscopic holography could achieve three-dimensionalimaging as well as interferometric analysis of anorgan inside the body.7In the in situ holographic technique presented here,
we keep the advantage of internal recording, i.e.,phase conservation to form the hologram, while get-ting rid of its main drawback, which is the use of theholographic plate and its relatively complex handling.In our setup the hologram is collected on the tip of themulticore optical fiber 1MCF2,8 in a quasi on-axissetting, and transmitted to a CCD camera for acquisi-tion. Eventually the reconstruction is performednumerically,9,10 adding in this way more flexibility tothe holographic process and offering new solutions tosolve difficult experimental problems.11The first objective of our study was to evaluate the
performance of the miniaturized endoholoscope.A simulation program of the entire Fresnel holo-graphic process was developed to predict the resolu-tion limit as a function of the different parametersinvolved. Experimental measurements performedunder the conditions matched by the simulation fullyconfirmed the theoretical predictions. Further-
more, the different sources of noise encountered experi-mentally were analyzed and their influence on theresolution limit was evaluated. The commonly ob-served speckle noise is not discussed here; it should beminimized in our experiments, because of the absenceof parasitic scattering centers. Indeed, the use of thestandard U. S. Air Force positive test target as anobject prevents speckle originating from multiply scat-tered light. Noise caused by multimodal propagation oflight in theMCF and by its weak guiding properties wasinvestigated. The importance of this noise was com-paredwith the observed structural noise, which seems tobe themain cause of signal degradation.
2. Materials and Methods
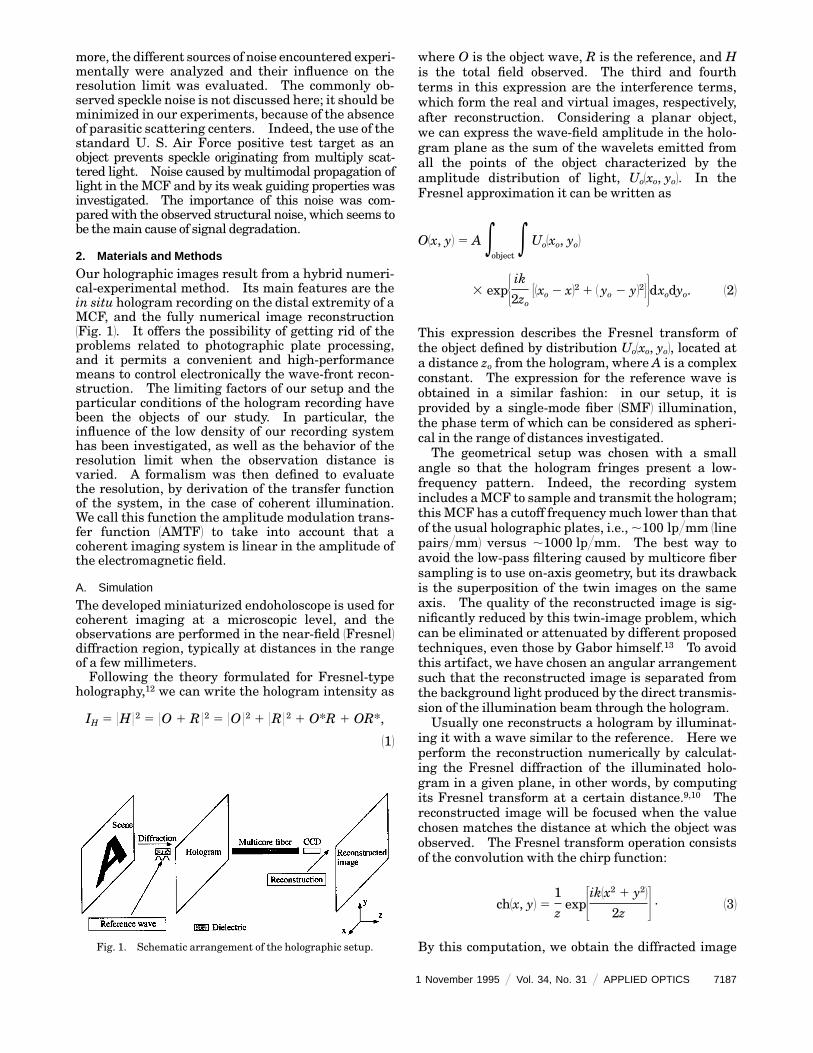
Our holographic images result from a hybrid numeri-cal-experimental method. Its main features are thein situ hologram recording on the distal extremity of aMCF, and the fully numerical image reconstruction1Fig. 12. It offers the possibility of getting rid of theproblems related to photographic plate processing,and it permits a convenient and high-performancemeans to control electronically the wave-front recon-struction. The limiting factors of our setup and theparticular conditions of the hologram recording havebeen the objects of our study. In particular, theinfluence of the low density of our recording systemhas been investigated, as well as the behavior of theresolution limit when the observation distance isvaried. A formalism was then defined to evaluatethe resolution, by derivation of the transfer functionof the system, in the case of coherent illumination.We call this function the amplitude modulation trans-fer function 1AMTF2 to take into account that acoherent imaging system is linear in the amplitude ofthe electromagnetic field.
A. Simulation
The developed miniaturized endoholoscope is used forcoherent imaging at a microscopic level, and theobservations are performed in the near-field 1Fresnel2diffraction region, typically at distances in the rangeof a few millimeters.Following the theory formulated for Fresnel-type
holography,12 we can write the hologram intensity as
IH 5 0H 02 5 0O 1 R 02 5 0O 02 1 0R 02 1 O*R 1 OR*,
112
Fig. 1. Schematic arrangement of the holographic setup.
where O is the object wave, R is the reference, and His the total field observed. The third and fourthterms in this expression are the interference terms,which form the real and virtual images, respectively,after reconstruction. Considering a planar object,we can express the wave-field amplitude in the holo-gram plane as the sum of the wavelets emitted fromall the points of the object characterized by theamplitude distribution of light, Uo1xo, yo2. In theFresnel approximation it can be written as
O1x, y2 5 A eobject
e Uo1xo, yo2
3 exp5 ik2zo 31xo 2 x22 1 1 yo 2 y2246dxodyo. 122
This expression describes the Fresnel transform ofthe object defined by distribution Uo1xo, yo2, located ata distance zo from the hologram, where A is a complexconstant. The expression for the reference wave isobtained in a similar fashion: in our setup, it isprovided by a single-mode fiber 1SMF2 illumination,the phase term of which can be considered as spheri-cal in the range of distances investigated.The geometrical setup was chosen with a small
angle so that the hologram fringes present a low-frequency pattern. Indeed, the recording systemincludes aMCF to sample and transmit the hologram;thisMCF has a cutoff frequencymuch lower than thatof the usual holographic plates, i.e., ,100 lp@mm 1linepairs@mm2 versus ,1000 lp@mm. The best way toavoid the low-pass filtering caused by multicore fibersampling is to use on-axis geometry, but its drawbackis the superposition of the twin images on the sameaxis. The quality of the reconstructed image is sig-nificantly reduced by this twin-image problem, whichcan be eliminated or attenuated by different proposedtechniques, even those by Gabor himself.13 To avoidthis artifact, we have chosen an angular arrangementsuch that the reconstructed image is separated fromthe background light produced by the direct transmis-sion of the illumination beam through the hologram.Usually one reconstructs a hologram by illuminat-
ing it with a wave similar to the reference. Here weperform the reconstruction numerically by calculat-ing the Fresnel diffraction of the illuminated holo-gram in a given plane, in other words, by computingits Fresnel transform at a certain distance.9,10 Thereconstructed image will be focused when the valuechosen matches the distance at which the object wasobserved. The Fresnel transform operation consistsof the convolution with the chirp function:
ch1x, y2 51
zexp3ik1x
2 1 y22
2z 4 . 132
By this computation, we obtain the diffracted image
1 November 1995 @ Vol. 34, No. 31 @ APPLIED OPTICS 7187

in a plane located at a distance z from the hologram.Using the indirect method for convolution 1by meansof Fourier transform2, we found the algorithm to befast and appropriate for this problem. It was usedfor the reconstruction of experimental holograms.The simulation of the whole process 1recording and
reconstruction2 was performed to predict the resolu-tion of our system, according to the Fresnel diffractiontheory. The main parameters to be considered arethe multicore fiber density, aperture, and observationdistance. The spatial resolution is often character-ized by the frequency analysis of the imaging system.In our simulation, we consider as our object an idealpoint source 1Dirac2; then the hologram is formedwhen its diffracted image is combined with a spheri-cal reference wave. The object and reference direc-tions form a very small angle u. To perform thereconstruction, we use a wave identical to the refer-ence as illumination of the hologram; then we obtainthe image by computing the Fresnel transform of thewave front going out of the hologram in the directionu. This image is nothing but the impulse response ofour system, or point spread function. Because weare working with coherent imaging, the frequencyanalysis has to be applied on the complex amplitudeof the field,14 and we will systematically add the wordamplitudeasaprefix to the functionnamesasareminder.Therefore, we can derive the coherent or amplitudetransfer function by achieving the Fourier transform ofthe amplitude point spread function. The modulusof the ATF is referred to here as the AMTF. Thecutoff is defined for a frequency, theAMTF correspond-ing value of which is equal to one half of the ampli-tude, to obtain a signal-to-noise ratio of 10.15
B. Experiments
A miniaturized flexible endoscope imaging multicorefiber 1Fujikura FIGH-10-510N, 0.46-mm imaging di-ameter, 10,000 cores2 was used for in situ holographicrecording 1Fig. 22. The angle between the object andreference directions was minimized to reduce thedensity of fringes in the hologram. Illumination wasprovided by a SMF with a monomodal transmissionat a wavelength of 633 nm 1He–Ne laser source2.The reference beam was produced by partial reflec-tion on an optical flat used as a beam splitter, slightlytilted so that the reflected beam was centered on theMCF placed beside the SMF. The tilt angle wasapproximately 6.5°. For the interference of the light
Fig. 2. Experimental setup: F, the neutral-density filter; L, lens;BS, beam splitter; O, object; LS, loudspeaker.
7188 APPLIED OPTICS @ Vol. 34, No. 31 @ 1 November 1995
reflected on both interfaces of the optical flat to beminimized, the front interface received an antireflec-tion coating 1Fig. 32. In this case, only the lightincident on the back panel is reflected. The lightreflected by the object interferes with the referencebeam to form the hologram on the MCF tip. It issampled and transmitted by each individual fiber coreof the MCF to a CCD camera for digitization.The reconstructionwas performed numerically with
an algorithm described in Subsection 2.A, which usesa Fresnel transform to reconstruct the focused imageof the illuminated hologram. With this type of proce-dure, both the recorded hologram and the recon-structed image can be treated electronically to elimi-nate the background illumination and accentuatecontrast and contour.The key point for a good numerical reconstruction is
the ability to reproduce as accurately as possible thereference beam in the hologram illumination step.Particularly, as expected, the phase distribution mustbe carefully computed to match the reference so thatpropagation and focusing of the reconstructed imageare performed in the same conditions as during therecording process. This point is especially importantwhen holography is realized with spherical waves, asin our case. SMF illumination 1NA > 0.12 was foundto be a good solution to build the first prototype fortwo reasons. First, it is convenient to assemble inthe experimental setup; second, both the phase andamplitude of the light beam launched at its outputcan be easily and reliably quantified.The experiments were performed with a planar
object, namely, the U. S.Air Force 1USAF2 positive testtarget. This standard test object contains horizontaland vertical three-bar patterns, characterized by1–228-lp@mm, spatial frequencies in the form of areflecting chromium coating set on a BK-7 glasssubstrate. The glass substrate was antireflectioncoated to ensure that the object wave informationcomes only from the chromium bar patterns.The experimental AMTF is defined by the normal-
ized amplitude contrast measurement,
AMTF 5Amax2 Amin
Amax 1 Amin
, 142
Fig. 3. Detail of the distal part of the experimental setup; AR,antireflection; BS and O, as defined in Fig. 2 caption.

where Amax and Amin stand for maximal and minimalvalues of the field amplitude in the reconstructedimage. We could evaluate the spatial resolution ofour system, by systematically deriving the cutofffrequency from the measured AMTF, for differentobservation distances and compare it with predictionsgiven by simulation.Holograms recorded with our setup suffer degrada-
tion introduced mainly by the MCF. Indeed, theMCF produces three kinds of noise when used withcoherent light. The first is structural noise, inducedby the nonuniform light coupling in each individualcore caused by morphological inhomogeneities of theMCF. The second is caused by cross talk betweenadjacent cores and recoupling of leaky modes in acore. The third is interference betweenmodes withina core, introduced by the multimodal characteristicsof light propagation in the multicore fiber.16,17The importance of cross talk was investigated
experimentally in the following way: a laser beamwas focused on a single core at the input of the MCF.The light intensity was then carefully measured atthe output of the MCF with a photodiode as a refer-ence to determine precisely the coupling betweenadjacent and distant cores.Modal noise, caused by the interference of modes
propagating in each individual core of the multicorefiber, appears as an additional disturbing effect. Theexperimental setup designed to attenuate this noisemade use of a loudspeaker to apply a slight deforma-tion to the MCF 1Fig. 22, modifying the path lengthtraveled by the light in each core. Interference be-tween modes traveling in a single core is altered aswell, and if a vibration frequency higher than thevideo sampling rate is applied, the captured imageshows an averaged light intensity transmitted by thefiber core. Thismanipulation provokes a noise reduc-tion in the fringes so that they become clearly distinct.Of course, each extremity is tightened to avoid anyparasitic blurring effect caused by movement. Wecould, by comparing raw and vibrated images, isolatethe modal noise, analyze it, and see whether it has aninfluence on spatial resolution.Noise analysis was performed according to the
following procedure: the image of the MCF sectionwas first segmented with an ad hoc program. Acalibration image, obtained by the illumination of theMCF with uniform white light, was used to define theposition and surface associated with each core.Light intensity transmitted by each individual corecould then be quantified, providing the base for astatistical analysis of the image distortion caused bythe nonuniform light coupling in the fiber cores andcross talk. The same computer-assisted analysiswas performed on images of MCF illuminated with auniform coherent light source 1He–Ne laser, 633 nm2.The mean intensity transmitted by each core wasobtained by an integral weighted over its surface.The variance of the core intensity histogram providesquantitative information on the noise influence, in-cluding modal noise as well. The importance of the
different noise sources was compared on the basis ofthe coefficient of variation, i.e., the ratio of the vari-ance to the signal mean.
3. Results
Typical results obtainedwith our hybrid experimental-numerical method are illustrated in Fig. 4. A holo-gram of USAF test target patterns 1elements of group62 is shown, after digitization on a CCD. Here thecontribution of the reference wave intensity 3secondterm in Eq. 1124 is subtracted to enhance the fringevisibility. The corresponding numerically recon-structed image shows that the patterns could beresolved with good quality up to 102 lp@mm at adistance of 4 mm.Our microendoscopic system was capable of restor-
ing three-dimensional information of the observedobject by locating the plane where the reconstructed
Fig. 4. Top, hologram of USAF test target patterns 1elements ofgroup 62 collected on the MCF and digitized on a CCD camera.Bottom, the focused reconstructed image shows patterns of fre-quency of 64 lp@mm 1vertical and horizontal patterns at right2, and80.6, 90.5, 102, and 114 lp@mm 1vertical patterns top to bottom atleft2. The observation distance was 4 mm.
1 November 1995 @ Vol. 34, No. 31 @ APPLIED OPTICS 7189

image was focused 1Fig. 52. Precise measurement ofthe observation distance to the object was renderedpossible by the use of a micrometric translation stageto move the object and the miniaturized endoholo-scope prototype. A calibration of the distance wasnecessary before the measurement was acquired.Nevertheless, one has to be careful with the use ofthis distance in the calculation because the lighttravels through two different media 1air and quartz2,characterized by two different wave numbers. Fur-thermore, the tilt angle of the optical flat influences
Fig. 5. From top to bottom, the image reconstructed at d 2 0.15mm, d, and d 1 0.15 mm, respectively. These images illustratethe capability of our system to restore three-dimensional informa-tion by focusing the reconstructed image with a precision of lessthan 0.15 mm for an observation distance of d 5 4 mm.
7190 APPLIED OPTICS @ Vol. 34, No. 31 @ 1 November 1995
the spatial distribution of the interference fringes.These factors must be considered when the phase andamplitude data of the reference beam are introducedin the image reconstruction procedure of the holo-gram and in the determination of the reconstructiondistance with the focusing condition.Measurements on the USAF test target were per-
formed for different distances so that the cutoff fre-quency could be systematically determined and com-pared with the simulation predictions. Theexperimental AMTF could be derived from contrastmeasurements and plotted along with the simulatedAMTF 1Fig. 62. The results obtained from the simula-tion show some oscillations caused by numericalartifacts, coming from the windowing effect occurringin the Fourier transform computations involved in thealgorithm. The main information concerning theresolution power is given by the cutoff frequencyderived from the transfer function. A criterion forcutoff at an AMTF value of one half 1signal-to-noiseratio of 102 was stated previously 1Subsection 2.A2.However, we have noticed in our systematic observa-tions that patterns could be clearly distinguishedeven when they had an amplitude contrast measuredbelow the one-half threshold. Therefore, to provideinformation that better corresponds to what the ob-server can see with this technique, we applied a lowerrequirement to the determination of cutoff frequency,i.e., an AMTF value of 0.25. It is critical to note thatthis value does not guarantee a high signal-to-noiseratio value of the reconstructed object signal. Theexperimental cutoff frequency was compared with thesimulation in the same conditions and with the samecriterion, over a range of observation distances 1Fig.72, and it showed good agreement.One of the principal anticipated outcomes of the
simulation predictions was to evaluate the impor-tance of low-pass filtering because the hologram hadto be sampled on theMCF tip, presenting a linear coredensity of ,200 mm21, which should permit a correctsampling up to 100 lp@mm. Logically, if we standfar enough from the object, the limit is due to themulticore fiber aperture, which cuts the higher-
Fig. 6. Simulated 1dashed curve2 and experimental 1squares2AMTF at 4-mm distance.

frequency hologram fringes. When we get closer tothe observed object, the hologram fringes are moredense and can no longer be sampled correctly over thewhole surface of the multicore fiber, which is then thelimiting factor for resolution. Therefore, the behav-ior of the resolution power will be governed by themulticore fiber density, imposing a limit for the cutofffrequency at small observation distances, and byaperture for larger distances, with a hyperbolic de-crease 1Fig. 82. This behavior was in fact verified bysimulation with a simulated multicore fiber featuringa perfectly hexagonal arrangement.18 However, thearrangement of cores in the MCF is rather random.This permits an oversampling of the signal by theMCF, resulting in a cutoff not as distinctly observedas expected. As we get closer to the object thehologram fringes are no longer sampled accurately byall theMCF cores, already inducing a loss of signal forthe frequencies below cutoff. This phenomenon be-gins at observation distances under 2 mm 1Fig. 92.Finally, MCF sampling is responsible for a large
Fig. 7. Cutoff frequency versus observation distance, calculatedby simulation 1dashed curve2 and derived experimentally 1dia-monds2.
Fig. 8. Plot of the cutoff frequency as a function of observationdistance, showing the effect of sampling the hologram on the MCF1squares2 and the limitation caused by the aperture only 1dashedcurve2.
attenuation of AMTF values, qualifying it definitelyas the most limiting factor for observations closerthan 1.5 mm. These results were obtained by simu-lation of the hologram sampling on an actual experi-mental image of an MCF. Unfortunately, these twodifferent parts of the cutoff frequency curve could notbe demonstrated experimentally because of the tech-nical limits of our prototype. All the measurementswere performed in a range of distances 1d $ 4 mm2 inwhich the multicore fiber density effect on resolutionis negligible.Experiments were performed to analyze and quan-
titatively characterize the different sources of noise.Interference effects between the different modes ofpropagation in a fiber core could be evaluated bycomparison of an image recorded in normal conditionsto an image in which vibration applied to the imagingmulticore fiber provoked an averaging of the lightpattern transmitted by the cores 1Fig. 102. The noiseis not totally eliminated, but its drastic reductionsmooths the signal shape, and allows, for instance,the human eye to read better the fringes of thehologram. This is explained by the fact that, in thepresence of vibration, light transmitted by each coreis distributed over several propagation modes, lead-ing to a spreading of the intensity shape. The lightglobally transmitted by an individual core could bealtered by 10–20%, depending on the bending radiusor the vibration applied to the MCF. This variationis due to the cross talk and the coupling of radiativemodes, acting mostly between adjacent cores. Ourexperimental observations have shown that ,15% ofthe light focused into a single core 1fundamentalmode2 could be coupled in adjacent cores. We couldalso demonstrate that the total intensity transmittedby the MCF remains constant, reinforcing our state-ment that these local intensity variations are due tointeraction phenomena between adjacent cores, andeven between different propagation modes within thesame core. As a major result, we have been able toverify, both experimentally and by simulation, that
Fig. 9. Plot of the simulated AMTF’s for different observationdistances 1z # 2 mm2, showing a decrease of the AMTF level forfrequencies below cutoff caused by nonoptimal fringe sampling bythe MCF.
1 November 1995 @ Vol. 34, No. 31 @ APPLIED OPTICS 7191

this noise does not influence the resolution limitsignificantly. This result, surprising at a first glance,can be explained: information carried by the interfer-ence fringes is disturbed only locally, so we takeadvantage of the statistical averaging to retrieve itfrom the noise. Furthermore, the modal noise has aspatial frequency content higher than that of theholographic signal. In this case, the informationnecessary for reconstruction is not altered signifi-cantly, as far as resolution is concerned.Finally, the most important perturbation to the
signal is due to structural noise. Indeed, the lightcoupling into the multicore fiber is strongly depen-dent on the core morphology. This effect is enhancedwhen coherent light is used, compared with whitelight for which the intensity is supposed to be distrib-uted among the whole set of propagation modes of thecore.The relative importance of all the different sources
of noise described above was investigated quantita-tively by application of a uniform signal at theentrance to the MCF. The signal mean and stan-dard deviation were measured at the output of themulticore fiber under three different conditions, i.e.,with incoherent light, or with coherent light with orwithout vibration applied to eliminate multimodalinterference effects. The ratio of standard deviationto signal mean gives information on the heterogene-ity of the output signal introduced by the MCF noise.
Fig. 10. Images showing a uniform coherent signal transmittedthrough stable 1top2 and vibrated MCF 1bottom2.
7192 APPLIED OPTICS @ Vol. 34, No. 31 @ 1 November 1995
The influence of noise introduced by the MCF to thehologram on the reconstructed image was quantified.The coefficient of variation was shown to be approxi-mately of the same order as noise in the hologram.Furthermore, in the absence of MCF sampling, thereis intrinsic noise caused by numerical artifacts.Indeed, the image of a uniformly intense object isreconstructed with a fluctuation characterized by avariance of 9% of the signal mean, without the MCFnoise. Table 1 shows that structural noise is impor-tant in the case of coherent illumination, whereasmodal noise, although it is very remarkable by visualperception, adds only ,10% of intensity spreading,compared with the structural noise component.
4. Discussion
The possibility of using a numerical holographicreconstruction seems to be a valuable approach to-ward the development of holography in differentapplications. The numerical modeling of Fresnelholography has proved to be adequate, and its resultshave been successfully verified experimentally. How-ever, we need to be aware of numerical artifacts, suchas the windowing effect, which prevent us fromobtaining a wide uniform field of reconstruction.The algorithm chosen was quite simple and allowedus to foresee that it could lead to quasi real-timeimage reconstruction, with the help of a digital signalprocessor and its associated software.11The experimental research involving the evalua-
tion of the amplitude MTF suffered a lack of precisionin the cutoff slope definition. This was due to thefact that measurements were made only with oneobject, the USAF target, which offers a limited num-ber of frequency patterns. Other standard test ob-jects were examined but were found to be inadequatefor holography. Ronchi rulings available for ourexperiments did not feature a smooth surface, and avariable frequency test target19 induced a parasiticgrating effect that disturbed the real focused image.The most promising result was the resolution ofmicrometric objects 15 µm2 with a low-frequency re-cording medium, i.e., the MCF. This resolution iscomparable with what was obtained before withholographic plates 14.38 µm2 under different experi-mental conditions.4 This establishes the possibilityof microscopic coherent imaging of biological tissuesat the cellular level, which is a major advantage of thismethod.4 This performance is very attractive forfuture possible medical applications, because it signifi-
Table 1. Noise Statistics: Coefficient of Variation ARatio of Variance s toSignal Mean mB for the Hologram and Reconstructed Image
Experimental Condition
s@µ 1%2
HologramReconstructed
Image
Incoherent illumination 11 10Coherent illumination 28 24.5Coherent illumination, vibrationapplied to MCF
25 23

cantly improves the resolution achievable in conven-tional microendoscopy. Furthermore, the versatilityintroduced by the electronic processing of the holo-graphic image is an undeniable asset for its use inroutine procedures by the physician. The minor roleplayed by the MCF in the resolution limitation shouldencourage the use of holographic recordings in medi-cal applications without the help of holographic plates.This extends the potential use of the holographictechnique to new domains of investigation. The qual-ity of the hologram endoscopic recording could begreatly improved with technological advances, and nolonger suffers the drastic limitations encountered bythe group who first experimented with this method.8The results obtained in the quantitative analysis ofnoise have revealed that the spatial resolution ob-tained with our method is not sensitive to perturba-tions introduced by different phenomena occurring inthe MCF transmission. In particular, the noise pro-duced by modal interference in each core, whichseemed to be important following the first visualobservations, turned out to be unimportant for theresolution capabilities of our endoholoscope. Struc-tural noise contribution was shown to be the majorperturbation to the signal, and it is an unavoidabledrawback to the use of an endoscope with coherentlight. The quantitative analysis of intensity fluctua-tions in the reconstructed image showed that thedetectability of the signal can be perturbed by thenoise coming from theMCF. However, this was not amajor drawback in the measurements performedbecause the USAF target elements presented anoptimally contrasted signal. Finally, these differentnoise sources do not significantly affect the resolutionpower of our system. This is the major conclusion ofour analysis.
5. Conclusion
The method of applying a numerical reconstructionprocedure to experimental holograms has been suc-cessfully demonstrated in the conditions of miniatur-ized endoholoscopy. The resolution performances ob-tained with our experimental setup have shown avery good agreement with the predictions obtained bysimulation, based on the Fresnel diffractionmodeling.The identification of 5-µm objects for a 4-mm observa-tion distance has been possible and let us foresee theimaging of biological tissues at the cellular level.The analysis of the different sources of noise allowed adetailed understanding of the phenomena occurringin our processing but evidenced no relevant resolutionloss caused by these perturbations. This can be seenas a robust property of this holographic methodtoward experimental defects. This research indi-cates that the method is feasible and opens a new wayto what could be called numerical microholography,which brings new and attractive perspectives to thestudy of the morphology of very small organs andcavities as well as tissues even at the cellular level.
This research was supported by the Swiss PriorityProgram in Optics, CEPF-PPO@MED. The authors
thank E. B. de Haller for his important contributionto the experimental setup, G. von Bally for fruitfuldiscussions, and R. and N. Croisy 1Andromis Ltd.,Geneva2 for constant interest.
References1. D. Hadbawnik, ‘‘Holographische endoskopie,’’ Optik 45, 21–38
119762.2. G. Raviv, M. E. Marhic, E. F. Scanlon, S. F. Sener, and M.
Epstein, ‘‘In vivo holography of vocal chords,’’ J. Surg. Oncol.20, 213–217 119822.
3. H. I. Bjelkhagen, M. D. Friedman and M. Epstein, ‘‘Holo-graphic high resolution endoscopy through optical fibers,’’Proc. Laser Inst. Am. 64, 94–103 119882.
4. H. I. Bjelkhagen, J. Chang, and K. Moneke, ‘‘High-resolutioncontact Denisyuk holography,’’ Appl. Opt. 31, 1041–1047119922.
5. G. von Bally, ‘‘Otoscopic investigations by holographic interfer-ometry: a fiber endoscopic approach using a pulsed rubylaser system,’’ in Proceedings of the International Conferenceon Optics in Biomedical Sciences, G. von Bally and P. Greguss,eds. 1Springer-Verlag, Berlin, 19822, pp. 110–114.
6. J. A. Gilbert, T. D. Dudderar, and A. Nose, ‘‘Remote deforma-tion field measurement through different media using fiberoptics,’’ Opt. Eng. 24, 628–631 119852.
7. H. Podbielska andA. Friesem, ‘‘Endoscopic optical metrology—the possibilities of holographic interferometry,’’ in OpticalFibers in Medicine V, A. Katzir, ed., Proc. Soc. Photo-Opt.Instrum. Eng. 1201, 552–560 119902.
8. T. D. Dudderar, J. A. Gilbert, and A. J. Boehnlein, ‘‘Achievingstability in remote holography using flexible multimode imagebundles,’’Appl. Opt. 22, 1000–1005 119832.
9. W. S. Haddad, D. Cullen, J. C. Solem, J. W. Longworth, A.McPherson, K. Boyer, and C. K. Rhodes, ‘‘Fourier-transformholographic microscope,’’Appl. Opt. 31, 4973–4978 119922.
10. U. Schnars and W. Juptner, ‘‘Direct recording of holograms bya CCD target and numerical reconstruction,’’ Appl. Opt. 33,179–181 119942.
11. E. Leith, C. Chen, H. Chen, Y. Chen, D. Dilworth, J. Lopez, J.Rudd, P. -C. Sun, J. Valdmanis, and G. Vossler, ‘‘Imagingthrough scattering media with holography,’’ J. Opt. Soc. Am. A9, 1148–1153 119922.
12. H. M. Smith, Principles of Holography 1Wiley, NewYork, 19752,Chap. 3.
13. D. Gabor and W. P. Goss, ‘‘Interference microscope with totalwavefront reconstruction,’’ J. Opt. Soc. Am. 56, 849–858119662.
14. J. W. Goodman, Introduction to Fourier Optics 1McGraw-Hill,San Francisco, Calif., 19682, Chap. 6.
15. J. B. DeVelis and G. O. Reynolds, ‘‘Fresnel holography,’’ inHandbook of Optical Holography, H. J. Caulfield, ed. 1Aca-demic, NewYork, 19792, pp. 139–155.
16. W. B. Spillman, B. R. Kline, L. B. Maurice, and P. L. Fuhr,‘‘Statistical-mode sensor for fiber optic vibration sensing uses,’’Appl. Opt. 28, 3166–3176 119892.
17. C. O. Egalon and R. S. Rogowski, ‘‘Model of an axially strainedweakly guiding optical fiber modal pattern,’’ Opt. Eng. 31,1332–1339 119922.
18. O. Coquoz, C. Depeursinge, R. Conde, and F. Taleblou, ‘‘Perfor-mance of on-axis holography with a flexible endoscope,’’ inHolography, Interferometry, and Optical Pattern Recognitionin Biomedicine III, H. Podbielska, ed., Proc. Soc. Photo-Opt.Instrum. Eng. 1889, 216–223 119932.
19. Edmund Scientific Company, Barrington, N.J. 08007-1380.
1 November 1995 @ Vol. 34, No. 31 @ APPLIED OPTICS 7193