PERFORMANCE OF FARM INCOME ENHANCEMENT AND FOREST CONSERVATION (FIEFOC) PROJECT BENEFICIARIES IN...
49
1 PERFORMANCE OF FARM INCOME ENHANCEMENT AND FOREST CONSERVATION (FIEFOC) PROJECT BENEFICIARIES IN RUKUNGIRI DISTRICT, WESTERN UGANDA BY NDYABANDIHO SAUL 11/U/1295 ARESEARCH PROJECT SUBMITTED TO MAKERERE UNIVERSITY SCHOOL OF FORESTRY, ENVIROMENTAL AND GEOGRAPHICAL SCIENCES AS PARTIAL FULLFILLMENT FOR THE AWARD OF THE DEGREE OF BACHELOR OF SOCIAL AND ENTREPRENUARIAL FORESTRY AUGUST- 2014
-
Upload
independent -
Category
Documents
-
view
2 -
download
0
Transcript of PERFORMANCE OF FARM INCOME ENHANCEMENT AND FOREST CONSERVATION (FIEFOC) PROJECT BENEFICIARIES IN...
1
PERFORMANCE OF FARM INCOME ENHANCEMENT AND FOREST
CONSERVATION (FIEFOC) PROJECT BENEFICIARIES IN RUKUNGIRI
DISTRICT, WESTERN UGANDA
BY
NDYABANDIHO SAUL
11/U/1295
ARESEARCH PROJECT SUBMITTED TO MAKERERE UNIVERSITY
SCHOOL OF FORESTRY, ENVIROMENTAL AND GEOGRAPHICAL
SCIENCES AS PARTIAL FULLFILLMENT FOR THE AWARD OF THE
DEGREE OF BACHELOR OF SOCIAL AND ENTREPRENUARIAL
FORESTRY
AUGUST- 2014

i
DECLARATION
I Ndyabandiho Saul hereby declare that this research project report is my original work and
has never been submitted to Makerere University or any other academic institution for any
award of the Bachelors’ degree.
Signed …………………………………….
NDYABANDIHO SAUL
Date……………………………………….
This research project report has been submitted to the school of forestry, environmental and
geographical sciences under the supervision and approval of
Signed…………………………………….
Dr.JOSEPH BAHATI
Date………………………………………

ii
DEDICATION
I dedicate this research project report to my parents Mr.&Mrs.Karyeija Roland, my grandfather
Mzee Tomos Nkanga, my brothers,Clerkson, Caleb, Molton and Dalton.
iii
ACKNOWLEDGEMENT
Firstly, I thank the almighty God for his love, faithfulness and protection upon my life for
seeing me throughout university life up to the completion of my degree at Makerere University
Kampala. Great thanks to my parents Mr. &Mrs.Karyeija Roland for the provision of material,
moral and financial support to me.
Special thanks go to my supervisor Dr. Joseph Bahati, the DFO Rukungiri District, Mr.
Twinomujuni Arthur, my cousin Mr.Ngabirano Innocent.
Lastly but not least Iam so grateful to my classmates, and all my friends who have helped and
guided me throughout the period of writing this research report especially Mr.Karuhanga
Roland, May the Good Lord reward you abundantly.
iv
TABLE OF CONTENTS
DECLARATION ........................................................................................................................ i
DEDICATION ........................................................................................................................... ii
ACKNOWLEDGEMENT ........................................................................................................iii
TABLE OF CONTENTS .......................................................................................................... iv
LIST OF TABLES ................................................................................................................... vii
LIST OF FIGURES .................................................................................................................viii
LIST OF APPENDICES ........................................................................................................... ix
ABBREVIATIONS AND ACRONYMS .................................................................................. x
ABSTRACT .............................................................................................................................. xi
CHAPTER 0NE: INTRODUCTION ......................................................................................... 1
1.0 BACK GROUND ................................................................................................................. 1
1.1 Problem statement ................................................................................................................ 3
1.2. OBJECTIVES ..................................................................................................................... 4
1.2.1 General objective............................................................................................................... 4
1.2.2 Specific objectives............................................................................................................ 4
1.3 Hypothesis. ........................................................................................................................... 4
1.4 Problem justification ............................................................................................................ 4
CHAPTER TWO: LITERATURE REVIEW ............................................................................ 5
2.1 Plantation Forestry in Uganda .............................................................................................. 5
2.2 Farm income enhancement and forest conservation (fiefoc) project beneficiaries .............. 6
2.3 Performance of project beneficiaries.................................................................................... 7
2.4 Growth performance of trees................................................................................................ 8
2.4.1 Tree height growth ............................................................................................................ 8
2.4.2 Tree diameter growth ........................................................................................................ 8
v
2.5 Establishment of trees on farms ........................................................................................... 8
2.5.1 Land preparation ............................................................................................................... 9
2.5.2 Lining out .......................................................................................................................... 9
2.5.3 Spacing/Espacement and lining out .................................................................................. 9
2.6 Maintenance of trees on farm ............................................................................................... 9
2.6.1 Weeding .......................................................................................................................... 10
2.6.2 Thinning: ......................................................................................................................... 11
2.6.3 Pruning: ........................................................................................................................... 12
2.6.4Protection against fires, grazers and browsers: ................................................................ 12
2.7 Challenges to plantation forestry in Uganda ...................................................................... 12
CHAPTER THREE: STUDY AREA AND METHODOLOGY ............................................. 14
3.1 Location .............................................................................................................................. 14
3.1.1 Population........................................................................................................................ 14
3.1.2 Economic activities ......................................................................................................... 14
3.1.3 Climate ............................................................................................................................ 15
3.1.4 Geology and soils ............................................................................................................ 15
3.1.5 Flora and fauna ................................................................................................................ 15
3.1.6 Drainage .......................................................................................................................... 15
3.2 study design ........................................................................................................................ 16
3.3 sample selection and size ................................................................................................... 16
3.4 sampling ............................................................................................................................. 16
3.5. Assessment of establishment and maintenance levels ...................................................... 17
3.6. Determination of growth performance .............................................................................. 18
3.7. Assessment of the challenges faced by beneficiaries ........................................................ 18
vi
3.8. Data analysis ..................................................................................................................... 18
CHAPTER FOUR: RESULTS AND DISCUSSIONS ............................................................ 19
4.1 Social economical and demographic summary characteristics of the respondents ............ 19
4.2 Growth performance .......................................................................................................... 21
4.3Establishment and management practices for the different beneficiary categories ............ 22
4.4 Challenges faced by the different categories...................................................................... 25
CHAPTER FIVE: CONCLUSION AND RECOMMENDATIONS ...................................... 27
5.1 Conclusions ........................................................................................................................ 27
5.2 Recommendations .............................................................................................................. 28
APPENDICES .......................................................................................................................... 32
vii
LIST OF TABLES
Table 1: Social economical and demographic summary characteristics of the respondents ....... 19
Table 2: Results for dbh and height comparisons under the different beneficiary categories ..... 21
Table 3: Establishment and management practices percentages ................................................. 22
Table 4: Results for severity of Challenges under the beneficiary categories ............................. 25

viii
LIST OF FIGURES
Figure 1: Design of the plot lay out along the diagonal transect in the plantation ...................... 17

ix
LIST OF APPENDICES
Appendix 1: Check list for collecting management/silvicultural data ......................................... 32
Appendix 2: Sample analysis for tree growth performance parameters ...................................... 34
x
ABBREVIATIONS AND ACRONYMS
FIEFOC: Farm Income Enhancement and Forest Conservation.
FAO: Food and Agricultural Organization.
MAAIF: Ministry of Agriculture, Animal Industry and Fisheries.
MWE: Ministry of Water and Environment.
NTFPs: non timber forest products.
DFO: District Forestry Officer.
SFTO: Sub county forest technical officer.
DBH: diameter at breast height.
SPGS: Sawlog Production Grant Scheme.
UBOS: Uganda bureau of statics.
SPSS: Stastical package for social scientists.
FRA: Forest resource assessment.
FSSD: Forest Sector Support Department.
M: Meters.
CM: Centimeter.
%: Percentage.
xi
ABSTRACT
Uganda like any other developing country has several tree planting and conservation projects
that have been implemented of which FIEFOC Project is among. This study was aimed at
assessing the performance of different beneficiary categories under FIEFOC project i.e.
individual farmers, groups and institutions in Rukungiri District in terms of dbh and height,
challenges faced, establishment and maintenance practices. The study employed both
quantitative and qualitative techniques from which data was collected on the variables dbh and
height, lining out, weeding, thinning, pruning , forest protection and the challenges faced, the
main tree species that was assessed was pinus caribea var hondurensis. Data analysis was done
using excel and spss to obtain the significance levels and the percentages for comparisons under
different categories, the standard p value used was 0.5. The results showed a significant
difference in the growth performance in terms of dbh and height, the best being individual
farmers, followed by institutions and lastly groups. In terms of establishment and maintenance,
results showed that all the three beneficiary categories had the basics of what was required in
plantation establishment and maintenance though institutions demonstrated the best practices
followed by individual farmers and lastly group farmers. All the three beneficiary categories
shared the similar challenges but with different percentages of severity.
1
CHAPTER 0NE: INTRODUCTION
1.0 BACK GROUND
Today forests cover 21 % of Uganda area; this figure reflects a long history of deforestation.
From 1970 to 1990 forest cover was reduced by 50 % (FAO, 1995). The actual reduction rate
per year is presumed to be 2 % (FRA, 2000). According to a report by (BANANA, 1999), the
tropical high forest covered 12.7 % of Uganda in 1900; today it covers 5 % of the total land
area, this gives an idea of the distribution of forest ownership in Uganda. There are 20,000 ha
plantations in the forest reserves. However, only 6,000 ha of the 20,000 ha plantations in Forest
Reserves are presumed to be well-stocked due to difficult political situations. Moreover, does
not consider the unknown number of on-farm plantations, agro forestry systems and private
small-scale woodlots, only 65 % of the Forest Reserves are covered with forest. But this should
not necessarily be interpreted as forest loss, as parts of these reserves were established in the
1920’s on land not covered by forest (HAMILTON, 1984; MWLE, 2000).
The number of trees in forests is declining, and the number on farms is increasing. This can be
explained by the fact that the natural forests accessible to villagers are declining; farm sizes are
decreasing which leads to intensification and diversification with trees; rapid urbanization
(6%/year) resulting in an increasing demand for tree products; and increasing demand for timber
while forest-sourced timber supply is falling (FAO,2005).And hence development organizations
and research institutes worldwide have implemented numerous projects targeted towards
improving the production, use and commercialization of NTFPs and agro forestry tree products
for livelihoods, markets and biodiversity purposes(Cosyns et al.,2011).
The deliberate integration of trees in the farming landscape for social, economic and
environmental benefits – has come of age and is now being recognized as a significant
contributor in meeting virtually all the millennium development goals, and in particular
alleviating poverty (Garrity,2004).and hence an increment in the number of Planted forests
which now account to around 140million ha or around 4% of global forests, these plantations
provide over a third of the industrial wood produced in the world wide and their extent and
productivity are increasing (FAO,2006).
2
Once land has been degraded, it’s possible to rehabilitate it and thus restore it to a level of
utility, possibly not as good as its original state but better than it was in its damaged state
(Barrow,1995) and hence Farm income enhancement forest and conservation project FIEFOC
project.
Fiefoc is a project that has been implemented in nationwide tree planting; it is implemented by
the government of Uganda under the ministry of water and environment, according to the office
of the auditor general (2011). FIEFOC aims at contributing to reducing poverty, increasing
agricultural growth rates, diversifying agricultural production and expanding on farm
employment without jeopardizing the stability of agricultural systems.
The project target beneficiaries are the rural poor households, but some few households that
may not be categorized as poor also benefited from the project (auditor general,
2011),Rukungiri District is one of the project areas which were selected based on the severity of
degradation, fuel wood shortage, availability of local forest reserves and degraded areas for
rehabilitation, and tree planting, Under this project in Rukungiri District various beneficiaries
categorized as individual farmers, groups and institutions which include communities, willing
farmers, users, producers, women, youth and students, FIEFOC achieves its objectives through
provision of forestry related logistics like seedlings and technical support to the beneficiaries,
this research is therefore aimed at assessing and comparing the performance of different
beneficiary categories under Fiefoc project in Rukungiri District.
3
1.1 Problem statement
Farmers are commonly believed to be uninterested in, or even hostile to, trees and are widely
blamed for deforestation and land-clearing, especially in tropical developing countries, yet there
is ample evidence that smallholder farmers could establish and even protect small woodlots, but
what we have not yet satisfactorily addressed is the conditions under which they would want to,
(Neil,2001),According to (Masahiko et al.,2014) Provision of material benefits by external
agencies has been widely adopted in developing countries’ forest management, although their
effectiveness in improving local livelihoods and conservation has been controversial
FIEFOC as a project implemented by the government of Uganda is aimed at overcoming some
of the catastrophes through promotion of community based development by ensuring food
security, provision of gainful employment and promotion of sustainable use and management of
natural resources (MWE, 2011), This is achieved through provision of seedlings and technical
advice to farmers who are categorized differently into three beneficiary groups’ i.e. individual
farmers, farmer groups and institutions, However on farm performance of the different
beneficiary categories mentioned above is not known. This study is therefore expected to
provide information and compare the on farm performance of different farmer beneficiary
categories in Rukungiri District.
4
1.2. OBJECTIVES
1.2.1 General objective
• To assess the performance of Fiefoc beneficiary categories (individual farmers, farmer
groups and institutional farmers).
1.2.2 Specific objectives
• To compare the height and diameter (dbh) of tree plantations under different beneficiary
categories.
• To assess the establishment and maintenance practices under different beneficiary
categories.
• To assess the challenges faced by different beneficiary categories.
1.3 Hypothesis.
• Ho: there is no significant difference in the tree growth performance of planted trees by
different beneficiary categories.
• Ho: there is no significant difference in the establishment and maintenance practices
under different beneficiary categories.
1.4 Problem justification
This study will provide information to be used in the implementation of any other tree planting
programmes and projects in Rukungiri District by strategically planning so that much emphasis
is put on the weaknesses and challenges of each farmer beneficiary category in order to enhance
the success of the tree planting projects, It will also provide information on the most active
beneficiaries and their challenges; this will help in providing specific support to a particular
beneficiary category to improve its performance in tree planting programmes.
5
CHAPTER TWO: LITERATURE REVIEW
In this chapter, there is a review of the literature relevant to the topic and the objectives of the
study, the literature on plantation forestry in Uganda, plantation establishment and management
practices, tree growth performance parameters, challenges to plantation forestry and
performance of project beneficiaries.
2.1 Plantation Forestry in Uganda
Every country has a responsibility and obligation for sustainable development of world forestry
Because the status of forests and their changes within any country can have ultimate impacts on
both domestic and international eco-environments under the contemporary global economy
(Limin, et al.,2013), Trees, forests and woodlands cover about 14% of Uganda’s land surface.
Over the last 30–40 years, growth in human population and corresponding increase in demand
for forest products for domestic and industrial use, expansion of agricultural land, illegal
settlements and weak forest management capacity have adversely affected the status of natural
forests in Uganda, particularly the biodiversity. Until recently, little attention had been paid to
development of commercial forests which should have provided alternative forest products and
services to relieve the pressure on natural forests and conserve biodiversity. As a result,
Uganda’s forests have been degraded. (Obua et al.,2001,).
Due to the high rates of deforestation and degradation in Uganda various key forestry
initiatives/programmes and projects were developed with a view that forest trees can help to
combat land degradation by stabilizing soils, reducing water and wind erosion and maintaining
nutrient cycling in soils. ( Lawal.A et al.,2013) ,the projects included the Implementation of the
Farm Income Enhancement and Forestry Conservation Project (FIEFOC),REDD+Coordination,
Saw log Production Grant Scheme, Nyabyeya Forestry College, and the FAO supported
programme “Support for the Rehabilitation, Development and Sustainable Management of
Forest Resources In Northern Uganda”. (MWE, 2013)
However these projects and programmes face challenges such as the high demand for seedlings
that is not matched by the available resources, poor maintenance of the tree crops, and failure of
the group members to stick to their teams, which undermines follow up activities.
6
2.2 Farm income enhancement and forest conservation (Fiefoc) project beneficiaries
Project beneficiaries are a limited group among stake holders who will directly or indirectly
benefit from the project (FAO, 2007). For a project to be successful, it involve beneficiaries at
all levels of project implementation (Morales et al, 2008), Stakeholder participation has also
become a major concern for non-government organizations (NGOs) and international financial
and donor institutions many of whom are increasingly focusing on the issues of basic needs,
access to resources and institutions in their projects and programmes such as FIEFOC project.
(Ajai kumar et al.,2004),According to (Melanie Lain Dare et al.,2012) Involving a range of
stakeholders helps to create working relationships that promote shared appreciation and
accommodation of diverse values and interests in forest management, and enables marginalized
groups to have a voice in decisions affecting them (Hammersley-Chambers and Beckley 2003).
However, developing a balanced and effective stakeholder group is challenging, and neither
genuine nor equitable representation can be assured (Race et al.,1999).
The Farm Income Enhancement and Forestry Conservation (FIEFOC) Project was jointly
coordinated by Ministry of Water and Environment(MWE) and Ministry of Agriculture Animal
Industry and Fisheries (MAAIF), while implementation was by Local governments. The
Forestry Support Component of the project was being co-ordinated by FSSD in 70 districts, and
consists of two sub-components namely Community Watershed Management and Tree
Planting, The 5 – year project was funded by African Development Fund and Nordic
Development Fund as well as Government of Uganda and ended in Dec 2012.
Fiefoc project had three beneficiary categories through which the implementation of its
activities was done, these are; Individual farmer approach, Institutions approach, Groups
approach.
7
2.3 Performance of project beneficiaries.
According to (Race-D, et al.,2000), before beneficiaries are likely to adopt plantation forestry,
they must be motivated to take up the new enterprise and be able to access information on farm
forestry.In order for the farmers to fully participate in tree planting projects (Neil,2001)
suggests that there must be secure access to land on which to grow trees, and secure rights to
the products from the trees, there must be a viable production technology, and all the necessary
inputs for that technology must be available: knowledge, fertilizer, credit, germplasm, etc ,the
farmers must have reasonable confidence that they can protect their trees until maturity, from a
variety of risks: fires; insects, pests and diseases, theft, and even expropriation;
The performance of project beneficiaries may also be influenced by factors such as participation
of project beneficiaries in the implementation and management of the project that was found to
enhance ownership amongst project beneficiaries, increase the sustainability and transparency
of the projects (maraga et al., 2010). In addition environmental factors such as water shortage,
draught, animal damage and pest problems were found to influence the participation of project
beneficiaries in tree planting programmes there by affecting their performance (Ekisa, 2009).
Beneficiary assessment involved data collection techniques such as conversational interviews,
focused group discussion and direct participant observations
The local people as programme beneficiaries provide their off-farm family labor. All other
management inputs and technical supports are provided by the government (Nurmuhammed, et
al., 2009).Here the main objectives are to integrate the people in this programme to ensure
better plantation protection and to help them to find an alternative source of income to eradicate
their poverty. The parameters used to assess growth performance; challenges; establishment and
maintenance levels of the beneficiary farms are discussed.
8
2.4 Growth performance of trees
The rate of growth is dependent upon factors namely, spacing, silvicultural practices, pests and
diseases, animal damage through grazing and browsing. Growth of trees is also influenced by
microclimatic factors and site factors namely topography, soil texture and soil moisture
(Robertson, 1992), growth performance is an attribute of tree diameter growth and tree height
2.4.1 Tree height growth
This occurs by elongation of the terminal bud, this is influenced by site factors such as the
topography, soil moisture and soil texture and it is also related to microclimatic factors
(Robertson, 1992). In addition the tree height is also influenced by grazing and browsing
activities of animals that may result in stunting. Poor post planting silvicultural operations such
as mechanical damage during weeding and early pruning may also lead to stunting of trees
2.4.2 Tree diameter growth
Trees increase in diameter as aring of many cells of xylem is laid by division of the cambium
layer. The rate of diameter growth is influenced by factors such as the species, spacing, the
climatic conditions and quality of the site. Tree diameter growth is sensitive to environmental
fluctuations (dobbertin, 2005; Nath et al.,2006)
2.5 Establishment of trees on farms
Establishment involves activities such as identification of suitable planting sites, lining out,
selection of right initial spacing and planting of seedlings. The time of planting is very crucial to
the survival of tree seedlings. It is important to have sufficient moisture in the soil to ensure
seedling survival and rapid early growth(Meilan,2006).planting should be done in the wet
season since planting in the dry season may lead to increased mortality of the tree seedlings due
to high levels of evapo-transpiration thus increased wilting of the crops(Evans,1996).
9
2.5.1 Land preparation
Land preparation is an important part of establishment with the aim of achieving high survival
and rapid early growth of the planted trees. Some form of land preparation is always necessary
in order to achieve successful plantation establishment. It achieves this largely by removing (or
controlling) the competing vegetation and by cultivation of the soil, which encourages fast root
development of the newly planted seedlings. It is often the most costly silvicultural operation
though choosing the most appropriate techniques and good timing can significantly reduce these
costs.
2.5.2 Lining out
The es-pacement is determined during the lining out operation. Good lining-out not only
ensures the right stocking on the site but also determines the layout of the plantation. Planting
one’s trees in straight lines also makes all subsequent operations much easier - for instance,
weeding, planting, thinning and eventually harvesting.
2.5.3 Spacing/Espacement and lining out
Plant Espacement refers to the distance between plants, which determines the plant density
(known as the stocking) on that particular site. There is an infinite number of different spacing
that can be used but researchers have narrowed it down to a common range for various site
types, species and end product. The Espacement is determined during the lining out operation.
Good lining-out not only ensures the right stocking (sph) on the site but also determines the
layout of the plantation. Planting trees in straight lines also makes all subsequent operations
much easier - for instance, weeding, planting, thinning and eventually harvesting
2.6 Maintenance of trees on farm
Improving timber production efficiency is the most important management consideration in
plantation forests (Kimmins,1997). To meet this goal, plantation forest managers have
established even-aged forests (Kerr 1999) and implemented silviculture management practices
to maximize timber harvests (Peterken,1993).
Plantation maintenance is important in ensuring that the plantations reaches the desired maturity
in addition to enhancing the growth and survival of the tree crops, trees are most susceptible to
10
damage when young and newly planted, early maintenance of established trees through
pruning,thining, weeding should be done to improve stand growth(NARO,2005)
2.6.1 Weeding
A weed is an unwanted plant or a plant that grows in an undesired place, in our case the tree
plantations. Weeds have the ability to grow fast and dominate an area very quickly: they thus
compete against our desired (planted) crop. This competition deprives the planted trees of the
nutrients, water, sunlight and space needed to grow quickly and with a good form. Weedy
plantations are stressed, of poor form, stunted and are susceptible to pest and disease attack
(SPGS, 2011)
There is no question that weed growth is the main problem confronting commercial tree
growers in Uganda, leading to very costly control in the early years of plantation establishment.
The country’s generally highly favorable conditions for tree growth, also leads to rampant weed
growth and unless the weeds are controlled effectively, the plantation investment suffer
seriously and may even fail completely (SPGS, 2007).
There are various methods of weed control which include chemical, mechanical and manual
weeding that are applied for weed control in forest plantations (Evans, 2004),Below is the
classification of different weed types in Uganda’s forest plantations (SPGS, 2011).
Fast growing, annual broad-leaved weeds: A wide range of annual broad-leaved weeds can
emerge from the soil seed bank and compete with trees. These weeds normally reproduce by
means of seeds, and in most cases complete their life cycle in one year (after seeding). Although
they grow very fast, these weeds are generally fairly easy to deal with by removing them early
enough before they compete with the trees and before they set seed. The most common example
is Black-jack (Bidens pilosa), which can be found in all tropical foresters’ socks.
Annual grass weeds; Annual grasses germinate from seed and reproduce in one year. Though
easy to control they need to be dealt with before they pose a serious threat to the trees. Sweet
buffalo grass (Panicum schinzii) is one example of a common annual grass.
11
Perennial, shrubby broad-leaved weeds: These weeds generally reproduce through seed, but
also through various vegetative structures. They include coppice regrowth, invasive species and
climbers. They can impair movement within the plantation to carry out the various operations of
pruning, thinning and harvesting. Their management can therefore be aimed at one or more
phases of the life cycle such as prevention of seed setting or exhaustion of underground roots.
The best known examples are Lantana (Lantana camara), bramble (Rubus cuneifolius) and bug
weed (Solanum mauritianum).
Perennial grass weeds: These weeds are among the most troublesome for tree growers. They
easily spread and are particularly resilient to control. They have a range of mechanisms for
propagation; seeds, rhizomes, stolons. They also constitute a serious fire threat on the plantation
during the dry season. Management programmes should focus on prevention of spread,
cultivation and desiccation of roots. The main problem species are elephant grass, couch grass,
spear grass and sugar cane.
Woody weeds: These include indigenous tree regrowth (e.g. Combretum spp.), Eucalyptus spp.
coppice and alien invader species such as Paper Mulberry (Broussonetia papyrifera) and Black
Wattle (Acacia mearnsii).
Sedges: These are biologically different from grasses and are very difficult to kill because of
their underground rhizomes. Yellow nut sedge (Cyperus esculentus) is common in wetter areas
in Uganda.
2.6.2 Thinning:
Thinning is the removal of a proportion of individual living trees from a stand before the final
harvest (SPGS, 2007).It is normally carried several times over the crop’s life and should start
soon after canopy closure, which is when competition begins. Thinning normally removes the
weaker trees and gives the best trees the space to reach a utilizable size sooner. It’s done so that
the stand produces only large, high quality trees, which can be sold at a Premium price. Where
this size and quality does not matter (e.g. a fuel wood plantation) obviously the same thinning as
for saw log won’t be done.
12
Forest thinning and other management practices are thought to reduce mortality and increase
growth, and have therefore been proposed and implemented to minimize the effects of drought,
warmer temperatures and longer growing seasons expected with climate change (Beverly et al.,
2013). Thinning also maximizes the production of large saw logs in the shortest possible time It
2.6.3 Pruning:
Pruning is the physical severance of a tree’s lower branches, usually carried out in stages or
‘lifts’ throughout the life of the plantation. Pruning allows the early formation of clear knot-free
timber and thereby improves timber quality; Pruning is thus a technique for adding value to
trees growing in plantations (Evans, 1997). Most tree species exhibit a degree of self-pruning,
especially when grown in a plantation situation, which casts heavy shade on the lower branches
as the trees grow. Tree species, however, differing their ability to self-prune: pines have much
more persistent branches than most eucalypts but both require pruning if the grower wants to
maximize the quality of the saw log produced. It is important that pruning takes place before the
branches die, otherwise dead knots will form. Thus it is important to monitor one’s Plantation to
see when canopy closure (i.e. when the overlapping branches from adjacent Rows start
touching) is expected. (SPGS, 2007).
2.6.4Protection against fires, grazers and browsers:
Protection against fires, animals, pests and diseases are very crucial in the management of tree
plantations. Fires are categorized by where they burn, along the ground (ground fires), just
above the surface (surface fires), or in the crowns of the trees (crown fires). The closer it is to
the ground the less difficult it is to fight, Fire protection is important on grassy sites since young
seedlings soon die after burning (Evans, 1996). Browsing and grazing are injurious to newly
planted seedlings (shepherd, 1986; Mathews et al., 1997; Klein et al., 2011). The damages
caused by man manifested through grazing domestic animals in the plantations have a negative
influence on tree performance since they reduce plant growth (Evans, 1992). Livestock damage
through browsing, debarking and trampling.
2.7 Challenges to plantation forestry in Uganda
Nowadays, the intensive management and huge pressure from the human population has
become a great challenge for efficient forest management (Inkyin, et al.,2014).
13
According to (Schirmer,2001),farmers fail to adopt plantation forestry due to fear for factors
such as Shading of crops, pasture and houses on neighboring properties and altering views,
increased feelings of isolations through the fragmentation of previously agricultural landscapes,
loss of productive agricultural land, off site impacts of chemicals used to establish and manage
plantations.
Establishing a plantation requires considerable labor time if land holders do most of the ground
preparation and planting work themselves and yet labor time in long-term investments such as
farm forestry is often allocated as spare time from other enterprises and hence remains a
challenge to mostly small scale farmers(Schirmer,et al.,1999).
14
CHAPTER THREE: STUDY AREA AND METHODOLOGY
In this chapter, the description of the study area, the methodology for sampling, data collection
and analysis are presented,
3.1 Location
Rukungiri District is bordered by Rubirizi District to the north, Mitooma District to the east,
Ntungamo District to the southeast, Kabale District to the south, Kanungu District to the west
and the Democratic Republic of the Congo to the northwest. The district headquarters at
Rukungiri are located approximately 385 kilometers, by road, southwest of Kampala, Uganda's
capital city.
3.1.1 Population
The 2002 national census estimated the population of the district at 308,696. The district annual
population growth rate was estimated at 2.5% in 2002 using those statistics, it is estimated that
the population of the district in 2014 is approximately 366,944. (Rukungiri census Report,
2007).
3.1.2 Economic activities
The mainstay of the economy of Rukungiri District, like the rest of the country, is agriculture.
More than 90% of the population is engaged in farming. Of the 1,524.28 square kilometers total
land area of the district, 1,352.3 square kilometers is arable land. Out of these, 1,150 square
kilometers are already under cultivation. However, production is mainly subsistence although
the soils are very fertile and with potential for intensive commercial farming. The two chief
cash crops are coffee and matooke, the District also has some of the best dairy farms in the
country especially in the sub counties of Kebisoni and Buyanja. About 3.52 million liters of
milk are produced in the district annually. Due to the altitude, Rukungiri District is ideal for
cultivation of all crops including temperate fruits. Thus in many sub counties there are
successful farmers engaged in the production of grapes, apples, pears and peaches.
15
3.1.3 Climate
The District has bimodal rainfall with long rains received from February-May and short rains
from September-November. The mean annual rainfall ranges between 700mm-1200mm. Recent
observations indicate that the rainfall pattern, distribution and amount are becoming more
unpredictable and unreliable. The District is generally cool with daily temperatures ranging
from 15◦C to 20◦C. There is no readily available data on humidity and winds.
3.1.4 Geology and soils
The soils in the District are generally sandy clay loams. The most common soil types are
greyish brown sandy loams and reddish brown sands with sandy loams: Dark brown sandy clay
loam is also common. The parent rock to these soils is Rift valley sediments and volcanic ash.
Pressure due to population increase and poor methods of soil management and the land tenure
system have negatively affected the soils and degradation is rampant.
3.1.5 Flora and fauna
Land that is not under cultivation is covered by three main vegetation zones namely forests,
forest/savanna mosaic and grass savanna. The medium altitude forest types are portions of
Maramagambo forest in Rujumbura County and are also common in parts of Nyarushanje and
Nyakishenyi in Rubabo County, although clearing for cultivation is a constant threat here.
Forest/Savanna mosaics are commonly found in Buyanja, Kebisoni, Nyakagyeme and parts
ofNyakishenyi sub-counties. Towards Queen Elizabeth National Park in Bwambara sub-county
and Minera River in Kebisoni subcounty, grass savanna is dominant. The district is host to some
Forest Reserves for both natural forests and plantations.
3.1.6 Drainage
The district is endowed with a number of rivers and one major lake. Lake Edward is the main
lake in the district where fishing activities take place at Rwenshama Fishing village. Other small
lakes include Kimbugu in Nyarushanje and Lake Garubunda in Kebisoni sub-counties.
The District has both permanent and temporally wetlands (approximately 78.64 sq km). They
include Ntungwa (Birara) system, Nchwera system and Lake Edward margins. There are also
minor wetlands that drain into Kagera system and eventually form part of Lake Victoria
drainage system.
16
3.2 study design
The study employed both quantitative and qualitative techniques in data collection, Quantitative
techniques were used to establish growth performance of the plantations through, height and
dbh measurement, Qualitative techniques were used to assess the challenges as well as
establishment and management practices through use of a check list accompanied by
interviewing and observation.
3.3 sample selection and size
Fiefoc project was implemented in three sub counties in Rukungiri District which are
Nyakagyeme, Narushanje and Buhunga Sub-counties, in each of the above sub counties, three
parishes were taken for project implementation in each of the above mentioned sub county. Due
to time and resource constraints, only one Sub County was taken for the study. Nyakagyeme
Sub County was purposively selected because it had the most number of beneficiaries.
This was done also to reduce on the amount of variability in the site and soil characteristics in
the plantations. All the three parishes in the sub county i.e. Rwerere, Rushasha and Kahoko
were taken for the study and farmers were randomly selected based on different beneficiary
categories and the range of farmers’ plantation size.
3.4 sampling
Plots of 10m by 10m covering 0.01ha were established, these were preferred due to limited
resource and man power and because they were sufficient enough to give wide coverage. (Spgs,
2007), plots were systematically distributed by lying diagonal transects in the plantations with
the help of a compass bearing in order to avoid bias in the data collected.
Diagonal transects were preferred because they capture much variability, these plots were laid
alternating each other leaving a constant space throughout the study of 10m in between them to
avoid bias, using a sampling intensity of 5% for each plantation, the sample size was obtained
and this was used due to the homogeneity in the plantations, as demonstrated in the figure
below,
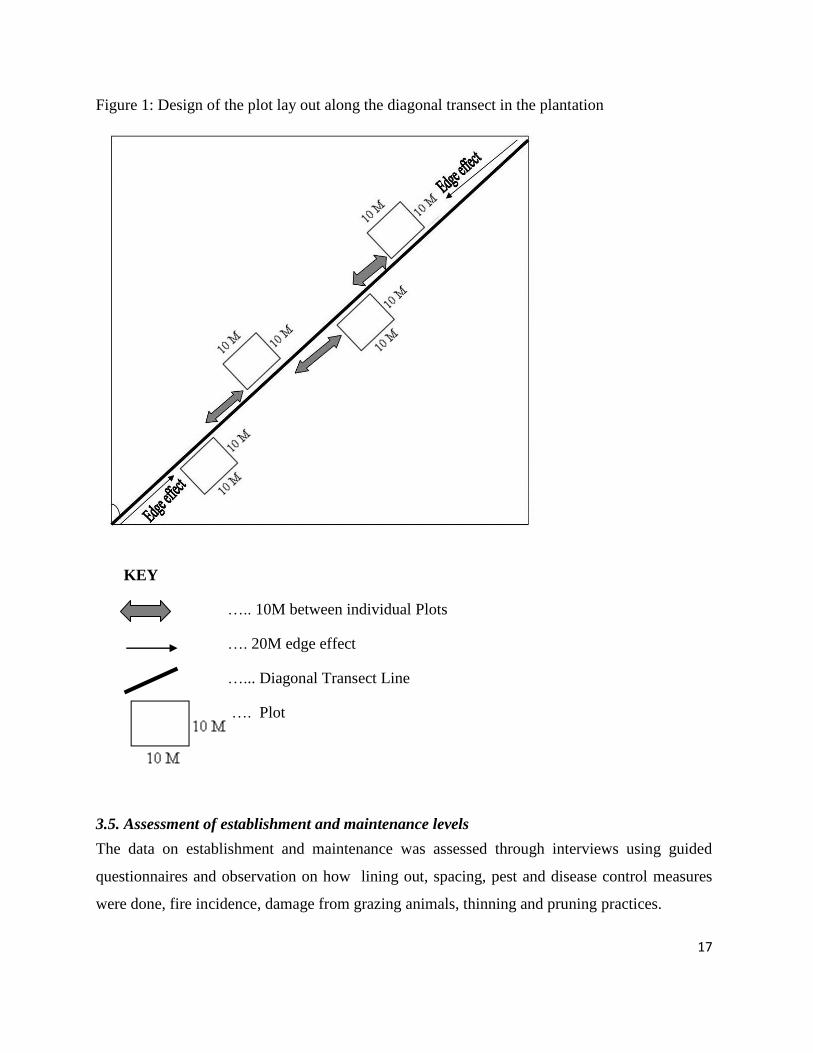
17
Figure 1: Design of the plot lay out along the diagonal transect in the plantation
KEY
….. 10M between individual Plots
…. 20M edge effect
…... Diagonal Transect Line
…. Plot
3.5. Assessment of establishment and maintenance levels
The data on establishment and maintenance was assessed through interviews using guided
questionnaires and observation on how lining out, spacing, pest and disease control measures
were done, fire incidence, damage from grazing animals, thinning and pruning practices.
18
3.6. Determination of growth performance
Data on the growth performance was obtained by measuring the diameter at breast height (dbh)
in centimeters of trees with in the plots as height measurements were obtained by using aludde
and results presented in meters.
3.7. Assessment of the challenges faced by beneficiaries
Data on the challenges affecting different beneficiary categories was obtained through
interviews with the farmers using a guided questionnaire and also through observation on farm
for the condition and performance of trees.
3.8. Data analysis
Individual tree values for height and dbh were entered into excel and exported to spss, means
were calculated and compared to test for the significance at 95% confidence interval, Using spss
(statistical package for social scientists) version 16, the social economical data, establishment
and maintenance data and challenges were cross tabulated with the beneficiary categories and
percentages for each item under each beneficiary category was obtained
19
CHAPTER FOUR: RESULTS AND DISCUSSIONS
The results which were obtained after analysis of the findings using excel and spss in relation to
the set objectives of the study are presented and discussed in this chapter as shown below,
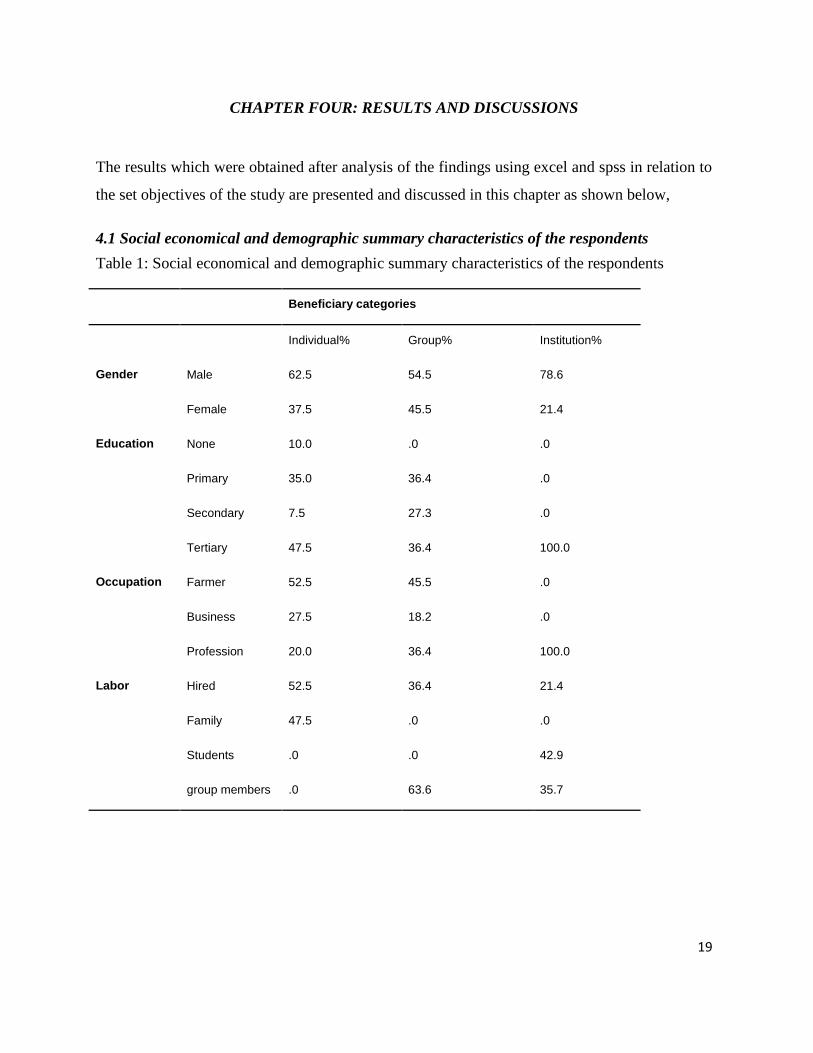
4.1 Social economical and demographic summary characteristics of the respondents
Table 1: Social economical and demographic summary characteristics of the respondents
Beneficiary categories
Individual% Group% Institution%
Gender Male 62.5 54.5 78.6
Female 37.5 45.5 21.4
Education None 10.0 .0 .0
Primary 35.0 36.4 .0
Secondary 7.5 27.3 .0
Tertiary 47.5 36.4 100.0
Occupation Farmer 52.5 45.5 .0
Business 27.5 18.2 .0
Profession 20.0 36.4 100.0
Labor Hired 52.5 36.4 21.4
Family 47.5 .0 .0
Students .0 .0 42.9
group members .0 63.6 35.7
20
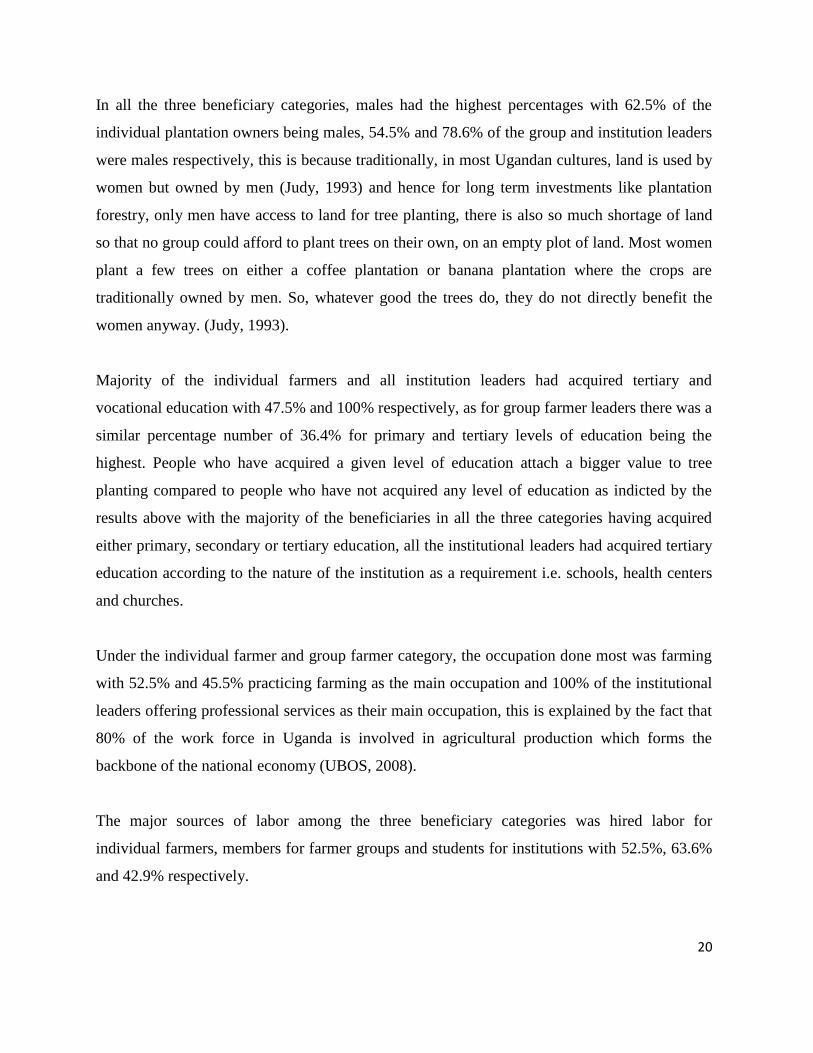
In all the three beneficiary categories, males had the highest percentages with 62.5% of the
individual plantation owners being males, 54.5% and 78.6% of the group and institution leaders
were males respectively, this is because traditionally, in most Ugandan cultures, land is used by
women but owned by men (Judy, 1993) and hence for long term investments like plantation
forestry, only men have access to land for tree planting, there is also so much shortage of land
so that no group could afford to plant trees on their own, on an empty plot of land. Most women
plant a few trees on either a coffee plantation or banana plantation where the crops are
traditionally owned by men. So, whatever good the trees do, they do not directly benefit the
women anyway. (Judy, 1993).
Majority of the individual farmers and all institution leaders had acquired tertiary and
vocational education with 47.5% and 100% respectively, as for group farmer leaders there was a
similar percentage number of 36.4% for primary and tertiary levels of education being the
highest. People who have acquired a given level of education attach a bigger value to tree
planting compared to people who have not acquired any level of education as indicted by the
results above with the majority of the beneficiaries in all the three categories having acquired
either primary, secondary or tertiary education, all the institutional leaders had acquired tertiary
education according to the nature of the institution as a requirement i.e. schools, health centers
and churches.
Under the individual farmer and group farmer category, the occupation done most was farming
with 52.5% and 45.5% practicing farming as the main occupation and 100% of the institutional
leaders offering professional services as their main occupation, this is explained by the fact that
80% of the work force in Uganda is involved in agricultural production which forms the
backbone of the national economy (UBOS, 2008).
The major sources of labor among the three beneficiary categories was hired labor for
individual farmers, members for farmer groups and students for institutions with 52.5%, 63.6%
and 42.9% respectively.
21
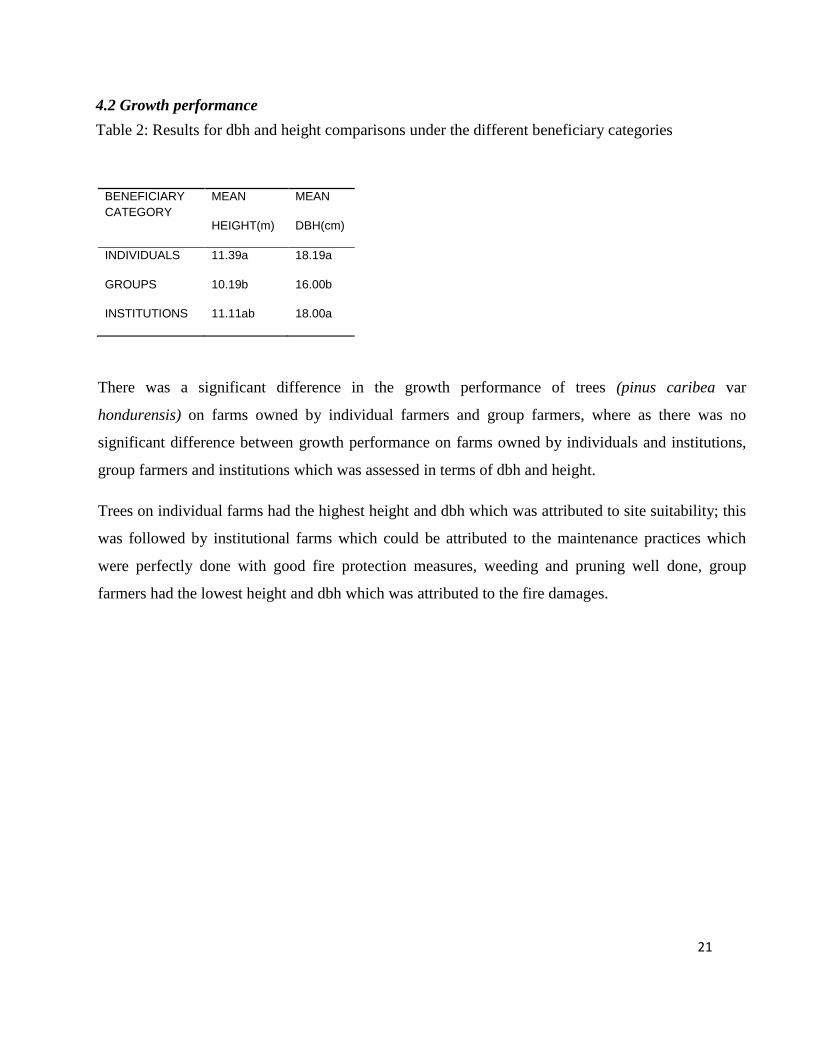
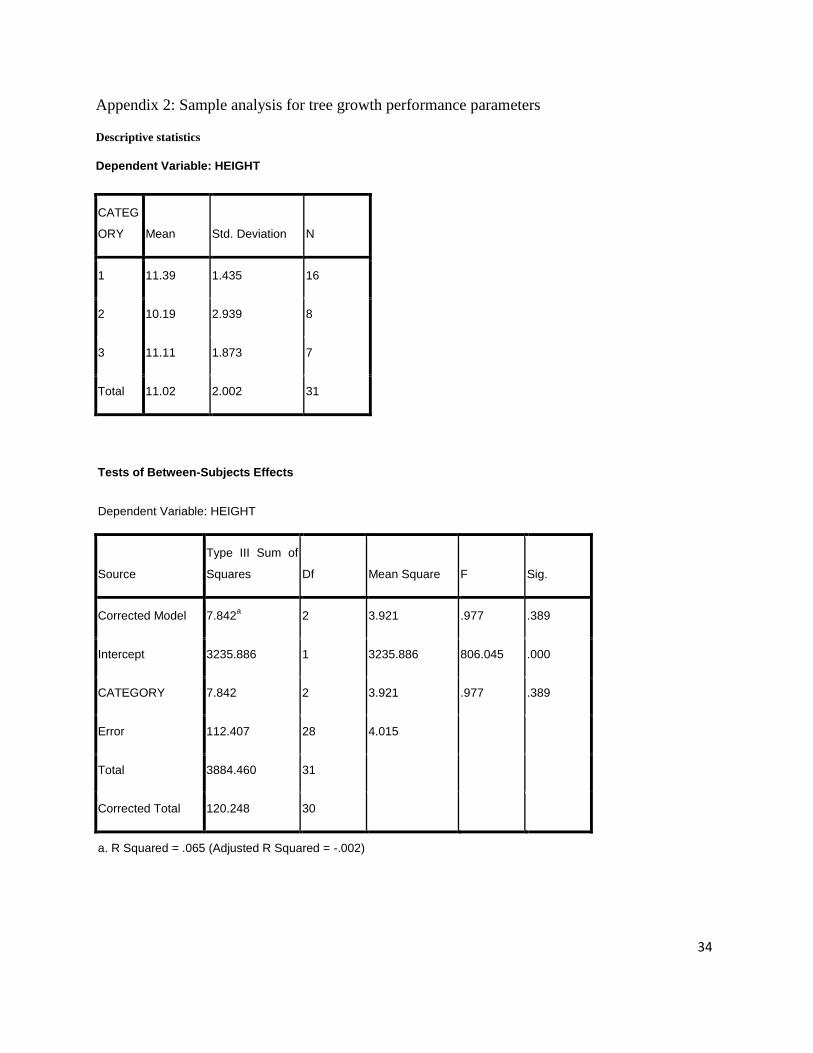
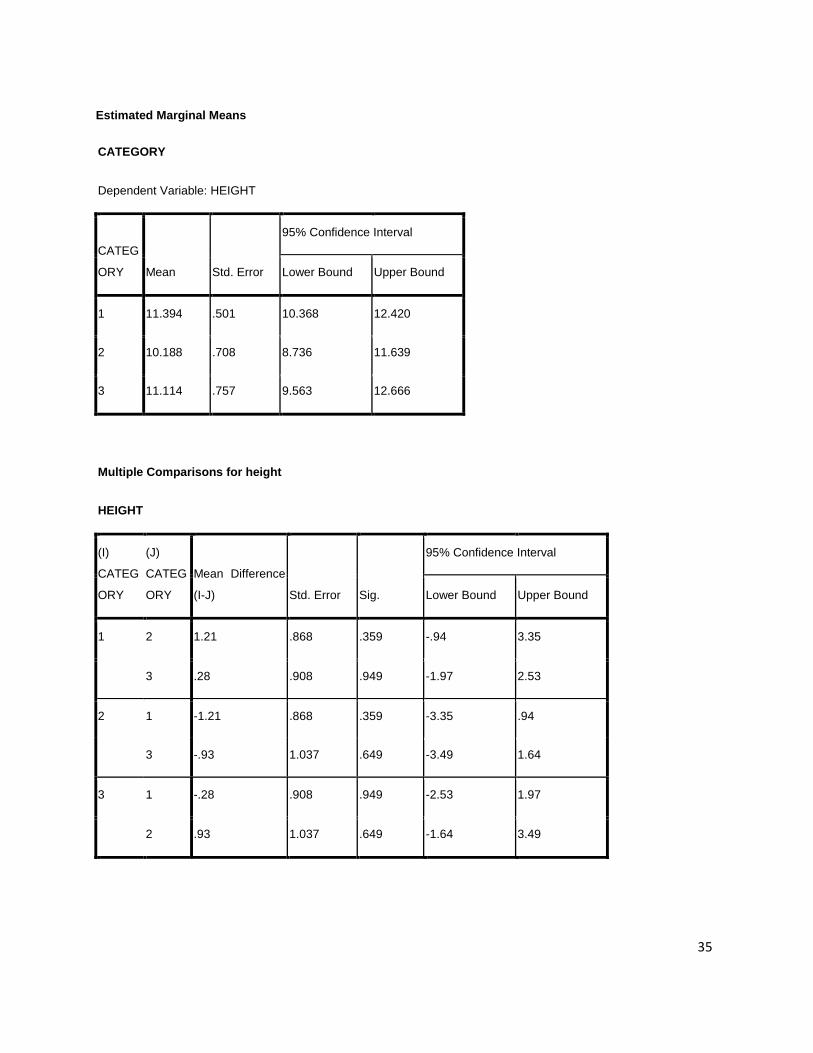
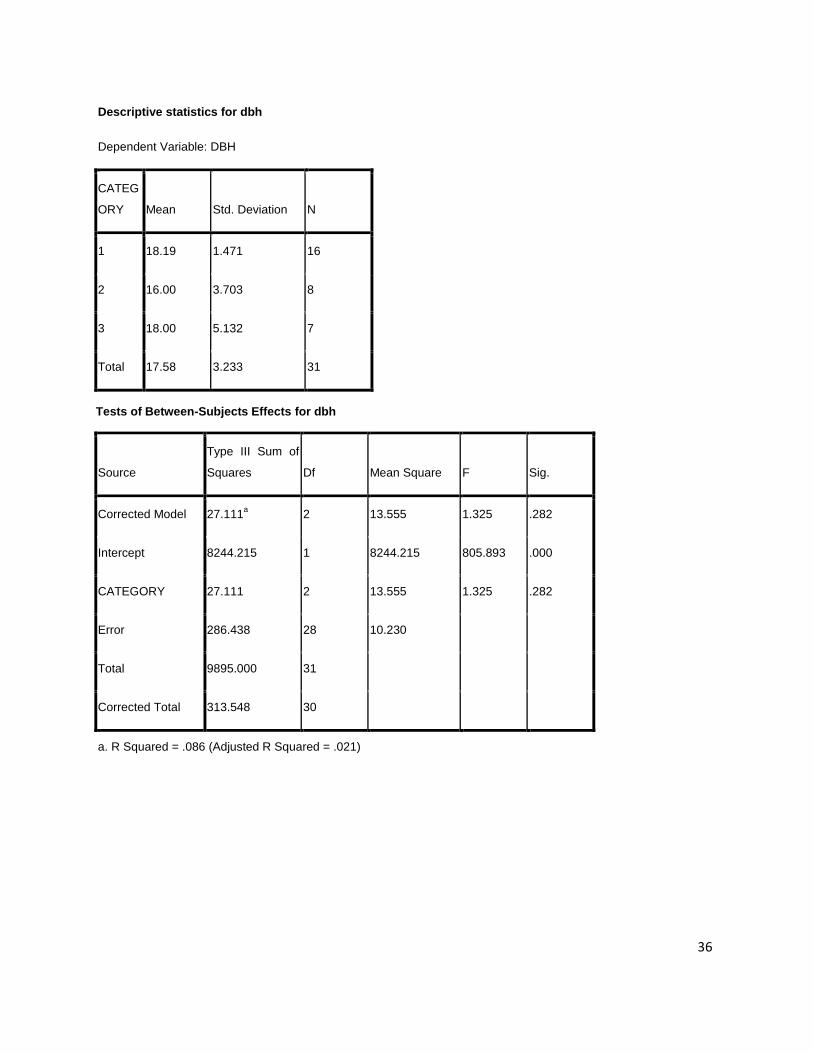
4.2 Growth performance
Table 2: Results for dbh and height comparisons under the different beneficiary categories
BENEFICIARY
CATEGORY
MEAN
HEIGHT(m)
MEAN
DBH(cm)
INDIVIDUALS 11.39a 18.19a
GROUPS 10.19b 16.00b
INSTITUTIONS 11.11ab 18.00a
There was a significant difference in the growth performance of trees (pinus caribea var
hondurensis) on farms owned by individual farmers and group farmers, where as there was no
significant difference between growth performance on farms owned by individuals and institutions,
group farmers and institutions which was assessed in terms of dbh and height.
Trees on individual farms had the highest height and dbh which was attributed to site suitability; this
was followed by institutional farms which could be attributed to the maintenance practices which
were perfectly done with good fire protection measures, weeding and pruning well done, group
farmers had the lowest height and dbh which was attributed to the fire damages.
22
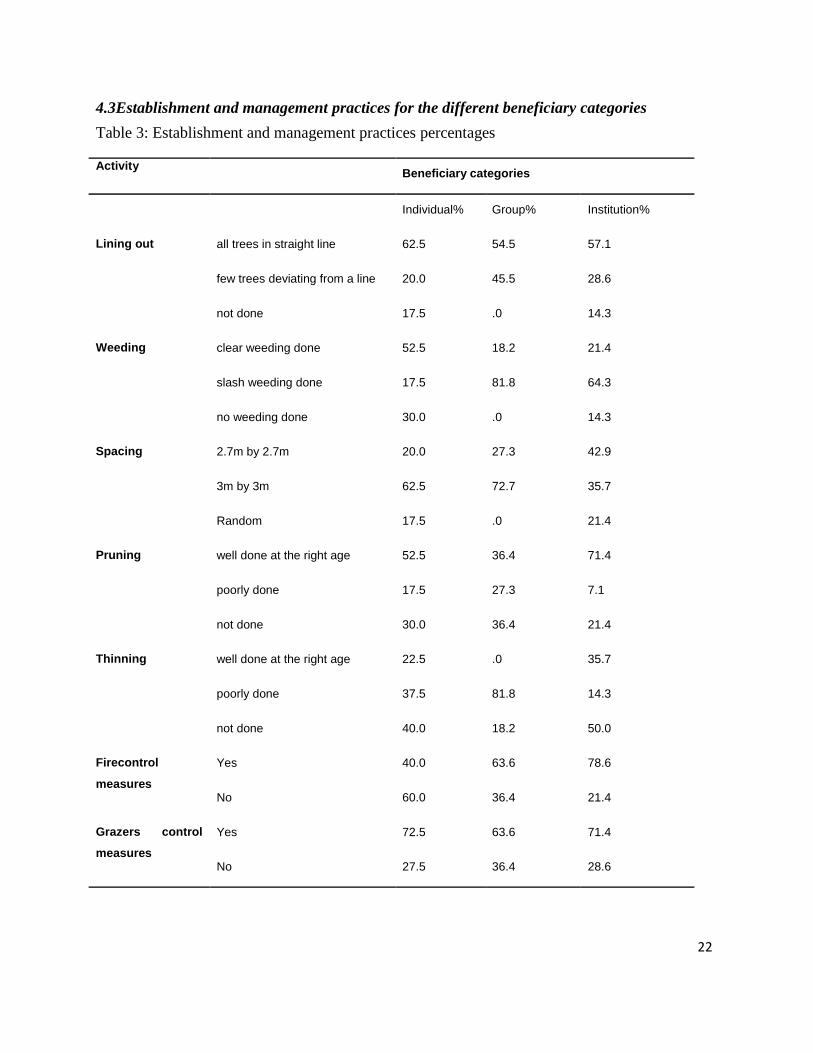
4.3Establishment and management practices for the different beneficiary categories
Table 3: Establishment and management practices percentages
Activity Beneficiary categories
Individual% Group% Institution%
Lining out all trees in straight line 62.5 54.5 57.1
few trees deviating from a line 20.0 45.5 28.6
not done 17.5 .0 14.3
Weeding clear weeding done 52.5 18.2 21.4
slash weeding done 17.5 81.8 64.3
no weeding done 30.0 .0 14.3
Spacing 2.7m by 2.7m 20.0 27.3 42.9
3m by 3m 62.5 72.7 35.7
Random 17.5 .0 21.4
Pruning well done at the right age 52.5 36.4 71.4
poorly done 17.5 27.3 7.1
not done 30.0 36.4 21.4
Thinning well done at the right age 22.5 .0 35.7
poorly done 37.5 81.8 14.3
not done 40.0 18.2 50.0
Firecontrol
measures
Yes 40.0 63.6 78.6
No 60.0 36.4 21.4
Grazers control
measures
Yes 72.5 63.6 71.4
No 27.5 36.4 28.6
23
Lining out was well done in majority of the plantations among all the three beneficiary
categories with all trees in a straight line, individual farmers had the highest percentage,
followed by group farmers and institutions this was due to the technical assistance, trainings and
advice that were offered by the DFO and the project staff (SFTO) in the establishment of the
tree plantations. Individual farmers had the highest percentages of properly lined out plantations
which was attributed to the sense of belonging and individual ownership that encourages hard
work among individual farmers unlike groups where the members are demotivated by the
communal or public ownership and institutional leaders who are not certain of where they will
be by the time the trees are ready for harvesting.
Clear weeding was done mainly in individual farms due to taungya system with 52.5%,
according to (James,et al.,2013), the costs of plantation establishment and management can be
offset by agricultural production, slash weeding was the most used among the group and
institutional farmers with 81.8% and 64.3% respectively this was attributed to availability of
labor provided by the group members and students respectively , and the highest percentage of
un weeded percentages was seen in the individual percentages with 30% of the plantations un
weeded, Individual farmers had the highest percentages of un weeded plantations due to lack of
enough man power since family labor was not enough and thus they required to hire labor for
weeding which was also limited by insufficient monetary funds.
Different spacing intervals for the same tree species i.e. pinus caribea var hondurensis which
was taken for the study was used,3m by 3m spacing was the most used among the individual
and group farmers, and 2.7m by 2.7m was the most used among the institution farmers;
institutions had the highest percentage of randomly planted plantations under the same tree
species for all the categories i.e. pinus caribea var hondurensis, the choice of spacing depended
mostly on the advice of the DFO and SFTO based on the varying site conditions and
suitability.
Institutions had the highest percentages of well pruned plantations this could be attributed to the
levels of education attained by the beneficiary category members, all institutional leaders had
attained tertiary education and thus had some knowledge on pruning as well as quick uptake of
24
the skills from the trainings done by the DFO and project staff, this was followed by individual
farmers who did not do pruning majorly due to lack of sufficient man power to do pruning and
lastly group farmers who were used to self pruning species like eucalyptus were hesitant to do
pruning some plantations had poorly done pruning using poor tools (pangas) and thus
damaging the plantations, the plantations were also over pruned, this was more done among the
group farmers, followed by individual and institutional farmers.36.4% of the group farmers had
not done any pruning, individual 30% and institutions21.4% respectively.
The entire three beneficiary categories had poorly done thinning with the highest numbers being
group members with 81.8%, individuals with 37.5% and 14.3% for institutional farmers,
thinning was randomly done leaving out the forked and fox tailed trees. Thinning was well done
in institutional farmers than group and individual farmers, the right trees were left and crooked,
forked, double shoots and fox tail trees were removed,50% of the institutional farms were
overdue for first pruning and thinning as well as 40 %and 18.2% of the individual and group
farmers respectively.
The fire control measures employed were mainly using live fences, fire lines, early weeding and
trenches, this was mostly done by the institutions, groups and individuals had the least. Control
measures for grazers which include cows, goats and sheep practiced include fencing; talking to
neighbors these were done by all the beneficiary categories with the highest percentages being
among individuals, institutions and lastly farmer groups.
25
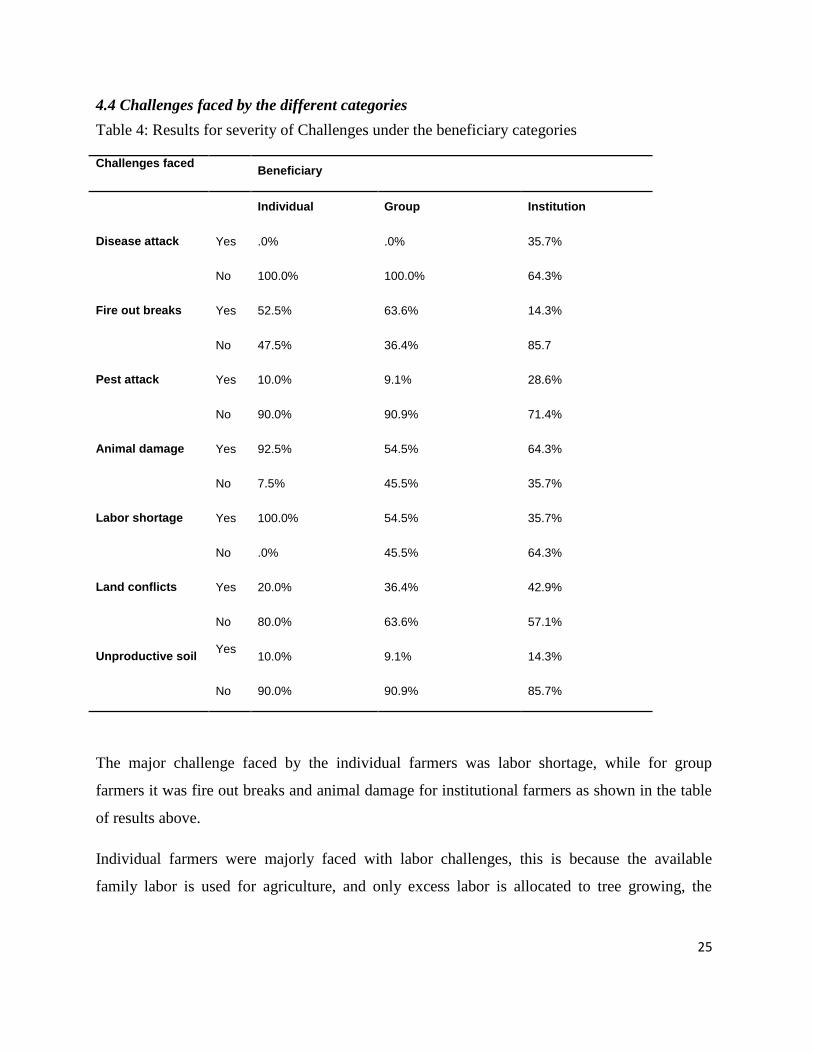
4.4 Challenges faced by the different categories
Table 4: Results for severity of Challenges under the beneficiary categories
Challenges faced Beneficiary
Individual Group Institution
Disease attack Yes .0% .0% 35.7%
No 100.0% 100.0% 64.3%
Fire out breaks Yes 52.5% 63.6% 14.3%
No 47.5% 36.4% 85.7
Pest attack Yes 10.0% 9.1% 28.6%
No 90.0% 90.9% 71.4%
Animal damage Yes 92.5% 54.5% 64.3%
No 7.5% 45.5% 35.7%
Labor shortage Yes 100.0% 54.5% 35.7%
No .0% 45.5% 64.3%
Land conflicts Yes 20.0% 36.4% 42.9%
No 80.0% 63.6% 57.1%
Unproductive soil Yes
10.0% 9.1% 14.3%
No 90.0% 90.9% 85.7%
The major challenge faced by the individual farmers was labor shortage, while for group
farmers it was fire out breaks and animal damage for institutional farmers as shown in the table
of results above.
Individual farmers were majorly faced with labor challenges, this is because the available
family labor is used for agriculture, and only excess labor is allocated to tree growing, the
26
easiest option of obtaining labor is by hiring which requires finances that are not readily
available .
Animal damage among the institutional plantations was common due to the nature of ownership
of the plantations that lacked a serious eye for overseeing and inspection, this made the
neighbors who are majorly farmers not to take enough care to control their animals from
sneaking to the institutions plantations and thus damage to the plantations.
Among the group farmers, fire out breaks were common because of the conflicts of interests of
the people, formally the land under tree planting by the groups was used for grazing animals
and growing crops by the community members and hence these community members lost
access to land after it was changed to tree planting, this became a cause for the fires in the group
tree plantations.
27
CHAPTER FIVE: CONCLUSION AND RECOMMENDATIONS
Chapter five brings out the conclusions and the recommendations drawn from the findings and
results of the study as listed below;
5.1 Conclusions
The following conclusions are drawn from this study,
1. Of the three beneficiary categories, the individual farms performed better than the
institutions and farmer groups as far as DBH and height growth is concerned
2. The establishment and management practices which were assessed in terms of lining
out, spacing, weeding, pruning, and thinning and plantation protection measures showed
that all the three beneficiary categories had basics of what was required in plantation
establishment, this may be due to the trainings and technical support that was offered by
the DFO and the SFTO.
3. Institutions demonstrated the best establishment and maintenance practices followed by
individual farmers and lastly group farmers.
4. All the three beneficiary categories shared the similar challenges but with different
percentages of severity, the challenges included animal damage, fire out breaks, pests,
insufficient labor, land conflicts and un productive soils, fire outbreak was the most
common among the group farmers, labor shortage among the individual farmers and
animal damage among the institutional farmers.
28
5.2 Recommendations
Several recommendations for this study are here by presented below,
1. More sensitization should done on tree planting to involve women as well as people of
all levels of education so as to include the illiterates in tree planting, majority of the
illiterates are un aware of the potential benefits of tree planting yet they have big pieces
of unproductive land.
2. Follow up should be done regularly to check on the seedlings which were distributed as
well as offering more advice and technical assistance as the trees grow because majority
of the farmers were using pangas for pruning.
3. Farmers groups should be formed with the guidance of the DFO, formal rules and
guidelines should be set to guide the group members in achieving the desired goals and
objectives of tree planting.
4. Individual farmers should be encouraged to establish plantations in terms of size and
coverage relative to the amount of labor they can provide, early weeding before the dry
season should also be encouraged among the group farmers in order to reduce on risks
of fire outbreaks during the dry season as well as encouraging institutions to fence their
plantations as a measure to protect trees from grazers.
29
REFERENCES
Ajai kumar & s. K. Puri.(2004). People’s participation in joint forest management: empowerment of
communities or Protection of forests? Forests, trees and livelihoods, 14:2-4, 189-198.
Banana, A.Y.(1999). The status of Forestry in Uganda: A country Report. In: Proceedings of the firest
Meeting of the Eastern and North-Eastern Node/ The African Forestry Research Network
(AFRONET) held At KEFRI HQs, Kenya, 24th–26thMay, 1999.
Barrow, c. (1995). land degradation. Development and breakdown of terrestrial enviroments. pg 2.
Beverly E. Law, Tara W. Hudiburg & Sebastian Luyssaert .(2013). Thinning effects on forest
Productivity: consequences of preserving old forests and mitigating impacts of fire and drought,
Plant Ecology & Diversity, 6:1, 73-85.
Cosyns H, Degrande A, De Wulf R, Van Damme P, Tchoundjeu Z. (2011).Can commercialization of
NTFPs alleviate poverty? A case study of Ricinodendron heudelotii kernel marketing in
Cameroon. J Agric Rural Dev Tropics Subtropics. 112(1):45–56.
Dobbertin, M. (2005): Tree growth as indicator of tree vitality and of tree reaction to environmental
stress: a review. European Journal of Forest Research24: 319-333.
Ekisa, G.T. (2009). Community participation in a forestation and agro forestry programmes in Kenya:
the influence of biophysical environment in the case of Teso district.
Evans, J.(2004).plantation Forestry University in the tropics. Oxford University press, oxford. Pg 331.
Evans. (1996). Plantation forestry in the tropics. Tree planting for industrial, social, environmental and
agro forestry purposes. 2nd
Edition Clarendon press. Oxford.
FAO. (1995). Forest Resources Assessment 1990 - Tropical forest plantation resources, FAO Forestry
Paper 128, FAO Rome, 81 pp.
FAO. (2007).preparing and using project profiles. A participatory approach to identifying and
preparing small scale rural investments. Module 2.Rome, Italy.
FAO .(2010). Support for the rehabilitation, Development and sustainability management of Forest
Resources in Northern Uganda.
FAO. (2005). State of the world’s forests. Rome.
FRA, (2000). Global Forest Resources Assessment Main report.
Garrity,DP.(2004). Agro forestry and achievement of the millennium development goals. Agro for
Syst. 61(1):5–17.
Hamilton, A.C. (1984). Deforestation in Uganda. Oxford University Press, East & Central Africa.
30
Hammersley-Chambers, F. and Beckley, T.(2003).Public involvement in sustainable boreal forest
management. In: Burton, P.J., Messier. Smith, D.W. and Adamowicz, W.L. (eds) Towards
Sustainable Management of the Boreal Forest. NRC Research Press, Ottawa, pp. 113-154.
Inkyin Khaine & Su Young Woo.(2014). Study on the extent of support of current forest management
to local people by comparing natural forests and plantation forests in Myanmar, Forest Science
and Technology, 10:3,172-177, DOI: 10.1080/21580103.2014.894946.
Jacki Schirmer, Peter Kanowski and Digby Race. (1999). Factors affecting adoption of plantation
forestry on farms: implications of farm forestry development in Australia.
James,M.,Roshetko,D. R.et al.(2013). Teak agroforestry systems for livelihood enhancement, industrial
timber production and enviromental rehabilitation. Forests,Trees and Livelihoods,22:4 , 241-
256.
Kerr G. (1999). The use of silvicultural systems to enhance the biological diversity of plantation forests
in Britain. Forestry 72:191–205.
Kimmins H. (1997). Balancing act: environmental issues in forestry. 2nd ed. Vancouver: University of
British Columbia Press.
Kugonza A.; Buyinza M.; & Byakagaba P. (2009).linking local community livelihoods and forest
conservation in Masindi District, North Western Uganda. Research journal of applied sciences
4, (1), pg.10-16.
Lawal.A & V.A. J. Adekunle.(2013).A silvicultural approach to volume yield, biodiversity and soil
fertility restoration of degraded natural forest in South-West Nigeria, International Journal of
Biodiversity Science, Ecosystem Services & Management, 9:3, 201-214, DOI:
10.1080/21513732.2013.823464.
Limin Dai, Wei Zhao, Guofan Shao, Bernard J. Lewis, Dapao Yu, Li Zhou & Wangming Zhou.(2013)
.The progress and challenges in sustainable forestry development in China, International Journal
of Sustainable Development &World Ecology, 20:5, 394-403, DOI:
10.1080/13504509.2013.775193.
Masahiko Ota, Sheetal Antil, Prodyut Bhattacharya & Misa Masuda.(2014). Presence and effectiveness
of material benefit provisions under Joint Forest Management in India: the cases of World
Bank-aided Village Forest Committees in Madhya Pradesh, Forests, Trees and Livelihoods,
23:3, 159-174.
Mathew, J.E. and Newton, A.C. (1997). The Silviculture of Mahogany (Swietenia macrophylla) (draft).
Melanie Lain Dare, Frank Vanclay & Jacki Schirmer.(2012).Public participation in commercial
Environments: critical reflections on community engagement methods used in the Australian
plantation forestry Industry, Australian Forestry, 75:3, pg 180-191.
31
Ministry of Water, Lands and Environment. (2001). Forest Sector Review Report. Unpublished report,
Government of Uganda, 158 pp.
Ministry of water and Environment. (2011). Uganda water and environment sector performance report.
Muwanga, J.F.S. (2011).value for money audit report on the management of the farm income
enhancement and forest conservation project implemented by ministry of water and
environment and the ministry of Agriculture, Animal Industry and Fisheries. Office of the
Auditor General (OAG), P.O.Box 7083, Kampala city, The Republic of Uganda.
NARO.(2005). Sustain our forests, trees and people’s livelihoods.NARO, Entebbe.
Nath V and Shadangi D K.(2006). Litter decomposition in eucalyptus and pine plantation and natural
forests related to micro-arthropod in different season in Amarkantak (M.P.). The Indian
Forester, 132: 420 - 428. Nath V, Pal Rajat S and Banerjee S K 2008. Bamboo - its distribution,
production, habitat and agro forestry potentiality. The Indian Forester (Special issue, March,
2008), 134: 387-396
Neil Byron. (2001). keys to smallholder Forestry, forests, trees and livelihoods, 11:4, 279-294.
Nur muhammed, farhana haque & Masao koike. (2009) .The role of participatory social forestry in the
enhancement of the Socio-economic condition of the rural poor: a case study of Dhaka.
Obua.J, Agea.G.J and Ogwal.J,.(2001). Status of forests in uganda.African journal of ecology pg 1-7,
Blackwell publishing ltd.
Peterken, G.F. (1993).‘Woodland Conservation and Management’ (2nd Edn.). Chapman and Hall,
London
Race-D, S.-J. K.-P. (2000). factors afffecting adoption of plantation forestry on farms . pg 44-51.
Rukungiri Census Report.(2007). Rukungiri district 2002 population and housing census Analytical
Report, February 2007.
Schirmer, J.and Kanowski, P.(2001). Avoiding snatching defeat from the jaws victory: plantation
forestry in Australia. In: proceedings 16th
common wealth forestry conference and 19th
IFA
Biennial conference, 18-25 April 2001,Fremantle.Promaco Conventions, Canning
Bridge,WA,PP.99-108.
SPGS. (2009).tree planting guidelines for Uganda.
SPGS. (2011).community Tree planting guideline. Plantation establishment and management.
SPGS. (2011)Tree planting guidelines vol.3 October 2011.
32
APPENDICES
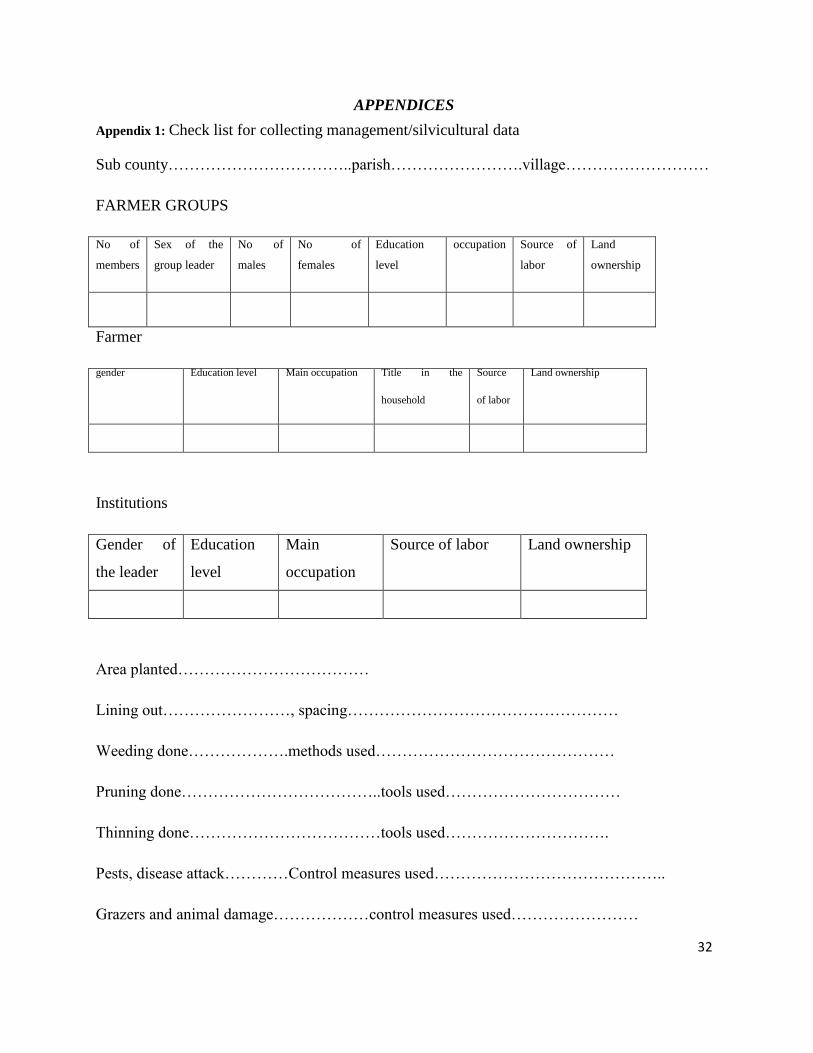
Appendix 1: Check list for collecting management/silvicultural data
Sub county……………………………..parish…………………….village………………………
FARMER GROUPS
No of
members
Sex of the
group leader
No of
males
No of
females
Education
level
occupation Source of
labor
Land
ownership
Farmer
gender Education level Main occupation Title in the
household
Source
of labor
Land ownership
Institutions
Gender of
the leader
Education
level
Main
occupation
Source of labor Land ownership
Area planted………………………………
Lining out……………………, spacing……………………………………………
Weeding done……………….methods used………………………………………
Pruning done………………………………..tools used……………………………
Thinning done………………………………tools used………………………….
Pests, disease attack…………Control measures used……………………………………..
Grazers and animal damage………………control measures used……………………

33
Fire out breaks…………If any, causes and control measures……………………………….
Lining out levels weeding levels pest and disease
1. All trees in straight line 1. Clear weeding done 1. Present
2. Few trees deviating from aline 2. Slash weeding done 2.abscent
3. Random planting 3.no weeding done
Pruning thinning fire control measures
1. Well done at the right age 1. Well done at the right 1.present
2. Poorly done 2. Poorly done 2.abscent
3. Not done 3. Not done
Animal damage control measures
1. Present
2. Absent
Do you face any of the following challenges?
Disease attack YES NO
Pest attack YES NO
Fire out breaks YES NO
Grazers and animal damage YES NO
Labor shortage YES NO
Land ownership insecurity and conflicts YES NO
Un productive soils YES NO
34
Appendix 2: Sample analysis for tree growth performance parameters
Descriptive statistics
Dependent Variable: HEIGHT
CATEG
ORY Mean Std. Deviation N
1 11.39 1.435 16
2 10.19 2.939 8
3 11.11 1.873 7
Total 11.02 2.002 31
Tests of Between-Subjects Effects
Dependent Variable: HEIGHT
Source
Type III Sum of
Squares Df Mean Square F Sig.
Corrected Model 7.842a 2 3.921 .977 .389
Intercept 3235.886 1 3235.886 806.045 .000
CATEGORY 7.842 2 3.921 .977 .389
Error 112.407 28 4.015
Total 3884.460 31
Corrected Total 120.248 30
a. R Squared = .065 (Adjusted R Squared = -.002)
35
Estimated Marginal Means
CATEGORY
Dependent Variable: HEIGHT
CATEG
ORY Mean Std. Error
95% Confidence Interval
Lower Bound Upper Bound
1 11.394 .501 10.368 12.420
2 10.188 .708 8.736 11.639
3 11.114 .757 9.563 12.666
Multiple Comparisons for height
HEIGHT
(I)
CATEG
ORY
(J)
CATEG
ORY
Mean Difference
(I-J) Std. Error Sig.
95% Confidence Interval
Lower Bound Upper Bound
1 2 1.21 .868 .359 -.94 3.35
3 .28 .908 .949 -1.97 2.53
2 1 -1.21 .868 .359 -3.35 .94
3 -.93 1.037 .649 -3.49 1.64
3 1 -.28 .908 .949 -2.53 1.97
2 .93 1.037 .649 -1.64 3.49
36
Descriptive statistics for dbh
Dependent Variable: DBH
CATEG
ORY Mean Std. Deviation N
1 18.19 1.471 16
2 16.00 3.703 8
3 18.00 5.132 7
Total 17.58 3.233 31
Tests of Between-Subjects Effects for dbh
Source
Type III Sum of
Squares Df Mean Square F Sig.
Corrected Model 27.111a 2 13.555 1.325 .282
Intercept 8244.215 1 8244.215 805.893 .000
CATEGORY 27.111 2 13.555 1.325 .282
Error 286.438 28 10.230
Total 9895.000 31
Corrected Total 313.548 30
a. R Squared = .086 (Adjusted R Squared = .021)
37
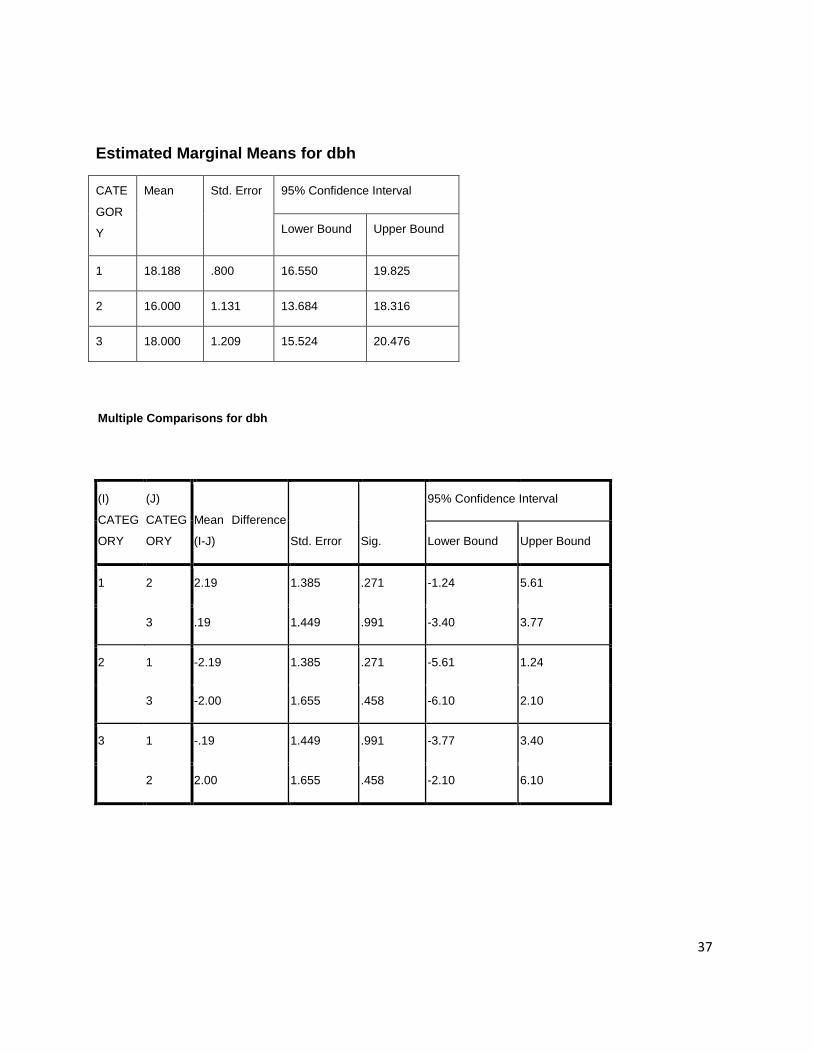
Estimated Marginal Means for dbh
CATE
GOR
Y
Mean Std. Error 95% Confidence Interval
Lower Bound Upper Bound
1 18.188 .800 16.550 19.825
2 16.000 1.131 13.684 18.316
3 18.000 1.209 15.524 20.476
Multiple Comparisons for dbh
(I)
CATEG
ORY
(J)
CATEG
ORY
Mean Difference
(I-J) Std. Error Sig.
95% Confidence Interval
Lower Bound Upper Bound
1 2 2.19 1.385 .271 -1.24 5.61
3 .19 1.449 .991 -3.40 3.77
2 1 -2.19 1.385 .271 -5.61 1.24
3 -2.00 1.655 .458 -6.10 2.10
3 1 -.19 1.449 .991 -3.77 3.40
2 2.00 1.655 .458 -2.10 6.10