Performance Improvement of a Forced Draught Cooling Tower ...
13
CFD Letters 13, Issue 1 (2021) 45-57 45 CFD Letters Journal homepage: www.akademiabaru.com/cfdl.html ISSN: 2180-1363 Performance Improvement of a Forced Draught Cooling Tower Using a Vortex Generator Dan Mugisidi 1,* , Oktarina Heriyani 2 , Pancatatva Hesti Gunawan 1 , Dwi Apriani 1 1 Department of Mechanical Engineering, Universitas Muhammadiyah Prof. Dr HAMKA, Jakarta, Indonesia 2 Department of Electrical Engineering, Universitas Muhammadiyah Prof. Dr HAMKA, Jakarta, Indonesia ARTICLE INFO ABSTRACT Article history: Received 22 November 2020 Received in revised form 16 January 2021 Accepted 23 January 2021 Available online 30 January 2021 Cooling systems using colling towers are often an important element in a production process and always involve water or energy consumption. Therefore, increasing the efficiency of the colling tower will reduce water and / or energy consumption. In order to increase the efficiency of colling tower energy consumption, the most studied part is the fills, where heat transfer occurs. However, there are no studies on the use of vortex generators in colling tower fills. Hence the aim of this study was to evaluate the performance improvement in a forced draught cooling tower using a vortex generator. It was conducted on a laboratory scale using single fill as a trial medium. The fill was made of 3-mm acrylic with dimensions of 30 × 30 × 1950 mm. A three-unit vortex generator was placed inside the fill. The rectangular vortex generator was made of 0.5- mm thick aluminium and had a size of 50 × 10 mm. Data were retrieved for the fills with and without a vortex generator. Water and air discharge of 1 L/minute and an inlet water temperature of 60°C were maintained. The results indicated that the effectiveness of the fill with a vortex generator was increased by 90.72% compared to the fill without a vortex generator. Keywords: Cooling tower; Forced draft; Vortex generator; CFD Simulation 1. Introduction Cooling systems play an important role in maintaining the temperature of production machinery so that it can work optimally. Optimization of a cooling system can reduce water and energy consumption [1]. An example of a cooling system is a cooling tower, which is a heat exchanger for reducing water temperature using air flow. One type of cooling tower is the forced draught cooling tower. Forced draught cooling towers are used in various industries because of their high air resistance, relatively quiet fans and lower power consumption, even though their cooling efficiency is lower than that of induced draught cooling towers [2,3]. * Corresponding author. E-mail address: [email protected] (Dan Mugisidi) https://doi.org/10.37934/cfdl.13.1.4557
-
Upload
khangminh22 -
Category
Documents
-
view
0 -
download
0
Transcript of Performance Improvement of a Forced Draught Cooling Tower ...

CFD Letters 13, Issue 1 (2021) 45-57
45
CFD Letters
Journal homepage: www.akademiabaru.com/cfdl.html
ISSN: 2180-1363
Performance Improvement of a Forced Draught Cooling Tower Using a Vortex Generator
Dan Mugisidi1,*, Oktarina Heriyani2, Pancatatva Hesti Gunawan1, Dwi Apriani1
1 Department of Mechanical Engineering, Universitas Muhammadiyah Prof. Dr HAMKA, Jakarta, Indonesia 2 Department of Electrical Engineering, Universitas Muhammadiyah Prof. Dr HAMKA, Jakarta, Indonesia
ARTICLE INFO ABSTRACT
Article history: Received 22 November 2020 Received in revised form 16 January 2021 Accepted 23 January 2021 Available online 30 January 2021
Cooling systems using colling towers are often an important element in a production process and always involve water or energy consumption. Therefore, increasing the efficiency of the colling tower will reduce water and / or energy consumption. In order to increase the efficiency of colling tower energy consumption, the most studied part is the fills, where heat transfer occurs. However, there are no studies on the use of vortex generators in colling tower fills. Hence the aim of this study was to evaluate the performance improvement in a forced draught cooling tower using a vortex generator. It was conducted on a laboratory scale using single fill as a trial medium. The fill was made of 3-mm acrylic with dimensions of 30 × 30 × 1950 mm. A three-unit vortex generator was placed inside the fill. The rectangular vortex generator was made of 0.5-mm thick aluminium and had a size of 50 × 10 mm. Data were retrieved for the fills with and without a vortex generator. Water and air discharge of 1 L/minute and an inlet water temperature of 60°C were maintained. The results indicated that the effectiveness of the fill with a vortex generator was increased by 90.72% compared to the fill without a vortex generator.
Keywords: Cooling tower; Forced draft; Vortex generator; CFD Simulation
1. Introduction
Cooling systems play an important role in maintaining the temperature of production machinery so that it can work optimally. Optimization of a cooling system can reduce water and energy consumption [1]. An example of a cooling system is a cooling tower, which is a heat exchanger for reducing water temperature using air flow. One type of cooling tower is the forced draught cooling tower.
Forced draught cooling towers are used in various industries because of their high air resistance, relatively quiet fans and lower power consumption, even though their cooling efficiency is lower than that of induced draught cooling towers [2,3].
* Corresponding author. E-mail address: [email protected] (Dan Mugisidi) https://doi.org/10.37934/cfdl.13.1.4557

CFD Letters
Volume 13, Issue 1 (2021) 45-57
46
Several studies have been conducted to improve the efficiency of cooling towers. Improvement of evaporation can reduce the wet ball by 85–95%, while the filler surface affects the decrease in the ratio of water mass flux to air [4,5]. Interesting results have been obtained using a fill made alternative material such as pebbles, PET strip, and coconut husk and energy loses also reduced using alternative fill [6,7]. Gao et al., [8] demonstrated that wind speed affects efficiency and temperature decrease. Ramakrishnan and Arumugam [9] examined the optimization of operating parameters and conducted a performance evaluation of forced draught cooling towers using the response surface methodology (RSM) and artificial neural network (ANN) methods. The results indicated that a lower water temperature was obtained with the ANN model than with RSM. Johanes [10] used water and air fluid distribution and found that a lower water/air mass flow rate ratio caused a decrease in efficiency. Murugaveni and Shameer [11] investigated the performance of a forced draught cooling tower using Ansys Fluent Software, varying the parameters of the air inlet with different air inlet angles and installing nozzles in the air inlet to increase the effectiveness of the cooling tower model. Wang et al., [12] reported a decrease in cooling performance in the presence of a crosswind. A study that aimed to improve the performance of cooling towers with air vortex distribution of the crosswind found that the distribution of air within a vortex, when the wind blew on the cooling tower, caused a disruption of heat transfer and mass, thereby reducing performance [13]. Although various methods and materials have been used to improve cooling tower performance, no studies have explored vortex generators inside the fill in a cooling tower to increase heat transfer and the tower’s efficiency. In fact, heat transfer can be increased by adding a vortex generator [14], which causes flow instability (turbulence) and the development of boundary layers and vortices [15]. The vortices themselves are affected by an increase in the Re number and the height of the vortex generator [16,17]. An inline winglet vortex arrangement results in the greatest heat transfer and fluid mixing with increases in heat transfer by 36.23%, in the friction factor by 36.29% and in thermal performance by 28.5% [18]. This study aimed to use a vortex generator to increase the efficiency of a forced draught cooling tower. 2. Methodology
This study used a fill in a cooling tower. Convection heat transfer from water to cooling air occurs in every single fill separately. The fill is located in a vertical canal that is passed through by hot water from the water intake to the water tank. At the same time, cold air is taken in by the fan so that it flows from the air intake to the fan through the fill, as shown in the cooling tower scheme in Figure 1, and hot water meets the cooling air flowing in the opposite direction inside the fill. Then, to study the effect of vortex generators on cooling tower performance, this study only uses one fill as a model.
The experimental rig was based on Ramakrishnan and Arumugam’s [9] test model, with a cross-sectional area of 90,000 mm2. The size of each fill was 30 × 30 mm with a height of 1,950 mm. Since this study aimed to evaluate the effect of installing a vortex generator in a fill, we compared only a single fill with a vortex generator (VG) and a fill without a vortex generator (NVG). The fill was covered with an insulator so that it was not affected by ambient temperature. The amount of water and air entering the fill was 1 L/minute [9]. Water from the basin was pumped to the storage. The water contained in the storage was heated using a heater to maintain a temperature of 60°C and then flowed into the fill through a sprinkler to break the water into small beads. Excess water in the storage was channelled back to the water tank. At the same time, air from the compressor was channelled through pipes to the bottom of the fill. The water and air discharge were regulated using a manually operated valve. The thermocouple for the inlet water was positioned below the sprinkler, while the thermocouple for the exit air was placed above the sprinkler. At the bottom of the fill, the

CFD Letters
Volume 13, Issue 1 (2021) 45-57
47
temperature of exiting water was measured below the inlet air duct, while the inlet air temperature gauge was placed above the duct, as illustrated in Figure 2.
Fig. 1. Schematic of the forced draught cooling tower [2]. 1: Fan, 2: Wall, 3: Fill, 4: Water tank, 5: Drift eliminator, 6: Water intake, 7: Air intake
Fig. 2. Schematic of the experimental rig
The height of VG affects the intensity of the vortices because if the VG is higher, the intensity of
the resulting vortex increases because the cross-sectional area of the flow decreases, causing an increase in flow velocity [19]. Based on the results of Han's [20] research, the best vortex generator height compared to the channel height or the VG height ratio is up to 0.47. This study using aluminium rectangular winglet vortex generator with a size of 50 × 10 × 0.5 mm with a height ratio 0.33, as shown in Figure 3. The distance between vortex generator inside the rectangular channel

CFD Letters
Volume 13, Issue 1 (2021) 45-57
48
can be determined by using the ratio of the distance of the vortex generator inside the channel to the length of the channel, also referred as to the longitudinal pitch ratio. The longitudinal pitch ratio of 0.18 produces the largest vortices, while the longitudinal pitch ratio above 0.24 to 0.36 is constant and can affect heat transfer in the channel because induced vortices that form previously can combine with subsequent VG vortices [20,21]. Therefore, in this study, taking into account the length of the fill, the longitudinal pitch ratio used is 0.19 which is obtained from the distance between vortex generator (D) of 375 mm to the channel length (L) of 1950 mm. Another parameter that greatly affects the vortex generator is the angle of attack. The angle of attack of VG is a very important parameter for increasing heat transfer because the intensity of vortices and fluid mixing depends on the angle of attack [22-24]. The angle of attack in this study refers to Lu and Zhai [25] who stated that the angle of attack 15° has the best hydraulic thermal performance.
The temperature data were collected using a Fluke 51 digital thermometer with a type K thermocouple with a 0.05% and 0.3°C accuracy. Data collection was performed every 15 minutes from 14:45 to 16:30 for was performed over six days, not sequentially, taking ambient temperature into consideration. VG and NVG data were retrieved for three days (VG1, VG2 and VG3, and NVG1, NVG2 and NVG3, respectively).
Fig. 3. Arrangement of the vortex generator inside the fill
2.1 Performance Parameters 2.1.1 Range
By determining the entry and exit properties of the air and water, range (𝑅𝐶𝑇), the simplest method of examining the performance of the cooling tower, where Twi is the temperature of the water entering the fill, and Two is the temperature of the water leaving the fill [26]. 𝑅𝐶𝑇 = 𝑇𝑤𝑖 − 𝑇𝑤𝑜 (1)

CFD Letters
Volume 13, Issue 1 (2021) 45-57
49
2.1.2 Approach Approach (ACT) is the difference between the air wet-bulb temperature and the water
temperature, where 𝑇𝑤𝑜 is the water temperature at exit, and 𝑇𝑤𝑏 is the wet-bulb temperature. 𝐴𝐶𝑇 = 𝑇𝑤𝑜 (℃) − 𝑇𝑤𝑏 (℃) (2) 2.1.3 Merkel Number
The Merkel number (Me) involves two phenomena in a cooling tower, sensible heat transfer and evaporative heat transfer, and is defined as follows [27,28]:
𝑀𝑒 = 𝛼𝑎𝐹𝑇
𝐶𝑝𝑎𝑀𝑎 (3)
𝑀𝑒 is calculated using the simple logarithmic mean enthalpy difference (LMED) method as
follows:
𝑀𝑒 =ℎ𝑎,𝑜−ℎ𝑎,𝑖
∆ℎ𝑚 (4)
∆ℎ𝑚 = (ℎ𝑎,𝑤𝑖−ℎ𝑎,𝑜)−(ℎ𝑎,𝑤𝑜−ℎ𝑎,𝑖)
lnℎ𝑎,𝑤𝑖−ℎ𝑎,𝑜
ℎ𝑎,𝑤𝑜−ℎ𝑎,𝑖
, (5)
where ∆ℎ𝑚 is the LMED.
2.1.4 Effectiveness
Effectiveness is estimated by comparing the range of work with its ideal range [29].
𝑒𝐶𝑇 = 𝑇𝑤𝑖−𝑇𝑤𝑜
𝑇𝑤𝑖−𝑇𝑤𝑏× 100% (6)
2.1.5 CFD Simulation
Computational fluid dynamics (CFD) modelling was performed before the study was conducted
to predict vortices on the vortex generator using Ansys Fluent 18.2 software. The computation settings and meshing of the CFD simulation are shown in Table 1 and Figure 4, respectively. The default parameters were used for other settings.
Table 1 Computation settings No. Setting Parameter
1 Gravity 9.81 2 Multiphase Eulerian 3 Turbulent RNG. K-epsilon 4 Energy On

CFD Letters
Volume 13, Issue 1 (2021) 45-57
50
Fig. 4. Meshing of the CFD simulation of a fill (a) without and (b) with a vortex generator
The computational domain in Figure 4(a) is divided into a set of hexahedral cells to achieve high,
convergent resolution. However, the division of the computational domain in Figure 4(b) uses tetrahedra cells because they cannot achieve high convergence and resolution. Furthermore, the number of mesh is determined using the grid independency test.
Grid independency test is used to varying the number of elements and further accuracy of simulation [30]. This test is carried out to obtain the minimum number of meshes that can provide consistent, repeatable, and low error results. Table 2. shows the grid independence test with the number of mesh elements from 300,000 to 1,000,000. The parameter used to see changes in the simulation results is the average velocity of water in the area after the first vortex generator. The results show that the number of meshes to the water velocity does not show a significant change with each deviation below 10%. Considering the results and calculation time, a mesh with an element size of 1.5 was chosen as the parameter used in the simulation.
Table 2 Grid Independency Test Element Size (mm)
Number of Element
Node number Water Velocity (m/s)
Deviation
2 327.821 262.307 -2,43162 - 1,8 439.020 352.376 -2,30936 -5,0279238 1,6 594.586 484.769 -2,19683 -4,8727786 1,55 638.473 517.565 -2,14458 -2,3784271 1,5 702.614 569.901 -2,12903 -0,7250837 1,4 849.013 688.432 -1,95753 -8,0553116 1,3 1.070.306 875.732 -1,81828 -7,1135564
3. Results 3.1 Experimental Result
This experiment was performed over six days, not sequentially, to take ambient temperature into account. The collected data were in an environment temperature range of 33.1–33.6°C.
Figure 5 shows a comparison of the ranges obtained on three days. The average temperature range for the fill with the VG was 6.08–6.1°C, while the NGV fill had an average range of 3.4–3.9°C. This indicates that the VG resulted in a greater temperature decrease than the NVG. Since the range can be understood as the transfer of energy from water to air, the higher value for the range indicates that the cooling tower lowered the temperature more effectively [31,32]. It can therefore be concluded that a VG in the fill can improve water temperature reduction. Moreover, the VG approach had lower values than the NVG, as can be seen in Figure 6.

CFD Letters
Volume 13, Issue 1 (2021) 45-57
51
Fig. 5. Temperature ranges without (NVG1 to NVG3) and with a vortex generator (VG1 to VG3) on day 1 to day 3
The performance of the VG fill was closer to ambient temperature. Therefore, the fill with a VG
is better than the one without. The lower the approach value, the better the performance of the cooling tower, as it represents its ability to lower the temperature of the water closer to the wet-bulb temperature of the surrounding air [5]. It can thus be concluded that a VG can reduce the approach value in the forced draught fill type of the cooling tower.
Fig. 6. Cooling tower approach without (NVG1 to NVG3) and with a vortex generator (VG1 to VG3) on day 1 to day 3

CFD Letters
Volume 13, Issue 1 (2021) 45-57
52
Accordingly, as shown in Table 3, the Merkel numbers for the fill with a VG were higher than the those for the fill without one. Disturbances in the flow cause splitting of the fluid into droplets so that the interface surface becomes wider and ultimately increases the transfer of evaporative heat [33].
Table 3 Merkel numbers Day NVG VG
1 1.7397 3.1149 2 1.6694 3.1981 3 1.9764 3.1341
Figure 7 shows that the cooling tower effectiveness (eCT) of the VG was 90% higher than that of
the NVG because the vortex generator broke the flow, resulting in greater heat transfer. To visualize the flow, CFD modelling was used (Figure 8).
Fig. 7. Cooling tower effectiveness (eCT) without (NVG1 to NVG3) and with a vortex generator (VG1 to VG3) on day 1 to day 3
3.2 CFD Simulation
The results obtained by using the CFD simulation are similar to the experimental results that the vortex generator has the effect of reducing the temperature of the water coming out of the channel. Figure 8 and Figure 9 shows a change in the mixing between water and air after passing through the VG. The mixing of these fluids delays the separation of the boundary layer that forms continuously

CFD Letters
Volume 13, Issue 1 (2021) 45-57
53
on the rectangular winglet vortex. The addition of a rectangular winglet–shaped VG controls the boundary layer by mixing high-momentum fluids from the outside into the boundary layer [34]. This is confirmed in Figure 10, which shows the shape of the flow in the area around the VG. A flow deflection formed a vortex in the VG.
Fig. 8. A CFD 3D model without vortex generator
Fig. 9. A CFD 3D model with vortex generators
CFD Letters
Volume 13, Issue 1 (2021) 45-57
54
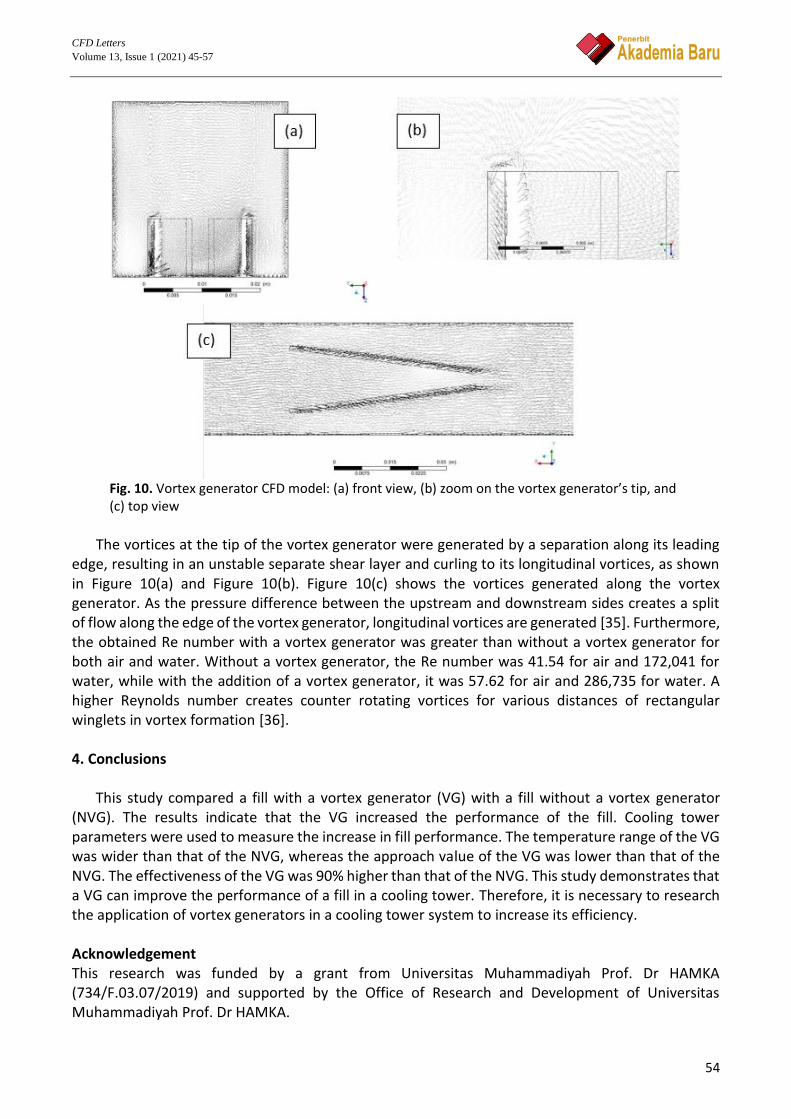
Fig. 10. Vortex generator CFD model: (a) front view, (b) zoom on the vortex generator’s tip, and (c) top view
The vortices at the tip of the vortex generator were generated by a separation along its leading
edge, resulting in an unstable separate shear layer and curling to its longitudinal vortices, as shown in Figure 10(a) and Figure 10(b). Figure 10(c) shows the vortices generated along the vortex generator. As the pressure difference between the upstream and downstream sides creates a split of flow along the edge of the vortex generator, longitudinal vortices are generated [35]. Furthermore, the obtained Re number with a vortex generator was greater than without a vortex generator for both air and water. Without a vortex generator, the Re number was 41.54 for air and 172,041 for water, while with the addition of a vortex generator, it was 57.62 for air and 286,735 for water. A higher Reynolds number creates counter rotating vortices for various distances of rectangular winglets in vortex formation [36].
4. Conclusions
This study compared a fill with a vortex generator (VG) with a fill without a vortex generator (NVG). The results indicate that the VG increased the performance of the fill. Cooling tower parameters were used to measure the increase in fill performance. The temperature range of the VG was wider than that of the NVG, whereas the approach value of the VG was lower than that of the NVG. The effectiveness of the VG was 90% higher than that of the NVG. This study demonstrates that a VG can improve the performance of a fill in a cooling tower. Therefore, it is necessary to research the application of vortex generators in a cooling tower system to increase its efficiency. Acknowledgement This research was funded by a grant from Universitas Muhammadiyah Prof. Dr HAMKA (734/F.03.07/2019) and supported by the Office of Research and Development of Universitas Muhammadiyah Prof. Dr HAMKA.

CFD Letters
Volume 13, Issue 1 (2021) 45-57
55
References [1] Goshayshi, H. R., J. F. Missenden, and R. Tozer. "Cooling tower-an energy conservation resource." Applied Thermal
Engineering 19, no. 11 (1999): 1223-1235. https://doi.org/10.1016/S1359-4311(98)00119-7
[2] Brin, A. A., and A. I. Petruchik. " Thermal Efficiency of Forced Draft Cooling Tower With Full Cone Nozzles." CYSENI 2011 (2011).
[3] Putra, Raden Suhardi. "Analisa perhitungan beban cooling tower pada fluida di mesin injeksi plastik." Jurnal Teknik Mesin Mercu Buana 4, no. 2 (2015): 56-62. https://doi.org/10.22441/jtm.v4i2.1010
[4] Pearlmutter, D., E. Erell, Y. Etzion, I. A. Meir, and H. Di. "Refining the use of evaporation in an experimental down-draft cool tower." Energy and Buildings 23, no. 3 (1996): 191-197. https://doi.org/10.1016/0378-7788(95)00944-2
[5] Mansour, M. Khamis, and M. A. Hassab. "Innovative correlation for calculating thermal performance of counterflow wet-cooling tower." Energy 74 (2014): 855-862. https://doi.org/10.1016/j.energy.2014.07.059
[6] Tomás, A. C. C., S. D. O. Araujo, Marcos D. Paes, Ana RM Primo, J. A. P. Da Costa, and A. A. V. Ochoa. "Experimental analysis of the performance of new alternative materials for cooling tower fill." Applied Thermal Engineering 144 (2018): 444-456. https://doi.org/10.1016/j.applthermaleng.2018.08.076
[7] Afanasenko, V. G., P. A. Kulakov, Yu L. Galimova, and D. I. Sidorkin. "Modeling of heat and mass transfer processes in cooling towers and structure optimizing of polymer filler." In IOP Conference Series: Materials Science and Engineering, vol. 709, no. 4, p. 044017. IOP Publishing, 2020. https://doi.org/10.1088/1757-899X/709/4/044017
[8] Gao, Ming, Feng-Zhong Sun, Kai Wang, Yue-tao Shi, and Yuan-bin Zhao. "Experimental research of heat transfer performance on natural draft counter flow wet cooling tower under cross-wind conditions." International Journal of Thermal Sciences 47, no. 7 (2008): 935-941. https://doi.org/10.1016/j.ijthermalsci.2007.07.010
[9] Ramakrishnan, Ramkumar, and Ragupathy Arumugam. "Optimization of operating parameters and performance evaluation of forced draft cooling tower using response surface methodology (RSM) and artificial neural network (ANN)." Journal of Mechanical Science and Technology 26, no. 5 (2012): 1643-1650. https://doi.org/10.1007/s12206-012-0323-9
[10] Johanes, Susanto. "Komparasi karakteristik menara pendingin menggunakan beberapa tipe susunan pipa-pipa sebagai pendistribusi cairan." In Forum Teknik, vol. 34, no. 1. (2011): 67-75.
[11] Murugaveni, S. Parimala, and P. Mohamed Shameer. "Analysis of forced draft cooling tower performance using Ansys Fluent software." International Journal of Research in Engineering and Technology 4, no. 4 (2015): 217-229. https://doi.org/10.15623/ijret.2015.0404039
[12] Wang, Weiliang, Hai Zhang, Pei Liu, Zheng Li, Junfu Lv, and Weidou Ni. "The cooling performance of a natural draft dry cooling tower under crosswind and an enclosure approach to cooling efficiency enhancement." Applied Energy 186 (2017): 336-346. https://doi.org/10.1016/j.apenergy.2016.02.007
[13] Gao, Ming, Feng-zhong Sun, Ni-ni Wang, and Yuan-bin Zhao. "Experimental research on circumferential inflow air and vortex distribution for wet cooling tower under crosswind conditions." Applied Thermal Engineering 64, no. 1-2 (2014): 93-100. https://doi.org/10.1016/j.applthermaleng.2013.12.023
[14] Yang, Jae Sung, Myunggeun Jeong, Yong Gap Park, and Man Yeong Ha. "Numerical study on the flow and heat transfer characteristics in a dimple cooling channel with a wedge-shaped vortex generator." International Journal of Heat and Mass Transfer 136 (2019): 1064-1078. https://doi.org/10.1016/j.ijheatmasstransfer.2019.03.072
[15] Fiebig, M. "Vortices, generators and heat transfer." Chemical Engineering Research and Design 76, no. 2 (1998): 108-123. https://doi.org/10.1205/026387698524686
[16] Deb, P., G. Biswas, and N. K. Mitra. "Heat transfer and flow structure in laminar and turbulent flows in a rectangular channel with longitudinal vortices." International Journal of Heat and Mass Transfer 38, no. 13 (1995): 2427-2444. https://doi.org/10.1016/0017-9310(94)00357-2
[17] Zaman, K. B. M. Q., D. L. Rigby, and J. D. Heidmann. "Inclined jet in crossflow interacting with a vortex generator." Journal of Propulsion and Power 26, no. 5 (2010): 947-954.

CFD Letters
Volume 13, Issue 1 (2021) 45-57
56
https://doi.org/10.2514/1.49742 [18] Henze, M., and J. Von Wolfersdorf. "Influence of approach flow conditions on heat transfer behind vortex
generators." International Journal of Heat and Mass Transfer 54, no. 1-3 (2011): 279-287. https://doi.org/10.1016/j.ijheatmasstransfer.2010.09.045
[19] Md Salleh, Mohd Fahmi, Ahmadali Gholami, and Mazlan A. Wahid. "Numerical evaluation of thermal hydraulic performance in fin-and-tube heat exchangers with various vortex generator geometries arranged in common-flow-down or common-flow-up." Journal of Heat Transfer 141, no. 2 (2019). https://doi.org/10.1115/1.4041832
[20] Han, Zhimin, Zhiming Xu, and Hongwei Qu. "Parametric study of the particulate fouling characteristics of vortex generators in a heat exchanger." Applied Thermal Engineering 167 (2020): 114735. https://doi.org/10.1016/j.applthermaleng.2019.114735
[21] Dietz, C. F., M. Henze, S. O. Neumann, and Jens von Wolfersdorf. "The effects of vortex structures on heat transfer and flow field behind arrays of vortex generators." Journal of Enhanced Heat Transfer 16, no. 2 (2009). https://doi.org/10.1615/JEnhHeatTransf.v16.i2.60
[22] Min, Chunhua, Chengying Qi, Enyu Wang, Liting Tian, and Yaju Qin. "Numerical investigation of turbulent flow and heat transfer in a channel with novel longitudinal vortex generators." International Journal of Heat and Mass Transfer 55, no. 23-24 (2012): 7268-7277. https://doi.org/10.1016/j.ijheatmasstransfer.2012.07.055
[23] Sun, Zhiqiang, Kang Zhang, Wenhao Li, Qiang Chen, and Nianben Zheng. "Investigations of the turbulent thermal-hydraulic performance in circular heat exchanger tubes with multiple rectangular winglet vortex generators." Applied Thermal Engineering 168 (2020): 114838. https://doi.org/10.1016/j.applthermaleng.2019.114838
[24] Biswas, Gautam, Himadri Chattopadhyay, and Anupam Sinha. "Augmentation of heat transfer by creation of streamwise longitudinal vortices using vortex generators." Heat Transfer Engineering 33, no. 4-5 (2012): 406-424. https://doi.org/10.1080/01457632.2012.614150
[25] Lu, Gaofeng, and Xiaoqiang Zhai. "Effects of curved vortex generators on the air-side performance of fin-and-tube heat exchangers." International Journal of Thermal Sciences 136 (2019): 509-518. https://doi.org/10.1016/j.ijthermalsci.2018.11.009
[26] Najjar, Yousef SH. "Forced draft cooling tower performance with diesel power stations." Heat Transfer Engineering 9, no. 4 (1988): 36-44. https://doi.org/10.1080/01457638808939679
[27] Mohiuddin, A. K. M., and K. Kant. "Knowledge base for the systematic design of wet cooling towers. Part I: Selection and tower characteristics." International Journal of Refrigeration 19, no. 1 (1996): 43-51. https://doi.org/10.1016/0140-7007(95)00059-3
[28] Yilmaz, Alper. "Analytical calculation of wet cooling tower performance with large cooling ranges." Journal of Thermal Science and Technology 30, no. 2 (2010): 45-56.
[29] Singh, Kuljeet, and Ranjan Das. "An experimental and multi-objective optimization study of a forced draft cooling tower with different fills." Energy Conversion and Management 111 (2016): 417-430. https://doi.org/10.1016/j.enconman.2015.12.080
[30] Hamad, A., Syed Mohammed Aminuddin Aftab, and Kamarul Arifin Ahmad. "Reducing flow separation in T-junction pipe using vortex generator: CFD study." Journal of Advanced Research in Fluid Mechanics and Thermal Sciences 44, no. 1 (2018): 36-46.
[31] Lemouari, M., M. Boumaza, and I. M. Mujtaba. "Thermal performances investigation of a wet cooling tower." Applied Thermal Engineering 27, no. 5-6 (2007): 902-909. https://doi.org/10.1016/j.applthermaleng.2006.08.014
[32] Indrawati, Titik, Indrariningrum Indrariningrum, and Rhevi Raditya Ginanjar. "Perancangan 'Mini Cooling Tower' Sederhana Sebagai Pendingin Air Kondensor Pada Proses Refluks Ujichemical Oxygen Demand (COD)." Jurnal Temapela 1, no. 1 (2018): 16-22. https://doi.org/10.25077/temapela.1.1.16-22.2018
[33] Singla, Rohit K., Kuljeet Singh, and Ranjan Das. "Tower characteristics correlation and parameter retrieval in wet-cooling tower with expanded wire mesh packing." Applied Thermal Engineering 96 (2016): 240-249. https://doi.org/10.1016/j.applthermaleng.2015.11.063
[34] Schubauer, Galen Brandt, and W. G. Spangenberg. "Forced mixing in boundary layers." Journal of Fluid Mechanics 8, no. 1 (1960): 10-32. https://doi.org/10.1017/S0022112060000372
[35] Fiebig, M., A. Valencia, and Nimai K. Mitra. "Wing-type vortex generators for fin-and-tube heat exchangers." Experimental Thermal and Fluid Science 7, no. 4 (1993): 287-295.

CFD Letters
Volume 13, Issue 1 (2021) 45-57
57
https://doi.org/10.1016/0894-1777(93)90052-K [36] Oyakawa, K., Y. Furukawa, T. Taira, I. Senaha, and T. Nagata. "Effects of vortex generators on heat transfer
enhancement in a duct." In Experimental Heat Transfer, Fluid Mechanics and Thermodynamics 1993, pp. 633-640. Elsevier, 1993. https://doi.org/10.1016/B978-0-444-81619-1.50075-7