Performance Evaluation of Open Graded Base Course with ...
132
-
Upload
khangminh22 -
Category
Documents
-
view
1 -
download
0
Transcript of Performance Evaluation of Open Graded Base Course with ...


2
1. Report Number
WHRP 10-10
2. Govt. Accession
No
3 Recipient‟s Catalog No.
4. Title and Subtitle
Performance Evaluation of Open Graded Base Course
with Doweled and Non-doweled Transverse Joints on
USH 18/151, STH 29, and USH 151
5. Report Date
September 2010
6. Performing Organization Code
Wisconsin Highway Research Program
7. Authors
Schmitt, Robert; Owusu-Ababio, Samuel; Crovetti, James
8. Performing Organization Report No.
9. Performing Organization Name and Address
Department of Civil and Environmental Engineering
University of Wisconsin-Madison
1415 Engineering Drive
Madison, WI 53706
10 Work Unit No. (TRAIS)
11. Contract or Grant No.
WisDOT SPR #0092-09-03
12. Sponsoring Agency Name and Address
Wisconsin Department of Transportation
Division of Business Services
Research Coordination Section
4802 Sheboygan Ave., Room 104
Madison, WI 53707
13. Type of Report and Period Covered
Final Report.
2008 – September 2010
14. Sponsoring Agency Code
15. Supplementary Notes
16. Abstract
The objectives of this study were to investigate the performance of 20-year old doweled/non-doweled and
dense-graded/permeable base test sections on three concrete pavement segments in Wisconsin: USH 18/151 in Iowa
and Dane counties, STH 29 in Brown County, and USH 151 in Columbia and Dane Counties. Five pavement bases
were placed including: dense graded, asphalt-stabilized permeable, cement-stabilized permeable, and untreated
permeable having two gradation sizes.
USH 18/151 test sections had similar performance (PDI) for doweled unsealed pavement on dense and
permeable base. Distresses common to all segments included slight to moderate distressed joints/cracks and slight
transverse faulting. Asphalt-stabilized permeable base had no slab breakup or surface distresses, however it
measured a greater severity of distressed joints and cracks. Non-doweled sections having asphalt-stabilized
permeable base and Transverse Inter Channel drains had better performance and ride than the other non-doweled
sections. IRI was generally higher on non-doweled pavements, but many doweled sections had an equal roughness
to non-doweled sections. Sealed non-doweled joints produced a better performing pavement, however, sealant did
not appear to improve ride.
STH 29 unsealed sections performed better than the median PDI for the sealed sections. The sealed
doweled pavement did perform a little better than the non-doweled section, but the opposite occurred on the non-
doweled sections. Sealed doweled joints had a smoother ride than the other combinations.
USH 151 test sections found the finer-graded New Jersey permeable base had the smoothest ride when
compared to other permeable sections. Asphalt-stabilized permeable base had the roughest ride, and unstabilized
and cement-stabilized permeable bases had intermediate values.
The average hydraulic conductivity for the unstabilized permeable base was 17,481 feet per day and there
appears little variation due to doweling or joint sealant. Deflection load transfer results indicate expected high
average values for the doweled sections and fair to poor values for the non-doweled sections. Slab support ratios
indicate variable results based on base type and joint reinforcement/sealant.
Life-cycle cost analysis found dense-graded base was the least cost among all base alternatives, with a total
estimated present-worth life-cycle cost of $665,133 per roadway mile. Untreated and asphalt-stabilized permeable
bases were more expensive by 13% and 27%, respectively. Other factors in selecting dense-graded base over
permeable base include project drainage conditions set forth in the FDM guidelines an anticipated increase in
pavement surface roughness.
17. Key Words
Concrete, Pavement, Base, Drainage, Performance
18. Distribution Statement
No Restriction. This document is available to the
public through the National Technical Information
Service, 5285 Port Royal Rd., Springfield, VA 22161
19. Security Classif.(of this
report) Unclassified
20. Security Classif. (of
this page) Unclassified
21. No. of Pages
131
22. Price -0-

3
DISCLAIMER
This research was funded through the Wisconsin Highway Research Program by the
Wisconsin Department of Transportation and the Federal Highway Administration under
Project 0092-09-03. The contents of this report reflect the views of the authors who are
responsible for the facts and accuracy of the data presented herein. The contents do not
necessarily reflect the official views of the Wisconsin Department of Transportation or the
Federal Highway Administration at the time of publication.
This document is disseminated under the sponsorship of the Department of
Transportation in the interest of information exchange. The United States Government
assumes no liability for its contents or use thereof. This report does not constitute a standard,
specification or regulation.
The United States Government does not endorse products or manufacturers. Trade
and manufacturers‟ names appear in this report only because they are considered essential to
the object of the document.

4
EXECUTIVE SUMMARY
The objectives of this study are to investigate the performance of doweled/non-
doweled and open-graded/dense-graded base test sections on three concrete pavement
segments in Wisconsin. A field evaluation was conducted from 20-year old pavement on
USH 18/151 in Iowa and Dane Counties (17 test sections), STH 29 in Brown County (4 test
sections), and USH 151 in Columbia and Dane Counties (4 test sections). This data allowed
a comparison of unique features of each section to determine effects between subgrade
support, drainability, load transfer, joint sealant, and overall performance.
The USH 18/151 test sections were constructed in 1988 with 9-inch thick PCC
pavement and 7 unique design factors across Iowa and Dane County. Test sections in Iowa
County were non-doweled, while those in Dane County were doweled. Both sealed and
unsealed transverse joints were constructed in each county. There were 5 unique pavement
bases, including: asphalt stabilized permeable base (ASOG), cement-stabilized permeable
base (CSOG), unstabilized permeable base (OGBC), dense graded, and Transverse Inter
Channel (TIC) drains on dense-graded base. Except for the TIC drain system, the remaining
four base types were constructed in both the non-doweled Iowa County sections and doweled
Dane County sections.
Test sections on STH 29 in Brown County and USH 151 in Columbia County were a
more simplified experimental design than USH 18/151. STH 29 was constructed in 1988
with 10-inch thick PCC pavement over a 4-inch upper permeable aggregate base and a 4-inch
lower dense aggregate subbase. Joints were both sealed and unsealed in two non-doweled
sections and two doweled sections.
Constructed in 1991, the all-doweled USH 151 Columbia County project has 10-inch
PCC pavement over 5 unique bases: ASOG, CSOG, unstabilized OGBC, dense graded, and
unstabilized finer-graded New Jersey OGBC with 50% passing the #4 sieve. Asphalt
concrete sections were also included in this project. Drainage pipe on STH 29 and USH 151
were 6-inch diameter, unlike USH 18/151 with 4-inch pipe diameter.
Data were collected for the Pavement Distress Index (PDI), International Roughness
Index (IRI), Falling Weight Deflectometer (FWD), and water drainage to evaluate pavement
performance, support conditions, and water permeability through the base course. Both
automated and manual pavement condition data surveys were conducted for each test section.
First, semi-automated electronic survey were collected for transverse faulting and ride quality
with IRI measurements in both wheel paths. Pavement condition was manually measured for
traditional PCC pavement distresses, including slab breakup, distressed joints and cracks,
joint crack filling, patching, surface distress, longitudinal joint distress and distortion, and
transverse faulting.
The doweled sections of USH 18/151 had similar performance (PDI) for doweled
unsealed pavement on both dense and permeable base. Distresses common to all segments
included slight to moderate distressed joints/cracks and slight transverse faulting. ASOG had

5
no slab breakup or surface distresses, however it measured a greater severity of distressed
joints and cracks. The dense-graded base section had the roughest ride when compared to all
open-graded doweled sections. There was little difference in ride among the open-graded
sections. In summary, doweled pavement on asphalt-stabilized open graded bases had the
lowest measured composite distresses, while the open-graded bases had a lower surface
roughness.
For non-doweled sections on USH 18/151, the CSOG, ASOG, and TIC drains had the
least amount of distress. DGBC and untreated OGBC had the highest composite measure of
pavement distress. ASOG base and TIC drains had the smoothest ride, while untreated
OGBC and CSOG had the rougher surface smoothness. Therefore, non-doweled sections
having ASOG base and TIC drains had better performance and ride than the other non-
doweled sections.
USH 151 had doweled 10-thick PCC, unsealed skewed transverse joints, paved over a
4-inch top permeable base (untreated with two gradations, cement-stabilized, and asphalt-
stabilized) and 4-inch lower dense base. All permeable base types had nearly the same
performance among the different bases with slight distressed joints/cracks. Minor
differences were found with untreated OGBC with 10% of slab area having slab breakup and
surface distresses, and ASOG having slight transverse faulting. The finer New Jersey open-
graded base had the smoothest ride when compared to other open-graded sections. ASOG
base had the roughest ride, and unstabilized OGBC and CSOG bases had intermediate
values. In summary, the much finer-graded New Jersey base had less composite distresses
and a smoother ride.
Pooled data from the three projects found that non-doweled pavement generally has a
higher distress level than doweled; however, when two non-doweled outliers are removed,
the difference is less pronounced. The extent of transverse faulting was equal among all test
sections, however, the severity was higher for non-doweled joints with about half of those
sections rated a level 2 (¼ to ½ inch). All doweled sections were either at or less than 0.02
inches. IRI was generally higher on non-doweled pavements, but many doweled sections
had an equal roughness to non-doweled sections.
USH 18/151 sealed non-doweled joints produced a better performing pavement than
unsealed joints; however, sealant did not appear to have a consistent effect on ride. On two
doweled dense-graded sections, sealant slightly outperformed the unsealed section, with
minor patching the prominent distress for the unsealed section. Both sections had identical
extent and severity levels for slab breakup, distressed joints/cracks, surface distress,
longitudinal distress, and transverse faulting.
STH 29 unsealed sections for doweled/non-doweled joints performed better than the
median PDI for the sealed sections. The sealed doweled pavement did perform slightly
better than the non-doweled section, but the opposite occurred on the non-doweled sections.
Sealed doweled joints had a smoother ride than the other combinations. Sealed/non-doweled
joints produced the roughest ride, and as expected, non-doweled joints, whether sealed or
unsealed, had the highest IRI values.

6
The average hydraulic conductivity for the unstabilized OGBC was 17,481 feet per
day (fpd), exceeding the desired minimum rate of 1,000 fpd. The average hydraulic
conductivity for the cement-stabilized permeable base CSOG was 15,129 fpd and there was a
substantial variation due to joint sealant, with the sealed section having a hydraulic
conductivity of 21,212 fpd and the unsealed sections averaging 12,087 fpd. The average
hydraulic conductivity for the ASOG was 8,471 fpd which was significantly lower than the
untreated OGBC and CSOG sections. There appeared to be a slight variation due to
doweling with the doweled section having a hydraulic conductivity of 5,920 fpd and the non-
doweled sections averaging 9,747 fpd.
The results provided for STH 29 Brown County indicate adequate drainage capacity
in all sections. The data disclosed a significant variation due to doweling but little variation
due to joint sealant. The average hydraulic conductivity for the unstabilized permeable base
(OGPB) sections without dowels is 2,817 fpd and 13,637 fpd for the doweled test sections.
Results for USH 151 Columbia-Dane Counties indicate adequate drainage capacity in only
the CSOG base section, with a calculated hydraulic conductivity of 10,697 fpd. The base
layers in the remaining three test sections would not accept water, indicating a complete
blockage of the layer. The reason for this condition is unknown.
The deflection load transfer results indicate expected high average values for the
doweled sections and fair to poor values for the non-doweled sections. For USH 18/151, the
overall average load transfer values for the doweled and non-doweled sections were 94.8%
and 40.9%, respectively. For the non-doweled sections, the overall average load transfer
values for the sealed and unsealed sections were 45.1% and 38.5%, respectively. For the
doweled sections, the overall average load transfer values for the sealed and unsealed
sections were 96.0% and 94.7%, respectively. For STH 29, the overall average load transfer
values for the doweled and non-doweled sections were 93.0% and 17.9%, respectively.
Little variation was noted for the sealed and unsealed sections. For USH 151, the overall
average load transfer value for the doweled sections was 98.3%.
The slab support ratios indicate variable results based on base type, joint
reinforcement and joint sealant. For USH 18/151 Iowa-Dane Counties, all corner support
ratios suggest full support is maintained. The edge support ratios generally indicate full
support is maintained with the exception of three doweled and unsealed sections; namely
sections 10a (SSRe=0.58), 13 (SSRe=0.54) and 14 (SSRe=0.67). These reduced values (<
0.75) suggest support problems due to densification of the base layers which is not normally
expected for doweled sections. For the STH 29 sections, reduced edge support is noted for
non-doweled section 2 (SSRe=0.73) and doweled section 3 (SSRe=0.69) and reduced corner
support is noted for doweled section 3 (SSRc=0.63). While these values are near the trigger
value of 0.75, indicating only minor loss of support, it is interesting to note that these are the
sealed sections. The results from USH 151 Columbia-Dane Counties indicates support
problems under all edges and corners, with SSR values ranging from a low of 0.16 to a high
of 0.66.
A life-cycle cost analysis was performed to quantify costs of comparable sections for
the various base types. The analysis began by identifying the stage or time in pavement life
when rehabilitation activities would occur using performance models, then estimating a cost
7
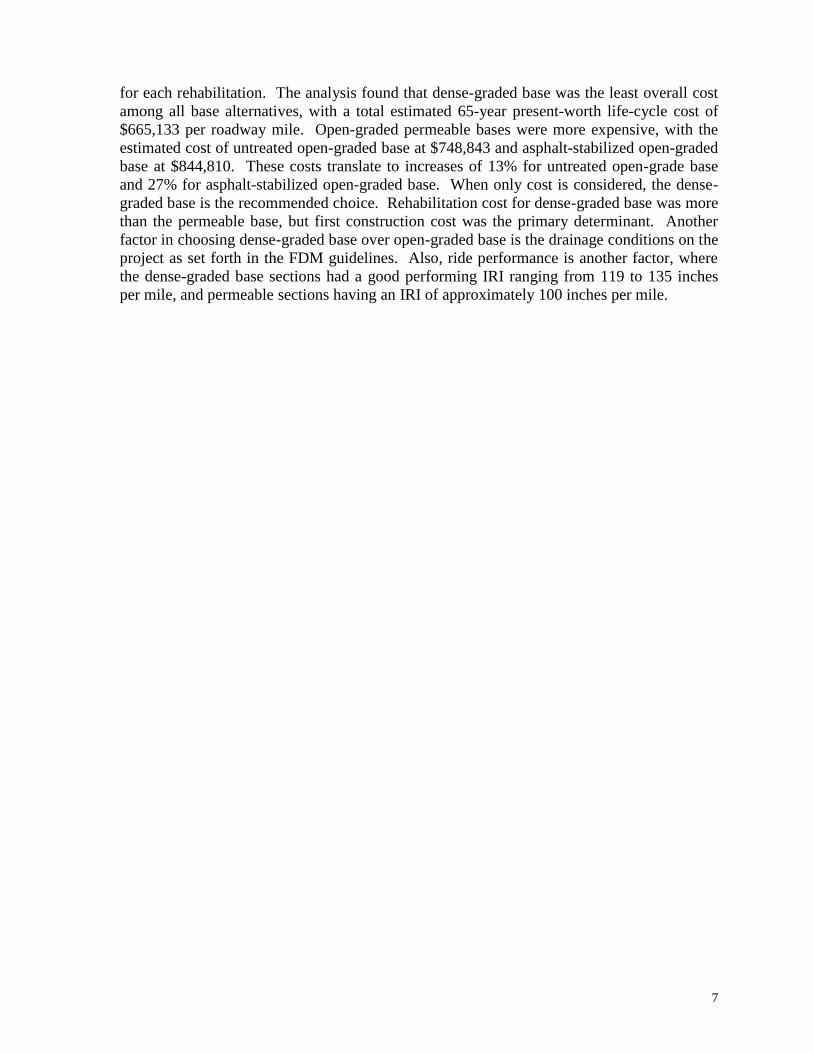
for each rehabilitation. The analysis found that dense-graded base was the least overall cost
among all base alternatives, with a total estimated 65-year present-worth life-cycle cost of
$665,133 per roadway mile. Open-graded permeable bases were more expensive, with the
estimated cost of untreated open-graded base at $748,843 and asphalt-stabilized open-graded
base at $844,810. These costs translate to increases of 13% for untreated open-grade base
and 27% for asphalt-stabilized open-graded base. When only cost is considered, the dense-
graded base is the recommended choice. Rehabilitation cost for dense-graded base was more
than the permeable base, but first construction cost was the primary determinant. Another
factor in choosing dense-graded base over open-graded base is the drainage conditions on the
project as set forth in the FDM guidelines. Also, ride performance is another factor, where
the dense-graded base sections had a good performing IRI ranging from 119 to 135 inches
per mile, and permeable sections having an IRI of approximately 100 inches per mile.

8
ACKNOWLEDGMENTS
The authors thank Wisconsin DOT for sponsoring this research. They also thank the Brown,
Columbia, and Iowa County Highway Departments for providing safe traffic control during
field data collection. A special thanks for Mr. Jay Shabelski for expertise in permeability
testing, and UW-Platteville civil engineering students for test section mapping and field data
collection, including Mr. Russell Ruplinger, Mr. Matthew Backes, Mr. Kyle Ruef, Mr.
Thomas Stock, and Mr. Tyler Wyman.

9
TABLE OF CONTENTS
EXECUTIVE SUMMARY ...................................................................................................... 4 ACKNOWLEDGMENTS ........................................................................................................ 8 LIST OF FIGURES ................................................................................................................ 11 LIST OF TABLES .................................................................................................................. 12 CHAPTER 1 INTRODUCTION ........................................................................................... 13
1.1 Background ................................................................................................................... 13 1.2 Problem Statement ........................................................................................................ 14 1.3 Objective ....................................................................................................................... 14 1.4 Benefits ......................................................................................................................... 15
CHAPTER 2 LITERATURE REVIEW ................................................................................ 16 2.1 Introduction .................................................................................................................. 16 2.2 Wisconsin DOT Studies ............................................................................................... 16 2.3 Other Agency Studies ................................................................................................... 21 2.4 National and Other Studies ........................................................................................... 25 2.5 FWD Publications......................................................................................................... 29 2.6 Summary ....................................................................................................................... 30
CHAPTER 3 EXPERIMENTAL DESIGN ........................................................................... 32 3.1 Introduction .................................................................................................................. 32 3.2 USH 18/151 Test Sections ............................................................................................ 33 3.3 STH 29 and USH 151 Test Sections ............................................................................ 34 3.4 Data Overlay ................................................................................................................. 34
CHAPTER 4 DATA COLLECTION .................................................................................... 39 4.1 Introduction .................................................................................................................. 39 4.2 IRI and Pavement Condition Survey ............................................................................ 39 4.3 Falling Weight Deflectometer ...................................................................................... 41 4.4 Permeability and Drainage ........................................................................................... 42
CHAPTER 5 PERFORMANCE ANALYSIS ....................................................................... 48 5.1 Introduction .................................................................................................................. 48 5.2 Methodology ................................................................................................................. 48 5.3 Individual Distress Measures ........................................................................................ 48 5.4 Performance Analysis Plots .......................................................................................... 53
5.4.1 Base Type and Performance ................................................................................... 53 5.4.2 Transverse Dowels and Performance ..................................................................... 57 5.4.3 Sealant and Performance ........................................................................................ 59
5.5 Statistical Analysis ....................................................................................................... 63 5.5.1 Basic Statistics........................................................................................................ 63 5.5.2 Statistical Models ................................................................................................... 65
5.6 Summary of Performance Analysis .............................................................................. 69 5.6.1 Base Type ............................................................................................................... 69 5.6.2 Transverse Dowels ................................................................................................. 70 5.6.3 Sealant .................................................................................................................... 71
CHAPTER 6 STRUCTURAL ANALYSIS .......................................................................... 72

10
6.1 Water Flow Field Testing Procedure ............................................................................ 72 6.2 Drainage Flow Calculations ......................................................................................... 73 6.3 Field Permeability Testing Results ............................................................................... 76 6.4 Falling Weight Deflectometer (FWD) Analysis ........................................................... 77
6.4.1 Analysis of Interior Slab Deflections ...................................................................... 77 6.4.2 Analysis of Transverse Joint Deflections ............................................................... 81
6.5 Summary ....................................................................................................................... 85 CHAPTER 7 ECONOMIC ANALYSIS ............................................................................... 86
7.1 Introduction .................................................................................................................. 86 7.2 Roadway Cross Section ................................................................................................ 86 7.2 Cost Data ...................................................................................................................... 88 7.3 Timing of Maintenance and Rehabilitation Treatments ............................................... 94 7.4 LCCA Computations .................................................................................................... 98
CHAPTER 8 CONCLUSIONS AND RECOMMENDATIONS ........................................ 104 8.1 Conclusions ................................................................................................................ 104
8.1.1 Base Type ............................................................................................................. 104 8.1.2 Transverse Dowels ............................................................................................... 105 8.1.3 Sealant .................................................................................................................. 105 8.1.4 Drainage ............................................................................................................... 105 8.1.5 Structural Capacity ............................................................................................... 106 8.1.6 Life-Cycle Cost Analysis ..................................................................................... 107
8.2 Recommendations ...................................................................................................... 107 REFERENCES ..................................................................................................................... 109 Appendix A - Adjustment of Data Sets ................................................................................ 113 Appendix B – Pavement Cross Sections ............................................................................... 120 Appendix C – Correlation Matrix ......................................................................................... 128

11
LIST OF FIGURES
Figure 3.1 Field Verification of Test Sections on Eastbound USH 18/151 ........................... 32 Figure 3.2 Test Sections for USH 18/151 in Iowa County .................................................... 35 Figure 3.3 Test Sections for USH 18/151 in Dane County.................................................... 36 Figure 3.4 Test Sections for USH 18/151 Westbound in Iowa County ................................. 36 Figure 3.5 Test Sections on STH 29/32 in Brown County .................................................... 37 Figure 3.6 Test Sections for USH 151 Dane and Columbia Counties ................................... 38 Figure 4.1 Transverse Joint Fault Measurement on USH 18/151 .......................................... 40 Figure 4.2 Longitudinal Fault Measurement on USH 18/151 ............................................... 40 Figure 4.3 FWD Testing on USH 18/151 at Barneveld Interchange ..................................... 41 Figure 4.4 Measurement of In-Place Permeability ................................................................ 42 Figure 4.5 Illustration of plume of water from core hole to pavement edge ......................... 43
Figure 4.6 Drilling Corehole and Recording Elevations (USH 18/151) ................................ 44 Figure 4.7 Water Inflow at Corehole and Recording Rate and Volume (USH 18/151) ........ 44 Figure 4.8 Water Flow Meter (USH 18/151) ......................................................................... 45 Figure 4.9 Recording Elevation at Outflow Drainpipe (USH 18/151) .................................. 45 Figure 4.10 Flow Meter measuring 97.94 Gallons of Water into Corehole (STH 29) .......... 46 Figure 4.11 Water flowing out Edgedrain Pipe and Apron Endwall (STH 29) ..................... 46 Figure 4.12 Water with Tracer Dye flowing out Edgedrain Pipe and Apron Endwall .......... 47 Figure 5.1 Patching in TIC Section Adjacent to New On-Ramp ........................................... 49 Figure 5.2 PDI variation for Unsealed Doweled Transverse Joints on USH 18/151 ............ 53 Figure 5.3 IRI variation for Unsealed Doweled Transverse Joints on USH 18/151.............. 54 Figure 5.4 PDI variation for Unsealed Doweled Transverse Joints on USH 151.................. 55 Figure 5.5 IRI variation for Unsealed Doweled Transverse Joints on USH 151 ................... 55 Figure 5.6 PDI variation for Base Type on Non-doweled Sections on USH 18/151 ............ 56 Figure 5.7 IRI variation for effect of Base Type on Non-doweled Sections on USH 18/151 57 Figure 5.8 PDI variation with Transverse Joint Dowel Treament (all segments) ................. 58 Figure 5.9 Faulting variation with Transverse Joint Dowel Treament (all segments) ........... 58 Figure 5.10 IRI variation with Transverse Joint Dowel Treament (all segments) ................. 59 Figure 5.11 Location of USH 18/151 Test Section east of STH 78 Exit Ramp .................... 60 Figure 5.12 PDI for Sealed/Unsealed Doweled Joints on Dense Base (USH 18/151) .......... 61 Figure 5.13 IRI for Sealed/Unsealed Doweled Joints on Dense Base (USH 18/151) ........... 61 Figure 5.14 PDI for Sealed/Unsealed Doweled/Non-Doweled Joints on STH 29 ................ 62
Figure 5.15 IRI for Sealed/Unsealed Doweled/Non-Doweled Joints on STH 29 ................. 62 Figure 5.16 Significant Correlations between Design Variables and Performance ............... 65 Figure 6.1 Flow Conditions During Permeability Testing..................................................... 73
Figure 6.2 Hydraulic Conductivity Calculation Sequence .................................................... 75 Figure 7.1 Pavement Cross Sections for LCCA .................................................................... 87 Figure 7.2 Unit Prices for Aggregate Base ............................................................................ 91 Figure 7.3 Unit Prices for Concrete Pavement Thickness ..................................................... 92
Figure 7.4 Unit Prices for Underdrain Pipe ........................................................................... 93 Figure 7.5 Patching on Doweled Dense-Graded Test Section #14 on USH 18/151.............. 97
12
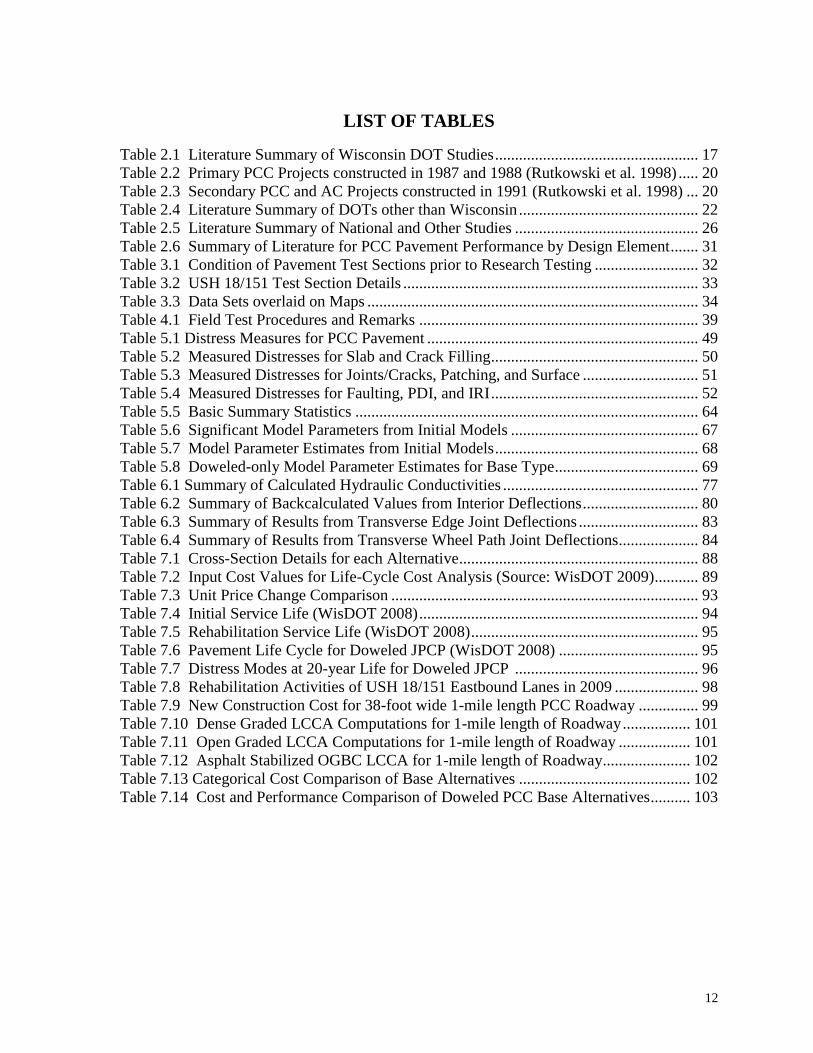
LIST OF TABLES
Table 2.1 Literature Summary of Wisconsin DOT Studies ................................................... 17 Table 2.2 Primary PCC Projects constructed in 1987 and 1988 (Rutkowski et al. 1998) ..... 20 Table 2.3 Secondary PCC and AC Projects constructed in 1991 (Rutkowski et al. 1998) ... 20 Table 2.4 Literature Summary of DOTs other than Wisconsin ............................................. 22 Table 2.5 Literature Summary of National and Other Studies .............................................. 26 Table 2.6 Summary of Literature for PCC Pavement Performance by Design Element ....... 31 Table 3.1 Condition of Pavement Test Sections prior to Research Testing .......................... 32 Table 3.2 USH 18/151 Test Section Details .......................................................................... 33 Table 3.3 Data Sets overlaid on Maps ................................................................................... 34 Table 4.1 Field Test Procedures and Remarks ...................................................................... 39
Table 5.1 Distress Measures for PCC Pavement .................................................................... 49 Table 5.2 Measured Distresses for Slab and Crack Filling .................................................... 50 Table 5.3 Measured Distresses for Joints/Cracks, Patching, and Surface ............................. 51 Table 5.4 Measured Distresses for Faulting, PDI, and IRI .................................................... 52 Table 5.5 Basic Summary Statistics ...................................................................................... 64 Table 5.6 Significant Model Parameters from Initial Models ............................................... 67 Table 5.7 Model Parameter Estimates from Initial Models ................................................... 68 Table 5.8 Doweled-only Model Parameter Estimates for Base Type .................................... 69 Table 6.1 Summary of Calculated Hydraulic Conductivities ................................................. 77 Table 6.2 Summary of Backcalculated Values from Interior Deflections ............................. 80 Table 6.3 Summary of Results from Transverse Edge Joint Deflections .............................. 83 Table 6.4 Summary of Results from Transverse Wheel Path Joint Deflections.................... 84
Table 7.1 Cross-Section Details for each Alternative ............................................................ 88 Table 7.2 Input Cost Values for Life-Cycle Cost Analysis (Source: WisDOT 2009) ........... 89 Table 7.3 Unit Price Change Comparison ............................................................................. 93 Table 7.4 Initial Service Life (WisDOT 2008) ...................................................................... 94 Table 7.5 Rehabilitation Service Life (WisDOT 2008) ......................................................... 95 Table 7.6 Pavement Life Cycle for Doweled JPCP (WisDOT 2008) ................................... 95 Table 7.7 Distress Modes at 20-year Life for Doweled JPCP .............................................. 96 Table 7.8 Rehabilitation Activities of USH 18/151 Eastbound Lanes in 2009 ..................... 98 Table 7.9 New Construction Cost for 38-foot wide 1-mile length PCC Roadway ............... 99 Table 7.10 Dense Graded LCCA Computations for 1-mile length of Roadway ................. 101
Table 7.11 Open Graded LCCA Computations for 1-mile length of Roadway .................. 101 Table 7.12 Asphalt Stabilized OGBC LCCA for 1-mile length of Roadway ...................... 102
Table 7.13 Categorical Cost Comparison of Base Alternatives ........................................... 102 Table 7.14 Cost and Performance Comparison of Doweled PCC Base Alternatives .......... 103

13
CHAPTER 1 INTRODUCTION
1.1 Background
Until the late 1980s, Portland cement concrete (PCC) pavement in Wisconsin was
constructed as either jointed plain concrete pavement (JPCP) or continuously reinforced
concrete pavement (CRCP). Use of CRCP was discontinued because of its high initial cost.
Use of JPCP was questioned because of severe transverse joint faulting that occurred at many
locations. It was proposed that using dowel bars to provide load transfer at joints and/or
eliminating free water and erodible material beneath the slabs would alleviate the faulting
problem. All PCC pavements since 1987 have been constructed as JPCP with doweled joints,
and many utilize open-graded base course (OGBC) to provide a drained pavement structure.
However, it has not been proven whether dowels, OGBC, or a combination of both provide
the best protection against joint faulting and other pavement distress. In 1988, 17 test
sections were constructed on USH 18/151 in Iowa and Dane Counties to study the effects of
dense and open graded base courses (stabilized and non-stabilized), several drain systems,
and doweled and non-doweled transverse joints. A performance report was written after the
pavement had been in service for 10 years (Rutkowski et al. 1998). The major conclusions of
this report were that dowels and asphalt-stabilized OGBC provided the greatest protection
against joint faulting, but use of dowels and asphalt-stabilized OGBC in combination did not
provide significantly better performance than using either of these measures separately.
Additionally, test sections to evaluate doweled/non-doweled performance were
constructed on STH 29 in Brown County. Constructed in 1988, this pavement cross-section
consists of a 10-inch JPCP over a 4-inch permeable aggregate base and a 4-inch aggregate
subbase. The joints are non-doweled in two test sections and doweled in the other two
sections. For all four sections, the joints are skewed and variably spaced in a repeating 12-
13-19-18 ft pattern. The STH 29 project is part of an original Wisconsin experimental
section that investigated a number of different design features, including joint sealant and
dowel bars. In this study, two sections contained pre-formed sealant and two sections are
unsealed.
Other test sections were constructed around the state. In 1991, the doweled USH 151
Columbia County project had 5 test sections, each with a unique base: asphalt stabilized
permeable, cement stabilized permeable, unstabilized permeable, dense graded, and New
Jersey permeable. A dense-graded section was constructed at the STH 73 interchange, but
did not have equivalent traffic loading and structural section to the mainline test sections.
After nearly 20 years of service, performance differences among these test sections
may now be apparent. Designing a field data collection plan and analyzing the data will
allow more definite conclusions to be drawn.

14
1.2 Problem Statement
This study evaluated the 20-year performance characteristics of 3 concrete pavement
test segments in Wisconsin, including 17 test sections constructed on USH 18/151 in Dane
and Iowa Counties; 4 test sections constructed on STH 29 in Brown County; and 4 test
sections on USH 151 in Columbia County. Performance results of test sections constructed
with multiple combinations of doweled and non-doweled joints; cement, lean concrete,
asphalt, and non-stabilized OGBC; pipe/aggregate longitudinal, interchannel transverse, and
wrapped trench/pipe edge drains; and sealed and unsealed transverse joints. At this time, it is
unclear what factors, or combination of factors, influence actual performance, as measured
by the PDI and IRI.
1.3 Objective
The objective of this study is to investigate the performance of test sections on three
concrete pavement segments in Wisconsin: (1) 17 test sections along USH 18/151 in Iowa
and Dane counties, (2) 4 test sections along STH 29 in Brown County, and (3) 4 test sections
along USH 151 in Columbia County. The following analytical tools are used, including:
(a) WisDOT Pavement Surface Distress Survey Manual and PDI;
(b) International Roughness index (IRI);
(c) Falling Weight Deflectometer (FWD) testing to evaluate support conditions;
(d) Permeability testing to measure water flow through the permeable base course; and
(e) Data analysis and modeling.
Initially, the scope of the project was limited to USH 18/151 in Iowa and Dane
Counties. WHRP amended the initial scope of research to include more testing and
evaluation of PCC test pavements. In the report by Rutkowski et al. (1988), there were
several other research segments constructed from 1987 to 1991 to evaluate the performance
of both PCC and AC pavements. These segments were reviewed to identify candidate test
sections for evaluation in this study. Since the principal objective of the initial USH 18/151
research was to evaluate dowel/non-dowel and base performance, there were 3 candidate
segments from the 1998 report that were best suited for this study, including: STH 29, Brown
County; USH 14, Dane County; and USH 151, Columbia County.
With the approval of additional funds, the study was expanded to allow the testing of
STH 29 in Brown County. USH 14 was overlayed with hot-mix asphalt in 2007, precluding
a detailed data collection and analysis. The WisDOT Kuab 2-m FWD was made available
for this study soon after the addition of STH 29 project, allowing cost savings to be applied
to a third project, USH 151 in Columbia County.

15
1.4 Benefits
The potential benefits of this study include:
Enhancing WisDOT PCC pavement design that result in pavements providing a high
level of performance at the lowest cost;
Augmenting results from previous studies of dowel bars and drained pavement
structures; and
Supplementing technological developments and the knowledge base on this topic.

16
CHAPTER 2 LITERATURE REVIEW
2.1 Introduction
A comprehensive literature review was conducted to identify factors affecting PCC
performance in doweled and non-doweled pavements having varying base conditions. The
literature review was conducted using the Transportation Research Information Services
(TRIS), general web-based search, and published documents related specifically to these test
sections.
Several recent literature sources were reviewed to understand the effect of doweled or
undoweled transverse joints, and related design elements, to actual pavement performance.
Literature were identified with the assistance of the TRIS database and WisDOT research
reports. Literature sources were divided into Wisconsin DOT, other DOTs, and national
studies (e.g., FHWA, NCHRP).
2.2 Wisconsin DOT Studies
A summary of studies for Wisconsin DOT are provided in Table 2.1. These include
two reports directly related to this study, along with two other reports that evaluated design
elements. Reports directly related to the test sections in this study include those by Weiss
(1992), Rutkowski (1992a; 1993), Crovetti (1995), and Rutkowski et al. (1998).
The reports by Weiss (1992) and Rutkowski (1992a; 1993) evaluated four PCC and
three HMA test sections along USH 151 and STH 73 in Dane and Columbia Counties. The
initial reports by Weiss (1992) and Rutkowski (1992a; 1993) were published in a series of
phases (Phase II, III, and IV) to coincide with the FHWA Open-Grade Base Course National
Open House. This FHWA demonstration project focused on the research and development
of OGBC as an alternative to DGBC. Analysis of FWD data found no substantial variation
in the measured load transfer efficiencies (LTE) between five PCC test sections constructed
with different base types including DGBC, non-stabilized OGBC, non-stabilized New Jersey
OGBC, asphalt-stabilized OGBC, and cement-stabilized OGBC. LTE showed 90% load
transfer for the OGBC test sections. The substitution of OGBC for DGBC adds
approximately $55,000 to $110,000 per mile to the structural cost depending upon base
course gradation and material stabilization. The substitution of asphalt-stabilized OGBC for
the standard HMA paving system adds approximately $44,000 per mile to the structural cost
(Rutkowski 1992a).

17
Table 2.1 Literature Summary of Wisconsin DOT Studies
Reference
(1)
Key Findings
(2)
Weiss, 1992;
Rutkowski
1992a, 1993
Evaluated test sections along USH 151 and STH 73 in Dane and Columbia
Counties.
After 4 years pavement service, there was no substantial variation in the
measured load transfer efficiencies between sections constructed with
different base types (DGBC, non-stabilized OGBC, non-stabilized New
Jersey OGBC, asphalt-stabilized OGBC, and cement-stabilized OGBC).
Substitution of OGBC for DGBC adds approximately $55,000 to $110,000
per mile to the structural cost.
Substitution of asphalt-stablized OGBC for the standard HMA paving
system adds approximately $44,000 per mile to the structural cost
Crovetti, 1995;
Rutkowski et
al. 1998
Dowels and asphalt-stabilized OGBC provided the greatest protection
against joint faulting.
Use of dowels and asphalt-stabilized OGBC in combination did not provide
significantly better performance than using either of these measures
separately.
Wen and Chen,
2007 Thick concrete slabs result in lower initial pavement roughness than thin
slabs.
Pavements located in urban areas have higher initial pavement roughness
than those in rural areas.
There is no statistically significant difference of initial pavement roughness
resulting from dowel bar placement methods, either dowel baskets or
inserted dowel bars.
There are no differences in initial pavement roughness resulting from base
types, including CABC, OGBC, and OGBC2, except that for rural
pavements, OGBC2 results in statistically higher initial pavement roughness
than does CABC.
Joint spacing is not a statistically significant factor affecting initial pavement
roughness.
Longer paving projects in urban areas result in lower initial pavement
roughness.
Crovetti, 2006 Fiber-reinforced polymer (FRP) composite dowels may not be a practical
alternative to conventional epoxy coated steel dowels due to their reduced
rigidity, which results in lower deflection load transfer capacities at
transverse joints.
Reduced placements of solid stainless steel dowels also indicate reduced load
transfer capacity and increased IRI values as compared to similarly designed
sections incorporating epoxy coated dowels.
Reduced doweling in the driving lane wheel paths also is detrimental to
performance for most constructed test sections.
Sections constructed with variable slab geometry and drainage designs
indicate that one-way surface and base drainage designs are performing as
well as or better than standard crowned pavements with two-way base
drainage.
Drainage capacity of the base layer, constructed with open graded number 1
stone, appears sufficient to handle all infiltrated water.

18
A separate report published by Rutkowski (1992b) evaluated other test sections in the
state constructed with variable design elements, including USH 18/151 in Dane and Iowa
Counties, USH 14 in Dane County, STH 164 in Waukesha County, STH 50 in Kenosha
County, and STH 29 in Brown County. In 1988, 17 test sections were constructed on USH
18/151 to study the effects of dense and open graded base courses (stabilized and non-
stabilized), several drain systems, and doweled and non-doweled transverse joints. The key
finding from this report was that OGBC appears to provide better pavement performance
than the standard base course system after five years of faulting experience on one project
(USH 14, Dane County) of the drained pavements study. Otherwise, a pavement structure
that places the OGBC directly on the subgrade has resulted in the same pavement
performance as the standard DGBC system. The average faulting of both type of base course
systems was similar after four years of monitoring. The OGBC test section measured a
diminished level of average faulting (0.05 inches) compared to standard DGBC sections
(0.13 inches). There was no apparent benefit to the installation of an edge drain at the
outside edge of the outside shoulder of a DGBC structure, and it was recommended that this
type of edge drain installation be discontinued.
The 1992 report also observed that pavement width may have had an effect on
performance (Rutkowski 1992b). For example, on USH 18/151, Iowa County, pavement
sections were constructed with 14-foot wide driving lanes. The other project pavements used
as the basis for early faulting distress were constructed with 12-foot driving lane slabs.
Based on conclusions from Rutkowski (1992b), the lack of early faulting in 14-foot wide
driving lane pavements can possibly be explained by a "wider slabs theory". The 12-foot
wide slabs constructed in 1983 allowed the outer wheel path to be approximately 3 feet from
the outside edge of the pavement. This is thought to promote faulting (pumping of fines) at
the pavement/base course interface of the transverse joint. The most intense faulting takes
place in the outer lane. The pavements constructed in 1988 had a 14-foot wide outside slab
allowing the shoulder stripe to be placed 2 feet in from the edge of the pavement. The outer
wheel path is then 5 feet from the outside edge of the pavement. It was theorized that this
greater distance to the pavement outer edge at the transverse joint places less stress due to
loading on the outside corner and that the faulting (pumping) mechanism is diminished to a
large degree. This may have resulted in a lower rate of faulting on this pavement
configuration. Based on the this report, the 1988 test sections with dense graded base did not
have the intensity of faulting seen in the test sections of the 1983 pavements at similar age
(Rutkowski 1992b).
Rutkowski (1992) also observed that it was not possible to differentiate between the
provision or absence of dowel load transfer systems and transverse joint sealing systems
(USH 18/151 Iowa and Dane Counties) on the basis of pavement distress index or average
transverse joint faulting. It could not be stated that the provision or absence of dowel load
transfer and transverse joint sealing would be superior. The average faulting values are
extremely low on all test sections. It was not possible to determine a benefit for load transfer
devices after four years of transverse joint fault and pavement distress index monitoring.
There was only a slight difference in average faulting or pavement distress index for test
19
sections constructed with the provision or absence of dowel load transfer devices at
transverse joints for either OGBC, DGBC, or TIC drain systems. The addition of retrofit
edge drains to a dense graded base course pavement structure ground to profile had not
prevented the development of subsequent faulting. Between 75 and 100% of the original
degree of faulting has returned to the pavement transverse joints in four years or less.
Retrofit edge drains have not proven to be an effective short term rehabilitation method. It
was recommended that the use of retrofit edge drains to prevent renewed faulting be
discontinued as a rehabilitation method (Rutkowksi 1992).
A report by Rutkowski et al. (1998) provided a comprehensive background and
evaluation of concrete and asphalt pavement test sections constructed throughout the state,
while a report by Crovetti (1995) addressed the USH 18/151 test sections in Iowa and Dane
Counties. The purpose of the reports was to document performance after the pavement had
been in service for 7 to 10 years. The major conclusions of these reports were that dowels
and asphalt-stabilized OGBC provided the greatest protection against joint faulting, but use
of dowels and asphalt-stabilized OGBC in combination did not provide significantly better
performance than using either of these measures separately. However, both reports
recommended that a 20-year performance of these pavement segments be evaluated,
providing the motivation for this study.
In the report by Rutkowski et al. (1998), PCC and AC pavement test segments
constructed from 1987 to 1991 were listed. Tables 2.2 and 2.3 provide the characteristics for
those segments, where Table 2.2 presents primary PCC projects constructed in 1987 and
1988, and Table 2.3 presents secondary PCC and AC projects constructed in 1988. Primary
projects were designed to compare various formats of positive drainage features, as well as
dowel/non-dowel and sealant design features. Secondary PCC and asphaltic concrete (AC)
segments researched positive drainage concepts, but on a less comprehensive scale.

20
Table 2.2 Primary PCC Projects constructed in 1987 and 1988 (Rutkowski et al. 1998)
Table 2.3 Secondary PCC and AC Projects constructed in 1991 (Rutkowski et al. 1998)

21
A Wisconsin DOT study by Wen and Chen (2007) analyzed the design and
construction factors affecting initial pavement roughness. Initial IRI of 90 concrete
pavements constructed in Wisconsin from 2000 to 2004 were analyzed using multiple
regression methods. The factors considered in this study included concrete pavement slab
thickness, project location, dowel bar placement, joint spacing, base type, and pavement
length. The factors affecting initial pavement roughness were identified. Thicker concrete
slabs result in lower initial pavement roughness than do thinner concrete slabs. Pavements
located in urban areas have higher initial pavement roughness than those in rural areas.
There is no statistically significant difference of initial pavement roughness resulting from
dowel bar placement methods, either dowel baskets or inserted dowel bars. There are no
differences in initial pavement roughness resulting from base types, including CABC,
OGBC, and OGBC2, except that for rural pavements, OGBC2 results in statistically higher
initial pavement roughness than does CABC. Joint spacing is not a statistically significant
factor affecting initial pavement roughness. Longer paving projects in urban areas result in
lower initial pavement roughness.
A Wisconsin DOT study by Crovetti (2006) evaluated alternate pavement designs
targeted at reducing the initial construction costs of concrete pavements without
compromising pavement performance. Test sections were constructed with alternate dowel
materials, reduced dowel placements, variable thickness concrete slabs and alternate surface
and subsurface drainage details. Performance data were collected out to 5 and 7 years after
construction. The study results indicate that fiber reinforced polymer (FRP) composite
dowels may not be a practical alternative to conventional epoxy coated steel dowels due to
their reduced rigidity, which results in lower deflection load transfer capacities at transverse
joints. Ride quality measures also indicate higher IRI values on sections constructed with
FRP composite dowels. Study results for sections constructed with reduced placements of
solid stainless steel dowels also indicate reduced load transfer capacity and increased IRI
values as compared to similarly designed sections incorporating epoxy coated dowels.
Reduced doweling in the driving lane wheel paths also is shown to be detrimental to
performance for most constructed test sections. The performance of sections with reduced
doweling in the passing lane wheel paths indicates that this alternate may be justifiable to
maintain performance trends similar to those exhibited by the driving lane with standard
dowel placements. Performance data from sections constructed with variable slab geometry
and drainage designs indicate that one-way surface and base drainage designs are performing
as well as or better than standard crowned pavements with two-way base drainage. The
drainage capacity of the base layer, constructed with open graded number 1 stone, appears
sufficient to handle all infiltrated water.
2.3 Other Agency Studies
A summary of studies from DOTs other than Wisconsin are provided in Table 2.4. A
brief paragraph summary of each source is provided.

22
Table 2.4 Literature Summary of DOTs other than Wisconsin
Reference
(1)
Key Findings
(2)
Chen et al.,
2008, Texas
DOT
Premature asphalt pavement failure was attributed to disintegration of the
cement-stablized base layer.
Asphalt pavement failure was attributed to two primary factors: 1) a very
coarse gradation of the aggregate used in the cement-stablized layer which
produced a mix prone to segregation during placement; and 2) the cement-
stabilized layer was placed in 2 lifts, which were not well bonded together.
Another contributing factor was the lack of bond between the cement-
stabilized base and the asphalt pavement surface layer.
Rahman et al.,
2008, Kansas
DOT
Key pavement distresses (deformation and roughness) are insensitive to the
subgrade modulus.
Asphalt-stabilized base was used, and it was determined that base layer
thickness has more influence on the total pavement deformation than the
subbase layer.
The influence of subgrade modulus on the slab thickness is insignificant.
Gisi et al.,
2007, Kansas
DOT
Pavement drainage is critical to performance.
Both daylighted and partially daylighted drainage systems of various
configurations can perform as well as a system using a positive drainage
system of pipes and outlets.
Both systems do not have the inherent problems of a pipe system clogging.
Winter freeze condition can affect the outflow of water from the base and
this condition may not be desirable in harsh freezing environments.
Drainable PCC sections with permeable asphalt treated base (PATB) have
performed the best.
Elfino and
Hossain, 2007,
Virginia DOT
Lack of positive drainage along with heavily loaded truck traffic resulted in
premature failure.
Water entering the pavement because of poor joint sealing was trapped in the
open-graded drainage layer, and led to severe faulting, midslab cracks,
pumping, and eventual failure of the pavement.
Sargand et al.,
2006, Ohio
DOT and
FHWA
Multiple base types in Ohio and North Carolina were evaluated including
granular, lean concrete, asphalt treated, cement treated, and permeable
asphalt treated.
Type of base had little impact on subgrade moisture.
The choice of base depends chiefly on three requirements: appropriate
stiffness, sufficient permeability, and good constructability.
Chowdhury and
Hossain, 1999,
Kansas DOT
Three FWD tests per mile are recommended for the network-level
evaluation.
The decrease in the structural number values obtained from the models
developed in this study was about 33% higher than the KDOT design
assumption.
The Bayesian regression models developed are very similar in form to the
classical regression models and yielded statistically similar results when
tested on a different set of pavements. However, the Bayesian regression
models appeared to give slightly better results for some pavements during
testing.

23
Although a TxDOT study by Chen et al. (2008) evaluated asphalt pavement
performance, it did highlight the degradation of a cement-stablized base treatment and the
effect on pavement performance. After only 2 months in service, the frontage road of U.S.
290 in Houston, Texas, developed a series of depressions that caused a very poor ride. The
main cause of the premature failure was attributed to disintegration of the cement treated
base (CTB) layer. This was attributed to two primary factors: 1) a very coarse gradation of
the aggregate used in the CTB layer which produced a mix prone to segregation during
placement; and 2) the CTB layer was placed in 2 lifts, which were not well bonded together.
Another contributing factor was the lack of bond between the CTB and the hot mix asphalt
(HMA) surface layer. Secondary factors include high air voids in the HMA layer and low
HMA layer thickness. The material, when prepared carefully in the lab at the design cement
content, passed the strength requirement of 2.07 MPa. But this coarse mix appears to have
been difficult to place correctly in the field. The coarsely graded aggregate used on this
project appears to be prone to segregation, either during placement or compaction. The
ground penetration radar results (with confirmation by core samples) indicated that most of
the problems were at the bottom of the upper CTB lift. The CTB was placed in 2 lifts and
very poor condition was found between the CTB layers. This problem was coupled with a
thin, porous, and poorly bonded HMA layer that permitted moisture to enter the CTB layer.
Similar failures have also been reported recently on other CTB projects in Houston.
A Kansas DOT study by Rahman et al. (2008) evaluated the effect of variation of the
subgrade resilient moduli on the pavement design using the MEPDG analysis. Subgrade
modulus values were obtained from three test sections on two routes in Kansas with an
Intelligent Compaction (IC) roller and from the deflection tests using a Falling Weight
Deflectometer (FWD). The deflection data was used to backcalculate the subgrade moduli
using an elastic layer analysis backcalculation program and the Boussinesq‟s equation. The
pavement design analysis for various subgrade moduli was done with the MEPDG v1.0
software. The results show that the predicted total pavement deformation and roughness are
sensitive to the subgrade modulus for flexible pavements. For JPCP, the key distresses are
insensitive to the subgrade modulus. Asphalt base thickness has more influence on the total
pavement deformation than the foundation layer. However, truck traffic plays an even more
significant role in controlling this distress. The influence of subgrade modulus on the slab
thickness in the JPCP design is insignificant. The “target” subgrade modulus for intelligent
compaction control can be derived well before construction based on the soil type and asphalt
base thickness and using the M-EPDG analysis. Achievement of this modulus in the field
will lead to a reliable pavement structure for a given design period.
A TRB proceedings paper by Gisi et al. (2007) discusses KDOT experience with
drainage of six in-service concrete projects. The study found that pavement drainage is
critical to performance. Since 1988, the Kansas Department of Transportation (KDOT) has
been using a drainable base layer as an option for the PCC pavements. However, the
majority of PCC pavements in Kansas do not incorporate a drainable base because the traffic
volume is low to medium. Four of these projects were the experimental sections chosen from
the Kansas SPS-2 project located on I-70 and incorporate a permeable asphalt treated base
(PATB) layer with edge drains. The other two projects, US-50 and US-400, had daylighted
drainable base layers. These projects also incorporated some alternative drainage designs

24
and instrumentation for drainage monitoring. Both daylighted and partially daylighted
drainage systems of various configurations can perform as well as a system using a positive
drainage system of pipes and outlets. Both systems do not have the inherent problems of a
pipe system clogging. However, the winter freeze condition can affect the outflow of water
from the base and this condition may not be desirable in harsh freezing environments. On
the SPS-2 project, the drainable PCC sections with permeable asphalt treated base (PATB)
have performed the best. These sections were built smoother and remained so after 13 years
of service. Kansas experience has also reinforced the need for an acceptable separator layer
in the drainable PCC design.
In a Virginia DOT study by Elfino and Hossain (2007), field and laboratory forensic
investigations were used to identify the failure mechanism of a jointed plain concrete
pavement with a subsurface drainage system in Virginia. Similar to many states‟ practice,
this subsurface drainage system consists of open-graded drainage layer and edge drains to
provide positive drainage for the pavement. The investigation included a review of
construction practices and pavement performance records, a visual distress survey,
nondestructive testing using a falling weight deflectometer, roughness measurements using a
profiler, coring and boring for materials testing, observation wells, subgrade soil
classification, mineralogy, determination of concrete compressive strength, edge drain
camera inspection, and slab removal. On the basis of the investigation, it was concluded that
lack of positive drainage along with heavily loaded truck traffic resulted in premature failure.
The water entering the pavement because of poor joint sealing was trapped in the open-
graded drainage layer; this led to severe faulting, midslab cracks, pumping, and eventual
failure of the pavement.
An Ohio DOT study by Sargand et al. (2006) investigated how base materials should
be properly selected for specific types of pavement, not only considering the performance of
individual layers but also how they interact in the total pavement structure. Base types
considered in this study included granular (GB), lean concrete (LCB), asphalt treated (ATB),
cement treated (CTB), and permeable asphalt treated (PATB) bases as constructed under
both asphalt and concrete pavements. The LTPP Seasonal Monitor Program (SMP) sites
investigated for this report included four SMP sections in the North Carolina SPS-2
experiment on US52 and thirteen SMP sections in the SPS-1 and SPS-2 experiments on the
Ohio SHRP Test Road on US23. The NC site contained two GB and two LCB sections, and
the OH site contained eight GB, one ATB, two PATB, and two LCB sections. The NC sites
are located in a wet-no-freeze zone and OH sites are located in a wet-freeze zone.
Environmental data were collected via seasonal monitors and time domain reflectometry.
The effects of service were measured by conducting surface profiles and FWD
measurements. It was found that the type of base had little impact on subgrade moisture.
The choice of base depends chiefly on three requirements: appropriate stiffness, sufficient
permeability, and good constructability. Guidelines for the selection of base under flexible
and rigid pavements were developed.
An earlier KDOT report by Chowdhury and Hossain (1999) developed a pavement
rating attribute, known as the Pavement Structural Evaluation (PSE), using FWD tests and
network-level distress surveys. These ratings are subjective and based on the condition of
the pavement as indicated by the visual distresses and maintenance histories and the ability of

25
the section to provide an adequate surface for the prevailing traffic. PSE is expected to be an
indicator of the structural deficiency of the pavement sections. However, since KDOT does
not collect any deflection data at the network level, the PSE computation process does not
directly take into account any structural evaluation. The regression models proposed in this
study predict the decrease in PSE values by taking into account the FWD data, age,
thickness, and distress levels of pavements, and very closely approximate the current PSE
ratings obtained at the district level. FWD data on approximately 20% of the KDOT network
is needed for network level structural evaluation. This translates into 750 lane-miles (1207
lane-km) of FWD testing per year. Three FWD tests per mile are recommended for the
network-level evaluation. This testing would also be necessary for using/updating the
models developed in this study. The decrease in the structural number values obtained from
the models developed in this study was about 33% higher than the KDOT design assumption.
A parallel study at Kansas State University used the Bayesian Regression methodology
developed by the Canadian Strategic Highway Research Program. The Bayesian regression
models developed are very similar in form to the classical regression models and yielded
statistically similar results when tested on a different set of pavements. However, the
Bayesian regression models appeared to give slightly better results for some pavements
during testing.
2.4 National and Other Studies
A summary of national studies, including FHWA, FAA, and NCHRP, along with
studies from non-agency specific studies are provided in Table 2.5.

26
Table 2.5 Literature Summary of National and Other Studies
Reference
(1)
Key Findings
(2)
Hall and Crovetti,
2007, NCHRP The presence of subsurface pavement drainage could not be readily
identified as having a positive impact on pavement performance.
Deflection response, roughness, rutting, faulting, and cracking were
found to be influenced by the stiffness, rather than the drainability.
Best-performing pavements were those with bases that were neither
too weak (non-stabilized) nor too stiff (lean concrete).
Prabhu et al., 2007 Principal stresses that develop between the concrete panel-dowel
interface were measured using 3-D finite element models.
When steel dowels are misaligned, more stress is developed.
Mallela et al.,
2007, FAA Concrete pavements constructed over certain dense-graded bases have
a higher risk of early-age, uncontrolled cracking.
Buch et al., 2006,
NCHRP The performance of key design elements were investigated including
slab thickness, base type, drainage, flexural strength, and slab width.
Base type was the most critical design factor affecting performance in
terms of cracking and IRI.
Pavement sections with a permeable asphalt-treated base and in-
pavement drainage performed better than those with a dense-graded
aggregate base or a lean concrete base.
PCC slab thickness also played an important role in improving the
cracking performance of the pavements.
PCC flexural strength and slab width have only marginal effects on
performance at this time.
Jiang and Darter,
2005, FHWA No SPS-2 projects were built on certain subgrade types and in some
climates.
Some SPS-2 sites had construction deviations, and significant
materials data and traffic data are missing from other sites or sections.
Khazanovich and
Gotlif, 2003,
FHWA
Load transfer efficiency (LTE) indexes and joint stiffnesses were
calculated.
LTE depends on FWD load plate position and testing time.
It is recommended that FWD LTE testing be conducted in the early
morning in cool weather to provide realistic estimation of LTE.
LTE of CRCP cracks was higher than LTE of joint in JPCP.
LTE of doweled joints was higher than non-doweled joints.
Non-doweled sections with a high level of LTE are less likely to
develop significant faulting than sections with low LTE.
LTE from leave and approach side deflection testing data was found
to be statistically different for a large number of JPCP sections.
Davids et al., 2003 Finite element models in 3-D were created to understand stress
interactions.
Dowel locking and slab-base shear transfer can significantly affect the
stresses in slabs subjected to both uniform shrinkage and thermal
gradients.
Joint load transfer is greatly reduced by dowel looseness.
Transverse joint mislocation can significantly reduce peak dowel
shears, but has relatively little effect on total load transferred across
the joint.

27
In a comprehensive NCHRP study by Hall and Crovetti (2007), LTPP SPS-1 and
SPS-2 pavement sections were evaluated for load deflection and flow testing of pavement
drainage systems. The study did not identify any aspect of the behavior or performance of
the HMA and PCC pavement structures that could have been improved by the presence of
subsurface pavement drainage. Instead, the measures of pavement behavior and performance
analyzed for these pavements - namely, deflection response, roughness, rutting, faulting, and
cracking - were found to be influenced by the stiffness, rather than the drainability, of the
base layers (Hall and Crovetti 2007). Overall, the best-performing PCC pavements in the
SPS-2 experiments were those with bases that were neither too weak (untreated aggregate)
nor too stiff (lean concrete). These include the sections with drained permeable asphalt-
treated base, but also the sections with undrained HMA base and cement-aggregate-mixture
base.
A study by Prabhu et al. (2007) investigated the effects of dowel misalignment on the
joint opening behavior and distress in concrete pavement joints. A key finding of the study
was the ability to measure and identify principal stresses that develop between the concrete
panel-dowel interface when the steel dowels are misaligned in transverse joints, suggesting
that steel dowels carry considerable load transfer between adjacent panels. Three-
dimensional (3-D) finite element models were created for computing the complex stress
states and resulting damage in concrete pavement joints with misaligned dowels. The
concrete pavement was modeled using a damage–plasticity material model, which uses
concepts of damage–plasticity formulation in compression and cracking combined with
damage elasticity in tension. The longitudinal bond between the steel dowel and the concrete
was modeled in two parts. First, the longitudinal bond resulting from chemical adhesion,
mechanical interlock, and static friction (in the aligned state) is modeled by means of spring
elements. The nonlinear force–deformation relationship for the spring elements is derived
from specific experimental results. Second, the longitudinal bond resulting from transverse
interaction between steel dowels and the concrete pavement is modeled by surface-to-surface
contact interaction elements and associated friction models. The 3-D finite element models
are validated by the results of experimental investigations. These validated models provide
significant insight into the 3-D stress states and principal stresses that develop in concrete
pavement joints with misaligned dowels. They are used to evaluate analytically the effects of
misalignment type, magnitude, uniformity, and distribution on the 3-D stress states and
resulting damage in concrete pavements.
Mallela et al. (2007) reports that under certain circumstances concrete pavements
constructed over certain types of bases have a higher risk of early-age, uncontrolled cracking.
In some cases, this has resulted in the removal and replacement of up to 5% to 7% of the total
number of slabs paved on a project. An investigation of nearly two dozen airfield pavement
sections in the United States identified several plausible factors that act either independently
or in concert with other factors and lead to this phenomenon. This study attempted to explain
the interaction between factors that trigger slab movements (triggers) and key design,
material, and construction factors (variants) that aggravate the impact of these movements on
early cracking risk. On the basis of this study, guidelines for design, materials selection, and
construction of rigid pavements on stabilized and drainable bases were developed to mitigate
the impact of various factors on the early-age cracking phenomenon. Revisions were

28
suggested to the FAA‟s specifications for lean concrete, cement-treated, and hot-mix asphalt
bases. New specifications were developed for permeable bases that balance stability with
drainability.
The relative effects of various design and site factors on the performance of JPCP
were researched by Buch et al. (2006) in NCHRP Project 20-50 (10&16), “LTPP Data
Analysis: Influence of Design and Construction Features on the Response and Performance
of New Flexible and Rigid Pavements”. The data used in this study were primarily drawn
from Release 17 of DataPave. An SPS-2 experiment was designed to investigate the effects
of slab thickness, base type, drainage, flexural strength, and slab width on the performance of
JPCP. On the basis of the statistical analysis of 167 test sections, ranging in age from 5 to 12
years, it was concluded that base type was the most critical design factor affecting
performance in terms of cracking and roughness as measured by the IRI. Pavement sections
with a permeable asphalt-treated base and in-pavement drainage performed better than those
with a dense-graded aggregate base or a lean concrete base. PCC slab thickness also played
an important role in improving the cracking performance of the pavements. PCC flexural
strength and slab width have only marginal effects on performance at this time.
An FHWA report by Jiang and Darter (2005) documented the first comprehensive
review and evaluation of the SPS-2 experiment, "Strategic Study of Structural Factors for
Jointed Plain Concrete Pavements (JPCP)". The main objective of this experiment is to
determine the relative influence and long-term effectiveness of JPCP design features
(including slab thickness, portland cement concrete flexural strength, base type and drainage,
and slab width) and site conditions (traffic, subgrade type, climate) on performance. Thirteen
SPS-2 projects have been constructed with one additional site under construction. At each
site, there are 12 core sections plus various numbers of supplemental sections. The data
availability and completeness for the SPS-2 experiment are good overall. A high percentage
of the SPS-2 data are at level E--greater than 82% for all data types, and greater than 99% for
many. However, a significant amount of data are still missing, especially traffic, distress and
faulting surveys, and key materials testing data. These deficiencies need to be addressed
before a comprehensive analysis of the SPS-2 experiment is conducted. Required
experimental pavement design factors and site conditions were compared with the actual
constructed values. Most SPS-2 sections follow the experiment design for the large majority
of the design factors. When comparing designed versus constructed, eight SPS-2 projects
can be characterized as good to excellent, four projects are considered poor to fair, and one
new SPS-2 project does not yet have enough data in the IMS database to be evaluated. The
evaluation has shown that several problems may limit the results that can be obtained from
the SPS-2 experiments if not rectified. Specifically, no SPS-2 projects were built on certain
subgrade types and in some climates. Some SPS-2 sites had construction deviations, and
significant materials data and traffic data are missing from other sites or sections. One site
has excessive early cracking that will limit its usefulness. However, even though the SPS-2
sections are relatively young (oldest project is 7.5 years) and a large majority show no or
little distress, some interesting and important early trends have already been identified that
will be very useful to the design and construction of JPCP. As time and traffic loadings
accumulate, much more valuable performance data will be obtained. The Federal Highway
Administration is conducting a concerted effort to obtain missing data. Recommendations for

29
future analyses are provided in the last chapter of this report. Valuable information will be
obtained from this experiment if these studies are carried out.
A paper by Davids et al. (2003) describes computer software, EverFE2.2, that can be
used for 3-D finite element modeling. The software has the ability to model multiple-tied
slabs or shoulders, model dowel misalignment or mislocation, treat nonlinear thermal or
shrinkage gradients, and simulate nonlinear horizontal shear stress transfer between the slabs
and base. The results of two parametric studies are reported in this paper. The first study
considers the effects of dowel locking and slab-base shear transfer and demonstrates that
these factors can significantly affect the stresses in slabs subjected to both uniform shrinkage
and thermal gradients. The second study examines transverse joint mislocation and dowel
looseness on joint load transfer. As expected, joint load transfer is greatly reduced by dowel
looseness. However, while transverse joint mislocation can significantly reduce peak dowel
shears, it has relatively little effect on total load transferred across the joint for the models
considered.
An ERES Consultants study for the FHWA evaluated load transfer efficiency (LTE)
of cracks and joints for rigid pavements included in the Long-Term Pavement Performance
(LTPP) program (Khazanovich and Gotlif, 2003). This study presents the first systematic
analysis of the deflection data collected under the LTPP program related to LTE.
Representative LTE indexes and joint stiffnesses were calculated for all General Pavement
Studies (GPS), Special Pavement Studies (SPS), and Seasonal Monitoring Program (SMP)
rigid test sections. Data tables that include computed parameters were developed for
inclusion in the LTPP Information Management System (IMS). Trend analysis was
performed to evaluate the effect of design features and site conditions on LTE. One key
finding was LTE is a complex parameter, which depends on many factors, including falling
weight deflectometer (FWD) load plate position, and testing time, where FWD LTE testing
must be conducted in the early morning in cool weather to provide realistic estimation of
LTE. Another finding was that LTE of continuously reinforced concrete pavements (CRCP)
cracks was found to be higher than LTE of joint in jointed concrete pavements (JCP). Also,
LTE of doweled joints was found to be higher than LTE of nondoweled joints. Nondoweled
sections with a high level of LTE are less likely to develop significant faulting than sections
with low LTE. Finally, LTE from leave and approach side deflection testing data was found
to be statistically different for a large number of JCP sections.
2.5 FWD Publications
FWD testing is an integral component of this research study. To understand
limitations and lessons learned from previous field testing, several literature sources were
reviewed. A brief review of three relevant sources are cited.
A synthesis by Alavi et al. (2008) reported on the state of the practice of FWD usage
as it involves state DOTs using these devices to measure pavement deflections in response to
a stationary dynamic load, similar to a passing wheel load. The data obtained are used to
evaluate the structural capacity of pavements for research, design, rehabilitation, and
pavement management practices. It is anticipated that this synthesis will provide useful

30
information to support guidelines, advancing the state of the practice for state DOTs and
other FWD users, as well as equipment manufacturers and others involved in pavement
research, design, rehabilitation, and management. Based on a survey conducted for this
report, 45 state highway agencies (SHAs) reported using 82 FWDs, produced by 3 different
manufacturers. The importance of FWDs among SHAs appears to be reflected in the survey
results, as it was noted that SHAs conduct FWD tests on up to 24 100 lane-km (15,000 lane
miles) annually.
A publication by the FHWA (1997) describes that FWD load deflection-time data can
be used to measure the dissipated work during the loading and unloading of the pavement
structure from the FWD impact load. An important property of materials that defines the
viscoelastic and inelastic characteristics of materials is the dissipated work or dissipated
energy of the material. Dissipated energy has been used in the asphalt concrete fatigue area
for many years by some agencies. This dissipated work should be related to the occurrence
of selected surface distresses, especially for asphalt concrete-surfaced pavements. The
deflection-time history data collected within the LTPP program represent an invaluable data
source and critical data element that has yet to be thoroughly investigated and used to its full
potential in pavement diagnostic studies. A limited study was undertaken to determine if
there is any relationship between the dissipated work as measured with the FWD and levels
of pavement distress. The study also shows some of the different parameters that can be used
from the deflection-time data and the benefit of using these data for pavement diagnostic
studies and pavement classifications.
A publication by the FHWA cautions that the FWD must be properly calibrated
(FHWA 2002). To make the best possible decisions about where and when to conduct
pavement rehabilitation work, State departments of transportation (DOTs) need extensive
data on the structural condition of pavement. To measure the structural condition of
pavement, most pavement engineers rely on FWD technology. FWDs "thump" the pavement
and record information about its structure and integrity. But like all sophisticated tools, the
FWD must be properly calibrated. If it is not, measurements will be inaccurate. Inaccuracy
wastes precious budget dollars.
2.6 Summary
A comprehensive literature review was conducted to identify factors affecting PCC
pavement performance. Table 2.6 summarizes primary findings by design element.

31
Table 2.6 Summary of Literature for PCC Pavement Performance by Design Element
Design
Element
(1)
Primary Findings
(2)
Base Type Substitution of OGBC for DGBC adds approximately $55,000 to $110,000
per mile to the structural cost (1993 cost).
There are no differences in initial pavement roughness resulting from base
types, including DGBC, OGBC, and OGBC2, except that for rural pavements,
OGBC2 results in higher initial pavement roughness than DGBC.
Best-performing pavements were those with bases that were neither too weak
(non-stabilized) nor too stiff (lean concrete).
Concrete pavements constructed over certain dense-graded bases have a
higher risk of early-age, uncontrolled cracking.
Drainage Drainage capacity of the base layer, constructed with open graded number 1
stone, appears sufficient to handle all infiltrated water.
Both daylighted and partially daylighted drainage systems can perform as
well as a system using a positive drainage system of pipes and outlets.
Drainable PCC sections with ASOG have performed the best.
The presence of subsurface pavement drainage could not be readily identified
as having a positive impact on pavement performance.
Pavement sections with a permeable asphalt-treated base and in-pavement
drainage performed better than those with a dense-graded aggregate base or a
lean concrete base.
Dowels Dowels and ASOG provided the greatest protection against joint faulting.
Use of dowels and asphalt-stabilized OGBC in combination did not provide
significantly better performance than using either of these measures
separately.
Strength Key pavement distresses (deformation and roughness) are insensitive to the
subgrade modulus.
When ASOG base was used it was determined that base layer thickness has
more influence on the total pavement deformation than the subbase layer.
Deflection Deflection response, roughness, rutting, faulting, and cracking were found to
be influenced by the stiffness, rather than the drainability.
LTE depends on FWD load plate position and testing time.
LTE of doweled joints was higher than non-doweled joints.
Non-doweled sections with a high level of LTE are less likely to develop
significant faulting than sections with low LTE.
LTE from leave and approach side deflection testing data was found to be
statistically different for a large number of JPCP sections.
Sealant Water entering the pavement because of poor joint sealing was trapped in the
open-graded drainage layer, and led to severe faulting, mid-slab cracks,
pumping, and eventual failure of the pavement.

32
CHAPTER 3 EXPERIMENTAL DESIGN
3.1 Introduction
A field experiment was designed to collect and analyze data from the 17 USH 18/151
test sections, 4 STH 29 test sections, and 4 USH 151 test sections. This data allowed a
comparison of unique features of each section to determine effects between subgrade
support, drainability, load transfer, joint seal, and overall performance.
The condition of each test location was documented by visual surveys in November
2008 and April 2009. County highway departments were also contacted to understand the
current pavement condition and whether any pavement rehabilitation was planned. It was
learned that USH 14 Dane County had been overlayed with hot-mix asphalt during the 2008
construction season. Also, it was learned that USH 18/151 test sections were planned for a
dowel-bar retrofit in the 2009 construction season, thus, field research testing of these
sections was scheduled prior to that project. Table 3.1 summarizes the condition of the three
project test locations. Figure 3.1 illustrates a field survey of USH 18/151 in April 2009.
Table 3.1 Condition of Pavement Test Sections prior to Research Testing
Project Location
(1)
Test
Sections
(2)
Lane Direction
(3)
Condition
(3)
USH 18/151 Iowa and
Dane Counties
17 Eastbound, 14 sections
Westbound, 3 sections
Westbound dowel-bar
retrofit in 2004;
Eastbound dowel-bar
retrofit in summer 2009.
STH 29 Brown County 4 Eastbound Original construction
USH 151 Columbia and
Dane Counties
4 Westbound Original construction
Figure 3.1 Field Verification of Test Sections on Eastbound USH 18/151

33
3.2 USH 18/151 Test Sections
The USH 18/151 test sections have multiple levels of individual factors, as illustrated
in Table 3.2. A total of 17 sections were constructed with 7 unique design factors across
Iowa and Dane County. In the bottom row of Table 3.2 are the total number of levels
associated with each primary factor. A factorial experiment to isolate on each unique
combination of factors would have required 256 test sections (2 x 4 x 2 x 1 x 4 x 2 x 2 =
256). Obviously, a full factorial design would not be feasible in highway construction
projects. Since 17 sections were constructed with 7 unique factors, what was created 20
years ago was largely a fold-over design, where combinations of factors were simultaneously
changed to reduce the overall number of combinations. Typical cross sections are illustrated
in Appendix B.
Table 3.2 USH 18/151 Test Section Details
Test
Section
Base
Thickness,
inches
Base
Type
Subbase
Thickness,
inches
Subbase
Type
Drain
Design
Doweled
Transverse
Joints
Sealed
Transverse
Joints
1 4 NS 4 DGBC PAD No Yes
2 4 NS 4 DGBC PAD No No
3 4 CS 4 DGBC PAD No Yes
4 4 CS 4 DGBC PAD No No
5 4 AS 4 DGBC PAD No Yes
6 4 AS 4 DGBC PAD No No
7 -- -- 6 DGBC TIC No No
7a -- -- 6 DGBC TIC No No
8 -- -- 6 DGBC None No Yes
9 -- -- 6 DGBC None No No
10 -- -- 6 DGBC TIC Yes No
11 4 CS 4 DGBC PED Yes No
12 4 AS 4 DGBC PED Yes No
13 4 NS 4 DGBC PED Yes No
14 -- -- 6 DGBC None Yes No
15 -- -- 6 DGBC None Yes Yes
16 6 LCBC -- -- None Yes No
LEVELS 2 4 2 1 4 2 2
Pavement thickness all sections = 10 inches;
NS, Non-Stabilized Open Graded Base Course;
CS, Cement-Stabilized Open Graded Base Course;
AS, Asphalt-Stabilized Open Graded Base Course;
LCBC, Lean Concrete Base Course;
DGBC, Dense Graded SubBase Course;
PAD, Pipe/Aggregate Longitudinal Drains;
TIC, Transverse InterChannel Transverse Joint Drains;
PED, Wrapped Trench with 4‟ Pipe Longitudinal Edge Drain;
None, No Edge Drains.

34
3.3 STH 29 and USH 151 Test Sections
Test sections on STH 29 in Brown County and USH 151 in Columbia County have a
more simplified factorial design than USH 18/151. Four test sections to evaluate dowel/non-
dowel performance, and sealed and unsealed joints, were constructed on STH 29 in Brown
County. Constructed in 1988, this pavement cross-section consists of a 10-inch JPCP over a
4-inch permeable aggregate base and a 4-inch aggregate subbase. The joints are non-
doweled in two test sections and doweled in the other two sections. Joints are sealed and
unsealed within each doweled and non-doweled sections.
Constructed in 1991, the all-doweled USH 151 Columbia County project has 10-inch
JPCP over 5 unique bases: asphalt stabilized, cement stabilized, non-stabilized, dense graded,
and New Jersey graded. Asphalt concrete sections were also included in this project.
Typical cross sections for STH 29 and USH 151 are illustrated in Appendix B.
3.4 Data Overlay
The specific location of each test section was identified with the traditional Reference
Point (RP) system. As-built construction locations and collected performance data for each
segment were overlaid on single project maps using MSN Maps Live™. Five data sets were
overlaid on each project map, as listed in Table 3.3. These data sets include: (1) as-built test
section end points BROWN, (2) WisDOT distress and profile data collected prior to field
testing BLUE, (3) Reference Points for each Sequence Number RED, (4) the 0.1-mile
WisDOT PDI location that is typically 0.3 to 0.4 miles from a Reference Point YELLOW,
and (5) the proposed 0.1-mile test Research PDI location GREEN where Falling Weight
Deflectometer (FWD) and permeability testing were to occur in summer 2009 that is a
variable distance from the butt joint in the direction of traffic. During field testing, the
location of the 0.1-mile Research PDI segment was chosen using the beginning location of
FWD test sites then projecting ahead 528 feet.
Table 3.3 Data Sets overlaid on Maps
Color
(1)
Data Set
(2)
Notes
(3)
BROWN Construction as-built
sections
Construction stationing was used to identify
paving butt joints (end points)
BLUE WisDOT distress and
profile data
Each project was measured using the Pathway
Van in November 2008 or April 2009.
RED Reference Points for each
Sequence Number
The endpoints for a section of pavement where
performance is measured.
YELLOW WisDOT PDI The 528-foot segement where performance
distresses and roughness are measured. This is
located 0.3 to 0.4 miles from a starting Reference
Point, such as an intersection.
GREEN Research PDI A 528-foot segment of pavement where the
performance of the test section was measured.
This is located at the start of FWD testing to 528
feet ahead in the direction of traffic.

35
Figures 3.2 through 3.6 provide the overlay maps for each project for USH 18/151,
STH 29/32, and USH 151. Each of these maps has the overall project length, along with the
5 data sets. Circle symbols designate end points of each data set feature.
Figures 3.2 through 3.4 illustrate USH 18/151 in Iowa and Dane Counties. These
figures indicate a disagreeement between the construction butt joints (Contractor) and RP
locations. Many of the construction joints were found between intersections, while the RP
descriptors generally originated and terminated at intersections.
Figure 3.2 Test Sections for USH 18/151 in Iowa County

36
Figure 3.3 Test Sections for USH 18/151 in Dane County
Figure 3.4 Test Sections for USH 18/151 Westbound in Iowa County

37
In Figure 3.5, the STH 29/32 project indicates a general agreement between the
construction butt joints and the RP and Sequence Number termini. Figure 3.6 illustrates the
USH 151 project in Columbia and Dane Counties.
Figure 3.5 Test Sections on STH 29/32 in Brown County

38
Figure 3.6 Test Sections for USH 151 Dane and Columbia Counties
These overlay maps indicated that the existing RP and Sequence Number system did
not align with the physical test sections. In an attempt to overcome the disagreement, a series
of tables were used to adjust the RP with the actual as-built sections. The Research PDI
location was treated as the contolling location for the adjustment, since these 0.1-mile
segments were to be used to conduct FWD testing and water permeability testing. Later,
during field testing, the Research PDI locations were adjusted for traffic control and safety
concerns. Adjustment tables are provided in Appendix A.

39
CHAPTER 4 DATA COLLECTION
4.1 Introduction
Field data were collected in multiple steps as listed in Table 4.1. Pavement
performance data were collected by both WisDOT and the research team. In addition, the
reserach team collected field FWD and permeability test data. Traffic control was contracted
and provided by the highway departments from Brown, Columbia, and Iowa Counties. All
traffic control charges were included in the research budget. The 511 System for lane
closures was implemented according the WisDOT policy. There were multiple types of data
collected and assembled for data analysis, with following sections detailing features of each
procedure.
Table 4.1 Field Test Procedures and Remarks
Test
Sequence
Remarks
1. IRI Measured with WisDOT performance van.
Scheduled in advance of other field testing.
2. PDI Initially raw data were collected and measured with WisDOT
performance van, but was omitted due to resource constraints and
duplication of effort.
Manual field measurements were conducted by UW-Platteville faculty
and engineering students.
3. FWD WisDOT Kuab 2-m Falling Weight Deflectometer.
Nine test locations per section.
Three sites per test section (joint, mid-panel, and corner).
4. Core One full-depth, 4-inch diameter core in each OGBC test section.
Top, mid-depth, and bottom temperature recorded to compensate for
warping.
5. Drainage Measured using core hole and flow meter.
Flow rate and time from core hole to outlet recorded.
6. Patch Patched by county crews.
4.2 IRI and Pavement Condition Survey
Both automated and manual pavement condition surveys were conducted for each test
section. First, a semi-automated electronic survey and IRI measurements were collected
using the WisDOT performance van prior to FWD and permeability testing. This was
intended to anticipate actual performance measures, provide a pilot data analysis, and make
any necessary adjustments to field testing. Due to resource constraints and duplicate effort, it
was decided that only IRI and electronic faulting data be furnished by WisDOT to the
research team. PDI data would have required additional time and effort, and since a manual
condition survey was planned by the research team, the semi-automated PDI data were
omitted. Rutting and faulting measurements were retained.

40
Pavement condition was manually measured for PDI. Trained UW-Platteville civil
engineering students collected the manual data under faculty supervision. Prior to project
data collection, the students completed a course in pavement design and pavement
rehabilitation at UW-Platteville, and conducted practice measurements on actual concrete
segments. Figures 4.1 and 4.2 illustrate pavement condition measurement during the study.
Figure 4.1 Transverse Joint Fault Measurement on USH 18/151
Figure 4.2 Longitudinal Fault Measurement on USH 18/151

41
4.3 Falling Weight Deflectometer
Falling Weight Deflectometer (FWD) testing was performed using WisDOT‟s Kuab
2-m FWD. FWD testing was utilized to provided fundamental measures of transverse joint
load transfer capacity, subgrade strength and uniformity of slab support. A traditional two-
layer analysis procedure, using FWD deflections measured at various load levels, was used
to determine the in-place stiffness of the constructed pavement (all layers combined) and the
dynamic k value of the subgrade. Effective PCC slab thicknesses were estimated based on
assumed pavement modulii values based on the PCC pavement deflection analysis procedure
outlined in the 1998 supplement to the AASHTO guide. Namely, an AREA-based solution
was employed to estimate the pavement‟s radius of relative stiffness, with corrections applied
to account for in-place slab dimensions (length and width). Figure 4.3 illustrates FWD
testing on the USH 18/151 project.
Figure 4.3 FWD Testing on USH 18/151 at Barneveld Interchange
Longitudinal test locations varied by project, and were at least several hundred feet
from transitions in base type or PCC cross-section. Readings were recorded at the joint, mid-
slab, and at the corner. A benefit of repeating this testing on the same segments was to
measure the relative change in subgrade reaction and modulus over time; however, based
upon a review of data from previous studies, little change was expected. It is commonly
believed that load transfer values calculated from deflections measured when the FWD load
plate is on the leave side of the joint tend to be lower than load transfer values calculated
from deflections measured when the FWD load plate is on the approach side of the joint
(Khazanovich and Gotlif 2003). The rationale for this belief is that support under the slab on
the leave side of the joint is expected to be weaker, according to the classical description of
the mechanism of pumping at transverse joints.

42
A key factor in back-calculating subgrade reaction with the FWD is pavement
temperature. It has been well documented that curling and warping occur due to changes in
PCC pavement temperature, thus, temperature was measured at the surface, at or near the
middepth, and near the bottom of the PCC layer. Then, the readings were factored during the
data analysis to screen their relative effect. Fortunately, the weather conditions were ideal
for FWD testing on each of the three projects with morning overcast and little temperature
change.
4.4 Permeability and Drainage
One of the key features of permeable PCC pavement base layers is their ability to
quickly drain moisture away from the structural section. The ease with which water flows
through the permeable base, commonly measured as the permeability or hydraulic
conductivity, k, is a function of the gradation and density of the drainage layer. In-place
permeability may be estimated by transfer functions or quantified by direct measurements of
infiltration capacity. For this study, direct field measurements were made to establish the
infiltration capacity of the drainage layers. This value was then used to estimate the in-place
permeability value, k, using direct measures of flow gradients and an assumed geometry of
the subsurface flow (see Figures 4.4 and 4.5). Because the calculated k can be changed
significantly with variations in the assumed width of the flow plume (Figure 4.5), this
approach is better used as a relative indicator of the subsurface drainage capacity, i.e., as the
in-place permeability increases the infiltration capacity should also increase. The overall
quality of the drainage system may also be assessed by visual observations of outflow waters
exiting the transverse drains. During steady-state infiltrations, a rapid and sustained outflow
confirms the hydraulic continuity of a well-functioning drainage system. When no inflow or
outflow occurs, on the other hand, this indicates a potential malfunctioning of the
subdrainage system due to a clogged drainage layer and/or clogged longitudinal/transverse
pipe systems.
Figure 4.4 Measurement of In-Place Permeability

43
Figure 4.5 Illustration of plume of water from core hole to pavement edge
Permeability and drainage capacity were measured within each of the OGBC test
sections. Full-depth cores were cut through the PCC pavement, then water from a county
highway truck was pumped into the drainage layer to allow subsurface flow towards the
longitudinal collector edgedrain pipe and ultimately out the transverse edgedrain outlet.
(FWD testing preceded water permeability testing so that the flow of water in the pavement
base did not alter the FWD reading). A flow meter measured and displayed the rate of water
inflow, in gallons per minute, and the total volume of infiltrated water, in gallons. Inflow
rates ranged from 0 to 8 gallons per minute. The permeability of the drainage layer, in feet
per day, was then estimated using standard permeability and flow calculations. Target
permeability from the FDM is recommended at 1,000 feet per day (WisDOT 2008). In
several test sections, no water flow was observed after 100 gallons of water were added to
the corehole. If water was observed at the outlet, tracer dye was added at the corehole to then
measure the time to flow through the drainage system. Figures 4.6 through 4.12 capture
permeability testing.

44
Figure 4.6 Drilling Corehole and Recording Elevations (USH 18/151)
Figure 4.7 Water Inflow at Corehole and Recording Rate and Total Volume (USH
18/151)

45
Figure 4.8 Water Flow Meter (USH 18/151)
Figure 4.9 Recording Elevation at Outflow Drainpipe (USH 18/151)

46
Figure 4.10 Flow Meter measuring 97.94 Gallons of Water into Corehole (STH 29)
Figure 4.11 Water flowing out Edgedrain Pipe and Apron Endwall (STH 29)

47
Figure 4.12 Water with Tracer Dye flowing out Edgedrain Pipe and Apron Endwall
(STH 29)

48
CHAPTER 5 PERFORMANCE ANALYSIS
5.1 Introduction
A comprehensive analysis was conducted on the collected data to understand
relationships among key variables in PCC pavement performance and to provide guidelines
for modifications to pavement design inputs. The data analysis focused on understanding
responses in pavement performance to design variables.
5.2 Methodology
Traditionally, field survey data are used to compute the WisDOT Pavement Distress
Index (PDI). Combined indices such as the PDI and Pavement Condition Index (PCI) have
been widely used by state highway agencies to characterize pavement performance. There
are, however, major concerns associated with the use of such combined indices to indicate
performance. These problems have been outlined by Paterson (1987) and include:
a) Different types of maintenance are appropriate for different levels of each distress
type.
b) The relative seriousness of different defects varies with the pavement type,
environment, the rate of deterioration and the maintenance program in place.
c) Each distress type evolves at different rates in different pavement types and under
different traffic and environmental conditions.
The problems outlined by Paterson (1987) suggest that modeling the performance of
PCC pavements using a combined index, such as the PDI, requires determining the average
amount of distress effects from the many different combinations of distresses encountered.
This method has the potential to yield results that have wide variances that, in turn, may
suppress the very effects of interest. Thus, the analysis approach adopted in this study
considered both the combined index (PDI) approach and a more versatile approach that
evaluated major distress modes to better explain the relationship between distress progression
and its influential factors. International Roughness Index (IRI) for the segment was
evaluated as a single performance indicator.
5.3 Individual Distress Measures
The measurement of performance data included separate extent and severity values
for each of the individual distresses observed. The extent provides information on the
frequency of occurrence while the severity indicates the seriousness of the distress.
Established WisDOT measures pertaining to PCC pavement distress include slab breakup,
distressed joints and cracks, joint crack filling, patching, surface distresses, longitudinal joint
distress and distortion, and transverse faulting. The length of evaluation segment for each

49
test section was 0.1 mile (528 feet). Pavement area or location for the measured distresses,
along with extent and severity values, are listed in Table 5.1.
Table 5.1 Distress Measures for PCC Pavement
Index
(1)
Pavement Distress
Indicator
(2)
Pavement Area Measured
(3)
Extent
Levels
(4)
Severity
Levels
(5)
1 Slab Breakup Total pavement area. 0, 1, 2,
3, 4
0, 1, 2, 3
2 Joint Crack Filling None defined. None None
3 Distress Joints/Cracks Within 2 feet on either side of
a joint or crack.
0, 1-2,
3-4, 5+
0, 1, 2,3
4 Patching Total pavement area. 0, 1, 2,
3, 4
0, 1, 2, 3
5 Surface Distress Total pavement area. 0, 1, 2 0, 1, 2
6 Longitudinal Joint
Distress
Distress within 2 feet on either
side of longitudinal joint.
0, 1 0, 1, 2, 3
7 Transverse Faulting 2 to 3 feet from both the
outside and inside pavement
edge.
0, 1, 2, 3 0, 1, 2, 3
Measured performance data from the three highway segments are shown in Tables
5.2 through 5.4. The third TIC section on USH 18/151 was omitted from the analysis since
patching and distressed joints/cracks appeared to be the result of a removed right-side
longitudinal pipe when a new eastbound entry ramp was constructed in 2004. Figure 5.1
illustrates the extent of patching in this TIC section adjacent to the new on-ramp.
Figure 5.1 Patching in TIC Section Adjacent to New On-Ramp

50
Table 5.2 Measured Distresses for Slab and Crack Filling
Joints Slab Slab Crack
Highway Section Dowels Drainage Base Sealed Extent Severity Filling
(1) (2) (3) (4) (5) (6) (7) (8) (9)
18/151 1 No Drained OGBC Yes 3 1 0
18/151 2 No Drained OGBC No 3 1 2
18/151 3 No Drained CSOG Yes 1 1 0
18/151 4 No Drained CSOG No 1 1 2
18/151 5 No Drained ASOG Yes 0 0 0
18/151 6 No Drained ASOG No 0 0 2
18/151 7A No Drained TIC No 0 0 2
18/151 7B No Drained TIC No 0 0 2
18/151 7C No Drained TIC No 1 1 2
18/151 8 No Undrained DGBC Yes 1 1 0
18/151 9 No Undrained DGBC No 1 1 2
18/151 10A Yes Drained TIC No 1 1 2
18/151 10B Yes Drained TIC No 2 1 2
18/151 11 Yes Drained CSOG No 1 1 2
18/151 12 Yes Drained ASOG No 0 0 2
18/151 13 Yes Drained OGBC No 2 1 2
18/151 14 Yes Undrained DGBC No 1 1 2
18/151 15 Yes Undrained DGBC Yes 1 1 0
29/32 1 No Drained OGBC No 4 1 2
29/32 2 No Drained OGBC Yes 4 1 0
29/32 3 Yes Drained OGBC Yes 1 1 0
29/32 4 Yes Drained OGBC No 2 1 2
151 1 Yes Drained CSOG No 0 0 2
151 2 Yes Drained OGBC No 0 0 2
151 3 Yes Drained ASOG No 0 0 2
151 4 Yes Drained OGBC No 1 1 2
1=10% 0=none 0=filled
2=20% 1= 2 to 3 1=need
3=30% blocks more
4=40% 2=none

51
Table 5.3 Measured Distresses for Joints/Cracks, Patching, and Surface
Distressed Distressed Surface Surface
Long.
Jt. Long. Jt.
Joint/Crack Joint/Crack Patch Patch Distress Distress Distress Distress
Highway Section Extent Severity Extent Severity Extent Severity Extent Severity
(1) (2) (3) (4) (5) (6) (7) (8) (9) (10)
18/151 1 3 2 0 0 0 0 0 0
18/151 2 3 2 0 0 1 1 1 2
18/151 3 1 1 0 0 1 1 0 0
18/151 4 3 2 0 0 0 0 0 0
18/151 5 3 2 0 0 1 1 0 0
18/151 6 3 2 0 0 0 0 1 1
18/151 7A 3 1 0 0 1 1 0 0
18/151 7B 3 2 0 0 1 1 0 0
18/151 7C 3 3 3 2 1 1 0 0
18/151 8 3 2 0 0 0 0 0 0
18/151 9 3 2 0 0 0 0 0 0
18/151 10A 3 1 0 0 0 0 1 1
18/151 10B 3 1 0 0 0 0 1 1
18/151 11 3 1 1 1 1 1 1 1
18/151 12 3 2 0 0 0 0 0 0
18/151 13 3 1 0 0 1 1 1 2
18/151 14 3 1 1 1 1 1 1 1
18/151 15 3 1 0 0 1 1 1 1
29/32 1 3 1 0 0 1 1 1 1
29/32 2 3 2 0 0 1 1 1 1
29/32 3 3 1 0 0 0 0 1 1
29/32 4 3 1 0 0 0 0 1 1
151 1 3 1 0 0 0 0 0 0
151 2 3 1 0 0 0 0 0 0
151 3 3 1 0 0 0 0 0 0
151 4 3 1 0 0 1 1 0 0
0=none 0=none 0=none 0=none 0=none 0=none 0=none 0=none
1=1 to 2 1=slight 1=1to3 1=good
1=LT
10%
1=LT 1
in. 1=yes 1=slight
2=3 to 4 2=moderate 2=4to6 2=fair
2=GT
10%
2=GT 1
in. 2=moderate
3=5+ 3=severe 3=7to9 3=poor 3=severe
4=10+
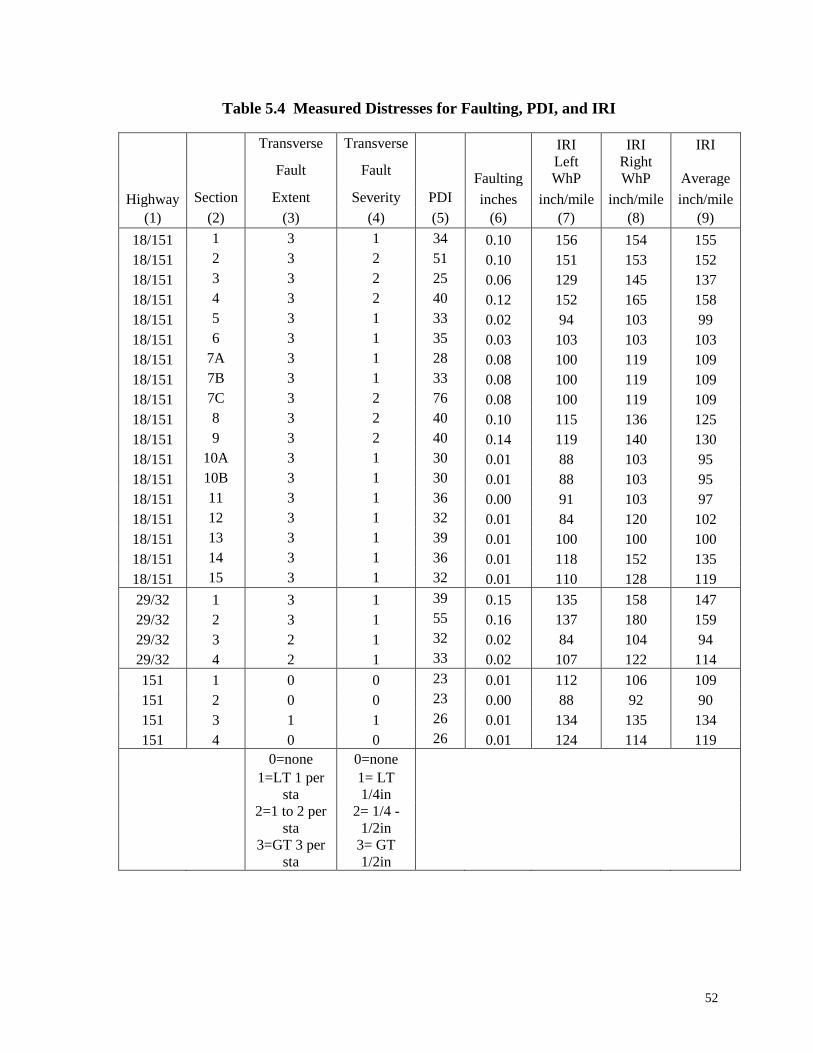
52
Table 5.4 Measured Distresses for Faulting, PDI, and IRI
Transverse Transverse IRI IRI IRI
Fault Fault
Faulting
Left
WhP
Right
WhP Average
Highway Section Extent Severity PDI inches inch/mile inch/mile inch/mile
(1) (2) (3) (4) (5) (6) (7) (8) (9)
18/151 1 3 1 34 0.10 156 154 155
18/151 2 3 2 51 0.10 151 153 152
18/151 3 3 2 25 0.06 129 145 137
18/151 4 3 2 40 0.12 152 165 158
18/151 5 3 1 33 0.02 94 103 99
18/151 6 3 1 35 0.03 103 103 103
18/151 7A 3 1 28 0.08 100 119 109
18/151 7B 3 1 33 0.08 100 119 109
18/151 7C 3 2 76 0.08 100 119 109
18/151 8 3 2 40 0.10 115 136 125
18/151 9 3 2 40 0.14 119 140 130
18/151 10A 3 1 30 0.01 88 103 95
18/151 10B 3 1 30 0.01 88 103 95
18/151 11 3 1 36 0.00 91 103 97
18/151 12 3 1 32 0.01 84 120 102
18/151 13 3 1 39 0.01 100 100 100
18/151 14 3 1 36 0.01 118 152 135
18/151 15 3 1 32 0.01 110 128 119
29/32 1 3 1 39 0.15 135 158 147
29/32 2 3 1 55 0.16 137 180 159
29/32 3 2 1 32 0.02 84 104 94
29/32 4 2 1 33 0.02 107 122 114
151 1 0 0 23 0.01 112 106 109
151 2 0 0 23 0.00 88 92 90
151 3 1 1 26 0.01 134 135 134
151 4 0 0 26 0.01 124 114 119
0=none 0=none
1=LT 1 per
sta
1= LT
1/4in
2=1 to 2 per
sta
2= 1/4 -
1/2in
3=GT 3 per
sta
3= GT
1/2in

53
5.4 Performance Analysis Plots
A series of plots were prepared to illustrate the relationship between pavement design
features and resulting performance. The following sections break down the effect of key
design features, including base type, dowels, and sealant upon pavement performance as
measured by the composite PDI, individual distresses, and ride performance.
5.4.1 Base Type and Performance
USH 18/151 and USH 151 provided important data to compare the different base
types and their effect on performance. STH 29 had the same base type throughout, an
untreated open graded base course, thus it was unable to directly evaluate a monolithic base
type.
The plot for doweled, unsealed JPCP in Figure 5.2 illustrates nearly the same
performance among the different bases for doweled concrete pavement. Except for skewed
transverse joints, the dense-graded base section (#14) is considered the standard, having a 6-
inch thick dense-graded crushed aggregate base, and unsealed doweled transverse joints.
Distresses common to all segments included slight to moderate distressed joints/cracks and
slight transverse faulting. PDI scores were highest for open-graded base and lowest for the
asphalt-stabilized open-graded (ASOG) base. ASOG had no slab breakup or surface
distresses, however it measured a greater severity of distressed joints and cracks (moderate
rating compared to others with a slight rating).
Figure 5.2 PDI variation for Unsealed Doweled Transverse Joints on USH 18/151
0
5
10
15
20
25
30
35
40
45
PD
I
Dense Open CementSOG AsphaltSOG

54
Figure 5.3 compares the IRI (inches per mile) with the same four sections, where
values ranged from 97 to 135 inches per mile. Overall, this is considered good ride
performance and within the normal range of what is expected for a rural PCC pavement
nearing its first maintenance cycle. The dense-graded base section (#14) had the roughest
ride when compared to all open-graded doweled sections. There was little difference among
the open-graded sections, with a measured IRI approximately 100 inches per mile. Thus,
based on the analysis of these two plots, asphalt-stabilized open graded base had the lowest
measured distresses, while the open-graded bases had a lower surface roughness but higher
measured distresses.
Figure 5.3 IRI variation for Unsealed Doweled Transverse Joints on USH 18/151
Similar plots were prepared for the test sections on USH 151, where all test sections
were constructed with permeable base; no mainline dense-graded control sections were
constructed for comparative purposes. Sections were doweled 10-inch thick PCC, unsealed
skewed transverse joints, paved over a 4-inch upper permeable base and 4-inch lower dense
base. Drainage pipe was 6-inch diameter, unlike USH 18/151 with 4-inch pipe diameter.
Figure 5.4 illustrates nearly the same performance among the different bases, where PDI
scores were very similar for the four sections, ranging from 23 to 26. Slight distressed
joints/cracks were common to all segments. The higher PDI scores were attributed to the
untreated OGBC base having 10% of slab area with slab breakup and surface distresses, and
asphalt-stabilized OGBC having slight transverse faulting. However, faulting data from the
WisDOT performance van measured 0.01 inches for all sections except New Jersey OGBC
with a recorded value of zero.
0
20
40
60
80
100
120
140
160
IRI,
inch
es p
er m
ile
Dense Open CementSOG AsphaltSOG

55
Figure 5.4 PDI variation for Unsealed Doweled Transverse Joints on USH 151
IRI was plotted for the same four sections in Figure 5.5. The New Jersey open-
graded base had the smoothest ride when compared to other open-graded sections. ASOG
base had the roughest ride, and unstabilized OGBC and CSOG bases had intermediate
values. Overall, the finer-graded New Jersey base had less composite distresses and a
smoother ride. The more coarse OGBC Gradation #1 is no longer specified for drainable
PCC pavement bases.
Figure 5.5 IRI variation for Unsealed Doweled Transverse Joints on USH 151
0
5
10
15
20
25
30
PD
I
Open CementSOG AsphaltSOG NJ OBGC
0
20
40
60
80
100
120
140
160
IRI,
inch
es p
er m
ile
Open CementSOG AsphaltSOG NJ OBGC

56
Of key interest in this study is the effect of base type on distress-based performance
and ride quality. Removing doweled sections from the data set allowed a more direct
evaluation of base type. Only USH 18/151 data were used in the evaluation since STH 29
had a monolithic base and all sections of USH 151 sections were doweled. Sealed and
unsealed joints were stratified in the analysis since that is the only remaining design variable.
Figure 5.6 plots the PDI against base type on non-doweled USH 18/151 sections.
When using the median value for the sealed and unsealed PDI scores, it can be concluded
that cement-stabilized, asphalt-stabilized, and TIC drains had the least amount of distress.
Dense-graded and unstabilized OGBC had the highest composite measure of pavement
distress. Sealed joints produced a better performing pavement than unsealed joints. All TIC
sections were unsealed.
Figure 5.6 PDI variation for Base Type on Non-doweled Sections on USH 18/151
0
10
20
30
40
50
60
PD
I
Dense Open CSOG ASOG TIC
Sealed Joints
Unsealed Joints

57
Similarly, ride was plotted against the same sections (see Figure 5.7). Asphalt-
stabilized open base and TIC drains had the smoothest ride, while untreated and CSOG had
the rougher ride. Sealant did not appear to have a consistent effect on ride. Based on this
analysis of non-doweled sections, ASOG base and TIC drains had better distress-based
performance and ride than the other non-doweled sections.
Figure 5.7 IRI variation for effect of Base Type on Non-doweled Sections on USH
18/151
5.4.2 Transverse Dowels and Performance
Since 1988, doweled JPCP pavements have been exclusively specified as a WisDOT
PCC pavement standard. This study presented a valuable opportunity to understand their
effect on performance and ride quality. Figure 5.8 combines the data from the three projects
and plots the PDI against doweled and non-doweled pavement. This plot suggests that non-
doweled pavement generally has a higher distress level than doweled; however, with the two
highest non-doweled values removed, the difference is less pronounced.
0
20
40
60
80
100
120
140
160
180
IRI,
inch
es p
er m
ile
Dense Open CSOG ASOG TIC
Sealed
Unsealed

58
Figure 5.8 PDI variation with Transverse Joint Dowel Treament (all segments)
Since the composite PDI inherently limits the ability to assess individual distresses,
they were reviewed individually to assess their contribution. As would be expected,
transverse faulting impacted the PDI scores. The extent of transverse faulting was equal
among all test sections; however, the severity was higher for non-doweled joints with about
half of those sections rated a level 2 (¼ to ½ inch). Figure 5.9 illustrates this relationship
using actual data from the WisDOT performance Van. Clearly, faulting was higher on the
non-doweled sections, yielding values greater than or equal to 0.02 inches. All doweled
sections were either at or less than 0.02 inches.
Figure 5.9 Faulting variation with Transverse Joint Dowel Treament (all segments)
0
10
20
30
40
50
60
PD
I
Doweled Non-doweled
USH 18/151
STH 29
USH 151
0.00
0.02
0.04
0.06
0.08
0.10
0.12
0.14
0.16
0.18
Fau
ltin
g, in
ches
Doweled Non-doweled
USH 18/151
STH 29
USH 151

59
Transverse faulting affects ride quality, and Figure 5.10 confirms this relationship
where IRI was generally higher on non-doweled pavements, but many doweled sections had
an equal roughness to non-doweled sections.
Figure 5.10 IRI variation with Transverse Joint Dowel Treament (all segments)
5.4.3 Sealant and Performance
The earlier plot in Figure 5.6 of PDI against base type on non-doweled USH 18/151
sections suggested that sealed joints produced a better performing pavement than unsealed
joints. However, in Figure 5.7, sealant did not appear to have a consistent effect on ride
across non-doweled sections.
The effect of sealant was further investigated by comparing adjacent sealed and
unsealed sections on doweled USH 18/151 dense graded sections, and a combination of
doweled and non-doweled sections on STH 29. First, the two sections on USH 18/151 were
analyzed. These adjacent sections both had doweled JPCP with 6-inch thick dense graded
base, with the only difference being Section #14 without sealant (WisDOT standard) and
Section #15 with sealant. Traffic levels were assumed equal, however the 528-foot PDI
segment was just beyond an exit ramp for STH 78 on the west side of Mount Horeb (Figure
5.11).
0
20
40
60
80
100
120
140
160
180IR
I, in
ches
per
mile
Doweled Non-doweled
USH 18/151
STH 29
USH 151

60
Figure 5.11 Location of USH 18/151 Test Section east of STH 78 Exit Ramp
Figure 5.12 illustrates the PDI for the two dense-graded doweled JPCP segments on
USH 18/151 where the sealed section slightly outperformed the unsealed section. Both
sections had identical extent and severity levels for slab breakup, distressed joints/cracks,
surface distress, longitudinal distress, and transverse faulting; all were lowest severity rating,
and all except distressed joints/cracks were lowest extent. The distress that produced the
higher PDI for the unsealed section was patching, where 1 to 3 patches (extent=1) in good
condition (severity=1) increased the PDI from 32 to 36. In Figure 5.13, the sealed section
had a lower roughness than the unsealed section. Based on these two plots, sealed doweled
joints yielded a better performing pavement than unsealed doweled joints.
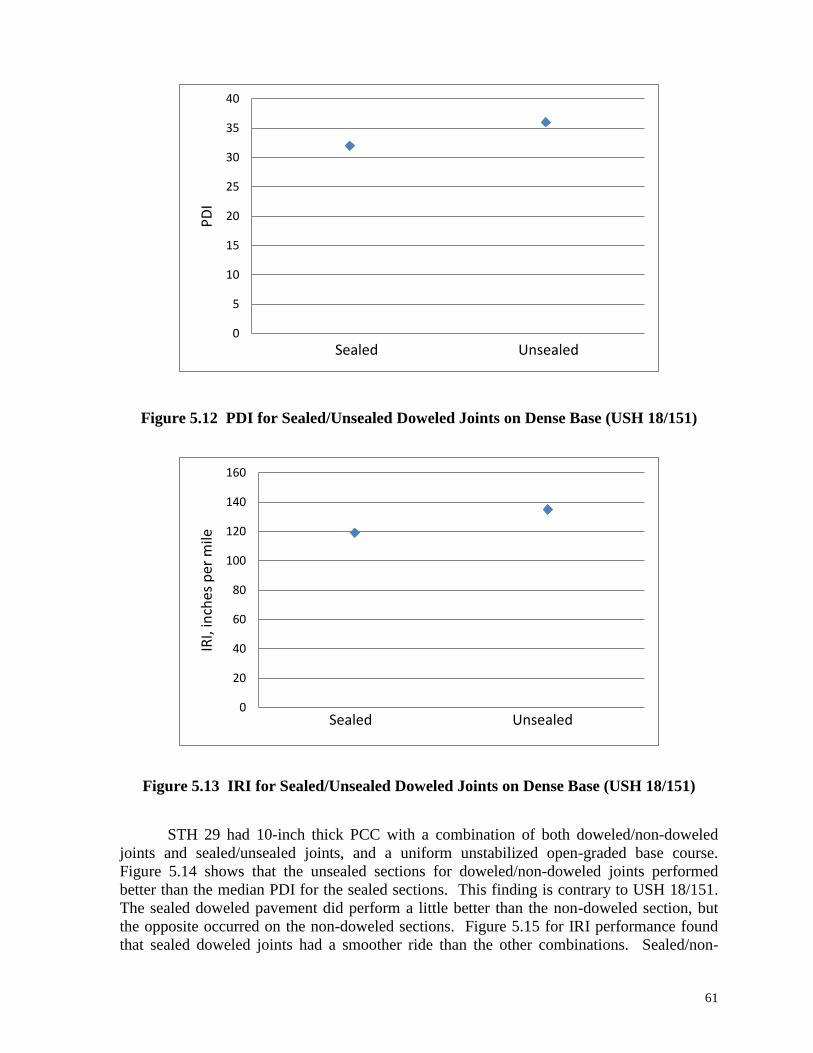
61
Figure 5.12 PDI for Sealed/Unsealed Doweled Joints on Dense Base (USH 18/151)
Figure 5.13 IRI for Sealed/Unsealed Doweled Joints on Dense Base (USH 18/151)
STH 29 had 10-inch thick PCC with a combination of both doweled/non-doweled
joints and sealed/unsealed joints, and a uniform unstabilized open-graded base course.
Figure 5.14 shows that the unsealed sections for doweled/non-doweled joints performed
better than the median PDI for the sealed sections. This finding is contrary to USH 18/151.
The sealed doweled pavement did perform a little better than the non-doweled section, but
the opposite occurred on the non-doweled sections. Figure 5.15 for IRI performance found
that sealed doweled joints had a smoother ride than the other combinations. Sealed/non-
0
5
10
15
20
25
30
35
40
PD
I
Sealed Unsealed
0
20
40
60
80
100
120
140
160
IRI,
inch
es p
er m
ile
Sealed Unsealed

62
doweled joints produced the roughest ride, and as expected, non-doweled joints, whether
sealed or unsealed, had the highest IRI values.
Figure 5.14 PDI for Sealed/Unsealed Doweled/Non-Doweled Joints on STH 29
Figure 5.15 IRI for Sealed/Unsealed Doweled/Non-Doweled Joints on STH 29
0
10
20
30
40
50
60
PD
I
Sealed Unsealed
Doweled
Non-doweled
0
20
40
60
80
100
120
140
160
180
IRI,
inch
es p
er m
ile
Sealed Unsealed
Doweled
Non-doweled

63
5.5 Statistical Analysis
The statistical analysis consisted of two phases: a preliminary phase and a model-
building phase. The former phase used basic statistics and correlations to identify key design
input variables (base type, drainage type, etc.) having an effect on the extent, severity, and
PDI of the major distresses predominantly observed. From a designer‟s point of view, the
influential factors for the extent and severity can provide a basis for design modifications.
For example, if a high frequency or severity level of distressed cracks is related to base type,
an investigation will be warranted and proper design and materials recommended. The
combination of the severity and extent is also needed for determining the type and level of
maintenance work to be performed, and consequently, aid in the life-cycle cost analysis
associated with specific maintenance alternatives. The visual analysis in the previous section
were very useful; however, they may partially confound the relationships of primary
variables.
5.5.1 Basic Statistics
Table 5.5 summarizes the mean, standard deviation, minimum and maximum for each
rural JPCP variable. A total of 26 unique sections were tested, but only sample sizes of 25
are shown since the TIC section (#7C) adjacent to the new on ramp at Barneveld was
dropped from the analysis. Excessive patching occurred where it appeared that longitudinal
drains were removed during ramp construction.
Variables were coded for the statistical analysis to improve computing time with
these designations:
Dowel1Y0N: Dowels present, 1 = Yes, 0 = No.
B1D2O3C4A5T: Base type, 1 = Dense, 2 = OGBC, 3 = CSOG, 4 = ASOG, 5 = TIC.
Seal1Y0N: Sealant, 1 = Yes, 0 = No.
Slbext through TransFaultsev: Performance distress measures for extent and severity
designated with numeric condition code.
PDI: Pavement Distress Index.
IRIavg: average of IRI readings from left and right wheel path.
Faulting: measured in one hundredths of an inch.

64
Table 5.5 Basic Summary Statistics
Variable N Mean Std Dev Minimum Maximum
Dowel1Y0N 25 0.5200000 0.5099020 0 1.0000
B1D2O3C4A5T 25 2.8000000 1.3540064 1.0000000 5.0000
Seal1Y0N 25 0.2800000 0.4582576 0 1.0000
slbext 25 1.2000000 1.2247449 0 4.0000
slbsev 25 0.6800000 0.4760952 0 1.0000
crkfill 25 1.4400000 0.9165151 0 2.0000
distjtckext 25 2.9200000 0.4000000 1.0000000 3.0000
distjtcksev 25 1.4000000 0.5000000 1.0000000 2.0000
patchext 25 0.0800000 0.2768875 0 1.0000
patchsev 25 0.0800000 0.2768875 0 1.0000
surfdistext 25 0.4800000 0.5099020 0 1.0000
surfdistsev 25 0.4800000 0.5099020 0 1.0000
LJDistext 25 0.4800000 0.5099020 0 1.0000
LJDistsev 25 0.5600000 0.6506407 0 2.0000
TranFaultext 25 2.4800000 1.0456258 0 3.0000
TranFaultsev 25 1.0800000 0.5715476 0 2.0000
PDI 25 34.0400000 7.7216147 23.0000000 55.0000
IRIavg 25 119.4400000 22.3421873 90.0000000 159.0000
Faulting 25 0.0508000 0.0528299 0 0.1600
A correlation matrix was prepared for each combination of variables, with full output
in Appendix C. Significant correlations are summarized in Figure 5.16. The correlation
coefficient is a numerical measure that quantifies the strength of linear relationships, where
coefficients at or near 1.000 indicate a strong relationship. Doweled joints affected
distressed joints/cracks severity, transverse faulting extent/severity, PDI, IRI, and Faulting.
This validated earlier findings from the plots, and as expected, there was a strong correlation
with distressed joints, IRI, and faulting. Base type affected slab breakup extent/severity,
PDI, and IRI. Sealed or unsealed joints had no effect on performance, which confirmed prior
analysis where sealant had contradictory results on USH 18/151 and STH 29.

65
Pearson Correlation Coefficients, N = 25
Prob > |r| under H0: Rho=0
Dowels Base Sealant
Slbext -0.24019 -0.40202 0.19302
0.2475 0.0464 0.3553
Slbsev 0.02746 -0.55587 0.23681
0.8963 0.0039 0.2544
Crkfill 0.29244 0.30890 -1.00000
0.1560 0.1330 <.0001
Distjtcksev -0.68641 0.00000 0.21822
0.0002 1.0000 0.2947
TranFaultext -0.48765 0.10006 0.22957
0.0134 0.6341 0.2696
TranFaultsev -0.57761 -0.13999 0.22908
0.0025 0.5045 0.2707
PDI -0.47114 -0.35788 0.14978
0.0174 0.0790 0.4748
IRI -0.54759 -0.40880 0.21129
0.0046 0.0425 0.3106
Faulting -0.82040 -0.23649 0.19689
<.0001 0.2551 0.3455
Figure 5.16 Significant Correlations between Design Variables and Performance
5.5.2 Statistical Models
Statistical models were developed to quantify the key relationship between design
variables and performance. The primary modeling technique was Analysis of Variance
(ANOVA). The ANOVA procedure first finds the mean of the data, then the function. The
key objective was to understand what design variables provide a change in the mean PDI,
individual numeric distresses, and IRI; the ANOVA output naturally provides this mean in
the function. Equation 5.1 provides a general framework for the full model of variables.
Performance = Design + Construction + Traffic + Environment + Interactive Effects
+ Unexplained Variability or Error (5.1)
Performance was treated as the dependent variable, and measured by the IRI,
composite PDI, and extent/severity of each pavement distress category. Since the sections

66
have the same level of traffic and exposure to the environment, these factors were blocked
and removed from the model.
Construction is a key factor in the performance of any pavement; however,
construction records for these sections were not readily available. For practical purposes, the
as-built properties were assumed homogenous across a highway segment and this variable
was dropped from the model. This is not preferred since there may be some unique features
of construction that may have an effect on performance, such as flexural strength and
gradation. Equation 5.1 was reduced by dropping construction, traffic and environment
effects to yield Equation 5.2:
Performance = Design (Base, Dowels, Sealant) + Interactive Effects + Unexplained
Variability or Error (5.2)
The ANOVA procedure has the ability to test the significance of a variable when
entered last into the model using Type III Sum of Squares, while regression computes the
Sum of Squares in the specified model order using Type II Sum of Squares. Two standard
statistics were calculated and used to determine significance: (1) F-value and (2) p-value.
The F-value was calculated from the ratio of variances, then the probability level of
significance, or p-value, was calculated. Equation 5.3 shows how the F-value for each
distress indicator was calculated from the ratio of variability in each design variable (base
type, dowels, sealant) to the unexplained variability (error). A p-value cutoff of 0.10 was
specified since the “noise” in field data may inadvertently drop a marginally significant
variable when the p-value is just beyond the traditional 0.05 cutoff value. In addition, small
sample sizes have a more pronounced effect on significance tests.
FExt, Sev, or PDI = (Error) MS
Variable)(Input MS (5.3)
A full model of variables was initially tried, then only significant variables were
retained. The TIC system was removed since it has not been adopted as a design standard,
and a reduction from 5 to 4 base levels allowed an increase in the degrees of freedom and
enhanced sensitivity in parameter significance. A total of 21 test sections were used to
develop the models; USH 18/151 n=13 (15 sections minus 2 TIC), STH 29 n=4, and USH
151 n=4. Additionally, this allowed a pooling of a two-level project data set having 4 base
types each (DGBC, OGBC, CSOG, and ASOG) from the USH 18/151 and USH 151
projects. STH 29 had only one level of base, untreated OGBC, and it was decided to retain
this variable to pool with the OGBC sections on USH 18/151 and USH 151.
Table 5.6 summarizes the significant model relationships from initial investigation.
The models largely reflect the significant linear correlation relationships. A notable
observation is that sealant did not have significant relationship with any performance distress
measure or the IRI, confirming earlier plots where there was disagreement between USH
18/151 (sealant has an effect) and STH 29 (sealant does not have an effect). It is clear that
the transverse faulting (severity and extent) was affected by the presence of dowel bars.

67
Table 5.6 Significant Model Parameters from Initial Models
Performance Measure
(1)
Base
(2)
Dowels
(3)
Sealant
(4)
Interactions
(5)
PDI X
Slab extent X X Base*Dowel
Slab severity X
Dist. joints/cracks severity X
Transverse faulting extent X
Transverse faulting severity X
IRI X Base*Dowel
Based on the preliminary findings, final revised models were developed by dropping
the insignificant variables. The final models had greater degrees of freedom and resulting
model strength, and estimated parameters to quantify the effect on the dependent
performance variable. Table 5.7 presents the final models, along with model accuracy as
measured by the R-squared statistic. Key model parameters were dowels affecting PDI, slab
extent and severity, distressed joints and cracks, transverse faulting extent and severity, and
IRI. There were insufficient degrees of freedom to include interaction terms in parameter
estimation.
The final set of models focused on doweled-only pavements, consistent with current
WisDOT design standards and practice. A total of 11 test sections were used in model
development; USH 18/151 n=5, STH 29 n=2, and USH 151 n=4. The dowel and sealant
variables were dropped from the models to enhance the degrees of freedom as a tradeoff to a
reduced sample size. Table 5.8 presents the models for the estimate of base type on
performance. At 20 years of age, more slab breakup is expected with DGBC, OGBC, and
CSOG.

68
Table 5.7 Model Parameter Estimates from Initial Models
Performance
Measure
(1)
Parameter Estimates
(2)
R-squared
(3)
PDI 30.727 + 8.473 (1 non-doweled, 0 otherwise)
Base only was not significant.
Base and dowels in the model determined that only
dowels were significant.
27.8%
Slab extent -0.537 + 1.074 (1 non-doweled, 0 otherwise)
+1.000 (1 DGBC, 0 otherwise)
+2.282 (1 OGBC, 0 otherwise)
+0.750 (1 CSOG, 0 otherwise)
+0.000 (1 ASOG, 0 otherwise)
0.0 + 1.000 (1 DGBC, 0 otherwise)
+ 2.222 (1 OGBC, 0 otherwise)
+ 0.750 (1 CSOG, 0 otherwise)
+ 0.000 (1 ASOG, 0 otherwise)
0.818 + 0.982 (1 non-doweled, 0 otherwise)
68.2%
50.0%
15.6%
Slab severity 0.0 + 1.000 (1 DGBC, 0 otherwise)
+ 0.889 (1 OGBC, 0 otherwise)
+ 0.750 (1 CSOG, 0 otherwise)
+ 0.000 (1 ASOG, 0 otherwise)
61.7%
Distressed joints
cracks severity
1.091 + 0.709 (1 non-doweled, 0 otherwise) 51.2%
Transverse
faulting extent
1.818 + 1.182 (1 non-doweled, 0 otherwise) 29.3%
Transverse
faulting severity
0.727 + 0.773 (1 non-doweled, 0 otherwise) 40.0%
IRI(in/mile) 96.213 + 26.574 (1 non-doweled, 0 otherwise)
+ 17.750 (1 DGBC, 0 otherwise)
+ 17.532 (1 OGBC, 0 otherwise)
+ 15.750 (1 CSOG, 0 otherwise)
+ 0.000 (1 ASOG, 0 otherwise)
110.273 + 26.227 (1 non-doweled, 0 otherwise)
Base only was not significant.
44.2%
34.9%

69
Table 5.8 Doweled-only Model Parameter Estimates for Base Type
Performance
Measure
(1)
Parameter Estimates
(2)
R-squared
(3)
PDI Base only was not significant. ---
Slab extent 0.0 + 1.000 (1 DGBC, 0 otherwise)
+ 1.200 (1 OGBC, 0 otherwise)
+ 0.500 (1 CSOG, 0 otherwise)
+ 0.000 (1 ASOG, 0 otherwise)
41.5%
Slab severity 0.0 + 1.000 (1 DGBC, 0 otherwise)
+ 0.800 (1 OGBC, 0 otherwise)
+ 0.500 (1 CSOG, 0 otherwise)
+ 0.000 (1 ASOG, 0 otherwise)
48.9%
Dist. joints/cracks
severity
1.5 - 0.500 (1 DGBC, 0 otherwise)
- 0.500 (1 OGBC, 0 otherwise)
- 0.500 (1 CSOG, 0 otherwise)
+ 0.000 (1 ASOG, 0 otherwise)
45.0%
Transverse
faulting extent
Base only was not significant. ---
Transverse
faulting severity
Base only was not significant. ---
IRI Base only was not significant. ---
There were only three significant models for doweled JPCP, those for slab breakup
extent and severity, and the extent of distressed joints and cracks. Model parameters for PDI,
transverse faulting, and IRI were insignificant. Important estimates for slab breakup extent
compute an increase of 10% area for DGBC, increase of 12% area for OGBC, and an
increase of 5% area for CSOG. Asphalt-stabilized open-graded base is the best choice for
reducing the extent of slab breakup. With respect to severity, asphalt-stabilized base is again
the ideal choice, and increases in slab breakup severity are expected by 1 for DGBC, 0.8 for
OGBC, and 0.5 for CSOG. To limit the severity of distressed joints and cracks, three bases
performed well including DGBC, OGBC, and CSOG. An increase of 1 (from slight to
moderate) is estimated with ASOG. These are important model estimates since they can
predict timing of maintenance and rehabilitation treatments in the life-cycle cost analysis.
5.6 Summary of Performance Analysis
5.6.1 Base Type
USH 18/151 and USH 151 had multiple base types, while STH 29 had one type, an
untreated open graded base course. On USH 18/151, there was similar PDI-based
performance for doweled unsealed pavement on dense and permeable base. Distresses
common to all segments included slight to moderate distressed joints/cracks and slight
transverse faulting. ASOG had no slab breakup or surface distresses, however it measured a
greater severity of distressed joints and cracks. Statistical models estimate an increase in

70
severity of distressed joints/cracks from slight to moderate with doweled ASOG. The DGBC
section had the roughest ride when compared to all open-graded doweled sections. There
was little difference in ride among the open-graded sections. In summary, doweled
pavement on DGBC and ASOG bases had the lowest measured composite distresses, while
the open-graded bases generally had a lower surface roughness.
For non-doweled sections on USH 18/151, the CSOG, ASOG, and TIC drains had the
least amount of distress. DGBC and untreated OGBC had the highest composite measure of
pavement distress. ASOG base and TIC drains had the smoothest ride, while untreated and
CSOG had the rougher ride. In summary, non-doweled sections having ASOG permeable
base and TIC drains had better performance and ride than the other non-doweled sections.
USH 151 had doweled 10-inch thick PCC, unsealed skewed transverse joints, paved
over a 4-inch top permeable base (untreated with two gradations, CSOG, and ASOG) and 4-
inch bottom dense base. All permeable base types had nearly the same performance among
the different bases with slight distressed joints/cracks. Slight differences were untreated
aggregate with 10% of slab area with slab breakup and surface distresses, and ASOG having
slight transverse faulting. The finer New Jersey open-graded base had the smoothest ride
when compared to other open-graded sections. ASOG had a rougher ride when compared to
unstabilized OGBC and CSOG bases, which had intermediate values. In summary, the much
finer-graded New Jersey base had less composite distresses and a smoother ride.
There were only three significant models for doweled JPCP, those for slab breakup
extent and severity, and the extent of distressed joints and cracks. Model parameters for PDI,
transverse faulting, and IRI were insignificant. Important estimates for slab breakup extent
compute an increase of 10% area for DGBC, increase of 12% area for OGBC, and an
increase of 5% area for CSOG. Asphalt-stabilized open-graded base is the best choice for
reducing the extent of slab breakup. With respect to severity, asphalt-stabilized base is again
the ideal choice, and increases in slab breakup severity are expected by 1 for DGBC, 0.8 for
OGBC, and 0.5 for CSOG. To limit the severity of distressed joints and cracks, three bases
performed well including DGBC, OGBC, and CSOG. An increase of 1 (from slight to
moderate) is estimated with ASOG.
5.6.2 Transverse Dowels
Combined data from the three projects found that non-doweled pavement generally
has a higher distress level than doweled; however, when two non-doweled outliers are
removed, the difference is less pronounced. The extent of transverse faulting was equal
among all test sections; however, the severity was higher for non-doweled joints with about
half of those sections rated a level 2 (¼ to ½ inch). All doweled sections were either at or
less than 0.02 inches. IRI was generally higher on non-doweled pavements, but many
doweled sections had an equal roughness to non-doweled sections.

71
5.6.3 Sealant
USH 18/151 sealed non-doweled joints produced a better performing pavement than
unsealed joints, however, sealant did not appear to have a consistent effect on ride. On two
doweled dense-graded sections, sealant slightly outperformed the unsealed section, with
minor patching as the prominent distress for the unsealed section. Both sections had
identical extent and severity levels for slab breakup, distressed joints/cracks, surface distress,
longitudinal distress, and transverse faulting.
STH 29 unsealed sections for doweled/non-doweled joints performed better than the
median PDI for the sealed sections. The sealed doweled pavement did perform a little better
than the non-doweled section, but the opposite occurred on the non-doweled sections. Sealed
doweled joints had a smoother ride than the other combinations. Sealed/non-doweled joints
produced the roughest ride, and as expected, non-doweled joints, whether sealed or unsealed,
had the highest IRI values. Statistical models determined that sealant did not have an effect
on overall performance and ride of doweled or non-doweled sections.

72
CHAPTER 6 STRUCTURAL ANALYSIS
6.1 Water Flow Field Testing Procedure
The procedure and the equipment for testing the rate of flow of water through the
subsurface drainage system were developed under NCHRP Project 1-34D. The testing
procedure required approximately two hours per test section, including pavement coring,
elevation measurements, flow testing, and corehole patching.
Locating the transverse outlets: For each of the drained test sections, a typical
transverse drainage outlet was located and marked for testing.
Measuring longitudinal grade: Locations for coring were selected based on the local
longitudinal gradient of the pavement. The longitudinal grade was measured using a 2-foot
carpenter‟s level with a digital display. The corehole location was then selected to ensure
that subsurface flow though the permeable base layer would enter the longitudinal pipe
system upstream of the located transverse outlet.
Coring: A 4-inch core was cut through the concrete surface down to the top of the
permeable base layer. Coring was terminated as soon as the wash water was seen to be
draining through the base layer.
Other measurements: A variety of distance and elevation measurements were
collected for later use in calculating the length of the flow path and the hydraulic
conductivity of the drainage layer. A measuring wheel was used to measure the transverse
distance from the core hole to the edge of the pavement, the longitudinal distance from the
core hole to the drainage outlet, and the transverse distance from the edge of the pavement to
the transverse drainage outlet. A rod and laser level were used to obtain elevation readings at
the surface of the pavement next to the corehole, the surface of the drainage layer within the
corehole, the surface of the pavement at the pavement edge at the corehole station, the
surface of the pavement at the edge adjacent to the drainage outlet station, and the inside
bottom edge of the drainage outlet pipe. (Note: elevation readings increase as the measuring
rod lowers).
Measuring inflow and outflow: Water was run from a water truck provided by the
county highway department, through a hose to a water pump, then through a flow meter, and
then into the corehole. The flow meter‟s screen can display either the total volume of water
used, in gallons, or the rate of water flow, in gallons per minute. The water pump is powered
by connection to a 12V car battery. Normally the tests were conducted by first adjusting the
flow rate to the maximum that the drainage layer could accommodate without water spilling
over the top of the corehole. The maximum inflow rate was recorded, and then the flow rate
was reduced to a steady-state rate of 8 gallons per minute. The steady-state elevation of the
free water level within the core hole was recorded. If the maximum inflow capacity of the
drainage layer was less than 8 gallons per minute, the inflow rate was set to a value which
maintained the water level in the core hole just below the pavement surface.

73
Clear water was allowed to flow into the base until it was observed flowing out of the
downstream outlet, as illustrated in Figure 6.1. Once free-flow through the drainage system
was established, a tracer dye was added to the inflowing water. A stopwatch was used to
measure the time to when outflow was first observed, the time to when tracer dye outflow
was observed, and the time when inflow was stopped. In many cases no water was observed
flowing out of the downstream outlet after 20 minutes. In these cases, drainage testing was
terminated and no tracer dye was introduced.
Figure 6.1 Flow Conditions During Permeability Testing
6.2 Drainage Flow Calculations
The following general equation is used to determine the rate of flow through a porous
medium:
Q = K i A (6.1)
Where:
Q = rate of flow through cross sectional area, L3
/ t
K = hydraulic conductivity of medium, L / t
i = hydraulic gradient, L / L
A = cross sectional area, L2
Equation 6.1 can be rearranged to solve for the hydraulic conductivity, K, of the open
graded permeable base (OGPB) as a function of a known flow rate, hydraulic gradient, and
cross-sectional area of flow:
K = 192.5 Q / i A (6.2)

74
Where:
K = hydraulic conductivity of OGPB, feet/day
Q = maximum inflow rate measured during field tests (gal/min)
1 gal/min = 192.5 ft3/day
i = hydraulic gradient measured in field = Δh / L
Δh = elevation head difference measured in field = (1 - 2 ) + 3 + 4 - 5, each defined
below
1= elevation measure at top of pavement at edge, ft
2= elevation measure at top of pavement at corehole, ft
3= pavement thickness above OGPB, ft
4= thickness of OGPB, ft (assumed = 0.33 ft)
5= depth to top of free water surface, ft
L = flow length, ft = distance measured from corehole to pavement edge
A = cross-sectional area of flow, ft2
= thickness of OGPB (ft) x assumed width of flow plume through OGPB (= 3ft)
Equations 6.1 and 6.2 are based on transverse flow (i.e., for a longitudinal grade of 0
percent). As the longitudinal grade increases above 0 percent, both the hydraulic gradient
and the flow length increase. However, the proportional increase for both is the same, and
thus Equation 6.2 can be considered valid for any longitudinal gradient provided the flow
remains laminar. If turbulence is introduced due to an increased longitudinal gradient, the
computed hydraulic conductivity can be considered as an equivalent K. In general, a
minimum hydraulic conductivity of 1,000 fpd is required to provide adequate drainage.
Target permeability from the FDM is recommended at 1,000 fpd (WisDOT 2008).
Significantly higher values are indicative of highly permeable systems which can be
considered as excellently drained but may lack stability unless adequately confined and/or
stabilized.
An example of the hydraulic conductivity calculation sequence is detailed in Figure 6.2,
using field measurements from the sealed, non-doweled, cement-stabilized open-graded test
section within the USH 18/151 project location.

75
Figure 6.2 Hydraulic Conductivity Calculation Sequence
The result obtained appears reasonable since the hydraulic conductivity falls within
the expected range for an OGPB; however, it should be noted that there is at least one
limitation to this approach for calculating the in-place hydraulic conductivity of the OGPB.
The actual value obtained for the hydraulic conductivity, K, is a function of the assumed
width of the flow plume. For these calculations, a flow plume width of 3 feet is assumed for
Date: 06/16/09
Site ID: USH18/151-3 CSOG
GPS Coordinates: N 43° 00.307', W 89° 58.200'
Cross Slope (%): 4.2
Longitudinal Grade (%): 1.1
Distance Measures, ft
Core to Edge: 4.6
Core to Outlet: 20.0
Edge to Outlet: 16.5
Elevation Readings, ft
Top of Pavement at Core: 2.52
Top of OGBC after Coring: 3.31
Top of Pavement at Edge: 2.69
Top of Pavement at Outlet: 2.79
Outlet: 5.81
Infiltration Measures
Maximum Inflow Rate (gal/min): 12
Steady State Infiltration Rate (gal/min): 8
Depth to Upstream Head (ft): 0.79
Time to First Outflow (min:sec): 14:42
Time to Tracer Input (min:sec): 14:42
Time to Tracer Outflow (min:sec) 20:28
Water Inflow Stopped: Stop @ 150 gal
Calculations from Measurements
Cross Slope (%): 3.7 [=(2.69-2.52)/4.6]
Longitudinal Grade (%): 0.5 [=(2.79-2.69)/20.0]
Thickness of pavement above OGPB (ft) 0.79 [=3.31-2.52]
Maximum Inflow, Q (ft3/day): 2,310 [=192.5*12]
Head Difference, Δh (ft) 0.50 [=2.69-2.52+0.79+0.33-0.79]
Flow Length, L (ft): 4.6
Hydraulic Gradient, i (ft/ft): 0.11 [=0.50/1.6]
Cross Sectional Flow Area (ft2): 0.99 [=0.33*3]
Hydraulic Conductivity, K (fpd): 21,212 [=2,310/(0.11*0.99)]
76
all of the outlets tested in this study. Because there is no way of knowing what the true flow
plume width was for any particular core hole test, the calculated k values are best used as
comparators for the different types (unstabilized, cement stabilized, asphalt stabilized) and
gradations (open-graded No. 1, New Jersey) of permeable base materials tested. In other
words, the computed K values are more meaningful as relative indicators of the capacity and
functioning of the subdrainage system. When no inflow or outflow occurs, on the other
hand, this indicates a malfunctioning of the subdrainage system, due to a clogged base layer,
longitudinal pipe, and/or transverse outlet.
6.3 Field Permeability Testing Results
The hydraulic conductivity values calculated from all field measurements are
summarized in Table 6.1. As shown, all calculated hydraulic conductivities computed for the
USH 18/151 test section in Iowa-Dane Counties are in excess of 5,000 fpd, indicating very
good to excellent drainage characteristics. The average hydraulic conductivity for the
unstabilized permeable base (OGPB) is 17,481 fpd and there appears little variation due to
doweling or joint sealant. The average hydraulic conductivity for the cement-stabilized
permeable base (CSOG) is 15,129 fpd and there is a substantial variation due to joint sealant,
with the sealed section having a hydraulic conductivity of 21,212 fpd and the unsealed
sections averaging 12,087 fpd. The average hydraulic conductivity for the asphalt-stabilized
permeable base (ASOG) is 8,471 fpd which is significantly lower than the OGPB and CSOG
sections. There appears to be a slight variation due to doweling with the doweled section
having a hydraulic conductivity of 5,920 fpd and the undoweled sections averaging 9,747
fpd.
The results provided for STH 29 Brown County indicate adequate drainage capacity
in all sections. The data indicates a significant variation due to doweling but little variation
due to joint sealant. The average hydraulic conductivity for the unstabilized permeable base
(OGPB) sections without dowels is 2,817 fpd and 13,637 fpd for the doweled test sections.
The results provided for USH 151 Columbia-Dane Counties indicate adequate
drainage capacity in only the cement stabilized permeable base section (CSOG), with a
calculated hydraulic conductivity of 10,697 fpd. The base layers in the remaining three test
sections would not accept water, indicating a complete blockage of the layer. The exact
reason for this condition is unknown, however, the source aggregate for this project has a
history of degradation concerns that may have caused an increase in fine particles and
reduction in the permeability rate.

77
Table 6.1 Summary of Calculated Hydraulic Conductivities
Hwy
No.
County
Name
Test
Section
Dowels
Base
Type
Joints
Sealed
Hydraulic
Conductivity
fpd
USH 18/151 IOWA 1 N OGPB Y 17,949
USH 18/151 IOWA 2 N OGPB N 16,667
USH 18/151 IOWA 3 N CSOG Y 21,212
USH 18/151 IOWA 4 N CSOG N 10,802
USH 18/151 IOWA 5 N ASOG Y 10,234
USH 18/151 IOWA 6 N ASOG N 9,259
USH 18/151 DANE 11 Y CSOG N 13,371
USH 18/151 DANE 12 Y ASOG N 5,920
USH 18/151 DANE 13 Y OGPB N 17,828
STH29 BROWN 1 N OGPB N 3,241
STH29 BROWN 2 N OGPB Y 2,393
STH29 BROWN 3 Y OGPB Y 11,438
STH29 BROWN 4 Y OGPB N 15,837
USH 151 DANE 1 Y CSOG n/a 10,697
USH 151 COLUMBIA/DANE 2 Y NJOG n/a n/a
USH 151 COLUMBIA 3 Y ASOG n/a n/a
USH 151 COLUMBIA 4 Y OGPB n/a n/a
Note: n.a. indicates water flow into base layer could not be initiated.
6.4 Falling Weight Deflectometer (FWD) Analysis
Nondestructive deflection testing (NDT) using the WisDOT 2m-FWD was conducted
to provide a measure of the structural response of the pavement systems to loads similar in
magnitude and duration to moving truck loadings. Deflection testing at slab centers and
transverse joints was conducted prior to drainage testing to provide an indication of the
interior support and deflection load transfer. Deflection testing at wheelpath edge and corner
locations was performed during drainage testing to provide an indication of the uniformity of
slab support and deflection load transfer. Loads of approximately 9,000 and 20,000 lbf were
used at all test locations.
6.4.1 Analysis of Interior Slab Deflections
The foundation k-value and slab properties were backcalculated from center slab and
mid-slab transverse joint deflections using the following 7-step process which is applicable to
highway pavements:
Step 1: The deflection basin AREA was computed from center slab deflections using the
equation:
AREA = (6 / 0) (0 + 212 + 224 + 36) (6.3)
where: AREA = deflection basin AREA, in
i = surface deflection measure at i inches from the load

78
Step 2: A first estimate of the dense-liquid radius of relative stiffness of the pavement
system, lk-est is backcalculated using the equation:
l k-est = {ln[(36-AREA) / 1812.279133] / -2.55934}4.387009
(6.4)
The dense-liquid radius of relative stiffness is a combined term which incorporates
slab and subgrade properties and is defined as:
lk = [ (Ec Hc3) / (12 (1-c
2) k) ]
0.25 (6.5)
where: Ec = elastic modulus of concrete slab, psi
Hc = thickness of concrete slab, in
c = Poisson=s ratio of concrete slab (assumed = 0.15)
k = subgrade k-value, psi/in
Step 3: The effective dimensions of the test slab are computed as:
Leff = Lact + ( Ladj * LT 2 ) (6.6)
Weff = Wact + ( Wadj * LT 2 ) (6.7)
where: Leff, Weff = effective slab length or width, in
Lact, Wact = actual slab length or width, in
Ladj, Wadj = adjacent slab length or width, in
LT = deflection load transfer across adjacent slab joint(s), decimal form
LT = u / l
u = deflection of unloaded slab at 12 inches from the load plate, mils
l = deflection of the loaded slab at the center of loading, mils
Step 4: Slab size correction factors are computed as:
CFlk-est = 1 - 0.89434 exp [ -0.61662 (Leff / lk-est) 1.04831
] (6.8)
CFi = 1 - 1.15085 exp [ -0.71878 (Weff / lk-est) 0.80151
] (6.9)
where: CFlk-est = correction factor for estimated dense-liquid radius of relative
stiffness
CFi = correction factor for maximum center slab deflection
Step 5: Compute adjusted lk and i values by:
lk-adj = lk-est * CFlk-est (6.10)
i-adj = i * CFdi (6.11)
Step 6: The interior slab dynamic k-value is backcalculated using the equation:
ki = [1000 P / (i-adj lk-adj2)] [0.1253 - 0.008 a / lk-adj - 0.028 (a/lk-adj)
2] (6.12)

79
where: ki = interior subgrade dynamic k-value, psi/in
P = applied load, lb
i-adj = maximum adjusted center slab deflection, mils
lk-adj = adjusted dense-liquid radius of relative stiffness, in
a = radius of load, in
Step 7: The effective thickness of the concrete slab was estimated from previously
backcalculated lk and k values by a rearrangement of Eq. 6.5 as follows:
Hc = [ 11.73 lk-adj4 ki / Ec ]
1/3 (6.13)
where: Ec = known or assumed PCC modulus, psi
Incremental analysis of deflection response was also conducted to provide a means of
differentiating slab curling from poor foundation support. For those cases where the slab
temperature gradient (top temperature - bottom temperature) is excessively positive and
foundation support stiffness is high, the center of the slab may be lifted off the foundation.
In these cases, the maximum deflection and the deflection basin AREA term increase,
resulting in a reduced backcalculated foundation k-value. If, however, at least two of the
load levels used during testing were sufficient to create maximum surface deflections
exceeding the depth of curling-induced voids, incremental analysis should indicate an
increased dynamic foundation k-value and a decreased effective slab thickness as compared
to values backcalculated from individual load/deflection pairs.
For the purposes of this incremental analysis of interior deflections, the incremental
maximum interior deflection and loading were computed as:
1 2P P
inc
- =
P2 - P1
(6.14)
P1 - P2 = Pinc (6.15)
where: inc = incremental maximum interior deflection, inches
Pinc = incremental load, lb
P2 = maximum interior deflection at highest load level, inches
P1 = maximum interior deflection at second highest load level, inches
P2 = maximum load level, lb ( approximately 17,000 lb)
P1 = second highest load level, lb (approximately 12,000 lb)
The incremental maximum interior deflection and loading were then used to compute
the incremental dynamic K-value and the slab bending stiffness modulus using the following
equations:
ki-inc = (Pinc / inc lk-adj2) (0.1253 – 0.008(a/lk-adj) – 0.028 (a/lk-adj)
2) (6.16)

80
Dk = lk-adj4*ki-inc (6.17)
where: ki-inc = incremental interior dynamic K-value, psi/in
Dk = slab bending stiffness modulus, lb-in
The above processes were used to estimate slab and foundation properties for all
sections included in the FWD testing program. Table 6.2 provides a summary of these
results.
Table 6.2 Summary of Backcalculated Values from Interior Deflections
Hwy
No County
Test
Sect Dowels
Base
Type
Joints
Sealed
ki-inc
pci
Heff
in
USH 18/151 IOWA 1 N OGPB Y 278 9.5
USH 18/151 IOWA 2 N OGPB N 328 9.4
USH 18/151 IOWA 3 N CSOG Y 335 10.2
USH 18/151 IOWA 4 N CSOG N 370 10.8
USH 18/151 IOWA 5 N ASOG Y 270 10.4
USH 18/151 IOWA 6 N ASOG N 461 10.3
USH 18/151 IOWA 7a N CABC-TIC N 688 10.8
USH 18/151 IOWA 7b N CABC-TIC N 359 10.4
USH 18/151 IOWA 7c N CABC-TIC N 547 9.6
USH 18/151 IOWA 8 N CABC Y 772 9.7
USH 18/151 IOWA 9 N CABC N 284 10.8
USH 18/151 IOWA 10a Y CABC-TIC N 742 9.9
USH 18/151 IOWA 10b Y CABC-TIC N 385 11.3
USH 18/151 DANE 11 Y CSOG N 667 11.9
USH 18/151 DANE 12 Y ASOG N 372 11.2
USH 18/151 DANE 13 Y OGPB N 380 10.5
USH 18/151 DANE 14 Y CABC N 913 9.6
USH 18/151 DANE 15 Y CABC Y 367 10.3
STH29 BROWN 1 N OGPB N 245 10.0
STH29 BROWN 2 N OGPB Y 228 11.6
STH29 BROWN 3 Y OGPB Y 212 10.6
STH29 BROWN 4 Y OGPB N 201 10.7
USH 151 DANE 1 Y CSOG N 270 13.8
USH 151 DANE 2 Y NJOG N 428 13.1
USH 151 COLUMBIA 3 Y ASOG N 378 10.8
USH 151 COLUMBIA 4 Y OGPB N 536 11.1

81
6.4.2 Analysis of Transverse Joint Deflections
The transverse joint deflections obtained at mid-panel and wheel path (WhP)
locations were used to determine the normalized total joint deflection, dynamic edge and
corner foundation support, and transverse edge and corner slab support ratios. The
normalized total edge/WhP deflection is computed as the simple addition of unloaded and
loaded slab deflections, normalized to a common load level of 9,000 lb, using the equation:
U L9000 * +
DT = P
(6.18)
where: DT = total deflection, mils, normalized to 9-kip load
U = unloaded slab deflection, mils (12 inches from the load center)
L = loaded slab deflection, mils (at the center of loading)
P = applied load, lb
The normalized total edge/WhP deflection should remain relatively constant
regardless of available deflection load transfer, provided that slab thickness, elastic modulus,
and foundation support remain constant. The total edge/WhP deflection can be used as a
relative indicator of the overall edge structural capacity of a test section as well as an input
for the backcalculation of edge foundation support.
The edge foundation support was backcalculated based on the assumption that each
test slab is of uniform thickness and elastic modulus, using the following equation:
P
D DT 2.32 + a 0.82
D = k
Ke
4
Ke
1000
(6.19)
where: ke = transverse edge foundation k-value, psi/in
DK = slab bending stiffness modulus, lb-in
a = radius of load plate, inches ( = 5.9055 in)
DTe = normalized total edge deflection, mils
P = normalized load value ( = 9,000 lb)
Incremental analysis of transverse edge deflection response was conducted to provide
a means of differentiating slab curling from poor foundation support. For the purposes of
this incremental analysis of edge deflections, the incremental total edge deflection,
normalized to a 9,000 lb load level, was computed as:

82
P1 - P2
DT - DT* 9000 = DT
P1-eP2-einc-e (6.20)
where: DTe-inc = incremental normalized total edge deflection, mils
DTe-P2 = total transverse edge deflection at maximum load level, mils
DTe-P1 = total transverse edge deflection at second highest load level, mils
P2 = highest load level, lb (approximately 17,000 lb)
P1 = second-highest load level, lb (approximately 12,000 lb)
The incremental normalized total edge deflection was then used to compute the
incremental transverse edge slab support using the equation:
P
D DT 2.32 + a 0.82
D = k
Kince
4
Kince
1000
(6.21)
where: ke-inc = transverse edge incremental foundation k-value, psi/in
DK = slab bending stiffness modulus, lb-in
a = radius of load plate, inches ( = 5.9055 in)
DTe-inc = incremental normalized total edge deflection, mils
P = normalized load value ( = 9,000 lb)
In those cases where temperature curling alone was responsible for poor support,
incremental slab support should increase over that computed based on individual load levels,
provided at least two load levels produced sufficient total edge deflection to close any curl-
induced voids.
The uniformity of support under the transverse edge, termed the transverse edge slab
support ratio, is computed as the ratio of backcalculated incremental edge to interior dynamic
foundation k-values using the equation:
k
k = SSR
inci
inceet
(6.22)
where: SSRet = incremental transverse edge slab support ratio
ke-inc = incremental transverse edge foundation k-value, psi/in
ki-inc = incremental interior foundation k-value of the same test slab, psi/in
A similar approach was used to compute the corner support ratios based on the
deflections obtained at the wheelpath locations. In general, incremental edge/corner slab
support ratios less than approximately 0.75 are indicative of slabs with poor edge/corner
support due to foundation densification/pumping and/or temperature curling. Tables 6.3 and

83
6.4 provide a summary of the results obtained from the edge and wheelpath locations,
respectively, for the test sections included in the FWD program.
Table 6.3 Summary of Results from Transverse Edge Joint Deflections
Hwy
No
Test
Sect Dowels
Base
Type
Joints
Sealed LT
%
e-inc
mils@9k
ke-inc
pci
SSRe
USH 18/151 1 N OGPB Y 35.7 8.13 317 1.16
USH 18/151 2 N OGPB N 39.3 6.59 469 1.45
USH 18/151 3 N CSOG Y 50.5 7.38 372 1.07
USH 18/151 4 N CSOG N 52.2 6.50 388 1.06
USH 18/151 5 N ASOG Y 65.0 6.89 368 1.42
USH 18/151 6 N ASOG N 29.2 6.43 565 1.17
USH 18/151 7a N CABC-TIC N 10.4 5.84 594 0.86
USH 18/151 7b N CABC-TIC N 32.8 7.14 338 0.99
USH 18/151 7c N CABC-TIC N 67.9 5.94 546 1.07
USH 18/151 8 N CABC Y 29.2 4.89 760 0.97
USH 18/151 9 N CABC N 37.7 6.68 376 1.42
USH 18/151 10a Y CABC-TIC N 94.6 6.62 437 0.58
USH 18/151 10b Y CABC-TIC N 93.9 6.39 403 1.06
USH 18/151 11 Y CSOG N 92.2 4.78 587 0.83
USH 18/151 12 Y ASOG N 100.2 5.61 461 1.21
USH 18/151 13 Y OGPB N 94.7 10.29 203 0.54
USH 18/151 14 Y CABC N 92.4 6.80 462 0.67
USH 18/151 15 Y CABC Y 96.0 6.44 462 1.17
STH29 1 N OGPB N 17.1 11.36 181 0.81
STH29 2 N OGPB Y 18.6 10.37 159 0.73
STH29 3 Y OGPB Y 91.8 11.40 144 0.69
STH29 4 Y OGPB N 94.2 10.45 173 0.83
USH 151 1 Y CSOG N 98.2 7.33 173 0.66
USH 151 2 Y NJOG N 100.1 7.99 182 0.42
USH 151 3 Y ASOG N 96.1 10.30 178 0.45
USH 151 4 Y OGPB N 98.7 10.62 291 0.49

84
Table 6.4 Summary of Results from Transverse Wheel Path Joint Deflections
Hwy
No
Test
Sect Dowels
Base
Type
Joints
Sealed c-inc
mils@9k
kc-inc
pci
SSRc
USH 18/151 1 N OGPB Y 16.59 484 1.75
USH 18/151 2 N OGPB N 18.33 436 1.43
USH 18/151 3 N CSOG Y 19.64 360 1.07
USH 18/151 4 N CSOG N 14.93 473 1.34
USH 18/151 5 N ASOG Y 21.15 328 1.25
USH 18/151 6 N ASOG N 14.83 528 1.13
USH 18/151 7a N CABC-TIC N n/a n/a n/a
USH 18/151 7b N CABC-TIC N n/a n/a n/a
USH 18/151 7c N CABC-TIC N n/a n/a n/a
USH 18/151 8 N CABC Y n/a n/a n/a
USH 18/151 9 N CABC N n/a n/a n/a
USH 18/151 10a Y CABC-TIC N n/a n/a n/a
USH 18/151 10b Y CABC-TIC N n/a n/a n/a
USH 18/151 11 Y CSOG N n/a n/a n/a
USH 18/151 12 Y ASOG N n/a n/a n/a
USH 18/151 13 Y OGPB N n/a n/a n/a
USH 18/151 14 Y CABC N n/a n/a n/a
USH 18/151 15 Y CABC Y n/a n/a n/a
STH29 1 N OGPB N 12.82 213 0.88
STH29 2 N OGPB Y 11.54 225 1.09
STH29 3 Y OGPB Y 16.28 134 0.63
STH29 4 Y OGPB N 12.12 225 1.08
USH 151 1 Y CSOG N 15.42 92 0.32
USH 151 2 Y NJOG N 18.17 66 0.16
USH 151 3 Y ASOG N 18.87 90 0.25
USH 151 4 Y OGPB N 20.05 126 0.22
The deflection load transfer results provided in Table 6.3 indicate expected high
average values for the doweled sections and fair to poor values for the non-doweled sections.
For USH 18/151, the overall average load transfer values for the doweled and undoweled
sections were 94.8% and 40.9%, respectively. For the non-doweled sections, the overall
average load transfer values for the sealed and unsealed sections were 45.1% and 38.5%,
respectively. For the doweled sections, the overall average load transfer values for the sealed
and unsealed sections were 96.0% and 94.7%, respectively. For STH 29, the overall average
load transfer values for the doweled and non-doweled sections were 93.0% and 17.9%,
respectively. Little variation was noted for the sealed and unsealed sections. For USH 151,
the overall average load transfer value for the doweled sections was 98.3%.
The slab support ratios provided in Tables 6.3 and 6.4 indicate variable results based
on base type, joint reinforcement and joint sealant. For USH 18/151 Iowa-Dane Counties, all

85
corner support ratios indicate full support is maintained. The edge support ratios generally
indicate full support is maintained with the exception of three doweled and unsealed sections;
namely sections 10a (SSRe=0.58), 13 (SSRe=0.54) and 14 (SSRe=0.67). These reduced
values (< 0.75) suggest support problems due to densification of the base layers which is not
normally expected for doweled sections. For the STH 29 sections, reduced edge support is
noted for undoweled section 2 (SSRe=0.73) and doweled section 3 (SSRe=0.69) and reduced
corner support is noted for doweled section 3 (SSRc=0.63). While these values are near the
trigger value of 0.75, indicating only minor loss of support, it is interesting to note that these
are the sealed sections. The results from USH 151 Columbia-Dane Counties indicates
support problems under all edges and corners, with SSR values ranging from a low of 0.16 to
a high of 0.66.
6.5 Summary
The results of the permeability and FWD tests may provide insight into the
performance of the various test sections. For the USH 18/151 Iowa/Dane County test
sections, while all bases can be considered adequately drained (K > 1,000 fpd), there appears
to be a substantial reduction in the flow capacity for the ASOG base (#12) when compared to
the other permeable bases. This section, however, is performing well in comparison to others
in terms of PDI and IRI values. The poor load transfer evident in all un-doweled sections has
led to increased faulting in all but the ASOG sections 5 and 6 and increased roughness in all
but the ASOG sections 5 and 6 and the TIC sections 7a – 7c. Poor slab support ratios in the
doweled sections 10a, 13 and 14 has only led to increased roughness in the DGBC section
(#14). The PDI for all sections is generally comparable with the exception of increased PDI
values in TIC section 7a and OGBC section 2. As a whole, these results indicate the ASOG
is providing the best overall performance.
The results from the STH 29 Brown County sections indicate reduced drainage
capacity for the non-doweled OGBC base sections 1 and 2. These sections also exhibit
comparably poor load transfer, increased faulting and increased roughness. The doweled and
sealed section 3 exhibits reduced edge and corner support and increased PDI.
The results from USH 151 Columbia/Dane County sections indicate poor drainage
capacity for all but the CSOG section and poor edge and corner support for all sections.
However, the PDI values are similar for all sections and only the ASOG section 3 has
increased roughness.

86
CHAPTER 7 ECONOMIC ANALYSIS
7.1 Introduction
Existing WisDOT design practice, as well as recommended changes to current
practice, must be made in the context of costs. For that reason, an economic analysis was
performed to (1) quantify costs of comparable sections for the various base types, (2) identify
the stage or time in pavement life when maintenance and rehabilitation activities are
performed, and (3) quantify a life-cycle cost analysis (LCCA) for comparable sections. To
conduct this analysis, several tools were used to yield proposed design guidelines and
maintenance policies. The WisDOT LCCA methodology was used as the analysis tool, and
recent construction and maintenance cost data were collected and applied.
The WisPave Pavement Design and LCCA computer program is considered
department policy (WisDOT 2008). The FDM also states that, in addition to the pavement
surface type, pavement structures are classified as “drained” and “un-drained. The selection
of a drained system should be based on need, and in an LCCA, a drained pavement structure
should not be compared to an un-drained pavement structure (WisDOT 2009). Despite that
policy, a comparison was necessary to quantify the costs associated with each system. A
manual approach illustrated the transformation of all cost data over time using fundamental
engineering economic methods.
In addition to these standard tools, the developed performance relationships from
prior analyses were interfaced with the LCCA to reflect input levels of construction and
maintenance activities with the observed performance level. In essence, the relationships
were able to predict the age of a certain maintenance treatment based on the distress level.
The following sections describe the LCCA process.
7.2 Roadway Cross Section
Cross-sections for the project test sections are shown in Appendix B. Since there
were discrepancies in cross-section designs, standardized cross-sections for dense-graded and
open-graded base courses were created using the primary features from the three projects, as
illustrated in Figure 7.1.
Primary differences among projects included USH 18/151 having a 9-inch thick PCC
pavement, while both STH 29 and USH 151 having a 10-inch thick PCC pavement. Based
upon an investigation in the MEDPG software calibration project, a majority of drainable
PCC pavements in the state are 10 inches thick. Thus, a 10-inch thick pavement was selected
for LCCA; however, any pavement thickness must be designed for traffic loading and base
support. PCC pavement width was specified at 26 feet, with two 12-foot driving lanes and an
integral 2-foot shoulder. The composite shoulder consists of a 2-foot extension of the PCC
plus 8-foot wide asphaltic concrete (AC) surface, where the outer slab of the roadway is 14
feet with the striped pavement edge marked 12 feet from the centerline to indicate the limits
of the travel lane.

87
Figure 7.1 Pavement Cross Sections for LCCA
Drainage pipe diameter varied with 2-inch TIC and 4-inch perforated pipe underdrain
installed on USH 18/151, and 6-inch perforated pipe on both STH 29 and USH 151. Since it
was not possible to directly analyze the effectiveness of 4-inch and 6-inch pipe, and current
design guidelines in the FDM specify a 6-inch diameter drainage pipe, a 6-inch size was
adopted for the LCCA. TIC drainage with 2-inch diameter transverse pipe, that has not been
adopted as a design standard, was not considered. Outfall pipe spacing varied among the
three projects, from 100 feet to 400 feet. On the upper side of super-elevated curves,
drainage pipe was omitted. Ramps and at-grade interchanges may create a change in
spacing. The current FDM specifies a maximum 250-foot spacing, and since the spacing on
the projects could not be directly evaluated, the 250-foot spacing was used in the LCCA. A
tangent rural section having longitudinal perforated pipe on both edges was adopted.
Aggregate base designs vary for dense-graded and open-graded particle distribution.
Current policy states that minimum thickness of the Base Aggregate Open Graded (BAOG)
layer, when placed directly on subgrade, be 8 inches regardless of pavement type (WisDOT
2009). The particle size of the soil and BAOG must meet three filter criteria. If the filter
criteria are not met, 6 inches of crushed aggregate base is required to protect the BAOG layer
from contamination. A minimum thickness of 4 inches is required for the BAOG layer.
Dense Graded Base
PCC AC
8 ft
12 ft 2 ft
Open Graded Base
Edge Drain
4 in OGBC
4 in DGBC
PCC AC
8 ft
12 ft 2 ft
6 in DGBC

88
Based upon these requirements, and to provide a comparable section with dense and open
graded bases, the following base aggregate sections were used in the LCCA: (1) dense
graded base with 6 inches of crushed aggregate, and (2) open graded base with 4-inch lower
layer of dense-graded crushed aggregate and 4-inch upper layer of open-graded crushed
aggregate.
Details of the two alternatives are summarized in Table 7.1 for one direction of the 4-
lane freeway. Material in the shoulders, including base aggregate and asphalt concrete, were
included in the cost analysis since a substantial rehabilitation in the PCC pavement structure
(i.e., partial depth patching, full depth patching, diamond grinding, etc.), may directly impact
the shoulder. Shoulder base aggregate is not considered in the maintenance or rehabilitation.
A minimum 6-inch base thickness was designed for the entire 38-foot paved roadway width,
with shoulder base thickness of 12 to 13 inches to account for the 6 and 7 inch difference in
PCC pavement (10 inches) and both the inner and outer AC shoulders (3 and 4 inches),
respectively.
Table 7.1 Cross-Section Details for each Alternative
Cross-Section Element
(1)
Alternative 1
JPCP with Dense Base
(2)
Alternative 2
JPCP with Drainable Base
(3)
Paved Roadway Width 38 ft (4ft + 12ft + 14ft + 8 ft) 38 ft (4ft + 12ft + 14ft + 8 ft)
Pavement Structure 26-ft wide Type-8 PCC, 10-inch thick 26-ft wide Type-8 PCC, 10-inch thick
Left Shoulder 4-ft wide AC, 3-inch thick
4-ft wide dense aggregate base, 13-in thick
4-ft wide AC, 3-inch thick
4-ft wide dense aggregate base, 13-in
thick
Right Shoulder 2-ft Type-8 PCC 10-in thick (incl.)
8-ft wide AC, 4-in thick
8-ft wide dense aggregate base, 12-in thick
2-ft Type-8 PCC 10-in thick (incl.)
8-ft wide AC, 4-in thick
8-ft wide dense aggregate base, 12-in
thick
Drainage Pipe None 6-in perforated longitudinal pipe on
both edges of slab.
6-in transverse pipe, every 250 feet, 14
feet long, both sides of slab.
Apron end wall every 250 feet, both
sides of slab.
7.2 Cost Data
The most recent construction and maintenance cost data were collected from
WisDOT Average Unit Prices reported at the end of each fiscal year (WisDOT 2009). To
achieve the objectives of the LCCA, the unit costs of all major pay items associated with
PCC pavements over a life-cycle had to be collected. These bid prices include direct
construction costs from the material, labor, and equipment, plus indirect costs from job
overhead (temporary facilities, supervision, etc.), general and administrative expenses of the
company (main office expenses, legal, etc.), bonds, and profit. Table 7.2 provides the
relevant bid prices for the three most recent fiscal years.

89
Table 7.2 Input Cost Values for Life-Cycle Cost Analysis (Source: WisDOT 2009)
ITEM DESCRIPTION UNIT FY2007 FY2008 FY2009
(1) (2) (3) (4) (5) (6)
305.011 BASE AGGREGATE DENSE 3/4-INCH TON $9.78 $10.89 $11.05
305.0115 BASE AGGREGATE DENSE 3/4-INCH CY $17.33 $18.96 $24.50
310.011 BASE AGGREGATE OPEN GRADED TON $10.28 $11.86 $13.73
310.0115 BASE AGGREGATE OPEN GRADED CY $43.78 $20.00 $36.05
315.01 ASPHALTIC BASE TON $26.90 $70.00 $47.52
415.006 CONCRETE PAVEMENT 6-INCH SY $25.45 $39.34 $29.68
415.007 CONCRETE PAVEMENT 7-INCH SY $19.05 $22.58 $26.06
415.0075 CONCRETE PAVEMENT 7 1/2-INCH SY $21.17 $22.50 $25.70
415.008 CONCRETE PAVEMENT 8-INCH SY $19.88 $25.64 $25.04
415.0085 CONCRETE PAVEMENT 8 1/2-INCH SY $23.78 $26.34 $28.01
415.009 CONCRETE PAVEMENT 9-INCH SY $21.55 $21.40 $29.96
415.0095 CONCRETE PAVEMENT 9 1/2-INCH SY $24.17 $30.24 $34.28
415.01 CONCRETE PAVEMENT 10-INCH SY $20.88 $24.45 $27.46
415.0105 CONCRETE PAVEMENT 10 1/2-INCH SY $23.25 $47.00 $26.29
415.012 CONCRETE PAVEMENT 12-INCH SY $35.70 $37.61 $39.99
416.071 CONCRETE PAVEMENT REPAIR CY $186.78 $200.95 $202.00
416.0905 CONCRETE PAVEMENT CONT. DIAMOND GRINDING SY $2.59 $3.05 $2.40
455.0105 ASPHALTIC MATERIAL PG 58-28 TON $307.12 $386.93 $295.37
460.11 HMA PAVEMENT TYPE E-0.3 TON $26.35 $36.82 $37.12
460.1103 HMA PAVEMENT TYPE E-3 TON $25.64 $29.97 $39.43
490.01 SALVAGED ASPHALTIC PAVEMENT SY $1.29 $1.07 $1.00
490.0105 SALVAGED ASPHALTIC PAVEMENT TON $3.93 $4.26 $5.17
612.0104 PIPE UNDERDRAIN 4-INCH LF $8.88 $8.47 $7.10
612.0106 PIPE UNDERDRAIN 6-INCH LF $1.90 $4.79 $4.18
612.0204 PIPE UNDERDRAIN UNPERFORATED 4-INCH LF $11.10 $11.94 $8.69
612.0206 PIPE UNDERDRAIN UNPERFORATED 6-INCH LF $8.45 $8.56 $9.40
612.0404 PIPE UNDERDRAIN WRAPPED 4-INCH LF $10.00 $7.85 $5.52
612.0406 PIPE UNDERDRAIN WRAPPED 6-INCH LF $3.32 $6.38 $3.86
612.0806 APRON ENDWALLS FOR UNDERDRAIN REINF. CONC. EACH $110.27 $140.95 $132.99
90
An important stipulation in the LCCA is that the costs should take into account the
quantity of materials, as well as the location and type of project being analyzed (WisDOT
2009). Given the limited test sections in this project, average unit prices were used in the
analysis. A downside of using an average is not accounting for the effect of disproportionate
units prices from small and large volume projects, and from the location of the project itself.
Due to economy of scale, larger volume projects tend to have a lower unit price, while
smaller volume projects have a higher unit price. Possibilities of unbalanced bids and
different margins are also a factor.
In some cases, a lesser product size has a higher unit price because of material price
variation, and effects on labor and equipment productivity. For example, a 7-inch concrete
pavement may have a higher unit price than thicker mainline concrete pavements because of
potential effects from reduced productivity placing concrete in a more confined space, and
labor and equipment costs spread across a smaller volume and area of work. Additional
factors are the number of projects used on an annual basis, the project size, raw material price
fluctuations, cash or futures market pricing of commodities, special conditions in the
contract, and regional cost differentials from labor agreements and material suppliers. Thus,
average unit prices were more closely scrutinized by evaluating recent historic trends of
average contract unit prices for aggregate base, PCC pavement, and drainage pipe for years
2007 through 2009. Unit cost variability has a direct impact on the results of an LCCA, thus,
warranting an investigation.
Figure 7.2 illustrates the trends in aggregate bases (dense, open, and asphaltic) from
2007 to 2009. All untreated aggregate bases had a consistent upward trend, and it was
reasonable to adopt the most recent 2009 price for LCCA. The 3/4–inch NMAS was adopted
for dense-graded aggregate base consistent with current practice, and a smaller NMAS
provides improved grade control for the pavement base, a feature critical for high-quality ride
PCC pavement. Open-graded base specified in Section 310 is used on standard permeable
base concrete pavements. The percentage passing the #4 sieve ranges from 15 to 45%.
Wisconsin Gradation #1 was constructed on the USH 151 test sections in this study, where
the percentage passing the #4 sieve was limited to 0 to 10%, yielding a theoretical
permeability of 10,000 feet per day (Rutkowski 1998). USH 151 had an actual Gradation #1
passing the #4 sieve of 3%. One section constructed on USH 151 had New Jersey OGBC
with a passing #4 of 49% (specification range of 40 to 55%) and theoretical permeability of
3,000 feet per day. Neither the Gradation #1 or New Jersey OGBC are currently specified,
thus, the most reasonable approach for LCCA is to use the current Section 310 prices.
Conversions used, consistent with WisDOT policy, were 2 tons/CY for dense-graded base
and 1.75 tons/CY of open-graded base.

91
Figure 7.2 Unit Prices for Aggregate Base
Asphaltic base had a spike of $70/ton in 2008 followed by a drop to about $48/ton.
The asphaltic base cost item includes furnishing and installing both the aggregate and asphalt
cement, unlike the standard Section 460 E-series mainline or shoulder mixtures that pay
separately for the furnished and installed pavement (minus the asphalt cement) plus the
separate tonnage of asphalt cement used in the mixture. The purpose of the Section 315
asphaltic base is to provide the base support for overlaying with new pavement. The original
test sections limited the passing #4 sieve to 10%, allowing water permeability. One-inch
NMAS aggregate is specified and to be placed in 4-inch or thinner compacted layers. An E-3
Section 460 mixture (minus asphalt cement) averaged $39.42/ton in 2009, and with 4.6%
asphalt cement at $300/ton (non-polymer modified) added to a typical coarse-graded mixture,
the total furnished and installed price would be approximately $52/ton (95.6% x $40/ton +
4.6% x $300/ton). (E-3 was chosen since it is one of the higher tonnage asphaltic materials
and would reduce the effect of quantity pricing). The E-3 price closely approximates the
$47.52/ton asphaltic base price.
Cement-treated open-graded base, similar to that constructed on the test sections in
this study, is not an active WisDOT bid item. Currently, Section 320 concrete is specified to
provide a support base for pavement. This concrete base is constructed using Section 415
specifications, with modifications, and does not include an aggregate gradation and
permeability thresholds consistent with the objectives of a permeable base. The cement-
treated aggregate structure in the test sections was open graded allowing the flow of water.
The cement-treated bases in this study can be considered “lean concrete”, where the test
sections on USH 18/151 and USH 151 specified per cubic yard of mixture were: (1) 250 lbs
of Type-I Portland cement equating to about a 3-bag mixture, and (2) 11 gallons of water
(water-cement ratio of 0.36). The mixture was placed and roller compacted, then asphalt
emulsion sprayed across the surface at a rate of 0.1 to 0.2 gallons/S.Y. There is not a single
$0.00
$10.00
$20.00
$30.00
$40.00
$50.00
$60.00
$70.00
2007 2008 2009
$/to
n
Fiscal Year
Dense Graded 3/4-inch
Dense Graded 1 1/4-inch
Dense Graded 3-inch
Open Graded
Asphaltic Base

92
bid item available to assign to the cement-treated base, and a combination of costs would be
necessary to create a prototype bid item. Based on this price uncertainty, it was decided to
omit this base type for the LCCA, and focus the analysis on dense-graded aggregate base,
untreated open graded base, and asphaltic-treated aggregate base.
A plot of $/SY for PCC pavement thickness by year was prepared to illustrate the
cost trends (Figure 7.3) to assess whether thickness and year had a relative impact. Upward
cost trends were observed for 7, 8½, 9, 9½, 10, and 12-inch thick PCC pavements, while 6, 8,
and 10½-inch had a general decrease from 2008 to 2009. Overall, pavement costs have
generally increased the past few years. As noted earlier, the 10-inch thick pavement was
selected for the LCCA.
Figure 7.3 Unit Prices for Concrete Pavement Thickness
Drainage pipe unit prices were then analyzed by plotting the data in Figure 7.4. Both
the 4-inch and 6-inch prices were plotted since a 4-inch perforated pipe underdrain was
installed on USH 18/151, and 6-inch perforated pipe on STH 29 and USH 151. As
mentioned earlier, the 6-inch pipe has been selected for LCCA. The prices show a general
spike in 2008, for 4-inch unperforated and 6-inch wrapped, consistent with the spike in oil
prices, since polyvinyl chloride drainage pipe (AASHTO M 278) is a petroleum-based
product. The 6-inch perforated had an increasing trend, while 4-inch wrapped had a
decreasing trend.
$15.00
$20.00
$25.00
$30.00
$35.00
$40.00
$45.00
$50.00
2007 2008 2009
$/S
Y
Fiscal Year
6 inch
7 inch
7 1/2 inch
8 inch
8 1/2 inch
9 inch
9 1/2 inch
10 inch
10 1/2 inch
12 inch

93
Figure 7.4 Unit Prices for Underdrain Pipe
Unit bid prices were then compared to U.S. Consumer Price Index (inflation rates),
Producer Price Index, and the Building Construction Cost Index (BCCI) computed by ENR,
to determine if the unit price trends were consistent with broader index values. The BCCI is
computed with 68.38 hours of skilled labor at the 20-city average of bricklayers, carpenters
and structural ironworkers rates, plus 25 cwt of standard structural steel shapes at the mill
price prior to 1996 and the fabricated 20-city price from 1996, plus 1.128 tons of portland
cement at the 20-city price, plus 1,088 board-ft of 2 x 4 lumber at the 20-city price (ENR
2010). Table 7.3 compares the change in prices for the CPI, PPI, BCCI, and three primary
unit price items. Changes in dense-graded base more closely reflected inflation and the
BCCI than 10-inch PCC pavement and OGBC. This may be explained by dense-graded base
used across a greater number of project applications than PCC and OGBC, thus, aligning
more closely than PCC pavement and OGBC. Based on this review, it was decided to use
the most recent FY 2009 unit prices in the analysis.
Table 7.3 Unit Price Change Comparison
Year
(1)
U.S.
inflatio
n rate
(CPI),
%
(2)
Producer
Price
Index,
%
(3)
BCCI,
index
(4)
BCCI,
%
change
(5)
PCC
10-
inch,
$/SY
(6)
PCC
10-
inch, %
change
(7)
Dense
graded
¾-inch,
$/ton
(8)
Dense
graded
¾-inch,
%
change
(9)
Open
graded,
$/ton
(10)
Open
graded,
%
change
(11)
2007 2.8 3.9 4554 2.5 20.88 -- 9.78 -- 10.28 --
2008 3.8 6.3 4796 5.3 24.45 17.1 10.89 11.3 11.86 15.4
2009 -0.3 -2.6 4795 0 27.46 12.3 11.05 1.5 13.73 15.8
$0.00
$2.00
$4.00
$6.00
$8.00
$10.00
$12.00
$14.00
2007 2008 2009
$/LF
Fiscal Year
4-inch unperforated
6-inch unperforated
4-inch wrapped
6-inch wrapped

94
7.3 Timing of Maintenance and Rehabilitation Treatments
An important step in an LCCA is to determine the timing of maintenance and
rehabilitation treatments. A combination of WisDOT policies and findings from the doweled
sections on USH 18/151, STH 29, and USH 151 were used to determine the treatment
schedule. Only doweled sections were considered because of the 1988 design policy change.
The initial service life from the WisDOT FDM is shown in Table 7.4. According to
the FDM, an undrained PCC pavement has a service life of 25 years, while a drained
pavement adds 6 years of service life to yield 31 years. Rehabilitation service lives are
shown in Table 7.5. The FDM further states that the service lives for drained pavement
structures are estimates that add 25 percent more life onto like undrained pavement
structures. Service lives of pavement rehabilitations over drained bases are considered the
same as like pavement rehabilitations over undrained bases (WisDOT 2008).
Table 7.4 Initial Service Life (WisDOT 2008)
Initial Construction
(1)
Service Life, years
(2)
HMA – Traditional or Deep-Strength 18
HMA (drained) – Traditional or Deep-Strength 22
HMA – Perpetual 16
HMA over Pulverized HMA 18
HMA over Rubblized Concrete 22
Concrete 25
Concrete (drained) 31
Concrete over Rubblized Concrete 31
To establish the most probable sequence of rehabilitations, a standard sequence has
been developed to maximize initial cost expenditures (WisDOT 2008). Table 7.6 shows
typical rehabilitation scenarios and standard sequences that should be used as guidance.

95
Table 7.5 Rehabilitation Service Life (WisDOT 2008)
Rehabilitation
(1)
Service Life, years
(2)
HMA Overlay over Traditional HMA Pavement 12
HMA Overlay over CRCP 8
HMA Overlay over JRCP 8
HMA Overlay over JPCP 15
Mill and HMA Overlay over Deep-Strength HMA Pavement 12
Mill and HMA Overlay over Perpetual HMA Pavement 16
Concrete Grind 15a
Concrete Pavement Repair and Grind 15a
a New service life values to be published in 2010.
Table 7.6 Pavement Life Cycle for Doweled JPCP (WisDOT 2008)
Scenario
(1)
Rehabilitation Options1
(2)
Initial Construction (Concrete Pavement over granular base)
First Rehabilitation (Functional Repair) Concrete Pavement Repair and Grind or
Concrete Partial Depth Repair or
Concrete Pavement Repair and HMA Overlay
Second Rehabilitation (Functional or
Structural Repair)
Concrete Pavement Repair and Grind or
Concrete Pavement Repair and HMA Overlay
Third Rehabilitation (Functional or
Structural Repair)
Concrete Pavement Repair and HMA Overlay or
HMA Mill, Concrete Pavement Repair and HMA
Overlay or
Concrete Pavement Repair and Concrete Overlay
Reconstruction Pavement Removal and Pavement Reconstruction or
Concrete Rubblization and Pavement
Reconstruction
1 See Table 7.5 for service lives.
To supplement the treatment alternatives and policy timelines, the observed distresses
and the developed models from analysis in Chapter 5 were used to estimate the timing of the
maintenance and rehabilitation treatments. Observed distresses were reported in Tables 5.2
through 5.4, and statistical performance models were developed in Table 5.8. There were

96
only three significant distress models for doweled PCC for base type: (1) slab breakup extent,
(2) slab breakup severity, and (3) the extent of distressed joints and cracks. Estimates for
slab breakup extent computed a 10% area for DGBC and 12% area for OGBC. ASOG was
observed at 0% area. For slab breakup severity, estimated values are 1 for DGBC, 0.8 for
OGBC, and 0 for ASOG. Distressed joints and cracks were the only remaining significant
distress. DGBC and OGBC were estimated to be slight severity, while ASOG was estimated
at 1.5 (between slight and moderate). Additionally, patching (extent=1, severity=1) was
observed on the DGBC section. Table 7.7 summarizes distress modes by base type.
Table 7.7 Distress Modes at 20-year Life for Doweled JPCP
Distress Mode
(1)
DGBC
(2)
OGBC
(3)
ASOG
(4)
Slab breakup extent 10% area 12% area 0% area
Slab breakup severity 1 (1 to 3
blocks)
0.8 (1 to 3
blocks)
0 (none)
Distressed
joints/cracks severity
1 (slight) 1 (slight) 1.5 (slight to
moderate)
Patching Extent = 1
Severity = 1
none none
IRI 119 in/mile;
134 in/mile
100 in/mile (#1);
119 in/mile (#1);
90 in/mile (#2)
102 in/mile;
134 in/mile
The distress modes were then coupled with best practices and recommendations for
rehabilitating in-service concrete pavement. In a WHRP report by Titus-Glover and Darter
(2008), guidelines for full-depth concrete repair have been set forth. They are a composition
of existing WisDOT guidelines, Wisconsin research, and published national and regional
literature pertaining to full-depth repair projects in Wisconsin. Full-depth repair depends on
several factors, such as the extent and severity of the distress and rate of deterioration. As a
general rule, when 10 to 20 percent of the slabs in the outer traffic lane are cracked, a full-
depth repair is needed. The slab breakup and cracking is typically caused by repeated heavy
truck loads and loss of support from beneath the slab (Titus-Glover and Darter 2008). Based
on the observed conditions and developed models, both the DGBC and OGBC are at or
approaching full-depth repair warrants. In fact, the DGBC section #14 on USH 18/151 has
received full-depth repair (see Figure 7.5) at least a year prior to the 2009 dowel-bar retrofit
and diamond grind project.
The severity of the OGBC has not reached a full “1” rating, and is about 20% less
than DGBC with an “0.8” estimated rating. Since the DGBC section on USH 18/151 has
already received patching at 20 years, and none has been recorded on the OGBC but is about
80% of the DGBC severity, a reasonable estimate for full-depth repair would be DGBC at 20
years and OGBC at 24 years (20 years plus linear 20% to achieve severity=1 rating). A
single patch observed in a 528-foot segment would imply at least 10 patches in a one-mile
segment. OGBC extent has been measured at 12% slab area, so 11 patches would be

97
constructed in a one-mile segment. Width of full-depth repair can range from 6 to 15 feet; to
standardize the analysis, a 6-foot wide segment a length of 26 feet was estimated.
Figure 7.5 Patching on Doweled Dense-Graded Test Section #14 on USH 18/151
For distressed joints and cracks, or general joint spalling, full-depth repair is
recommended when 50% of the joints in the outer lane have medium- or high-severity joint
deterioration, and/or when there are about 75 or more medium- or high-severity transverse
cracks per mile in the outer traffic lane (Titus-Glover and Darter 2008). Low-severity cracks
are part of the design and are not structural distresses. The ASOG sections have reached a
slight to moderate condition (USH 151 is slight, USH 18/151 is moderate) at 20 years of age.
It can be assumed that the full moderate condition is reached for the test sections in about 5
years at a non-linear rate; 1.5 reached at 20 years and 2 reached at 25 years. Using an
assumed single patch observed in a 528-foot segment would result in 10 patches in a one
mile segment. Width of full-depth repair was set at 6 feet and length set at 26 feet.
Three rehabilitations at 15-year service lives were planned over a 65-year service life,
including a 20-year initial life, 15-year life for full-depth patching, 15-year life for patching
and diamond grinding, and 15-year life for asphalt overlay. Since the OGBC and ASOG
initial service lives were 24 and 25 years, respectively, the remaining service life of the
asphalt overlay was credited back to the cost.
In the summer and fall of 2009, eastbound lanes of USH 18/151 in Iowa and Dane
Counties underwent their first rehabilitation. The rehabilitation included dowel-bar retrofit in
the non-doweled section, dowel-bar installation in the doweled sections where transverse
faulting was noted, full-depth patching, and diamond grinding of the entire surface. A field
investigation of USH 18/151 after construction documented the rehabilitation activities listed
in Table 7.8. The extent of full-depth patching per mile closely approximated the estimated

98
quantity in life-cycle cost analysis. It must be noted that the location of the dowel-bar retrofit
for the doweled sections (12, 13, 14, and 15) was mid-panel to remedy slab breakup.
Table 7.8 Rehabilitation Activities of USH 18/151 Eastbound Lanes in 2009
Test
Section
(1)
Base
Type
(2)
Doweled
Transverse
Joints
(3)
Sealed
Transverse
Joints
(4)
Dowel
Bar
Retrofit
(5)
Full
Depth
Patches
(6)
1 OGBC No Yes All 12
2 OGBC No No All 10
3 CSOG No Yes All 8
4 CSOG No No All 12
5 ASOG No Yes All 11
6 ASOG No No All 6
7 DGBC/TIC No No None 3
8 DGBC No Yes All 15
9 DGBC No No All 9
10 DGBC/TIC Yes No None 3
11 CSOG Yes No 23 joints 2
12 ASOG Yes No None 5
13 OGBC Yes No 33 joints 5
14 DGBC Yes No 17 joints 8
15 DGBC Yes Yes 15 joints 5
7.4 LCCA Computations
Life-cycle costing process illustrated the interface of standard WisDOT practice and
recent bid prices with the results of the performance analysis in this study. The general
inputs considered in the analysis included initial construction cost, maintenance and
rehabilitation costs, analysis period, and interest rate. A 65-year analysis period and a
discount rate of 5%, as defined by WisDOT policy, were used in the analysis.
After all the LCCA parameters were identified, the LCCA calculation was performed
using standard engineering economic analysis procedures for computing present worth costs.
For alternatives that have rehabilitation cycles that extend beyond 65 years, a “Rehabilitation
Salvage Value” was calculated and credited back into the alternative‟s “Total Facility Cost.”
The “Rehabilitation Salvage Value” calculation consists of discounting the linearly prorated
rehabilitation cost (WisDOT 2008). The cost to place a base and pave a 38-foot wide
roadway section for a distance of 1 mile is calculated in Table 7.9.

99
Table 7.9 New Construction Cost for 38-foot wide 1-mile length PCC Roadway
Base Type
(1)
Work Item
(2)
Quantity
(3)
Unit
(4)
Unit Price
(5)
Total Cost
(6)
Dense Graded Base PCC Pavement, 10-inch 15253 SY 27.46 $418,857
Pavement dense graded base, 6-inch thick 2542 CY 24.50 $62,284
AC inside shoulder, E-0.3 387 Ton 37.12 $14,373
AC inside shoulder, PG 58-28, 5.5% 21 Ton 295.37 $6,290
AC outside shoulder, E-0.3 1033 Ton 37.12 $38,328
AC outside shoulder, PG 58-28, 5.5% 57 Ton 295.37 $16,774
AC inside shld DGBC, 13-inch thick 636 CY 24.50 $15,571
AC outside shld DGBC, 12-inch thick 1564 CY 24.50 $38,329
Total = $610,806
Open Graded Base PCC Pavement, 10-inch 15253 SY 27.46 $418,857
Pavement open graded base, 4-inch thick 1695 CY 36.05 $61,098
Pavement dense graded base, 4-inch thick 1695 CY 24.50 $41,523
AC inside shoulder, E-0.3 387 Ton 37.12 $14,373
AC inside shoulder, PG 58-28, 5.5% 21 Ton 295.37 $6,290
AC outside shoulder, E-0.3 1033 Ton 37.12 $38,328
AC outside shoulder, PG 58-28, 5.5% 57 Ton 295.37 $16,774
AC inside shld DGBC, 13-inch thick 636 CY 24.50 $15,571
AC outside shld DGBC, 12-inch thick 1564 CY 24.50 $38,329
Long. Perf. Wrapped Pipe, 6-inch dia 10560 LF 3.86 $40,762
Trans. Pipe, 6-inch dia. 486 LF 9.40 $4,566
Apron endwalls 44 Each 132.99 $5,883
Total = $702,353
Asphalt Stabilized
Base PCC Pavement, 10-inch 15253 SY 27.46 $418,857
Asphaltic pavement base, 4-inch thick 3356 Ton 47.52 $159,464
Pavement dense graded base, 4-inch thick 1695 CY 24.50 $41,523
AC inside shoulder, E-0.3 387 Ton 37.12 $14,373
AC inside shoulder, PG 58-28, 5.5% 21 Ton 295.37 $6,290
AC outside shoulder, E-0.3 1033 Ton 37.12 $38,328
AC outside shoulder, PG 58-28, 5.5% 57 Ton 295.37 $16,774
AC inside shld DGBC, 13-inch thick 636 CY 24.50 $15,571
AC outside shld DGBC, 12-inch thick 1564 CY 24.50 $38,329
Long. Perf. Wrapped Pipe, 6-inch dia 10560 LF 3.86 $40,762
Trans. Pipe, 6-inch dia. 486 LF 9.40 $4,566
Apron endwalls 44 Each 132.99 $5,883
Total = $800,720

100
An additional two inches of subbase for a dense-graded base was omitted since it
assumed that the roadway profile would be adjusted for grade difference. Since project time
frame and number of rehabilitations were similar, these items were omitted:
Preliminary engineering costs
Engineering and contingencies
Mobilization
Traffic control costs
Sales tax (included in material price and overall unit price)
Labor overhead (included in bid unit price)
Rumble strips since design varies (integral to PCC, or AC shoulder).
Pavement markings
The dense-graded section has the lowest initial construction cost of $610,806. It costs
an additional $91,547 to construct an untreated OGBC system, an increase of 14%. This cost
increase is from approximately $40,000 for permeable stone base and $50,000 for the gravity
drained pipe system. (Note, this percentage would change if asphalt shoulders and base were
removed from the cost). The ASOG system costs more than both the DGBC and OGBC
systems, with relative cost increases of 31% and 14%.
The rehabilitation costs for all three alternatives include full-depth repair for a 6-foot
x 26-foot area and depth of 10 inches. Total volume of concrete per repair is 4.8 CY. Bid
price for full-depth concrete repair is $202.00/CY, or a total cost of $970 each. Crack filling
has not been clearly defined and was omitted from the LCCA, and would have a negligible
effect if the timing is similar among alternatives.
The costs of the relevant activities were computed for each year with data using the
line-item construction and treatment estimates. Present worth costs were computed for all
future rehabilitations using standard time-based Equation 7.1.
$P = $F / (1 + i) n (7.1)
Where,
$P = Current year (2009) cost;
$F = Future year cost adjusted for inflation/discount rate;
i = Interest rate, 0.05; and
n = Number of years between base year and rehabilitation treatment.
Tables 7.10 through 7.12 compute the 65-year life-cycle costs for the three base
alternatives. A summary of costs is provided in Table 7.13. Table 7.14 combines the cost
analysis with primary performance characteristics identified earlier.
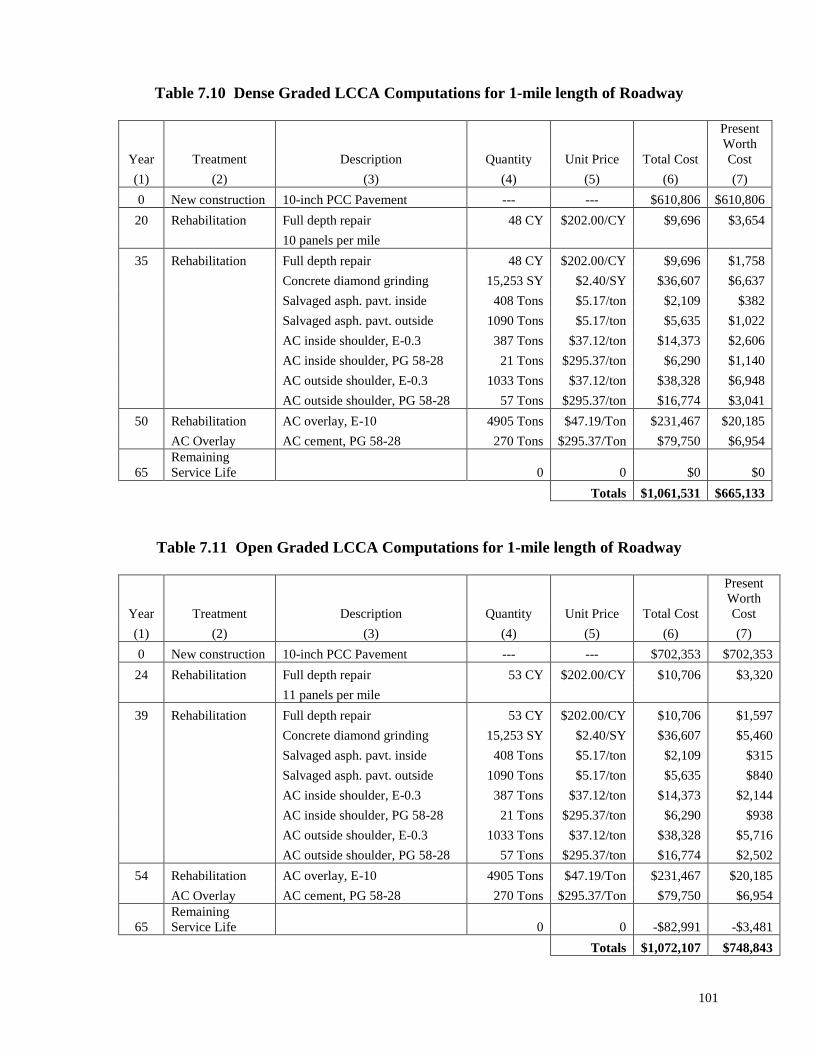
101
Table 7.10 Dense Graded LCCA Computations for 1-mile length of Roadway
Year Treatment Description Quantity Unit Price Total Cost
Present
Worth
Cost
(1) (2) (3) (4) (5) (6) (7)
0 New construction 10-inch PCC Pavement --- --- $610,806 $610,806
20 Rehabilitation Full depth repair 48 CY $202.00/CY $9,696 $3,654
10 panels per mile
35 Rehabilitation Full depth repair 48 CY $202.00/CY $9,696 $1,758
Concrete diamond grinding 15,253 SY $2.40/SY $36,607 $6,637
Salvaged asph. pavt. inside 408 Tons $5.17/ton $2,109 $382
Salvaged asph. pavt. outside 1090 Tons $5.17/ton $5,635 $1,022
AC inside shoulder, E-0.3 387 Tons $37.12/ton $14,373 $2,606
AC inside shoulder, PG 58-28 21 Tons $295.37/ton $6,290 $1,140
AC outside shoulder, E-0.3 1033 Tons $37.12/ton $38,328 $6,948
AC outside shoulder, PG 58-28 57 Tons $295.37/ton $16,774 $3,041
50 Rehabilitation AC overlay, E-10 4905 Tons $47.19/Ton $231,467 $20,185
AC Overlay AC cement, PG 58-28 270 Tons $295.37/Ton $79,750 $6,954
65
Remaining
Service Life 0 0 $0 $0
Totals $1,061,531 $665,133
Table 7.11 Open Graded LCCA Computations for 1-mile length of Roadway
Year Treatment Description Quantity Unit Price Total Cost
Present
Worth
Cost
(1) (2) (3) (4) (5) (6) (7)
0 New construction 10-inch PCC Pavement --- --- $702,353 $702,353
24 Rehabilitation Full depth repair 53 CY $202.00/CY $10,706 $3,320
11 panels per mile
39 Rehabilitation Full depth repair 53 CY $202.00/CY $10,706 $1,597
Concrete diamond grinding 15,253 SY $2.40/SY $36,607 $5,460
Salvaged asph. pavt. inside 408 Tons $5.17/ton $2,109 $315
Salvaged asph. pavt. outside 1090 Tons $5.17/ton $5,635 $840
AC inside shoulder, E-0.3 387 Tons $37.12/ton $14,373 $2,144
AC inside shoulder, PG 58-28 21 Tons $295.37/ton $6,290 $938
AC outside shoulder, E-0.3 1033 Tons $37.12/ton $38,328 $5,716
AC outside shoulder, PG 58-28 57 Tons $295.37/ton $16,774 $2,502
54 Rehabilitation AC overlay, E-10 4905 Tons $47.19/Ton $231,467 $20,185
AC Overlay AC cement, PG 58-28 270 Tons $295.37/Ton $79,750 $6,954
65
Remaining
Service Life 0 0 -$82,991 -$3,481
Totals $1,072,107 $748,843

102
Table 7.12 Asphalt Stabilized OGBC LCCA Computations for 1-mile length of
Roadway
Year Treatment Description Quantity Unit Price Total Cost
Present
Worth
Cost
(1) (2) (3) (4) (5) (6) (7)
0 New construction 10-inch PCC Pavement --- --- $800,720 $800,720
25 Rehabilitation Full depth repair 48 CY $202.00/CY $9,696 $2,863
10 panels per mile
40 Rehabilitation Full depth repair 48 CY $202.00/CY $9,696 $1,377
Concrete diamond grinding 15,253 SY $2.40/SY $36,607 $5,200
Salvaged asph. pavt. inside 408 Tons $5.17/ton $2,109 $300
Salvaged asph. pavt. outside 1090 Tons $5.17/ton $5,635 $800
AC inside shoulder, E-0.3 387 Tons $37.12/ton $14,373 $2,042
AC inside shoulder, PG 58-28 21 Tons $295.37/ton $6,290 $893
AC outside shoulder, E-0.3 1033 Tons $37.12/ton $38,328 $5,444
AC outside shoulder, PG 58-28 57 Tons $295.37/ton $16,774 $2,383
55 Rehabilitation AC overlay, E-10 4905 Tons $47.19/Ton $231,467 $20,185
AC Overlay AC cement, PG 58-28 270 Tons $295.37/Ton $79,750 $6,954
65
Remaining
Service Life 0 0 -$103,739 -$4,351
Totals $1,147,706 $844,810
Table 7.13 Categorical Cost Comparison of Base Alternatives
Base Type
(1)
Net Present Worth ($/roadway-mile)
Initial
Construction
(2)
Rehabilitation
(3)
Salvage
(4)
Total
(5)
DGBC 610,806 54,327 0 665,133
OGBC 702,353 49,971 -3,481 748,843
ASOG 800,720 48,441 -4,351 844,810
Dense-graded base was the least cost among all base alternatives, with a total
estimated present-worth cost of $665,133 per roadway mile. Open-graded permeable bases
were more expensive, with the estimated cost of untreated open-graded base at $748,843 and
asphalt-stabilized open-graded base at $844,810. These costs translate to increases of 13%
for untreated open-grade base and 27% for asphalt-stabilized open-graded base. When only
cost is considered, the dense-graded base is the recommended choice. Rehabilitation cost for
dense-graded base was $4,000 to $6,000 more than the permeable base, but first construction
cost was the primary determinant. Another factor in choosing dense-graded base over open-

103
graded base is the drainage conditions on the project as set forth in the FDM guidelines.
Also, ride performance is another factor, where, on USH 18/151, the dense-graded base
sections had an IRI =135 ipm (unsealed) and IRI =119 ipm (sealed), while drained sections
were approximately IRI=100 ipm.
Table 7.14 Cost and Performance Comparison of Doweled PCC Base Alternatives
Base Type
(1)
Net Present
Worth,
$/roadway-
mile
(2)
20-year Pavement Distresses
(3)
20-year Surface Roughness
(4)
Dense Graded
Base Course
$665,133 10% slab break up
Slight distressed joints
and cracks
Rougher ride
IRI ≥ 119 in/mile
Open Graded
Base Course
$748,843 12% slab break up
Slight distressed joints
and cracks
Smoother ride
IRI = 90 in/mile, Gradation #2
IRI = 100 and 119 in/mile,
Gradation #1
Asphalt
Stabilized
Open Graded
Base Course
$844,810 No slab break up
Moderate distressed joints
and cracks
Lower composite
distresses
Smooth to rough ride
IRI = 102 and 134 in/mile

104
CHAPTER 8 CONCLUSIONS AND RECOMMENDATIONS
8.1 Conclusions
This research examined the performance of 20-year old doweled and non-doweled
PCC pavement sections constructed over a variety of base course materials. The test sections
examined were located along USH 18/151 (17 test sections), STH 29 in Brown County (4
test sections), and USH 151 (4 test sections). Data were collected for the Pavement Distress
Index (PDI), International Roughness Index (IRI), Falling Weight Deflectometer (FWD), and
water drainage to evaluate pavement performance, support conditions, and water
permeability through the base course. Both automated and manual pavement condition
surveys were conducted for each test section. First, a semi-automated electronic survey were
collected for transverse faulting and ride quality with IRI measurements in both wheel paths.
Pavement condition was manually measured for traditional PCC pavement distresses,
including slab breakup, distressed joints and cracks, joint crack filling, patching, surface
distress, longitudinal joint distress and distortion, and transverse faulting. In addition, a life
cycle cost analysis was conducted to determine the most cost effective base course material
for consideration in PCC pavement design. On the basis of data analyses, several
conclusions that relate to the pavement characteristics are presented in the following sub-
sections.
8.1.1 Base Type
For doweled pavements along USH 18/151, dense-graded base sections exhibited
poor ride quality compared to open-graded base sections. There was no significant difference
in ride quality among open-graded base sections. Asphalt-stabilized open-graded bases
exhibited the least composite distresses when compared to a dense-graded section on USH
18/151.
For non-doweled sections on USH 18/151, the cement-stabilized, asphalt-stabilized,
and TIC drains had the least amount of distress. Dense-graded and untreated OGBC had the
highest composite measure of pavement distress. Asphalt-stabilized open base and TIC
drains had the smoothest ride, while untreated and cement-stabilized OGBC had the rougher
ride.
USH 151 had doweled 10-thick PCC, unsealed skewed transverse joints, paved over a
4-inch top permeable base (untreated with two gradations, cement-stabilized, and asphalt-
stabilized) and 4-inch bottom dense base. All permeable base types had nearly the same
performance among the different bases with slight distressed joints/cracks. Slight differences
were untreated aggregate with 10% of slab area with slab breakup and surface distresses, and
asphalt-stabilized OGBC having slight transverse faulting. The finer New Jersey open-
graded base had the smoothest ride when compared to other open-graded sections. Asphalt-
stabilized open-graded base had the roughest ride, and un-stabilized and cement-stabilized
open-graded bases had intermediate values. In summary, the much finer-graded New Jersey
base had less composite distresses and a smoother ride.

105
8.1.2 Transverse Dowels
Combined data from the three projects found that non-doweled pavement generally
has a higher distress level than doweled, however, when two non-doweled outliers are
removed, the difference is less pronounced. The extent of transverse faulting was equal
among all test sections, however, the severity was higher for non-doweled joints with about
half of those sections rated a level 2 (¼ to ½ inch). All doweled sections were either at or
less than 0.02 inches. IRI was generally higher on non-doweled pavements, but many
doweled sections had an equal roughness to non-doweled sections.
8.1.3 Sealant
USH 18/151 sealed non-doweled joints produced a better performing pavement than
unsealed joints, however, sealant did not appear to have a consistent effect on ride. On two
doweled dense-graded sections, sealant slightly outperformed the unsealed section, with
minor patching as the prominent distress for the unsealed section. Both sections had
identical extent and severity levels for slab breakup, distressed joints/cracks, surface distress,
longitudinal distress, and transverse faulting.
STH 29 unsealed sections for doweled/non-doweled joints performed better than the
median PDI for the sealed sections. The sealed doweled pavement did perform a little better
than the non-doweled section, but the opposite occurred on the non-doweled sections. Sealed
doweled joints had a smoother ride than the other combinations. Sealed/non-doweled joints
produced the roughest ride, and as expected, non-doweled joints, whether sealed or unsealed,
had the highest IRI values.
8.1.4 Drainage
The average hydraulic conductivity for the unstabilized permeable base (OGPB) is
17,481 fpd and there appears little variation due to doweling or joint sealant. The average
hydraulic conductivity for the cement-stabilized permeable base (CSOG) is 15,129 fpd and
there is a substantial variation due to joint sealant, with the sealed section having a hydraulic
conductivity of 21,212 fpd and the unsealed sections averaging 12,087 fpd. The average
hydraulic conductivity for the asphalt-stabilized permeable base (ASOG) is 8,471 fpd which
is significantly lower than the OGPB and CSOG sections. There appears to be a slight
variation due to doweling with the doweled section having a hydraulic conductivity of 5,920
fpd and the non-doweled sections averaging 9,747 fpd.
The results provided for STH 29 Brown County indicate adequate drainage capacity
in all sections. The data indicates a significant variation due to doweling but little variation
due to joint sealant. The average hydraulic conductivity for the unstabilized permeable base
(OGPB) sections without dowels is 2,817 fpd and 13,637 fpd for the doweled test sections.
106
The results provided for USH 151 Columbia-Dane Counties indicate adequate
drainage capacity in only the cement stabilized permeable base section (CSOG), with a
calculated hydraulic conductivity of 10,697 fpd. The base layers in the remaining three test
sections would not accept water, indicating a complete blockage of the layer. The reason for
this condition is unknown.
Overall, for the USH 18/151 Iowa/Dane County test sections, while all bases can be
considered adequately drained (k > 1,000 fpd), there appears to be a substantial reduction in
the flow capacity for the ASOG base (#12) when compared to the other permeable bases.
This section, however, is performing well in comparison to others in terms of PDI and IRI
values. STH 29 Brown County sections indicate reduced drainage capacity for the non-
doweled OGBC base sections 1 and 2. USH 151 Columbia/Dane County sections indicate
poor drainage capacity for all but the CSOG section.
8.1.5 Structural Capacity
The deflection load transfer results indicate expected high average values for the
doweled sections and fair to poor values for the non-doweled sections. For USH 18/151, the
overall average load transfer values for the doweled and non-doweled sections were 94.8%
and 40.9%, respectively. For the non-doweled sections, the overall average load transfer
values for the sealed and unsealed sections were 45.1% and 38.5%, respectively. For the
doweled sections, the overall average load transfer values for the sealed and unsealed
sections were 96.0% and 94.7%, respectively. For STH 29, the overall average load transfer
values for the doweled and non-doweled sections were 93.0% and 17.9%, respectively.
Little variation was noted for the sealed and unsealed sections. For USH 151, the overall
average load transfer value for the doweled sections was 98.3%.
The slab support ratios indicate variable results based on base type, joint
reinforcement and joint sealant. For USH 18/151 Iowa-Dane Counties, all corner support
ratios indicate full support is maintained. The edge support ratios generally indicate full
support is maintained with the exception of three doweled and unsealed sections; namely
sections 10a (SSRe=0.58), 13 (SSRe=0.54) and 14 (SSRe=0.67). These reduced values (<
0.75) suggest support problems due to densification of the base layers which is not normally
expected for doweled sections. For the STH 29 sections, reduced edge support is noted for
undoweled section 2 (SSRe=0.73) and doweled section 3 (SSRe=0.69) and reduced corner
support is noted for doweled section 3 (SSRc=0.63). While these values are near the trigger
value of 0.75, indicating only minor loss of support, it is interesting to note that these are the
sealed sections. The results from USH 151 Columbia-Dane Counties indicates support
problems under all edges and corners, with SSR values ranging from a low of 0.16 to a high
of 0.66.
The results of the permeability and FWD tests may provide insight into the
performance of the various test sections. For the USH 18/151 Iowa/Dane County test
sections, poor load transfer evident in all non-doweled sections has led to increased faulting
in all but the ASOG sections 5 and 6 and increased roughness in all but the ASOG sections 5
and 6 and the TIC sections 7a – 7c. Poor slab support ratios in the doweled sections 10a, 13

107
and 14 has only led to increased roughness in the DGBC section (#14). The PDI for all
sections is generally comparable with the exception of increased PDI values in TIC section
7a and OGBC section 2. As a whole, these results indicate the ASOG is providing the best
overall performance.
The results from the STH 29 Brown County non-doweled OGBC base sections 1 and
2 indicate comparably poor load transfer, increased faulting and increased roughness. The
doweled and sealed section 3 exhibits reduced edge and corner support and increased PDI.
The results from USH 151 Columbia/Dane County sections indicate poor edge and
corner support for all sections. However, the PDI values are similar for all sections and only
the ASOG section 3 has increased roughness.
8.1.6 Life-Cycle Cost Analysis
A life-cycle cost analysis found that dense-graded base was the least cost among all
base alternatives, with a total estimated present-worth life-cycle cost of $665,133 per
roadway mile. Open-graded permeable bases were more expensive, with the estimated cost
of untreated open-graded base at $748,843 and asphalt-stabilized open-graded base at
$844,810. These costs translate to increases of 13% for untreated open-grade base and 27%
for asphalt-stabilized open-graded base. Rehabilitation cost for dense-graded base was
$4,000 to $6,000 more than the permeable base, but first construction cost was the primary
determinant.
8.2 Recommendations
An investigation is warranted as to why permeable bases (with the exception of
CSOG) on USH 151 in Columbia-Dane counties failed to drain during field testing.
This suggests a complete blockage of the base layers or drainage system. The
blockage may further explain the poor slab edge and corner support problems as
revealed in this research for the USH 151 sections. The trapped water can potentially
affect the foundation K-value and cause pumping in addition.
This research suggests that the selection of base material for PCC pavements should
be based on factors including life-cycle cost, drainage characteristics, pavement
distresses, and overall expected performance as dictated by ride quality, which is
measured in terms of the International Roughness Index (IRI). If cost is the only
consideration, then dense-graded base is the recommended choice. If ride quality is
the preferred criterion, then permeable bases should be considered.
Testing and analysis of additional test sections in the state will augment the data and
findings in this report. A simplified analysis would involve collection and synthesis
of WisDOT PDI and IRI performance data traditionally collected on a biennial basis.
An advanced analysis would include physical field testing similar to that conducted in
this study. Projects from the Rutkowski report (1998) include STH 50, STH 164, IH

108
43 in both Ozaukee and Walworth Counties. There was an additional IH 90 segment
in Rock County not included in the Rutkowski report.

109
REFERENCES
AASHTO (2008). Mechanistic-Empirical Pavement Design Guide, Interim Edition: A
Manual of Practice, American Association of State and Highway Transportation Officials,
Washington, D.C., July 2008.
AASHTO (1998), Supplement to the AASHTO Guide For Design of Pavement Structures-
Part II, Rigid Pavement Design & Rigid Pavement Joint Design, American Association of
State and Highway Transportation Officials, Washington, D.C.
AASHTO (1993). Guide for the Design of Pavement Structures, American Association of
State and Highway Transportation Officials, Washington, D.C.
AASHTO (1986). Guide for the Design of Pavement Structures, American Association of
State and Highway Transportation Officials, Washington, D.C.
AASHTO (1981). Interim Guide for Design of Pavement Structures, 1972, Chapter III
Revised, American Association of State and Highway Transportation Officials, Washington,
D.C.
ACPA (2000), “WinPAS Pavement Analysis Software-version 1.0.4”, Amercan Concrete Pavement Association, Skokie, IL.
Alavi, S., LeCates, J.F., and Tavares, M.P. (2008), “Falling Weight Deflectometer Usage”,
NCHRP Synthesis of Highway Practice No. 381, Transportation Research Board ,
Washington, D.C.
Aunet, B. (1989), “Estimating and Forecasting Equivalent Single Axle Loadings for
Pavement Design”, Wisconsin Department of Transportation, Division of Planning and
Budget, Madison, WI.
Buch, N., Chatti, K., Haider, S.W., Pulipaka, A.S., Lyles, R.W., Gilliland, D. (2006),
“Network-Level Evaluation of Specific Pavement Study-2 Experiment: Using a Long-Term
Pavement Performance Database”, Journal of the Transportation Research Board No. 1947,
Washington, D.C., pp 3-14.
Chen, D.-H., Scullion, T., Lee, T.-C., and Bilyeu, J. (2008), “Results from a Forensic
Investigation of a Failed Cement Treated Base”, Journal of Performance of Constructed
Facilities, American Society of Civil Engineers, Vol. 22, No. 3, pp. 143-153.
Chowdhury, T. and Hossain, M. (1999), “Use of Falling Weight Deflectometer Data for
Assessing Pavement Structural Evaluation Values”, Kansas Department of Transportation,
Topeka, KS, September 1999.
110
Crovetti, J.A. (2006), Cost Effective Concrete Pavement Cross Sections - Final Report,
Wisconsin Department of Transportation, Madison, WI.
Crovetti, J. A., “Analysis of Support Conditions Under Jointed Concrete Slabs Along USH
18/151,” Wisconsin Department of Transportation Report No. WI/SPR-04-95, Mar. 1995.
Davids, W.G., Wang, Z., Turkiyyah, G., Mahoney, J. P., and Bush, D. (2003), “Three-
dimensional finite element analysis of JPCP with EverFE2.2”, Transportation Research
Record No. 1853, Transportation Research Board, pp. 92-99.
Elfino, M.K. and Hossain, S. (2007), “Subsurface Drainage and Premature Distresses in
Concrete Pavement: A Case Study in Virginia”, Journal of the Transportation Research
Board No. 2004, Transportation Research Board, Washington, D.C., pp. 141-149.
FHWA (2002), “FWD calibration centers ensure states get quality data : states use falling-
weight deflectometer (FWD) data to develop more cost-effective rehabilitation strategies”,
Turner Fairbank Highway Research Center, McClean, VA,
<http://www.tfhrc.gov/pavement/ltpp/pdf/02067.pdf>, Accessed November 19, 2008.
FHWA (1997), “Advanced methods for using FWD deflection-time data to predict pavement
performance : LTTP Tech Brief”, Turner Fairbank Highway Research Center, McClean, VA,
July 1997.
Friedrichs, D. A., “The Effects of Truck Volume, Mix and Weight Distribution on Pavement
Design, Wisconsin Department of Transportation, Madison, WI. 1988.
Gisi, A.J., Brennan, J.J., Luedders, C.G., Manandhar, C.B., and Hossain, M. (2007), “Kansas
Experience with Drainable Portland Cement Concrete Pavements”, Proceedings of the
Transportation Research Board 86th Annual Meeting, Washington, D.C., 19p.
Hall, K.T. and Crovetti, J.A., “Effects of Subsurface Drainage on Pavement Performance –
Analysis of the SPS-1 and SPS-2 Field Sections”, National Cooperative Highway Research
Program Report 583, Transportation Research Board of the National Academies,
Washington, D.C, 2007.
Jiang, Y.J. and Darter, M.I. (2005), “Structural Factors of Jointed Plain Concrete Pavements:
SPS-2--Initial Evaluation and Analysis”, Federal Highway Administration, Washington,
D.C., 203 pages.
Khazanovich, L., and A. Gotlif. “Evaluation of Joint and Crack Load Transfer”, Report
FHWA-RD-02-088, Federal Highway Administration, Washington, D.C., 2003.
Mallela, J., Hall Jr, J.W., and Smith, K.L. (2007), “Role of Stabilized and Drainable Bases in
Early-Age Cracking on Concrete Airfield Pavements”, Journal of the Transportation
Research Board No. 2004, Transportation Research Board, Washington, D.C., pp 150-162.

111
Owusu-Ababio, S., and R.L. Schmitt (2003). “Paved Shoulders Adjacent to Concrete
Pavements: Final Report”, Wisconsin Department of Transportation, Wisconsin Highway
Research Program Report 03-03, Madison, WI, 2003.
PCA (1984). Thickness Design for Concrete Highway and Street Pavements, Portland
Cement Association, Skokie, Illinois, 1984.
Paterson, W.D.O. (1987) “Road Deterioration and Maintenance Effects: Models for
Planning and Management,” John Hopkins University Press, Baltimore, Maryland, 1987.
Perera, R.W., Byrum. C., and Kohn, S.D. Investigation of Development of Pavement
Roughness. FHWA-RD-97-147, Federal Highway Administration, Washington, DC, May
1998.
Prabhu, M., Varma, A.H., and Buch, N. (2007), “Experimental and Analytical Investigations
of the Mechanistic Effects of Dowel Misalignment in Jointed Concrete Pavements”,
Transportation Research Record No. 2037, Transportation Research Board, Washington
D.C., pgs. 12-29.
Rahman, F., Hossain, M., Hunt, M., and Romanoschi, S.A. (2008), “Evaluation of Subgrade
Resilient Modulus for Pavement Design Using Mechanistic-Empirical Pavement Design
Guide, Proceedings of the Transportation Research Board 87th Annual Meeting,
Transportation Research Board, Washington, D.C.
Rutkowski, T. S., Shober, S. F., and Schmeidlin, R. B. (1998), “Performance Evaluation of
Drained Pavement Structures,” Wisconsin Department of Transportation Report No.
WI/SPR-04-98, Dec. 1998, 41 pp. 2.
Rutkowski, T. S. (1993), “WisDOT Open-Graded Base Course National Open House – Phase
IV Final Report”, Wisconsin Department of Transportation, Research Study #87-5A,
DTFH71-91-DP87-WI-14, Report #WI-DP-02-92, August 1993.
Rutkowski, T. S. (1992a), “WisDOT Open-Graded Base Course National Open House –
Phase III Report”, Wisconsin Department of Transportation, Research Study #87-5,
DTFH71-91-DP87-WI-14, July 1992.
Rutkowski, T. S. (1992b), “Performance Evaluation of Drained Pavement Structures –
Interim Report”, Wisconsin Department of Transportation, Research Study #87-5,
DTFH71-91-DP87-WI-14, Aug. 1992.
Sargand, S.M., Wu, S., Figueroa, J.L. (2006), “Truck/Pavement/Economic Modeling and In-
Situ Field Test Data Analysis Applications - Volume 1: Influence of Drainage on Selection
of Base”, Final Report, Ohio Department of Transportation, Columbus, OH. Sawan, J.S., Darter, M. I., and Dempsey, B. J. (1982), “Structural Analysis and Design of PCC Shoulders,” Technical Report FHWA/RD-81/122, Federal Highway Administration, Washington, D.C.

112
Titus-Glover, L. and Darter, M.I. (2008). “Guidelines for Improving Full Depth Concrete
Repair of PCC Pavements in Wisconsin: Final Report”, Wisconsin Department of
Transportation, Wisconsin Highway Research Program Report 08-02, Madison, WI, January
2008.
Weiss, K. (1992), “Report on Phase II Demonstration Project #87: Subsurface Drainage
Systems in Wisconsin”, Wisconsin Department of Transportation, Research Study #87,
DTFH71-91-DP87-WI-14, July 1992.
Wen, H. and Chen, C. (2007), "Factors Affecting Initial Roughness of Concrete Pavement",
Journal of Performance of Constructed Facilities, American Society of Civil Engineers, Vol.
21 No. 6, pp 459-464.
Wisconsin DOT (2008). “Facilities Development Manual.” Roadway Standards and
Methods Section, <http://roadwaystandards.dot.wi.gov/standards/fdm/> (Nov. 19, 2008).
Wisconsin DOT (2009). “Average unit price list.” HCCI - Bid letting information,
<http://roadwaystandards.dot.wi.gov/hcci/bid-letting/reports/aupfy07-09.pdf> (Dec. 12,
2009).

113
Appendix A - Adjustment of Data Sets
Tables A.3 through A.7 provides the locations of the RP and Sequence Numbers for
the three projects, along with a comparison of the Sequence Number length with as-built
construction stationing. The purpose of this comparison was to verify that the traditional
Sequence Number was compatible with the construction plans during the overlay process.
The beginning and ending limits for STH 29 and USH 151 projects did not extend to
the limits of the Sequence Number, thus, a verification was not possible. It was possible to
compare all Sequence Number locations with as-built stationing on USH 18/151, and the
comparison proved that the lengths were within 1/100th
of a mile. This is important, since it
confirms that the stationing and RP overlay are compatible.
Table A.1 STH 29/32 Data Set Locations of Pathway Profiler Van
Index Distance Reference Road Reference Reference PIF Lane
to PDI Point Name Point Point Section
Survey Number From To Length
Segment Feature Feature
(1) (2) (3) (4) (5) (6) (7) (8)
29 SITE DELIMITER
30 1.0 284K 0.0 029E CTH U TEST 1 3229.0 Driving Lane
31 1.0 001 0.0 029E TEST 1 TEST 2 2500.0 Driving Lane
32 1.0 002 0.0 029E TEST 2 TEST 3 2500.0 Driving Lane
33 1.0 003 0.0 029E TEST 3 CONTROL 2500.0 Driving Lane
34 1.0 004 0.0 029E CONTROL END 2500.0 Driving Lane
35 SITE DELIMITER
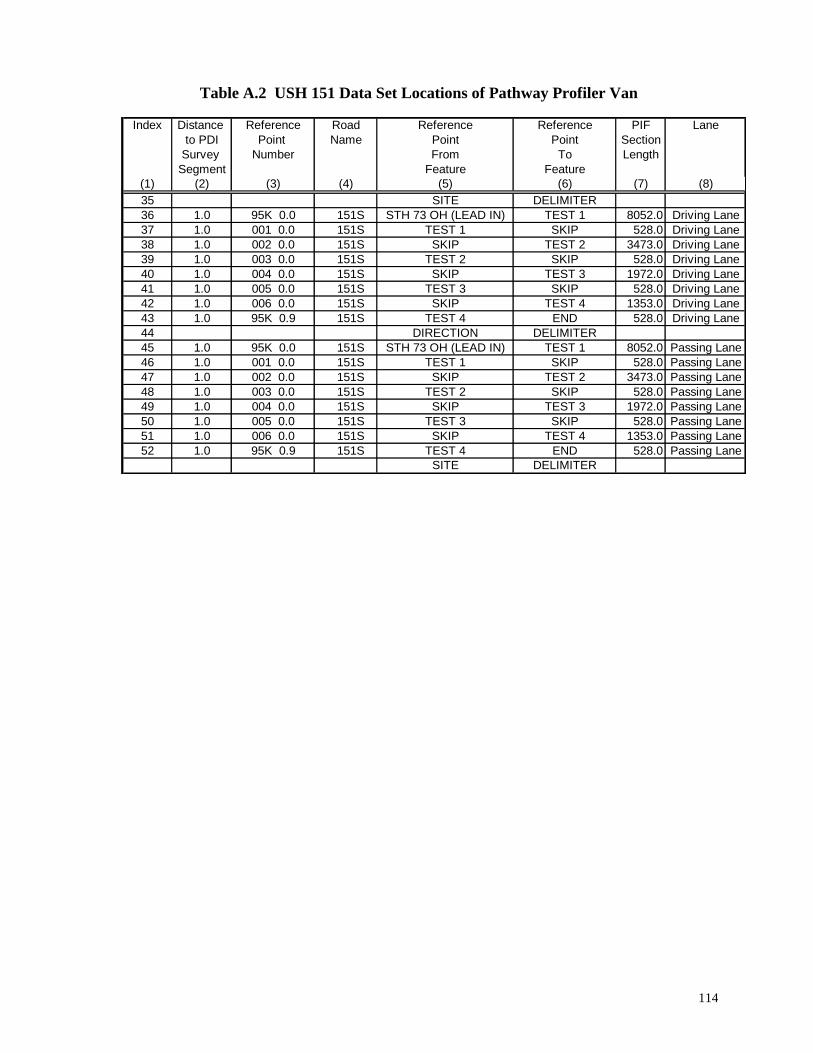
114
Table A.2 USH 151 Data Set Locations of Pathway Profiler Van
Index Distance Reference Road Reference Reference PIF Lane
to PDI Point Name Point Point Section
Survey Number From To Length
Segment Feature Feature
(1) (2) (3) (4) (5) (6) (7) (8)
35 SITE DELIMITER
36 1.0 95K 0.0 151S STH 73 OH (LEAD IN) TEST 1 8052.0 Driving Lane
37 1.0 001 0.0 151S TEST 1 SKIP 528.0 Driving Lane
38 1.0 002 0.0 151S SKIP TEST 2 3473.0 Driving Lane
39 1.0 003 0.0 151S TEST 2 SKIP 528.0 Driving Lane
40 1.0 004 0.0 151S SKIP TEST 3 1972.0 Driving Lane
41 1.0 005 0.0 151S TEST 3 SKIP 528.0 Driving Lane
42 1.0 006 0.0 151S SKIP TEST 4 1353.0 Driving Lane
43 1.0 95K 0.9 151S TEST 4 END 528.0 Driving Lane
44 DIRECTION DELIMITER
45 1.0 95K 0.0 151S STH 73 OH (LEAD IN) TEST 1 8052.0 Passing Lane
46 1.0 001 0.0 151S TEST 1 SKIP 528.0 Passing Lane
47 1.0 002 0.0 151S SKIP TEST 2 3473.0 Passing Lane
48 1.0 003 0.0 151S TEST 2 SKIP 528.0 Passing Lane
49 1.0 004 0.0 151S SKIP TEST 3 1972.0 Passing Lane
50 1.0 005 0.0 151S TEST 3 SKIP 528.0 Passing Lane
51 1.0 006 0.0 151S SKIP TEST 4 1353.0 Passing Lane
52 1.0 95K 0.9 151S TEST 4 END 528.0 Passing Lane
SITE DELIMITER

115
Table A.3 USH 18/151 Data Set Locations of Pathway Profiler Van
Index Distance Reference Road Reference Reference PIF Lane
to PDI Point Name Point Point Section
Survey Number From To Length
Segment Feature Feature
(1) (2) (3) (4) (5) (6) (7) (8)
1 SITE DELIMITER
2 6125.0 108G 0.0 18 W CTH HHH INT BEGIN TEST 3 ( CTH HHH ) 8237.0 Driving Lane
3 5702.0 106K 0.0 18 W TEST 3 ( CTH HHH ) TEST 2 ( CTH BB ) 7814.0 Driving Lane
4 5227.0 103G 0.0 18 W TEST 2 ( CTH BB ) TEST 1 ( CTH Y ) 7339.0 Driving Lane
5 4699.0 101K 0.0 18 W TEST 1 ( CTH Y ) END TEST 1 ( Dodge BR Stream STR ) 6811.0 Driving Lane
6 5333.0 101K 1.2 18 W END TEST 1 ( Dodge BR Stream STR ) USH 151S INT 7973.0 Driving Lane
7 SITE DELIMITER
8 1584.0 101K 0.0 18 E CTH Y BEGIN TEST 1 ( CTH BB ) 7339.0 Driving Lane
9 1584.0 103G 0.0 18 E TEST 1 ( CTH BB ) TEST 2 ( CTH HHH ) 7814.0 Driving Lane
10 1584.0 106K 0.0 18 E TEST 2 ( CTH HHH ) TEST 3 ( CTH HHH ) 8237.0 Driving Lane
11 1584.0 108G 0.0 18 E TEST 3 ( CTH HHH ) TEST 4 ( W. Brigham Rd ) 5650.0 Driving Lane
12 1584.0 110M 0.0 18 E TEST 4 ( W. Brigham Rd ) TEST 5 ( Thompson Rd ) 5122.0 Driving Lane
13 1584.0 111K 0.0 18 E TEST 5 ( Thompson Rd ) TEST 6 ( CTH T ) 2640.0 Driving Lane
14 1584.0 112D 0.0 18 E TEST 6 ( CTH T ) TEST 7 ( CTH ID OH ) 6758.0 Driving Lane
15 1584.0 113M 0.0 18 E TEST 7 ( CTH ID OH ) TEST 8 ( CTH K ) 6019.0 Driving Lane
16 1584.0 115G 0.0 18 E TEST 8 ( CTH K ) TEST 9 (Mound View Rd) 4488.0 Driving Lane
17 1584.0 117M 0.0 18 E TEST 9 (Mound View Rd) TEST 10 (Co Line) 6706.0 Driving Lane
18 1584.0 117M 0.0 18 E TEST 10 (Co Line) End Test 10 6706.0 Driving Lane
19 SITE DELIMITER
20 879.0 119K 0.2 18 E DANE CO LN (TEST 1) CTH F 3749.0 Driving Lane
21 2139.0 121K 0.0 18 E CTH F (TEST 2) CAVE OF MOUNDS RD 3960.0 Driving Lane
22 5404.0 122G 0.0 18 E CAVE/MOUNDS RD(T #3) CTH E 11035.0 Driving Lane
23 417.0 126D 0.0 18 E CTH E (TEST 4) STH 78 OH 3062.0 Driving Lane
24 542.0 127K 0.0 18 E STH 78 OH (CONTROL) SANDROCK RD STR 4805.0 Driving Lane
25 0.0 128M 0.0 18 E SANDROCK RD STR(SKIP CTH "JG" OH 4171.0 Driving Lane
26 680.0 129G 0.0 18 E CTH "JG" OH (TEST 5) STH 92 STR 3062.0 Driving Lane
27 0.0 130D 0.0 18 E STH 92 STR (SKIP) CTH "ID" OH 5386.0 Driving Lane
28 2246.0 131K 0.0 18 E CTH "ID" OH (TEST 6) TOWN HALL RD OH 3010.0 Driving Lane
29 SITE DELIMITER

116
Table A.4 STH 29/32 Sequence Number Locations
Table A.5 USH 151 Sequence Number Locations
Table A.6 USH 18/151 Iowa County EB Sequence Number Locations
Section Start Description End Description Length, Length, Station, As-built As-built
Name feet mile mile Start Sta. End Sta.
(1) (2) (3) (4) (5) (6) (7) (8)
Seq 36180 Center CTH 'U Center 'VV' 7181 1.36 out limits out limits 559+50
WISDOT PDI 0.3 mile past intersection 0.4 mile past intersection 528 0.10 0.10 out limits out limits
Seq 36190 Center CTH 'VV' Center Sunlite Dr 7210 1.39 1.37 559+50 631+60
WISDOT PDI 0.3 mile past intersection 0.4 mile past intersection 528 0.10 0.10 575+34 580+62
Section Start Description End Description Length, Length, Station, As-built As-built
Name feet mile mile Start Sta. End Sta.
(1) (2) (3) (4) (5) (6) (7) (8)
Seq 126370 STH 73 OH STH 73 STR 11563 2.19 --- out limits out limits
WISDOT PDI 0.3 mile past intersection 0.4 mile past intersection 528 0.10 --- out limits out limits
Seq 126350 STH 73 STR Columbia / Dane Co. Line 4649 0.92 0.88 1202+98 1156+49
WISDOT PDI 0.3 mile past intersection 0.4 mile past intersection 528 0.10 --- --- ---
Seq 126360 Columbia / Dane Co. Line CTH 'V' OH 8659 1.64 --- 1156+49 ---
WISDOT PDI 0.3 mile past intersection 0.4 mile past intersection 528 0.10 --- --- ---
Section Start Description End Description Length, Length, Station, As-built As-built
Name feet mile mile Start Sta. End Sta.
(1) (2) (3) (4) (5) (6) (7) (8)
Seq 21000 Center CTH 'Y' Center CTH 'BB' 7266 1.39 1.38 358+65 521+01
WISDOT PDI 0.3 mile past intersection 0.4 mile past intersection 528 0.10 0.10 374+49 379+77
Seq 21010 Center CTH 'BB' Center HHH to Ridgeway 7733 1.48 1.46 521+01 599+42
WISDOT PDI 0.3 mile past intersection 0.4 mile past intersection 528 0.10 0.10 536+85 542+13
Seq 21020 Center HHH to Ridgeway Center HHH to Ridgeway 8769 1.56 1.58 599+42 687+11
WISDOT PDI 0.3 mile past intersection 0.4 mile past intersection 528 0.10 0.10 615+26 620+54
Seq 21030 Center HHH to Ridgeway Center West Brigham Rd 5614 1.07 1.06 687+11 743+25
WISDOT PDI 0.3 mile past intersection 0.4 mile past intersection 528 0.10 0.10 702+95 708+23
Seq 21040 Center West Brigham Rd Center Thompson Dr. 5279 0.97 1.00 743+25 796+04
WISDOT PDI 0.3 mile past intersection 0.4 mile past intersection 528 0.10 0.10 759+09 764+37
Seq 21050 Center Thompson Dr. Center CTH 'T' 2651 0.50 0.50 796+04 822+55
WISDOT PDI 0.3 mile past intersection 0.4 mile past intersection 528 0.10 0.10 811+88 817+16
Seq 21060 Center CTH 'T' Center CTH 'ID' Overpass 9571 1.28 1.28 822+55 818+42
WISDOT PDI 0.3 mile past intersection 0.4 mile past intersection 528 0.10 0.10 838+39 843+67
Seq 21070 Center CTH 'ID' Overpass Center CTH 'K' 3108 1.14 1.12 818+42 849+50
WISDOT PDI 0.3 mile past intersection 0.4 mile past intersection 528 0.10 0.10 834+26 839+54
Seq 21080 Center CTH 'K' Center Mounds View Rd 4500 0.85 0.85 849+50 894+50
WISDOT PDI 0.3 mile past intersection 0.4 mile past intersection 528 0.10 0.10 865+34 870+62
Seq 21090 Center Mounds View Rd Dane / Iowa Co. Line 6672 1.27 1.26 894+50 961+22
WISDOT PDI 0.3 mile past intersection 0.4 mile past intersection 528 0.10 0.10 910+34 915+62
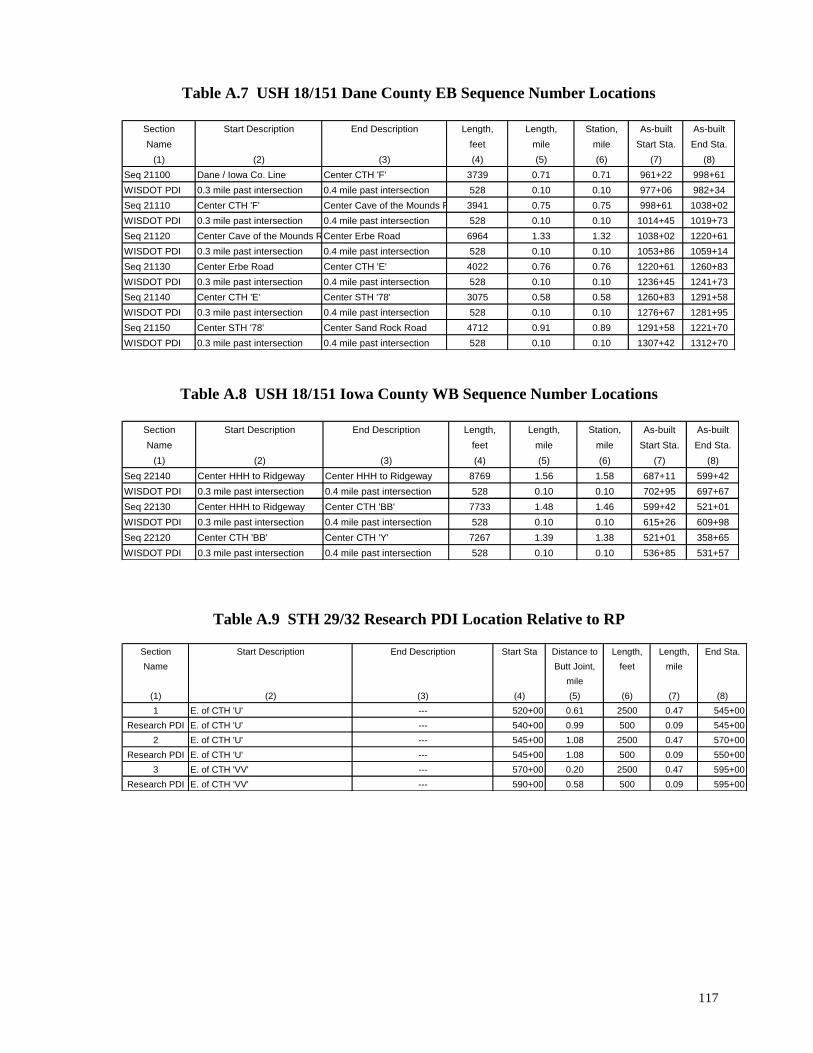
117
Table A.7 USH 18/151 Dane County EB Sequence Number Locations
Table A.8 USH 18/151 Iowa County WB Sequence Number Locations
Table A.9 STH 29/32 Research PDI Location Relative to RP
Section Start Description End Description Length, Length, Station, As-built As-built
Name feet mile mile Start Sta. End Sta.
(1) (2) (3) (4) (5) (6) (7) (8)
Seq 21100 Dane / Iowa Co. Line Center CTH 'F' 3739 0.71 0.71 961+22 998+61
WISDOT PDI 0.3 mile past intersection 0.4 mile past intersection 528 0.10 0.10 977+06 982+34
Seq 21110 Center CTH 'F' Center Cave of the Mounds Rd 3941 0.75 0.75 998+61 1038+02
WISDOT PDI 0.3 mile past intersection 0.4 mile past intersection 528 0.10 0.10 1014+45 1019+73
Seq 21120 Center Cave of the Mounds RdCenter Erbe Road 6964 1.33 1.32 1038+02 1220+61
WISDOT PDI 0.3 mile past intersection 0.4 mile past intersection 528 0.10 0.10 1053+86 1059+14
Seq 21130 Center Erbe Road Center CTH 'E' 4022 0.76 0.76 1220+61 1260+83
WISDOT PDI 0.3 mile past intersection 0.4 mile past intersection 528 0.10 0.10 1236+45 1241+73
Seq 21140 Center CTH 'E' Center STH '78' 3075 0.58 0.58 1260+83 1291+58
WISDOT PDI 0.3 mile past intersection 0.4 mile past intersection 528 0.10 0.10 1276+67 1281+95
Seq 21150 Center STH '78' Center Sand Rock Road 4712 0.91 0.89 1291+58 1221+70
WISDOT PDI 0.3 mile past intersection 0.4 mile past intersection 528 0.10 0.10 1307+42 1312+70
Section Start Description End Description Length, Length, Station, As-built As-built
Name feet mile mile Start Sta. End Sta.
(1) (2) (3) (4) (5) (6) (7) (8)
Seq 22140 Center HHH to Ridgeway Center HHH to Ridgeway 8769 1.56 1.58 687+11 599+42
WISDOT PDI 0.3 mile past intersection 0.4 mile past intersection 528 0.10 0.10 702+95 697+67
Seq 22130 Center HHH to Ridgeway Center CTH 'BB' 7733 1.48 1.46 599+42 521+01
WISDOT PDI 0.3 mile past intersection 0.4 mile past intersection 528 0.10 0.10 615+26 609+98
Seq 22120 Center CTH 'BB' Center CTH 'Y' 7267 1.39 1.38 521+01 358+65
WISDOT PDI 0.3 mile past intersection 0.4 mile past intersection 528 0.10 0.10 536+85 531+57
Section Start Description End Description Start Sta Distance to Length, Length, End Sta.
Name Butt Joint, feet mile
mile
(1) (2) (3) (4) (5) (6) (7) (8)
1 E. of CTH 'U' --- 520+00 0.61 2500 0.47 545+00
Research PDI E. of CTH 'U' --- 540+00 0.99 500 0.09 545+00
2 E. of CTH 'U' --- 545+00 1.08 2500 0.47 570+00
Research PDI E. of CTH 'U' --- 545+00 1.08 500 0.09 550+00
3 E. of CTH 'VV' --- 570+00 0.20 2500 0.47 595+00
Research PDI E. of CTH 'VV' --- 590+00 0.58 500 0.09 595+00

118
Table A.10 USH 151 Research PDI Location Relative to RP
Table A.11 USH 18/151 Iowa County EB Research PDI Location Relative to RP
Section Start Description End Description Start Sta Distance to Length, Length, End Sta.
Name Butt Joint, feet mile
mile
(1) (2) (3) (4) (5) (6) (7) (8)
4 W. of '73' --- 1250+00 1.33 3500 0.66 1215+00
Research PDI W. of '73' --- 1240+00 1.52 500 0.09 1235+00
3 W. of '73' --- 1215+00 1.99 2000 0.38 1195+00
Research PDI W. of '73' mi W. of W. end Deansville Rd Overpass1205+00 2.18 500 0.09 1200+00
2 W. of W. end of Dean. Rd Overpass --- 1195+00 0.15 2800 0.53 1167+00
Research PDI W. of W. end of Dean. Rd Overpass --- 1175+00 0.53 500 0.09 1170+00
1 W. of W. end of Dean. Rd Overpass --- 1167+00 0.68 2800 0.53 1139+00
Research PDI W. of Dane Co. Line --- 1155+00 0.03 500 0.09 1150+00
Section Start Description End Description Start Sta Distance to Length, Length, End Sta.
Name Butt Joint, feet mile
mile
(1) (2) (3) (4) (5) (6) (7) (8)
Control 361+80 3683 0.70 488+32
1 E. of CTH 'Y' E. of Cemetery Road 488+32 0.76 5280 1.00 541+12
Research PDI Past Butt Joint 504+16 0.30 528 0.10 509+44
2 E. of Cemetery Road 500' West of HHH to Ridgeway 541+12 0.09 5280 1.00 595+00
Research PDI Past Butt Joint 556+96 0.30 528 0.10 562+24
Control 595+00 5184 0.98 651+31
Bridge 651+51 652+96
Control 653+23 200 0.04 655+23
3 E. of W. End of CTH 'H' Overpass E. of HHH to Ridgeway 655+23 0.04 5200 0.98 707+23
Research PDI Past Butt Joint 655+23 0.30 528 0.10 660+51
4 E. of HHH to Ridgeway E. of W. Brigham Road 707+23 0.38 5200 0.98 760+70
Research PDI Past Butt Joint 707+23 0.30 528 0.10 712+51
5 E. of W. Brigham Road E of Boe Harris Road 760+70 0.33 5200 0.98 812+70
Research PDI Past Butt Joint 760+70 0.30 528 0.10 765+98
6 E of Boe Harris Road W. of CTH 'ID' 812+70 0.06 5200 0.98 864+70
Research PDI Past Butt Joint 812+70 0.30 528 0.10 817+98
7 E. of W. Industrial Drive W. of S. Jones St. Overpass 864+70 0.10 5201 0.98 816+86
Research PDI Past Butt Joint 864+70 0.30 528 0.10 869+98
GAP W. of S. Jones St. Overpass 816+86 0.01 295 0.06 819+81
8 E. of S. Jones St. Overpass E. of CTH 'K' 819+81 0.00 4740 0.90 867+21
Research PDI Past Butt Joint 819+81 0.30 528 0.10 825+09
9 E. of CTH 'K' E . of E. Mounds View Road 867+21 0.34 4700 0.89 914+21
Research PDI Past Butt Joint 867+21 0.30 528 0.10 872+49
10 E of Mounds View Road Dane Co. Line 914+21 0.37 4701 0.89 961+22
Research PDI Past Butt Joint 914+21 0.30 528 0.10 919+49

119
Table A.12 USH 18/151 Dane County EB Research PDI Location Relative to RP
Table A.13 USH 18/151 Iowa County WB Research PDI Location Relative to RP
An example of adjusting the performance data to the Research PDI is provided in Figure A.1.
This example is provided for Section 3 located in the west bound lane of USH 18/151, which begins
0.32 miles west of CTH „H‟ (Grove Street) overpass. The butt joint is located here and the research
PDI starts 0.3 miles from this point and runs 0.1 miles west along USH 18/151.
Figure A.1 Locating Research PDI for Section 3 in Westbound USH 18/151
Section Start Description End Description Start Sta Distance to Length, Length, End Sta.
Name Butt Joint, feet mile
mile
(1) (2) (3) (4) (5) (6) (7) (8)
11 Iowa Co. Line E. of CTH 'F' 961+22 --- 5280 1.00 1014+02
Research PDI past butt joint 961+22 0.30 528 0.10 966+50
12 E. of CTH 'F' E. of Cave of the Mounds Road 1014+02 0.29 5280 1.00 1066+82
Research PDI past butt joint 1014+02 0.30 528 0.10 1019+30
13 E. of Cave of the Mounds Road E. of Erbe Road 1066+82 0.55 5280 1.00 1232+57
Research PDI past butt joint 1066+82 0.30 528 0.10 1072+10
14 E. of Erbe Road STH 78 1232+57 0.23 5280 1.00 1285+37
Research PDI past butt joint 1232+57 0.30 528 0.10 1237+85
15 E. of CTH 'E' Sand Rock Road 1285+37 0.46 5313 1.01 1221+50
Research PDI past butt joint 1285+37 0.30 528 0.10 1290+65
Section Start Description End Description Start Sta Distance to Length, Length, End Sta.
Name Butt Joint, feet mile
mile
(1) (2) (3) (4) (5) (6) (7) (8)
3 W. of E. end of CTH 'H' Overpass HHH to Ridgeway 634+74 0.32 6294 1.19 573+80
Research PDI past butt joint 634+74 0.30 528 0.10 629+46
2 E. of Ridgeview Road Center of CTH 'BB' 573+80 0.07 5280 1.00 521+00
Research PDI past butt joint 573+80 0.30 528 0.10 568+52
1 CTH 'Y' 521+00 CL CTH 'BB' 5281 1.00 378+50
Research PDI past butt joint 521+00 0.30 528 0.10 515+72

120
Appendix B – Pavement Cross Sections
Figure B.1 USH 18/151 Sections 1 and 2 with Non-Stabilized OGBC
Figure B.2 USH 18/151 Sections 3, 4, and 11 with Cement-Stabilized OGBC

121
Figure B.3 USH 18/151 Sections 5, 6, and 12 with Asphalt-Stabilized OGBC
Figure B.4 USH 18/151 Sections 7 and 10 with TIC Drain

122
Figure B.5 USH 18/151 Sections 8, 9, 14 and 15 with Dense Graded Base Course

123
Figure B.6 STH 29 Sections 1 through 4 with Non-Stabilized OGBC

124
Figure B.7 USH 151 Section 1 with Cement-Stabilized OGBC

125
Figure B.8 USH 151 Section 2 with New Jersey Non-Stabilized OGBC

126
Figure B.9 USH 151 Section 3 with Asphalt-Stabilized OGBC

127
Figure B.10 USH 151 Section 4 with Non-Stabilized OGBC

128
Appendix C – Correlation Matrix
Pearson Correlation Coefficients, N = 25
Prob > |r| under H0: Rho=0
Dowel1Y0N B1D2O3C4A5T Seal1Y0N slbext slbsev
Dowel1Y0N 1.00000 -0.02414 -0.29244 -0.24019 0.02746
0.9088 0.1560 0.2475 0.8963
B1D2O3C4A5T -0.02414 1.00000 -0.30890 -0.40202 -0.55587
0.9088 0.1330 0.0464 0.0039
Seal1Y0N -0.29244 -0.30890 1.00000 0.19302 0.23681
0.1560 0.1330 0.3553 0.2544
slbext -0.24019 -0.40202 0.19302 1.00000 0.68599
0.2475 0.0464 0.3553 0.0002
slbsev 0.02746 -0.55587 0.23681 0.68599 1.00000
0.8963 0.0039 0.2544 0.0002
crkfill 0.29244 0.30890 -1.00000 -0.19302 -0.23681
0.1560 0.1330 <.0001 0.3553 0.2544
distjtckext 0.21246 -0.03077 -0.32733 0.03402 -0.14003
0.3079 0.8839 0.1102 0.8717 0.5044
distjtcksev -0.68641 0.00000 0.21822 0.06804 -0.14003
0.0002 1.0000 0.2947 0.7466 0.5044
patchext 0.28332 -0.17782 -0.18389 -0.04915 0.20229
0.1699 0.3951 0.3789 0.8155 0.3322
patchsev 0.28332 -0.17782 -0.18389 -0.04915 0.20229
0.1699 0.3951 0.3789 0.8155 0.3322
surfdistext -0.19872 -0.09656 0.11412 0.24019 0.14417
0.3410 0.6461 0.5870 0.2475 0.4917
surfdistsev -0.19872 -0.09656 0.11412 0.24019 0.14417
0.3410 0.6461 0.5870 0.2475 0.4917
LJDistext 0.28205 -0.15691 -0.06419 0.50707 0.48745
0.1719 0.4538 0.7605 0.0097 0.0135
LJDistsev 0.21602 -0.19864 -0.12857 0.53334 0.46809
0.2997 0.3411 0.5402 0.0060 0.0183
TranFaultext -0.48765 0.10006 0.22957 0.31235 0.32140
0.0134 0.6341 0.2696 0.1285 0.1172
TranFaultsev -0.57761 -0.13999 0.22908 0.21429 0.40425
0.0025 0.5045 0.2707 0.3037 0.0450
PDI -0.47114 -0.35788 0.14978 0.66441 0.44566
0.0174 0.0790 0.4748 0.0003 0.0256
IRIavg -0.54759 -0.40880 0.21129 0.59203 0.39375
0.0046 0.0425 0.3106 0.0018 0.0515
Faulting -0.82040 -0.23649 0.19689 0.56411 0.27566
<.0001 0.2551 0.3455 0.0033 0.1823

129
Pearson Correlation Coefficients, N = 25
Prob > |r| under H0: Rho=0
crkfill distjtckext distjtcksev patchext patchsev
Dowel1Y0N 0.29244 0.21246 -0.68641 0.28332 0.28332
0.1560 0.3079 0.0002 0.1699 0.1699
B1D2O3C4A5T 0.30890 -0.03077 0.00000 -0.17782 -0.17782
0.1330 0.8839 1.0000 0.3951 0.3951
Seal1Y0N -1.00000 -0.32733 0.21822 -0.18389 -0.18389
<.0001 0.1102 0.2947 0.3789 0.3789
slbext -0.19302 0.03402 0.06804 -0.04915 -0.04915
0.3553 0.8717 0.7466 0.8155 0.8155
slbsev -0.23681 -0.14003 -0.14003 0.20229 0.20229
0.2544 0.5044 0.5044 0.3322 0.3322
crkfill 1.00000 0.32733 -0.21822 0.18389 0.18389
0.1102 0.2947 0.3789 0.3789
distjtckext 0.32733 1.00000 0.16667 0.06019 0.06019
0.1102 0.4259 0.7750 0.7750
distjtcksev -0.21822 0.16667 1.00000 -0.24077 -0.24077
0.2947 0.4259 0.2463 0.2463
patchext 0.18389 0.06019 -0.24077 1.00000 1.00000
0.3789 0.7750 0.2463 <.0001
patchsev 0.18389 0.06019 -0.24077 1.00000 1.00000
0.3789 0.7750 0.2463 <.0001
surfdistext -0.11412 -0.21246 -0.13074 0.30692 0.30692
0.5870 0.3079 0.5333 0.1356 0.1356
surfdistsev -0.11412 -0.21246 -0.13074 0.30692 0.30692
0.5870 0.3079 0.5333 0.1356 0.1356
LJDistext 0.06419 0.19612 -0.29417 0.30692 0.30692
0.7605 0.3475 0.1535 0.1356 0.1356
LJDistsev 0.12857 0.17931 -0.20493 0.20353 0.20353
0.5402 0.3911 0.3258 0.3292 0.3292
TranFaultext -0.22957 -0.10361 0.41442 0.14967 0.14967
0.2696 0.6221 0.0394 0.4752 0.4752
TranFaultsev -0.22908 -0.33535 0.46657 -0.04213 -0.04213
0.2707 0.1013 0.0187 0.8415 0.8415
PDI -0.14978 0.24390 0.56767 0.07639 0.07639
0.4748 0.2400 0.0031 0.7166 0.7166
IRIavg -0.21129 -0.16374 0.36403 -0.04634 -0.04634
0.3106 0.4342 0.0736 0.8259 0.8259
Faulting -0.19689 -0.03628 0.55524 -0.26092 -0.26092
0.3455 0.8633 0.0040 0.2078 0.2078

130
Pearson Correlation Coefficients, N = 25
Prob > |r| under H0: Rho=0
Tran
surfdistext surfdistsev LJDistext LJDistsev Faultext
Dowel1Y0N -0.19872 -0.19872 0.28205 0.21602 -0.48765
0.3410 0.3410 0.1719 0.2997 0.0134
B1D2O3C4A5T -0.09656 -0.09656 -0.15691 -0.19864 0.10006
0.6461 0.6461 0.4538 0.3411 0.6341
Seal1Y0N 0.11412 0.11412 -0.06419 -0.12857 0.22957
0.5870 0.5870 0.7605 0.5402 0.2696
slbext 0.24019 0.24019 0.50707 0.53334 0.31235
0.2475 0.2475 0.0097 0.0060 0.1285
slbsev 0.14417 0.14417 0.48745 0.46809 0.32140
0.4917 0.4917 0.0135 0.0183 0.1172
crkfill -0.11412 -0.11412 0.06419 0.12857 -0.22957
0.5870 0.5870 0.7605 0.5402 0.2696
distjtckext -0.21246 -0.21246 0.19612 0.17931 -0.10361
0.3079 0.3079 0.3475 0.3911 0.6221
distjtcksev -0.13074 -0.13074 -0.29417 -0.20493 0.41442
0.5333 0.5333 0.1535 0.3258 0.0394
patchext 0.30692 0.30692 0.30692 0.20353 0.14967
0.1356 0.1356 0.1356 0.3292 0.4752
patchsev 0.30692 0.30692 0.30692 0.20353 0.14967
0.1356 0.1356 0.1356 0.3292 0.4752
surfdistext 1.00000 1.00000 0.19872 0.28635 0.25320
<.0001 0.3410 0.1652 0.2220
surfdistsev 1.00000 1.00000 0.19872 0.28635 0.25320
<.0001 0.3410 0.1652 0.2220
LJDistext 0.19872 0.19872 1.00000 0.91431 0.33135
0.3410 0.3410 <.0001 0.1057
LJDistsev 0.28635 0.28635 0.91431 1.00000 0.32337
0.1652 0.1652 <.0001 0.1148
TranFaultext 0.25320 0.25320 0.33135 0.32337 1.00000
0.2220 0.2220 0.1057 0.1148
TranFaultsev 0.00572 0.00572 0.00572 0.09860 0.69999
0.9784 0.9784 0.9784 0.6391 <.0001
PDI 0.25949 0.25949 0.41823 0.50955 0.56519
0.2104 0.2104 0.0375 0.0093 0.0032
IRIavg 0.17819 0.17819 -0.08515 -0.02912 0.21888
0.3941 0.3941 0.6857 0.8901 0.2932
Faulting 0.12436 0.12436 -0.12312 -0.08631 0.40761
0.5537 0.5537 0.5577 0.6817 0.0431

131
Pearson Correlation Coefficients, N = 25
Prob > |r| under H0: Rho=0
Tran
Faultsev PDI IRIavg Faulting
Dowel1Y0N -0.57761 -0.47114 -0.54759 -0.82040
0.0025 0.0174 0.0046 <.0001
B1D2O3C4A5T -0.13999 -0.35788 -0.40880 -0.23649
0.5045 0.0790 0.0425 0.2551
Seal1Y0N 0.22908 0.14978 0.21129 0.19689
0.2707 0.4748 0.3106 0.3455
slbext 0.21429 0.66441 0.59203 0.56411
0.3037 0.0003 0.0018 0.0033
slbsev 0.40425 0.44566 0.39375 0.27566
0.0450 0.0256 0.0515 0.1823
crkfill -0.22908 -0.14978 -0.21129 -0.19689
0.2707 0.4748 0.3106 0.3455
distjtckext -0.33535 0.24390 -0.16374 -0.03628
0.1013 0.2400 0.4342 0.8633
distjtcksev 0.46657 0.56767 0.36403 0.55524
0.0187 0.0031 0.0736 0.0040
patchext -0.04213 0.07639 -0.04634 -0.26092
0.8415 0.7166 0.8259 0.2078
patchsev -0.04213 0.07639 -0.04634 -0.26092
0.8415 0.7166 0.8259 0.2078
surfdistext 0.00572 0.25949 0.17819 0.12436
0.9784 0.2104 0.3941 0.5537
surfdistsev 0.00572 0.25949 0.17819 0.12436
0.9784 0.2104 0.3941 0.5537
LJDistext 0.00572 0.41823 -0.08515 -0.12312
0.9784 0.0375 0.6857 0.5577
LJDistsev 0.09860 0.50955 -0.02912 -0.08631
0.6391 0.0093 0.8901 0.6817
TranFaultext 0.69999 0.56519 0.21888 0.40761
<.0001 0.0032 0.2932 0.0431
TranFaultsev 1.00000 0.52795 0.47352 0.54976
0.0067 0.0168 0.0044
PDI 0.52795 1.00000 0.54863 0.65873
0.0067 0.0045 0.0003
IRIavg 0.47352 0.54863 1.00000 0.74595
0.0168 0.0045 <.0001
Faulting 0.54976 0.65873 0.74595 1.00000
0.0044 0.0003 <.0001

132