Performance Diagnosis of Mobile Applications and Cloud ...
204
Performance Diagnosis of Mobile Applications and Cloud Services KANG, Yu A Thesis Submitted in Partial Fulfilment of the Requirements for the Degree of Doctor of Philosophy in Computer Science and Engineering August 2016
-
Upload
khangminh22 -
Category
Documents
-
view
1 -
download
0
Transcript of Performance Diagnosis of Mobile Applications and Cloud ...
Performance Diagnosis of MobileApplications and Cloud Services
KANG, Yu
A Thesis Submitted in Partial Fulfilmentof the Requirements for the Degree of
Doctor of Philosophyin
Computer Science and Engineering
August 2016
Thesis Assessment Committee
Professor YIP Yuk Lap (Chair)
Professor LYU Rung Tsong Michael (Thesis Supervisor)
Professor LEE Pak Ching (Committee Member)
Professor Cao Jiannong (External Examiner)
Abstract of thesis entitled:Performance Diagnosis of Mobile Applications and Cloud Ser-
vicesSubmitted by KANG, Yufor the degree of Doctor of Philosophyat The Chinese University of Hong Kong in August 2016
Mobility and scalability are two recent technological trends whoserepresentative techniques are mobile computing and cloud comput-ing. For example, cloud-based mobile computing, as a mix of thetwo, is becoming popular. However, current mobile computing andcloud services do not satisfy all of the performance requirementsof the critical users. To improve user experience, it is necessaryto enhance the performance of them. In this thesis, we propose amethodology for tuning the performance of the mobile applicationsand cloud services. This thesis contributes significantly to theperformance tuning for both of them.
First, we examine how to tune the performance of mobile app.Rapid user interface (UI) responsiveness is a key consideration ofAndroid app developers. However, service requests to the cloudoften take a long time to execute. To avoid freezing the screen byblocking the UI thread, the requests are usually conducted underAndroid’s complicated concurrency model, making it difficult fordevelopers to understand and further diagnose the performance.This thesis presents DiagDroid, a tool specifically designed forAndroid UI performance diagnosis. The key notion of DiagDroidis that the UI-triggered asynchronous executions (e.g., cloud servicerequests) contribute to UI performance, and hence their performanceand their runtime dependency needs to be properly captured to
i
facilitate performance diagnosis. However, there are tremendousways to start an asynchronous execution, posing a great challengeto profiling such executions and their runtime dependency. To thisend, we properly abstract five categories of asynchronous executionsas the building basis. They can be tracked and profiled basedon the specifics of each category using a dynamic instrumentationapproach carefully tailored for Android. DiagDroid can thenprofile the asynchronous executions in a task granularity, equippingit with low-overhead and high compatibility merits. The tool issuccessfully applied in diagnosing 33 real-world open-source apps;we find 27 performance issues in 14 apps. These case studies showthe effectiveness of our tool for Android UI performance diagnosis.
Even when they are finely tuned, many services still requirea long time to execute. Mobile apps should be tolerant of longprocessing time. Good user interface (UI) design is the key tosuccessful mobile apps. UI latency, which can be considered as thetime between the commencement of a UI operation and its intendedUI update, is a critical consideration for app developers. There arecurrently no studies of how much UI latency a user can tolerate, andhow to find UI design defects that cause intolerably long UI latency.As a result, bad UI apps are still common in app markets, leading toextensive user complaints. This thesis examines user expectationsof UI latency, and develops a tool to pinpoint intolerable UI latencyin Android apps. To this end, we design an app to conduct a usersurvey of UI latency in apps. Through the survey, we examinethe relationship between user patience and UI latency. Therefore atimely screen update (e.g., a loading animation) is critical to heavy-weighted UI operations (i.e., those that incur a long execution timebefore the final UI update is available). We then design a tool that,by monitoring the UI inputs and updates, can detect apps that do notmeet this criterion. The survey and the tool are open-source releasedon-line. We also apply the tool to many real-world apps. The resultsdemonstrate the effectiveness of the tool in combating UI design
ii
defects in apps.Moreover, we investigate methods for improving the perfor-
mance of cloud services. In a cloud, the optimal deployment ofservers is key to providing better service for a wide range of mobileusers. User experience, which is affected by client-server connectiondelays, is a key concern for optimizing cloud service deployment;however, it is a challenging task to determine the user experience ofend users, as users may connect to a cloud service from anywhere.Moreover, there is generally no proactive connection between auser and the machine that hosts a service instance. In this thesis,we propose a framework to model cloud features and captureuser experience. Based on the obtained user experience data, weformulate an optimal service deployment model. Furthermore, manyservices involve multiple clouds. For example, a service providermay use a hybrid cloud that provides several services in privateand public clouds, or a service may request another service suchas ticket booking agency services. Therefore, we formulate modelsfor the multiple services co-deployment. Experiments based on areal-world dataset prove the effectiveness of the proposed modelsand algorithms.
In summary, we study the performance tuning problems formobile apps and cloud services. We propose the mobile app andthe cloud service performance tuning methods. Our tools are ableto locate previously unknown performance issues in real-worldmobile apps. Moreover, we collect a set of real-world QoS datafrom the Internet. The experiments based on the dataset prove theeffectiveness of our models and algorithms. We have public releasedthe dataset as well as the source codes of our tools.
iii
論文題目 :移動應用程序以及云服務的的性能調優
作者 :康昱
學校 :香港中文大學
學系 :計算機科學與工程學系
修讀學位 :哲學博士
摘要 :
輕量化和規模化是當前技術發展的兩大趨勢,其各自的代
表技術為移動計算和雲計算。例如基於云服務的移動計算作
为這兩種技術的融合正變得流行。然而現有的技術仍不能滿
足挑剔的用戶對應用程序性能的高要求。提高程序性能,改
善用戶體驗對移動應用程序和雲服務都十分關鍵。良好的用
戶體驗直接影響到應用程序能否成功吸引并留住用戶。在本
論文中,我們提出了分別針對移動應用程序和雲計算的性能
調優方法。
在本論文中,首先,我們研究了移動應用程序的性能調優。
在移動端,用戶界面的響應速度是用戶體驗的關鍵因素也是
衡量應用程序性能的重要指標。然而移動端的一些操作通常
需要比較久的時間完成。為了防止由於阻塞主線程導致的界
面凍結,耗時操作通常會利用移動操作系統(如 Android)中
的複雜並發模式完成。這使得開發人員對於程序性能的理解
以及進一步的調優變得困難。本論文針對 Android UI 性能調
iv
優的需求實現了 DiagDroid 工具。DiagDroid 設計的主要觀念
是 UI 觸發的異步任務(如雲服務請求)會影響 UI 性能,因
此對程序的性能調優時,需要記錄分析這些異步任務的性能
和他們之間的運行時依賴關係。然而,安卓提供了及其多樣
的方式啟動異步任務,這使得記錄異步任務以及他們之間的
依賴關係變得很困難。本論文中,我們將異步任務分為五類。
對每一種類型的異步任務,我們設計了針對性的追蹤和記錄
的方法。我們利用了 Android 的一些系統特性,基於輕量級
動態插樁,實現了這些記錄方法。我們實現了 DiagDroid 工
具,其能夠在任務級別記錄異步任務的生命週期,并具有低
開銷、高兼容性的優點。我們使用 DiagDroid 對 33 個我們不
熟悉的開源應用進行性能調優,發現了其中 14 個程序包含 27
個新的性能問題,這樣的結果是我們確信 DiagDroid 對開發
者進行性能調優是有幫助的。
即使經過性能調優,受限於如網絡連接的速度以及服務的
複雜度,許多操作仍然需要很長時間來完成。移動端的設計
需要能夠容忍長延遲的操作。而好的界面設計能夠提升用戶
對長延遲容忍度。而低界面延遲,也即從用戶操作至其相應
的界面更新之間的延遲,是好的界面設計的重要因素。現今
仍然缺乏一項完整的,針對用戶可以容忍多長的界面延遲,
以及如何檢測不良界面設計中導致用戶不耐煩的長界面延遲
缺陷的研究。因此,移動應用市場上充斥著很多界面設計有
缺陷的應用程序,導致了大量的用戶抱怨應用程序的性能問
題。本論文旨在更好的理解移動端用戶對界面延遲的期望,
v

基於此檢測并定位那些用戶不滿意的長延遲界面元素。為此,
我們設計了一項對界面延遲的用戶調查。通過問卷調查我們
發現了用戶耐心與界面延遲的關係。因此一個及時的屏幕更
新(例如加載動畫)對于長延遲的用戶操作十分重要。我們
設計了一個工具監視用戶數據和界面更新,并檢測沒有及時
響應的界面元素。我們公佈了用戶調查和工具。我們將工具
應用於在實際程序中,實驗結果表明我們的工具能夠有效檢
測界面設計的缺陷。
此外,我們研究了雲服務的性能調優問題。在雲端,服務
器的優化部署是為分散的移動用戶提供更好服務的關鍵。用
戶體驗受用戶端和雲端連接延遲的影響,是服務器的優化部
署需要著重考慮的因素。然而用戶可能從各個地方請求雲服
務,用戶通常也不會主動訪問雲服務器提供用戶體驗數據,
因此用戶體驗不容易獲取。本論文對雲服務建模,提出在雲
服務框架中獲取及預測用戶體驗數據的方法。基於獲得的用
戶體驗數據,論文設計了優化服務部署的方法,包括單服務
部署和多服務協同部署的算法。我們收集了實際的用戶訪問
數據,實驗驗證了論文方法的有效性。
綜上所述,本論文研究了移動應用以及雲服務的性能調優
的方法,提出了移動端和雲端的性能調優方法。實驗驗證了
論文方法的有效性。論文實現的工具集以及使用的數據集已
開源發佈以供其他研究者使用。
vi

Acknowledgement
First and foremost, I would like to express my sincere gratitudemy supervisor, Prof. Michael R. Lyu, for his continuous support ofmy PhD study at CUHK. He has provided inspiring guidance andincredible help on every aspect of my research. From choosing aresearch topic to working on a project, from technical writing todoing presentation, I have learnt so much from him not only onknowledge but also on attitude in working. I will always appreciatehis advice, encouragement and support at all levels.
Besides my supervisor, I would like to thank my thesis assess-ment committee members, Prof. Yuk Lap Yip and Prof. Pak ChingLee, for their insightful comments and constructive suggestions tothis thesis and all my term reports. Great thanks to Prof. JiannongCao from The Hong Kong Polytechnic University who kindly servesas the external examiner for this thesis.
I am also grateful to my oversea advisor and colleague, Prof. K-ishor S. Trivedi and Dr. Javier Alonso, for their help on my visit toDuke University. During this visit, they have taught me a lot on themethodology of doing good research. I would thank Dr. JianguangLou, my mentor during the internship at Microsoft Research Aisa. Ialso thank Mr. Qingwei Lin, Xinsheng Yang, and Pengfei Chen, fortheir helps during my stay at Microsoft Research Aisa.
My sincere thank to Dr. Yangfan Zhou for the stimulatingdiscussions, for the sleepless nights we were working togetherbefore deadlines, and for the advices on life and career. I wouldlike to thank Hui Xu, Zibin Zheng, Jieming Zhu, and Cuiyun Gao
vii
for their valuable guidance and contribution to the research work inthis thesis. I am also thankful to my other groupmates, Guang Ling,Qirun Zhang, Yuxin Su, Shenglin Zhao, Jichuan Zeng, MingzhenMo, Shouyuan Chen, Chen Cheng, Chao Zhou, Xin Xin, YileiZhang, Pinjia He, Jian Li, Tong Zhao, Jianlong Xu, and HongyiZhang who gave me advices and kind help.
My special thanks go to my dear friends, Zhongyu Wei, RanTao, Qing Yang, Fei Chen, Yixia Sun, Wei Yu, Zhe Zhu, JihangYe, Sheng Cai, Qinglu Yang, Ruolan Huang, Wenjie Wu, ZhiweiZhang, Xinyuan Shi, Yanyin Zhu, Xin Feng, and many others for allthe wonderful memories over these years. Without them, life wouldnever be so enjoyable.
Last but not least, I would like to thank my parents for supportingme spiritually. Without their deep love and constant support, thisthesis would never have been completed.
viii

In dedication to my beloved family.
ix

Contents
Abstract i
Acknowledgement vii
1 Introduction 11.1 Overview . . . . . . . . . . . . . . . . . . . . . . . 11.2 Thesis Contributions . . . . . . . . . . . . . . . . . 6
1.2.1 Performance Diagnosis for Mobile App . . . 61.2.2 Delay-Tolerant UI Design for Mobile App . . 71.2.3 Service Deployment on Cloud . . . . . . . . 71.2.4 Multiple Services Deployment on Cloud . . . 8
1.3 Thesis Organization . . . . . . . . . . . . . . . . . . 9
2 Background Review 122.1 Mobile Applications and Cloud Services . . . . . . . 122.2 Performance Tuning of Mobile Applications . . . . . 14
2.2.1 Testing Mobile Applications . . . . . . . . . 142.2.2 Performance Diagnosis of Mobile Applica-
tions . . . . . . . . . . . . . . . . . . . . . . 152.2.3 Performance and UI Design of Mobile Ap-
plications . . . . . . . . . . . . . . . . . . . 172.3 Performance Tuning of Cloud Server . . . . . . . . . 19
2.3.1 Cloud Architecture and Datacenter Charac-teristics . . . . . . . . . . . . . . . . . . . . 19
x

2.3.2 Virtual Machine Live Migration and Man-agement . . . . . . . . . . . . . . . . . . . . 23
2.3.3 Cloud-based Service Deployment and Algo-rithms . . . . . . . . . . . . . . . . . . . . . 24
3 Android Performance Diagnosis via Anatomizing Asyn-chronous Executions 283.1 Motivation and Problem Definition . . . . . . . . . . 293.2 Android Application Specifics . . . . . . . . . . . . 31
3.2.1 UI Event Processing . . . . . . . . . . . . . 313.2.2 Asynchronous Executions . . . . . . . . . . 33
3.3 Motivating Examples . . . . . . . . . . . . . . . . . 343.3.1 Sequential Running of Multiple Asynchron-
ous Executions . . . . . . . . . . . . . . . . 363.3.2 Not Canceling Unnecessary Asynchronous
Executions . . . . . . . . . . . . . . . . . . 383.4 UI Performance Diagnosis . . . . . . . . . . . . . . 40
3.4.1 Modeling Tasks and Their Dependency . . . 413.4.2 Dependency-aware Performance Diagnosis . 44
3.5 Profiling Asynchronous Tasks . . . . . . . . . . . . 473.5.1 Categorizing Asynchronous Tasks . . . . . . 483.5.2 Profiling Asynchronous Tasks . . . . . . . . 50
3.6 Experimental Study . . . . . . . . . . . . . . . . . . 533.6.1 Case studies . . . . . . . . . . . . . . . . . . 543.6.2 Why Clustering . . . . . . . . . . . . . . . . 643.6.3 Performance Enhancement . . . . . . . . . . 663.6.4 Discussions of Experiment . . . . . . . . . . 67
3.7 Tool Insights and Discussions . . . . . . . . . . . . . 693.7.1 Tips for Developers . . . . . . . . . . . . . . 693.7.2 Discussions on the Implementation . . . . . 723.7.3 Limitation of Our Tool . . . . . . . . . . . . 72
3.8 Summary . . . . . . . . . . . . . . . . . . . . . . . 73
xi

4 Detecting Poor Responsiveness UI for Android Applica-tions 744.1 Introduction . . . . . . . . . . . . . . . . . . . . . . 754.2 Motivation . . . . . . . . . . . . . . . . . . . . . . . 774.3 User study . . . . . . . . . . . . . . . . . . . . . . . 79
4.3.1 Test settings . . . . . . . . . . . . . . . . . . 804.3.2 Results . . . . . . . . . . . . . . . . . . . . 81
4.4 Overall framework for poor-responsive UI detection . 844.4.1 Problem specification . . . . . . . . . . . . . 844.4.2 Proposed execution flow . . . . . . . . . . . 864.4.3 Framework Design . . . . . . . . . . . . . . 86
4.5 Implementation details . . . . . . . . . . . . . . . . 874.5.1 Event monitor . . . . . . . . . . . . . . . . . 884.5.2 Display monitor . . . . . . . . . . . . . . . 894.5.3 Log analyzer . . . . . . . . . . . . . . . . . 90
4.6 Experimental study . . . . . . . . . . . . . . . . . . 914.6.1 Tool effectiveness validation with fault in-
jection . . . . . . . . . . . . . . . . . . . . . 914.6.2 Overview of Experimental Results . . . . . . 934.6.3 Case Study 1: YouCam . . . . . . . . . . . . 964.6.4 Case Study 2: Bible Quotes . . . . . . . . . 984.6.5 Case Study 3: Illustrate . . . . . . . . . . . . 100
4.7 Discussions . . . . . . . . . . . . . . . . . . . . . . 1024.8 Summary . . . . . . . . . . . . . . . . . . . . . . . 103
5 Deployment of Single Cloud Service 1055.1 Background and Motivation . . . . . . . . . . . . . 1065.2 Overview of Cloud-Based Services . . . . . . . . . . 108
5.2.1 Framework of Cloud-Based Services . . . . 1085.2.2 Challenges of Hosting the Cloud Services . . 109
5.3 Obtaining User Experience . . . . . . . . . . . . . . 1115.3.1 Measure the Internet Delay . . . . . . . . . . 1115.3.2 Predict the Internet Delay . . . . . . . . . . 111
xii
5.4 Redeploying Service Instances . . . . . . . . . . . . 1125.4.1 Minimize Average Cost . . . . . . . . . . . 1125.4.2 Maximize Amount of Satisfiable Users . . . 115
5.5 Experiment and Discussion . . . . . . . . . . . . . . 1195.5.1 Dataset Description . . . . . . . . . . . . . . 1195.5.2 Necessity of Redeployment . . . . . . . . . 1195.5.3 Weakness of Auto Scaling . . . . . . . . . . 1205.5.4 Comparing the Redeployment Algorithms
for k-Median . . . . . . . . . . . . . . . . . 1235.5.5 Redeployment Algorithms for Max k-Cover . 125
5.6 Discussion . . . . . . . . . . . . . . . . . . . . . . . 1285.7 Summary . . . . . . . . . . . . . . . . . . . . . . . 129
6 Deployment of Multiple Cloud Services 1306.1 Background and Motivation . . . . . . . . . . . . . 1316.2 Framework of Cloud-based Multi-services . . . . . . 1336.3 Independent Deployment of Single Service . . . . . 1356.4 Co-deployment of Multi-services . . . . . . . . . . . 136
6.4.1 Multiple Cloud-based Services Co-deploymentModel . . . . . . . . . . . . . . . . . . . . . 137
6.4.2 Iterative Sequential Co-deployment Algorithm1396.5 Experiment and Discussion . . . . . . . . . . . . . . 140
6.5.1 Latency Data Collection . . . . . . . . . . . 1416.5.2 Dataset Description . . . . . . . . . . . . . . 1426.5.3 Experiment Parameters . . . . . . . . . . . . 1436.5.4 Algorithm Specifics . . . . . . . . . . . . . 1446.5.5 Number of Services . . . . . . . . . . . . . . 1456.5.6 Number of Service VMs . . . . . . . . . . . 1466.5.7 Services Logs . . . . . . . . . . . . . . . . . 147
6.6 Summary . . . . . . . . . . . . . . . . . . . . . . . 149
7 Conclusion and Future Work 1517.1 Conclusion . . . . . . . . . . . . . . . . . . . . . . 151
xiii

7.2 Future work . . . . . . . . . . . . . . . . . . . . . . 1537.2.1 User Experience Enhancement of Mobile
Applicaions . . . . . . . . . . . . . . . . . . 1547.2.2 Cloud Service Processing Time Optimization 1557.2.3 Cloud-client Communication Cost Reduction 155
A List of Publications 157
Bibliography 159
xiv
List of Figures
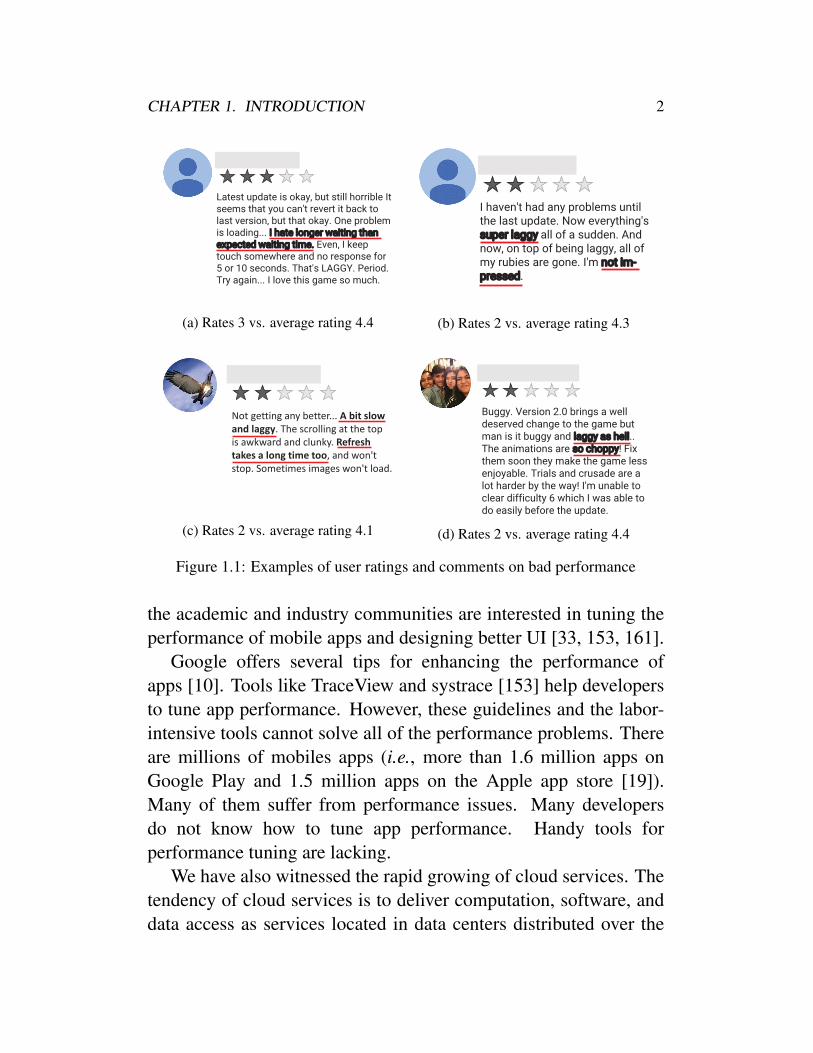
1.1 Examples of user ratings and comments on badperformance . . . . . . . . . . . . . . . . . . . . . . 2
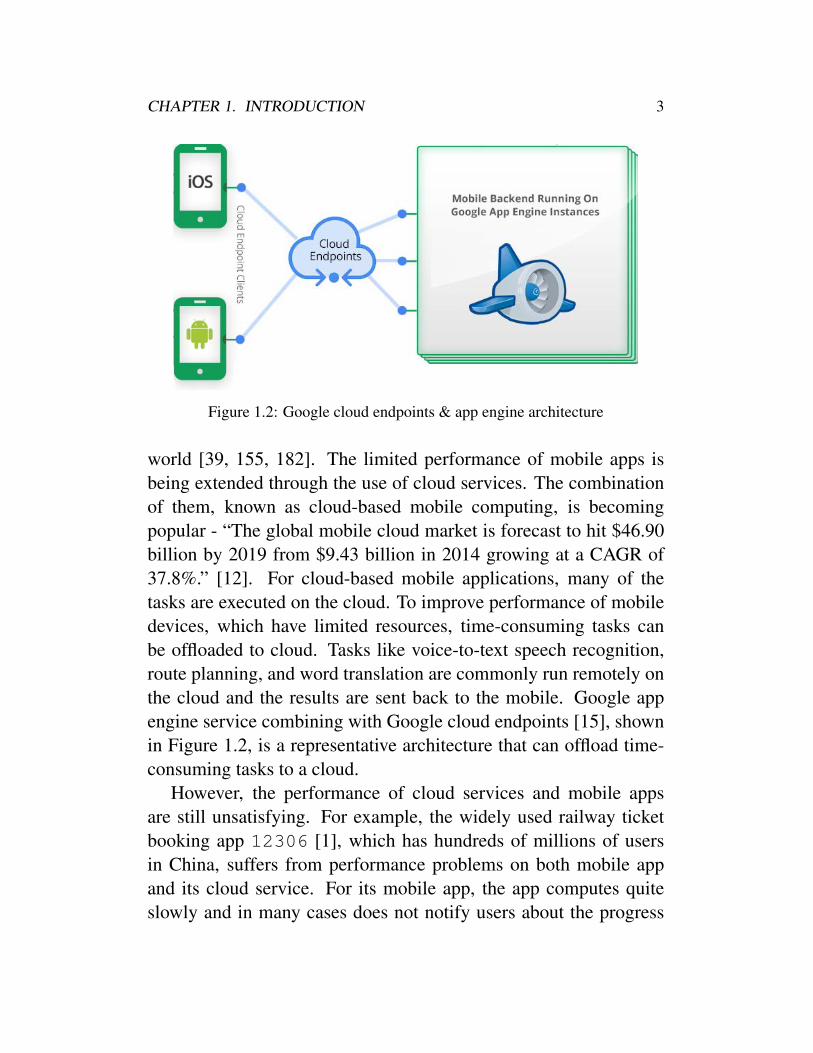
1.2 Google cloud endpoints & app engine architecture . . 31.3 An overview of cloud-based mobile app perfor-
mance tuning . . . . . . . . . . . . . . . . . . . . . 4
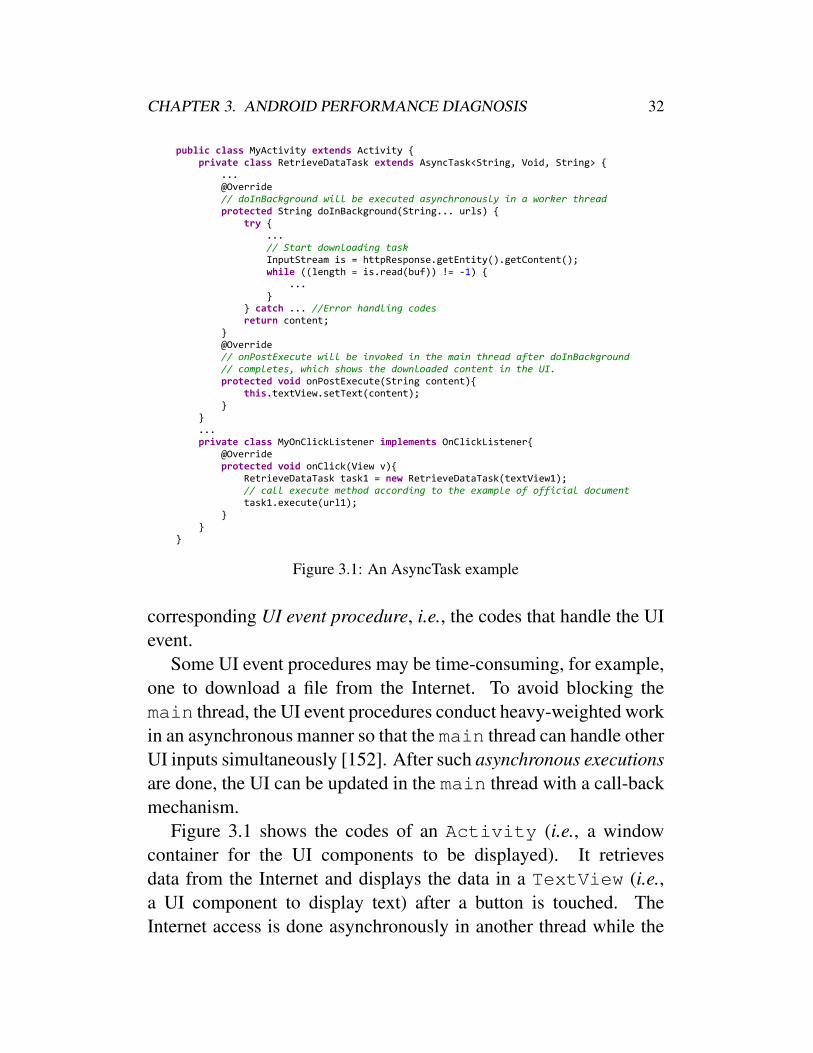
3.1 An AsyncTask example . . . . . . . . . . . . . . . . 323.2 Example codes which may cause potential perfor-
mance problems . . . . . . . . . . . . . . . . . . . . 363.3 Correct codes to execute an Asynctask . . . . . . 373.4 An example of cancelling AsyncTask . . . . . . . . 383.5 Overview of DiagDroid Framework . . . . . . . . 403.6 Asynchronous tasks runtime . . . . . . . . . . . . . 433.7 Report and code segments of case 1 . . . . . . . . . 563.8 Report and code segments of case 2 . . . . . . . . . 583.9 Report and code segments of case 3 . . . . . . . . . 603.10 Report and code segments of case 4 . . . . . . . . . 623.11 Report and code segments of case 5 . . . . . . . . . 633.12 Similar contexts without clustering . . . . . . . . . . 653.13 Message handler blocking delays before (left) and
after (right) fix of Transportr . . . . . . . . . . . . . 663.14 Queuing delay of showing apps before (left) and
after (right) fix of AFWall+ . . . . . . . . . . . . . . 67
4.1 Examples of user ratings and comments about badUI responsiveness . . . . . . . . . . . . . . . . . . . 75
xv
4.2 Screenshot and related source codes of a simple gallery 784.3 Screen shot of survey app . . . . . . . . . . . . . . . 804.4 Rating on UI responsiveness and user patience (size
of a circle is related to the number of repetitions ofthat point) . . . . . . . . . . . . . . . . . . . . . . . 82
4.5 Detecting poor-responsive operations . . . . . . . . . 854.6 Example logs of Pretect . . . . . . . . . . . . . 894.7 Feedback delay of applications detected by Pretect
. . . . . . . . . . . . . . . . . . . . . . . . . . . . 934.8 Cases number distribution . . . . . . . . . . . . . . 944.9 Feedback delay distribution . . . . . . . . . . . . . . 944.10 Avg. # of cases per category with different thresholds 954.11 Selected report of YouCam Perfect . . . . . . . . . . 974.12 Screenshots of Youcam Perfect . . . . . . . . . . . . 984.13 Selected report of Bible Quotes . . . . . . . . . . . . 994.14 Selected report of Illustrate . . . . . . . . . . . . . . 101
5.1 Framework of cloud-based services . . . . . . . . . 1085.2 Worst case without redeployment . . . . . . . . . . . 1205.3 Deploy in limited data centers . . . . . . . . . . . . 1215.4 Auto scaling algorithms . . . . . . . . . . . . . . . . 1215.5 Selecting data centers by redeployment algorithm . . 1225.6 Selecting 10 - 20 data centers for 4000 users . . . . . 1245.7 Histogram on number of connected users for each
server . . . . . . . . . . . . . . . . . . . . . . . . . 1255.8 Max k-cover using greedy approach . . . . . . . . . 1265.9 Average cost by max k-cover model . . . . . . . . . 127
6.1 The framework of cloud-based multi-services (Thetwo user icons in the figure actually represent thesame user u.) . . . . . . . . . . . . . . . . . . . . . 133
6.2 Convergence of sequential procedure . . . . . . . . . 1446.3 Number of disturbs . . . . . . . . . . . . . . . . . . 1446.4 Number of services . . . . . . . . . . . . . . . . . . 145
xvi
6.5 Set size of candidate VMs . . . . . . . . . . . . . . 1466.6 Number of service VMs to deploy . . . . . . . . . . 1466.7 Number of service users . . . . . . . . . . . . . . . 1476.8 Average call length . . . . . . . . . . . . . . . . . . 1486.9 Average usage . . . . . . . . . . . . . . . . . . . . . 148
xvii

List of Tables
3.1 Asynchronous execution examples . . . . . . . . . . 333.2 Categories of asynchronous tasks . . . . . . . . . . . 483.3 Representative performance issues found (Rank: rank-
ing of the buggy issue / total number of issuesreported) . . . . . . . . . . . . . . . . . . . . . . . . 55
4.1 Patience measurement under different delay levels . . 834.2 Pairwise patience measurement comparisons on dif-
ferent delay levels . . . . . . . . . . . . . . . . . . . 834.3 List of applications . . . . . . . . . . . . . . . . . . 924.4 Statistics of feedback delay . . . . . . . . . . . . . . 944.5 Top 10 components contain poor-responsive opera-
tions . . . . . . . . . . . . . . . . . . . . . . . . . . 96
5.1 Alphabet of problem model . . . . . . . . . . . . . . 1125.2 Execution time of the algorithms (unit: ms) . . . . . 124
6.1 Alphabet of the multiple cloud-based services co-deployment model . . . . . . . . . . . . . . . . . . 136
6.2 Dataset statistics (unit: ms) . . . . . . . . . . . . . . 1436.3 Parameters used in randomized log generation . . . . 143
xviii

Chapter 1
Introduction
This thesis presents our research on performance tuning of mobileapplications and cloud services, which attracts widely interests inboth academia and industry. In Section 1.1, we motivate ourresearch and provide an overview of the research problem. InSection 1.2, we highlight the main contributions of this thesis. InSection 1.3, we give the outline of the thesis.
1.1 Overview
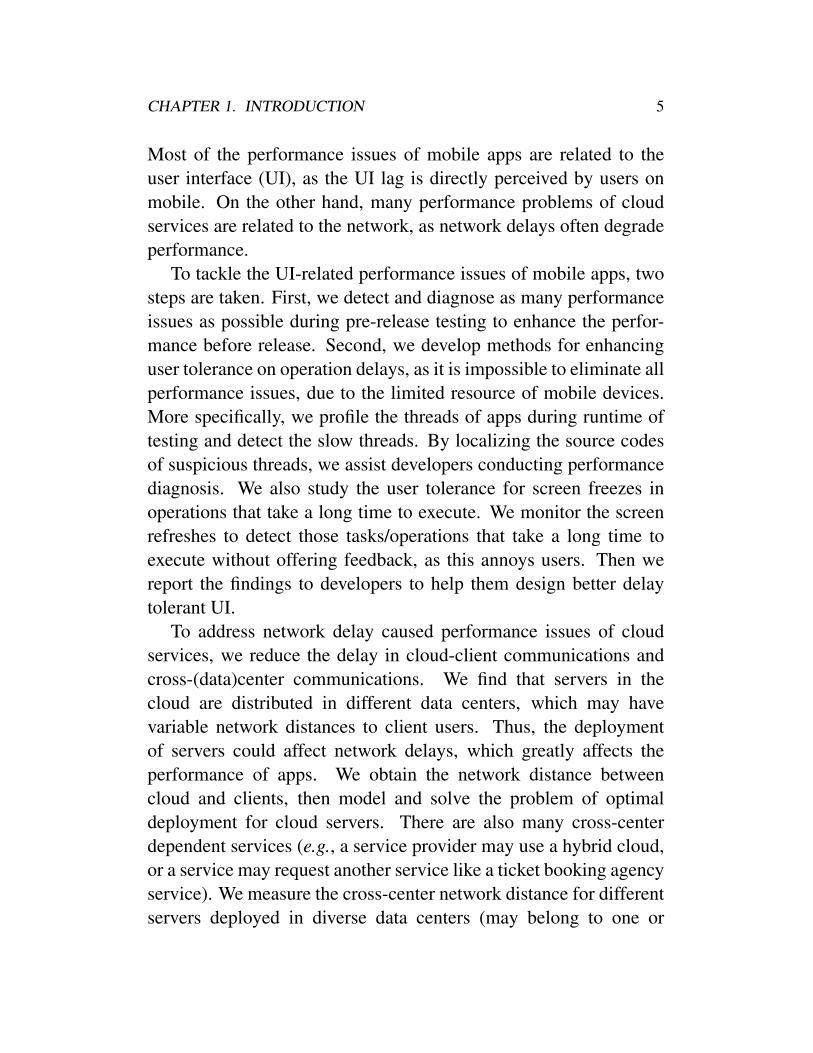
Today, mobile devices are an indispensable part of daily life. It isestimated that about a quarter of the world will use a mobile devicein 2016 [2]. One report shows that on average, a US adult spendsabout three hours every day using mobile devices [16]. As a result,users are demanding high performance in mobile apps (i.e., low UIlatency). Mobile apps are expected to provide a responsive userinterface (UI). Figure 1.1 depicts several user comments and theirratings of four different apps on the Google Play app store. Thecomments are negative and the ratings are below average for the appswith poor performance (e.g., laggy). Moreover, users have expecta-tions on the waiting time of some operations and they hate to waitlonger than expected, as shown by the user comments in Figure 1.1a:“I hate longer waiting than expected waiting time”. Therefore, both
1
CHAPTER 1. INTRODUCTION 2
Hamzah S
Latest update is okay, but still horrible It seems that you can't revert it back to last version, but that okay. One problem is loading... I hate longer waiting than expected waiting time. Even, I keep touch somewhere and no response for 5 or 10 seconds. That's LAGGY. Period. Try again... I love this game so much.
(a) Rates 3 vs. average rating 4.4
K Bailey
I haven't had any problems until the last update. Now everything's super laggy all of a sudden. And now, on top of being laggy, all of my rubies are gone. I'm not im-pressed.
(b) Rates 2 vs. average rating 4.3
Henry Kuo
Not getting any better... A bit slow and laggy. The scrolling at the top is awkward and clunky. Refresh takes a long time too, and won't stop. Sometimes images won't load.
(c) Rates 2 vs. average rating 4.1
Abhishek Venugopal
Buggy. Version 2.0 brings a well deserved change to the game but man is it buggy and laggy as hell.. The animations are so choppy! Fix them soon they make the game less enjoyable. Trials and crusade are a lot harder by the way! I'm unable to clear difficulty 6 which I was able to do easily before the update.
(d) Rates 2 vs. average rating 4.4
Figure 1.1: Examples of user ratings and comments on bad performance
the academic and industry communities are interested in tuning theperformance of mobile apps and designing better UI [33, 153, 161].
Google offers several tips for enhancing the performance ofapps [10]. Tools like TraceView and systrace [153] help developersto tune app performance. However, these guidelines and the labor-intensive tools cannot solve all of the performance problems. Thereare millions of mobiles apps (i.e., more than 1.6 million apps onGoogle Play and 1.5 million apps on the Apple app store [19]).Many of them suffer from performance issues. Many developersdo not know how to tune app performance. Handy tools forperformance tuning are lacking.
We have also witnessed the rapid growing of cloud services. Thetendency of cloud services is to deliver computation, software, anddata access as services located in data centers distributed over the
CHAPTER 1. INTRODUCTION 3
Figure 1.2: Google cloud endpoints & app engine architecture
world [39, 155, 182]. The limited performance of mobile apps isbeing extended through the use of cloud services. The combinationof them, known as cloud-based mobile computing, is becomingpopular - “The global mobile cloud market is forecast to hit $46.90billion by 2019 from $9.43 billion in 2014 growing at a CAGR of37.8%.” [12]. For cloud-based mobile applications, many of thetasks are executed on the cloud. To improve performance of mobiledevices, which have limited resources, time-consuming tasks canbe offloaded to cloud. Tasks like voice-to-text speech recognition,route planning, and word translation are commonly run remotely onthe cloud and the results are sent back to the mobile. Google appengine service combining with Google cloud endpoints [15], shownin Figure 1.2, is a representative architecture that can offload time-consuming tasks to a cloud.
However, the performance of cloud services and mobile appsare still unsatisfying. For example, the widely used railway ticketbooking app 12306 [1], which has hundreds of millions of usersin China, suffers from performance problems on both mobile appand its cloud service. For its mobile app, the app computes quiteslowly and in many cases does not notify users about the progress

CHAPTER 1. INTRODUCTION 4
Slow
tasks
UI laggy
Poor connection
Diagnosis
Task management
User experience
UI feedback
Cloud‐client connection
Service deployment
Cross‐center connection
Service co‐deployment
Figure 1.3: An overview of cloud-based mobile app performance tuning
of the processing. For example, the search for tickets from Beijingto Tianjin, sorted by arrival time, takes quite a long time to finish,and it offers no progress updates during the processing. This annoysusers a lot. For its cloud service, the cloud server is not configuredand deployed optimally for serving a large number of users. Itbecomes extremely slow at peak times (e.g., Chinese Lunar NewYear) when there are too many user requests. All of these issuesmake the user experience poor and give 12306 an ill reputation forbad performance [11]. This demonstrates that the performance ofboth mobile apps and cloud services should be improved.
An overview of our proposed procedure for tuning the perfor-mance of mobile apps and cloud services is shown in Figure 1.3. Wetune the performance of mobile apps and cloud services respectively.
CHAPTER 1. INTRODUCTION 5
Most of the performance issues of mobile apps are related to theuser interface (UI), as the UI lag is directly perceived by users onmobile. On the other hand, many performance problems of cloudservices are related to the network, as network delays often degradeperformance.
To tackle the UI-related performance issues of mobile apps, twosteps are taken. First, we detect and diagnose as many performanceissues as possible during pre-release testing to enhance the perfor-mance before release. Second, we develop methods for enhancinguser tolerance on operation delays, as it is impossible to eliminate allperformance issues, due to the limited resource of mobile devices.More specifically, we profile the threads of apps during runtime oftesting and detect the slow threads. By localizing the source codesof suspicious threads, we assist developers conducting performancediagnosis. We also study the user tolerance for screen freezes inoperations that take a long time to execute. We monitor the screenrefreshes to detect those tasks/operations that take a long time toexecute without offering feedback, as this annoys users. Then wereport the findings to developers to help them design better delaytolerant UI.
To address network delay caused performance issues of cloudservices, we reduce the delay in cloud-client communications andcross-(data)center communications. We find that servers in thecloud are distributed in different data centers, which may havevariable network distances to client users. Thus, the deploymentof servers could affect network delays, which greatly affects theperformance of apps. We obtain the network distance betweencloud and clients, then model and solve the problem of optimaldeployment for cloud servers. There are also many cross-centerdependent services (e.g., a service provider may use a hybrid cloud,or a service may request another service like a ticket booking agencyservice). We measure the cross-center network distance for differentservers deployed in diverse data centers (may belong to one or
CHAPTER 1. INTRODUCTION 6
several clouds), which provide different services. Taking both cross-center and cloud-client communication cost into consideration, weformulate an optimization problem. By solving the problem, we findan optimal deployment of complex services in cloud that reduces thenetwork delay.
1.2 Thesis Contributions
In the thesis, we contribute to the performance tuning of both mobileapps and cloud services. The contributions can be summarized asfollows.
1.2.1 Performance Diagnosis for Mobile App
Rapid user interface (UI) responsiveness is a key consideration forAndroid app developers. To avoid freezing the screen by blockingthe UI thread, the requests are usually conducted under the compli-cated concurrency model of Android. This makes it difficult for thedevelopers to understand and further diagnose an app’s performance.This thesis develops DiagDroid, a tool specifically designed forAndroid UI performance diagnosis. The key idea of DiagDroid isthat UI-triggered asynchronous executions contribute to UI perfor-mance, and hence their performance and their runtime dependencyshould be properly captured to facilitate performance diagnosis.However, there are numerous ways to start these asynchronousexecutions, posing a great challenge to profiling such executionsand their runtime dependency. To this end, we properly abstractfive categories of asynchronous executions as the building basis.These executions can then be tracked and profiled based on thespecifics of each category with a dynamic instrumentation approachcarefully tailored for Android. DiagDroid can then profile theasynchronous executions in a task granularity, equipping it with low-overhead and high compatibility merits. The tool is successfully

CHAPTER 1. INTRODUCTION 7
applied in diagnosing 33 real-world open-source apps; we find 27performance issues in 14 of the apps. These results show theeffectiveness of our tool in Android UI performance diagnosis. Wehave open-source released DiagDroid online.
1.2.2 Delay-Tolerant UI Design for Mobile App
Even finely tuned, due to limited resources, many operations onmobile devices are inevitably slow. Therefore, a good user interface(UI) should be designed to improve user tolerance. UI latency,which is the time between a UI operation and its intended UI update,is a critical consideration for app developers. Current literaturestill lacks a comprehensive study of how much UI latency a usercan tolerate or how to find UI design defects that cause intolerablylong UI latency. As a result, bad UI apps are still common in appmarkets, leading to extensive user complaints. This thesis aims at abetter understanding of user tolerance for UI latency, and developsa tool to detect intolerable UI latency in Android apps. To this end,we first design an app to conduct a user survey of app UI latency.A key finding of the survey is that a timely screen update (e.g., aloading animation) is critical to heavy-weighted UI operations (i.e.,those that incur a long execution time before the final UI update isavailable). We design a tool to monitor the UI inputs and updates,and detect apps that do not meet this criterion. The survey and thetool have been released open-sourced online. We also present ourexperiences on applying the tool on many real-world apps. Theresults demonstrate the effectiveness of the tool in combating theseapp UI design defects.
1.2.3 Service Deployment on Cloud
The cloud service has attracted much interest recently from bothindustry and academia. Optimal deployment of cloud services iscritical for providing good performance to attract users. Optimizing

CHAPTER 1. INTRODUCTION 8
user experience is usually a primary goal of cloud service deploy-ment. However, it is challenging to access the user experience,as mobile users may connect to cloud service from any point.Moreover, there is generally no proactive connection between a userand the machine that will host the service instance. To address thischallenge, in this thesis, we first propose a framework to modelcloud features and capture user experience. Then, based on the col-lected user connection information, we formulate the redeploymentof service instances as k-median and max k-cover problems. Wepropose several approximation algorithms to efficiently solve theseproblems. Comprehensive experiments are conducted by employinga real-world QoS dataset of service invocation. The experimentalresults demonstrate the effectiveness of our proposed redeploymentapproaches.
1.2.4 Multiple Services Deployment on Cloud
Multiple cloud services tend to cooperate with each other to accom-plish complicated tasks. For example, a service provider may use ahybrid cloud that provides several services in its private and publicclouds, or one service may request another service like a ticketbooking agency service. Deploying these services independentlymay not lead to good overall performance, as there are manyinteractions among the different services. Determining an optimalco-deployment of multiple services is critical for reducing latencyof user requests. If the services are highly related, taking onlythe distribution of users into consideration is not enough, as thedeployment of one service affects others. Thus, we employ crossservice information and user locations to build a new model ininteger programming formulation. To reduce the computation timeof the model, we purpose a sequential model running iteratively toobtain an approximate solution. We collect and publicly release areal-world dataset to promote future research. The dataset involves

CHAPTER 1. INTRODUCTION 9
307 distributed computers in about 40 countries, and 1881 real-world Internet-based services in about 60 countries. Extensiveexperiments have been conducted over the dataset to show theeffectiveness of our proposed model.
1.3 Thesis Organization
The remainder of this thesis is organized as follows:
• Chapter 2In this chapter, we review some background knowledge andrelated work on performance tuning of mobile applications andcloud services. Firstly, in Section 2.1, we briefly introducecloud-based mobile apps, mainly focusing on the characteris-tics of mobile apps and the usage of cloud service. Secondly,in Section 2.2, we review some related work on performancetuning of mobile applications, including performance diagnosisrelated techniques and delay-tolerant UI design. Thirdly, inSection 2.3, we review some related work on performance tun-ing of the cloud services, including the background knowledgeof the cloud architecture and the cloud service deployment.
• Chapter 3In this chapter, we present DiagDroid, a tool for perfor-mance diagnosis of mobile apps on Android OS. The per-formance diagnosis is done via anatomizing asynchronousexecutions. We first introduce the problem in Section 3.1.Then we introduce some Android specifics as the preliminaryknowledge in Section 3.2. In Section 3.3, we show twomotivating examples of performance issues caused by asyn-chronous executions. Section 3.4 and Section 3.5 elaborate thedesign and implementation of DiagDroid. We then demo thesuccessful application of our tool on real-world mobile appsand how previously unknown performance issues are found in

CHAPTER 1. INTRODUCTION 10
Section 3.6. We discuss our tool design and offer some tips fordevelopers to avoid performance issues in Section 3.7. Finally,Section 3.8 summarizes this chapter.
• Chapter 4In this chapter, we present Pretect, a tool which could detectpoor-responsive UI components in Android apps, for delay-tolerant UI design. The detection is done via monitoring theuser inputs and UI updates. We first introduce the problemin Section 4.1. Section 4.2 motivates the work by introducingan example of common program defect that causes poor-responsive UI. Section 4.3 presents the results of our studyon the relationship between user patience and operations delaylevels, which also provides the motivation for developing ournew tool. Section 4.4 and Section 4.5 illustrate the frameworkdesign and implementation of our tool. Section 4.6 demon-strates the correctness and effectiveness of the tool. Section 4.7provides some discussions on the tool design considerations.Finally, Section 4.8 summaries this chapter.
• Chapter 5In this chapter, we present a cloud service redeployment mech-anism which is optimized for performance. We first introducethe problem and requirement of cloud service redeploymentin Section 5.1. Then we overview the cloud service hostingmechanism in Section 5.2. Section 5.3 discusses the method ofobtaining performance in terms of user experience. We presenttwo different models and objective functions for modelinginstance redeployment problem in Section 5.4. Section 5.5conducts experiments and discusses the experimental results.Finally, the chapter is summarized in Section 5.7.
• Chapter 6In this chapter, we present a latency-aware co-deploymentmechanism for optimizing performance of cooperative cloud-
CHAPTER 1. INTRODUCTION 11
based services. First, in Section 6.1, we briefly introducethe problem definition and motivation of cloud-based servicesco-deployment. Then we illustrate the framework of cloud-based multi-services and the data processing procedure inSection 6.2. Section 6.3 reviews the model of single ser-vice deployment. Section 6.4 presents our multi-services co-deployment model. Section 6.5 discusses experimental results.Finally, Section 6.6 summarizes the chapter.
• Chapter 7The last chapter concludes this thesis and provides some dis-cussions on possible future work in this research area.
Notice that to make each chapter independent, in some of thechapters we may repeat critical contents like motivations and modeldefinitions.
2 End of chapter.
Chapter 2
Background Review
Chapter Outline
We separately tune performance of mobile applications andcloud services (Figure 1.3). We review related work onthe architecture of cloud-based mobile applications, mobileapplications performance tuning and cloud service perfor-mance tuning.
2.1 Mobile Applications and Cloud Services
Building on two mature technologies, cloud-based mobile comput-ing is a promising development. Cloud-based mobile computinghas the portability of mobile computing and the scalability of cloudcomputing. It has attracted widely interests from academia [77] andis growing in share of the mobile app market [12].
Previous studies have surveyed cloud-based mobile applications.Abolfazli et al. [25] identify four scenarios in which cloud servicesincrease the computing capabilities of mobile devices: load sharing,remote execution, cyber foraging, and mobile computation augmen-tation. Mobile computation augmentation includes techniques suchas computation offloading, remote data storage, and remote service
12

CHAPTER 2. BACKGROUND REVIEW 13
requests. Dinh et al. [70] list five advantages of using cloud-basedmobile computing: 1) extending battery lifetime; 2) improving datastorage capacity and processing power; 3) improving reliability; 4)dynamic provisioning; and 5) scalability.
With so many advantages (e.g., augment computational power,battery lifetime of mobile devices), it is unsurprising that a numberof studies have proposed offloading computational tasks to clouds.MAUI [66] enables energy-aware offloading to clouds. It providesmethod-level, semi-automatic offloading of the .net code. Althoughit improves the performance of some applications, performanceenhancement is not its focus. CloneCloud [61] enables unmodifiedmobile applications running in an application-level virtual machine(VM) to offload part of their execution from mobile devices ontoVMs in clouds. CloneCloud automatically partitions applicationsinto pieces for migrating to a VM at runtime. The partitioningis determined offline. However, CloneCloud has limitations withregards to input applications and native resources. It also needs to beupdated for every new application version. ThinkAir [113] createsVMs of complete mobile systems on the cloud to address the scala-bility issues of MAUI, and adopts an online method-level offloadingto address the restrictions of CloneCloud. It also supports on-demand resource allocation and parallelism. Kovachev et al. [114]design MACS middleware that gives developers better control overoffloadable components. The above mentioned approaches work ongeneric applications. Lee et al. [116] propose Outatime which isspecially designed for mobile cloud games. For these mobile cloudgames, cloud servers execute the games while the mobile clientsonly transmit UI input events and display the output rendered by theservers.
There are also studies of the fundamental issues in cloud-basedmobile computing architecture, such as the tradeoff between perfor-mance improvement and energy saving [191].
Our work does not focus on the architecture of cloud-based
CHAPTER 2. BACKGROUND REVIEW 14
mobile applications and its implementation. We do not bind ourapproach to any specific architecture or implementation. We ex-amine the general performance tuning of mobile apps and cloudservices. Therefore, our methods will work to improve performancein a variety of architectures and their implementations.
2.2 Performance Tuning of Mobile Applications
Our tool assists developers to tune the performance of mobileapps during testing. Here, we first review related research ontesting mobile apps. Then we review related work on performancediagnosis. As performance diagnosis cannot solve all performanceissues, we further investigate UI design techniques to make usersmore patient with bad performance.
2.2.1 Testing Mobile Applications
Performance diagnosis often requires executing the target app au-tomatically. Script-based testing is widely used (e.g., UIAutoma-tor [177], Monkey runner [138], and Robotium [164]). The record-and-replay approaches (e.g., MobiPlay [156], Reran [88], and SPAG-C [124]) record an event sequence during the manual exercisingof an app, and generate replayable scripts. Complementary tothese semi-automatic approaches, fuzz testing approaches (e.g.,Monkey [179], Dynodroid [132], and VanarSena [160]) gener-ate random input sequences to exercise Android apps. Symbol-ic execution-based testing approaches (e.g., Mirzaei et al. [137],ACTEve [32], Jensen et al. [102], EvoDroid [133], A3E [42], andSIG-Droid [136]) explore the app functions in a systematic way.Model-based testing approaches (e.g., Android Ripper [30], Swift-Hand [59], and PBGT [140]) generate a finite state machine modeland event sequences to traverse the model. TestPatch [86] usesthe GUI ripping methods for regression tests. Test case selection
CHAPTER 2. BACKGROUND REVIEW 15
techniques (e.g., [94, 176]) can also be adopted to exercise the targetapps. These app-exercising tools can work as plugin modules forour tools. In other words, a developer can exploit the merits of atesting tool by simply applying it as a plugin to exercise the targetapp.
2.2.2 Performance Diagnosis of Mobile Applications
Performance Diagnosis of General Applications
Performance diagnosis has been well studied for many systems.Much work has been conducted on predicting the performanceof configurable systems [167, 198]. CARAMEL [146] detectsperformance problems caused by unnecessary loop executions withstatic analysis. Yu et al. [195] propose a performance analysisapproach based on real-world execution traces. However, suchtraces are usually not available in our problem setting. PPD [189]uses dynamic instrumentation for goal-oriented known performanceissues searches. Lag Hunting [107] searches for performance bugsin JAVA GUI applications in the wild without addressing concurren-cy issues. Performance issues in Javascript programs are also wellstudied [168]. SAHAND [27] visualizes a behavioral model of full-stack JavaScript apps’ execution, but it does not take the contentionsof asynchronous tasks into consideration. Existing work [29, 103]also considers “thread waiting time” (i.e., when a thread waits forother threads during its execution) as a metric to find performancebottlenecks. In contrast, we focus on queuing time, i.e., the time atask waits before being executed, to model task dependency. Morespecifically, a lock contention (e.g., db operations) pauses a threadfrom executing, whereas queuing asynchronous tasks does not. Onetask waits for another task in the same worker thread to finish,while that thread continuously runs. Therefore, our tool is speciallytailored to profile waiting time and task dependency in continuousthreads.

CHAPTER 2. BACKGROUND REVIEW 16
Performance Diagnosis of Mobile Applications
Performance is a critical concern for mobile apps [31, 162]. Liuet al. [125] show that many performance issues are caused by theblocking operations in the main thread. StrictMode [90] analyzes themain thread to find such blocking operations. Asynchronizer [123]provides an easy way to refactor specific blocking synchronousoperations into standard AsyncTask implementations. Async-Droid [122] further refactors AsyncTask to IntentServiceto eliminate the memory leakage problems. CLAPP [82] findspotential performance optimizations by analyzing loops. However,such static analysis-based tools cannot capture runtime executiondependency. Banerjee et al. [43, 44] design static analysis-driventesting for performance issues caused by anomalous cache behav-iors. Tango [91], Outatime [116], and Cedos [139] optimize WiFioffloading mechanisms to maintain a low-latency for apps. Smar-tIO [143] reduces the app delay by reordering IO operations. Of-floading tasks to remote servers can also reduce the delay [188, 187].Resource leakage is a common source of performance issues andhas been widely investigated [194]. These approaches solve specificperformance issues. In contrast, our work solves general UI perfor-mance issues caused by the runtime dependency of asynchronousexecutions.
UI Performance Diagnosis of Mobile Applications
User interface (UI) design is one of the key factors in mobile appdevelopment [105]. Many studies have focused on methods fordiagnosing UI performance. Method tracing [153] is an officialtool that is often used to diagnose performance issues, but it hasa high overhead and is suitable for diagnosing known issues only.QoE Doctor [57] bases its diagnosis on Android Activity TestingAPI [26], but can only handle pre-defined operations. Appin-sight [161] is a tracing-based diagnosis tool for Windows phone

CHAPTER 2. BACKGROUND REVIEW 17
apps. It traces all of the asynchronous executions from a UI eventto its corresponding UI update, and identifies the critical pathsthat influence the performance. Panappticon [196] adopts a similarapproach on Android. However, these approaches typically requireframework and kernel recompilation, which limits their compatibil-ity with various devices. Moreover, these studies focus on findingthe anomalous task delays; in contrast, our work identifies not onlythe runtime dependency between tasks, especially those for differentUI operations, but also the delays that affect user experience.
2.2.3 Performance and UI Design of Mobile Applications
Performance and General UI Design
Many studies have examined the relationship between user satisfac-tion and system response time.
Early studies of user-tolerable waiting time focus on generalcomputer applications. Miller [135] notes that different purposesand actions have different acceptable or useful response times.Shneiderman [171] states that response times to simple commandsshould not exceed 2 seconds. Nielsen [144] suggests that 0.1second is the limit at which users feel that the system is reactinginstantaneously and 1.0 second is the limit for users’ flow of thoughtto remain uninterrupted.
There are also many research investigations on the Web usertolerance. These studies indicate that over time user tolerance fordelays on Web pages has decreased. The tolerable delay in earlystudies was more than 30 to 40 seconds [159, 169]. Hoxmeier etal. [97] construct an Internet browser-based application to study howWeb delay affects user satisfaction, and find a 12 seconds threshold.Galletta et al. [83] vary the website delay time from 0 to 12 seconds.They examine the performance, attitudes, and behavioral intentionsof the subjects to understand user tolerance for website delays. Theresults suggest that users are tolerant of delays of about 4 seconds.

CHAPTER 2. BACKGROUND REVIEW 18
Nah [141] finds that most users are willing to wait for only about 2seconds for simple information retrieval tasks on the Web.
The above-mentioned research focuses on the absolute value ofdelays and does not consider how feedback affects user satisfactionwith a delay. Visual and non-visual feedback is an importantdesign element in delay-tolerable UI. Duis et al. [71] point outthat a system should let a user know immediately that her inputhas been received, but the authors offer these suggestions withoutexperimental study. Johnson [104] also provides many insightsinto system responsiveness and user satisfaction. He suggests thatshowing a progress bar for long-term operations is much better thanshowing nothing or only a busy bar.
Performance and Touch Screen UI Design
Touch screen user interfaces have attracted research interests forsome time. Findlater et al. [78] compare adaptive interfaces forsmall and desktop-sized screens to study the impact of screen size onuser satisfaction. They show that high accuracy adaptive menus arehighly beneficial for small screen displays. Forlines et al. [79] studythe different characteristics of direct touch screen input and mouseinput. They show different input methods have different benefits.
Tolerance for delays on mobile devices has also been studied.Oulasvirta et al. [149] reveal that user attention spans vary from 4seconds to 16 seconds on mobile devices once the page loading hasstarted. Anderson [33] suggests that user tolerance for touch screenlatency for common tasks is below 580 ms. Jota et al. [106] andtheir follow-up work [68] show that 1) the initial delay feedbackthe users can perceive ranges from 20 to 10 ms, and 2) the userdetectable threshold of direct and indirect operations for differenttasks (tapping and dragging) range from 11 ms to 96 ms. Nget al. [142] show that user notice improvements in speed at wellbelow 10 ms. These results have implications for touch screen UIdesign; our research is designed to detect violations of the tolerance

CHAPTER 2. BACKGROUND REVIEW 19
thresholds.Visual and non-visual feedback is widely used in the design of
delay tolerable UI. Roto et al. [166] show that multimodal feedbackfor delays of more than 4 seconds is required. Lee et al. [117]note that the absence of feedback affects user performance (e.g.,typing on flat piezo-electric buttons that have no tactile feedbacksignificantly reduces expert typists performance). Kristoffersen etal. [115] suggest using audio feedback on mobiles. Ng et al. [142]recommend providing low-fidelity visual feedback immediately.Poupyrev et al. [151] find that tactile feedback is most effectivewhen the GUI widgets need to be held down or dragged on thescreen. Ripples [190] provide a special system on top of the screenthat can give feedback about the successes and errors of the touchinteractions. In contrast, we do not modify the current mobileUI framework. Our work focuses on detecting UI elements withlong delays or with no feedback that may leave users uncertain ofthe status of their commands. This information can be used bydevelopers to avoid such problems.
2.3 Performance Tuning of Cloud Server
2.3.1 Cloud Architecture and Datacenter Characteristics
Cloud Architecture
Many previous studies have examined the cloud framework. Thereare several good survey work in this area [39, 65, 93, 155, 184]. Luiset al. [182] give a clear picture of cloud computing, and providedefinitions of key components of the cloud.
At first glance, cloud computing may look very similar to gridcomputing [80], but they are not identical. Foster, who posted thegrid framework, compares grid computing to cloud computing indetail [81]. They can both be used to do parallel computationsand thus reduce the cost of computing. They both manage large
CHAPTER 2. BACKGROUND REVIEW 20
numbers of facilities and offer users flexibility. The difference isthat grid computing uses distributed resources and an open standard,whereas cloud computing is sponsored by a single company. Thebusiness models of these two are different and so their target usersare different.
There are three kinds of cloud infrastructures, which correspondto three layers of services: Infrastructure as a Service (IaaS),Platform as a Service (PaaS), and Software as a Service (SaaS). IaaSabstracts the user from details of infrastructure (e.g., physical com-puting resources, location) to virtual machines. Users are usuallyrequired to install OS images and their application by themselves.PaaS provides typical development platform for developers. Theplatform includes operating system, programming-language execu-tion environment, database and web server. For SaaS, the providerinstall and operate application software in the cloud and usersaccess the software from the clients. Three real world examples areAmazon Elastic Compute Cloud (EC2) [5, 87] for Iaas, Microsoft’sWindows Azure Platform [18] for Paas and Google App Engine [14]for SaaS. Lenk et al. [119] give an overview of the features ofexisting cloud providers. Lin et al. [121] define high level IT asa service (ITaaS) that can be viewed from both technology andbusiness model perspectives.
Currently, there is limited cooperation between different cloudproviders. Rochwerger et al. [165] identify the shortcomings ofcontemporary clouds as due to the inherently limited scalabilityof single-provider clouds, lack of interoperability among cloudproviders, and no built-in Business Service Management (BMS)support. They present an architecture for a federation of disparatedata centers based on the principles of BMS.
Apart from commercial services, there are open source examplesof cloud services. Eucalyptus [147] is an open-source softwareframework for cloud computing. It implements the IaaS principle.
Brandic [49] offers a structure for self-manageable cloud ser-
CHAPTER 2. BACKGROUND REVIEW 21
vices. This structure uses the concept of autonomic systems. Theprocedure has four stages: monitoring, analyzing, planning, andexecution. He uses this life cycle in each work period (metanegotiation, negotiation, service execution, and post-execution) ofa cloud service to keep the architecture self-manageable. Our workimproves his analysis procedure.
Cloud computing is a commercial product. Buyya et al. [51]examine cloud issues from a market-orientation. They talk about thecommercial and technological implementations of cloud computingfor industry. Our research considers the effect of budget limitationsand thus also takes the commercial factors into consideration. Sub-sequent research by Buyya et al. [52] discusses the impact of cloudcomputing on the provision of computing power.
As claimed by Walker [185], clouds (e.g., Amazon EC2) per-form worse in high performance computing contexts than currentHPC clusters. However, there are also some variants that suithigh performance cloud computing. These variants include GPUscombined with CPUs to form a mixed cloud environment. GPUsprovide more computation power than CPUs, so including GPUsin a cloud can improve the computing capability greatly. Ama-zon claims to provide clusters of GPU based instances for highperformance computing [9]. Farivar et al. [75] design an archi-tecture, MITHRA, that leverages NVIDIA CUDA technology [20]along with Apache Hadoop [6] to produce scalable performancegains using the MapReduce [67] programming model. Barak etal. [45] present a packet for running OpenMP, C++, and unmodifiedOpenCL applications on clusters with many GPU devices. Theirexperiment demonstrates how powerful GPU clusters can be used tospeedup applications. Our model could improve deployment of bothGPU clusters and CPU clusters, as we do not differentiate them.
CHAPTER 2. BACKGROUND REVIEW 22
Data Center Characteristics
We have a special interest in data center traffic characteristics. Ourdeployment methods are based on the analysis of data center traffics;therefore, understanding traffic characteristics is very important.Luckily, there are many studies of data center characteristics.
Wang et al. [186] evaluate the performance of Amazon EC2.They measure: 1) processor sharing; 2) packet round-trip delay;3) TCP/UDP throughput; and 4) packet loss. The TCP/UDPthroughput referred to, like other network properties, are measuresof network performance inside the cloud; that is, they measure a pairof instances in the cloud, but do not consider an outside visit. Westill need to understand the complete traffic pattern for users usingservice in a cloud.
Ersoz et al. [73] first characterized network traffic in a cluster-based multi-tier data center. They find that 1) in most cases, therequest inter-arrival rates follow log-normal distribution, and self-similarity exists when the data center is heavily loaded; 2) messagesizes can be modeled by the log-normal distribution; and 3) servicetimes fit reasonably well with the Pareto distribution and show heavytailed behavior at heavy loads.
Benson et al. [48] present an empirical study of end-to-end trafficpatterns in data center networks. The same group [47] has con-ducted experiments in ten data centers belonging to three differentcategories, including university, enterprise campus, and cloud datacenters. They collect and analyze SNMP statistics, topology, andpacket-level traces, to provide insights into different data centercharacteristics. Srikanth et al. [109] instrument the servers to collectsocket-level logs. They obtain and report detailed views of trafficand congestion conditions and patterns.
Qian et al. [154] propose a hierarchical modeling approach thatcan easily combine all of the components of a cloud environment.Their model is a very useful analytical tool for online service pro-
CHAPTER 2. BACKGROUND REVIEW 23
viders who are evaluating cloud computing providers and designingredirection strategies.
2.3.2 Virtual Machine Live Migration and Management
The virtual machine live migration problem has been well studied.The Xen migration mechanism is first proposed by Clark et al. [63].They could transfer an entire machine in hundreds of milliseconds.Hines et al. [96] propose a post-copy based approach that defersthe transfer of the contents of a machine’s memory until after itsprocessor state has been sent to the target host. It ensures eachmemory page is transferred at most once, thus avoiding the duplicatetransmission overhead of pre-copy. The Remote Direct MemoryAccess (RDMA) technique is used to further reduce the migrationtime and application downtime [99].
The virtual machine migration technique has been extendedto management problems. Van et al. [180] study the problemof deciding what types of virtual machines to use for multipleapplications. They consider latency and the service level agreementwith computation cost. Stage et al. [174] consider how muchbandwidth is consumed during the migration. They propose anetwork topology-aware scheduling model to minimize the numberof hosts. Andreolini et al. [34] present a management algorithm ofVM placement that improves performance and resource utilizationby considering the load profile of the hosts and the load trendbehavior of the guest.
Although all of the virtual machine management algorithmsconsider the load balance across a set of hosts or reduce the numberof required hosts, user experience is seldom considered importantfactor. These models omit the network cost in their model, whereasour model emphasizes network latency and makes the assumptionthat the computation cost remains the same, regardless of the hostlocations.

CHAPTER 2. BACKGROUND REVIEW 24
2.3.3 Cloud-based Service Deployment and Algorithms
Web Server Placement
There are solutions that can accelerate Web applications by takingadvantage of extra cache servers such as AICache [3] and Akamaiapplication performance solutions [7]. However, these commercialservices increase costs. As their technique is merely to use extraservers, we can generalize the approach into our framework byincreasing the number of servers.
Previous research has examined service deployment in gird com-puting environments. Kecskemeti et al. [111] design an automaticservice deployment method for a grid that creates virtual appliancesfor grid services, deploys service from a repository, and influencesthe service schedules by altering execution planning services, candi-date set generators, or information systems. Unlike a cloud, a grid isnot centralized which limits application of these methods on cloud.
Burg et al. [181] focus on software deployment, especially select-ing which machine to load and to run the source codes on accordingto the QoS. In contrast, our approach is on the application level. Qiuet al. [157] study the placement of Web server replicas using severalplacement algorithms. They evaluate the algorithm by comparingthe output to the result of a super-optimal algorithm based onLagrangian relaxation which may not be feasible in practice. Zhanget al. [197] study the placement problem in shared service hostinginfrastructures. Instead of modeling the placement problem as a k-median problem, they consider it similar to the capacitated facilitylocation problem. They define their own penalty cost instead ofusing response time directly. However, these studies are not tailoredfor cloud computing.
Cloud-Based Service Deployment
The Web server placement problem has been widely studied.Web server replicas has been studied by Qiu et al. [157]. They
CHAPTER 2. BACKGROUND REVIEW 25
use the result of the k-median model as a super-optimal result.They use different algorithms to give an approximate solution ofthe model. Zhang et al. [197] study service placement in sharedservice hosting infrastructures. They formulate a model similar tothe general capacitated facility location model. They do not useresponse time directly, but define a new penalty cost.
However, these studies are not tailored for cloud computing.In our work, the properties of cloud computing are considered.The user experience is highlighted and a general framework ofservice deployment in a cloud environment is proposed. Building onprevious studies of single service deployment, we propose a modelfor the co-deployment of multiple services.
k-Median Problem
K-median problem is the problem of finding k medians such thatthe sum of distances of all the points to their nearest medians isminimized. It is a common model for facility location problem.More discussion of this problem can be found in Section 5.4.1.Jain and Vazirani [101] provide a 6-approximation for the k-medianproblem. Their algorithm uses the Lagrangian relaxation technique.Their main contribution is that they use the algorithm for thefacility location problem as a subroutine to solve the k-medianproblem. They prove that a Lagrangian multiplier preserving α-approximation algorithm for the facility location problem gives riseto a 2α-approximation algorithm for the k-median problem. Basedon this approach, many improvements have been achieved. Charikarand Guha [55] use a similar idea and achieve a 4-approximationalgorithm for the k-median problem. Jain et al. [100] obtain a newgreedy approach for the facility location problems. By improvingthe subroutine, they also get a 4-approximation using the sameprocedure as in the previous algorithm.
Arya et al. [40] first analyze the local search algorithm fork-median and provide a bounded performance guarantee. Their
CHAPTER 2. BACKGROUND REVIEW 26
analysis supports our algorithm, used in Section 5.4.1, which canapproximate the optimal solution to the ratio 3 + ε, the best resultcurrently known.
Max k-Cover Problem
Max k-cover is the problem of selecting at most k among n sets- which have many elements in common - that could cover max-imum number of elements. More discussions could be found inSection 5.4.2. The Max k-cover problem is related to the set coverproblem. Many algorithms have been proposed (e.g., [62, 76, 127])to solve this problem. The greedy algorithm [76] is one of the bestpolynomial time algorithms for this problem; it gives a (1 − 1/e)-approximation.
There is also an algorithm for solving the online set cover [28]problem, which deals with the given elements one-by-one. Thisalgorithm can fit the needs of users executing services in the cloud.
k-Median Model and Multi-commodity Facility Location
A series of facility location problems have been well studied in thesupply chain management field, as reviewed by Melo et al. [134].One discrete variation of the facility location problem is the k-median (also p-median) model [130], which has been studied inthe context of Web service deployment [157]. The original k-median model considers the facility location problem for only onecommodity. Our model is closer to the multi-commodity facilitylocation problem.
Pirkul et al. [150] propose the PLANWAR model, which isan established formulation of the multi-commodity, multi-plant,capacitated facility location problem. Shen [170] modifies the costfunction and obtains a new model. Cao et al. [54] propose a variationof the k-median model for the problem. However, these models donot consider cross-plant transportation; instead the commodities are

CHAPTER 2. BACKGROUND REVIEW 27
regarded as rather independent.Thanh et al. [178] propose a very complex dynamic model with
about 40 constraints. The model considers a multi-echelon, multi-commodity production-distribution network with deterministic de-mands. They make the assumption that the production process canbe divided into several steps and can be shared between severalplants. The production process does not rely on other productions orsub-routines. The relation between two commodities is that they canbe manufactured/stored in one facility simultaneously. The multi-echelon is divided according to the life cycle of a commodity butnot a cross-commodity, as in our model.
2 End of chapter.

Chapter 3
Android Performance Diagnosis viaAnatomizing AsynchronousExecutions
Android Performance Diagnosis
This chapter presents DiagDroid, a tool specifically de-signed for Android UI performance diagnosis. The key no-tion is that the UI-triggered asynchronous executions con-tribute to the UI performance, and hence their performanceand runtime dependency should be properly captured. Welist the points of this chapter as:
• Group tremendous ways to start the asynchronousexecutions into five categories; Track and profile themwith low-overhead and high compatibility.
• Implement and open-source release the tool.
• Apply DiagDroid in diagnosing real-world open-source apps which we are unfamiliar with their imple-mentations; Successfully locate and diagnose tens ofpreviously unknown performance issues.
28
CHAPTER 3. ANDROID PERFORMANCE DIAGNOSIS 29
3.1 Motivation and Problem Definition
As daily-use personal devices, mobiles are required to provide quickresponse to the user interface (UI). UI performance of a mobile appis a critical factor to its user experience, and hence becomes a majorconcern to developers [125, 126]. Many recent research efforts havetherefore been put on addressing the performance issues of Androidapps (e.g., Asynchronizer [123], Panappticon [196]). However, poorUI performance of Android apps remains a widely-complaint typeof issues among users [125, 126]. App developers are still lacking ahandy tool to help combat performance issues.
Android provides a non-blocking paradigm to process UI events(i.e., user inputs) for its apps. The UI main thread dispatches validUI events to their corresponding UI event procedures (i.e., the UIevent-handling logic). A UI event procedure generally runs in anasynchronous manner, so that the main thread can handle other UIevents simultaneously. After the asynchronous part is done, theUI can be updated with a call-back mechanism. This paradigmwill lead to complicated concurrent executions. Asynchronousexecution processes may bear implicit dependency during theirruntime. For example, two may be scheduled to run in the samethread by Android, and one may consequently wait for the other tocomplete. Such unexpected waiting may result in a longer delayfor a UI procedure, leading to UI performance issues. However,it is hard to predict such runtime dependency during the codingphase due to the complications of Android’s asynchronous executionmechanisms [152]. Performance issues are hence inevitable.
Concurrency is a notorious source of bugs [129]. Current toolsfor diagnosing Android UI performance issues generally considereither the synchronous part of the UI event procedure [90], or theexecution process of one UI event procedure per se [196]. They do

CHAPTER 3. ANDROID PERFORMANCE DIAGNOSIS 30
not focus on the dependency of multiple asynchronous executionprocesses. Hence, they are still not enough to cope with the UIperformance issues largely caused by such runtime dependency.
Long-term testing is a well-known, viable means to trigger bugscaused by concurrency [118]. Unfortunately, we lack an automaticmechanism to check whether there exists a performance issue inthe long-term testing. Manual inspection of the tremendous tracesproduced by current method tracing tools (e.g., Traceview [153]) isextremely labor-intensive, if not infeasible, not to mention their hugeoverhead.
We find that unlike general concurrent programs [50, 53, 98,108], an Android UI event procedure can be anatomized into a set oftrackable tasks, which can then be properly profiled so as to facilitatethe detection and localization of performance issues. Specifically,although Android supports tremendous ways to schedule asynchron-ous executions, we conclude that they can actually be abstracted asfive categories. Each can be tracked and profiled in task granularityaccording to the specifics of each category. UI performance canhence be modeled by the performance of the tasks. We furthertackle the complication of runtime dependency via examining thedependency of tasks, which can be solved by checking whether thetasks request the same execution unit (e.g., a thread pool). Viamodeling task performance by not only its execution time, but thetime when it waits for execution (i.e., the time between when itis scheduled and when it starts execution), we can model how atask is influenced by the others. Thus, performance issues due toasynchronous executions can be properly captured.
Hence, this chapter proposes DiagDroid (Performance Di-agnosis for Android), a novel tool to exercise, profile, andanalyze the UI performance of an Android app without modifyingits codes. First, via a light-weight static analysis of the targetapp, DiagDroid obtains the necessary app information for itsprofiling mechanism. Then it employs a plugin testing approach
CHAPTER 3. ANDROID PERFORMANCE DIAGNOSIS 31
(e.g., Monkey [179], a random testing approach) to exercise theoriginal app. The required runtime data are then captured duringthe testing run via its profiler. The data are then processed offlineto generate a human readable report. The report can unveil poten-tial performance bugs to developers and direct them to suspiciouslocations in the source codes. Human efforts can greatly be reducedin diagnosing UI performance issues. Finally, DiagDroid solvesthe compatibility and efficiency challenges generally faced by thedynamic analysis tools by slightly instrumenting only the generalAndroid framework invocations with a dynamic instrumentationapproach. Hence, it can be applied to most off-the-shelf mobilemodels and apps.
We have implemented and open-source released DiagDroidwith a tutorial [69]. We show that it is easy to apply DiagDroid toreal-world practical apps with light configurations. In the 33 open-source real-world apps we study, 27 performance defects in 14 appsare found, and we receive positive feedbacks from their developers.These defects are all caused by the complicated dependency ofasynchronous executions, which can hardly be located by currentUI performance diagnosis practice. This indicates the effectivenessof DiagDroid.
3.2 Android Application Specifics
3.2.1 UI Event Processing
Designed mainly for user-centric usage patterns, Android apps aretypically UI oriented: An app will iteratively process user inputs,and accordingly update the display to show the intended contents.The main thread of an app is the sole thread that handles theUI-related operations [152], such as processing user inputs anddisplaying UI components (e.g., buttons and images). When a validuser input (i.e., a UI event) comes, the main thread can invoke its
CHAPTER 3. ANDROID PERFORMANCE DIAGNOSIS 32
Figure 3.1: An AsyncTask example
corresponding UI event procedure, i.e., the codes that handle the UIevent.
Some UI event procedures may be time-consuming, for example,one to download a file from the Internet. To avoid blocking themain thread, the UI event procedures conduct heavy-weighted workin an asynchronous manner so that the main thread can handle otherUI inputs simultaneously [152]. After such asynchronous executionsare done, the UI can be updated in the main thread with a call-backmechanism.
Figure 3.1 shows the codes of an Activity (i.e., a windowcontainer for the UI components to be displayed). It retrievesdata from the Internet and displays the data in a TextView (i.e.,a UI component to display text) after a button is touched. TheInternet access is done asynchronously in another thread while the
CHAPTER 3. ANDROID PERFORMANCE DIAGNOSIS 33
Table 3.1: Asynchronous execution examples
Class Code Segment
Thread//Create a new thread and download in that thread
Thread thread = new Thread(new DownloadRunnable(url));
thread.start();
ThreadPool
Executor
//Download in one thread of a thread pool with capacity 10
ExecutorService threadPool = Executors.newFixedThreadPool(10);
threadPool.execute(new DownloadRunnable(url));
Handler
//Download in a HandlerThread by posting a task on the attached handler
HandlerThread handlerThread = new HandlerThread("DownloadHanderThread");
handlerThread.start();
Handler handler = new Handler(handlerThread.getLooper());
handler.post(new DownloadRunnable(url));
IntentService
//Download in a user‐defined Service
Intent downloadIntent = new Intent(this, DownloadService.class);
downloadIntent.putExtra(DownloadService.URLKEY, url);
startService(downloadIntent);
DownloadManager
//Use standard DownloadManager Service, utilizing ThreadPoolExecutor implictly
DownloadManager dm = (DownloadManager) getSystemService (DOWNLOAD_SERVICE);
DownloadManager.Request req = new DownloadManager.Request(Uri.parse(url));
dm.enqueue(req)
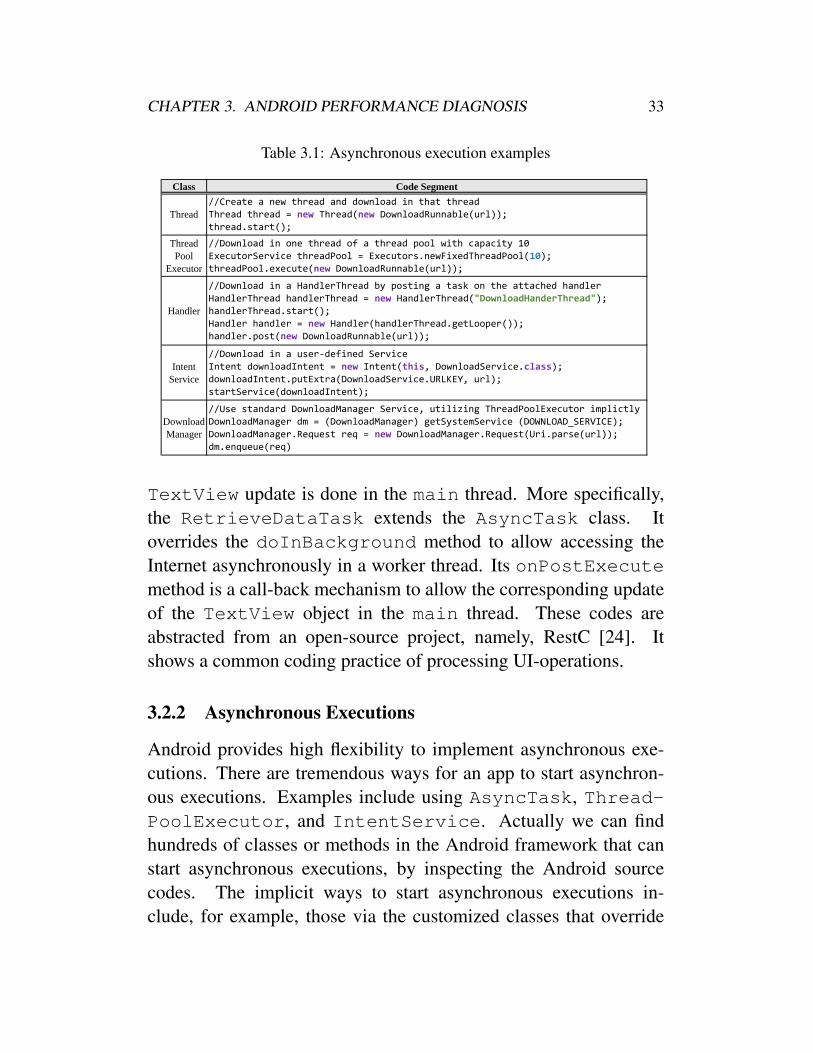
TextView update is done in the main thread. More specifically,the RetrieveDataTask extends the AsyncTask class. Itoverrides the doInBackground method to allow accessing theInternet asynchronously in a worker thread. Its onPostExecutemethod is a call-back mechanism to allow the corresponding updateof the TextView object in the main thread. These codes areabstracted from an open-source project, namely, RestC [24]. Itshows a common coding practice of processing UI-operations.
3.2.2 Asynchronous Executions
Android provides high flexibility to implement asynchronous exe-cutions. There are tremendous ways for an app to start asynchron-ous executions. Examples include using AsyncTask, Thread-PoolExecutor, and IntentService. Actually we can findhundreds of classes or methods in the Android framework that canstart asynchronous executions, by inspecting the Android sourcecodes. The implicit ways to start asynchronous executions in-clude, for example, those via the customized classes that override

CHAPTER 3. ANDROID PERFORMANCE DIAGNOSIS 34
the Android framework classes such as AsyncTask or Han-dlerThread.
Table 3.1 shows various ways of conducting asynchronous exe-cutions. For a simple task to download Internet contents, we couldname at least 6 ways (including examples shown in Figure 3.1and Table 3.1). Choosing which way generally depends on thedeveloper’s own preference.
No matter how an asynchronous execution starts, it is executedby the operating system (OS) via the thread mechanism so as toimplement concurrency. However, Android may start a new threador reuse a running thread for the asynchronous execution. As aresult, different asynchronous executions may share the same threadand run sequentially. In other words, they may compete for the sameexecution unit. Unfortunately, it is hard for the developer to be awareof such dependency of asynchronous executions: she may not knowexactly how the asynchronous executions run.
The complex ways of starting asynchronous executions, togetherwith their complicated runtime dependency, make it difficult for thedevelopers to comprehend the performance of UI event proceduresthey write. Performance issues are hence hard to be eliminatedwithout a proper tool. Next, we will show two representativeperformance issues.
3.3 Motivating Examples
Since there is only one sole main UI thread for each app, UI eventsare handled one by one by the thread. Hence, in order not to blockthe main thread, the official Android development guide [152]suggests that asynchronous executions should be conducted fortime-consuming tasks if an event handler includes such tasks.
Actually app developers may overlook such suggestions occa-sionally and write time-consuming codes in the synchronous partof the UI event handler (i.e., that executes in the main thread).
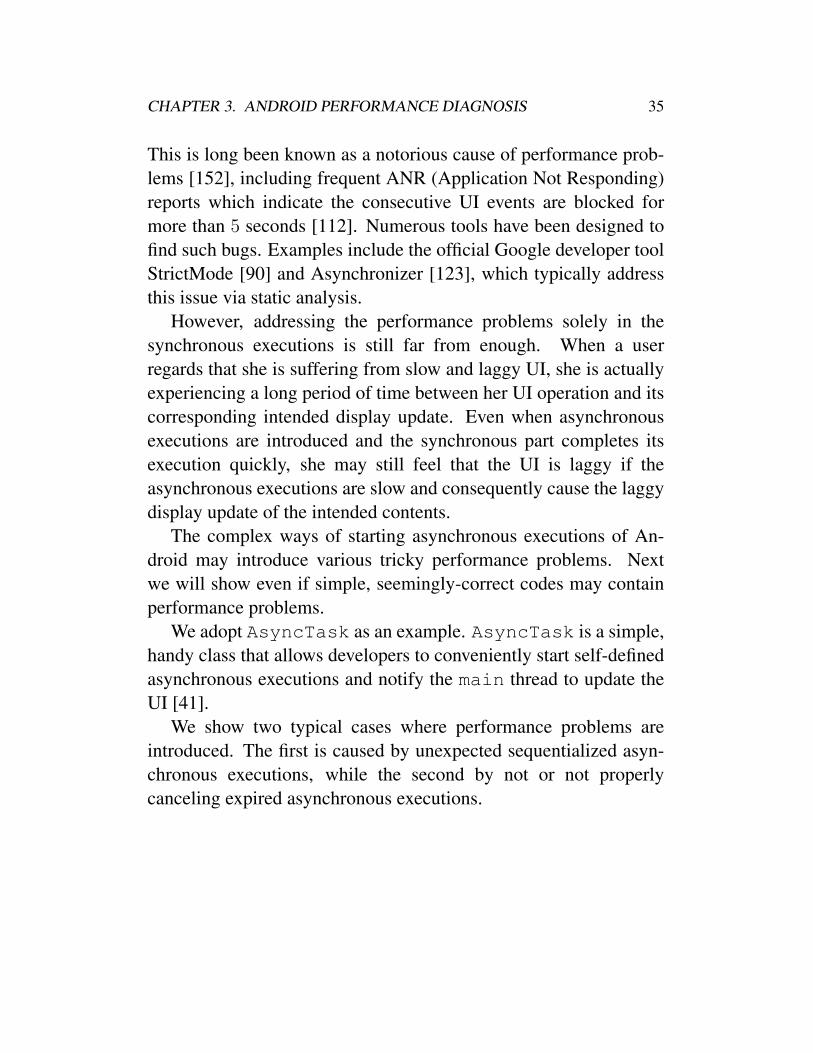
CHAPTER 3. ANDROID PERFORMANCE DIAGNOSIS 35
This is long been known as a notorious cause of performance prob-lems [152], including frequent ANR (Application Not Responding)reports which indicate the consecutive UI events are blocked formore than 5 seconds [112]. Numerous tools have been designed tofind such bugs. Examples include the official Google developer toolStrictMode [90] and Asynchronizer [123], which typically addressthis issue via static analysis.
However, addressing the performance problems solely in thesynchronous executions is still far from enough. When a userregards that she is suffering from slow and laggy UI, she is actuallyexperiencing a long period of time between her UI operation and itscorresponding intended display update. Even when asynchronousexecutions are introduced and the synchronous part completes itsexecution quickly, she may still feel that the UI is laggy if theasynchronous executions are slow and consequently cause the laggydisplay update of the intended contents.
The complex ways of starting asynchronous executions of An-droid may introduce various tricky performance problems. Nextwe will show even if simple, seemingly-correct codes may containperformance problems.
We adopt AsyncTask as an example. AsyncTask is a simple,handy class that allows developers to conveniently start self-definedasynchronous executions and notify the main thread to update theUI [41].
We show two typical cases where performance problems areintroduced. The first is caused by unexpected sequentialized asyn-chronous executions, while the second by not or not properlycanceling expired asynchronous executions.

CHAPTER 3. ANDROID PERFORMANCE DIAGNOSIS 36
private class MyOnClickListener implements OnClickListener {@Overrideprotected void onClick(View v){
RetrieveDataTask task1, task2, task3;task1 = new RetrieveDataTask(textView1);task2 = new RetrieveDataTask(textView2);task3 = new RetrieveDataTask(textView3);// the frist trial on executing tasks in parallel task1.execute(url1);task2.execute(url2);task3.execute(url3);
}}
// example code of executing tasks in parallel, notice the change// of API in Android 3.0if (Build.VERSION.SDK_INT >= Build.VERSION_CODES.HONEYCOMB) {
task1.executeOnExecutor(AsyncTask.THREAD_POOL_EXECUTOR, url1);} else {
task1.execute(url1);}
Figure 3.2: Example codes which may cause potential performance problems
3.3.1 Sequential Running of Multiple Asynchronous Execu-tions
Let us suppose that an event handler will show three text views inan Activity. The content of each text view should be loadedfrom the Internet. Since Internet access is slow, the developer mayresort to asynchronous executions to download the contents, andexpect to download the three in parallel. Her codes are illustratedin Figure 3.2, where the class RetrieveDataTask is defined inour previous example shown in Figure 3.1.
Invoking the execute method is shown as a usage example bythe official guide [41], which is commonly used to start the asyn-chronous executions defined by the AsyncTask extensions (e.g.,the RetrieveDataTask class in this example). The developermay consider that every RetrieveDataTasks would be executedin separated threads, and hence invoking three execute methodsin sequential will make them run in parallel.
However, even such simple codes contain subtle causes of po-tential performance problems. Since the execute method ofAsyncTask cannot be overridden, all the execution methods inthis example will actually call the execute method implementedin their super class (i.e., AsyncTask). In the recent versions of

CHAPTER 3. ANDROID PERFORMANCE DIAGNOSIS 37
private class MyOnClickListener implements OnClickListener {@Overrideprotected void onClick(View v){
retrieveDataTask task1, task2, task3;task1 = new retrieveDataTask(textView1);task2 = new retrieveDataTask(textView2);task3 = new retrieveDataTask(textView3);// the frist trial on executing tasks in paralleltask1.execute(url1);task2.execute(url2);task3.execute(url3);
}}
// example code of executing tasks in parallel, notice the change// of API in Android 3.0if (Build.VERSION.SDK_INT >= Build.VERSION_CODES.HONEYCOMB) {
task1.executeOnExecutor(AsyncTask.THREAD_POOL_EXECUTOR, url1);} else {
task1.execute(url1);}
Figure 3.3: Correct codes to execute an Asynctask
Android framework, invoking the execute method will insert thecorresponding task into a global queue and all tasks will be executedin sequential in one sole thread instead of in parallel in multiplethreads. This inevitably incurs more time to complete the downloadtasks and update the UI accordingly. As a result, the user willexperience laggy UI.
It is worth noting that such sequential execution mechanism isintroduced recently in Android systems with version numbers largerthan 3.0. In previous versions, the codes will, in contrast, executein parallel as expected. It is quite possible for the developers toneglect such changes and introduce potential performance problems.Android has a quick evolution on the framework. Though providinggood backward compatibility in APIs, the implementations of theseAPIs are not guaranteed to be stable. However, current tools likeStrictMode [90] and Asynchronizer [123] only locate problems inthe synchronous executions. As a result, such performance problemsin the asynchronous executions caused by unexpected sequentializedasynchronous executions cannot be located conveniently by currenttools. Nonetheless, such code defects are quite common among de-velopers. For example, the Facebook Widget [148] project containsa similar issue in its class StreamFragment.StatusAdapter.
Note that the execution time values of the tasks per se betweenthe sequential case and the parallel case may not be quite different.However, for the sequential case, a task may be queuing for exe-cution for a longer time after it is scheduled. If a tool can capturesuch a queuing time, it can greatly facilitate performance diagnosis.

CHAPTER 3. ANDROID PERFORMANCE DIAGNOSIS 38
public class MyActivity extends Activity {private class RetrieveDataTask extends AsyncTask<String, Void, String> {
...@Overrideprotected String doInBackground(String... urls) {
...// monitor the cancelation, stop as soon as the task is cancelledwhile (!isCancelled() && (length = is.read(buf)) != ‐1) {...
}}
private RetrieveDataTask retrieveDataTask1, retrieveDataTask2,retrieveDataTask3;
...
@Overridepublic void onStop() {
// should cancel tasks explicitlyif(retrieveDataTask1 != null) retrieveDataTask1.cancel(true);if(retrieveDataTask2 != null) retrieveDataTask2.cancel(true);if(retrieveDataTask3 != null) retrieveDataTask3.cancel(true);super.onStop();
}}
Figure 3.4: An example of cancelling AsyncTask
DiagDroid is a tool that can well capture such queuing time.As a consequence, it is able to detect and locate such performanceproblem.
Finally, such a code defect can be resolved by invoking theexecuteOnExecutor method instead of the execute methodby assigning a new task queue for each download task. We showthe modifications of the first execute statement in Figure 3.2 asan example in Figure 3.3.
3.3.2 Not Canceling Unnecessary Asynchronous Executions
Let us again consider the example codes shown in Figure 3.1. Afterthe codes are modified as shown in Figure 3.3 so that the threetasks can execute in parallel, the codes still may cause performanceproblems. Suppose the app allows its user to switch the activitiesduring the three views being loaded in the current activity, forinstance, with a right-to-left sliding operation. Such a mechanism iscommonly used in Android apps, which facilitates users to quickly

CHAPTER 3. ANDROID PERFORMANCE DIAGNOSIS 39
locate the activity of interest. An example is that an email clientmay allow the user to switch from the list-email activity to the read-email activity, even if the email list is not completely shown in thelist-email activity.
When the user switches to another activity, the three tasks whichare loading contents from the Internet are no longer required sincetheir associated views and activity are invisible. It is therefore un-necessary to continue the three asynchronous tasks in downloadingthe Internet contents. But the example codes do not explicitly cancelthe asynchronous tasks. The tasks will run until the entire con-tents are downloaded. Such unnecessary asynchronous executionsmay incur resource races (e.g., occupying the Internet bandwidth),and therefore deteriorate the performance of other asynchronousexecutions. Sometimes, they may even block other asynchronousexecutions: For example, they can occupy the working threads in athread pool and cause other tasks waiting for free threads.
The codes can be further improved, as shown in Figure 3.4. Notethat such code defects are very common to Android apps. We willshow in our experimental study that many developers of the popularAndroid apps (e.g., rtweel [158] and BeerMusicDroid [183]) havemade such mistakes.
Note that a canceling operation is typically required when thetask is time-consuming and should be terminated in the middle.If not properly canceling such a task, its execution latency willbe relatively large. Hence, the key to detect and locate sucha performance issue is to find out the execution latency of theasynchronous tasks. DiagDroid can well profile the task with itsexecution latency, which can greatly facilitate the diagnosis of sucha performance problem.
The above mentioned performance issues shown in Section 3.3.1and 3.3.2 actually can hardly be tackled by current tools. Toolslike StrictMode [90] and Asynchronizer [123] consider only thesynchronous part of a UI event procedure, which cannot locate the

CHAPTER 3. ANDROID PERFORMANCE DIAGNOSIS 40
App Binary
Runtime Data
Test Execute
Dependency‐aware Performance Diagnosis
Defects
AsynchronousExecution‐based
Profiling
StaticAnalysis
Cases
App Info
Figure 3.5: Overview of DiagDroid Framework
issues caused by the asynchronous executions. Other tools likePanappticon [196], Method Tracing [153] can track such executions.However, they largely do not focus on the runtime dependency ofasynchronous executions. It is hard to find out such dependency viaexamining the tremendous traces produced by these tools. Hence,they are still not enough to cope with UI performance issues. Fixingthis gap is the purpose of DiagDroid.
3.4 UI Performance Diagnosis
We notice that the key to pinpoint the above performance issue isto know not only the execution time of an AsyncTask, but alsothe time between when it is scheduled and when it starts to execute(i.e., the queuing time), as well as the other AsyncTasks that arein the same thread pool. Specifically, an unexpectedly long queuingtime of an AsyncTask can indicate a performance issue. We caninstantly know there are too many AsyncTasks in the thread pool.By examining which AsyncTasks are in the pool together with thepool capacity, we can easily locate these performance issues.
The above notion can also be applied to other mechanisms thatstart asynchronous executions. This is the basis of the DiagDroid
CHAPTER 3. ANDROID PERFORMANCE DIAGNOSIS 41
design, which we overview in Figure 3.5. DiagDroid anatomizesthe Android UI event procedures into a set of tasks and then quantizethem so that data analysis can be conducted towards automatingperformance diagnosis.
Specifically, as shown in Figure 3.5, DiagDroid first per-forms a light static analysis of the target app and obtains somerequired information to assist runtime profiling. It then exercisesthe original app via a plugin testing approach which can involverandom test cases (e.g., Monkey [179]) or user-defined ones (e.g.,Robotium [164], UIAutomator [177]). During the testing run, theprofiler can track asynchronous executions, so as to anatomize theUI event procedures into a set of tasks. The performance of the tasks,together with their runtime dependency, can then be captured. Basedon the profiling data, DiagDroid detects performance issues andanalyzes their causes. A report can finally be generated with an aimto direct the debugging process.
To this end, we need to address several critical considerationsincluding the profiling granularity and how to do the profiling and di-agnosing. Next, we will discuss the profiling granularity of Diag-Droid, and the required runtime data for modeling asynchronousexecutions and their runtime dependency (in Section 3.4.1). Then,we illustrate how such data can facilitate UI performance diagnosis(in Section 3.4.2).
3.4.1 Modeling Tasks and Their Dependency
As shown in Section 3.3, subtle runtime dependency of asynchron-ous tasks can result in tricky performance issues. Analyzing suchdependency is a key concern to DiagDroid. We analyze the appruntime in task level, defined as follows.
Definition 3.1. An asynchronous task (or task) is a segment of codesthat run in sequence in a single thread. It defines a developer-intended asynchronous execution process.
CHAPTER 3. ANDROID PERFORMANCE DIAGNOSIS 42
DiagDroid profiles the app runtime in task granularity. Thereasons are as follows. First, it is good enough for performancediagnosis to profile in such a granularity. A task is a short segmentof codes that can also be well understood by its developer. If thedeveloper can know which task is anomalous, she can instantlyreason its cause by inspecting the task-related codes. Second, such agranularity will not incur too much profiling overhead, comparedwith the finer granularity (e.g., in method level or in line level).Most importantly, profiling app runtime in task granularity can wellcapture the runtime dependency of two asynchronous tasks. As aconsequence, UI performance issues caused by such dependencycan be easily detected and located.
The task performance naturally reflects the performance of theentire UI event procedure: a slow task may result in a slow UI eventprocedure, leading to a laggy UI. Next, we discuss how to modeltask performance. We are aware of the fact that it is possible for atask to queue in an execution unit before it is executed. As a result,to model its performance, we should consider not only its executiontime, but also its queuing time in the unit.
Definition 3.2. The queuing time of a task is the interval betweenwhen the task is scheduled (e.g., when execute method is calledto start an AsyncTask) and when it starts to execute.
We propose to use both the queuing time and the execution timeto model the task performance. Note that this is generally differentfrom the current diagnosis practice with tools like TraceView anddumpsys [153]. It is hard, if not infeasible, for these tools to obtainsuch data as they focus only on the execution time of individualmethods.
The queuing time of a task is influenced by the other tasks thatmay compete for the same execution unit. We formally define taskruntime dependency as follows.
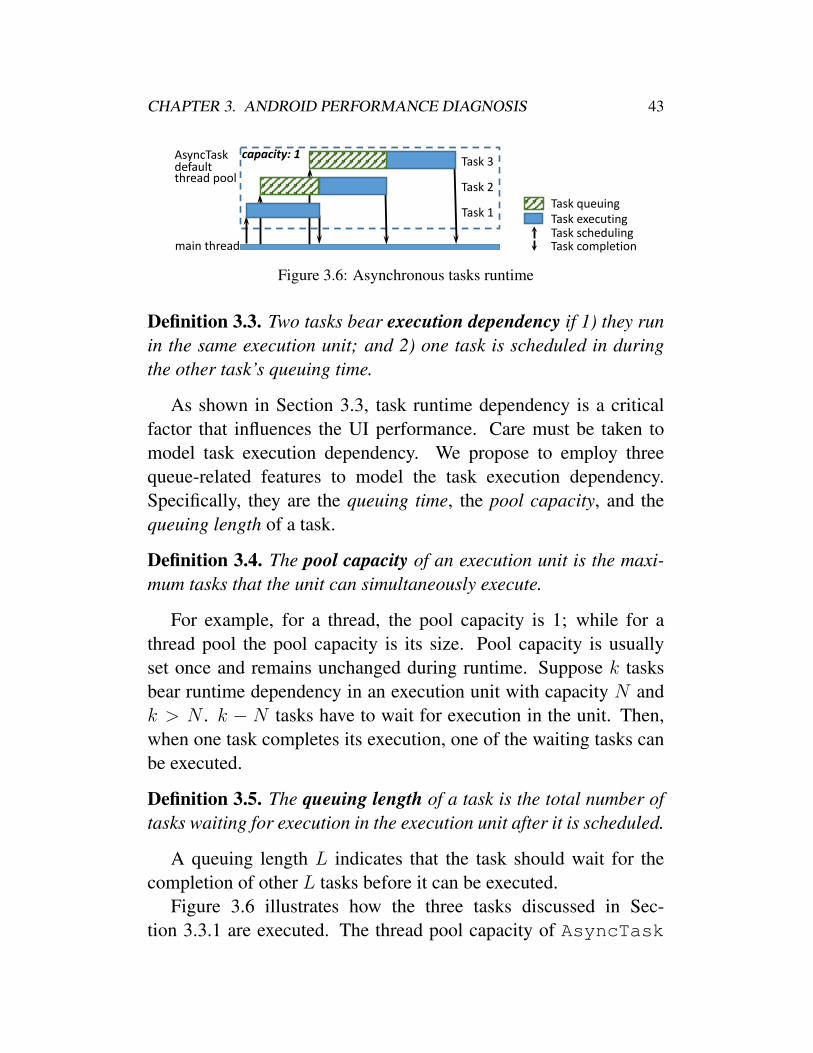
CHAPTER 3. ANDROID PERFORMANCE DIAGNOSIS 43
main thread
AsyncTask capacity: 1
Task 1
Task 2
Task 3
Task queuingTask executingTask schedulingTask completion
defaultthread pool
Figure 3.6: Asynchronous tasks runtime
Definition 3.3. Two tasks bear execution dependency if 1) they runin the same execution unit; and 2) one task is scheduled in duringthe other task’s queuing time.
As shown in Section 3.3, task runtime dependency is a criticalfactor that influences the UI performance. Care must be taken tomodel task execution dependency. We propose to employ threequeue-related features to model the task execution dependency.Specifically, they are the queuing time, the pool capacity, and thequeuing length of a task.
Definition 3.4. The pool capacity of an execution unit is the maxi-mum tasks that the unit can simultaneously execute.
For example, for a thread, the pool capacity is 1; while for athread pool the pool capacity is its size. Pool capacity is usuallyset once and remains unchanged during runtime. Suppose k tasksbear runtime dependency in an execution unit with capacity N andk > N . k − N tasks have to wait for execution in the unit. Then,when one task completes its execution, one of the waiting tasks canbe executed.
Definition 3.5. The queuing length of a task is the total number oftasks waiting for execution in the execution unit after it is scheduled.
A queuing length L indicates that the task should wait for thecompletion of other L tasks before it can be executed.
Figure 3.6 illustrates how the three tasks discussed in Sec-tion 3.3.1 are executed. The thread pool capacity of AsyncTask

CHAPTER 3. ANDROID PERFORMANCE DIAGNOSIS 44
is 1. When Task 2 is scheduled, it has to wait until Task 1 finishesits execution. So the queuing length of Task 2 is 1. Similarly, thequeuing length of Task 3 is 2.
The queuing time of a task reflects how other tasks influence itsperformance. The queuing length and pool capacity indicate thecause of a bad-performance task. Such information can greatly helpperformance diagnosis. However, existing tools for performancediagnosis (e.g., Panappticon [196], Method Tracing [153]) cannotprovide such information. As a result, it is difficult for themto diagnose the subtle performance issues caused by executiondependency.
We will elaborate how DiagDroid collects these runtime datain Section 3.5. Next, we will first discuss how DiagDroidconducts performance diagnosis with the collected data.
3.4.2 Dependency-aware Performance Diagnosis
When the UI is laggy, it indicates that a UI event procedure requireslonger time to complete. As discussed, this can be rooted in eitherthe synchronous part or the asynchronous executions. Althoughmany tools (e.g., [123, 90]) have well addressed the former case,DiagDroid moves a step further by focusing on the latter case, afar more difficult task in addressing the subtle performance issuescaused by the asynchronous executions.
If the asynchronous part is laggy, it means at least one of theasynchronous tasks requires more time to complete. Consequent-ly, DiagDroid should detect performance anomaly by checkingwhether there are any anomalous asynchronous tasks. Humaninspection of all the involved tasks is prohibitively labor-intensive.DiagDroid requires an automatic way to detect anomalous tasks.A possible approach is to group the tasks in such a way that we canassume the tasks in the same group have similar performance. Thenwe can perform anomaly detection in a group basis.
CHAPTER 3. ANDROID PERFORMANCE DIAGNOSIS 45
But easy as it looks, how to group the tasks is challenging. Aninstant approach is to consider the method call-stack when a taskis scheduled. We name such call-stack the execution context ofthe task. The execution context actually links to the source codesthat define the task and how the codes are reached. Two tasks withthe same execution context mean that they are corresponding to thesame specific source code segment and execution sequence. Hence,they should naturally be grouped together.
However, this simple consideration will result in extensive de-bugging efforts. A code defect may manifest in similar tasks withslightly-different execution contexts. Reporting all such tasks oneby one based on their execution contexts may be very tedious, andeven make the diagnosis difficult with such tedious information. Forexample, two UI event procedures of two buttons may invoke thesame buggy asynchronous task (in the source codes). In these twocases, the two task invocations have different execution contextssince they are invoked by different event procedures. But theyshould be grouped together to reduce human efforts in inspectingthe codes.
DiagDroid addresses this challenge by putting similar tasksinto a group with a proper definition of task similarity. By consid-ering each method call as a symbol, an execution context can beencoded into a sequence. Then the difference of two tasks is the editdistance of their execution contexts. We adopt such an edit distanceas a similarity measure due to the following considerations. First, itis suitable to model the differences of two tasks. Again consider theabove example, if two UI event procedures of two buttons invokethe same buggy asynchronous task (in the source codes), the editdistance of the execution contexts of the two task invocations willremain close. As a result, they can be grouped together. Second,it also takes the invocation order information into consideration,where such an order in execution context is important to describethe program runtime. Consequently, two close execution contexts
CHAPTER 3. ANDROID PERFORMANCE DIAGNOSIS 46
indicate that the corresponding tasks are similar during programruntime. With such a similarity measure, DiagDroid conductsthe single-linkage clustering, a widely-adopted sequence clusteringmethod, to form groups [84].
DiagDroid examines whether performance anomaly manifestsin each group of tasks by the execution context, queuing time andexecution time. DiagDroid considers both the maximum value ofqueuing time and that of the execution time of all the tasks withineach group A. The values are denoted by Mq(A) = max(Q(a))and Me(A) = max(E(a)) (∀a ∈ A), in which Q(a) and E(a) arequeuing time and execution time for task a respectively. Mq(A) andMe(A) are then considered as the performance metrics of group A,since either a long execution time or a long queuing time can resultin anomalous performance.
DiagDroid considers a group is anomalous if one of its twoperformance metrics is larger than a threshold τ . It ranks theanomalous groups according to their performance metrics as wellas their execution contexts. Since each group is corresponding toa specific source code segment, the ranking can direct the manualdebugging efforts towards a suspicious source code segment thatmay cause the performance anomaly. Moreover, a key considerationof DiagDroid is that the runtime dependency of tasks may alsocause performance issues. In other words, the anomalous taskper se may not always be the root cause of its poor performance.Especially, when the queuing time of the task is too long, the poorperformance may be due to other tasks that bear runtime dependencywith the poor-performance task. Therefore, DiagDroid alsoemploys the performance data (the queuing length and performance)of such tasks to help locate the root cause. We will show in ourexperimental study that the localization approach can greatly reducehuman efforts in locating performance issues.
The maximum values of queuing time and execution time aredefined as performance metrics by DiagDroid. We consider the
CHAPTER 3. ANDROID PERFORMANCE DIAGNOSIS 47
maximum values instead of the average values. A large averagevalue means that many tasks in the group are of poor performance,and is hence a good indicator of performance issues. However, incase that only a small portion of the tasks are with poor performance,the average value may still be small. But this can still be animportant symptom of performance issues [72]. Since in the abovetwo cases the maximum value will be large, it can indicate theperformance issues. Hence, we consider the maximum value as theperformance metric.
In the above discussions, we have considered a performancethreshold τ as an indicator of whether a group contains poor-performance tasks. τ is selected empirically based on the develop-er’s consideration on laggy UI. Previous work (e.g., [141, 145, 166])has suggested user-tolerable waiting time in web browsing, mobileweb browsing and mobile services, which are from two to severalseconds. One second is regarded as the limit for the user’s flow ofthought to stay uninterrupted [144]. We consider that mobile appusers are more sensitive to UI response time. Therefore, we use500ms as the value of τ . We will show in our experimental study inSection 3.6 that such a value is an effective choice.
3.5 Profiling Asynchronous Tasks
DiagDroid requires to profile the queuing time, the executiontime, and the queuing length of task, as well as the pool capacityof the execution unit. Hence, DiagDroid must firstly track thelife-cycle of a task, i.e., when it is scheduled, when it is executed,and when it completes.
However, as discussed in Section 3.2, there are hundreds of waysfor developers to implicitly or explicitly start asynchronous tasks.There are no sole entry/exit points for diverse types of tasks. It isdifficult, if not infeasible, to design specific profiling mechanismfor each. We attack this challenge with a separation-of-concerns

CHAPTER 3. ANDROID PERFORMANCE DIAGNOSIS 48
Table 3.2: Categories of asynchronous tasks
Category Type Representative classes
Reusing existing
threads
Looper & Handler HandlerThread
IntentService
Pool‐based
executor
ThreadPoolExecutor
AsyncTask
Creating new threads Thread Thread
approach. We first find that the tremendous ways to start tasks canbe classified into five categories (Section 3.5.1). Then based on theclassification, we can specifically track and profile the necessaryruntime data for each category (Section 3.5.2).
3.5.1 Categorizing Asynchronous Tasks
Via carefully inspecting Android source codes, we notice that theunderlying mechanisms for Android to execute a task can be nar-rowed down into two approaches: 1) reusing existing threads createdbeforehand, and 2) creating a new thread. The former case can befurther divided into two types: One directly schedules a task and theother requests the scheduling of a task by a delegate via sending amessage. We call them the Pool-based Executor mechanism andthe Looper & Handler mechanism respectively. We list them inTable 3.2, together with their representative classes in Android. Wediscuss them in what follows.
Both HandlerThread and IntentService depend on theLooper & Handler mechanism to start tasks. They create a workerthread and wait for new tasks to the looper associated with thethread. The request of scheduling a task is sent via a handlerattached to the looper. The requested task will then wait to beprocessed in the worker thread. Since there is only one workerthread, it can process one message at a time. The other requestsshould wait in a queue.

CHAPTER 3. ANDROID PERFORMANCE DIAGNOSIS 49
ThreadPoolExecutor and AsyncTask both use the Pool-based Executor mechanism. They maintain a pool of worker threadswith its number not exceeding a preset capacity. When a task comes,the task will be executed in one of the threads in the pool if there areavailable threads (i.e., the number of threads which are executingother tasks is smaller than the capacity). Otherwise, the task has towait for an available thread.
The Thread mechanism is relatively simple. Its building basis,i.e., the Thread class in Android, is the same as the traditional Javaone. This mechanism starts a task immediately in a new thread.
Although there are hundreds of ways for developers to implicitlyor explicitly start asynchronous tasks, the underlying mechanismsare mostly based on these five representative classes. For ex-ample, the AsyncQueryHandler class, which is a convenientAPI for querying data from a content provider, is based on theHandlerThread. The CursorLoader class, which is oftenused for acquiring data from the database, is based on AsyncTask.Moreover, the DownloadManager which we have discussed inSection 3.2 employs the ThreadPoolExecutor. Verifying bythe Android source codes, most types of asynchronous tasks arecovered by the five classes except TimerTask. TimerTask is aclass that defines periodical background tasks which usually wouldnot update UI, and thus is not our focus.
Each of the five classes for conducting asynchronous tasks hasits pros and cons. The Thread class is the most flexible one. Adeveloper can get full control on the threading mechanism. Thedisadvantage is that more efforts are required to manage the thread.Moreover, creating a new thread for every task consumes systemresources. The HandlerThread class requires many developmentefforts to customize both the background threads and the handler forthe tasks. The ThreadPoolExecutor class is a traditional JAVA classfor multi-threading. It is widely used to manage a pool of workerthreads. However, it is not suitable for tasks that will update UI

CHAPTER 3. ANDROID PERFORMANCE DIAGNOSIS 50
since Android framework prohibits UI updating in worker threads.The AsyncTask class is specifically customized for Android devel-opment, which is convenient for UI update after the task finishes.The IntentService class can start a background service which isindependent of the activity life cycle. It is a relatively heaviercontainer compared with the above-mentioned classes. It requiresmore system resources on execution. Choosing which way tostart asynchronous executions depends on the specific programmingrequirements, as well as the developer’s preference.
3.5.2 Profiling Asynchronous Tasks
DiagDroid tracks the tasks with a dynamic instrumentation mech-anism on the Android framework methods. It requires no changesto the target app, or recompiling the underlying OS and the Androidframework. This can guarantee the compatibility of DiagDroidwith diverse Android versions and device models. Moreover, it alsorequires little human efforts in installing and applying the tool.
Specifically, Android processes of its apps, unlike general Linuxprocesses, are all set up by duplicating a system process calledZygote [64]. Android framework functionalities have already beenloaded in Zygote before such duplication. Therefore, we caninstrument the Zygote process and “hijack” the Android frame-work methods of interest before an app runs. Then when it runs byforking Zygote, the method invocations are inherently hijacked byDiagDroid. Hence, we can easily track the methods. We adoptsuch a mechanism implemented in the tool named Xposed [193],usually used for modifying UI [192]. We program our own codesto hijack the methods of our interest. Next we introduce howDiagDroid tracks the tasks in each category.
1) Thread: An asynchronous task that implements as a threadalways starts with its start method. Hence, we can instantlyobtain the time when the task is scheduled by tracking the start

CHAPTER 3. ANDROID PERFORMANCE DIAGNOSIS 51
method. However, the task is executed in the overridden runmethod of a Runnable object. An abstract method of an interfacelike Runnable cannot be instrumented directly. Hence, we resortto static analysis to find the implementations of the abstract runmethod and instrument these implementation methods instead.
The static analysis is performed via the tool apktool [38]. Itdecompiles the binary into well-structured Dalvik bytecode. Theycan be parsed to obtain the implementations of the abstract runmethod, which can direct our dynamic instrumentation approach toobtain the execution time. It is worth noting that DiagDroid onlydecompiles and discovers these methods, instead of modifying andrecompiling the app before installation.
2) HandlerThread: HandlerThread is a thread that pro-vides a Looper object attached to it. A Handler is associatedwith the Looper object and handles messages for the Looper.Hence, we can obtain the request time of a task by tracking the timewhen a Message object is sent to the Handler. Since eventuallysendMessageAtTime or sendMessageAtFrontOfQueuemust be invoked to send a Message, we record the invocationtime of these two Android framework methods as the time whena task is scheduled. Since Handler actually performs the task byprocessing its corresponding Message, we track task execution byinstrumenting its dispatchMessage method.
3) IntentService: An IntentService task always startsby invoking the startService method of the Android frame-work class android.app.ContextImpl. Hence, the invoca-tion time of this method is recorded as the task scheduling time. In-tentService actually relies on a Hanlder to process the taskby an extended class ServiceHandler of Handler. Hence,we can track task execution by tracking the dispatchMessagemethod of Handler.
4) ThreadPoolExecutor: ThreadPoolExecutor is apool-based execution mechanism. The class has an elegant pattern.
CHAPTER 3. ANDROID PERFORMANCE DIAGNOSIS 52
A task is always requested via invoking the execute method.Moreover, the task always starts immediately after the beforeEx-ecute method, and is followed by the afterExecute method.Hence, we track tasks via these methods.
5) AsyncTask: A task can base its implementation on thecomplicated Java class inheritance of the basis AsyncTask class.It turns out that no matter how many layers of class inheritanceare applied, a task is always scheduled by the execute methodor the executeOnExecutor method eventually. Hence, wecan record the task scheduling time by monitoring the invocationtime of the two methods. We find in the Android frameworksource codes that for both cases, AsyncTask actually relies on theThreadPoolExecutor. Hence, we can utilize the similar wayas that for ThreadPoolExecutor to track task execution.
For the tasks in categories 2-5, they are put into a queue be-fore they are executed. To model task runtime dependency forthese cases, we use the hash code of the execution unit (e.g.,ThreadPoolExecutor object) as the queue identifier. Sucha hash code is easy to obtain during runtime according to Javaspecifics. Two tasks with the same queue identifier suggest that theymay bear runtime dependency. Finally, the pool capacity could beobtained via checking some internal field of the queue object (e.g.,the maximumPoolSize field of a ThreadPoolExecutor object).Details are omitted here, but can be found in our source codes [69].
The concrete methods for hooking may vary among differentAndroid framework versions. We have remarked the lines of Diag-Droid source codes that need to be modified if the implementationof the framework changed. Thereafter, validating DiagDroid fornew Android versions is acceptable since currently Google usuallyreleases one new version per year from 2013.
CHAPTER 3. ANDROID PERFORMANCE DIAGNOSIS 53
3.6 Experimental Study
We have implemented DiagDroid and released the project to-gether with a tutorial open-source online [69]. In our experimentalstudy, we target on open-source apps since we need to inspect thesource codes to verify the effectiveness of DiagDroid. To thisend, we download such apps from F-Droid, the largest app marketthat hosts only free and open-source Android apps [74]. It is also apopular app source for the research community [132]. We employMonkey [179] to exercise our target apps. It is an official randomtesting tool delivered by Google and also known as the most efficienttool in terms of code coverage by empirical study [60]. Among theapps we download, we exclude those that require a login account forconvenience consideration (so that we do not have to perform userregistrations). Note that DiagDroid can easily handle such appsas well, by applying a login script when the apps start. The processis trivial and will not affect the effectiveness of DiagDroid.We thus get 33 target apps covering diverse categories includingReading, Multimedia, Science & Education, Navigation, Securityand Internet.
We verify the compatibility of DiagDroid on four smartphonemodels covering a wide range of device capacities: Samsung GT-I9105P (Android 4.1.2), Huawei G610-T11 (Android 4.2.2), Hua-wei U9508 (Android 4.2.2), and Lenovo K50-T5 (Android 5.1).Experiments are conducted on the four devices simultaneously tosave time. We also conduct stress tests by injecting loads onCPU, memory, sdcard IO and network respectively with customizedAndroid background services. We implement five backgroundservices occupying 80% CPU, five background services occupying80% memory, five background services consuming 2 Internet down-loading threads each, two background services each reading 1 fileand writing 1 file on sdcard in separate threads. The parameters arechosen by common practice. Developers could configure with their

CHAPTER 3. ANDROID PERFORMANCE DIAGNOSIS 54
own preferences. We design a system app to guarantee that theseservices would run persistantly (i.e., they will not be terminatedby LowMemoryKiller [128]). Four devices with five configurationseach (four with load injections and one without load injection) comeup to 20 test configurations, each configuration is under Monkeytesting for 30 minutes. We run 19,800-minute test in total forthe 33 apps. DiagDroid reports overall 48 performance issuesmarked as highly suspicious for 14 apps, on average 3.4 issues foreach. The reports are also issued on our website. Via inspectingthe related source codes in the reports for several minutes per caseand understanding of the original project, we surprisingly find 14 ofthe target apps contain 27 performance issues. The bug cases areranked high in the report, (with an average rank of 1.7). Althoughunfamiliar with the target app design, we find it very convenient forus to pinpoint the root causes of the issues.
We categorize the 27 detected issues into 5 categories. Tenrepresentative issues are presented in Table 3.3, together with theircauses, the locations of their defects and their rankings in the reports.Detailed descriptions of all issues can be found in our website [69].We have reported the issues to the app developers, many of whichhave been confirmed and corrected accordingly. We have gotpositive feedbacks like “for faster search results :)”, “I’ve modifiedand I see the performance improvements.” after the developers fixthe performance problems. Next, we will elaborate our experiencesin applying DiagDroid to the performance diagnosis via fiverepresentative cases.
3.6.1 Case studies
Case 1: Unintended Sequential Executions
We provide our experiences on applying DiagDroid to diagnoseOpenLaw (https://openlaw.jdsoft.de/), an app underScience & Education category providing access to over 6,000 laws

CHAPTER 3. ANDROID PERFORMANCE DIAGNOSIS 55
Table 3.3: Representative performance issues found (Rank: ranking of the buggyissue / total number of issues reported)
Category Issue description Class@App Rank
Not awaring AsyncTask.execute() methodresults in undesired seqential execution
LawListFragment@OpenLaw 1/4
Loading tens of icons in sequence AppListArrayAdapter@AFWall+ 1/3
Improper cancelation of asynchronous tasks GetRouteFareTask@BartRunnerAndroid 1/4
Not canceling obsolete queries when newquery arrives
AsyncQueryTripsTask@Liberario 2/2
Failed to set optimal size of the thread pool ZLAndroidImageLoader@FBReader 1/2
Use the same pool for loading app list andapp icons
MainActivty@AFWall+ 2/3
Posting various types of tasks (e.g., updateprogress, store book) to the samebackgroundHandler
ReadingFragment@PageTurner 3/9
Executing Filter method of AutoComplete-TextView occupies the Handler of a publicmessage queue
LocationAdapter@Liberario 1/2
Not canceling the tasks implemented bythird-party library, Android asynchronoushttp client - loopj
HeadlineComposerAdapter@OpenLaw 4/4
Use the deprecated findall method ofWebView class which causes blocking
MainActivity@Lucid Browser 1/5
Misusingthird-partylibrary
Sequentialexecution
Forgettingcancelingexecution
Improperthreadpool
Overloadingmessagequeue
and regulations. DiagDroid reports 3 highly suspicious perfor-mance issues. It took us about half an hour to inspect the relatedsource codes according to the report, and we can summarize 2performance issues and localize the causes. One case is that thetask group with context c1 is anomalous. It contains the tasks withqueuing time longer than the threshold 500ms. This case is foundin 14 test configurations, mostly under those with heavy CPU orsdcard IO load, which indicates the case may be related to some IOintensive operations. We demonstrate the content of DiagDroidreport in Figure 3.7 (The line numbers are added for discussionconvenience).
We can instantly find that such a long queuing time is becausethe corresponding anomalous task should wait in queue till thecompletion of other tasks with long execution time based on Lines

CHAPTER 3. ANDROID PERFORMANCE DIAGNOSIS 56
1. asynchronous tasks with context c1 2. max queuing time: 1650ms 3. pool capacity: 1 4. cases with queuing time ≥ 500ms: 5. avg. queue length: 1.00 6. avg. execution time of the in‐queue tasks: 1666.00ms 7. runtime dependency: c2
Context c1 Class name: de.jdsoft.law.data.LawSectionList
Call‐stack: android.os.AsyncTask.executeOnExecutor (Native Method)
android.os.AsyncTask.execute (AsyncTask.java:535)
de.jdsoft.law.LawListFragment.onCreate (LawListFragment.java:87)
… Context c2 Class name: de.jdsoft.law.data. UpdateLawList
Call‐stack: android.os.AsyncTask.executeOnExecutor (Native Method)
android.os.AsyncTask.execute (AsyncTask.java:535)
de.jdsoft.law.LawListFragment.onCreate (LawListFragment.java:91)
…
public void onCreate(Bundle savedInstanceState) {
// Load actual list
final LawSectionList sectionDB = new LawSectionList(LawSectionList.TYPE_ALL);
sectionDB.execute(adapter);
// And parallel update the list from network
UpdateLawList updater = new UpdateLawList();
updater.execute(adapter);
}
…
…
…
1. asynchronous tasks with context c1 2. max queuing time: 1650ms 3. pool capacity: 1 4. cases with queuing time ≥ 500ms: 5. avg. queue length: 1.00 6. avg. execution time of the in‐queue tasks: 1666.00ms 7. runtime dependency: c2
Context c1 Class name: de.jdsoft.law.data. UpdateLawList
Call‐stack: android.os.AsyncTask.executeOnExecutor (Native Method)
android.os.AsyncTask.execute (AsyncTask.java:535)
de.jdsoft.law.LawListFragment.onCreate (LawListFragment.java:91)
… Context c2 Class name: de.jdsoft.law.data.LawSectionList
Call‐stack: android.os.AsyncTask.executeOnExecutor (Native Method)
android.os.AsyncTask.execute (AsyncTask.java:535)
de.jdsoft.law.LawListFragment.onCreate (LawListFragment.java:87)
…
public void onCreate(Bundle savedInstanceState) {
// Load actual list
final LawSectionList sectionDB = new LawSectionList(LawSectionList.TYPE_ALL);
sectionDB.execute(adapter);
// And parallel update the list from network
UpdateLawList updater = new UpdateLawList();
updater.execute(adapter);
}
…
…
…
Report
1. asynchronous tasks with context c1 2. max queuing time: 1650ms 3. pool capacity: 1 4. cases with queuing time < 500ms: 5. avg. queue length: 0.00 6. avg. execution time of the in‐queue tasks: 0.00ms 7. cases with queuing time ≥ 500ms: 8. avg. queue length: 1.00 9. avg. execution time of the in‐queue tasks: 1666.00ms 10. runtime execution dependency: c2
Context c1 Class name: de.jdsoft.law.data.LawSectionList
Call‐stack: android.os.AsyncTask.executeOnExecutor (Native Method)
android.os.AsyncTask.execute (AsyncTask.java:535)
de.jdsoft.law.LawListFragment.onCreate (LawListFragment.java:87)
… Context c2 Class name: de.jdsoft.law.data. UpdateLawList
Call‐stack: android.os.AsyncTask.executeOnExecutor (Native Method)
android.os.AsyncTask.execute (AsyncTask.java:535)
de.jdsoft.law.LawListFragment.onCreate (LawListFragment.java:91)
…
public void onCreate(Bundle savedInstanceState) {
// Load actual list
final LawSectionList sectionDB = new LawSectionList(LawSectionList.TYPE_ALL);
sectionDB.execute(adapter);
// And parallel update the list from network
UpdateLawList updater = new UpdateLawList();
updater.execute(adapter);
}
…
…
…
Codes
Figure 3.7: Report and code segments of case 1
4-7. We know on average one task (Line 5) bears runtime executiondependency with an anomalous task, of which the context is c2(Line 7). In other words, the anomalous c1 tasks are due to theheavy-weighted c2 tasks. The pool capacity is only 1 (Line 3),which indicates the tasks have to run in sequence. Waiting forthe completion of another heavy-weighted task should generally beavoided via proper scheduling. We can then focus on its cause.
The c1 and c2 contexts are included in the report, as shown inFigure 3.7. We can conveniently find the source codes of the two
CHAPTER 3. ANDROID PERFORMANCE DIAGNOSIS 57
tasks and where they are scheduled. Also shown in the figure, thetwo tasks are scheduled via execute methods. The developerhas commented “parallel update”, which shows the intention isto execute the two tasks in parallel. But this is a well-knownmistake [36], since calling execute will actually call the samemethod of the super class AsyncTask, which will insert the tasksinto a global thread pool with capacity one. Hence, we can instantlynotice such a defect via inspecting the short code segment. The fixis to call executeOnExecutor instead with a larger pool.
Note that such bugs are quite common in Android apps. Shown asanother issue in Table 3.3, developers of popular Android Firewallapp (AFWall+) are also unaware of their inefficient sequentialloading of icons until we report it to them. Developers are generallynot aware of how their customized tasks are scheduled during appruntime, and they wrongly assume that the execution unit is freewhen scheduling a task. Sometimes, such sequential tasks may bedefined and scheduled in different source files, making it harder tocapture their execution dependency manually.
In the example, OpenLaw requires to handle tens of UI events.It is hence difficult, if not infeasible, to manually test and detectperformance issues in tens of UI event procedures. Even if thedeveloper is aware of which UI event procedure (loading LawLis-tActivity in this case) is laggy, it is still hard for her to locate thedefect by inspecting nearly 300 hundred lines of codes distributedin several files, which even involves complicated third-party libraryinvocation.
Existing tools (e.g., Method Tracing [153], Panappticon [196])however focus essentially on the execution time of methods. Theygenerally lack the capability to model the queuing time of tasksand to identify the execution dependency. It is therefore difficultfor the developers to detect the subtle symptoms and reason thedefect caused by task execution dependency, especially when twodependent tasks are executed in different places. Take the sequential

CHAPTER 3. ANDROID PERFORMANCE DIAGNOSIS 58
1. asynchronous tasks with context c1: 2. max queuing time: 31885ms 3. pool capacity: 1 4. cases of queuing time ≥ 500ms: 5. avg. queue length: 19.50 6. avg. execution time of the in‐queue tasks: 1240.60ms 7. runtime dependency: c1, c2 8. execution time of c1 max: 19337.00ms avg. 1419.95ms 9. execution time of c2 max: 3446.00ms avg. 786.69ms
protected String doInBackground(Params... paramsArray) {
Params params = paramsArray[0];
if (!isCancelled()) {
return getFareFromNetwork(params, 0);
} else {
return null;
}
}
Report
1. asynchronous tasks with context c1: 2. max queuing time: 31885ms 3. pool capacity: 1 4. cases of queuing time ≥ 500ms: 5. avg. queue length: 19.50 6. avg. execution time of the in‐queue tasks: 1240.60ms 7. runtime dependency: c1, c2
protected String doInBackground(Params... paramsArray) {
Params params = paramsArray[0];
if (!isCancelled()) {
return getFareFromNetwork(params, 0);
} else {
return null;
}
}
Codes
Figure 3.8: Report and code segments of case 2
execution issue in Osmand (reported in [69]) as an example. Thebuggy class has over 500 lines of codes (LoC), and there are over300 LoC between two sequentially-scheduled tasks. Moreover, itis worth noting that the method tracing-based tools will generatea trace of thousands of methods for a UI event procedure. Theperformance diagnosis based on such tracing data is like finding aneedle in the hay stack, given the fact that GigaBytes of data will beproduced with Method Tracing for a simple 30-minutes testing run.
In contrast, DiagDroid properly models the task executiondependency, and provides tidy but helpful information to guide thediagnosis process. We show that it can greatly reduce the humanefforts by directing the developer to several lines of codes that causethe performance issue.
CHAPTER 3. ANDROID PERFORMANCE DIAGNOSIS 59
Case 2: Not Canceling Obsolete Tasks
The cancelation of a time-consuming task is necessary when thetask is no longer required. For example, consider an app allowingactivity-switching with a sliding operation, which is commonly usedin facilitating to quickly locate the activity of interest. Supposethe current activity shows the Internet content being downloadedby a task. When a user performs activity-switching, the Internetcontent is not necessary since its associated activity is invisible. Thedownloading task becomes obsolete. Obsolete tasks may occupyresources (e.g., the Internet bandwidth), and therefore deterioratethe UI performance. Sometimes, they may even block other tasks.For example, they can occupy the thread pool and cause other tasksto wait. However, canceling obsolete tasks is not obligatory andhence it is often neglected by developers. Our experiment revealsthat many popular Android apps contain performance issues causedby not canceling obsolete tasks.
We take BartRunnerAndroid, a public transport app, asan example. DiagDroid finds 5 highly suspicious performanceissues. We can then conveniently locate 5 bugs in the source codeswith the report. Specifically, we detect the anomalous c1 tasks underall 20 test configurations. The corresponding content of the report isdemonstrated in Figure 3.8. Similar to Case 1, we can instantly findthat the long queuing time is caused by waiting for various tasks thatbear execution dependency with the anomalous tasks (Lines 4 to 7).
It seems that we can apply a fix like that in Case 1 to this issue,i.e., by allowing each type of tasks to run in its own execution unit.However, we are aware both tasks could be executed for a longperiod (Lines 8-9). DiagDroid tells us the information that manyof these two long term tasks block the others. By inspecting thecodes of the c1 and c2 tasks, we find the developers have alreadyintended to cancel the obsolete tasks. Taken the c1 task as example,it is actually inherits from GetRouteFareTask. Its source code

CHAPTER 3. ANDROID PERFORMANCE DIAGNOSIS 60
1. asynchronous tasks with context c1: 2. max queuing time: 514ms 3. pool capacity: 3 4. cases of queuing time ≥ 500ms: 5. avg. queue length: 1.50 6. avg. execution time of the in‐queue tasks: 659.29ms 7. runtime dependency: c1
private static final int IMAGE_LOADING_THREADS_NUMBER = 3;//TODO: how many threads?
private final ExecutorService myPool = Executors.newFixedThreadPool(
IMAGE_LOADING_THREADS_NUMBER, new MinPriorityThreadFactory());
void startImageLoading( ){
final ExecutorService pool =
image.sourceType() == ZLImageProxy.SourceType.FILE ? mySinglePool : myPool;
pool.execute( );
}
…
…
…
Report
1. asynchronous tasks with context c1: 2. max queuing time: 514ms 3. pool capacity: 3 4. cases of queuing time < 500ms: 5. avg. queue length: 0 6. avg. execution time of the in‐queue tasks: 0.00ms 7. cases of queuing time ≥ 500ms: 8. avg. queue length: 1.50 9. avg. execution time of the in‐queue tasks: 659.29ms 10. runtime execution dependency: c1
private static final int IMAGE_LOADING_THREADS_NUMBER = 3;//TODO: how many threads?
private final ExecutorService myPool = Executors.newFixedThreadPool(
IMAGE_LOADING_THREADS_NUMBER, new MinPriorityThreadFactory());
void startImageLoading( ){
final ExecutorService pool =
image.sourceType() == ZLImageProxy.SourceType.FILE ? mySinglePool : myPool;
pool.execute( );
}
…
…
…
Codes
Figure 3.9: Report and code segments of case 3
for execution is illustrated in Figure 3.8. The cancelation checkingis done before the time-consuming networking task begins whichmeans it will not be canceled during its execution even when it isobsolete. Similar analysis could be applied on c2. In other words,the developers fail to conduct proper cancelation steps for these tasksvia cancelation checking.
Note that the correct way of cancelation involves two steps: 1)call cancel method of the AsyncTasks in the onStop methodof the container Activity, and 2) periodically check the resultof isCancelled function in doInBackground and release theresource when it returns true. Note that releasing the resource inAsyncTask.onCancel is also a common mistake that should beavoided.
Case 3: Improper Thread Pool Size
Improper thread pool size is a typical cause of poor performance.It may cause long queuing time of tasks since the pool is oftenbusy. We will show how DiagDroid handles such defects via our

CHAPTER 3. ANDROID PERFORMANCE DIAGNOSIS 61
experiences on diagnosing FBReader (https://fbreader.org/), a popular e-book reader.
DiagDroid reports only one performance issue for this appas shown in Figure 3.9. We detect this case under all 20 testconfigurations. We then inspect this performance issue in the sourcecodes and we find the bug in 20 minutes. Both the execution timeand the queuing time of the c1 tasks are anomalous. According to thecontext of c1, we can quickly locate the source codes and confirmthat the execution time is reasonable since the tasks load images.However, the reason for the long queuing time is that a c1 task hasto wait for other c1 tasks to complete (Lines 4-7). Unlike those inCase 2, c1 tasks however cannot be canceled since they should runin parallel to load many images simultaneously. Hence, a quick fixfor this defect is to set a larger pool size (DiagDroid confirms that5 is a good choice).
Properly setting a pool size is often not easy for a developerduring the coding phase. It is difficult for her to predict the possiblenumber of concurrent tasks in the same pool. For example, in thiscase study, the developer is not sure about the proper setting of thepool size, and hence put down a to-do comment in the source codes(see Figure 3.9). We find four such cases in our experimental study.
Finally, note that the existing approaches [153, 196] cannot iden-tify the performance issues caused by the defects in Cases 2 and 3,since these approaches focus only on the execution time. Even if thedeveloper is aware of the bug symptoms, the existing approaches donot provide a way to automatically analyze the runtime dependencyof the tasks. As a result, it requires daunting manual efforts to findthat a task sometimes has to wait for other tasks by the inspection oftremendous runtime traces.
Case 4: Overloading Message Queue
Similar to the thread pool, message handler is also a queue-basedexecution unit. But a handler has only one thread to process

CHAPTER 3. ANDROID PERFORMANCE DIAGNOSIS 62
1. asynchronous tasks with context c1: 2. max queuing time: 6138ms 3. pool capacity: 1 4. cases of queuing time ≥ 500ms: 5. avg. queue length: 1.38 6. avg. execution time of the in‐queue tasks: 3274.31ms 7. runtime dependency: c1
// This method could be optimized a lot, but hey processors are fast nowadays
protected FilterResults performFiltering( ) {
resultList = autocomplete.execute().get().getLocations();
}
…
…
…
Report
1. asynchronous tasks with context c1: 2. max queuing time: 6138ms 3. min queuing time: 3ms 4. max execute time: 7262ms 5. min execute time: 1286ms 6. pool capacity: 1 7. cases of queuing time < 500ms: 8. avg. queue length: 0.08 9. avg. execution time of the in‐queue tasks: 473.14ms 10. cases of queuing time ≥ 500ms: 11. avg. queue length: 1.38 12. avg. execution time of the in‐queue tasks: 3274.31ms 13. runtime execution dependency: c1
// This method could be optimized a lot, but hey processors are fast nowadays
protected FilterResults performFiltering( ) {
resultList = autocomplete.execute().get().getLocations();
}
…
…
…
Codes
Figure 3.10: Report and code segments of case 4
incoming messages which makes it vulnerable to performance bugs.Messages could come from separate UI operations (i.e., continuoustext inputs). If messages come too quickly, a message may wait forthe handler to be available as the handler may be busy processing theprevious messages. This type of issues can also be easily pinpointedwith DiagDroid. We find two such cases in our experimentalstudy. Next we discuss the Liberario (a public transport app)case. DiagDroid reports two highly suspicious performanceissues, from which we find two code defects in less than an hour.We report the cases and the developers have confirmed them andmodified the apps accordingly.
Figure 3.10 demonstrates part of the report. We can see thatthe c1 tasks are with anomalous queuing time and execution time.This problem is detected under all 20 test configurations. The causeof the long queuing time is that a c1 task has to wait for other c1tasks to complete (Lines 4-7). The long execution time indicatesthat a c1 task may long occupy the corresponding handler. Viainspecting the source codes of c1, we can easily find the cause.The c1 task is a Handler for filtering input text, which invokesperformFiltering directly. The method requests a list of

CHAPTER 3. ANDROID PERFORMANCE DIAGNOSIS 63
1. asynchronous tasks with context c1: 2. max queuing time: 664ms 3. pool capacity: 1 4. cases of queuing time ≥ 500ms: 5. avg. queue length: 3.00 6. avg. execution time of the in‐queue tasks: 323.00ms 7. runtime dependency: c1
public void onTextChanged( ) {
WV.findAll(s.toString());
}
…
Report
1. asynchronous tasks with context c1: 2. max queuing time: 664ms 3. pool capacity: 1 4. cases of queuing time < 500ms: 5. avg. queue length: 1.04 6. avg. execution time of the in‐queue tasks: 303.38ms 7. cases of queuing time ≥ 500ms: 8. avg. queue length: 3.00 9. avg. execution time of the in‐queue tasks: 323.00ms 10. runtime execution dependency: c1
public void onTextChanged( ) {
WV.findAll(s.toString());
}
…
Codes
Figure 3.11: Report and code segments of case 5
suggested locations with an incomplete location. It involves a time-consuming Internet query. Consequently, the upcoming messageswill have to wait in the message queue. Actually this is not neededsince the old query is no longer useful, and hence should be canceledso that the handler can process new messages.
This case is very difficult to be identified. The developers,after we report the case to them, update 11 files to fix the issue.If using existing approach [153], we can possibly know that theexecution time is long. However, we may accept the fact thatInternet query is time-consuming. Moreover, Panappticon [196], asan event tracing system to identify critical execution paths in usertransactions, is not aware of the dependency between tasks invokedin different UI operations. For example, in this case, tasks bearingexecution dependency are invoked by independent text inputs in theAutoCompleteTextView. It is generally hard to know howa long execution time may influence other tasks, without a toollike DiagDroid to properly model the runtime dependency of theconcurrent tasks.
Case 5: Misusing Third-party Library
Misusing third-party libraries is also a source of performance issues.Developers usually call a third-party library without knowing its

CHAPTER 3. ANDROID PERFORMANCE DIAGNOSIS 64
implementation details. Misunderstanding the usage of the librarymay introduce performance issues. For example, unaware of theasynchronous tasks in a third-party library, the developer will ne-glect to cancel them when they are obsolete. DiagDroid can alsoreduce the efforts in troubleshooting such defects as well. We detectthree such cases. We present how DiagDroid find such a defectin Lucid Browser, a web browser app. We infer this issue fromthe 3 suspicious issues reported by DiagDroid .
The report is presented in Figure 3.11. We can know this is asimilar defect like that in Case 1 based on Lines 3-7. It involvesunintended sequential executions. Checking source codes relatedto c1, we can locate the invocation of the findAll method inthe third-party library WebView. It finds the occurrences of aspecific text in a webpage when the text is modified. RevisitingfindAll, we can find that it is deprecated, and should be replacedby findAllAsync.
Note that the case is only detected on 3 devices other than LenovoK50-T5 (Android 5.1). findAll method does not introduceperformance issues in Android versions above 4.4, as the Webkit-based WebView is replaced by the Chromium-based WebViewin recent Android versions. Existing tools like Panappticon [196]which require to recompile the kernel, can work only on a small setof devices. It is hard for such tools to cope with such defects that donot persist in all Android versions [46].
3.6.2 Why Clustering
As mentioned in Section 3.4.2, to reduce the number of reportingsuspicious cases, we cluster the execution contexts (i.e., call-stacks)belonging to the same asynchronous task triggering by similarrunning sequences. First we extract two features via scanningthrough massive contexts: 1) similar call-stacks are similar in linelevel, and 2) similarity of call-stacks is transitive. Then we perform
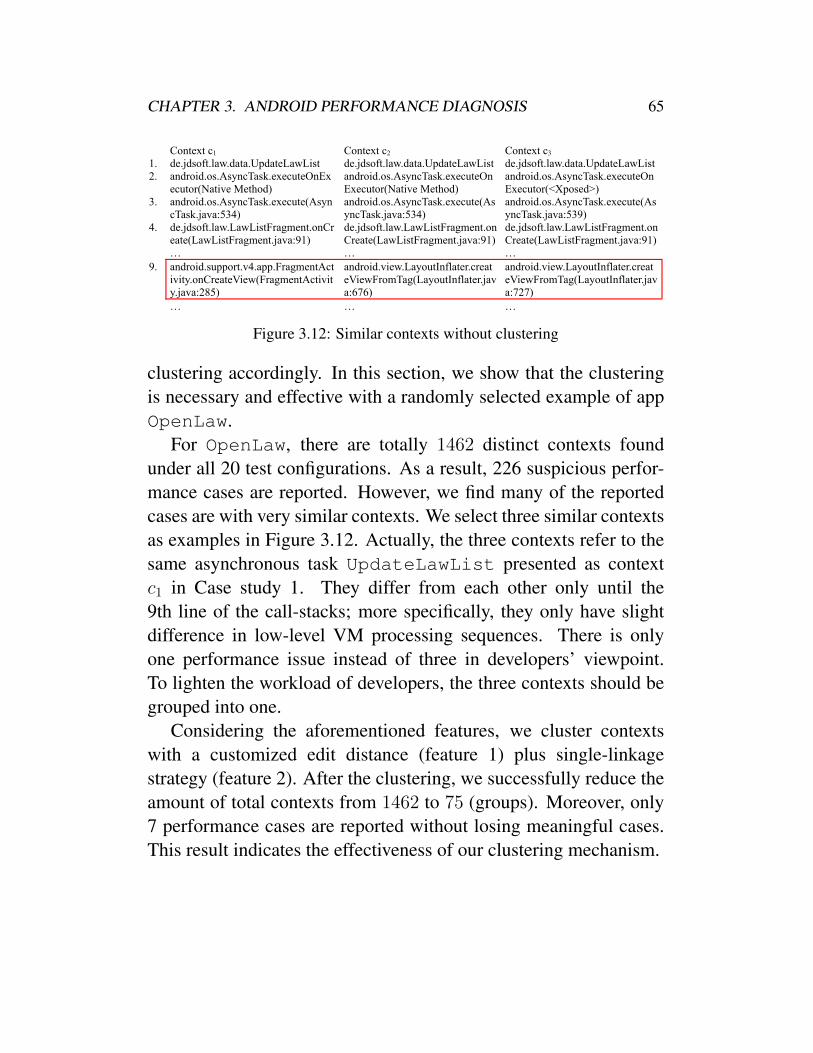
CHAPTER 3. ANDROID PERFORMANCE DIAGNOSIS 65
Context c1 Context c2 Context c3
1. de.jdsoft.law.data.UpdateLawList de.jdsoft.law.data.UpdateLawList de.jdsoft.law.data.UpdateLawList 2. android.os.AsyncTask.executeOnEx
ecutor(Native Method) android.os.AsyncTask.executeOnExecutor(Native Method)
android.os.AsyncTask.executeOnExecutor(<Xposed>)
3. android.os.AsyncTask.execute(AsyncTask.java:534)
android.os.AsyncTask.execute(AsyncTask.java:534)
android.os.AsyncTask.execute(AsyncTask.java:539)
4. de.jdsoft.law.LawListFragment.onCreate(LawListFragment.java:91)
de.jdsoft.law.LawListFragment.onCreate(LawListFragment.java:91)
de.jdsoft.law.LawListFragment.onCreate(LawListFragment.java:91)
… … … 9. android.support.v4.app.FragmentAct
ivity.onCreateView(FragmentActivity.java:285)
android.view.LayoutInflater.createViewFromTag(LayoutInflater.java:676)
android.view.LayoutInflater.createViewFromTag(LayoutInflater.java:727)
… … …
Figure 3.12: Similar contexts without clustering
clustering accordingly. In this section, we show that the clusteringis necessary and effective with a randomly selected example of appOpenLaw.
For OpenLaw, there are totally 1462 distinct contexts foundunder all 20 test configurations. As a result, 226 suspicious perfor-mance cases are reported. However, we find many of the reportedcases are with very similar contexts. We select three similar contextsas examples in Figure 3.12. Actually, the three contexts refer to thesame asynchronous task UpdateLawList presented as contextc1 in Case study 1. They differ from each other only until the9th line of the call-stacks; more specifically, they only have slightdifference in low-level VM processing sequences. There is onlyone performance issue instead of three in developers’ viewpoint.To lighten the workload of developers, the three contexts should begrouped into one.
Considering the aforementioned features, we cluster contextswith a customized edit distance (feature 1) plus single-linkagestrategy (feature 2). After the clustering, we successfully reduce theamount of total contexts from 1462 to 75 (groups). Moreover, only7 performance cases are reported without losing meaningful cases.This result indicates the effectiveness of our clustering mechanism.
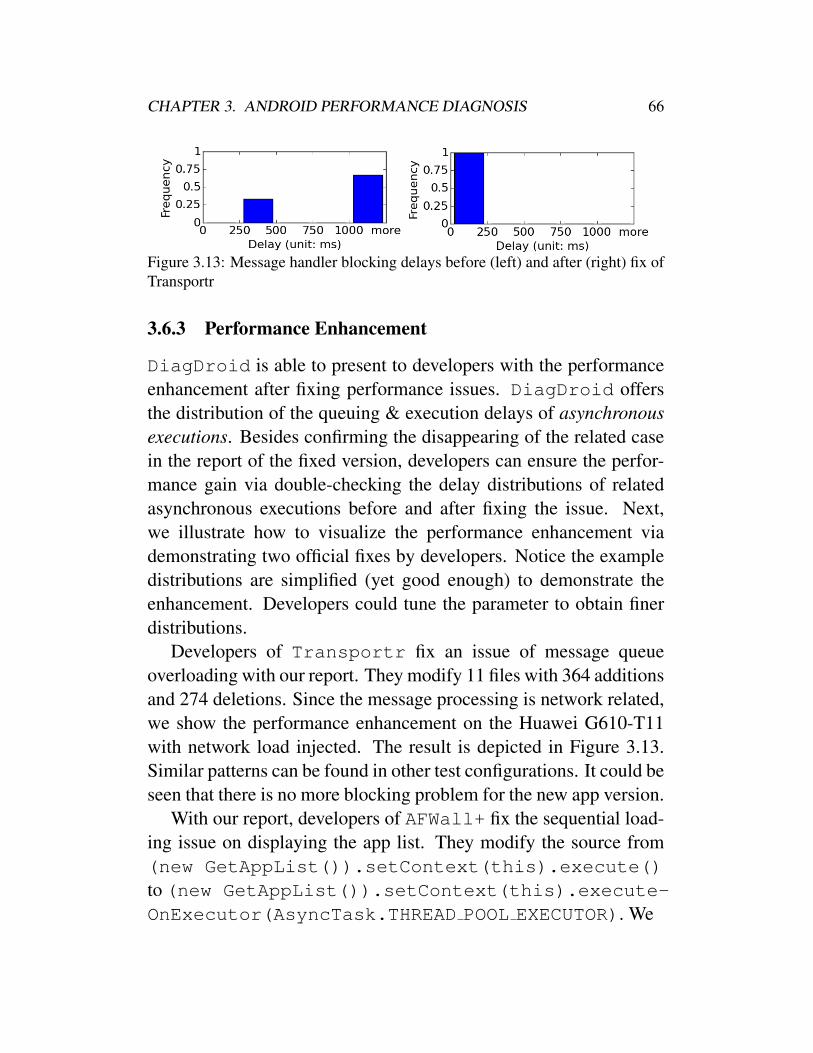
CHAPTER 3. ANDROID PERFORMANCE DIAGNOSIS 66
Figure 3.13: Message handler blocking delays before (left) and after (right) fix ofTransportr
3.6.3 Performance Enhancement
DiagDroid is able to present to developers with the performanceenhancement after fixing performance issues. DiagDroid offersthe distribution of the queuing & execution delays of asynchronousexecutions. Besides confirming the disappearing of the related casein the report of the fixed version, developers can ensure the perfor-mance gain via double-checking the delay distributions of relatedasynchronous executions before and after fixing the issue. Next,we illustrate how to visualize the performance enhancement viademonstrating two official fixes by developers. Notice the exampledistributions are simplified (yet good enough) to demonstrate theenhancement. Developers could tune the parameter to obtain finerdistributions.
Developers of Transportr fix an issue of message queueoverloading with our report. They modify 11 files with 364 additionsand 274 deletions. Since the message processing is network related,we show the performance enhancement on the Huawei G610-T11with network load injected. The result is depicted in Figure 3.13.Similar patterns can be found in other test configurations. It could beseen that there is no more blocking problem for the new app version.
With our report, developers of AFWall+ fix the sequential load-ing issue on displaying the app list. They modify the source from(new GetAppList()).setContext(this).execute()to (new GetAppList()).setContext(this).execute-OnExecutor(AsyncTask.THREAD POOL EXECUTOR). We

CHAPTER 3. ANDROID PERFORMANCE DIAGNOSIS 67
Figure 3.14: Queuing delay of showing apps before (left) and after (right) fix ofAFWall+
notice that the queuing effect is more obvious with CPU load inject-ed on a poorer device. We illustrate in Figure 3.14 the distributionof queuing delay of the AsyncTask with testing configuration ofSamsung GT-I9105P with CPU load injected. Similar patterns canbe found in other test configurations. It could be seen that there isno more queuing problem in the new app version.
3.6.4 Discussions of Experiment
Next, we discuss the threats to the validity of our experiments, andthe measures we take to address them. First is the overhead ofDiagDroid, which directly reflects how it affects the test effi-ciency. We conduct 10, 000 Monkey operations with DiagDroidon and off. The interval between two consecutive operations is200ms. We employ the Android time command to obtain theCPU time for both cases. Their difference is then the overhead ofDiagDroid, which is 0.8%. This shows that DiagDroid doesnot have a considerable impact on testing efficiency. Moreover, weuse the maximum latency among all test runs of one type of task asindicator of problematic tasks, commonly the value would be muchlarger than the threshold (i.e., 500ms). Therefore, the overhead ofDiagDroid seldom makes a task to become problematic.
We choose Monkey as our test executor for its efficiency [60].However, DiagDroid does not rely solely on Monkey as itstest executor. Test executor is a plug-in in DiagDroid. It alsoallows to incorporate other automate script-based testing tools like
CHAPTER 3. ANDROID PERFORMANCE DIAGNOSIS 68
UIAutomator [177] and Monkey runner [138].We test 30 minutes for each of 20 configurations per app to
show the capability of DiagDroid in such a short-term test. Thesettings can be changed according to the app specifics to explore theapp more thoroughly. We show the capability of DiagDroid ineven such a short-term test. Note that DiagDroid also carefullyaddresses its compatibility issues. Our tool requires no changesto the target app, or recompiling the underlying OS and Androidframework. It is proven to be compatible over various device modelsand Android versions. Parallel testing in multiple mobile deviceswith diverse models is feasible.
We have detected 27 real world performance issues among 48reported cases. The remaining 21 issues are mainly reasonabletime-consuming tasks (e.g., download tasks). We have provideddevelopers a way to filter out such tasks by name while to be geneticfor all apps we do not use such filter in our experiment.
Finally, DiagDroid resorts to dynamic analysis to diagnoseperformance issues. We focus on the performance issues causedby complicated runtime dependency of asynchronous executions. Itis hard, if not infeasible, for the static analysis approaches to dealwith such types of issues. For example, determining the proper poolsize based only on the source codes is hard, since it is impossibleto predict the possible number of concurrent tasks. Also, it isdifficult to determine when to cancel a task beforehand based onlyon the source codes. Human efforts are inevitable. The aim ofDiagDroid is to reduce such efforts, rather than approaching thetask of automatic code correction. As shown in our case studies,such efforts are light. DiagDroid is able to provide a small setof possible performance issues. The issues that really contain bugsare with high rankings. As shown in Table 3.3, the buggy casesrank 1.7 averagely. This indicates that we can easily be directed towhere the code defect lines. The debugging time of each case isgenerally less than an hour, even for us who are familiar with the
CHAPTER 3. ANDROID PERFORMANCE DIAGNOSIS 69
app implementations.
3.7 Tool Insights and Discussions
3.7.1 Tips for Developers
We have learned many kinds of bugs from the experiment. Sometips for developers could be concluded from these bugs.
Use a Private Pool Instead of the Public One When Necessary
It is necessary to define your own thread pool instead of using a pub-lic pool like AsyncTask.THREAD POOL EXECUTOR in somecases. The thread pool is used either for directly executing tasks onor being called by executeOnExecutor of AsyncTask. Cur-rent implementation of AsyncTask.THREAD POOL EXECUTORhas the thread pool size under 10 in usual situations. Thereforeif too many AsyncTasks are put into the pool, it is easy to beused up. We suggest defining your own thread pool especially forthe case that the asynchronous execution takes a long time or theasynchronous execution will not update UI after finishes. In theformer case asynchronous execution would occupy a thread in thepool for a long time. In the latter case, the asynchronous executionis not necessary to be implemented as AsyncTask.
Set Reasonable Pool Size
When using pool-based asynchronous execution, the developersshould carefully set the pool size. A small pool may increase thechance for an asynchronous execution to wait in the queue. On theother hand a large pool may waste system resource if starving fromworks. A practical choice is that the developers could just try to setthe pool size several times and run our tool. After getting the reports

CHAPTER 3. ANDROID PERFORMANCE DIAGNOSIS 70
for every run, a best choice among the previous settings could befound.
Use Third-party Library Carefully
The developers should inspect the specification of third-party li-braries carefully when utilizing them especially when there arepotential asynchronous executions. It is convenient to use third-party library. However, the developers are not generally aware of theimplementation details of the library. The library may provide mul-tiple implementations for an operation to suit different requirementsand situations. The implementations are separated by parameterspassed when calling the function. The default setting of parametersmight be only a moderate setting that meets most requirement. Ifthe developers did not read the specification carefully, they may setproblematic parameters that do not fit into their requirement. Inwhich case, there would be potential performance bugs.
Keep Effective Response
Most developers know they should keep the screen response whenan asynchronous execution is performed. But they may sometimesforget to make an effective response. In some cases, the developerssimply display a progress bar/circle in the entire screen to show theexecution is in progress. The user may get annoyed if a progress bardisplays for long. It could get even worse when the back button isdisabled and the user could do nothing but wait for the execution.It is acceptable that some operations could be delayed until anasynchronous execution is finished. Nevertheless, at the same timethe app should keep response to user interacts and better displaysome meaningful pages.

CHAPTER 3. ANDROID PERFORMANCE DIAGNOSIS 71
Cancel When No Longer Needed
The developers often do not take care of cancelling the asynchronousexecutions when they are no longer needed. For example, an asyn-chronous task which loads figures in an activity should be cancelledafter the activity is hidden or destroyed. Another example is whendownloading a list of figures that would be displayed on the screen,the figures swiped out should be cancelled from downloading. Allasynchronous execution requires resources including thread of pool-based executions, system resource like CPU, network and diskI/O, etc. If long term asynchronous executions are not cancelledproperly, thread pool may become exhausted or system resourcesmay become shorted (e.g., network becomes slow).
Use Proper Type of Asynchronous Execution
There are different types of asynchronous executions, the inexpe-rienced developers may not know which one is better to suit theirrequirement. For example, AsyncTask is a class simplifyinggeneric asynchronous execution. Asynchronizer [123] would refac-tor long concurrent works into AsyncTasks. However, it is nota panacea. Officially it is suggested that an asynctask should beused for short operations (a few seconds at the most) [41]. For longterm operations, it is common to introduce bugs in the design ofAsyncTask. For example, in the codes shown in Figure 3.1, thereis a bug in RetrieveDataTask class. It may take 20 secondsto retrieve the data from Internet. If during that time the activityis destroyed, however, the RetrieveDataTask will run until itfinishes. When the onPostExecute is invoked, the text viewno longer exists and the program would be crashed if the error isnot catched. Therefore it is not appropriate to use AsyncTaskfor network requests which may take very long. Developers thenresort to the Loader class. However, As suggested in RoboSpiceproject [163], AsyncTask has its limitation on performing network

CHAPTER 3. ANDROID PERFORMANCE DIAGNOSIS 72
requests. RoboSpice project [163] may be a better choice in thiscase. The developers should better understand the features ofdifferent types of asynchronous executions and apply suitable onewhen needed. Misusing of asynchronous executions could introduceperformance bugs.
3.7.2 Discussions on the Implementation
Hooking Methods of Apks
Method hooking is the first step (pre-run step) of our testing frame-work. When talking about hooking methods in app, the first idea isto decompile and modify the apk file. There are already severaltools that could do the decompile & recompile like smali [172]and apktool [38]. However, many apks would obfuscate the codeswhen release. Most obfuscated codes can hardly be hooked andrecompiled by these tools. Therefore we resort to runtime hijackingthe framework code which is more reliable.
3.7.3 Limitation of Our Tool
The main thread is different from worker threads. The main threadis not task-oriented. It keeps running during the entire life cycle ofthe app. We do not work on problems on the main thread. Thereforethose performance issues caused by bad design of the main threadwill not be detected by our tools. As mentioned in Section 3.3several tools address and attempt to solve this problem.
Currently the tool is built only on Android platform. While asthe methodology is generalized, the tool could be easily appliedto other mobile platforms such as Window Phone, iOS. However,the framework methods interception of these platforms are moreinvolved.

CHAPTER 3. ANDROID PERFORMANCE DIAGNOSIS 73
3.8 Summary
To conclude, this chapter focuses on an important type of Androidperformance issues caused by task execution dependency. Wecarefully model the performance of the asynchronous tasks and theirdependency. Taken task dependency into consideration, we designDiagDroid for task-level performance diagnosis. It is equippedwith a set of sophisticated task profiling approaches based on theAndroid multithreading mechanisms.
To make DiagDroid a practical, handy tool for performancediagnosis, we carefully consider the system design requirements likecompatibility, usability, flexibility and low overhead. Specifically,DiagDroid relies solely on the general features of Android. Henceit works for most mainstream Android devices, depending on nomanufacturer specifics. Moreover, DiagDroid is convenient to beused via a simple installation. It requires no efforts to recompile theoperation system kernel and the Android framework. With a pluginmechanism, DiagDroid provides the flexibility in selecting thetest executor that is required to exercise the app. It is convenient toapply different test executors based on the test requirements. Finally,DiagDroid keeps low overhead by instrumenting slightly on theframework.
We show DiagDroid can effectively reduce human effortsin detecting and locating performance issues. We apply the toolsuccessfully in finding bugs in tens of real-world apps which weare unfamiliar with.
2 End of chapter.
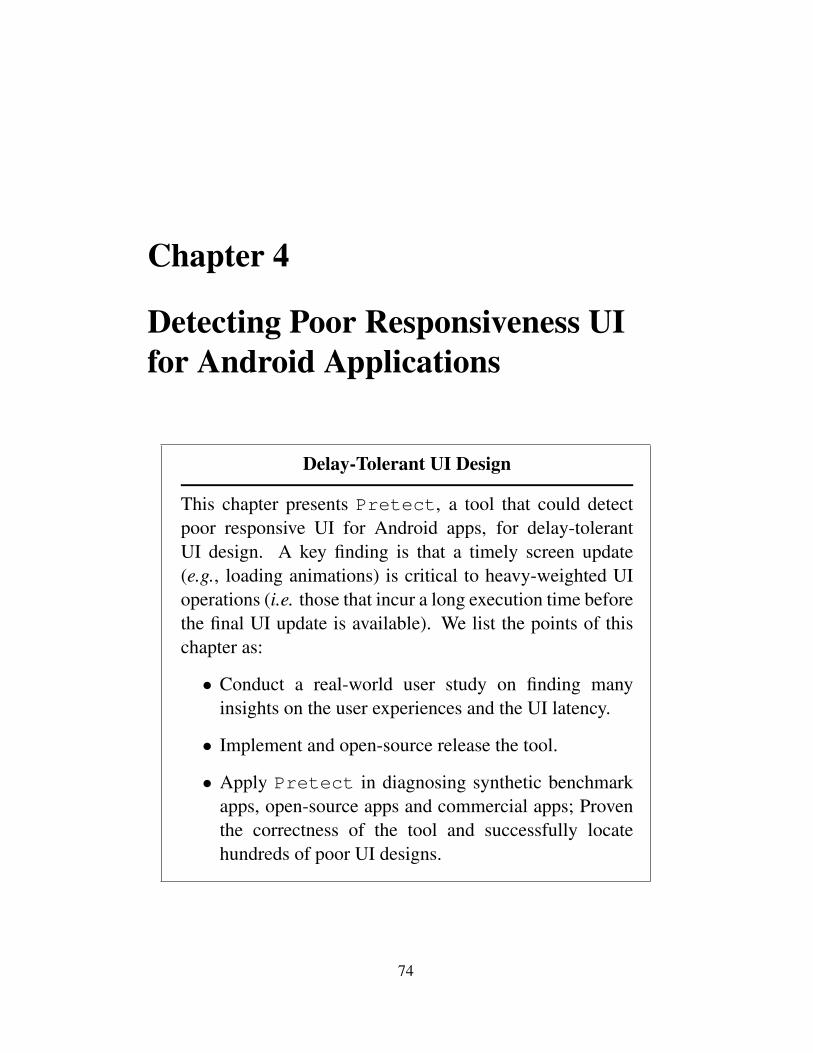
Chapter 4
Detecting Poor Responsiveness UIfor Android Applications
Delay-Tolerant UI Design
This chapter presents Pretect, a tool that could detectpoor responsive UI for Android apps, for delay-tolerantUI design. A key finding is that a timely screen update(e.g., loading animations) is critical to heavy-weighted UIoperations (i.e. those that incur a long execution time beforethe final UI update is available). We list the points of thischapter as:
• Conduct a real-world user study on finding manyinsights on the user experiences and the UI latency.
• Implement and open-source release the tool.
• Apply Pretect in diagnosing synthetic benchmarkapps, open-source apps and commercial apps; Proventhe correctness of the tool and successfully locatehundreds of poor UI designs.
74
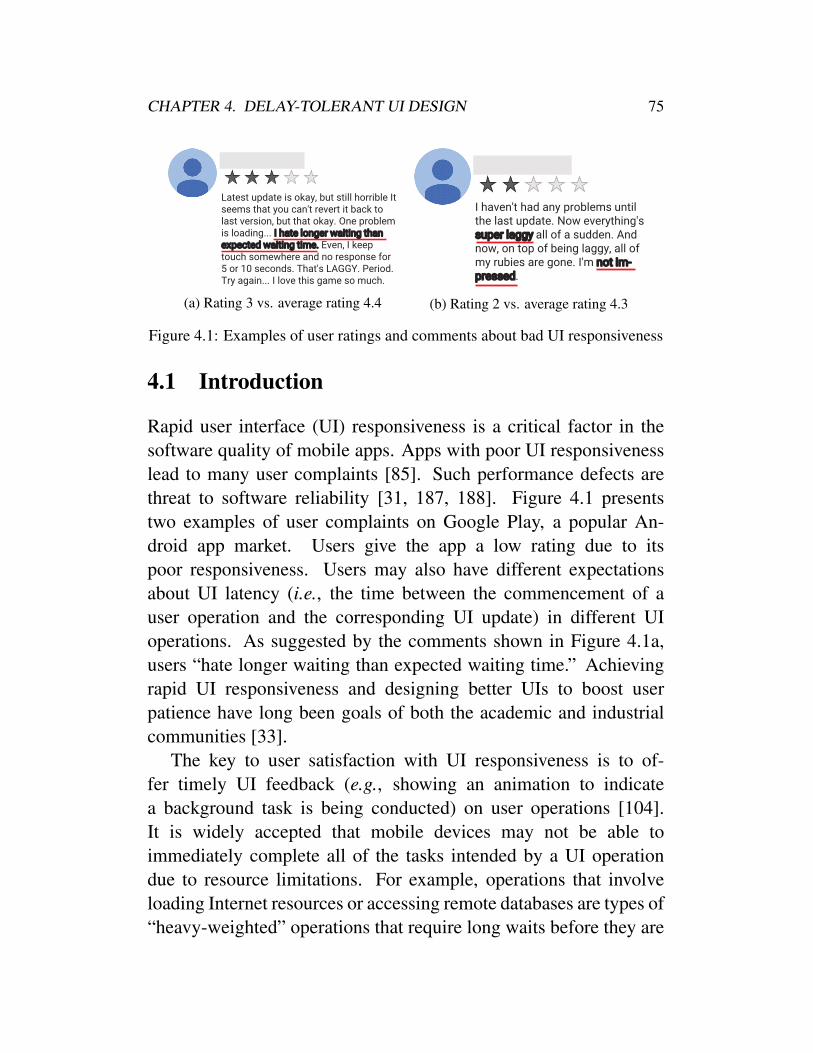
CHAPTER 4. DELAY-TOLERANT UI DESIGN 75
Hamzah S
Latest update is okay, but still horrible It seems that you can't revert it back to last version, but that okay. One problem is loading... I hate longer waiting than expected waiting time. Even, I keep touch somewhere and no response for 5 or 10 seconds. That's LAGGY. Period. Try again... I love this game so much.
(a) Rating 3 vs. average rating 4.4
K Bailey
I haven't had any problems until the last update. Now everything's super laggy all of a sudden. And now, on top of being laggy, all of my rubies are gone. I'm not im-pressed.
(b) Rating 2 vs. average rating 4.3
Figure 4.1: Examples of user ratings and comments about bad UI responsiveness
4.1 Introduction
Rapid user interface (UI) responsiveness is a critical factor in thesoftware quality of mobile apps. Apps with poor UI responsivenesslead to many user complaints [85]. Such performance defects arethreat to software reliability [31, 187, 188]. Figure 4.1 presentstwo examples of user complaints on Google Play, a popular An-droid app market. Users give the app a low rating due to itspoor responsiveness. Users may also have different expectationsabout UI latency (i.e., the time between the commencement of auser operation and the corresponding UI update) in different UIoperations. As suggested by the comments shown in Figure 4.1a,users “hate longer waiting than expected waiting time.” Achievingrapid UI responsiveness and designing better UIs to boost userpatience have long been goals of both the academic and industrialcommunities [33].
The key to user satisfaction with UI responsiveness is to of-fer timely UI feedback (e.g., showing an animation to indicatea background task is being conducted) on user operations [104].It is widely accepted that mobile devices may not be able toimmediately complete all of the tasks intended by a UI operationdue to resource limitations. For example, operations that involveloading Internet resources or accessing remote databases are types of“heavy-weighted” operations that require long waits before they are

CHAPTER 4. DELAY-TOLERANT UI DESIGN 76
complete. In such cases, it is necessary to provide quick UI feedbackto the user to let her know that the operation is being processed.
However, designing such feedback for every possible heavy-weighted UI operations requires a daunting amount of developmenteffort. Moreover, developers generally have no idea on the latencyon each UI operation. Without a comprehensive performance testand a handy tool to record UI latency, developers may neglectpotential heavy-weighted operations.
We consider operations that may require a long execution timewithout offering quick UI feedback as poor-responsive operations.Poor-responsive operations, as software design defects, should bedetected before an app is released to limit their influence on userexperience. However, there are currently no methods for detectingsuch defects. First, there is no comprehensive understanding ofwhat degree of UI latency (i.e., the latency threshold) leads to poor-responsive operations. The Android framework expects Androidapps to be responsive in 5 seconds, otherwise it produces an “Appli-cation Not Responding (ANR)” alert [112]. Therefore, 5 secondscan be viewed as a loose upper bound for the latency thresholdof poor-responsive operations. Alternatively, Google suggests that200 ms as a general threshold beyond which users will perceiveslowness in an application [112]. Therefore, 200 ms can be viewedas a lower bound for the latency threshold of poor-responsiveoperations. However, how much UI latency a typical user canreally tolerate remains unknown, this information is a prerequisitefor detecting poor-responsive operations.
Second, currently there is no tool that can detect poor-responsiveoperations during an app test run. The official tool StrictMode [90]or other tools like Asynchronizer [123] can detect operations thatblock the UI thread, but they cannot detect non-blocking operationsthat incur long UI latency. The official performance diagnosingtools Method Tracing (and TraceView) cannot correlate operationswith UI updates [153]. Other performance diagnosis tools such
CHAPTER 4. DELAY-TOLERANT UI DESIGN 77
as Panappticon [196] also cannot capture the performance of UIfeedback while a UI operation is being processed.
Hence, a tool that can detect poor-responsive operations duringan app test run is necessary to combat poor UI responsiveness.In this work, we first provide a threshold for classifying poor-responsive operations based on a real-world user study. Moreover,we observe that Android apps generally use a unique pattern whenconducting UI updates. Specifically, although Android has a com-plicated procedure for conducting UI updates that involves diversecomponents, we find that every app uses a similar communicationpattern based on a specific system process of Android when itconducts UI updates. Therefore, we can design a tool to track suchpatterns and detect poor-responsive operations.
The contributions of this chapter are as follows.
1. We conduct a real-world user study via a comprehensive sur-vey. Where we find many insights on the user experiences andthe UI latency. We thus find a reasonable threshold to detectpoor-responsive operations.
2. A handy tool, called Pretect (Poor-Responsive UI Detectionin Android Applications), is implemented and has been open-source released [37]. The tool aims at detecting poor-responsiveoperations. We use the tool to find many UI design defects inmany real-world Android apps.
4.2 Motivation
Android has unique UI design patterns. The main thread of an app isthe sole thread that handles the UI-related operations [152], such asprocessing user inputs and displaying UI components (e.g., buttonsand images). When a valid user input (i.e., a UI event) comes,the main thread invokes the corresponding UI event procedure,i.e., the codes that handle the UI event. However, some UI event

CHAPTER 4. DELAY-TOLERANT UI DESIGN 78
File - D:\svn\fps_test\Sources\synthetic_app\synthetic_app\app\src\main\java\com\cudroid\syntheticapp\Gallary_back.java
Page 1 of 1
package com.cudroid.syntheticapp;
import android.app.Activity;import android.graphics.Bitmap;import android.graphics.BitmapFactory;import android.os.AsyncTask;import android.os.Bundle;import android.util.Log;import android.view.View;import android.widget.ImageView;
import java.net.HttpURLConnection;import java.net.URL;
public class Gallary extends Activity { private ImageView imageView; public void onCreate(Bundle savedInstanceState) { super.onCreate(savedInstanceState); setContentView(R.layout.activity_gallary); setTitle("Gallary"); ImageView nextBtn = (ImageView) findViewById(R.id.next); this.imageView = ((ImageView) findViewById(R.id.gallary)); nextBtn.setOnClickListener(new View.OnClickListener() { public void onClick(View v) { new ImageDownloader().execute(downloadUrl[(count++) % downloadUrl.length]); } }); }
private Bitmap downloadBitmap(String urlStr) { Bitmap bitmap = null; try { URL url = new URL(urlStr); HttpURLConnection con = (HttpURLConnection) url.openConnection(); bitmap = BitmapFactory.decodeStream(con.getInputStream()); } catch (Exception e) { e.printStackTrace(); } return bitmap; }
private class ImageDownloader extends AsyncTask<String, Void, Bitmap> { protected Bitmap doInBackground(String... urls) { return downloadBitmap(urls[0]); }
protected void onPostExecute(Bitmap result) { imageView.setImageBitmap(result); } }}
Figure 4.2: Screenshot and related source codes of a simple gallery
procedures may be time-consuming; for example, a procedure mayinvolve downloading a large file from the Internet. Android preventssuch procedures from blocking the main thread, i.e., unable torespond to other user operations, by introducing the Application NotResponding (ANR) [112] mechanism.
Commonly, Android apps conduct heavy tasks in an asynchron-ous manner so as not to block the UI thread. More specifically,when accepting a user operation, an app will start executing time-consuming tasks asynchronously in threads other than the mainthread. Once the asynchronous task is finished, there is usually acallback to the main thread to update the UI accordingly [152].
The UI responsiveness is poor if the asynchronous task takesa long time to execute and there is no feedback (e.g., no loadinganimation) during its execution. Providing no feedback to usersis a common mistake of developers. Figure 4.2 shows a simple
CHAPTER 4. DELAY-TOLERANT UI DESIGN 79
gallery design and the source codes of its core functionality. TheImageDownloader task downloads the image with the givenURL and then updates the imageView. Although such functionalityis trivial, it contains a defect that may lead to slow UI respon-siveness. When the image is large, or the Internet connection ispoor (e.g., on a cellular network), the user has to wait a longtime before the image is loaded. The app provides no feedbackduring this waiting period. The user may be uncertain whethershe has successfully touched the “next” sign shown in Figure 4.2.A better design for this case is showing the progress of loadingwith onProgressUpdate function or displaying an instance ofProgressBar/ProgressDialog.
Although Google has offered some responsive Android widgetssuch as SwipeRefreshLayout, in most cases, they only providesuggestions for improving responsive UI design (e.g., showing theprogress of background work using a ProgressBar) [112]. In nextsection, we present a user study that shows how poor-responsive UIdesign hurts an app.
4.3 User study
Unlike traditional PC apps, mobile apps are usually executed in anexclusive manner. Users do not generally switch their focus to otherwindows while an app is being used. Therefore, users tend to bemore impatient with delays in mobile apps. This effect is not studiedbefore, thus we design a user study to reveal it. The study is availableonline [37]. Our study examines the relationship between UI latencyand user patience. The results can guide the design of our tool.
We implement a mobile app with different delay levels andcollect user feedback. The feedback reveals user tolerance underdifferent delay levels. The app interacts with the users usingcommon multimedia (e.g., video, audio, microphone, etc.). The apprequests user interaction (e.g., clicking buttons) before it continues

CHAPTER 4. DELAY-TOLERANT UI DESIGN 80
Figure 4.3: Screen shot of survey app
to the next page (i.e., an Android activity). A designed delay isattached to each user interaction. A sample page of the app is shownin Figure 4.3. After running the app with a designed procedure, usersare required to answer several questions related to their patience,each rated from 1 to 9 (e.g., rate 1 for user impatient, 9 for userpatient). The statistical analysis of the ratings show the trends inuser patience.
4.3.1 Test settings
In the study, we set three delay levels: 200 ms, 500 ms, and 2seconds (i.e., we set feedback after the delay time). As it is hard fora single user to rate fairly each separate operation with a differentdelay, we use a between-subject design [89, 97]. Thus, each userhas one assigned delay level throughout the test and rates the app’soverall performance; then the rates are compared between the sets

CHAPTER 4. DELAY-TOLERANT UI DESIGN 81
of similar users.The parameter settings are chosen based on the previous study
of Johnson [104]; 200 ms is the editorial “window” for eventsthat reach user consciousness, 500 ms is the attentional “blink”(inattentiveness to other objects) following recognition of an object,and 2 seconds is the maximum duration of a silent gap betweenturns in person-to-person conversation [104]. Google suggests 100to 200 ms as the threshold at which users will perceive slowness inan application [112]. More levels may be helpful to obtain a finerthreshold of user impatience. However, the threshold varies amongdifferent circumstances a conservative threshold is enough for usin our study. Moreover, too many delay levels would disperse thesubjects (noted that we use between-subject test) which makes theresult less meaningful in statistics.
We take the following measures to address possible threats to thevalidity of our user study. 1) Subjects do not rate objectively if theyknow the purpose of the study. Therefore, we design more questionsthan required to hide our purpose. We ask the subjects to rate forabout ten common questionnaire questions (e.g., [58, 92, 175]), onlytwo of which are related to user patience. We also ask the subjectstheir understanding on the purpose of the study. The results verifythat the subjects are unaware of our real purpose. 2) The ability tolearn a new app varies among subjects. To remove this effect, weconduct a practice before the study, but do not include the results ofthe practice in our analysis. 3) Internet delays are a common sourceof delay [31, 173], which can make subjects impatient. Therefore,to avoid introducing extra Internet delays, our tests are all conductedon local area networks.
4.3.2 Results
We collect 116 valid replies. All of the subjects are college studentsbetween the ages of 20 and 27. We first collect the user feedback
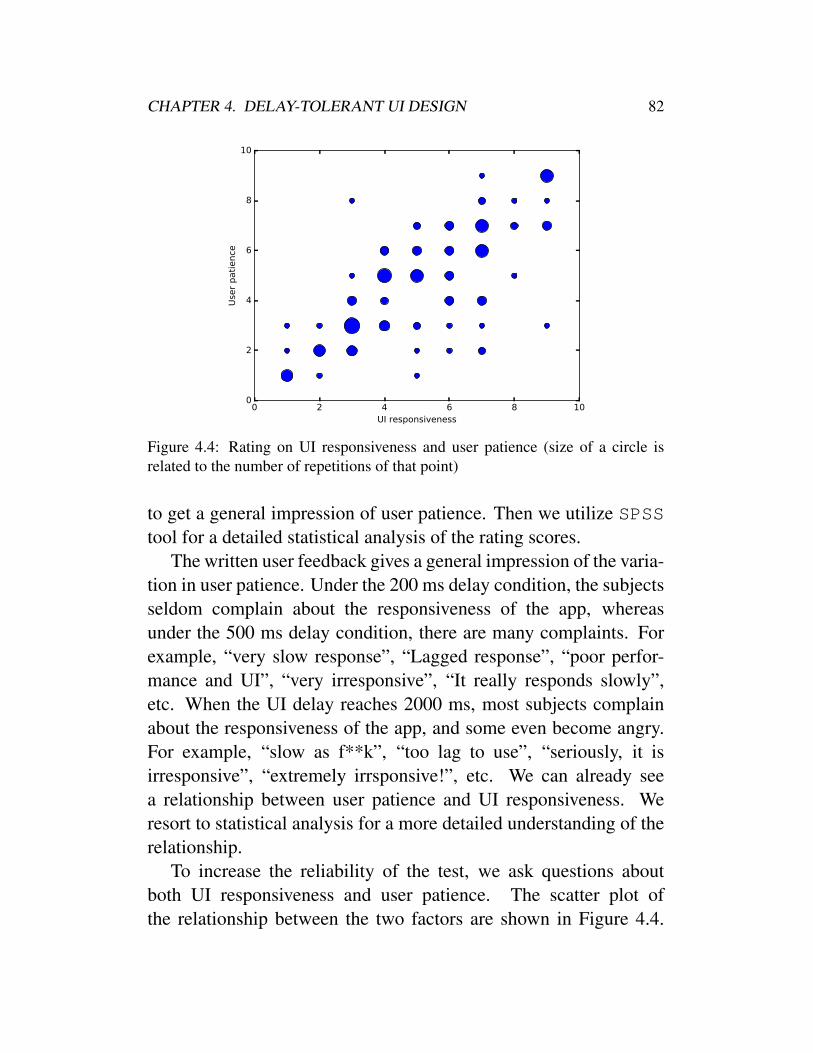
CHAPTER 4. DELAY-TOLERANT UI DESIGN 82
0 2 4 6 8 10UI responsiveness
0
2
4
6
8
10
Use
r pati
ence
Figure 4.4: Rating on UI responsiveness and user patience (size of a circle isrelated to the number of repetitions of that point)
to get a general impression of user patience. Then we utilize SPSStool for a detailed statistical analysis of the rating scores.
The written user feedback gives a general impression of the varia-tion in user patience. Under the 200 ms delay condition, the subjectsseldom complain about the responsiveness of the app, whereasunder the 500 ms delay condition, there are many complaints. Forexample, “very slow response”, “Lagged response”, “poor perfor-mance and UI”, “very irresponsive”, “It really responds slowly”,etc. When the UI delay reaches 2000 ms, most subjects complainabout the responsiveness of the app, and some even become angry.For example, “slow as f**k”, “too lag to use”, “seriously, it isirresponsive”, “extremely irrsponsive!”, etc. We can already seea relationship between user patience and UI responsiveness. Weresort to statistical analysis for a more detailed understanding of therelationship.
To increase the reliability of the test, we ask questions aboutboth UI responsiveness and user patience. The scatter plot ofthe relationship between the two factors are shown in Figure 4.4.
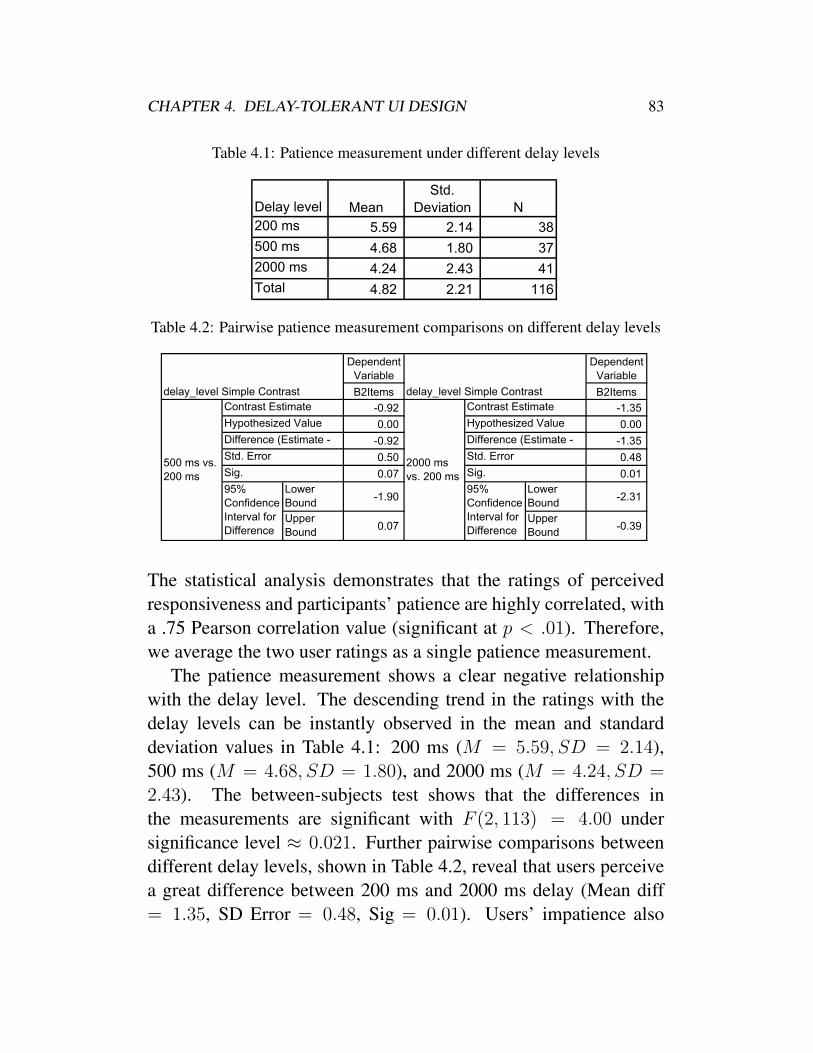
CHAPTER 4. DELAY-TOLERANT UI DESIGN 83
Table 4.1: Patience measurement under different delay levels
MeanStd.
Deviation N200 ms 5.59 2.14 38500 ms 4.68 1.80 372000 ms 4.24 2.43 41Total 4.82 2.21 116
Delay level
Table 4.2: Pairwise patience measurement comparisons on different delay levels
DependentVariable
DependentVariable
B2Items B2Items
-0.92 -1.35
0.00 0.00
-0.92 -1.35
0.50 0.48
0.07 0.01LowerBound
-1.90LowerBound
-2.31
UpperBound
0.07UpperBound
-0.39
2000 msvs. 200 ms
Contrast Estimate
Hypothesized Value
Difference (Estimate -
Std. Error
Sig.
95%ConfidenceInterval forDifference
500 ms vs.200 ms
Contrast Estimate
Hypothesized Value
Difference (Estimate -
Std. Error
Sig.
95%ConfidenceInterval forDifference
delay_level Simple Contrastdelay_level Simple Contrast
The statistical analysis demonstrates that the ratings of perceivedresponsiveness and participants’ patience are highly correlated, witha .75 Pearson correlation value (significant at p < .01). Therefore,we average the two user ratings as a single patience measurement.
The patience measurement shows a clear negative relationshipwith the delay level. The descending trend in the ratings with thedelay levels can be instantly observed in the mean and standarddeviation values in Table 4.1: 200 ms (M = 5.59, SD = 2.14),500 ms (M = 4.68, SD = 1.80), and 2000 ms (M = 4.24, SD =2.43). The between-subjects test shows that the differences inthe measurements are significant with F (2, 113) = 4.00 undersignificance level ≈ 0.021. Further pairwise comparisons betweendifferent delay levels, shown in Table 4.2, reveal that users perceivea great difference between 200 ms and 2000 ms delay (Mean diff= 1.35, SD Error = 0.48, Sig = 0.01). Users’ impatience also

CHAPTER 4. DELAY-TOLERANT UI DESIGN 84
increases between 200 ms and 500 ms delay with a marginal signif-icance (Mean diff = 0.92, SD Error = 0.50, Sig = 0.07). However,the 500 ms and 2000 ms delays do not provoke significantly differentlevels of impatience (Sig > 1).
These results suggest that 1) users are impatient when usingmobile apps and are sensitive to delays and 2) the developers shouldbe careful about operations with delays larger than 500 ms.
4.4 Overall framework for poor-responsive UI de-tection
In this section, we first introduce the UI design problem of ourinterest. Then, we propose a workflow to solve the problem. Finally,we consider how our tool fits within the execution flow.
4.4.1 Problem specification
As mentioned in Section 4.2, the Android framework is speciallytailored to suit the UI-driven requirements of Android apps. De-velopers try to keep apps responsive. A common practice whenprocessing long-term operations is to provide a loading bar/circleanimation as feedback to users. However, it requires dauntinghuman efforts to design feedback for every possible heavy-weightedoperation. In practice, developers usually only notice extremelylong-term operations that may trigger ANR. However, our user studyshows that a 500 ms delay is already long enough for users toperceive bad UI design.
Developers try their best to keep the app responsive. A com-mon practice is setting loading bar/circle animation as feedback tousers when processing long term operations. However, it requiresdaunting human efforts to design feedbacks for all possible heavy-weighted operations. In practice, in general developers merelynotice extremely long-term operations that may trigger ANR. While

CHAPTER 4. DELAY-TOLERANT UI DESIGN 85
Target
app
Event
monitor
Surface
flinger
Display
monitor
User input
Device
Log analyzer
Logs
Figure 4.5: Detecting poor-responsive operations
as our user study shows, 500ms delay is already long enough forusers to perceive bad UI design.
To facilitate the following discussions, we define several termsrelated to UI design.
Definition 4.1 (Operation feedback). A screen update that is trig-gered after an app receives a user operation (i.e., a button click).
Definition 4.2 (Feedback delay). The latency between a UI opera-tion and the first UI update that it triggers.
Definition 4.3 (Poor-responsive operations). A UI operation is poor-responsive if its feedback delay is not less than a threshold T.
In this work, we aim at detecting poor-responsive operations withfeedback that takes longer than T . The UI feedback should be givenas soon as the input event is accepted, but not until the event has

CHAPTER 4. DELAY-TOLERANT UI DESIGN 86
finished processing. The feedback can reassure users that their inputbeing processed by the app. Without timely feedback, users areunsure whether their operations have been accepted or the touchscreen is insensible. As a result, they become impatient.
4.4.2 Proposed execution flow
We propose an execution flow, shown in Figure 4.5, for detectingpoor-responsive operations. First, the system takes a user input Ifrom either a testing tool (e.g., Monkey [179], MonkeyRunner[138]) or human input. Then an event monitor module records theinput event without interfering with the execution of the app. Afterthe input event is processed, the display may or may not updatewithin a preset time window. A display monitor module capturesall of the display updates.
All of the related information is logged and analyzed offline. Alog analyzer module analyzes the logs by calculating the feedbackdelays for each input event. It then generates a report about the poor-responsive operations. With the report, developers can easily detectthe UI designs that should be improved.
4.4.3 Framework Design
We design a framework called Pretect (Poor-responsive UI De-tection) for Android apps that realizes the proposed execution flowshown in Figure 4.5. The main modules are as follows.
Event monitor
The event monitor module monitors the input events conducted onthe touchscreen. Whenever an input event (e.g., touch a button)is performed, the event monitor module would record the eventinformation including the type of event, the related UI component,and the time when the input is conducted in the log.
CHAPTER 4. DELAY-TOLERANT UI DESIGN 87
Display monitor
The display monitor module monitors the screen updates. Wheneverthe screen refreshes, this module logs the UI update informationincluding the source of the screen update (i.e., the process thatrequests the UI update) and the update time.
Log analyzer
The log analyzer module offline analyzes the logs of the input eventsand screen updates. The purpose of this module is to identify theUI designs that could be improved. It reports the poor-responsiveoperations. The supporting information it provides in the reportincludes the input event information, the feedback delay, and therelated logs.
4.5 Implementation details
We have implemented a poor-responsive UI detection tool basedon the proposed Pretect framework. The implementation of themain modules in Section 4.4.3 is described in detail in this section.Details could also be found from the released source codes [37].
It is worth noting that we rely on a dynamic instrumentationmechanism to keep Pretect compatible with most Android ver-sions and devices. The mechanism requires no changes to the targetapp per se. It also does not require us to recompile the underlyingOS and the Android framework. Moreover, the tool requires littlehuman effort to install and apply.
We intercept the Android framework methods in both Java andC. This approach is more light-weight and easier to implementthan tracking the functions at the OS level, which typically requiresheavy-weighted and sophisticated tools for kernel instrumentation.More importantly, we can thus rely on an Android-specific featureto conveniently track the relevant methods.

CHAPTER 4. DELAY-TOLERANT UI DESIGN 88
For Java method tracking, we note that, unlike general Linuxprocesses, all Android app processes are created by duplicatinga system process called Zygote. The framework binaries areloaded in Zygote before this duplication. Therefore, we caninstrument the Zygote process and “hijack” the Java-based frame-work methods we are interested in before the app runs. When theapp is running, the method invocations are inherently hijacked byPretect via the forking of Zygote. Hence, we can easily trackthe methods. We implement this idea by adopting a tool calledXposed [193], which is usually used to improve the appearance ofuser interfaces [192]. It can substitute the original Zygote processwith an instrumented one. We rely on its mechanism, and programour own codes to hijack the Java methods we are interested in.
For our C method interception, we note that the Android OS isbased on the Linux kernel. A well-known Linux system tool namedptrace, which is commonly used in debugging tools (e.g., gdb),is also available on Android. Ptrace makes it possible to inspectthe child process of the parent process. Ptrace enables the parentprocess to read and replace the value of the register of the childprocess. We can utilize ptrace to attach code to a target process(with a known process ID pid). Then, we are able to take over theexecution of the target process. By analyzing the elf-format libraryfiles of the target process, we can locate the memory addresses ofthe methods with the relevant names and invoke them accordingly.Therefore, it is feasible to invoke the dlopen, dlsym library-related system calls of the target process. We implement the ideaby adopting a tool called LibInject [120].
4.5.1 Event monitor
We implement the event monitor by instrumenting the related An-droid framework Java methods to obtain the input event information.In particular, we intercept several event dispatch methods of the

CHAPTER 4. DELAY-TOLERANT UI DESIGN 89
1. … 2365 …: com.cyberlink.youperfect[Event]com.cyberlink.youperfect.widgetpool.common. ChildProportionLayout{425193c8V.E...C....P....270,0-540,67#7f0a051dapp:id/cutout_tab_artis tic}_null-Motion-UP : 125696
2. … 138 …: BIPC:****android.gui.SurfaceTexture****, sender_pid:2365, UptimeMilli: 127932
Figure 4.6: Example logs of Pretect
View class; all touchable widgets such as Buttons, ImageViewand ListView are subclasses of the View class. We careful-ly select a set of methods to cover all types of possible inputevents. The methods include dispatchKeyEvent, dispatch-TouchEvent and some rarely used methods such as dispatch-KeyShortcutEvent, dispatchKeyEventPreIme and dis-patchTrackballEvent.
A sample log of an event is shown in line 1 of Figure 4.6.From this line we can see that the input event is a touch event, asindicated by the Motion-Up action. The touch event is conductedon a ChildProportionLayout with the ID cutout tab artistic.With the ID information, we can locate the component easily viathe Hierarchy Viewer [95] tool published along with Android SDK.The event is performed 125696 ms after the system is booted. Thehighlighted information is important for the subsequent steps of theanalysis.
4.5.2 Display monitor
There are numerous functions that can update Android app dis-plays (e.g., TextView.setText, ImageView.setImage-Bitmap). Therefore, it is hard to list and instrument all of them.Moreover, updating UI display is a cross-layer procedure. Multiplelayers created by the app, Android framework, kernel, and driverare involved in the procedure. Many components such as Sur-faceFlinger, OpenGL ES, and FrameBuffer are included.The complicated nature of the UI display update mechanism makes
CHAPTER 4. DELAY-TOLERANT UI DESIGN 90
it hard to trace. Luckily, we find that all of the UI updates aredone via the surfaceflinger process provided by the AndroidOS. All of the UI update requests from the app are sent to thesurfaceflinger process via binder, which is the standardinter-process communication (IPC) mechanism in Android.
Therefore, we can obtain the UI update information by intercept-ing the communication related functions of binder. More specif-ically, we intercept the surfaceflinger process on ioctlmethod of the shared library libbinder.so, which the bindermechanism is embedded in. The ioctl method is responsiblefor reading and writing the inter-process communication contents.We successfully intercept the invocations of ioctl to get detailedinformation about the UI update requests.
There are hundreds of binder communication messages persecond; the UI updating messages are the one type of request thatSurfaceTexture sends from the app under test (pid 2365 inthis example). We show a UI update message in line 2 of Figure 4.6.The corresponding UI request time is 127932 ms after the system isbooted.
4.5.3 Log analyzer
The log analyzer extracts information from the logs collected duringthe offline tests. We implement the analyzer in Python.
The most important task of the log analyzer is to correlate theinput events with their associated UI updates. The log analyzer firstscans the logs to retrieve the input events. For each input event I ,we check the following binder requests set (R), until it reaches thenext input event. With the information about the process ID (pid)of the sender process (e.g., we record the sender’s pid, as shown inthe second line in Figure 4.6); the analyzer is able to distinguish thesource of the binder request. We then search for the first binderrequest from set R such that 1) the sender’s pid is the same as that
CHAPTER 4. DELAY-TOLERANT UI DESIGN 91
of the app process (which we can determine from logs, for example,line 1 shown in Figure 4.6); and 2) the requested component isSurfaceTexture, which means it is a UI update request. Weregard this UI update request as feedback of the input event I . Thenit is not hard to calculate the feedback delay which is the time spanbetween the input event and the feedback.
Worse than long feedback delay, some operations may haveno feedback at all. For these operations, there are no followingUI update logs. We filter such events by calculating the intervalbetween the input event of interest and the following event. If theinterval is too large, we regard the event as having no feedback. Thelog analyzer reports poor-responsive operations as these input eventswithout feedback (i.e., no following UI update request by the app)or without timely feedback (i.e., feedback delay ≥ T ).
From lines 1-2 in Figure 4.6, we can infer that: 1) the two linesare a relevant input event and its first UI update; and 2) the feedbackdelay of the input event is 127932− 125696 = 2236 ms.
4.6 Experimental study
In this section, we first conduct several experiments on syntheticapps and open source apps to show the effectiveness of our tool.Then we illustrate how our tool improves the UI designs by present-ing several case studies.
4.6.1 Tool effectiveness validation with fault injection
We examine the accuracy of Pretect by evaluating ten apps,including five synthetic benchmarks and five open source apps.These apps are selected to represent those with common heavy-weighted UI operations that may incur long UI latency. The appsand the selected operations are listed in Table 4.3.
As mentioned in Section 4.2, various types of asynchronous tasks

CHAPTER 4. DELAY-TOLERANT UI DESIGN 92
Table 4.3: List of applications
Type Name OperationWorker Thread load an image by worker threadAsyncTask load an image by AsyncTaskThreadPool-Executor
load an image by ThreadPool-Executor
HandlerThread dump a table of a databaseIntentService load an image by IntentServiceK9Mail refresh email InboxASqliteManager dump a table of a databaseAFWall+ start network firewallAmaze scan disk for all imagesePUBator convert a pdf file to epub type
Synthetic
Opensource
and UI updates are common sources of poor-responsive operations.We implement all the five Android asynchronous mechanisms forthis purpose, including Worker Thread, AsyncTask, ThreadPoolEx-ecutor, HandlerThread, and Intent Service. The app loads animage after an asynchronous task finishes. We use sleep methodto ensure the asynchronous tasks finish in about 500 ms. To validatePretect’s ability to detect poor-responsive operations, we updatethe UI for each type of asynchronous mechanisms with two set-tings: separately with timely feedback and without timely feedback.More specifically, for the setting with timely feedback leading toresponsive operations, we set a loading circle to appear while theasynchronous tasks are executing. For the setting without timelyfeedback, leading to poor-responsive operations, we do nothingwhen the asynchronous tasks are executing.
We validate our tool on open source projects. We select fiveopen source projects that have representative heavy-weighted UIoperations that may incur long UI latency, as listed in Table 4.3.These operations may incur UI delays from various sources such asnetwork requests, database operations, system settings, disk scan-ning with querying content provider, and CPU-intensive computing.

CHAPTER 4. DELAY-TOLERANT UI DESIGN 93
0
500
1000
1500
2000
Delay (unit: m
s)
With timely feedback Without timely feedback
Figure 4.7: Feedback delay of applications detected by Pretect
The original apps offer good timely UI feedback on these long-termoperations. During the experiment, we manually switch off the UIfeedback for comparison.
The results presented in Figure 4.7 show a notable difference be-tween poor-responsive operations and responsive operations. Pre-tect can easily distinguish responsive operations from poor-res-ponsive operations.
4.6.2 Overview of Experimental Results
We apply the tool to 115 popular Android apps covering 23 cate-gories (including BooksReferences, Photography, Sports, etc.). Wedownload apps on AndroidDrawer [35] from all of the categoriesexcept the library demo category. We randomly select five popularapps from each category. We conduct the experiments on HuaweiG610-T11 with Android 4.2.2.
The overall statistics for the case where the threshold is 500 ms

CHAPTER 4. DELAY-TOLERANT UI DESIGN 94
Table 4.4: Statistics of feedback delay
# apps contain bugs 94 Total 327
Max bugs an app 23 Max 29189.0 (ms)Min bugs an app 0 Min 504.0 (ms)Avg. bugs per app 2.8 Avg 1603.9 (ms)Median bugs per app 2 Stdv 2635.5
Issues StatisticsApp Statistics
0.00%
25.00%
50.00%
75.00%
100.00%
0
15
30
45
0 1 3 6 9 More
Freq
uen
cy
Number of issues per app
Frequency Cumulative %
Figure 4.8: Cases number distribution
0.00%
25.00%
50.00%
75.00%
100.00%
0
50
100
150
500 800 1000 1200 1500 More
Freq
uency
Feedback delay (unit: ms)
Frequency Cumulative %
Figure 4.9: Feedback delay distribution
are shown in Table 4.4. We find that poor-responsive operationsare common defects in UI designs. Of the 115 apps examined,94 contain potential UI design defects. The maximum number ofdefects in a single app is 23 and the minimum number is 0. On
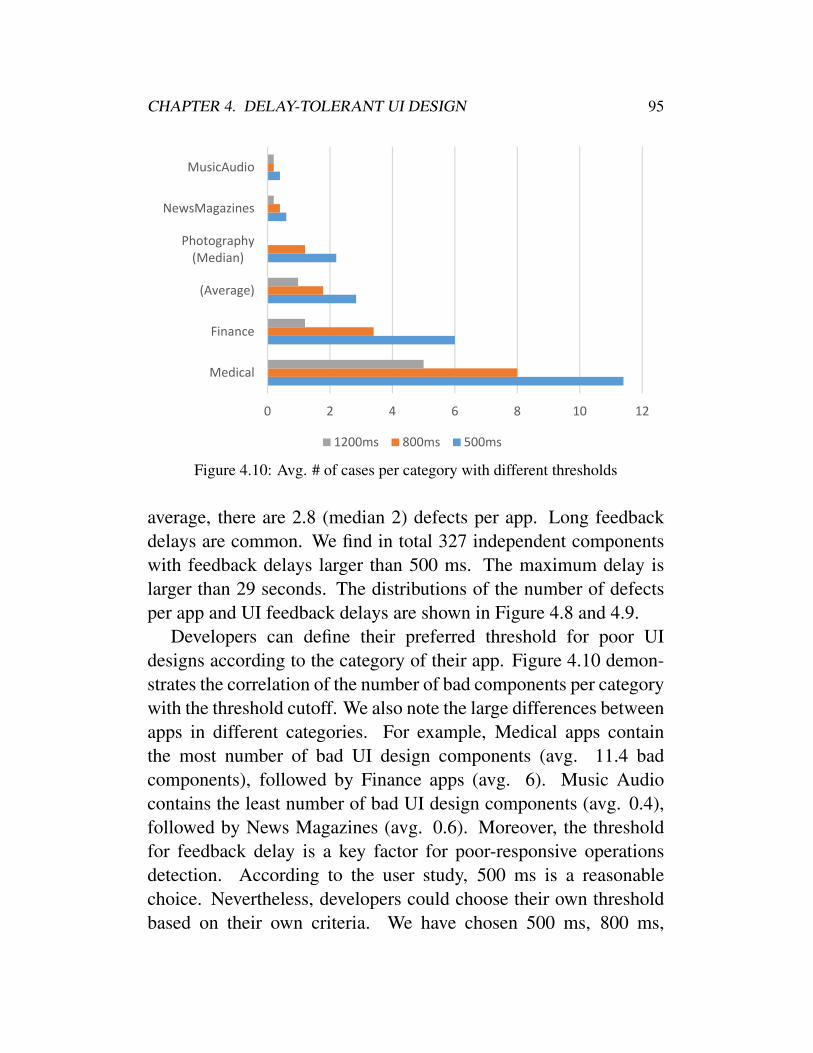
CHAPTER 4. DELAY-TOLERANT UI DESIGN 95
0 2 4 6 8 10 12
Medical
Finance
(Average)
Photography(Median)
NewsMagazines
MusicAudio
1200ms 800ms 500ms
Figure 4.10: Avg. # of cases per category with different thresholds
average, there are 2.8 (median 2) defects per app. Long feedbackdelays are common. We find in total 327 independent componentswith feedback delays larger than 500 ms. The maximum delay islarger than 29 seconds. The distributions of the number of defectsper app and UI feedback delays are shown in Figure 4.8 and 4.9.
Developers can define their preferred threshold for poor UIdesigns according to the category of their app. Figure 4.10 demon-strates the correlation of the number of bad components per categorywith the threshold cutoff. We also note the large differences betweenapps in different categories. For example, Medical apps containthe most number of bad UI design components (avg. 11.4 badcomponents), followed by Finance apps (avg. 6). Music Audiocontains the least number of bad UI design components (avg. 0.4),followed by News Magazines (avg. 0.6). Moreover, the thresholdfor feedback delay is a key factor for poor-responsive operationsdetection. According to the user study, 500 ms is a reasonablechoice. Nevertheless, developers could choose their own thresholdbased on their own criteria. We have chosen 500 ms, 800 ms,

CHAPTER 4. DELAY-TOLERANT UI DESIGN 96
Table 4.5: Top 10 components contain poor-responsive operations
Component Issues foundandroid.widget.Button 78android.widget.ListView 30android.widget.ImageButton 22android.widget.EditText 21android.widget.ScrollView 20android.widget.RelativeLayout 16android.widget.ImageView 13android.widget.TextView 10android.widget.LinearLayout 10android.support.v7.widget.Toolbar 7
1200 ms respectively as the thresholds for our tests.We also investigate the top-ranked components that commonly
suffer from poor responsiveness. They are shown in Table 4.5.When designing these UI components, developers must take specialcare to ensure their responsiveness.
Next, we select three representative cases to show how Pretectcontributes to delay tolerant UI design.
4.6.3 Case Study 1: YouCam
YouCam Perfect - Selfie Cam (http://www.perfectcorp.com/#ycp) is a popular selfie application. YouCam Perfect helpsusers to create better images via customized filters. The Androidapp has had more than 60 million downloads.
We apply Pretect to test Youcam Perfect, version 4.10.1. Arepresentative testing scenario is shown in the “Steps to triggerbug” section of Figure 4.11. A portion of the report generated byPretect is shown in the lower section of Figure 4.11. We test onthe cutout functionality of Youcam Perfect; this process cuts out apiece of an image and attaches it to a pre-defined template. As canbe seen from the report, the ChildProportionLayout with ID
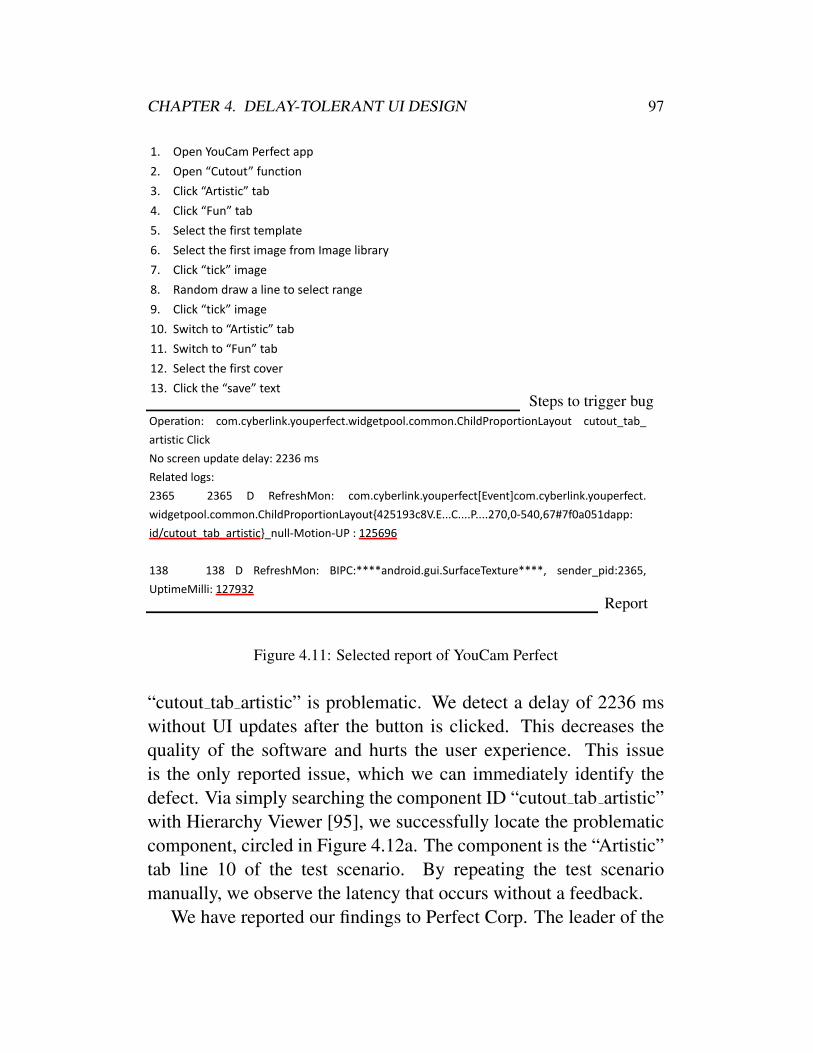
CHAPTER 4. DELAY-TOLERANT UI DESIGN 97
1. Open YouCam Perfect app 2. Open “Cutout” function 3. Click “Artistic” tab 4. Click “Fun” tab 5. Select the first template 6. Select the first image from Image library 7. Click “tick” image 8. Random draw a line to select range 9. Click “tick” image 10. Switch to “Artistic” tab 11. Switch to “Fun” tab 12. Select the first cover 13. Click the “save” text
Steps to trigger bug
Operation: com.cyberlink.youperfect.widgetpool.common.ChildProportionLayout cutout_tab_ artistic Click No screen update delay: 2236 ms Related logs: 2365 2365 D RefreshMon: com.cyberlink.youperfect[Event]com.cyberlink.youperfect. widgetpool.common.ChildProportionLayout{425193c8V.E...C....P....270,0-540,67#7f0a051dapp: id/cutout_tab_artistic}_null-Motion-UP : 125696 138 138 D RefreshMon: BIPC:****android.gui.SurfaceTexture****, sender_pid:2365, UptimeMilli: 127932
Report
Figure 4.11: Selected report of YouCam Perfect
“cutout tab artistic” is problematic. We detect a delay of 2236 mswithout UI updates after the button is clicked. This decreases thequality of the software and hurts the user experience. This issueis the only reported issue, which we can immediately identify thedefect. Via simply searching the component ID “cutout tab artistic”with Hierarchy Viewer [95], we successfully locate the problematiccomponent, circled in Figure 4.12a. The component is the “Artistic”tab line 10 of the test scenario. By repeating the test scenariomanually, we observe the latency that occurs without a feedback.
We have reported our findings to Perfect Corp. The leader of the

CHAPTER 4. DELAY-TOLERANT UI DESIGN 98
(a) Version 4.10.1 (b) Version 5.4.1
Figure 4.12: Screenshots of Youcam Perfect
YouCam Perfect development team has provided us with positivefeedback on our results: “With your hint, we find that we have useda widget which tends to be slower. We will fix as soon as possible.”In a later version of Youcam Perfect 5.4.1, the UI design has beenmodified, as shown in Figure 4.12b. A test run with Pretectshows that this modification has reduced the feedback delay to below100 ms.
4.6.4 Case Study 2: Bible Quotes
Bible Quotes (http://www.salemwebnetwork.com/) is apopular Bible app that provides verses from the Bible. Users canlookup verses in the Bible, save favorites, share quotes with others,etc. The app has had more than a million downloads on Google Play.
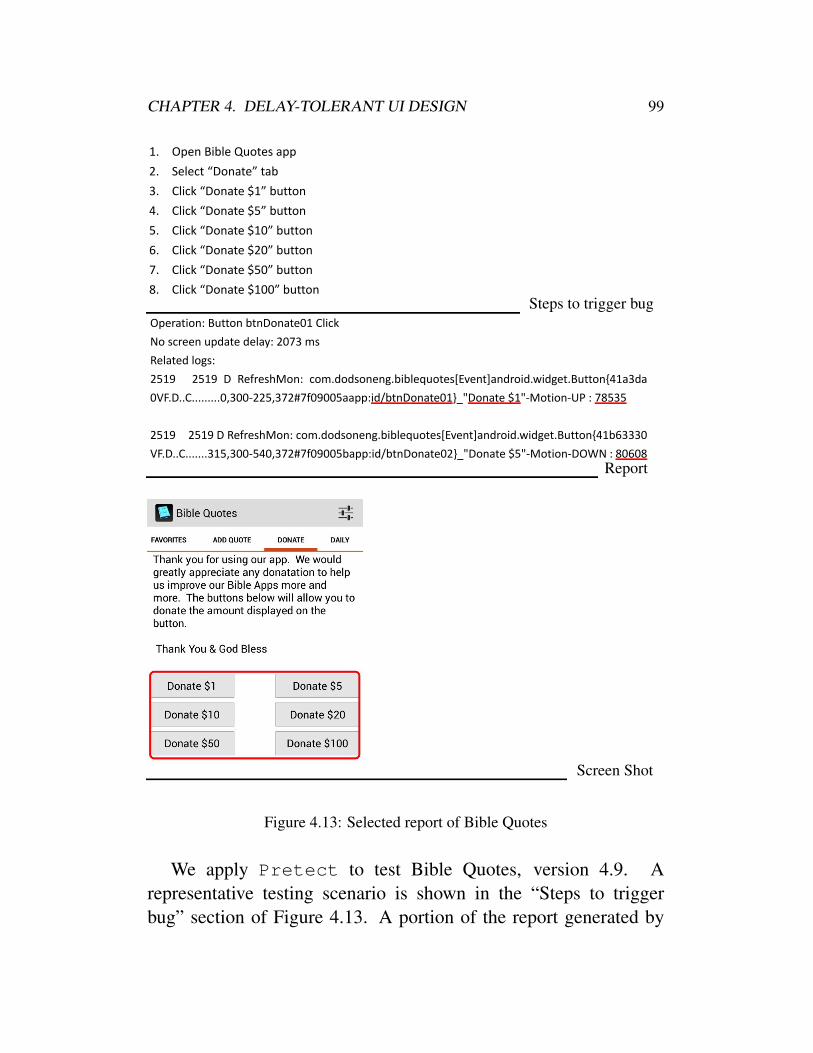
CHAPTER 4. DELAY-TOLERANT UI DESIGN 99
1. Open Bible Quotes app 2. Select “Donate” tab 3. Click “Donate $1” button 4. Click “Donate $5” button 5. Click “Donate $10” button 6. Click “Donate $20” button 7. Click “Donate $50” button 8. Click “Donate $100” button
Steps to trigger bug
Operation: Button btnDonate01 Click No screen update delay: 2073 ms Related logs: 2519 2519 D RefreshMon: com.dodsoneng.biblequotes[Event]android.widget.Button{41a3da 0VF.D..C.........0,300-225,372#7f09005aapp:id/btnDonate01}_"Donate $1"-Motion-UP : 78535 2519 2519 D RefreshMon: com.dodsoneng.biblequotes[Event]android.widget.Button{41b63330 VF.D..C.......315,300-540,372#7f09005bapp:id/btnDonate02}_"Donate $5"-Motion-DOWN : 80608
Report
Screen Shot
Figure 4.13: Selected report of Bible Quotes
We apply Pretect to test Bible Quotes, version 4.9. Arepresentative testing scenario is shown in the “Steps to triggerbug” section of Figure 4.13. A portion of the report generated by
CHAPTER 4. DELAY-TOLERANT UI DESIGN 100
Pretect is shown in the middle section of Figure 4.13. We testthe functionality of the donation process of Bible Quotes. As canbe seen from the report, the Button with ID “btnDonate01” isproblematic. Note that this is the first issue in our generated report(other issues are about other donate buttons which are similar to thisone). Via searching the component ID in Hierarchy Viewer, we im-mediately locate the button of the app. We find that there are no UIupdate-related logs generated between the time the “btnDonate01”button is clicked and the time the “btnDonate02” button is clicked(corresponding to the test scenario steps 3-4). This means that theUI does not update for more than 2 seconds after the “btnDonate01”button is clicked. This clearly decreases the quality of the app. Wefurther investigate the app to find the relevant information about theUI component. The logs reveal that the text on the button is “Donate$1”; the component is circled in the lower section of Figure 4.13.The component we are interested in is the “Donate $1” button online 3 of the test scenario.
4.6.5 Case Study 3: Illustrate
Illustrate - The Video Dictionary (http://www.mocept.com/illustrate/) is an effective app for teaching new words andtheir meanings. It provides videos with context and real-life exam-ples allowing the learner to grasp definitions and usage with ease.ICAL TEFL, a leading provider of English language courses, saysthat it is fun and will help students. The University of MichiganCampus Life News recommend it as the best app in “7 Helpful StudyApps for GRE, LSAT, and GMAT Preparation”
We apply Pretect to test Illustrate, version 1.2.7. A piece ofthe testing scenario is depicted in the upper section of Figure 4.14.Part of the report generated by Pretect is shown in the middlesection of Figure 4.14. We test the history clearing functionalityof Illustrate. As can be seen from the report, the TextView with
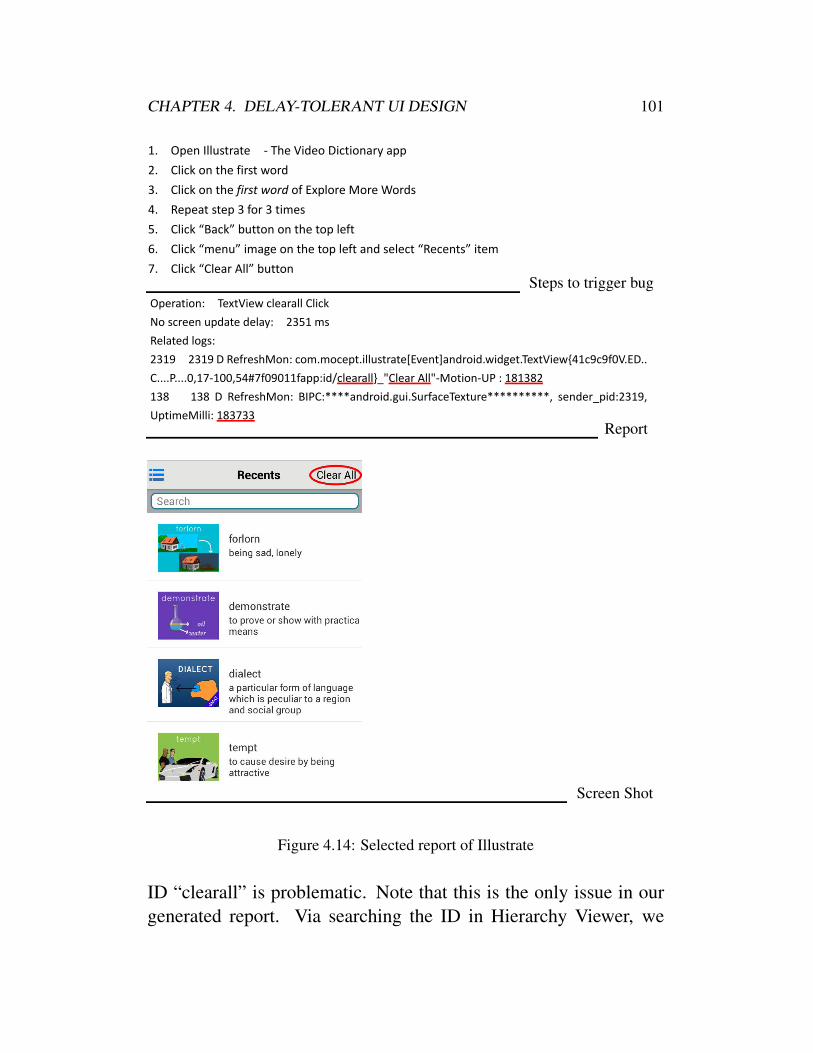
CHAPTER 4. DELAY-TOLERANT UI DESIGN 101
1. Open Illustrate - The Video Dictionary app 2. Click on the first word 3. Click on the first word of Explore More Words 4. Repeat step 3 for 3 times 5. Click “Back” button on the top left 6. Click “menu” image on the top left and select “Recents” item 7. Click “Clear All” button
Steps to trigger bug
Operation: TextView clearall Click No screen update delay: 2351 ms Related logs: 2319 2319 D RefreshMon: com.mocept.illustrate[Event]android.widget.TextView{41c9c9f0V.ED.. C....P....0,17-100,54#7f09011fapp:id/clearall}_"Clear All"-Motion-UP : 181382 138 138 D RefreshMon: BIPC:****android.gui.SurfaceTexture**********, sender_pid:2319, UptimeMilli: 183733
Report
Screen Shot
Figure 4.14: Selected report of Illustrate
ID “clearall” is problematic. Note that this is the only issue in ourgenerated report. Via searching the ID in Hierarchy Viewer, we
CHAPTER 4. DELAY-TOLERANT UI DESIGN 102
immediately locate the component. We detect a delay of 2351 mswithout UI updates after the TextView is clicked. This decreasesthe quality of the software and tests users’ patience. We furtherinvestigate the app to find the relevant information about the UIcomponent. An examination of the logs reveals that the text of theTextView is “Clear All”, which is circled in the lower section ofFigure 4.14. The component of interest is the “Clear All” button inline 7 of the test scenario. By repeating the test scenario manually,we observe the latency without feedback.
4.7 Discussions
Our user study results show that more than 500 ms delay can causethe users become impatient. To conduct the survey, we choosemost active mobile users (between 20 to 27 years old [8]) andcommon usage scenarios (e.g., video, audio, map). Users maytolerant 500 ms delay in other scenarios. Whereas, our focus ison revealing the relationship between user patience and UI latency,rather than obtaining the exact threshold of user impatience. Wehave shown in Section 4.6.2 that the threshold is just a parameterof Pretectwhich can be easily set to suit the requirement ofdevelopers.
Current approaches cannot properly detect poor-responsive op-erations. Approaches including StrictMode [90] and Asynchro-nizer [123] can detect operations that blocks the UI, but fail todetect asynchronous tasks that do not provide feedback. Otherapproaches (e.g., Appinsight [161], Panappticon [196]) define adelay as the time interval between the initiation of an operationand the completion of all of the triggered tasks. These approachesaim to detect the abnormal execution of asynchronous tasks ratherthan feedback delay. In such cases, using Pretect to detectfeedback delay is a better approach to improving the responsivenessof UI design. Moreover, these approaches may report some long-

CHAPTER 4. DELAY-TOLERANT UI DESIGN 103
term background tasks (e.g., download) as suspicious, as a result offocusing on the life cycle of the tasks. However, this kind of taskdoes not update the display when finished. They are less relevantto the responsiveness. In comparison, Pretect pays attention towhether the app notifies the users that the operations that will triggerthe background tasks have been accepted.
The screen refreshes even when the app UI does not update, asthe action bar on the top of the screen also refreshes. However,the action bar is not our focus. Therefore, intercepting low levelsystem functions related to full screen display refresh such aseglSwapBuffers in /system/lib/libsurfaceflinger.so is not a goodchoice. We further inspect the related screen update procedure andfind binder used in the process. We then intercept binder andmeasure the screen update time of the app more precisely with thelogged pid.
Even with the action bar updates filtered out, we are not guar-anteed to obtain the right user intended UI update after one useroperation. Because UI updates triggered by periodical updating,advertisement banners, or previous long-processed tasks may affectour detection on first UI updating after user operation. As validatedin Section 4.6.1, cases reported by Pretect, the first tool fordetecting poor-responsive operations, are all poor-responsive thatneed to be taken care with. The improvement of false-negative ratecould be leave as our future work. A possible solution is to study theuser concentration and app design to understand the user intended UIupdate after a user operation.
4.8 Summary
In this chapter, we discuss the problem of responsive UI designin Android apps. We motivate the problem of detecting poor-responsive operations by conducting a user survey. The survey re-sults show that users’ patience is correlated with UI responsiveness.

CHAPTER 4. DELAY-TOLERANT UI DESIGN 104
We design and implement a tool called Pretect that can detectpoor-responsive operations. The tool is shown to work correctly onsynthetic benchmarks and on open source apps. We further verifyPretect with real-world case studies. The results demonstrate theeffectiveness of Pretect.
2 End of chapter.

Chapter 5
Deployment of Single Cloud Service
Single Service Deploy
Making optimal server deployment of cloud services iscritical for providing good performance to attract users.The key to making optimal deployment is to know the userexperience of end users. With such knowledge, we thenmodel and solve the optimal deployment problem. We listthe points of this chapter as:
• Propose a framework to model cloud features andcapture user experience.
• Formulate the optimal service deployment consideringuser experience; propose approximation algorithms.
• Evaluate the proposed model solving method on real-world dataset; public release the dataset and simulationcode for repeatable experiments.
105

CHAPTER 5. DEPLOYMENT OF SINGLE CLOUD SERVICE 106
5.1 Background and Motivation
In cloud computing systems, computation, software, and data accesscan be delivered as services located in data centers distributed overthe world [39, 155]. Typically, these services are deployed oninstances (e.g., virtual machine instances) in the cloud data cen-ters. Recently, numerous systems have been implemented with thecloud computing paradigm (e.g., Amazon Elastic Compute Cloud(EC2) [5]).
In the emerging cloud computing systems, auto scaling andelastic load balance are keys to host the cloud services. Auto scalingenables a dynamic allocation of computing resources to a particularapplication. In other words, the number of service instances canbe dynamically tailored to the request load. For example, EC2can automatically launch or terminate a virtual machine instancefor an EC2 application based on user-defined policies (e.g., CPUusage) [4]. Elastic load balance distributes and balances the in-coming application traffic (i.e., the user requests) among the serviceinstances (e.g., the virtual machine instances in EC2 [13]).
Auto scaling and elastic load balance directly influence theInternet connections between the end users and the services asthey essentially determine the available service instance for an enduser. Hence, they are important to the user experience of serviceperformance.
Unfortunately, current auto scaling and elastic load balancetechniques are not usually optimized for achieving best serviceperformance. Specifically, typical auto scaling approaches (e.g., thatadopted in EC2 [4]) cannot start or terminate a service instance atthe data center which is selected according to the distributions ofthe end users. For example, when the number of users increasesdramatically in an area, a new instance located far away, insteadof nearby, may be activated for serving the users. Furthermore,elastic load balance generally redirects user requests to the service

CHAPTER 5. DEPLOYMENT OF SINGLE CLOUD SERVICE 107
instances merely based on loads of the instances. It does not take theuser specifics (e.g., user location) into considerations. As a result, auser may be directed to a service instance far away even if there isanother available service instance nearby.
In this chapter, we model the features of user experience mainlyby latency (other features can be extended in the framework) incloud service. After that we address these issues by proposing a newuser experience-based service hosting mechanism. Our mechanismemploys a service redeployment method. This method has twoadvantages:
1. It improves current auto scaling techniques by launching thebest set of service instances according to the distributions ofend users.
2. It extends elastic load balance. Instead of directing the userrequest to the lightest load service instance, it directs userrequest to a nearby one.
The prerequisite of such a service hosting mechanism is toknow the user experience of a potential service instance, beforewe choose to activate the instance and deliver the user requeststo it. This is quite a challenging task, as there is generally noproactive connection between a user and the machine that will hostthe service instance. Measuring the user experience beforehand ishence impossible. We notice that the user experience of a cloudservice depends heavily on the communication delay between theend user and the service instance the user accesses, which is mainlycaused by the Internet delay between the user and the data centerhosting the instance. We therefore propose a viable method toconveniently measure and predict such an Internet delay.
With the predicted user experiences, the service hosting problemis essentially how to redeploy a set of data centers for hostingthe service instances, while guaranteeing the user experience forfrequent users. We formulate it as a k-median problem and a
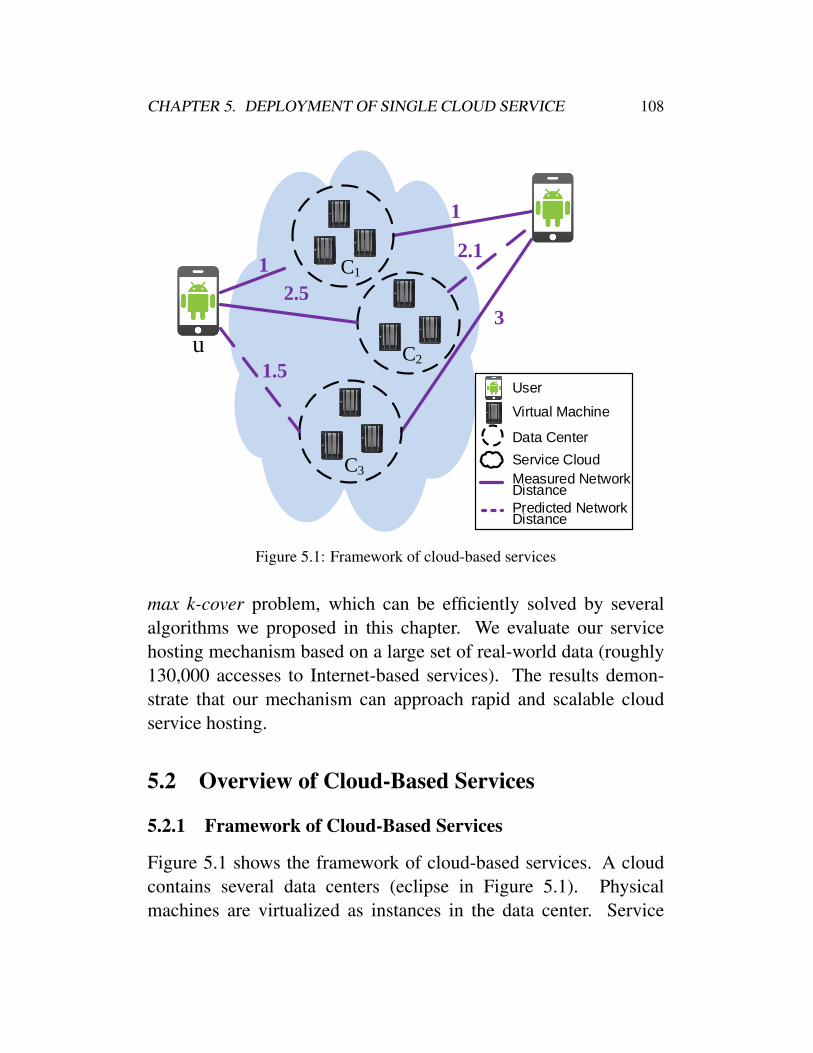
CHAPTER 5. DEPLOYMENT OF SINGLE CLOUD SERVICE 108
Virtual Machine
User
Data Center
u
Service CloudC3
C2
C11
2.5
Measured Network Distance
1.5
Predicted Network Distance
1
3
2.1
Figure 5.1: Framework of cloud-based services
max k-cover problem, which can be efficiently solved by severalalgorithms we proposed in this chapter. We evaluate our servicehosting mechanism based on a large set of real-world data (roughly130,000 accesses to Internet-based services). The results demon-strate that our mechanism can approach rapid and scalable cloudservice hosting.
5.2 Overview of Cloud-Based Services
5.2.1 Framework of Cloud-Based Services
Figure 5.1 shows the framework of cloud-based services. A cloudcontains several data centers (eclipse in Figure 5.1). Physicalmachines are virtualized as instances in the data center. Service

CHAPTER 5. DEPLOYMENT OF SINGLE CLOUD SERVICE 109
providers would deploy service running on these instances. An enduser normally connects to the cloud to get data and run applica-tions/services. User requests are directed to the service instances.
A good example is the Chrome OS developed by Google. Viasuch kind of light client, the end user can access data as well asapplication logic provided by the cloud as services.
Since the instances are inside the cloud, the connection infor-mation especially Round Trip Time (RTT) between a user and aninstance can be maintained by the cloud provider. The solid linesin Figure 5.1 represent RTT information being recorded between auser and some instances. Some links are not used thus the relatedRTT information is missing. We can derive new methods to predictthese values. Dash lines in Figure 5.1 stand for this situation.
Generally user experience contains three elements: the Internetdelay between user and cloud data center, the delay inside a datacenter in the cloud, and the time to handle the service request. Asmachines in a data center are typically connected by gigabit links,delay inside a data center can be ignored. Moreover, the time tohandle the service requests is only affected by the computing abilityof a service instance. As a result, the processing time is almost thesame for two service instances. Hence, the user experience is mainlydetermined by the Internet delay.
5.2.2 Challenges of Hosting the Cloud Services
In order to attract users by low latency, service providers areconcerning about where to deploy service instances in the cloud.The challenge of hosting the cloud service in the cloud comes fromthe difficulties of foreseeing user experience before actually runningthe service. So normally redeployment is required after knowing thedistributions of users better.
After the service operating for a period, the Internet delaybetween users and every cloud data center can either be measured

CHAPTER 5. DEPLOYMENT OF SINGLE CLOUD SERVICE 110
or be predicted. We describe this in Section 5.3. This means in thecloud we can obtain all information regarding the potential positionsfor deploying service instances, while many existing computinginfrastructures such as Internet services do not have such a feature.All the information is organized as a distance matrix. An element inthe matrix is the distance value between a user and a data center.
Moreover, we notice the fact that the number of data centers islimited, while there is no bound on the number of services. So thereare multiple services deployed in the data centers of a cloud. Thisfact suggests that we can use this measurement for optimizing anyservice in the cloud.
Consequently, we employ a distance matrix to formulate theredeployment problem as a k-median problem in Section 5.4.1.However, we have not taken the limitation of resource for a singleservice instance into consideration. Another model of max k-coverproblem is engaged to deal with this limitation and to make themodel more realistic. We discuss this formulation in Section 5.4.2.Through solving these problems we can redeploy the service in-stances intelligently.
The fact is that the physical machines are not required to migratewhen redeploying service instances in the cloud. Generally we storethe data of a service instance in the cloud storage and to redeploythe instance we could load the image to another machine in thecloud. If the new service instance for redeploying lies in anotherdata center of the original one, the loading overhead is huge and thisis usually the case. Since the major part of the users does not varyfrequently, we defeat this problem by running our redeploymentapproach periodically (the period can be set long such as one ortwo days). Another method is to redeploy the service instances oneby one. Then when one instance is under redeploying the otherinstances could take over the users connecting to the instance andsplit the workload.

CHAPTER 5. DEPLOYMENT OF SINGLE CLOUD SERVICE 111
5.3 Obtaining User Experience
5.3.1 Measure the Internet Delay
A user request of service in the cloud is responded by an instanceinside the cloud. Therefore the cloud provider is able to record theround trip time (RTT) from the user to the instance. This RTT valueis kept as the distance dij from the user i to the data center j as thedelay inside a data center can be ignored. The user generally callsseveral services and the related service instances are distributed indifferent data centers throughout the cloud. As a result, we can getplenty of distance values between different users and data centers.
5.3.2 Predict the Internet Delay
A user may not get a response from VM instances deployed in everydata center. Therefore we cannot get distance data between each userand every data center directly which means the measured distancematrix is quite sparse. We call it a missing value if the distancedij between a pair of user and data center (i, j) is not available.The task is to fill in the missing values in the distance matrix. Thetechnique given in [131] can be used to predict the missing values.The idea goes as the following. Some users may come from thesame place and use the network infrastructure of the same provider,thus their network performance is similar. We can examine theexisting values to find these similar users of user i. In the computing,Pearson Correlation Coefficient is employed to define the similaritybetween two users based on the distance to data centers they visitedin common. As these similar users may get the response from datacenter j already, we combine distance values between similar usersand data center j intelligently to predict the missing distance valuedij between the pair of user and data center (i, j). Technical detailscan be found in the work [131].
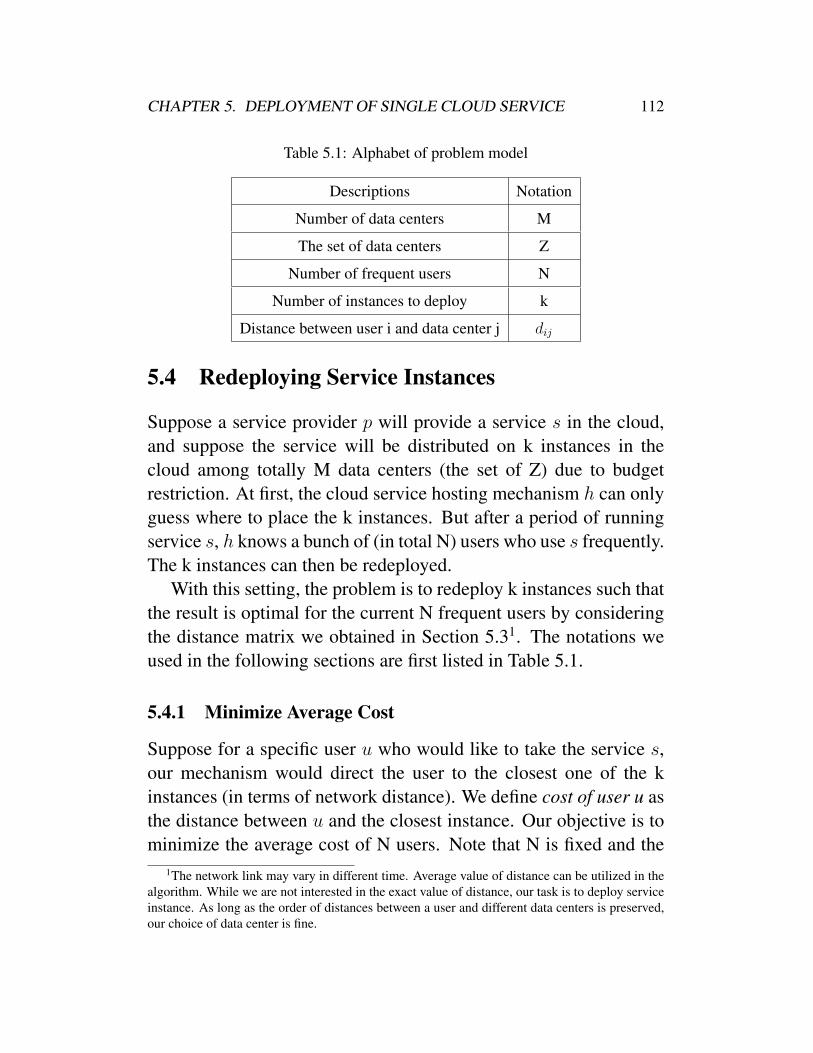
CHAPTER 5. DEPLOYMENT OF SINGLE CLOUD SERVICE 112
Table 5.1: Alphabet of problem model
Descriptions Notation
Number of data centers M
The set of data centers Z
Number of frequent users N
Number of instances to deploy k
Distance between user i and data center j dij
5.4 Redeploying Service Instances
Suppose a service provider p will provide a service s in the cloud,and suppose the service will be distributed on k instances in thecloud among totally M data centers (the set of Z) due to budgetrestriction. At first, the cloud service hosting mechanism h can onlyguess where to place the k instances. But after a period of runningservice s, h knows a bunch of (in total N) users who use s frequently.The k instances can then be redeployed.
With this setting, the problem is to redeploy k instances such thatthe result is optimal for the current N frequent users by consideringthe distance matrix we obtained in Section 5.31. The notations weused in the following sections are first listed in Table 5.1.
5.4.1 Minimize Average Cost
Suppose for a specific user u who would like to take the service s,our mechanism would direct the user to the closest one of the kinstances (in terms of network distance). We define cost of user u asthe distance between u and the closest instance. Our objective is tominimize the average cost of N users. Note that N is fixed and the
1The network link may vary in different time. Average value of distance can be utilized in thealgorithm. While we are not interested in the exact value of distance, our task is to deploy serviceinstance. As long as the order of distances between a user and different data centers is preserved,our choice of data center is fine.

CHAPTER 5. DEPLOYMENT OF SINGLE CLOUD SERVICE 113
target is equivalent to minimize the total cost.We formulate this problem as the followings:GivenZ = the set of data centersC = the set of usersdij = distance between every pair i, j ∈ C × ZMinimize:
N∑i=1
minj∈Z ′{dij}
Subject to:
Z ′ ⊂ Z
|Z ′| = k
This is exactly the well known k-median problem, which is NP-hard. So we resort to the following fast approximation algorithms.
Brute Force
In a small scale (e.g., select 3 instances from M potential datacenters), it is possible to list all combinations. We call this bruteforce algorithm in our experiment in Section 5.5. The complexity ofthis algorithm is O(Mk ·N), where M, N and k follow the definitionin Table 5.1. If k is small, it can be calculated in reasonable time.
Greedy Algorithm
Greedy algorithm runs as follows. Suppose we would choose kamong M data centers to deploy the instances. In the first iteration,we evaluate each of M data centers individually to determine whichone is the best to be chosen first. We compute the average distancefrom each data center to all users. The one achieving the smallestaverage cost will be chosen. In the second iteration, we search fora second data center. Together with the first data center we have
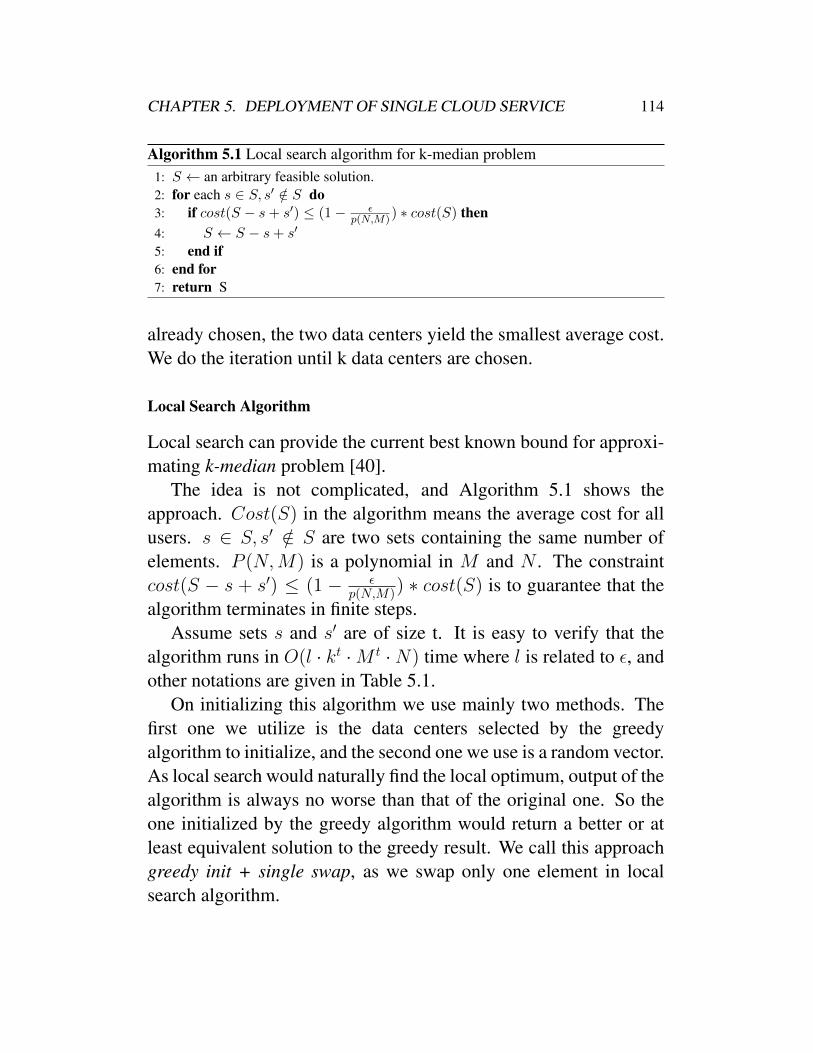
CHAPTER 5. DEPLOYMENT OF SINGLE CLOUD SERVICE 114
Algorithm 5.1 Local search algorithm for k-median problem1: S ← an arbitrary feasible solution.2: for each s ∈ S, s′ /∈ S do3: if cost(S − s+ s′) ≤ (1− ε
p(N,M)) ∗ cost(S) then4: S ← S − s+ s′
5: end if6: end for7: return S
already chosen, the two data centers yield the smallest average cost.We do the iteration until k data centers are chosen.
Local Search Algorithm
Local search can provide the current best known bound for approxi-mating k-median problem [40].
The idea is not complicated, and Algorithm 5.1 shows theapproach. Cost(S) in the algorithm means the average cost for allusers. s ∈ S, s′ /∈ S are two sets containing the same number ofelements. P (N,M) is a polynomial in M and N . The constraintcost(S − s + s′) ≤ (1 − ε
p(N,M)) ∗ cost(S) is to guarantee that thealgorithm terminates in finite steps.
Assume sets s and s′ are of size t. It is easy to verify that thealgorithm runs in O(l · kt ·M t ·N) time where l is related to ε, andother notations are given in Table 5.1.
On initializing this algorithm we use mainly two methods. Thefirst one we utilize is the data centers selected by the greedyalgorithm to initialize, and the second one we use is a random vector.As local search would naturally find the local optimum, output of thealgorithm is always no worse than that of the original one. So theone initialized by the greedy algorithm would return a better or atleast equivalent solution to the greedy result. We call this approachgreedy init + single swap, as we swap only one element in localsearch algorithm.

CHAPTER 5. DEPLOYMENT OF SINGLE CLOUD SERVICE 115
Random Selection Algorithm
Random selection algorithm would randomly choose k out of Mdata centers with equal probability. Every data center has the samepossibility to be chosen. This is a simple algorithm. Generally themethod to improve the performance of a random selection algorithmis to run it multiple times. The purpose of this algorithm is todesignate it as a base line of performance. So instead of runningrandom selection algorithm at fixed times, we determine the timesof running dynamically. For example, if we would like to knowhow good the greedy algorithm is in terms of time complexityand approximation rate, we would use a dynamic random selectionalgorithm for comparison. We record the run time of the greedyalgorithm Tgreedy and launch the random selection algorithm runningseveral times with the total running time roughly equal to Tgreedy.Consequently we could compare either their relative performance tothe optimal choice or their average distance to all users directly. Ifthe result is comparable then we argue that the greedy algorithm isnot a good algorithm as its performance is no better than the randomselection algorithm while the approach is more complicated, andvice versa.
In our experiment we also use the random algorithm to evaluatethe local search algorithm.
5.4.2 Maximize Amount of Satisfiable Users
In the previous section, we set our target to minimize the averagecost of all users. Through later experiments we confirm the greedyinit + single swap algorithm is good enough in terms of bothresult and time complexity to solve the k-median problem. Thismakes the redeployment simple; however, there is a limitation ofthe k-median model. Recall on formulating redeployment in the k-median problem we have assumed users are evenly distributed andall users can request service from their nearest service instance. In

CHAPTER 5. DEPLOYMENT OF SINGLE CLOUD SERVICE 116
practice, this condition does not always hold. All the users requestto the nearest service instance would cause some service instancesoverload in real world cases.
It is reasonable to think that we are deploying the instances inthe cloud and the cloud has virtually infinite resource. However, inreality we only get limited budget and we can only launch limited(say, k) instances in the cloud. If we want to ease the burden ofsome overload instances, we are required to put some extra instancesin the same data centers. As a result, we usually distribute serviceinstances in k′ (where k′ < k) data centers.
Moreover, in some cases part of the users may be extremely faraway from most of the data centers. While considering minimizingthe average cost, these users have a tendency to force some serviceinstances deployed in the data center close to them. This kindof users is called outlier in [56]. Though the model of k-medianproblem with outliers in [56] can successfully deal with outliers, ithas two drawbacks. First, it does not suit for the huge amount ofdata (i.e., thousands of users and hundreds of candidate locations).Second, it does not limit the number of users a service instance canserve. So in this model some instances may overload.
In this chapter we employ another model to deal with the outliersand the service overload problem. On considering QoS of a service,we believe it is unacceptable if some responses take a very longtime. In this model we set a threshold value T for the response time.We try several values of the proper threshold in our experiment. Ifsome dij > T , we drop this link by considering it disconnected.Moreover, to simplify the problem, we assume the user accepts theservice as long as the response time is shorter than the threshold.Overall, our target is to determine k instances that satisfy as manyusers as possible. Our mechanism can be extended to direct the userto a light load and close enough but not necessary the closest serviceinstance.
To model this situation, consider following problem:

CHAPTER 5. DEPLOYMENT OF SINGLE CLOUD SERVICE 117
Given Bipartite graph B(V1, V2, E) where
|V1| =M|V2| = N
i ∈ V1, j ∈ V2{(i, j) ∈ E, dij ≤ T ;(i, j) /∈ E, otherwise.
Maximize:|NB(V
′)|Subject to:
V ′ ⊂ V1|V ′| = k
|NB(V′)| is the number of nodes in the neighbor set of V’,
meaning the target is to choose a subset of V1 to cover as manyvertices in V2 as possible. Actually it is a max k-cover problem.
In this problem we construct M sets by setting i to be the ithvertex in V1 and the elements in this set are vertices connected toi in V2. We are trying to find k-sets to cover as many elements aspossible.
Max k-cover problem is a classical problem and is well studied.This problem is NP hard hence we do not expect to achieve theexact answer. Again we use approximate algorithms. Greedyalgorithm (Algorithm 5.2) is proven to be one of the best polynomialtime algorithms for this problem [76]. It could give a (1 − 1/e)approximation, which means it could cover at least (1− 1/e) of themaximum elements k-sets could cover.
In the greedy algorithm, every round we find a data center swhich, when combined with current selection set S, could cover themaximum users. There may be more than one such data centers. InAlgorithm 5.2 we choose one of them randomly. It can also be donemore precisely as we can use a stack to record and try all choices one

CHAPTER 5. DEPLOYMENT OF SINGLE CLOUD SERVICE 118
Algorithm 5.2 Greedy algorithm for max k-cover problem1: S ← φ.2: while Have not covered all users yet & Used less than k instances do3: maxcover ← 04: clear list l5: for all data centers s do6: if use s could cover c > maxcover more users than use instances in S then7: clear list l8: add s to l9: maxcover ← c
10: else if use s could cover exactly maxcover more users than use instances in Sthen
11: add s to l12: end if13: end for14: random select s from l15: S ← S + s16: (random eliminate limit users in cover list of s if s covers more than limit users)17: end while18: return S
by one. However, we find that with the growing of k, the amount ofbranches increases so fast that the reward quickly diminishes. So wedo not include this implementation in this chapter.
Moreover this model as well as the algorithm can be easilymodified to direct the user to a light load and close enough but notnecessary the closest service instance. This can be done by restrict-ing the number of users to whom an instance can be connected.To modify the formulation, we can add a constraint |NB(u)| <=limit,∀u ∈ V ′ after |V ′| = k, where limit is the number of usersan instance can connect to. As for the Algorithm 5.2, in line 15,instead of S ← S + s we consider the integer limit. If s covers≥ limit more users, we randomly pick up limit number of users tocover. Moreover, if s covers ≥ limit users we would force to set itas covering = limit users (Line 16). By these changes, we can limitthe connections and select a data center to deploy multiple instancesif needed. This constraint can make the model more realistic. Wecall this algorithm modified algorithm.
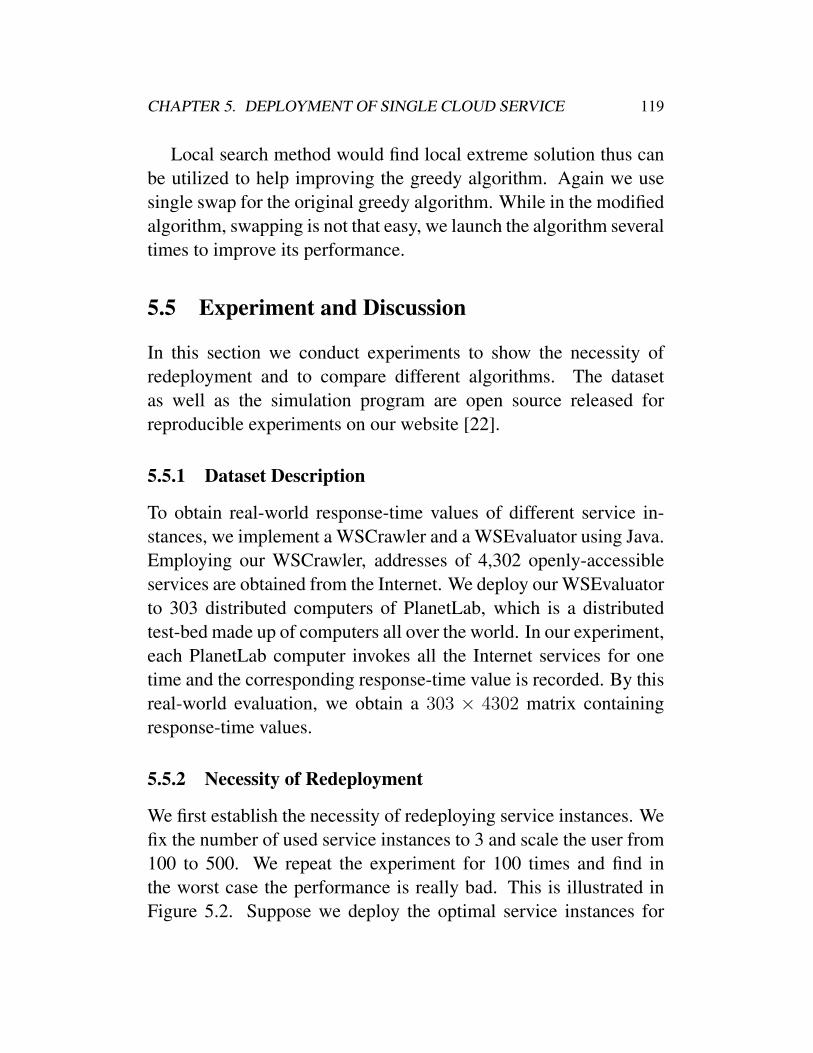
CHAPTER 5. DEPLOYMENT OF SINGLE CLOUD SERVICE 119
Local search method would find local extreme solution thus canbe utilized to help improving the greedy algorithm. Again we usesingle swap for the original greedy algorithm. While in the modifiedalgorithm, swapping is not that easy, we launch the algorithm severaltimes to improve its performance.
5.5 Experiment and Discussion
In this section we conduct experiments to show the necessity ofredeployment and to compare different algorithms. The datasetas well as the simulation program are open source released forreproducible experiments on our website [22].
5.5.1 Dataset Description
To obtain real-world response-time values of different service in-stances, we implement a WSCrawler and a WSEvaluator using Java.Employing our WSCrawler, addresses of 4,302 openly-accessibleservices are obtained from the Internet. We deploy our WSEvaluatorto 303 distributed computers of PlanetLab, which is a distributedtest-bed made up of computers all over the world. In our experiment,each PlanetLab computer invokes all the Internet services for onetime and the corresponding response-time value is recorded. By thisreal-world evaluation, we obtain a 303 × 4302 matrix containingresponse-time values.
5.5.2 Necessity of Redeployment
We first establish the necessity of redeploying service instances. Wefix the number of used service instances to 3 and scale the user from100 to 500. We repeat the experiment for 100 times and find inthe worst case the performance is really bad. This is illustrated inFigure 5.2. Suppose we deploy the optimal service instances for
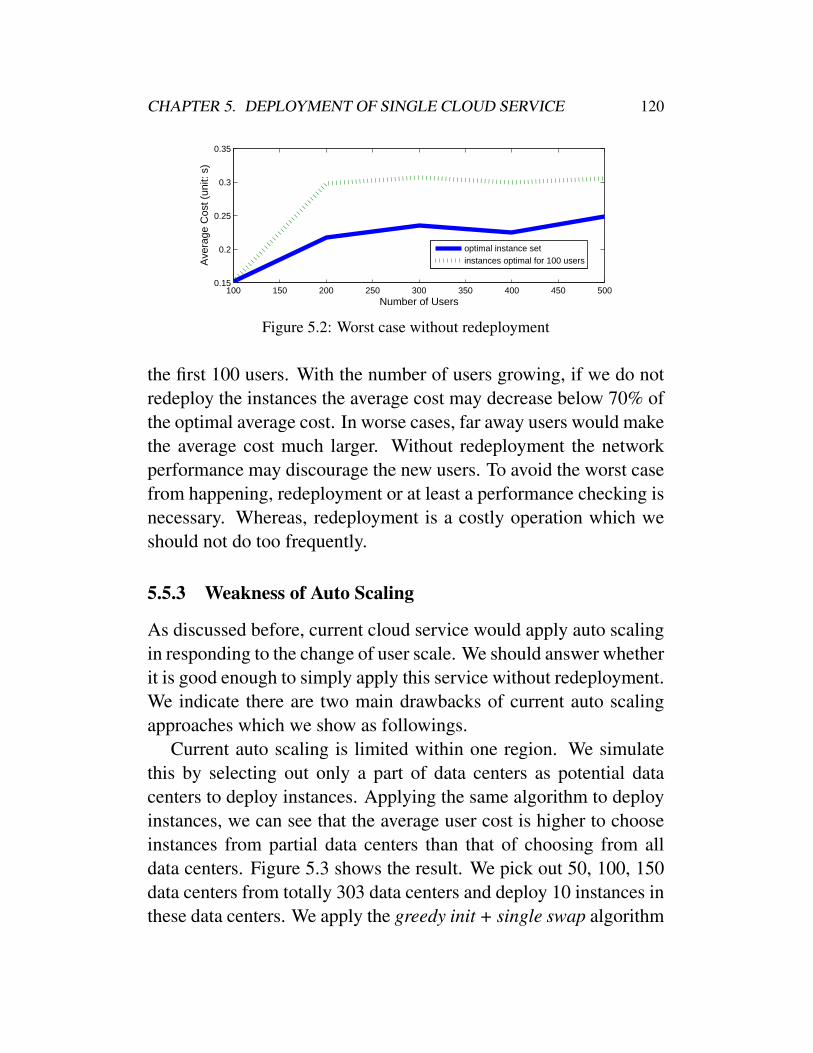
CHAPTER 5. DEPLOYMENT OF SINGLE CLOUD SERVICE 120
100 150 200 250 300 350 400 450 5000.15
0.2
0.25
0.3
0.35
Number of Users
Ave
rage
Cos
t (un
it: s
)
optimal instance setinstances optimal for 100 users
Figure 5.2: Worst case without redeployment
the first 100 users. With the number of users growing, if we do notredeploy the instances the average cost may decrease below 70% ofthe optimal average cost. In worse cases, far away users would makethe average cost much larger. Without redeployment the networkperformance may discourage the new users. To avoid the worst casefrom happening, redeployment or at least a performance checking isnecessary. Whereas, redeployment is a costly operation which weshould not do too frequently.
5.5.3 Weakness of Auto Scaling
As discussed before, current cloud service would apply auto scalingin responding to the change of user scale. We should answer whetherit is good enough to simply apply this service without redeployment.We indicate there are two main drawbacks of current auto scalingapproaches which we show as followings.
Current auto scaling is limited within one region. We simulatethis by selecting out only a part of data centers as potential datacenters to deploy instances. Applying the same algorithm to deployinstances, we can see that the average user cost is higher to chooseinstances from partial data centers than that of choosing from alldata centers. Figure 5.3 shows the result. We pick out 50, 100, 150data centers from totally 303 data centers and deploy 10 instances inthese data centers. We apply the greedy init + single swap algorithm

CHAPTER 5. DEPLOYMENT OF SINGLE CLOUD SERVICE 121
500 1000 1500 2000 2500 3000 3500 40000.1
0.11
0.12
0.13
0.14
Number of Users
Ave
rage
Cos
t (un
it: s
)
optimal server instances50 potential data centers100 potential data centers150 potential datacenters
Figure 5.3: Deploy in limited data centers
0 500 1000 1500 2000 2500 3000 3500 40000.05
0.1
0.15
0.2
0.25
0.3
0.35
0.4
Number of users
Ave
rage
co
st (u
nit :
s)
optimal instancesrandom scaling from 1 optimal instancerandom scaling from 3 optimal instancesgreedy scaling
Figure 5.4: Auto scaling algorithms
and the result of using total 303 potential data centers is employed asthe baseline. The performance decreases greatly if we choose only50 potential data centers. Moreover, we find the performance is notaffected much by the number of users. Note the distance betweenusers and data centers is better preserved if we choose 100 (33%)or more from the total data centers, and thus the performance getsgreatly improved in these cases. It is due to the fact that there areseveral data centers which are close to many users. The averagedistance would decrease greatly if we could pick up these datacenters.
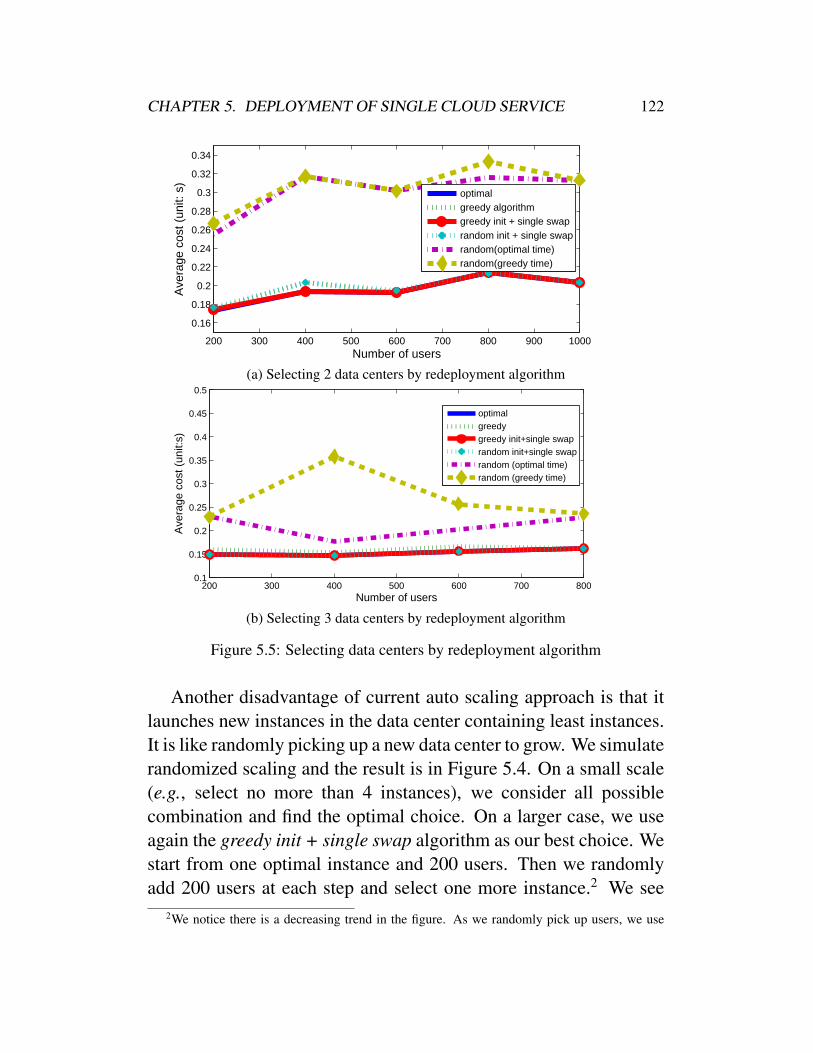
CHAPTER 5. DEPLOYMENT OF SINGLE CLOUD SERVICE 122
200 300 400 500 600 700 800 900 1000
0.16
0.18
0.2
0.22
0.24
0.26
0.28
0.3
0.32
0.34
Number of users
Ave
rage
cos
t (un
it: s
)
optimalgreedy algorithmgreedy init + single swaprandom init + single swaprandom(optimal time)random(greedy time)
(a) Selecting 2 data centers by redeployment algorithm
200 300 400 500 600 700 8000.1
0.15
0.2
0.25
0.3
0.35
0.4
0.45
0.5
Number of users
Ave
rage
cos
t (un
it:s)
optimalgreedygreedy init+single swaprandom init+single swaprandom (optimal time)random (greedy time)
(b) Selecting 3 data centers by redeployment algorithm
Figure 5.5: Selecting data centers by redeployment algorithm
Another disadvantage of current auto scaling approach is that itlaunches new instances in the data center containing least instances.It is like randomly picking up a new data center to grow. We simulaterandomized scaling and the result is in Figure 5.4. On a small scale(e.g., select no more than 4 instances), we consider all possiblecombination and find the optimal choice. On a larger case, we useagain the greedy init + single swap algorithm as our best choice. Westart from one optimal instance and 200 users. Then we randomlyadd 200 users at each step and select one more instance.2 We see
2We notice there is a decreasing trend in the figure. As we randomly pick up users, we use
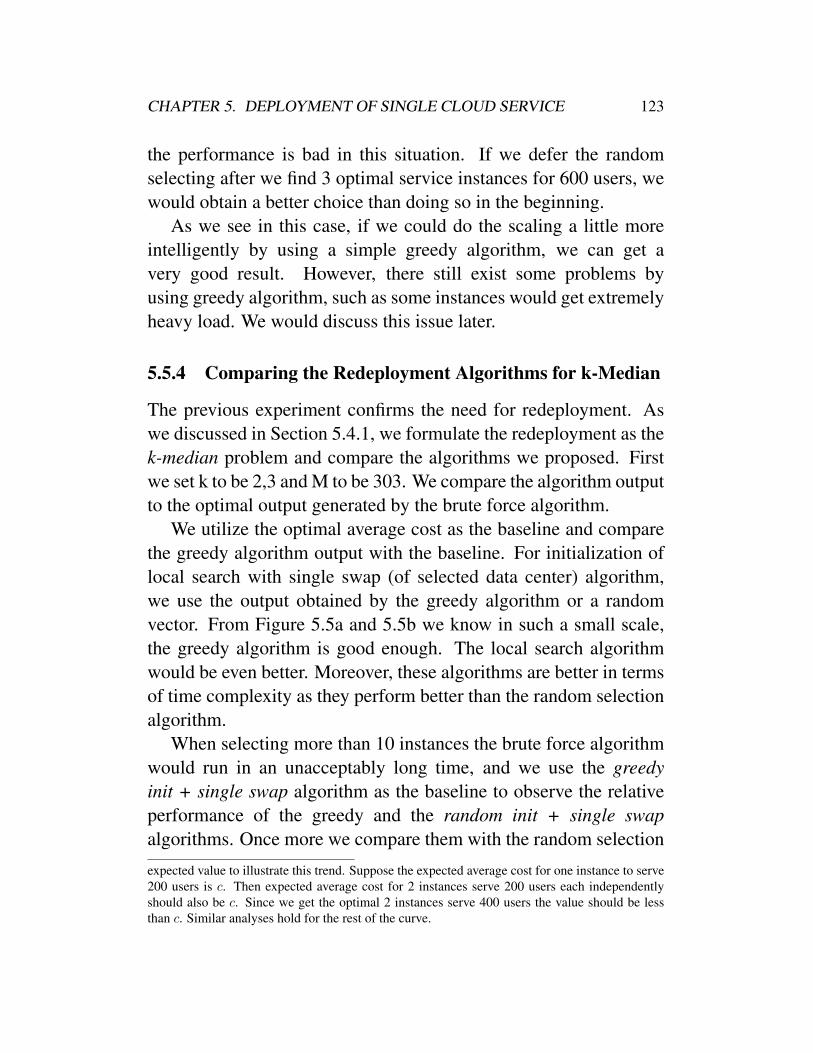
CHAPTER 5. DEPLOYMENT OF SINGLE CLOUD SERVICE 123
the performance is bad in this situation. If we defer the randomselecting after we find 3 optimal service instances for 600 users, wewould obtain a better choice than doing so in the beginning.
As we see in this case, if we could do the scaling a little moreintelligently by using a simple greedy algorithm, we can get avery good result. However, there still exist some problems byusing greedy algorithm, such as some instances would get extremelyheavy load. We would discuss this issue later.
5.5.4 Comparing the Redeployment Algorithms for k-Median
The previous experiment confirms the need for redeployment. Aswe discussed in Section 5.4.1, we formulate the redeployment as thek-median problem and compare the algorithms we proposed. Firstwe set k to be 2,3 and M to be 303. We compare the algorithm outputto the optimal output generated by the brute force algorithm.
We utilize the optimal average cost as the baseline and comparethe greedy algorithm output with the baseline. For initialization oflocal search with single swap (of selected data center) algorithm,we use the output obtained by the greedy algorithm or a randomvector. From Figure 5.5a and 5.5b we know in such a small scale,the greedy algorithm is good enough. The local search algorithmwould be even better. Moreover, these algorithms are better in termsof time complexity as they perform better than the random selectionalgorithm.
When selecting more than 10 instances the brute force algorithmwould run in an unacceptably long time, and we use the greedyinit + single swap algorithm as the baseline to observe the relativeperformance of the greedy and the random init + single swapalgorithms. Once more we compare them with the random selection
expected value to illustrate this trend. Suppose the expected average cost for one instance to serve200 users is c. Then expected average cost for 2 instances serve 200 users each independentlyshould also be c. Since we get the optimal 2 instances serve 400 users the value should be lessthan c. Similar analyses hold for the rest of the curve.
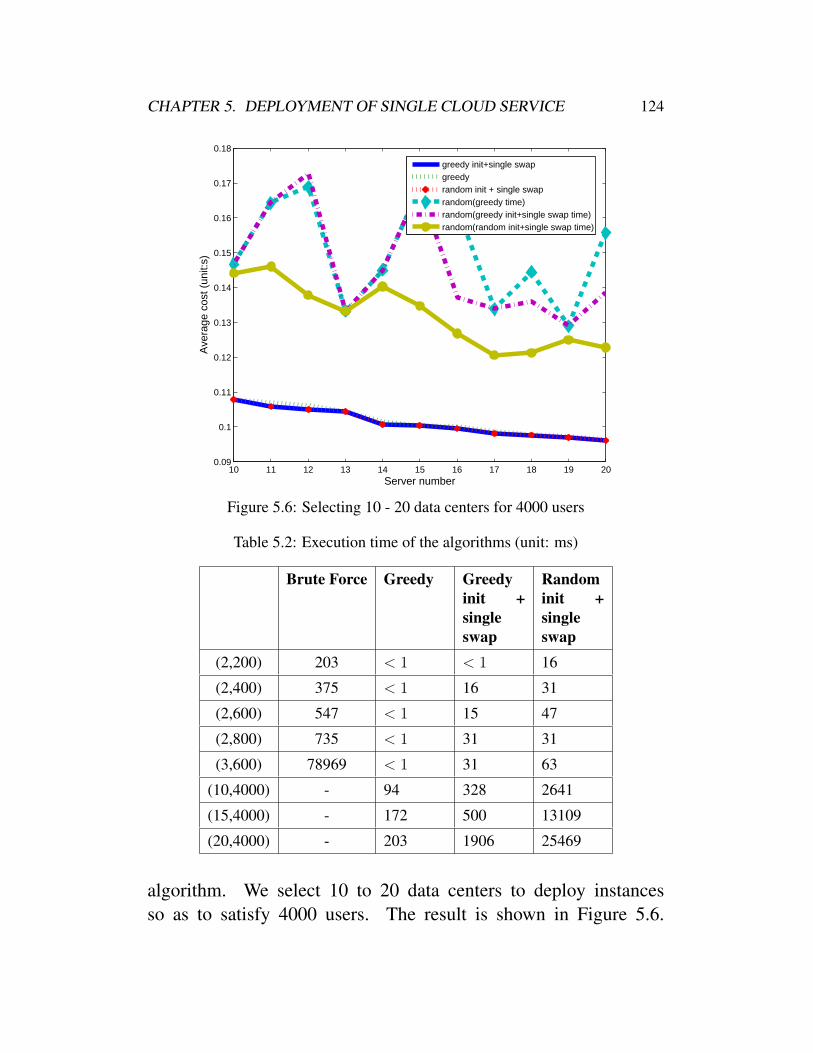
CHAPTER 5. DEPLOYMENT OF SINGLE CLOUD SERVICE 124
10 11 12 13 14 15 16 17 18 19 200.09
0.1
0.11
0.12
0.13
0.14
0.15
0.16
0.17
0.18
Server number
Ave
rage
cos
t (un
it:s)
greedy init+single swapgreedyrandom init + single swaprandom(greedy time)random(greedy init+single swap time)random(random init+single swap time)
Figure 5.6: Selecting 10 - 20 data centers for 4000 users
Table 5.2: Execution time of the algorithms (unit: ms)
Brute Force Greedy Greedyinit +singleswap
Randominit +singleswap
(2,200) 203 < 1 < 1 16
(2,400) 375 < 1 16 31
(2,600) 547 < 1 15 47
(2,800) 735 < 1 31 31
(3,600) 78969 < 1 31 63
(10,4000) - 94 328 2641
(15,4000) - 172 500 13109
(20,4000) - 203 1906 25469
algorithm. We select 10 to 20 data centers to deploy instancesso as to satisfy 4000 users. The result is shown in Figure 5.6.
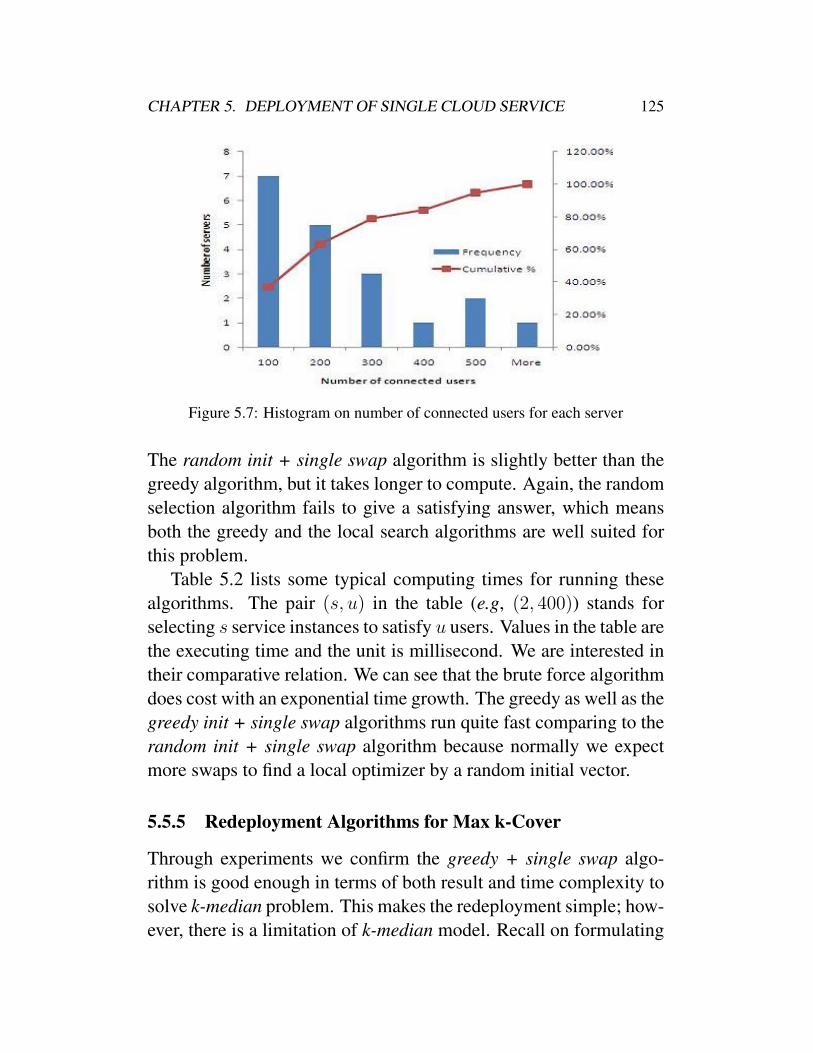
CHAPTER 5. DEPLOYMENT OF SINGLE CLOUD SERVICE 125
Figure 5.7: Histogram on number of connected users for each server
The random init + single swap algorithm is slightly better than thegreedy algorithm, but it takes longer to compute. Again, the randomselection algorithm fails to give a satisfying answer, which meansboth the greedy and the local search algorithms are well suited forthis problem.
Table 5.2 lists some typical computing times for running thesealgorithms. The pair (s, u) in the table (e.g, (2, 400)) stands forselecting s service instances to satisfy u users. Values in the table arethe executing time and the unit is millisecond. We are interested intheir comparative relation. We can see that the brute force algorithmdoes cost with an exponential time growth. The greedy as well as thegreedy init + single swap algorithms run quite fast comparing to therandom init + single swap algorithm because normally we expectmore swaps to find a local optimizer by a random initial vector.
5.5.5 Redeployment Algorithms for Max k-Cover
Through experiments we confirm the greedy + single swap algo-rithm is good enough in terms of both result and time complexity tosolve k-median problem. This makes the redeployment simple; how-ever, there is a limitation of k-median model. Recall on formulating
CHAPTER 5. DEPLOYMENT OF SINGLE CLOUD SERVICE 126
0 0.1 0.2 0.3 0.4 0.5 0.6 0.7 0.8 0.9 10.5
0.6
0.7
0.8
0.9
1
Threshold
Cov
er r
ate
greedy(no limit)greedy+single swap(no limit)greedy(limit 200)greedy(limit 300)
Figure 5.8: Max k-cover using greedy approach
redeployment in the k-median problem we have assumed users areevenly distributed and all users can request service from their nearestservice instance. In practice this condition does not always hold.
To motivate the construction of the max k-cover model, Fig-ure 5.7 shows a typical distribution of user connections on theservice instances. 20 instances are selected to provide service for4000 users. We expect all instances to connect to about 200 userseach, while the real case is that about 20% instances connect to upto 400 or more users. Therefore these instances get very heavy loadand the performance may become unsatisfiable.
Virtually the cloud has infinite resource, however, in reality thebudget is restricted. Service providers can only launch limited (say,k) instances in the cloud. If we would like to ease the burden ofsome instances we are required to put more than one instances inone data center and to distribute the service instances in k′ (wherek′ < k) data centers.
To attack this, we use another model to formulate the problemwhich is max k-cover problem. As discussed in Section 5.4.2,the threshold to cut edges is a key parameter we should pick upcarefully. We employ the entire 303×4302 matrix in our experiment

CHAPTER 5. DEPLOYMENT OF SINGLE CLOUD SERVICE 127
10 11 12 13 14 15 16 17 18 19 200.09
0.1
0.11
0.12
0.13
0.14
0.15
0.16
0.17
0.18
0.19
Server number
Ave
rage
cos
t (un
it:s)
optimal instanceslimit 200, threshold 0.15limit 200, threshold 0.5limit 300, threshold 0.15limit 300, threshold 0.5
Figure 5.9: Average cost by max k-cover model
and test the value of the threshold ranging from 0.05 to 1. We selectdata centers to deploy 20 service instances. Two typical values oflimitation are applied. The first one is 215, with 20 ∗ 215 = 4300,which means we can cover at most 4300 users. The second one is300 which is a loose limitation. The result is illustrated in Figure 5.8.The local search (with single swap) has no much improvement overthe greedy algorithm under this setting. A tight limitation (e.g., 200)will affect the performance of coverage; on the other hand loosenthe limitation a little bit, the performance will be unaffected by thislimitation (close to the result of no limitation).
Since we cut the edges with a weight less than the threshold, theaverage cost of the covered users is less than that of the threshold.So the threshold to some extent is related to the average cost of theusers. To this end, we compared the average cost of users by theinstances we selected using the greedy algorithm for the max k-coverproblem to the cost by instances we selected using the algorithmsfor the k-median problem. We use the result generated by the greedyinit + single swap algorithm of the k-median model as a baseline.The result is illustrated in Figure 5.9. During the experiment wechanged k, the number of instances to choose, and accordingly we
CHAPTER 5. DEPLOYMENT OF SINGLE CLOUD SERVICE 128
set the total number of users to 200 ∗ k. We pick up two typicalvalues of limitation and threshold. On setting the limitation we usea tight limitation of 200 and a loose one of 300 as done previously.As for the threshold, from previous experiment we get the averagecost of above 0.1 using greedy init + single swap algorithm. Sowe use 0.15 as the threshold to ensure the cost of the covered usersis below 0.15. We note using the threshold of 0.5 can cover mostusers in max k-cover model. So we employ these two values in theexperiment. The result shows a lower threshold would be better thana higher one. Although this limitation decreases the performance,the resulting model is more realistic.
5.6 Discussion
The main contribution of this work is to model the cloud service de-ployment problem instead of proposing new algorithm. Therefore,in this work we use quite simple but shown to be effective algorithmsto solve the proposed model. We choose greedy algorithm and localsearch algorithm because greedy algorithm is proven to be one ofthe best polynomial time algorithms for the set cover problem [76],and local search provides the current best known bound for approx-imating k-median problem [40]. Some other heuristic algorithmsto solve optimization problems can also apply but that is not ourcontribution.
In this work, we collect a dense distance matrix in a controlledenvironment. However, in real cloud environment, the distancematrix is sparse with many missing values since users may notvisit all data centers in advance. Therefore we use the missingvalue prediction technique proposed by Ma et al. [131] to recoverthe dense matrix as collected in this work. Other missing valueprediction techniques can also be applied as long as it could recoverthe distance matrix with full connection.
CHAPTER 5. DEPLOYMENT OF SINGLE CLOUD SERVICE 129
5.7 Summary
In this chapter, we highlight the problem of hosting the cloudservices. Our work consists two parts. First we propose a frameworkto address the new features of cloud. In the cloud we can getall possible connection information on potential locations that theservice instances could be deployed. The second work is that weformulate the redeployment of service instances as k-median andmax k-cover problems. By doing so, they can be solved by fastapproximate algorithms.
We employ a large data set collected via real-world measurementto evaluate the algorithms. The experimental results show ouralgorithms work well on this problem. The data set and the sourcecodes for the experiment are public released.
2 End of chapter.

Chapter 6
Deployment of Multiple CloudServices
Chapter Outline
In cloud computing, multiple services tend to cooperatewith each other to accomplish complicated tasks. De-ploying these services should take the interactions amongdifferent services into consideration. We model and solvethe multi-services co-deployment problem in this chapter.The key points of this chapter are as followings:
• Introduces the framework of cloud-based multi-services and the data processing procedure.
• Model cloud-based multi-services co-deploymentproblem.
• Evaluate the proposed model on real-world dataset;Public release the dataset and simulation code forrepeatable experiments.
130
CHAPTER 6. DEPLOYMENT OF MULTIPLE CLOUD SERVICES 131
6.1 Background and Motivation
We have witnessed the rapid growing of cloud-based services. Thetendency of cloud-based services is to deliver computation, soft-ware, and data access as services located in data centers distributedover the world [39, 155, 182]. Typically, cloud provides threelayers of services namely infrastructure as a service, platform as aservice and software as a service (i.e., IaaS, PaaS and SaaS). Thecloud-based services are generally deployed on virtual machines(VMs) in the cloud data centers (e.g., Amazon EC2) [186]. Sincethere are usually a large number of virtual machines in a cloud,making optimal deployment of cloud-based services to suitablevirtual machines is an important research problem.
To provide good service performance for users, auto scaling andelastic load balance are widely studied [4, 13]. Currently, differentcloud services are typically deployed independently by their ownproviders. Let’s take Facebook and Google as examples. Facebookprovides social network service in its own cloud; Google also pro-vides email services and document services in its own cloud. Thesecompanies have their own users. They make optimal deploymentof their services independently. Our previous work [110], which isshown in Chapter 5, proposes a redeployment mechanism to makeoptimal deployment for such kind of independent cloud services,considering the distribution of users and workload of the servers.
However, in reality, different cloud-based services may cooperatewith each other to complete complicated tasks. For example, whenwatching a video on YouTube, you can click the share button toshare it to Facebook or Twitter by invoking the services provided byFacebook or Twitter; when editing a file on Google Doc you can callGmail service to shard the document with your colleagues by email;when purchasing commodities on Taobao1, you can call Alipay2
1http://www.taobao.com2http://www.alipay.com

CHAPTER 6. DEPLOYMENT OF MULTIPLE CLOUD SERVICES 132
service to pay the money (both Taobao and Alipay are affiliatedentities of Alibaba Group). The number of various kinds of cloud-based services increasing, whereas the giant cloud providers in themarket are not so many, thus multiple services deployed by the sameprovider cooperate together to fulfill user requests becomes evenmore common.
Compared with making optimal deployment for a single service,making optimal deployment for multiple correlated services is amore challenging research problem. The situation becomes verycomplicated when there are tons of services and their deploymentsaffect each other. We could not simply treat the request from otherservices as the same as those from users since the service VMs ofother services are under deployment at the same time and could bemigrated to other places. Therefore it is critical to make a globaldecision for deploying multiple services together, especially forcompanies (e.g., Google and Alibaba) which host many services orfor companies that would like to cooperate with each other. We callthis the co-deployment problem of cloud-based services.
This chapter points out the new research problem of multi-services co-deployment in cloud computing and provides compre-hensive investigations. For ease of discussion, we assume thecloud-based services are deployed on virtual machines. ReplacingVMs with physical servers does not affect our model. We modelthe multi-services co-deployment problem formally as an integerprogramming problem which minimizes the latency of user requests.To evaluate the effectiveness of our proposed multi-services co-deployment model, large-scale real-world experiments are conduct-ed, involving 307 distributed computers in about 40 countries,and 1881 real-world Internet-based services in about 60 countries.The comprehensive experimental results show that our proposedlatency-aware co-deployment mechanism can provide much betterperformance than traditional independent deployment techniques.To make our experiments reproducible, we publicly release [21] our

CHAPTER 6. DEPLOYMENT OF MULTIPLE CLOUD SERVICES 133
Virtual Machine
User
Data Center
S1
S2
u
Service Cloud
v2
C3
C2
v1
C1
1
1
1
1.5
1.51.5
1.5
Network Distance
Figure 6.1: The framework of cloud-based multi-services(The two user icons in the figure actually represent the same user u.)
reusable research dataset, which includes about 577,000 accessesof Internet-based services and 94,000 pings of computers over theworld as well as our source codes for experiment.
6.2 Framework of Cloud-based Multi-services
Figure 6.1 shows the general framework of cloud-based multi-services. As shown in the figure, multiple services (e.g., S1 and S2)are to be deployed in different clouds. Suppose S1 (e.g., Google Docservice) and S2 (e.g., Gmail service) are correlated services (i.e., onerequest of S1 would involve S2 and vice versa). There are three datacenters. The network distances between these data centers are shownin the figure (the unit of network distance is second). Among thesedata centers, C2 (e.g., Amazon EC2) allows public access while C1
and C3 are private clouds (e.g., provided by Google Doc and Gmail,respectively). In this example, S1 can be deployed in C1 and C2
while S2 can be deployed in C2 and C3.Network distances between users and data centers are marked in
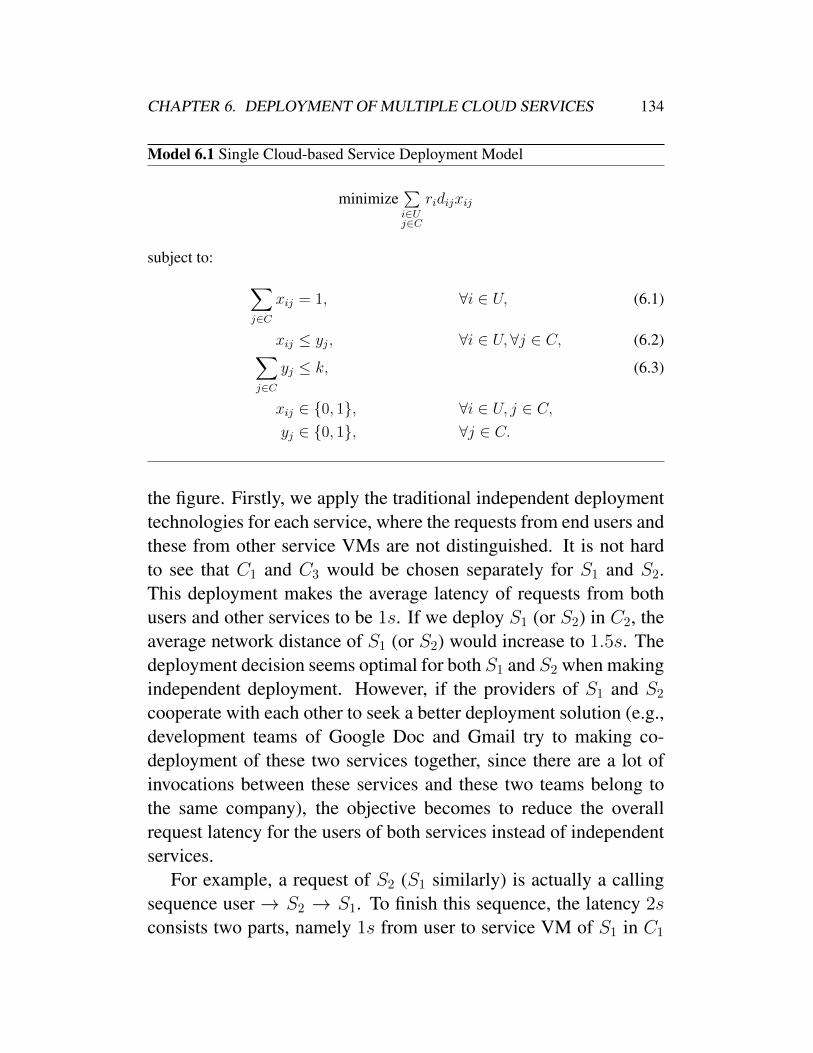
CHAPTER 6. DEPLOYMENT OF MULTIPLE CLOUD SERVICES 134
Model 6.1 Single Cloud-based Service Deployment Model
minimize∑i∈Uj∈C
ridijxij
subject to: ∑j∈C
xij = 1, ∀i ∈ U, (6.1)
xij ≤ yj, ∀i ∈ U,∀j ∈ C, (6.2)∑j∈C
yj ≤ k, (6.3)
xij ∈ {0, 1}, ∀i ∈ U, j ∈ C,yj ∈ {0, 1}, ∀j ∈ C.
the figure. Firstly, we apply the traditional independent deploymenttechnologies for each service, where the requests from end users andthese from other service VMs are not distinguished. It is not hardto see that C1 and C3 would be chosen separately for S1 and S2.This deployment makes the average latency of requests from bothusers and other services to be 1s. If we deploy S1 (or S2) in C2, theaverage network distance of S1 (or S2) would increase to 1.5s. Thedeployment decision seems optimal for both S1 and S2 when makingindependent deployment. However, if the providers of S1 and S2
cooperate with each other to seek a better deployment solution (e.g.,development teams of Google Doc and Gmail try to making co-deployment of these two services together, since there are a lot ofinvocations between these services and these two teams belong tothe same company), the objective becomes to reduce the overallrequest latency for the users of both services instead of independentservices.
For example, a request of S2 (S1 similarly) is actually a callingsequence user→ S2 → S1. To finish this sequence, the latency 2sconsists two parts, namely 1s from user to service VM of S1 in C1
CHAPTER 6. DEPLOYMENT OF MULTIPLE CLOUD SERVICES 135
and 1s from service VM of S1 in C1 to service VM of S2 in C3.If the deployment problem would be considered globally, deployingboth services in C2 would be a better choice. Therefore the overallrequest latency of the calling sequence would be 1.5s rather than 2s.
6.3 Independent Deployment of Single Service
First we consider a simple case of deploying a single cloud-basedservice. Suppose a service is to be deployed on k VMs with that wehave already obtained the distances between users and service VMs.We apply the long existing k-median model [130] in the integerprogramming formulation as Model 6.1.
In Model 6.1, U and C are the sets of users and potentialservice VMs. ri is the count of requests from user i. dij is thenetwork distance between user i and j-th candidate service VM. xijand yj are decision variables. yj indicates whether service VM j
is chosen or not to deploy the service. xij indicates whether user iwould request j-th service VM. This model aims at selecting a setof service VMs to deploy service (yj = 1 if selected). User icould connect to the closest available service VM (xij = 1 ifconnected). The objective function is to minimize the total distanceof all requests. Constraint 6.1 ensures one user would connect to oneservice VM to fulfill the requests. Constraint 6.2 ensures requestsof the users would only be processed on the selected service VM.Constraint 6.3 guarantees at most k service VMs are chosen.
The model is in integer programming formulation. We canapply mature techniques to solve the problem very efficiently withan acceptable approximation of the optimal solution. Actuallymore constraints could be added (e.g., model the computing powerdecreasing of servers with number of connections). Whereas, tosimplify the discussion in this section as a starting point, we usethe basic model.
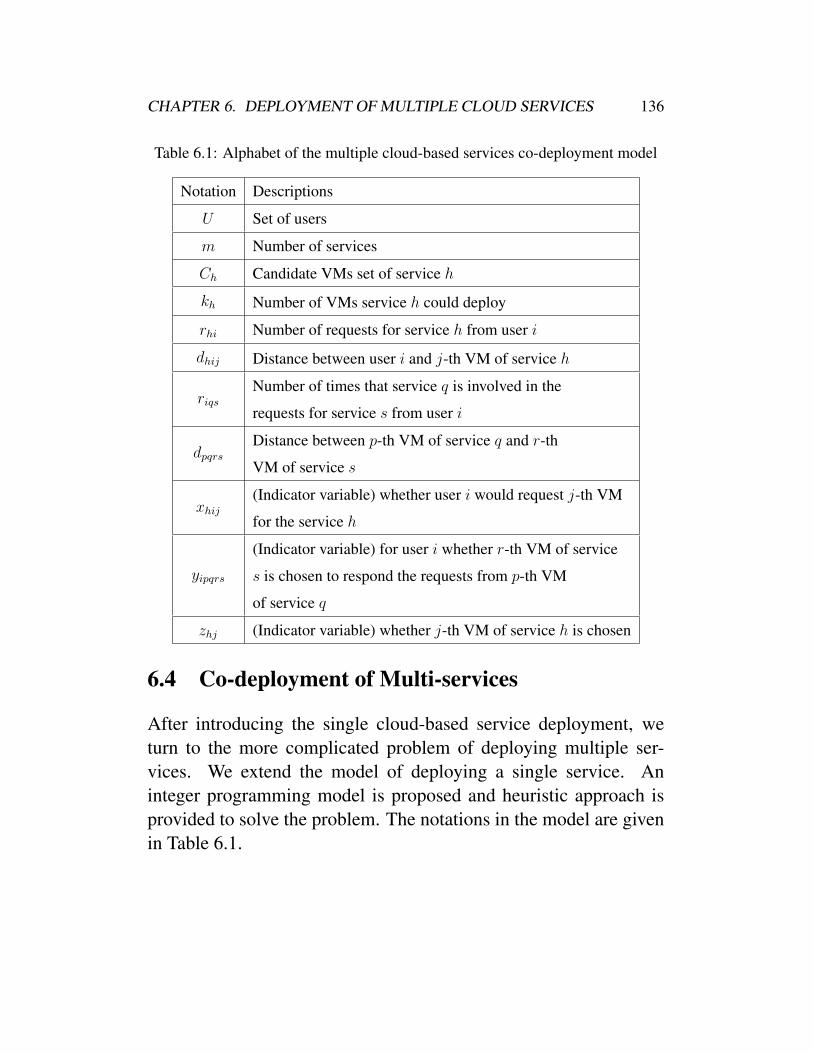
CHAPTER 6. DEPLOYMENT OF MULTIPLE CLOUD SERVICES 136
Table 6.1: Alphabet of the multiple cloud-based services co-deployment model
Notation Descriptions
U Set of users
m Number of services
Ch Candidate VMs set of service h
kh Number of VMs service h could deploy
rhi Number of requests for service h from user i
dhij Distance between user i and j-th VM of service h
riqsNumber of times that service q is involved in the
requests for service s from user i
dpqrsDistance between p-th VM of service q and r-th
VM of service s
xhij(Indicator variable) whether user i would request j-th VM
for the service h
yipqrs
(Indicator variable) for user i whether r-th VM of service
s is chosen to respond the requests from p-th VM
of service q
zhj (Indicator variable) whether j-th VM of service h is chosen
6.4 Co-deployment of Multi-services
After introducing the single cloud-based service deployment, weturn to the more complicated problem of deploying multiple ser-vices. We extend the model of deploying a single service. Aninteger programming model is proposed and heuristic approach isprovided to solve the problem. The notations in the model are givenin Table 6.1.

CHAPTER 6. DEPLOYMENT OF MULTIPLE CLOUD SERVICES 137
Model 6.2 Cloud-based Multi-services Co-deployment Model
minimize∑i∈U
1≤h≤mj∈Ch
rhidhijxhij +∑i∈U
1≤q,s≤m,q 6=sp∈Cq ,r∈Cs
riqsdpqrsyipqrs
subject to: ∑j∈Ch
xhij = sign(rhi), 1 ≤ h ≤ m,∀i ∈ U, (6.4)
xhij ≤ zhj, 1 ≤ h ≤ m,∀j ∈ Ch, (6.5)∀i ∈ U,∑
j∈Ck
zhj ≤ kh, 1 ≤ h ≤ m, (6.6)∑1≤s≤ms 6=hr∈Cs
yijhrs ≤ xhij, 1 ≤ h ≤ m,∀j ∈ Ch, (6.7)
∀i ∈ U,yipqrs ≤ zrs, 1 ≤ q, s ≤ m, q 6= s, (6.8)
∀p ∈ Cq,∀r ∈ Cs,∀i ∈ U,∑
p∈Cq
r∈Cs
yipqrs = sign(riqs), 1 ≤ q, s ≤ m, q 6= s, (6.9)
∀i ∈ U,xhij ∈ {0, 1}, 1 ≤ h ≤ m, j ≤ Ch,
∀i ∈ U,yipqrs ∈ {0, 1}, 1 ≤ q, s ≤ m, q 6= s,
∀p ∈ Cq,∀r ∈ Cs,zhj ∈ {0, 1}, 1 ≤ h ≤ m,∀j ∈ Ch.
6.4.1 Multiple Cloud-based Services Co-deployment Model
As we have introduced the motivation of deploying multiple servicessimultaneously, a model is designed. Model 6.2 optimizes the

CHAPTER 6. DEPLOYMENT OF MULTIPLE CLOUD SERVICES 138
Algorithm 6.1 Iterative sequential co-deployment algorithm1: tempS ← φ, S ← φ2: temp←MAX, tempmin←MAX,min←MAX3: for all service h do4: Select a set Sh of kh service VMs randomly among the candidate set Ch5: tempS ← tempS + Sh6: end for7: for i = 1→ n do8: tempmin← Evaluate the solution tempS9: repeat
10: temp← tempmin11: for all service h do12: Select a set S′h of kh service VMs according to Model 6.1 with decided
tempS13: tempS ← tempS − Sh + S′h14: end for15: tempmin← Evaluate the solution tempS16: if tempmin < min then17: min← tempmin18: S ← tempS19: end if20: until |tempmin− temp| ≤ ε21: Disturb the solution set tempS22: end for23: return S
latencies of both the requests from users and the cross-servicesrequests.
Model 6.2 decides the co-deployment of service VMs in acandidate set for all services (zhj = 1 if the VM is selected forService h). User i could connect to the closest available service VMfor service h (xhij = 1 if connected). The objective function aimsat minimizing the total distance of all requests (including requestsfrom all users and other cooperative services).
The Constraints 6.4 to 6.6 are similar to those in single cloud-based service deployment model. The function sign(x) in Equa-tion 6.4 returns 1 for x > 0 and 0 for x = 0. Equation 6.4 constrainsuser i would connect to one service VM to fulfill the requests ifthe user has a request of service h. Inequality 6.5 ensures the

CHAPTER 6. DEPLOYMENT OF MULTIPLE CLOUD SERVICES 139
requests of the users would only be processed on the selected serviceVM. Constraint 6.6 ensures at most kh service VMs are chosen forservice h. The Constraints 6.7 to 6.9 are introduced for cross-servicerequests. Inequality 6.7 means for user i the cross-service requestsfrom service h to s should be initiated from the j-th VM of service h,in which j-th service VM is chosen to serve user i for requests ofservice h. Inequality 6.8 constrains the cross-service requests couldonly be sent to selected service VMs. Constraint 6.9 ensures onelink would be set if and only if there are cross-service requests.
6.4.2 Iterative Sequential Co-deployment Algorithm
We have acquired a co-deployment model in Section 6.4.1, whereas,there are already too many decision variables. It is infeasible toapply general methods to obtain an approximate solution of themodel. Therefore we take the special properties of this problem andget a heuristic approach. Algorithm 6.1 shows the approach.
Algorithm 6.1 first generates a random deployment (Line 3 to 6)as there is no information about where to deploy. After deciding atemporary deployment, the algorithm tries to sequentially improvethe deployment of the services one by one (Line 11 to 14). It treatsthe requests from other services the same as those from the users inLine 12. By iteratively doing the improvement procedure in Line 9to 20, the deployment of all services would converge. The bestdeployment of the iteration does not necessary appear at last, sowe record the best ever deployment in Line 16 to 19. Since theiterative sub-procedure would fall into a local minimum, we disturbthe solution (usually change one or two chosen service VMs) andrun n loops to find a good enough co-deployment.
It is worth mentioning that this iterative computing algorithm isdifferent from doing unsupervised single service deployment. Thegoal of this algorithm is to acquire a feasible suboptimal solution forModel 6.2. It is true that if we do not participate in the deploying
CHAPTER 6. DEPLOYMENT OF MULTIPLE CLOUD SERVICES 140
schedule of all the services, after some time these services wouldalso evolve to an overall balanced suboptimal deployment. We callthis a natural evolution approach. There are several disadvantage ofnatural evolution approach compared to our algorithm. We list threeof them.
1. For the natural evolution approach, we have to wait for quite along time until the deployment performing well globally sincethe redeployment of services would not be done frequently. Oncontrary, our algorithm can compute the result in a short time.
2. The natural evolution approach would incur many real migra-tions of service VMs which costs a lot. The migration ofone service could cause the migrations of some other servicesand a chain reaction continues, but the order is random andhard to predict. Our algorithm exploits the changes in a moresystematic way and does not trigger any real migrations.
3. Last but the most important reason that our algorithm outper-forms the natural evolution approach is we are not necessaryto fall into local optimum. We disturb the result in Line 21and repeat our iterative algorithm to jump out of the localminimum, while the natural evolution approach has no choicebut to be stuck in the local optimum.
6.5 Experiment and Discussion
We first collect a large real-world latency data set. Based on the dataset we conduct the experiment to evaluate methods of deployingmultiple cloud-based services. We compare our algorithm to theindependent deployment method. The independent deploymentmethod deploys the service VMs randomly at the beginning. Afterthe logs have been collected, all services redeploy the VMs applyingsingle service deployment model without differentiating requests
CHAPTER 6. DEPLOYMENT OF MULTIPLE CLOUD SERVICES 141
from users and from other services. Ilog Cplex 9.0 [17] is appliedto give a good enough approximate solution of the integer program-ming problems (Model 6.1). Both the dataset and the related sourcecodes are public released on our website [21].
6.5.1 Latency Data Collection
We use a similar assumption as in our previous work [110] describedin Chapter 5. Generally, latency of a service request (the requesteither from user or another service) contains three parts: the Internetdelay between the request sponsor and the gateway of cloud datacenter, the Intranet delay inside the cloud, and the computing timeon the service VM. While inside a data center, usually gigabyteswitches are used, the Intranet delay can be ignored. Moreover,assuming two service VMs in the same data center have the samecomputational capability. Thus their processing time of a service canbe viewed as the same. Therefore, the dominant part of the latencyis the Internet delay. Under this assumption, there is no differencebetween two VMs in the same data center. We use distance betweena user u and a data center C to denote the latency between u andany VM v in C. Similarly, distance between a pair of data centersCi and Cj represents the latency between any pair of VMs vi and vjdeployed in Ci and Cj separately.
Since the service VMs are running in the cloud, the serviceproviders can collect the latency data when fulfilling user requests.The calling sequences of services are recorded as well. One logentry contains the user ID, the service ID it requests, a sequence ofservice IDs involved and a sequence of latencies of every servicerequests.
For any user u, if u has ever requested a service VM v in datacenter C, the recorded latency between (u, v) is used to representthe distance between u and C. When more than one VM in C isrequested by u, we take the average latency. Distance between two

CHAPTER 6. DEPLOYMENT OF MULTIPLE CLOUD SERVICES 142
pairs of data centers is retrieved by the same way. If there exists alatency record from a service VM vi in data center Ci to vj in Cj,this value is taken as the distance between Ci and Cj. If there is nohistorical information about a specific distance, we could use similaruser/data center to predict the missing distance value (applying themethod described in the work [131]).
We use again the example in Figure 6.1 to illustrate this. Theuser u requests the VM v1 followed by the VM v1 requests theVM v2. The calling sequence is recorded together with the latencybetween the pair (u, v1) and (v1, v2). These two values are regardedas distances between pair (u,C1) and (C1, C2).
After this period of data processing, we obtain two distance ma-trices. One matrix records the distances between every (user, datacenter) pair. Another matrix records the distances between everypair of data centers.
6.5.2 Dataset Description
To obtain real-world response time values of diverse users andservice VMs, we implement a Crawler using Java. Employing ourCrawler, we get the addresses of 1,881 openly-accessible services.We deploy shell script codes to 307 distributed computers of Planet-Lab, which is a distributed test-bed with hundreds of computers allover the world. During the experiment, each PlanetLab computerpings all the Internet services as well as all the other PlanetLabcomputers once and records the round trip time (RTT). The pingoperations are done simultaneously in a randomized way to avoidoverflow on one computer. By this real-world evaluation, we obtaintwo matrices and public release them [21]. One is a 307 × 1881matrix containing RTT values between PlanetLab computers andweb services (P2W Matrix). The other one is a 307×307 matrix withRTT values between every pair of PlanetLab computers inside (P2PMatrix). These two matrices are used as the two matrices described

CHAPTER 6. DEPLOYMENT OF MULTIPLE CLOUD SERVICES 143
Table 6.2: Dataset statistics (unit: ms)
Statistics P2W Matrix P2P Matrix
minimum 0.01 0.08
25th percentile 53.69 58.58
median 118.14 133.76
75th percentile 176.00 188.53
maximum 1604.02 5704.04
average 129.41 138.38
Table 6.3: Parameters used in randomized log generation
Notation Descriptions Default
nh Number of log entries of service h 1880
ρh Ratio of users use service h to total users 0.2
lNumber of services involved in one service
request5
in the previous section. All the service VMs are represented by thecontaining data center in the experiment.
6.5.3 Experiment Parameters
The experiment is conducted on the data set we obtained (whosestatistics is shown in Table 6.2) with randomly generated userlogs. The iterative sequential algorithm for solving Model 6.2 isevaluated. If it is not specially explained the parameters of the modelin Table 6.1 are set to default values. By the default setting, thereare 1881 users, 10 services. Every service would deploy 10 serviceVMs among a candidate set in 100 data centers. A user of service swould have 5 request logs. One request of a service would involveon average 5 requests of other services. The parameters withoutdefault value riqs together with parameter rhi depend on user logs.
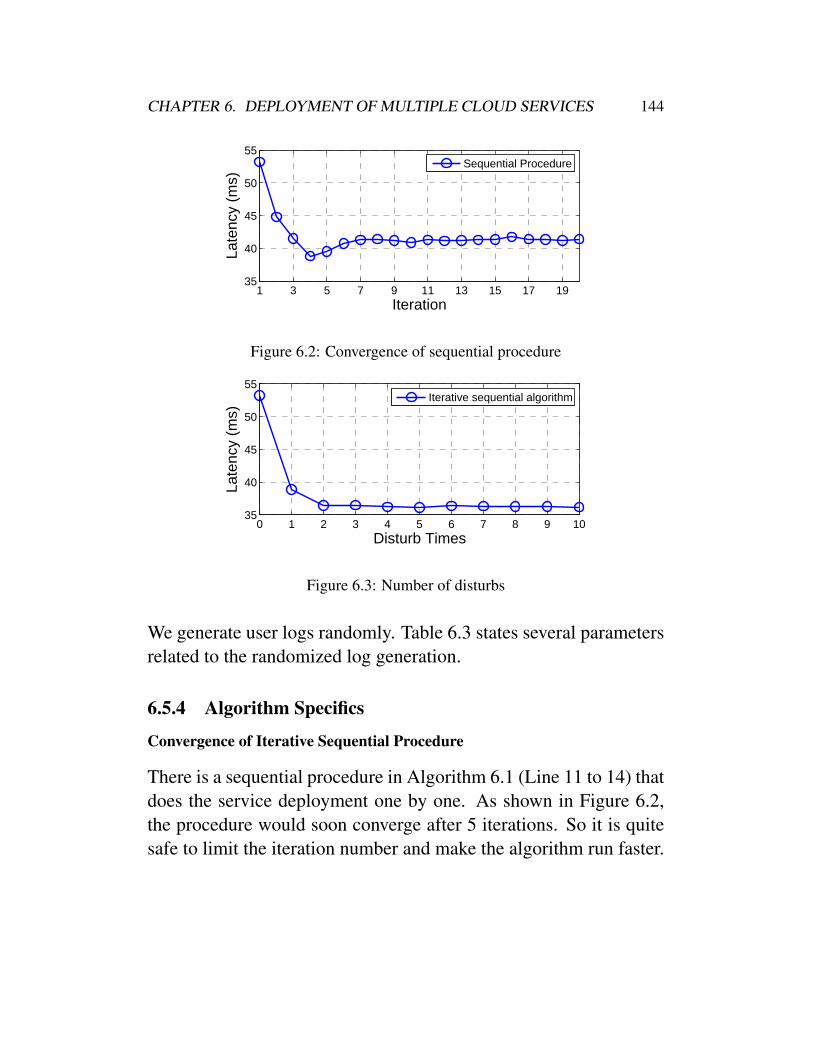
CHAPTER 6. DEPLOYMENT OF MULTIPLE CLOUD SERVICES 144
1 3 5 7 9 11 13 15 17 1935
40
45
50
55
Iteration
Late
ncy
(ms)
Sequential Procedure
Figure 6.2: Convergence of sequential procedure
0 1 2 3 4 5 6 7 8 9 1035
40
45
50
55
Disturb Times
Late
ncy
(ms)
Iterative sequential algorithm
Figure 6.3: Number of disturbs
We generate user logs randomly. Table 6.3 states several parametersrelated to the randomized log generation.
6.5.4 Algorithm Specifics
Convergence of Iterative Sequential Procedure
There is a sequential procedure in Algorithm 6.1 (Line 11 to 14) thatdoes the service deployment one by one. As shown in Figure 6.2,the procedure would soon converge after 5 iterations. So it is quitesafe to limit the iteration number and make the algorithm run faster.
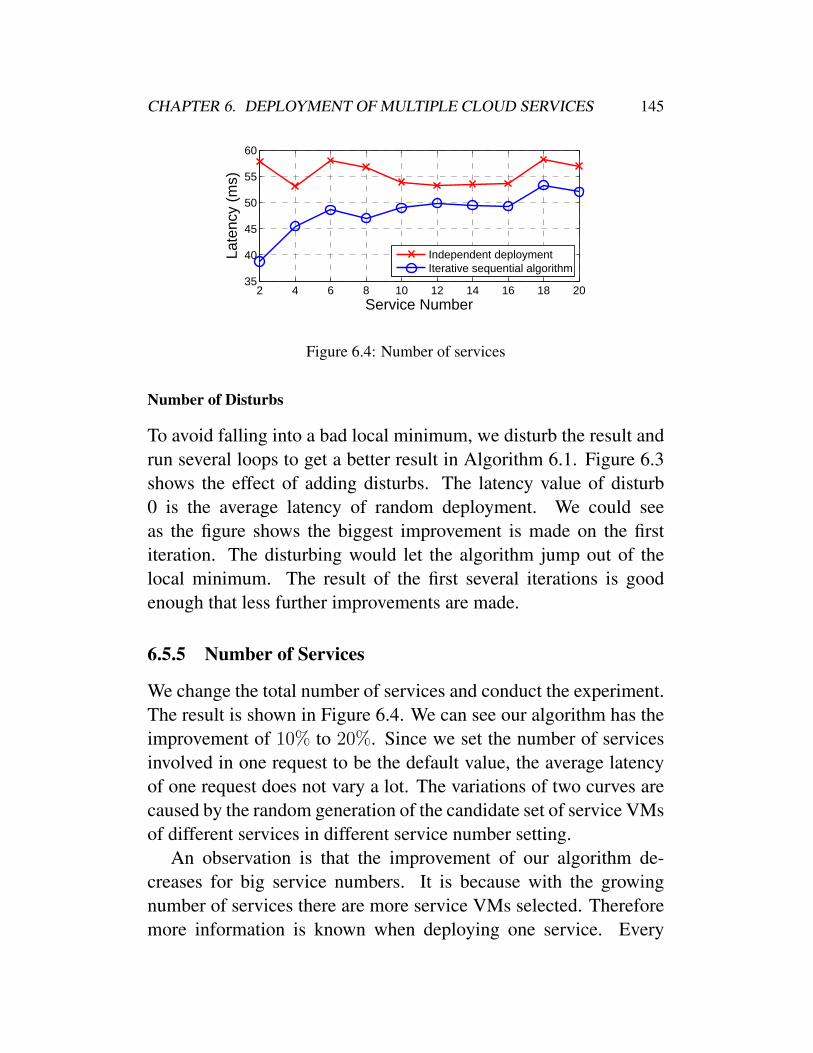
CHAPTER 6. DEPLOYMENT OF MULTIPLE CLOUD SERVICES 145
2 4 6 8 10 12 14 16 18 2035
40
45
50
55
60
Service Number
Late
ncy
(ms)
Independent deploymentIterative sequential algorithm
Figure 6.4: Number of services
Number of Disturbs
To avoid falling into a bad local minimum, we disturb the result andrun several loops to get a better result in Algorithm 6.1. Figure 6.3shows the effect of adding disturbs. The latency value of disturb0 is the average latency of random deployment. We could seeas the figure shows the biggest improvement is made on the firstiteration. The disturbing would let the algorithm jump out of thelocal minimum. The result of the first several iterations is goodenough that less further improvements are made.
6.5.5 Number of Services
We change the total number of services and conduct the experiment.The result is shown in Figure 6.4. We can see our algorithm has theimprovement of 10% to 20%. Since we set the number of servicesinvolved in one request to be the default value, the average latencyof one request does not vary a lot. The variations of two curves arecaused by the random generation of the candidate set of service VMsof different services in different service number setting.
An observation is that the improvement of our algorithm de-creases for big service numbers. It is because with the growingnumber of services there are more service VMs selected. Thereforemore information is known when deploying one service. Every

CHAPTER 6. DEPLOYMENT OF MULTIPLE CLOUD SERVICES 146
20 50 80 110 140 170 20030
40
50
60
70
80
Set Size of Candidate VMs
Late
ncy
(ms)
Independent deploymentIterative sequential algorithm
Figure 6.5: Set size of candidate VMs
2 5 8 11 14 17 2020
40
60
80
100
Number of VMs to Deploy
Late
ncy
(ms)
Independent deploymentIterative sequential algorithm
Figure 6.6: Number of service VMs to deploy
service could choose overall better service VMs for many users andother service VMs independently. Thus, the improvement of ouralgorithm decreases. While it is more common situation that thereare not many services, our algorithm is effective.
6.5.6 Number of Service VMs
Size of Candidate Set of Service VMs
We set different size of candidate service VM set. The result canbe found in Figure 6.5. The decreasing tendency of the curve is nothard to understand. Since there are more potential service VMs tobe chosen from the result should be better. The abnormal increasingon set size 170 is caused by randomized initial deployment phase.

CHAPTER 6. DEPLOYMENT OF MULTIPLE CLOUD SERVICES 147
10% 20% 30% 40% 50% 60% 70% 80% 90% 100%30
35
40
45
50
55
Ratio of Users
Late
ncy
(ms)
Independent deploymentIterative sequential algorithm
Figure 6.7: Number of service users
It is worth mentioning that our algorithm has greater improvementwith bigger set size. The reason is with more candidates to bechosen from, our algorithm could do a much better decision thanconsidering the deployment independently.
Number of Service VMs to Deploy
Figure 6.6 is generated by modifying the number of total serviceVMs of every service. We can see our algorithm outperformsthe independent deployment method by at most 25 percentages.Especially deploying a smaller number of VMs, we can makea much better decision. If we can deploy many service VMs,independently decision could find several outstanding VMs thatperform well. Therefore in these cases our algorithm does not havemany advantages.
6.5.7 Services Logs
We tried different log generation parameters and see the behavior ofour algorithm under different use cases of the services.
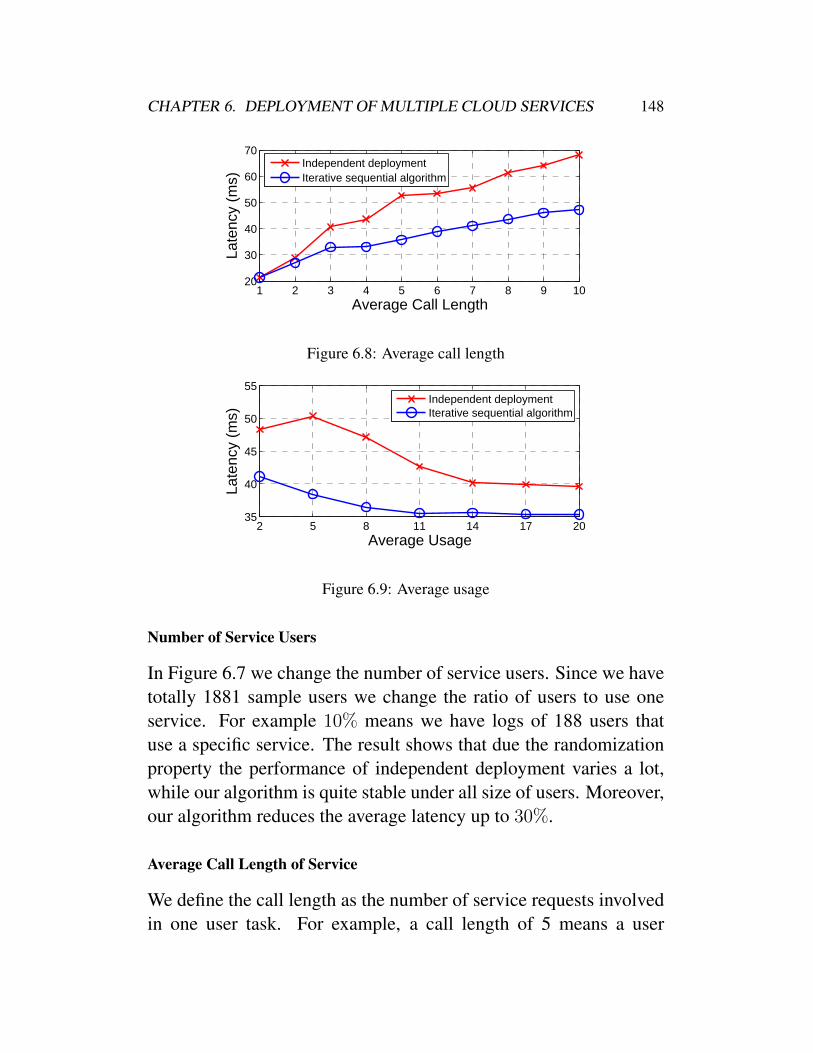
CHAPTER 6. DEPLOYMENT OF MULTIPLE CLOUD SERVICES 148
1 2 3 4 5 6 7 8 9 1020
30
40
50
60
70
Average Call Length
Late
ncy
(ms)
Independent deploymentIterative sequential algorithm
Figure 6.8: Average call length
2 5 8 11 14 17 2035
40
45
50
55
Average Usage
Late
ncy
(ms)
Independent deploymentIterative sequential algorithm
Figure 6.9: Average usage
Number of Service Users
In Figure 6.7 we change the number of service users. Since we havetotally 1881 sample users we change the ratio of users to use oneservice. For example 10% means we have logs of 188 users thatuse a specific service. The result shows that due the randomizationproperty the performance of independent deployment varies a lot,while our algorithm is quite stable under all size of users. Moreover,our algorithm reduces the average latency up to 30%.
Average Call Length of Service
We define the call length as the number of service requests involvedin one user task. For example, a call length of 5 means a user

CHAPTER 6. DEPLOYMENT OF MULTIPLE CLOUD SERVICES 149
request of a specific service s would involve 4 consequent requestsof other services from the VM of service s. As shown in Figure 6.8,our algorithm outperforms the independent deployment methodespecially when the service call length is large. It can also be foundthat the increasing curve of our algorithm is more stable.
Number of Logs
We modify the number of total logs on randomized generation. Theresult is shown in Figure 6.9. Average usage of a user means theaverage number of a user requesting a specific service. We can ex-pect the more records of users the more intelligent we can deploy theservice. As we can see in the figure, the average latency decreaseswith more user logs. An observation is that the gap between ouralgorithm and independent deployment method becomes narrowerwith the growing number of the user logs. This could be explainedby that there are numerous user logs providing enough informationeven for deploying service independently. We can see the tendencyof two curves. Our algorithm converges when there are more than 10average usages, while independent deployment method convergesafter 14. Therefore our algorithm could do a better deployment whenthe number of logs is insufficient.
6.6 Summary
In this chapter, we investigate the latency-aware cloud-based multi-ple services co-deployment problem. Motivating examples are givento illustrate the problem. We offer the method to show what and howthe user logs could be collected. The co-deployment problem is ab-stracted in a general framework. Integer programming formulationis employed to model the problem and a new heuristic algorithm isgiven to obtain an approximate solution. Extensive experiments areconducted on hundreds of computers over the world. The dataset

CHAPTER 6. DEPLOYMENT OF MULTIPLE CLOUD SERVICES 150
and the source codes of the experiment are public released. Theexperimental results show the effectiveness of our model.
2 End of chapter.

Chapter 7
Conclusion and Future Work
Chapter Outline
In this chapter, we give a brief conclusion of this thesisand summarize our contributions. We also provide severalinteresting future directions.
7.1 Conclusion
Performance is a critical criterion for mobile applications and cloudservices. Users are very intolerant to poor performance in mobileapps (e.g., laggy, slow responses). However, due to a lack of handytools and clear guidelines, developers struggle to tune the perfor-mance. In this thesis, we discuss performance-tuning mechanismsfor both mobile applications and cloud services. Open-source toolsand optimization guides are offered. Real-world performance issuesare found by our tools.
More specifically, in Chapters 3 and 4 we discuss tuning theperformance of mobile apps. In Chapters 5 and 6, we investigatemechanisms for tuning the performance of cloud services. We firststudy mechanisms for diagnosing the performance of mobile appsin Chapter 3. In Chapter 4, we discuss the UI design that could
151

CHAPTER 7. CONCLUSION AND FUTURE WORK 152
make the users more tolerant of long latency. Finally, cloud servicedeployment, which is a critical aspect of performance, is studied.We study single cloud service deployment in Chapter 5 and multipleservices co-deployment in Chapter 6.
In Chapter 3, we introduce the design and implementation ofDiagDroid, a handy, open-source tool that allows developers todiagnose the performance of mobile apps. It is the first work thatcan be easily applied to Android mobile devices with different OSversions. We first categorize the asynchronous tasks of Androidapps. Then we propose the Android framework instrumentationmethod for profiling the asynchronous tasks. Then, the suspiciousasynchronous tasks are identified according to some pre-definedcriteria. The suspicious tasks together with their related piece ofsource codes are then reported to the developers which help thema lot on performance diagnosis. We have successfully applied ourtool to real-world Android apps and found 27 previously unknownperformance issues. The whole diagnosis procedure can be doneby ourselves, who are not familiar with the apps being tested. Thisresult is convincing that our tool can be useful to developers.
In Chapter 4, we discuss the problem of responsive UI designin Android apps. The need to detect poor-responsive operationsis confirmed by our user survey. The survey results show thatusers’ patience is correlated with UI responsiveness. We design andimplement a tool called Pretect that can detect poor-responsiveoperations. The tool is shown to work correctly on synthetic bench-marks and on open source apps. We further verify Pretect withreal-world case studies. The results demonstrate the effectiveness ofPretect.
In Chapter 5, we propose a model for optimizing cloud serviceredeployment. The users and cloud VM instances communicationcosts are a critical component of operation delays in mobile app. Wefirst model and extract the major part of such communication delays.Then we propose methods for measuring and predicting such delays.

CHAPTER 7. CONCLUSION AND FUTURE WORK 153
We propose two optimization problems for reducing the total delay.Several algorithms are put forth to solve the problems. To verifyour idea and the usefulness of the algorithms, we collect a datasetof communication delays in the real-world and conduct simulationexperiments. The results show the effectiveness of our proposedmethods. Our collected data and simulation source codes have beenpublic released. Other researchers could repeat our results or use ourdata for further research.
In Chapter 6, we extend the cloud service deployment problemdiscussed in the previous chapter to the multiple cooperative cloudservices deployment case. In this work, we collect a dataset of notonly the communication delays between users and VM instances butalso communication delays between VM instances. Then, we pro-pose an optimization model for service deployment that considersboth user-service and service-service communication delays. Wealso collect real-world data and conduct simulations to show theeffectiveness of our methods. Again, the data and the source codesfor the simulation have been public released.
In summary, in this thesis we enhance the user experiencedperformance of mobile apps and cloud services by reducing latency.We propose comprehensive performance tuning mechanisms forboth mobile apps and cloud services. We implement the proposedmechanisms. The data and our tools have been public releasedonline to make our results repeatable, and more importantly, to makeour mechanism available to developers.
7.2 Future work
Delays in cloud-based mobile apps can come from three sources:mobile-side delays, cloud-side delays and communication delays.The performance can be tuned in all three parts. Although we havemade a number of significant achievements in this thesis, there arestill many interesting research problems for future studies.

CHAPTER 7. CONCLUSION AND FUTURE WORK 154
7.2.1 User Experience Enhancement of Mobile Applicaions
Users interact directly with their mobile apps. Therefore, optimiz-ing the performance of mobile apps is critical to improving userexperience. We propose two promising directions for research onuser experience enhancement, separately, preloading/precomputingtechniques, and delay-tolerant UI design.
Selective Loading, Computing in Advance
Preloading large size resources, and precomputing long-term com-putations are accepted as effective methods for reducing laten-cy. The idea is to use the mobile devices’ hardware resourcesduring idle circles to enhance performance. Unlike PCs, mobiledevices have limited energy; therefore, unnecessary preloading andprecomputing should not be conducted to avoid wasting energy.Predicting and judging more precisely whether the pre-processingof the resources/computation would be beneficial is the key tosaving energy. Our work, which detects the long-term operationsduring testing, provides some help for this problem. Identifyingthe frequent use patterns of these long-term operations may helpusers and developers to select appropriate resources/computationsfor preloading/precomputing.
Delay Tolerant UI Design
Our study has shown that without feedback, users tend to becomeimpatient with long-term operations. The users may doubt thesensitivity of the touch screen or believe that the UI has frozen.In our work, we focus on offering yes/no feedback to user input.Further research could examine what kind of feedback is betterfor users. For example, Airbnb [23] shows fancy pictures whenloading information. However, no study has shown that this designoutperforms a traditional loading bar design and developers maydoubt whether it is really a better design. A survey similar to the one
CHAPTER 7. CONCLUSION AND FUTURE WORK 155
in this thesis could be conducted to verify whether new UI designsoutperform established ones in terms of user satisfaction.
7.2.2 Cloud Service Processing Time Optimization
With the powerful computation resource, processing time of cloudservices can be reduced a lot. This work focuses on optimizingthe deployment of computing instance in clouds. We try to makethe instance as close to users as possible. Another direction foroptimizing instance deployment is to move the instances to wherethe data are stored. The instances that store the data in the cloudcould be different from the instances that perform computing. Thiswould create delays inside the cloud for retrieving data. Thetopology of the cloud could be optimized by reducing the distancebetween the data servers and computation servers.
Another direction is considering application-specific optimiza-tion. This work focuses on general applications, but different appli-cations have distinct characteristics. For example, social network-ing applications may require a lot of inter-server communicationsinside a cloud for obtaining massive amounts of information (e.g.,presenting updates from large groups of friends), whereas, serversfor different news applications store similar contents. The cloudserver characteristics of different applications could be taken intoconsideration for further optimization.
7.2.3 Cloud-client Communication Cost Reduction
In addition to tuning the performance on both mobile apps and cloudservices, the communication between the two could be optimizedto reduce the delays. Our proposed mechanism is one method forreducing the cost per communication, further research could is toreduce the number of communications.
The communication complexity between the two has alreadybeen studied in fields such as information theory, but the theoretical
CHAPTER 7. CONCLUSION AND FUTURE WORK 156
bound has not been achieved in practice. Applying the theorem suc-cessfully to real-world cloud-mobile communication is an interest-ing and practical research problem. What kind of communicationscan be merged to reduce the number of communications and how todo this are interesting problems. The extent to which the number ofcommunications can approach the bound also deserves further study.
2 End of chapter.

Appendix A
List of Publications
1. Yu Kang, Yangfan Zhou, Hui Xu and Michael R. Lyu. Di-agDroid: Android Performance Diagnosis via AnatomizingAsynchronous Executions. In Proc. of the ACM SIGSOFTSymposium on the Foundations of Software Engineering (FSE),2016.
2. Hui Xu, Yangfan Zhou, Cuiyun Gao, Yu Kang, and Michael R.Lyu. SpyAware: Investigating the Privacy Leakage Signaturesin App Execution Traces. In Proc. of the InternationalSysposium on Software Reliability Engineering (ISSRE), pages348-358, 2015.
3. Jiaojiao Fu, Yangfan Zhou, and Yu Kang. DependabilityIssues of Android Games: A First Look via Software Analysis.In Proc. of the International Workshop on Internet-basedVirtual Computing Environment (iVCE), pages. 291-296, 2015.
4. Yu Kang, Zibin Zheng, and M.R. Lyu. A Latency-awareCo-deployment Mechanism for Cloud-based Services, In Prof.of the IEEE International Conference on Cloud Computing(Cloud), pages 630-637, 2012.
5. Jieming Zhu, Yu Kang, Zibin Zheng, and Michael R. Lyu.WSP: A Network Coordinate based Web Service PositioningFramework for Response Time Prediction. In Proc. of the
157

APPENDIX A. LIST OF PUBLICATIONS 158
IEEE International Conference on Web Services (ICWS), pages90-97, 2012.
6. Jieming Zhu, Yu Kang, Zibin Zheng and Michael R. Lyu. AClustering-based QoS Prediction Approach for Web ServicesRecommendation. In Proc. of the International Workshop onInternet-based Virtual Computing Environment (iVCE), pages93-98, 2012.
7. Yu Kang, Yangfan Zhou, Zibin Zheng, and M.R. Lyu. A UserExperience-based Cloud Service Redeployment Mechanism.In Proc. of the IEEE International Conference on CloudComputing (Cloud), pages 227-234, 2011.
2 End of chapter.

Bibliography
[1] 12306 mobile app download. https://kyfw.12306.cn/otn/appDownload/init.
[2] 2 billion consumers worldwide to get smart(phones) by 2016.http://www.emarketer.com/Article/2-Billion-Consumers-Worldwide-Smartphones-by-2016/1011694.
[3] The aicache website. http://aicache.com/.
[4] Amazon auto scaling developer guide. http://aws.amazon.com/documentation/autoscaling/.
[5] Amazon elastic compute cloud (amazon ec2). http://aws.amazon.com/ec2/.
[6] Apache hadoop. http://hadoop.apache.org/.
[7] Application Performance Solutions | Akamai. http://uk.akamai.com/aps.
[8] Average daily time spent online via mobile by internetusers worldwide in 2015, by age group (in hours).http://www.statista.com/statistics/428425/daily-time-spent-online-mobile-age/.
[9] AWS | High Performance Computing - HPC Cloud Comput-ing. http://aws.amazon.com/ec2/hpc-applications/.
159
BIBLIOGRAPHY 160
[10] Best practices for performance — android developer-s. http://developer.android.com/training/best-performance.html.
[11] Chinese government launches app for booking train tickets,and it already sucks. https://www.techinasia.com/chinese-government-launches-app-booking-train-tickets-sucks/.
[12] Cloud computing technology market and mobilecloud industry strategic focus research reports.http://www.prnewswire.com/news-releases/cloud-computing-technology-market-and-mobile-cloud-industry-strategic-focus-research-reports-286988271.html.
[13] Elastic load balancing developer guide. http://aws.amazon.com/documentation/elastic-load-balancing/.
[14] Google app engine. http://code.google.com/appengine/.
[15] Google cloud endpoints. https://cloud.google.com/appengine/docs/java/endpoints/.
[16] Growth of time spent on mobile devices slows. http://www.emarketer.com/Article/Growth-of-Time-Spent-on-Mobile-Devices-Slows/1013072.
[17] Ibm cplex optimizer. http://www-01.ibm.com/software/integration/optimization/cplex-optimizer/.
[18] Microsoft’s windows azure platform. http://www.microsoft.com/windowsazure/.
BIBLIOGRAPHY 161
[19] Number of apps available in leading app stores as of july2015. http://www.statista.com/statistics/276623/number-of-apps-available-in-leading-app-stores/.
[20] Parallel Programming and Computing Platform | CUDA |NVIDIA |NVIDIA. http://www.nvidia.com/object/cuda_home_new.html.
[21] Resources of multiple services co-deployment.http://appsrv.cse.cuhk.edu.hk/˜ykang/cloud/multi_service_deploy.zip.
[22] Resources of single service deployment. http://appsrv.cse.cuhk.edu.hk/˜ykang/cloud/cloud_redeploy.zip.
[23] Vacation rentals, homes, apartments & rooms for rent -Airbnb. https://www.airbnb.com/.
[24] abhi2rai/RestC. https://github.com/abhi2rai/RestC.
[25] S. Abolfazli, Z. Sanaei, E. Ahmed, A. Gani, and R. Buyya.Cloud-based augmentation for mobile devices: Motivation,taxonomies, and open challenges. IEEE CommunicationsSurveys Tutorials (CST ’14), 16(1):337–368, 2014.
[26] Activity Testing — Android Developers. http://developer.android.com/tools/testing/activity_testing.html.
[27] S. Alimadadi, A. Mesbah, and K. Pattabiraman. Understand-ing asynchronous interactions in full-stack JavaScript. InProc. of the ACM/IEEE International Conference on SoftwareEngineering (ICSE ’16), pages 1169–1180, 2016.

BIBLIOGRAPHY 162
[28] N. Alon, B. Awerbuch, and Y. Azar. The online set coverproblem. In Proc. of the Annual ACM Symposium on Theoryof Computing (STOC ’03), pages 100–105, 2003.
[29] E. Altman, M. Arnold, S. Fink, and N. Mitchell. Performanceanalysis of idle programs. In Proc. of the ACM Interna-tional Conference on Object Oriented Programming SystemsLanguages and Applications (OOPSLA ’10), pages 739–753,2010.
[30] D. Amalfitano, A. R. Fasolino, P. Tramontana, S. De Carmine,and A. M. Memon. Using gui ripping for automated testing ofandroid applications. In Proc. of the IEEE/ACM InternationalConference on Automated Software Engineering (ASE ’12),pages 258–261, 2012.
[31] C. Amrutkar, M. Hiltunen, T. Jim, K. Joshi, O. Spatscheck,P. Traynor, and S. Venkataraman. Why is my smartphoneslow? on the fly diagnosis of underperformance on the mobileinternet. In Proc. of the Annual IEEE/IFIP InternationalConference on Dependable Systems and Networks (DSN ’13),pages 1–8, 2013.
[32] S. Anand, M. Naik, M. J. Harrold, and H. Yang. Automatedconcolic testing of smartphone apps. In Proc. of the JointMeeting on Foundations of Software Engineering (FSE ’12),pages 1–11, 2012.
[33] G. Anderson, R. Doherty, and S. Ganapathy. User perceptionof touch screen latency. Design, User Experience, andUsability: Theory, Methods, Tools and Practice (DUXU ’11),6769:195–202, 2011.
[34] M. Andreolini, S. Casolari, M. Colajanni, and M. Messori.Dynamic load management of virtual machines in cloudarchitectures. In Lecture Notes of the Institute for Computer

BIBLIOGRAPHY 163
Sciences, Social Informatics and Telecommunications Engi-neering (LNICST ’10), volume 34, pages 201–214. 2010.
[35] Android drawer. http://www.androiddrawer.com/.
[36] Android Execute Multiple AsyncTask Parallely.http://stackoverflow.com/questions/30011054/android-execute-multiple-asynctask-parallely.
[37] Pretect: Poor-responsive ui detection of android applications.http://www.cudroid.com/pretect.
[38] Apktool: A tool for reverse engineering Android apk files.http://ibotpeaches.github.io/Apktool/.
[39] M. Armbrust, A. Fox, R. Griffith, A. D. Joseph, R. Katz,A. Konwinski, G. Lee, D. Patterson, A. Rabkin, I. Stoica, andM. Zaharia. A view of cloud computing. ACM Communica-tion (CACM ’10), 53(4):50–58, 2010.
[40] V. Arya, N. Garg, R. Khandekar, A. Meyerson, K. Munagala,and V. Pandit. Local search heuristic for k-median and facilitylocation problems. In Proc. of the Annual ACM Symposiumon Theory of Computing (STOC ’01), pages 21–29, 2001.
[41] AsyncTask. http://developer.android.com/reference/android/os/AsyncTask.html.
[42] T. Azim and I. Neamtiu. Targeted and depth-first explo-ration for systematic testing of android apps. In Proc.of the ACM SIGPLAN International Conference on ObjectOriented Programming Systems Languages & Applications(OOPSLA ’13), pages 641–660, 2013.
[43] A. Banerjee. Static analysis driven performance and energytesting. In Proc. of the ACM SIGSOFT International Sym-
BIBLIOGRAPHY 164
posium on Foundations of Software Engineering (FSE ’14),pages 791–794, 2014.
[44] A. Banerjee, S. Chattopadhyay, and A. Roychoudhury. Staticanalysis driven cache performance testing. In Proc. of theIEEE Real-Time Systems Symposium (RTSS ’13), pages 319–329, 2013.
[45] A. Barak, T. Ben-Nun, E. Levy, and A. Shiloh. A package foropencl based heterogeneous computing on clusters with manygpu devices. In Proc. of the IEEE International Conferenceon Cluster Computing Workshops and Posters (CLUSTERWORKSHOPS ’10), pages 1 –7, 2010.
[46] G. Bavota, M. Linares-Vasquez, C. E. Bernal-Cardenas,M. Di Penta, R. Oliveto, and D. Poshyvanyk. The impact ofapi change- and fault-proneness on the user ratings of androidapps. IEEE Transactions on Software Engineering (TSE ’15),41(4):384–407, 2015.
[47] T. Benson, A. Akella, and D. A. Maltz. Network trafficcharacteristics of data centers in the wild. In Proc. of theannual conference on Internet measurement (IMC ’10), pages267–280, 2010.
[48] T. Benson, A. Anand, A. Akella, and M. Zhang. Understand-ing data center traffic characteristics. In Proc. of the ACMworkshop on Research on enterprise networking (WREN ’09),pages 65–72, 2009.
[49] I. Brandic. Towards self-manageable cloud services. In Proc.of the Annual IEEE International Computer Software andApplications Conference (COMPSAC ’09), pages 128–133,2009.
[50] J. Burnim and K. Sen. Asserting and checking determinismfor multithreaded programs. In Proc. of the ACM SIGSOFT
BIBLIOGRAPHY 165
Symposium on The Foundations of Software Engineering(FSE ’09), pages 3–12, 2009.
[51] R. Buyya, C. S. Yeo, and S. Venugopal. Market-orientedcloud computing: Vision, hype, and reality for deliveringit services as computing utilities. In Proc. of the IEEEInternational Conference on High Performance Computingand Communications (HPCC ’08), pages 5–13, 2008.
[52] R. Buyya, C. S. Yeo, S. Venugopal, J. Broberg, and I. Brandic.Cloud computing and emerging it platforms: Vision, hype,and reality for delivering computing as the 5th utility. FutureGeneration Computer Systems (FGCS ’09), 25(6):599–616,June 2009.
[53] Y. Cai and L. Cao. Effective and precise dynamic detection ofhidden races for java programs. In Proc. of the Joint Meetingon Foundations of Software Engineering (FSE ’15), pages450–461, 2015.
[54] B. Cao and G. Uebe. An algorithm for solving capacitat-ed multicommodity p-median transportation problems. TheJournal of the Operational Research Society (JORS ’93),44(3):259–269, 1993.
[55] M. Charikar and S. Guha. Improved combinatorial algorithmsfor the facility location and k-median problems. In Proc. ofthe Annual Symposium on Foundations of Computer Science(FOCS ’99), pages 378–388, 1999.
[56] M. Charikar, S. Khuller, D. M. Mount, and G. Narasimhan.Algorithms for facility location problems with outliers. InProc. of the Annual ACM-SIAM Symposium on Discrete Al-gorithms (SODA ’01), pages 642–651, 2001.
[57] Q. A. Chen, H. Luo, S. Rosen, Z. M. Mao, K. Iyer, J. Hui,K. Sontineni, and K. Lau. Qoe doctor: Diagnosing mobile

BIBLIOGRAPHY 166
app qoe with automated ui control and cross-layer analysis. InProc. of the Conference on Internet Measurement Conference(IMC ’14), pages 151–164, 2014.
[58] J. P. Chin, V. A. Diehl, and K. L. Norman. Developmentof an instrument measuring user satisfaction of the human-computer interface. In Proc. of the SIGCHI Conference onHuman Factors in Computing Systems (CHI ’88), pages 213–218, 1988.
[59] W. Choi, G. Necula, and K. Sen. Guided GUI testing ofandroid apps with minimal restart and approximate learning.In Proc. of the ACM SIGPLAN International Conference onObject Oriented Programming Systems Languages & Appli-cations (OOPSLA ’13), pages 623–640, 2013.
[60] S. R. Choudhary, A. Gorla, and A. Orso. Automated test inputgeneration for android: Are we there yet? In Proc. of theIEEE/ACM International Conference on Automated SoftwareEngineering (ASE ’15), pages 429–440, 2015.
[61] B.-G. Chun, S. Ihm, P. Maniatis, M. Naik, and A. Patti.Clonecloud: Elastic execution between mobile device andcloud. In Proc. of the Conference on Computer Systems(EuroSys ’11), pages 301–314, 2011.
[62] V. Chvatal. A greedy heuristic for the set-covering problem.Mathematics of Operations Research (MOOR ’79), 4(3):233–235, 1979.
[63] C. Clark, K. Fraser, S. Hand, J. G. Hansen, E. Jul, C. Limpach,I. Pratt, and A. Warfield. Live migration of virtual machines.In Proc. of the 2nd conference on Symposium on NetworkedSystems Design & Implementation (NSDI’05), pages 273–286, 2005.

BIBLIOGRAPHY 167
[64] Configuring ART. https://android.googlesource.com/platform/frameworks/base.
[65] M. Creeger. Cloud computing: An overview. ACM Queue,7(5):627–636, June 2009.
[66] E. Cuervo, A. Balasubramanian, D.-k. Cho, A. Wolman,S. Saroiu, R. Chandra, and P. Bahl. Maui: Making smart-phones last longer with code offload. In Proc. of the 8thInternational Conference on Mobile Systems, Applications,and Services (MobiSys ’10), pages 49–62, 2010.
[67] J. Dean and S. Ghemawat. Mapreduce: simplified dataprocessing on large clusters. Communications of The ACM(CACM ’08), 51(1):107–113, 2008.
[68] J. Deber, R. Jota, C. Forlines, and D. Wigdor. How muchfaster is fast enough? user perception of latency & latencyimprovements in direct and indirect touch. In Proc. of theACM Conference on Human Factors in Computing Systems(CHI ’15), pages 1827–1836, 2015.
[69] DiagDroid - Android Performance Diagnosis via Anatomiz-ing Asynchronous Executions. http://www.cudroid.com/DiagDroid.
[70] H. T. Dinh, C. Lee, D. Niyato, and P. Wang. A survey ofmobile cloud computing: architecture, applications, and ap-proaches. Wireless Communications and Mobile Computing(WCMC ’13), 13(18):1587–1611, 2013.
[71] D. Duis and J. Johnson. Improving user-interface respon-siveness despite performance limitations. In Proc. of theIEEE Computer Society International Conference (CompconSpring ’90), pages 380–386, 1990.
BIBLIOGRAPHY 168
[72] D. Engler, D. Y. Chen, S. Hallem, A. Chou, and B. Chelf.Bugs as deviant behavior: A general approach to inferringerrors in systems code. In Proc. of the ACM Symposiumon Operating Systems Principles (SOSP ’01), pages 57–72,2001.
[73] D. Ersoz, M. Yousif, and C. Das. Characterizing networktraffic in a cluster-based, multi-tier data center. In Proc. ofthe IEEE International Conference on Distributed ComputingSystems (ICDCS ’07), pages 59 –59, 2007.
[74] F-Droid. https://f-droid.org/.
[75] R. Farivar, A. Verma, E. Chan, and R. Campbell. Mithra:Multiple data independent tasks on a heterogeneous resourcearchitecture. In Proc. of the IEEE International Conferenceon Cluster Computing and Workshops (CLUSTER ’09), pages1–10, 2009.
[76] U. Feige. A threshold of ln n for approximating set cover.Journal of the ACM (JACM ’98), 45:634–652, 1998.
[77] N. Fernando, S. W. Loke, and W. Rahayu. Mobile cloudcomputing: A survey. Future Generation Computer System(FGCS ’13), 29(1):84–106, 2013.
[78] L. Findlater and J. McGrenere. Impact of screen size onperformance, awareness, and user satisfaction with adaptivegraphical user interfaces. In Proc. of the SIGCHI Conferenceon Human Factors in Computing Systems (CHI ’08), pages1247–1256, 2008.
[79] C. Forlines, D. Wigdor, C. Shen, and R. Balakrishnan. Direct-touch vs. mouse input for tabletop displays. In Proc. ofthe SIGCHI Conference on Human Factors in ComputingSystems (CHI ’07), pages 647–656, 2007.
BIBLIOGRAPHY 169
[80] I. Foster and C. Kesselman. The Grid: Blueprint for a NewComputing Infrastructure. November 1998.
[81] I. Foster, Y. Zhao, I. Raicu, and S. Lu. Cloud computing andgrid computing 360-degree compared. In Proc. of the GridComputing Environments Workshop (GCE ’08), pages 1–10,2008.
[82] Y. Fratantonio, A. Machiry, A. Bianchi, C. Kruegel, andG. Vigna. Clapp: Characterizing loops in android application-s. In Proc. of the Joint Meeting on Foundations of SoftwareEngineering (FSE ’15), pages 687–697, 2015.
[83] D. F. Galletta, R. Henry, S. McCoy, and P. Polak. Web sitedelays: How tolerant are users? Journal of the Associationfor Information Systems (JAIS ’04), 5(1):1–28, 2004.
[84] G. Gan, C. Ma, and J. Wu. Data Clustering: Theory,Algorithms, and Applications (ASA-SIAM Series on Statisticsand Applied Probability). 2007.
[85] C. Gao, B. Wang, P. He, J. Zhu, Y. Zhou, and M. R. Lyu. Paid:Prioritizing app issues for developers by tracking user reviewsover versions. In Proc. of the International Symposium onSoftware Reliability Engineering (ISSRE ’15), pages 35–45,2015.
[86] Z. Gao, C. Fang, and A. M. Memon. Pushing the limits onautomation in gui regression testing. In Proc. of the IEEEInternational Symposium on Software Reliability Engineering(ISSRE ’15), 2015.
[87] S. L. Garfinkel. An evaluation of amazon’s grid computingservices: Ec2, s3 and sqs. Technical report, Center forResearch on Computation and Society, Harvard University,2007.

BIBLIOGRAPHY 170
[88] L. Gomez, I. Neamtiu, T. Azim, and T. Millstein. Reran:Timing- and touch-sensitive record and replay for android. InProc. of the International Conference on Software Engineer-ing (ICSE ’13), pages 72–81, 2013.
[89] C. J. Goodwin. Research in psychology : methods and design.1995.
[90] Google. http://developer.android.com/reference/android/os/StrictMode.html.
[91] M. S. Gordon, D. K. Hong, P. M. Chen, J. Flinn, S. Mahlke,and Z. M. Mao. Accelerating mobile applications throughflip-flop replication. In Proc. of the Annual InternationalConference on Mobile Systems, Applications, and Services(MobiSys ’15), pages 137–150, 2015.
[92] B. D. Harper, L. A. Slaughter, and K. L. Norman. Question-naire administration via the www: A validation & reliabilitystudy for a user satisfaction questionnaire. In WebNet, vol-ume 97, pages 1–4, 1997.
[93] B. Hayes. Cloud computing. Communications of the ACM(CACM ’08), 51(7):9–11, July 2008.
[94] K. Herzig, M. Greiler, J. Czerwonka, and B. Murphy. The artof testing less without sacrificing quality. In Proc. of the In-ternational Conference on Software Engineering (ICSE ’15),pages 483–493, 2015.
[95] Hierarchy viewer. http://developer.android.com/tools/help/hierarchy-viewer.html.
[96] M. R. Hines and K. Gopalan. Post-copy based live virtualmachine migration using adaptive pre-paging and dynamicself-ballooning. In Proc. of the ACM SIGPLAN/SIGOPS
BIBLIOGRAPHY 171
international conference on Virtual execution environments(VEE ’09), pages 51–60, 2009.
[97] J. A. Hoxmeier and C. Dicesare. System response time anduser satisfaction: An experimental study of browser-basedapplications. In Proc. of the Association of InformationSystems Americas Conference (AMCIS ’00), pages 10–13,2000.
[98] J. Huang and L. Rauchwerger. Finding schedule-sensitivebranches. In Proc. of the Joint Meeting on Foundations ofSoftware Engineering (FSE ’15), pages 439–449, 2015.
[99] W. Huang, Q. Gao, J. Liu, and D. K. Panda. High per-formance virtual machine migration with rdma over moderninterconnects. In Proc. of the IEEE International Conferenceon Cluster Computing (CLUSTER ’07), pages 11–20, 2007.
[100] K. Jain, M. Mahdian, and A. Saberi. A new greedy approachfor facility location problems. In Proc. Annual ACM Sympo-sium on Theory of Computing (STOC ’02), pages 731–740,2002.
[101] K. Jain and V. V. Vazirani. Approximation algorithms formetric facility location and k-median problems using theprimal-dual schema and lagrangian relaxation. Journal of theACM (JACM ’01), 48:274–296, 2001.
[102] C. S. Jensen, M. R. Prasad, and A. Møller. Automated testingwith targeted event sequence generation. In Proc. of theInternational Symposium on Software Testing and Analysis(ISSTA ’13), pages 67–77, 2013.
[103] M. Ji, E. W. Felten, and K. Li. Performance measurements formultithreaded programs. ACM SIGMETRICS PerformanceEvaluation Review (PER ’98), 26(1):161–170, June 1998.
BIBLIOGRAPHY 172
[104] J. Johnson. Designing with the Mind in Mind: Simple Guideto Understanding User Interface Design Rules. 2010.
[105] M. E. Joorabchi, M. Ali, and A. Mesbah. Detecting incon-sistencies in multi-platform mobile apps. In Proc. of theInternational Symposium on Software Reliability Engineering(ISSRE ’15), pages 450–460, 2015.
[106] R. Jota, A. Ng, P. Dietz, and D. Wigdor. How fast is fastenough? a study of the effects of latency in direct-touchpointing tasks. In Proc. of the SIGCHI Conference on HumanFactors in Computing Systems (CHI ’13), pages 2291–2300,2013.
[107] M. Jovic, A. Adamoli, and M. Hauswirth. Catch me if youcan: Performance bug detection in the wild. In Proc. of theACM International Conference on Object Oriented Program-ming Systems Languages and Applications (OOPLSA ’11),pages 155–170, 2011.
[108] V. Kahlon, N. Sinha, E. Kruus, and Y. Zhang. Static data racedetection for concurrent programs with asynchronous calls. InProc. of the ACM SIGSOFT Symposium on The Foundationsof Software Engineering (FSE ’09), pages 13–22, 2009.
[109] S. Kandula, S. Sengupta, A. Greenberg, P. Patel, andR. Chaiken. The nature of data center traffic: measurements& analysis. In Proc. of the ACM SIGCOMM conference onInternet measurement conference (IMC ’09), pages 202–208,2009.
[110] Y. Kang, Y. Zhou, Z. Zheng, and M. Lyu. A user experience-based cloud service redeployment mechanism. In Proc. of theInternational Conference on Cloud Computing (CLOUD’11),pages 227 –234, july 2011.

BIBLIOGRAPHY 173
[111] G. Kecskemeti, P. Kacsuk, G. Terstyanszky, T. Kiss, andT. Delaitre. Automatic service deployment using virtual-isation. In Proc. of the Euromicro International Confer-ence on Parallel, Distributed and Network-Based Processing(PDP ’08), 2008.
[112] Keeping your app responsive. http://developer.android.com/training/articles/perf-anr.html.
[113] S. Kosta, A. Aucinas, P. Hui, R. Mortier, and X. Zhang.Thinkair: Dynamic resource allocation and parallel executionin the cloud for mobile code offloading. In Proc. of the IEEEInternational Conference on Computer Communications (IN-FOCOM ’12), pages 945–953, 2012.
[114] D. Kovachev, T. Yu, and R. Klamma. Adaptive computationoffloading from mobile devices into the cloud. In Proc. of theIEEE International Symposium on Parallel and DistributedProcessing with Applications (ISPA ’12), pages 784–791,2012.
[115] S. Kristoffersen and F. Ljungberg. “making place” to makeit work: Empirical explorations of hci for mobile cscw. InProc. of the International ACM SIGGROUP Conference onSupporting Group Work (GROUP ’99), pages 276–285, 1999.
[116] K. Lee, D. Chu, E. Cuervo, J. Kopf, Y. Degtyarev, S. Grizan,A. Wolman, and J. Flinn. Outatime: Using speculation toenable low-latency continuous interaction for mobile cloudgaming. In Proc. of the Annual International Conference onMobile Systems, Applications, and Services (MobiSys ’15),pages 151–165, 2015.
[117] S. Lee and S. Zhai. The performance of touch screen softbuttons. In Proc. of the SIGCHI Conference on Human
BIBLIOGRAPHY 174
Factors in Computing Systems (CHI ’09), pages 309–318,2009.
[118] Y. Lei and R. H. Carver. Reachability testing of concur-rent programs. IEEE Transactions on Software Engineering(TSE ’06), 32(6):382–403, 2006.
[119] A. Lenk, M. Klems, J. Nimis, S. Tai, and T. Sandholm. What’sinside the cloud? an architectural map of the cloud landscape.In Proc. of the ICSE Workshop on Software EngineeringChallenges of Cloud Computing (ICSE Cloud ’09), pages 23–31, 2009.
[120] Libinject – c/c++ code injection library. https://code.google.com/p/libinject/.
[121] G. Lin, G. Dasmalchi, and J. Zhu. Cloud computing and it as aservice: Opportunities and challenges. In IEEE InternationalConference on Web Services (ICWS ’08), pages 6–7, 2008.
[122] Y. Lin, S. Okur, and D. Dig. Study and refactoring of androidasynchronous programming. In Proc. of the IEEE/ACM In-ternational Conference on Automated Software Engineering(ASE ’15), pages 224–235, 2015.
[123] Y. Lin, C. Radoi, and D. Dig. Retrofitting concurrency forandroid applications through refactoring. In Proc. of the ACMSIGSOFT International Symposium on the Foundations ofSoftware Engineering (FSE ’14), pages 341–352, 2014.
[124] Y.-D. Lin, J. Rojas, E.-H. Chu, and Y.-C. Lai. On the accu-racy, efficiency, and reusability of automated test oracles forandroid devices. IEEE Transactions on Software Engineering(TSE ’14), 40(10):957–970, 2014.
[125] Y. Liu, C. Xu, and S.-C. Cheung. Characterizing and detectingperformance bugs for smartphone applications. In Proc.
BIBLIOGRAPHY 175
of the International Conference on Software Engineering(ICSE ’14), pages 1013–1024, 2014.
[126] Y. Liu, C. Xu, and S.-C. Cheung. Diagnosing energy effi-ciency and performance for mobile internetware applications.IEEE Software, 32(1):67–75, 2015.
[127] L. Lovasz. On the ratio of optimal integral and fractionalcovers. Discrete Mathematics, 13(4):383–390, 1975.
[128] Low RAM Configuration. https://source.android.com/devices/tech/config/low-ram.html.
[129] S. Lu, S. Park, E. Seo, and Y. Zhou. Learning from mis-takes: A comprehensive study on real world concurrencybug characteristics. In Proc. of the International Conferenceon Architectural Support for Programming Languages andOperating Systems (ASPLOS ’08), pages 329–339, 2008.
[130] D. M. Network and discrete location: Models, algorithmsand applications. Journal of the Operational Research Society(JORS ’93), 48(7):763–763, 1997.
[131] H. Ma, I. King, and M. R. Lyu. Effective missing dataprediction for collaborative filtering. In Proc. of the AnnualInternational ACM Conference on Research and Develop-ment in Information Retrieval (SIGIR ’07), pages 39–46,2007.
[132] A. Machiry, R. Tahiliani, and M. Naik. Dynodroid: An inputgeneration system for android apps. In Proc. of the JointMeeting on Foundations of Software Engineering (FSE ’13),pages 224–234, 2013.
[133] R. Mahmood, N. Mirzaei, and S. Malek. Evodroid: Seg-mented evolutionary testing of android apps. In Proc. of the
BIBLIOGRAPHY 176
ACM International Symposium on Foundations of SoftwareEngineering (FSE ’14), pages 599–609, 2014.
[134] M. Melo, S. Nickel, and F. S. da Gama. Facility location andsupply chain management - a review. European Journal ofOperational Research (EJOR ’09), 196(2):401 – 412, 2009.
[135] R. B. Miller. Response time in man-computer conversationaltransactions. In Proc. of the December 9-11, 1968, Fall JointComputer Conference, Part I (AFIPS ’68), pages 267–277,1968.
[136] N. Mirzaei, H. Bagheri, R. Mahmood, and S. Malek. Sig-droid: Automated system input generation for android ap-plications. In Proc. of the IEEE International Symposiumon Software Reliability Engineering (ISSRE ’15), pages 461–471, 2015.
[137] N. Mirzaei, S. Malek, C. S. Pasareanu, N. Esfahani, andR. Mahmood. Testing android apps through symbolic execu-tion. ACM SIGSOFT Software Engineering Notes (SEN ’12),37(6):1–5, Nov. 2012.
[138] monkeyrunner. http://developer.android.com/tools/help/monkeyrunner_concepts.html.
[139] Y. Moon, D. Kim, Y. Go, Y. Kim, Y. Yi, S. Chong, andK. Park. Practicalizing delay-tolerant mobile apps with cedos.In Proc. of the Annual International Conference on MobileSystems, Applications, and Services (MobiSys ’15), pages419–433, 2015.
[140] R. M. L. M. Moreira, A. C. R. Paiva, and A. Memon. Apattern-based approach for gui modeling and testing. In Proc.of the IEEE International Symposium on Software ReliabilityEngineering (ISSRE ’13), pages 288–297, 2013.
BIBLIOGRAPHY 177
[141] F. F.-H. Nah. A study on tolerable waiting time: how longare web users willing to wait? Behaviour & InformationTechnology, 23(3):153–163, 2004.
[142] A. Ng, J. Lepinski, D. Wigdor, S. Sanders, and P. Dietz.Designing for low-latency direct-touch input. In Proc. of theACM Symposium on User Interface Software and Technology(UIST ’12), pages 453–464, 2012.
[143] D. T. Nguyen, G. Zhou, G. Xing, X. Qi, Z. Hao, G. Peng,and Q. Yang. Reducing smartphone application delay throughread/write isolation. In Proc. of the Annual InternationalConference on Mobile Systems, Applications, and Services(MobiSys ’15), pages 287–300, 2015.
[144] J. Nielsen. Response times: The 3 important limits. InUsability Engineering, 1993.
[145] S. Niida, S. Uemura, and H. Nakamura. Mobile services.IEEE Vehicular Technology Magazine, 5(3):61–67, 2010.
[146] A. Nistor, P.-C. Chang, C. Radoi, and S. Lu. Caramel:Detecting and fixing performance problems that have non-intrusive fixes. In Proc. of the International Conference onSoftware Engineering (ICSE ’15), pages 902–912, 2015.
[147] D. Nurmi, R. Wolski, C. Grzegorczyk, G. Obertelli, S. So-man, L. Youseff, and D. Zagorodnov. The eucalyptus open-source cloud-computing system. In Proc. of the IEEE In-ternational Symposium on Cluster Computing and the Grid(CCGRID ’09), pages 124 – 131, 2009.
[148] omer727/FacebookWidget. https://github.com/omer727/FacebookWidget.
[149] A. Oulasvirta, S. Tamminen, V. Roto, and J. Kuorelahti.Interaction in 4-second bursts: The fragmented nature of

BIBLIOGRAPHY 178
attentional resources in mobile hci. In Proc. of the Conferenceon Human Factors in Computing Systems (CHI ’05), pages919–928, 2005.
[150] H. Pirkul and V. Jayaraman. A multi-commodity, multi-plant,capacitated facility location problem: formulation and effi-cient heuristic solution. Computers and Operations Research(COR ’98), 25:869–878, 1998.
[151] I. Poupyrev and S. Maruyama. Tactile interfaces for smalltouch screens. In Proc. of the ACM Symposium on UserInterface Software and Technology (UIST ’03), pages 217–220, 2003.
[152] Processes and Threads. http://developer.android.com/guide/components/processes-and-threads.html.
[153] Profiling with Traceview and dmtracedump. http://developer.android.com/tools/debugging/debugging-tracing.html.
[154] H. Qian, D. Medhi, and K. Trivedi. A hierarchical model toevaluate quality of experience of online services hosted bycloud computing. In Proc. of the IFIP/IEEE InternationalSymposium on Integrated Network Management (IM ’11),pages 105–112, 2011.
[155] L. Qian, Z. Luo, Y. Du, and L. Guo. Cloud computing:An overview. In Proc. International Conference on CloudComputing (CloudCom ’09), pages 626–631, 2009.
[156] Z. Qin, Y. Tang, E. Novak, and Q. Li. Mobiplay: A remoteexecution based record-and-replay tool for mobile applica-tions. In Proc. of the ACM/IEEE International Conferenceon Software Engineering (ICSE ’16), 2016.
BIBLIOGRAPHY 179
[157] L. Qiu, V. Padmanabhan, and G. Voelker. On the placementof web server replicas. In Proc. of the IEEE InternationalConference on Computer Communications (INFOCOM ’01),volume 3, pages 1587–1596, 2001.
[158] Railag/rtweel: A lightweight twitter android application. https://github.com/Railag/rtweel.
[159] J. Ramsay, A. Barbesi, and J. Preece. A psychologicalinvestigation of long retrieval times on the world wide web.Interacting with Computers (IwC ’98), 10(1):77–86, 1998.
[160] L. Ravindranath, S. Nath, J. Padhye, and H. Balakrishnan.Automatic and scalable fault detection for mobile applica-tions. In Proc. of the Annual International Conference onMobile Systems, Applications, and Services (MobiSys ’14),pages 190–203, 2014.
[161] L. Ravindranath, J. Padhye, S. Agarwal, R. Mahajan, I. Ober-miller, and S. Shayandeh. Appinsight: Mobile app perfor-mance monitoring in the wild. In Proc. of the USENIX Con-ference on Operating Systems Design and Implementation(OSDI ’12), pages 107–120, 2012.
[162] L. Ravindranath, J. Padhye, R. Mahajan, and H. Balakrishnan.Timecard: Controlling user-perceived delays in server-basedmobile applications. In Proc. of the ACM Symposium onOperating Systems Principles (SOSP ’13), pages 85–100,2013.
[163] Robospice. https://github.com/stephanenicolas/robospice.
[164] Robotium - User scenario testing for Android. http://www.robotium.org.
BIBLIOGRAPHY 180
[165] B. Rochwerger, D. Breitgand, E. Levy, A. Galis, K. Nagin,I. Llorente, R. Montero, Y. Wolfsthal, E. Elmroth, J. Caceres,M. Ben-Yehuda, W. Emmerich, and F. Galan. The reservoirmodel and architecture for open federated cloud comput-ing. IBM Journal of Research and Development, 53(4):1–11,2009.
[166] V. Roto and A. Oulasvirta. Need for non-visual feedback withlong response times in mobile hci. In Special Interest Tracksand Posters of the International Conference on World WideWeb (WWW ’05), pages 775–781, 2005.
[167] A. Sarkar, J. Guo, N. Siegmund, S. Apel, and K. Czarnecki.Cost-efficient sampling for performance prediction of con-figurable systems. In Proc. of the IEEE/ACM InternationalConference on Automated Software Engineering (ASE ’15),pages 342–352, 2015.
[168] M. Selakovic and M. Pradel. Performance issues and op-timizations in JavaScript: An empirical study. In Proc.of the International Conference on Software Engineering(ICSE ’16), 2016.
[169] P. Selvidge. How long is too long for a website to load.Usability News, 1(2), 1999.
[170] Z.-J. M. Shen. A multi-commodity supply chain designproblem. IIE Transactions, 37(8):753–762, 2005.
[171] B. Shneiderman. Response time and display rate in humanperformance with computers. ACM Computing Surveys (C-SUR ’84), 16(3):265–285, 1984.
[172] smali: An assembler/disassembler for android’s dex format.https://code.google.com/p/smali/.
BIBLIOGRAPHY 181
[173] S. Srinivasan, F. Buonopane, S. Ramaswamy, and J. Vain.Verifying response times in networked automation systemsusing jitter bounds. In Proc. of the IEEE InternationalSymposium on Software Reliability Engineering Workshops(ISSREW ’14), pages 47–50, 2014.
[174] A. Stage and T. Setzer. Network-aware migration controland scheduling of differentiated virtual machine workloads.In Proc. of the ICSE Workshop on Software EngineeringChallenges of Cloud Computing (ICSE CLOUD ’09), pages9–14, 2009.
[175] D. D. Suthers, R. Vatrapu, R. Medina, S. Joseph, and N. D-wyer. Beyond threaded discussion: Representational guid-ance in asynchronous collaborative learning environments.Computer & Education, 50(4):1103–1127, 2008.
[176] V. Terragni, S.-C. Cheung, and C. Zhang. Recontest: Ef-fective regression testing of concurrent programs. In Proc.of the International Conference on Software Engineering(ICSE ’15), pages 246–256, 2015.
[177] Testing Support Library - UI Automator. https://developer.android.com/tools/testing-support-library/index.html#UIAutomator.
[178] P. N. Thanh, N. Bostel, and O. Peton. A dynamic modelfor facility location in the design of complex supply chains.International Journal of Production Economics, 113(2):678 –693, 2008.
[179] UI/Application Exerciser Monkey. http://developer.android.com/tools/help/monkey.html.
[180] H. Van, F. Tran, and J.-M. Menaud. Autonomic virtualresource management for service hosting platforms. In Proc.
BIBLIOGRAPHY 182
of the ICSE Workshop on Software Engineering Challenges ofCloud Computing (ICSE CLOUD ’09), pages 1–8, 2009.
[181] S. van der Burg, M. de Jonge, E. Dolstra, and E. Visser.Software deployment in a dynamic cloud: From device toservice orientation in a hospital environment. In Proc. ofthe ICSE Workshop on Software Engineering Challenges ofCloud Computing (ICSE Cloud ’09), pages 61–66, 2009.
[182] L. M. Vaquero, L. Rodero-Merino, J. Caceres, and M. Lind-ner. A break in the clouds: towards a cloud definition. ACMSIGCOMM Computer Communication Review (CCR ’09),39(1):50–55, January 2009.
[183] vincent-d/BeerMusicDroid. https://github.com/vincent-d/BeerMusicDroid.
[184] M. Vouk. Cloud computing - issues, research and imple-mentations. In Proc. of the International Conference onInformation Technology Interfaces (ITI ’08), pages 31–40,2008.
[185] E. Walker. benchmarking amazon ec2 for high-performancescientific computing. Usenix, 33(5):18–23, 2008.
[186] G. Wang and T. S. E. Ng. The impact of virtualization on net-work performance of amazon ec2 data center. In Proc. of theIEEE International conference on computer communications(INFOCOM ’10), pages 1–9, 2010.
[187] Q. Wang, M. G. Jorba, J. M. Ripoll, and K. Wolter. Analysisof local re-execution in mobile offloading system. In Proc.of the IEEE International Symposium on Software ReliabilityEngineering (ISSRE ’13), pages 31–40, 2013.
[188] Q. Wang, H. Wu, and K. Wolter. Model-based performanceanalysis of local re-execution scheme in offloading system. In
BIBLIOGRAPHY 183
Proc. of the IEEE/IFIP International Conference on Depend-able Systems and Networks (DSN ’13), pages 1–6, 2013.
[189] A. Wert, J. Happe, and L. Happe. Supporting swift reaction:Automatically uncovering performance problems by system-atic experiments. In Proc. of the International Conference onSoftware Engineering (ICSE ’13), pages 552–561, 2013.
[190] D. Wigdor, S. Williams, M. Cronin, R. Levy, K. White,M. Mazeev, and H. Benko. Ripples: Utilizing per-contactvisualizations to improve user interaction with touch displays.In Proc. of the ACM Symposium on User Interface Softwareand Technology (UIST ’09), pages 3–12, 2009.
[191] H. Wu, Q. Wang, and K. Wolter. Tradeoff between per-formance improvement and energy saving in mobile cloudoffloading systems. In Proc. of the IEEE InternationalConference on Communications Workshops (ICC ’13), pages728–732, 2013.
[192] Xposed Module overview. http://repo.xposed.info/module-overview.
[193] Xposed Module Repository. http://repo.xposed.info.
[194] D. Yan, S. Yang, and A. Rountev. Systematic testing forresource leaks in android applications. In Proc. of the IEEEInternational Symposium on Software Reliability Engineering(ISSRE ’13), pages 411–420, 2013.
[195] X. Yu, S. Han, D. Zhang, and T. Xie. Comprehendingperformance from real-world execution traces: A device-driver case. ACM SIGPLAN Notices, 49(4):193–206, 2014.
[196] L. Zhang, D. R. Bild, R. P. Dick, Z. M. Mao, andP. Dinda. Panappticon: Event-based tracing to mea-
BIBLIOGRAPHY 184
sure mobile application and platform performance. InProc. of the IEEE/ACM/IFIP International Conferenceon Hardware/Software Codesign and System Synthesis(CODES+ISSS ’13), pages 1–10, 2013.
[197] Q. Zhang, J. Xiao, E. Grses, M. Karsten, and R. Boutaba.Dynamic service placement in shared service hosting infras-tructures. In Proc. of the International IFIP TC6 NetworkingConference (NETWORKING’10), pages 251–264, 2010.
[198] Y. Zhang, J. Guo, E. Blais, and K. Czarnecki. Performanceprediction of configurable software systems by fourier learn-ing. In Proc. of the IEEE/ACM International Conference onAutomated Software Engineering (ASE ’15), pages 365–373,2015.