Performance as a Function of Ability, Resources Invested, and Strategy Used
31
41 41 The Journal of General Psychology, 2009, 136(1), 41–69 Copyright © 2008 Heldref Publications Performance as a Function of Ability, Resources Invested, and Strategy Used JUAN BOTELLA Universidad Autónoma de Madrid DANIEL PEÑA Alava Reyes Consultores MARÍA JOSÉ CONTRERAS Universidad Nacional de Educación a Distancia PEI-CHUN SHIH JOSÉ SANTACREU Universidad Autónoma de Madrid ABSTRACT. Computerized tasks allow a more fine-grained analysis of the strategy deployed in a task designed to map a specific ability than the usual assessment on the basis of only the level of performance. Manipulations expected to impair performance sometimes do not have that effect, probably because the level of performance alone can confound the assessment of the ability level if researchers ignore the strategy used. In a study with 1,872 participants, the authors applied the Spatial Orientation Dynamic Test–Revised (J. Santacreu, 1999) in single and dual task settings, identifying 3 differ- ent strategies. Strategy shifts were associated with the level of performance, as more apt individuals were more likely to shift to better strategies. Ignoring the strategies yields counterintuitive results that cannot be explained by simple, direct relations among the constructs involved. Keywords: performance factors, spatial orientation dynamic task, strategy shifts IN THE PRESENT STUDY, we focused on the complex relations between (a) the level of performance of individuals (an observable variable) and (b) the ability of The Scientific-Technical Collaboration Agreement AENA-UAM/785005 and the Spanish Ministerio de Educacíon y Ciencia, project SEJ2007-64448/PSIC, provided financial sup- port for the present research. Address correspondence to Juan Botella, Facultad de Psicología, Universidad Autónoma de Madrid, Ivan Pavlov, 6, Campus de Cantoblanco, 28049 Madrid, Spain; [email protected] (e-mail).
Transcript of Performance as a Function of Ability, Resources Invested, and Strategy Used

4141
The Journal of General Psychology, 2009, 136(1), 41–69Copyright © 2008 Heldref Publications
Performance as a Function of Ability, Resources Invested, and Strategy Used
JUAN BOTELLAUniversidad Autónoma de Madrid
DANIEL PEÑAAlava Reyes Consultores
MARÍA JOSÉ CONTRERASUniversidad Nacional de Educación a Distancia
PEI-CHUN SHIHJOSÉ SANTACREU
Universidad Autónoma de Madrid
ABSTRACT. Computerized tasks allow a more fine-grained analysis of the strategy deployed in a task designed to map a specific ability than the usual assessment on the basis of only the level of performance. Manipulations expected to impair performance sometimes do not have that effect, probably because the level of performance alone can confound the assessment of the ability level if researchers ignore the strategy used. In a study with 1,872 participants, the authors applied the Spatial Orientation Dynamic Test–Revised (J. Santacreu, 1999) in single and dual task settings, identifying 3 differ-ent strategies. Strategy shifts were associated with the level of performance, as more apt individuals were more likely to shift to better strategies. Ignoring the strategies yields counterintuitive results that cannot be explained by simple, direct relations among the constructs involved.
Keywords: performance factors, spatial orientation dynamic task, strategy shifts
IN THE PRESENT STUDY, we focused on the complex relations between (a) the level of performance of individuals (an observable variable) and (b) the ability of
The Scientific-Technical Collaboration Agreement AENA-UAM/785005 and the Spanish Ministerio de Educacíon y Ciencia, project SEJ2007-64448/PSIC, provided financial sup-port for the present research.
Address correspondence to Juan Botella, Facultad de Psicología, Universidad Autónoma de Madrid, Ivan Pavlov, 6, Campus de Cantoblanco, 28049 Madrid, Spain; [email protected] (e-mail).

42 The Journal of General Psychology
the individuals, amount of cognitive resources they allocate to the task, and strat-egy deployed by the individual for performing it (i.e., two unobservable constructs and one computable construct). The complex pattern of relations among these elements can produce results that are counterintuitive or apparently contradictory with the assumptions involved in the specific relations between any pair of them. We first establish some specific relations between performance and the other three factors, highlighting the differences of the parameters approach and the strategies approach to individual differences in performance (Schunn & Reder, 2001). Then we illustrate them with a hypothetical example. In the empirical section, we show how the complex pattern of relations among them can be used to understand the results obtained in a Spatial Orientation Dynamic Task used as part of a battery for a personnel selection process.
Performance as Determined by Ability, Resources, and Strategy
Applied and theoretical psychologists widely accept that performance reflects ability. Even if a psychologist acknowledges that this relation should be qualified by other factors (e.g., motivation, context, training), this assumption is the basis for using almost any task to assess performers’ abilities. This relation is illustrated in Figure 1A. Keeping other factors constant, performance increases with the ability level of the individual.1
From an information-processing approach, the basis of individual differences in performance relies on some fundamental parameter of cognition, representing constructs such as processing speed and working memory capacity (Ackerman, 1988; Engle, Tuholski, Laughlin, & Conway, 1999; Fry & Hale, 1996; Just & Carpenter, 1992; Kane et al., 2004; Kyllonen, 1993; Kyllonen & Christal, 1990; Salthouse, 1994, 1996; Spearman, 1904, 1927). This is the reason why the information-processing approach has been called the parameter approach to individual differences in performance (Schunn & Reder, 2001).
However, it is well known that, for a given level of ability, performance is also a direct function of the cognitive resources invested in the task (Kahneman, 1973; Navon & Gopher, 1979; C. D. Wickens, 1984, 2002). Figure 2 shows the functions that describe that relation for two individuals (A, B) with different levels of ability. In an assessment context, the instructions and entire endeavor are usually created to motivate individuals to do their best, although different specific performance goals are sometimes set (see Landy & Becker, 1987; Mone & Shalley, 1995; Wood, Mento, & Locke, 1987). Therefore, it is expected that individual participants will allocate as many cognitive resources as neces-sary to reach an acceptable level of performance. However, this does not mean that participants will use all resources available to them. In the rightmost part of the functions in Figure 2, performance does not increase significantly by supplying additional resources. A point in the abscissa (resources axis) more to the right than the range shown in Figure 2 does not produce significant changes

in performance because it is close to the asymptote. There is probably some optimal balance between resources and performance that fits the needs for each specific scenario (Kahneman, 1973; Navon, 1990; Navon & Gopher, 1979), and performers look for that point.
Figure 2 shows that the level of performance can approach its asymptote at different levels of resources for each level of ability. Functions A and B represent
Botella, Peña, Contreras, Shih, & Santacreu 43
Perf
orm
ance
Ability
Perf
orm
ance
Ability
A
2
1
FIGURE 1. (A) General relation hypothesized between ability and perfor-mance and (B) how that relation can be modulated according to Strategies 1 and 2.
B

44 The Journal of General Psychology
the relations of performance with the resources invested for two individuals with different levels of ability. The asymptote of Function A is higher, reflecting a higher level of ability. However, an individual at Level B of ability who invests an amount Y of resources outperforms an individual at Level A who invests X amount of resources.
Even assuming that the individuals have good motivation for doing their best and that they adjust the resources for an optimal balance, under some spe-cific manipulations levels of performance can show sensitivity to changes in the resources invested. In this article, we discuss how this can be supported using the dual task technique.
Still, this is not the whole story. In complex tasks, performers can use several alternative strategies and can shift between them. An important issue is whether we can compare ability levels by comparing the success rates of people who use different strategies. For example, addition problems can be solved using retrieval or counting. As children grow, the probability of their shifting from counting to retrieving increases (Siegler, 1996). Suppose that 2 children answer correctly 5 of a set of 10 addition problems. Should their ability levels be estimated as equal although they have used different strategies?
Many researchers have reported strategy shifts in different types of problems and fields (Lemaire & Siegler, 1995; Reder, 1987; Reder & Schunn, 1999; Siegler & Lemaire, 1997). According to the strategies approach to individual differences in performance, the strategy that individuals choose can reflect their level of abil-ity. Researchers have found that strategy selection is related not only to ability
FIGURE 2. Hypothesized relation between resources invested and perfor-mance for 2 individuals with different levels of ability (A and B). X and Y represent differing amounts of resources invested.
Perf
orm
ance
X Y
Resources Invested
A
B

level (Kyllonen, Lohman, & Snow, 1984) but also to other factors (Bethell-Fox & Shepard, 1988; Cohen & Kubovy, 1993; Folk & Luce, 1987; Lajoie, 2003). In general, more efficient and sophisticated strategies indicate a higher level of the specific ability (Cokely, Kelley, & Gilchrist, 2006; McNamara & Scott, 2001; Schunn & Reder, 2001; Turley-Ames & Whitfield, 2003).
In spatial tests, various strategies can be placed at different points of a hypo-thetical continuum with analytic and holistic strategies at the extremes (Glück & Fitting, 2003). The holistic strategy is based on mental manipulations of the spa-tial relations between the elements of the task. At the other extreme, the analytic strategy is based on the transformation of the spatial information to a nonspatial format (e.g., naming the parts of the task). Analytic strategies are more time-consuming and demand less cognitive effort than holistic strategies. As in tasks reflecting other abilities, strategy shifts in spatial tasks are related not only to the ability level but also to other factors and task features (Cooper, 1982; Fischer, Hickey, Pellegrino, & Law, 1994; Glück, Machat, Jirasko, & Rollett, 2001).
In tasks for which several alternative strategies can be used, the relations of ability and resources with performance should be qualified by the strategy factor. Suppose that a given participant (thus with a constant level of ability) can use two strategies, one more efficient that the other. The two functions in Figure 3 show the relations between performance and resources invested for two differ-ent strategies, with Strategy 1 being more efficient than Strategy 2. The factors determining strategy choice are probably related to the ability itself and to a more general cognitive capacity. The maximum asymptotic level of performance
Botella, Peña, Contreras, Shih, & Santacreu 45
FIGURE 3. Hypothesized relation between resources invested and perfor-mance for 2 strategies (1 and 2) employed by individuals with the same level of ability.
Perf
orm
ance
Resources Invested
1
2

46 The Journal of General Psychology
is related specifically to the strategy used. That is, performance increases as resources increase in Strategy 2 until its maximum performance is approached. However, the asymptotic level of performance for Strategy 1 cannot be reached by adding more resources while using Strategy 2.
Some counterintuitive results are obtained from the relations between the resources allocated and performance for a given level of ability. For example, although the participant has apparently reached a maximum level of performance, sometimes researchers observe an unexpected jump in performance. Such a jump when asymptotic levels of performance have been reached cannot result from a sudden change in the resources allocated, but rather from a change in the strategy used. Further, using the new strategy can theoretically result in higher levels of per-formance while using fewer resources. Similarly, Figure 1B shows how different levels of ability generate different levels of performance but by means of different functions for distinct strategies while keeping constant the resources invested.
Spatial Orientation Dynamic Test-Revised
The Spatial Orientation Dynamic Task–Revised (SODT-R; Colom, Con-treras, Shih, & Santacreu, 2003; Contreras, Colom, Shih, Álava, & Santacreu, 2001; Contreras, Rubio, Peña, Colom, & Santacreu, 2007) was developed to assess peoples’ abilities in dynamic spatial tasks. The participants must redirect two moving dots on the screen toward a specified destination. They can control the trajectories by pressing two buttons that change the direction clockwise and counterclockwise, respectively, while the speed remains constant.
Colom et al. (2003) studied the psychometric properties of the SODT-R. They estimated a Cronbach’s alpha of .85 for internal consistency. As to the construct validity, they obtained a pattern of correlations with other tests that allowed them to interpret the SODT-R as an appropriate assessment of general spatial ability.
Before the present study, we found with this task some counterintuitive or paradoxical results that could be explained in the framework described in the previous section. In a different study, we introduced a manipulation intended to increase the variability of the scores (Botella, Contreras, Shih, García, & Santa-creu, 2001). The participants performed the task under two different conditions: single task (as described previously) and dual task. For the second condition, the SODT-R was the primary task (i.e., optimized task). Simultaneously, the participants performed with their other hand a speeded response to a change of color in several elements of the screen, and the changes were irrelevant to the SODT-R task.
After we (Botella et al., 2001) found that the balance between performances in the two tasks was sensitive to the priorities conveyed by the instructions (Navon, 1990; O’Donnell & Eggemeier, 1986), we had a different sample of participants complete the SODT-R under single and dual task conditions. Because
evidence that sensitivity to priorities can be interpreted in the sense that both tasks share a common pool of resources, the main result—that the level of performance was not significantly different between the two conditions—is counterintuitive. Our conclusion was that the amount of unspecific resources that the participants left untouched in the single task could be enough to perform the secondary task without any significant decrease in the resources devoted to the primary task. As a consequence, the level of performance in the primary task remained unchanged.
However, the level of any participant’s aptitude for the SODT-R task should be reflected in the cost incurred for maintaining a high level of performance for the dual task condition. A result that supports our (Botella et al., 2001) account of the lack of a significant effect of task sharing is that the reliability of the scores (i.e., internal consistency, taking the trials as items) increased from the single task condition to the dual task condition. That result is because in easier conditions, it is more difficult for participants to reflect ability differences between their perfor-mances, because of a ceiling effect on the scores. In difficult tasks, or when the participants are under pressure, individual differences arise more distinctly.
We also found a second counterintuitive result in that some participants were able to improve their level of performance from single task condition to dual task condition. But this is not possible if we only take into account the relations shown in Figures 1A and 2. For a given level of ability, if resources are reduced, performance shows some impairment if the level of performance is in the leftmost part of the function or remains essentially unchanged if it is at the rightmost part of the function. However, performance cannot increase if we do not take into account another relation, such as that illustrated in Figure 3.
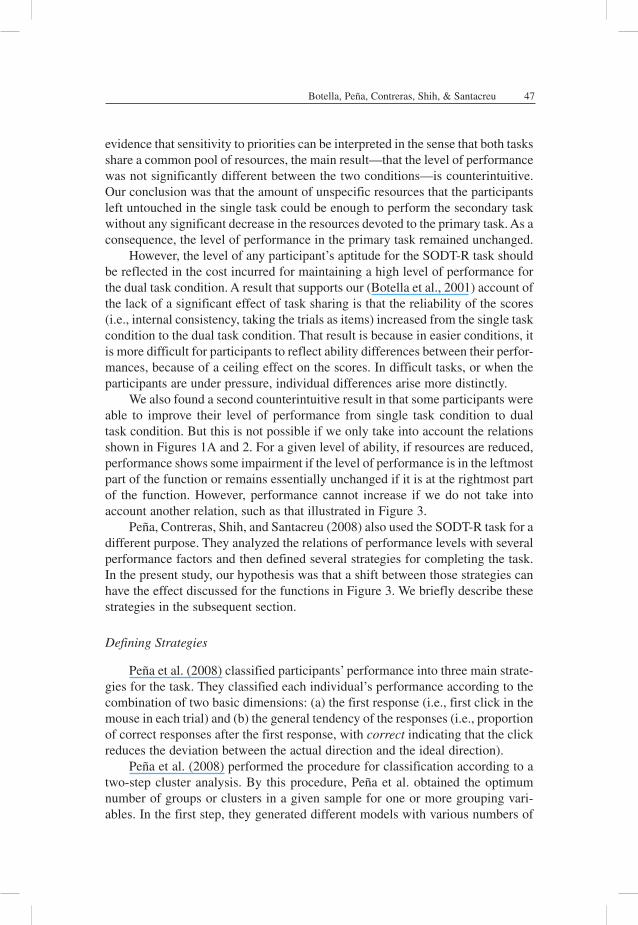
Peña, Contreras, Shih, and Santacreu (2008) also used the SODT-R task for a different purpose. They analyzed the relations of performance levels with several performance factors and then defined several strategies for completing the task. In the present study, our hypothesis was that a shift between those strategies can have the effect discussed for the functions in Figure 3. We briefly describe these strategies in the subsequent section.
Defining Strategies
Peña et al. (2008) classified participants’ performance into three main strate-gies for the task. They classified each individual’s performance according to the combination of two basic dimensions: (a) the first response (i.e., first click in the mouse in each trial) and (b) the general tendency of the responses (i.e., proportion of correct responses after the first response, with correct indicating that the click reduces the deviation between the actual direction and the ideal direction).
Peña et al. (2008) performed the procedure for classification according to a two-step cluster analysis. By this procedure, Peña et al. obtained the optimum number of groups or clusters in a given sample for one or more grouping vari-ables. In the first step, they generated different models with various numbers of
Botella, Peña, Contreras, Shih, & Santacreu 47

48 The Journal of General Psychology
clusters. In the second step, they determined the best model according to informa-tion criteria (parsimony) and maximization of the differences among the groups of each model for the variables considered.
There were four different response patterns isolated in the two-cluster analy-sis: two initial response patterns (using initial response as classification variable) and two general response patterns (using the frequency of the different responses available during the tasks as classification variable). Peña et al. (2008) analyzed the combination of the four frequencies of response patterns and formulated a general hypothesis about the types of strategies that participants used.
In the classification by the first responses, Peña et al. (2008) found two groups: (a) feedback dependent (i.e., low scores in the variable first response correct) and (b) planned (i.e., high scores in the same variable). In the general classification, the groups corresponded to one of two strategies: (a) segmentary (i.e., low scores for the variable general tendency correct) and (b) planned (i.e., high scores in the same variable). Peña et al. calculated the frequencies for the combination of the four clusters. The combination of a feedback-dependent strategy in the initial classification and a segmentary strategy in the general classification was used by 35.9% of participants, whereas 34.2% of participants used a feedback- dependent strategy for the initial classification and a holistic strategy for the gen-eral classification. Only 2.9% of the participants used a planned strategy for the initial classification and a segmentary strategy for the general classification. The rest of the participants (26.9%) used a planned strategy for the initial classifica-tion and a holistic strategy for the general classification. In sum, the nonholistic general response pattern seems to make up a relatively homogenous group in which the percentage of participants with high initial decrease deviation (i.e., initial planned strategy) is negligible.
The three final strategies are as follows: Strategy 1, segmentary strategy, involves neither planning nor integration of the elements of the task. Responses are more impulsive (i.e., short delay until the first response), less efficient (i.e., high response rate and long trial durations), and less accurate (i.e., larger devia-tions from the direct path) than in the other two strategies. The participants using a holistic strategy make a more complex integration of the elements of the task, showing a less impulsive, more efficient, and more accurate performance than do those using the segmentary strategy. However, there were two different holistic strategies depending on whether participants responded without planning and then corrected the responses after attending to the effect of these responses on the trial configuration (i.e., Strategy 2, holistic-feedback-dependent strategy) or planned before responding (i.e., Strategy 3, holistic-planned strategy). The par-ticipants using the holistic-planned strategy showed longer response times but more accurate and efficient performance than did those who used the holistic-feedback-dependent strategy.
For example, an individual using the segmentary strategy clicks the mouse immediately after the appearance of the display arbitrarily on one of the arrows

to turn left or right. He or she does not try to anticipate the result by developing any mental representation of the spatial relations among the elements involved. Then, after assessing the result (i.e., whether the change has improved the align-ment between the destination and the actual direction), he or she clicks again on the same arrow or changes to the other arrow. This is why the first click is quick, and the rate of clicks in each trial is high. However, the individuals using the holistic-planned strategy evaluate the situation before giving any response. They do the proper calculations before clicking the mouse. As a consequence, the first click is later than with the other strategy, but the number of clicks is smaller, total time for each trial is shorter, and final deviation is smaller than in the segmentary strategy.
The strategy used is not only associated with the level of the specific ability involved but also related to the general capacity of the individual (Carpenter & Just, 1988; Kyllonen et al., 1984; Lohman & Kyllonen, 1983). The general find-ing is that higher scores on general ability and visualization are associated with a larger probability of using holistic strategies. Peña et al. (2008) found similar results using a dynamic spatial task. Furthermore, the correlation between general ability scores and deviation (i.e., measure of spatial dynamic ability) was higher among those participants who used the holistic-planned strategy. The relation between general ability and strategy could be interpreted in different ways. On the one hand, given the relation between general ability and planning ability (Colom, Rubio, Shih, & Santacreu, 2006), the effect of the general ability on strategy must reflect the planned nature of the holistic strategy (Peña et al.). On the other hand, given the relation between general ability and working memory (Colom & Shih, 2004; Kyllonen & Christal, 1990), it could be that participants with higher scores on general ability have available more cognitive resources (e.g., attentional control; Miyake, Friedman, Rettinger, Shah, & Hegarty, 2001). This higher avail-ability of cognitive resources allows participants to use holistic strategies because these types of strategies require more resources than the analytic strategies (Glück & Fitting, 2003). In any case, general ability is a relevant variable for explaining both strategy selection and the cognitive features of the different strategies.
Present Study
Beyond the parameter approach to individual differences conveyed in Figure 1A, the strategies approach includes the strategy used as a basis to assess an individual’s ability (see Schunn & Reder, 2001). An extreme version of this approach states that individual differences can be caused by differences in acquired cognitive mechanisms including strategies (Cokely et al., 2006; Ericsson & Kintsch, 1995; McNamara & Scott, 2001). In the present study, we proposed that a full analysis of performance must take into account both approaches, because they are complementary and necessary to fully under-stand how performance reflects the level of ability.
Botella, Peña, Contreras, Shih, & Santacreu 49

50 The Journal of General Psychology
We explored the relations described previously by analyzing the performance of a large sample of candidates in a personnel selection process. They performed the SODT-R under single and dual task conditions in which the SODT-R is the primary task to be optimized. We analyzed the changes in the levels of perfor-mance from the single task to the dual task, but we also classified participants according to the strategies used in both conditions. We studied the strategy shifts and their relations with general capacity and performance in the task. Specifi-cally, we predicted that, when passing from the single task set to the dual task set, we would observe more shifts from bad strategies to better strategies than shifts from good strategies to worse strategies. Furthermore, we hypothesized that participants who moved to a better strategy would show better average scores than would those moving to a worse strategy in independent measures of general capacity and the SODT-R.
Method
Participants
Participants were 1,872 university graduates from different academic branch-es, all of whom were candidates for a preparatory air traffic control course. The sample comprised 789 women (42.1%) with a mean age of 28.6 years (SD = 3.9 years) and 1,083 men (57.8%) with a mean age of 29.1 years (SD = 4.0 years).
Apparatus and Materials
We administered the tasks in a large room with individual workplaces conve-niently separated. Participants completed the task using PC-compatible comput-ers with 43.18-cm monitors.
Tasks
The tasks that we used for the present analysis included the SODT-R task and the secondary task added for the dual task condition. Besides these, we also administered several tests of general capacity.
SODT-R. The SODT-R (Santacreu, 1999) assesses an individual’s ability to guide two moving dots toward a destination. The course of each dot takes a value between 0° and 359° on the plane of the screen, with the top of the screen as 0°. Figure 4 is an example of a trial in which two different colored dots appear in a position and advance following their initial course. Initially, both dots are located at the same distance from the target and have a course at a 90° angle from the correct course. The dots advance at a constant speed. The actual position of each dot and its track as a sequence of dots indicating the positions at previous times

are displayed on the screen. The track helps the participant to estimate the current course of the dot.
The program sets an original position and course for each dot that the partici-pant can modify by pressing the arrow buttons. If the course is not changed, the dot advances across the screen on the course specified in the initial configuration and is allowed to leave the screen. Participants can make each of the dots turn right or left by using the mouse to click on the respective course arrow buttons, signaled by the centered arrow between the two course arrow buttons. The course arrow buttons and the positions of the centered arrows at the top do not change from trial to trial. Figure 4 illustrates what each arrow button at the top does. The direction (i.e., up or down) of the centered arrow is important because it determines the direction in which the dot moves when the adjacent arrow but-tons are clicked. That is, as shown in Figure 4, the button on the right of the up arrow moves the red dot to the right, but the button on the left of the down arrow moves the blue dot to the right. Each click on one of the course arrow buttons
Botella, Peña, Contreras, Shih, & Santacreu 51
FIGURE 4. Example of a screen from the Spatial Orientation Dynamic Test–Revised (J. Santacreu, 1999).
Button 3: Changes the blue dot course to the right regarding its own direction.
Course arrow
Button 2: Changes the red dot course to the right
regarding its own direction.
Button 1: Changes the red dot course to the left regard-
ing its own direction.
Button 4: Changes the blue dot course to the left regard-
ing its own direction.
Red centered arrow
Blue centered arrow Blue moving
dot
Red moving dot
Target

52 The Journal of General Psychology
changes the course of the dot by 10°. Each time a button is clicked, it changes the direction of the dot so that the dot continues on its new course until the but-ton is clicked again. For each of the trials, the participants can see the two dots advancing on their current course, how each course has been modified by pressing the respective course arrow buttons, and, therefore, the course with regard to the target, which is always visible.
The test comprises a total of 12 trials. The first 3 trials are practice trials and are used to train participants in handling and understanding the set of tasks they will be ask to perform. Trials last 20 s each so participants do not have enough time to see the arrival of the dot. In 3 experimental trials, the dots begin to move from the top of the computer screen, and the destination is at the bottom (Figure 4 shows an example of this type of trial). In another 3 experimental trials, the dots begin to move from the left of the computer screen, and the destination is on the right. Last, in the remaining 3 experimental trials, the dots begin to move from the right of the computer screen, and the destination is on the left. The three types of trials are mixed in a programmed sequence that is always the same. The participant’s first task is to decide which course arrow button to press first to change the course of one of the dots, which are moving at the same speed. The speed of the moving dots is constant. If their course is not corrected by pressing the course arrow button repeatedly, the dots follow their original course, moving away from the target.
An individual may omit any calculation, randomly pressing one of the arrow buttons and then reacting according to the changes observed in one of the two moving dots. In this way, the course of the dot may be modified as desired, in which case it would only have to be adjusted until the dot is on the correct course. If, however, the participant modifies the course of the dot in the direction opposite to the desired one, the participant can change the course of the moving dot by clicking on the other course arrow button. Participants who concentrate on the effect of each press of the course arrows may click them more often than do participants who work out beforehand which course arrow to click. In general, participants who calculate beforehand which course arrow to click spend less time clicking the buttons because fewer clicks are needed to put each dot on the correct course. Some participants spend a long time in adjusting the course of the dot, monitoring continuously its route with regard to the position of the target. Therefore, the number of corrections to the course (i.e., clicks on the course arrow buttons) is independent of the time invested in the task of clicking.
The time allowed for the task of changing the direction of the dots to guide them toward their target is limited but sufficient. It is important that participants distribute their time and correct the course of both dots. Otherwise, at the end of the trials, one of the dots may be correctly guided toward the target, whereas the other could maintain its original route and even leave the screen.
The program records continuously the position of the dot on the screen and its course at that moment. Using the position of the dot at the end of the trial, the

program computes the difference between the courses of each dot at the moment when the trial finishes and compares it with the correct course to reach the target. This difference, expressed in degrees (absolute value), is the deviation score we use in our data analysis. A high score reflects low performance. The reported internal consistency (Cronbach’s alpha) in regard to the trials as items was .85 (Colom et al., 2003); the consistency was .947 and .942 for the single and dual task conditions of the present study, respectively.
SODT-R dual task. This was a dual task situation in which one of the tasks is the SODT-R described in the previous section. The secondary task, which was to be done simultaneously, consisted of a speeded discrimination of a change of colors of several elements of the SODT-R task. Specifically, during the course of the trials of the SODT-R task, for which the participants responded with their right hands, sometimes the color of the background and one of the mobile dots changed to different colors. Participants were to press the space bar with their left hand when the colors shifted to two specific sets of colors (i.e., background pink and one mobile yellow; background orange and one mobile green) but withhold their response to shifts to any other combination of colors. They were instructed to give priority to the main task (i.e., orienting the mobile dots to their destination); but given that constraint, they were to respond rapidly and accurately to the change of colors. We computed performance on the main task as in the SODT-R. We assessed performance on the secondary task according to two indexes: (a) mean response time (RT) in correct responses and (b) sensitivity in discriminating the correct set of colors, according to the A′ index of Signal Detection Theory (T. D. Wickens, 2002; see the computational formulas in Grier, 1971).
Analytic Sequential and Inductive Reasoning Test (TRASI). The TRASI (Rubio & Santacreu, 2003) measure of general intelligence consists of 30 items, each with a series of four graphical elements containing several dimensions that change among the elements (e.g., color, digits, number of lines). The maximum time allowed for each item is 3 min. The participant’s task is to choose from three response options the element that best continues the series. The score is the number of problems correctly solved. Internal consistency (Cronbach’s alpha) of three parallel forms has been reported as .710, .720, and .724, respectively (Rubio & Santacreu). For the present application of the TRASI, Cronbach’s alpha was .739.
Verbal Reasoning Test (VRT). The VRT (Colom, Contreras, Arend, García-Leal, & Santacreu, 2004) measures verbal reasoning and consists of 32 three-term series, comprising two premises that describe the relation between pairs of three terms. The participant must combine the information from the two premises to make an inference about the relation not explicit in the premises. The items result from the combination of the terms of the two premises and the location of the
Botella, Peña, Contreras, Shih, & Santacreu 53

54 The Journal of General Psychology
response—half of the syllogisms were positive comparative forms, and the other half were negative equative forms. The participant is required to give an answer accurately but as soon as possible. The score is the number of series correctly solved. Colom et al. calculated an internal consistency value (Cronbach’s alpha) of .92. We found a Cronbach’s alpha of .764 for the present application.
Estimation of Arrival Time Test (EAT-Test). The EAT-Test (Santacreu, 2001) is based on the Arrival-Time task of Hunt, Pellegrino, Frick, Farr, and Alderton (1988; Pellegrino & Hunt, 1989) and on the speed-anticipation tasks included in some assessment batteries for drivers (Maruyama & Kitamura, 1961). The test presents a mobile object (i.e., a boat) advancing on a certain course at constant speed. After 3–4 s, the object disappears from the screen at the same time as a small yellow circle appears. The participant’s task is to determine the moment at which the boat will arrive at the circle, pressing the circle when he or she thinks the boat is over the circle. When the participant responds, the yellow circle changes to red and disappears. If the participant does not press the circle after an interval of 5 s after the object has passed the circle, a red square appears with the message “did not respond.” The eight evaluation trials vary in the speed of the mobile object, distance that it must travel, and its initial position with regard to the destination. The final score is obtained as the mean difference of the dis-tance (in pixels) between the position of the boat when the participant clicks the mouse and the position of the destination. We obtained an internal consistency (Cronbach’s alpha) of .889 in previous studies (Peña et al., 2008) and .894 for the present application.
Procedure
Participants completed a computerized test battery to assess various abili-ties and personality traits as part of a selection process for candidates applying for admission to a course. They completed the evaluation battery in a single session of 3 hr. We described the relevant measures for the present study in the previous section.
Strategy Classification
We chose the procedure used by Peña et al. (2008) for defining strategies in the SODT-R task on the basis of cluster techniques (for a detailed description of the procedure and results, see Peña et al.). The solution reached with the present sample is the same as that found in the original work of Peña et al. We classified each participant in one strategy for each task (SODT-R as single or dual task) on the basis of the general response rate and the accuracy in the first response of each trial. We used the segmentary, holistic-feedback-dependent, and holistic-planned strategies.

Results
SODT-R Task and Strategy Used
To analyze the effect of adding the secondary task, we compared the averages of the main dependent variable (i.e., mean deviation in the SODT-R). A t test showed no significant difference between them, t(1868) = 0.550, p = .582. The averages were 30.7° and 30.5° for the single and dual tasks, respectively. Besides the lack of differ-ence in the averages, the individual scores showed an important level of stability, as the correlation between both applications was r = .863 (p < .001). That is, although the task enabled a stable assessment of the ability level, the addition of a secondary task did not change the average performance, which is consistent with our previous findings (Botella et al., 2001). If we do not think in terms of strategies, our interpreta-tion should be again that the relation between resources and performance remained in a point to the rightmost part of the functions depicted in Figure 2. Apparently, the resources supplying the secondary task were not taken from those allocated to the SODT-R in the single task condition. Therefore, the level of performance in the primary task does not show any general impairment. However, this simple analysis can be misleading. In fact, the effect of adding a secondary task can be determined if the participants’ strategies are taken into account.
To study the relations between performance and strategies used, we used strategy classification—segmentary, holistic-feedback-dependent, and holistic- planned strategies—and applied it to each participant in both applications of the SODT-R—single and dual tasks. Table 1 shows the contingencies between the strategies used in both tasks. The most salient feature of this data is that
Botella, Peña, Contreras, Shih, & Santacreu 55
TABLE 1. Simple and Joint Frequencies of Strategies Used in the Spatial Orientation Dynamic Test–Revised (J. Santacreu, 1999) for the Single and Dual Task Conditions
Dual task
Strategy Single task S HFD HP
558 (29.9) 715 (38.3) 596 (31.9)S 680 (36.4) 483 (71.0) 154 (22.5) 43 (6.3)HFD 693 (37.1) 68 (9.8) 510 (73.6) 115 (16.6)HP 496 (26.5) 7 (1.4) 51 (10.3) 438 (88.3)
Note. S = segmentary; HFD = holistic feedback dependent; HP = holistic planned. Percent-ages are in parentheses. The parentheses in the main 3 × 3 set of cells show percentages of individuals who used each strategy in the dual task set dependent on the strategy used in the single task. Simple frequencies are in bold type.

56 The Journal of General Psychology
participants were essentially stable in the strategy deployed (1,431 partici-pants—76.6% of the sample—showed the same strategy in simple and dual task settings), although each strategy was used with approximately equal frequency (26.5% for the least used).
As discussed previously, we expected no change in the level of performance for those participants who did not change their basic strategies. To check this, we compared by means of a t test the level of performance in both tasks (single vs. dual) for the 1,431 participants classified in both tasks into the same strategy group. The test did not show a significant difference, t(1430) = –1.491, p = .136. Nevertheless, at a descriptive level, performance was better in the single condi-tion, as expected from an analysis based exclusively on the resources allocated (the average deviations were 31.4 and 32.0 for the single and dual tasks, respec-tively). This corroborates that the two levels of resources invested in the task are in the region to the rightmost of Figure 2.
Our main interest in this research focused on strategy shifts. We note that strategy covaries with performance. In fact, the average deviation in the single task was significantly different between the groups that used the three strategies, as reflected in the corresponding analysis of variance (ANOVA), F(2, 1866) = 489.87, p < .001. Post hoc comparisons showed significant differences between all possible pairs (ps < .001). The average deviations were 52.8, 21.3, and 13.3 for the segmentary, holistic-feedback-dependent, and holistic-planned strategies, respectively. This effect was as expected on the basis of the previous results show-ing that strategy is strongly related to global performance (Peña et al., 2008).
However, perhaps this difference is also related to the fact that participants who are more stable in the strategy chosen are those using the more efficient strat-egy (holistic-planned). Thus, 71.0% and 73.6% of participants using segmentary and holistic-feedback-dependent strategies, respectively, did not shift to a differ-ent strategy when performing the dual task, and 88.3% of those using the holistic-planned strategy maintained this more efficient strategy. We expected that there would be a higher frequency of changes to better strategies than to worse strate-gies, and participants using the holistic-planned strategy did not need to change, as they could not have improved with a shift to either of the other two strategies. It is also apparent in Table 1 that shifting from the segmentary strategy to the holistic-feedback-dependent strategy occurred more frequently than shifting to the holistic-planned strategy, although both imply an improvement in efficiency. Furthermore, participants changing from the holistic-planned strategy more fre-quently moved to the holistic-feedback-dependent strategy than to the segmentary strategy. However, participants using the holisitic-feedback-dependent strategy (the only group that had the opportunity of shifting to a better or worse strategy) changed more frequently to a better strategy than to a worse strategy.
Performance changed according to the strategy used in both applications. Fig-ure 5 shows the average of the mean deviations on each task for the groups result-ing from each combination of strategies used in the single and dual tasks. We ran

separate ANOVAs for the three groups formed according to the strategy used in the single task. For each analysis, the within-participant factor task (two levels: single, dual) and the between-participants strategy in the dual task (three levels: segmen-tary, holistic-feedback-dependent, holistic-planned) were taken into account.
Segmentary strategy in single task. We found a significant effect of the inter-action, F(2, 677) = 10.7, p < .001. There were also significant main effects of the task, F(1, 677) = 5.9, p < .02, and of the strategy in dual task, F(2, 677) = 72.6, p < .001.
Holistic-feedback-dependent strategy in single task. We found a significant effect of the interaction for the holistic-feedback-dependent strategy in the single task, F(2, 690) = 13.7, p < .001. There was also a significant main effect of the strategy in the dual task, F(2, 690) = 30.1, p < .001, but not of the task, F(1, 690) = 1.1, p = .299.
Holistic-planned strategy in single task. We found a significant effect of the interaction, F(2, 493) = 11.02, p < .001. There were also significant main effects of the task, F(1, 493) = 10.046, p < .01, and of the strategy in the dual task, F(2, 493) = 28.81, p < .001.
Botella, Peña, Contreras, Shih, & Santacreu 57
FIGURE 5. Mean deviations for the Spatial Orientation Dynamic Test–Revised (J. Santacreu, 1999) task administered as single and dual tasks as a function of the strategy employed (S = segmentary; HFD = holistic feedback dependent; HP = holistic planned).
S HFD HP S HFD HP S HFD HP
Strategy in Dual Task
80
60
0
20
40
M D
evia
tion
DualSingle
Strategy in Single Task
S HFD HP

58 The Journal of General Psychology
In all three ANOVAs, the interaction reached statistical significance. To analyze the nature of those interactions, we completed additional analyses. We made Bonferroni comparisons for each single–dual task pair in each level of dual task strategy of each separate ANOVA (see Figure 5). Segmentary strategy performance in both tasks in the dual task condition was significantly worse than in the single task condition (p < .001). However, in the group with segmentary strategy in single task and with holistic-planned strategy in dual task, the signifi-cant difference was in the opposite direction (p < .02). In short, the black circles’ function is flatter than that of the white circles. In other words, among those using the segmentary strategy in single task, the groups formed according to the strategy used in the dual task changed more in performance in the dual task than in that of the single task. Among those using the holistic-feedback-dependent strategy, the difference was significant only for those using the holistic-planned strategy in dual task (p < .001). Again, in the central panel of Figure 5, the black circles’ function is flatter than the white circles’ function. A similar analysis among those using the holistic-planned strategy in single task produced different results, prob-ably because the group that shifted to the segmentary strategy was very small (n = 7). In fact, despite the finding that the largest descriptive difference appeared in this group (see the panel to the right in Figure 5), the difference was not sig-nificant. However, it reached significance for the large group (n = 438) using the holistic-planned strategy in both tasks.
Summary of the SODT-R task. The global pattern of results, set of comparisons made, and descriptive items displayed in Figure 5 suggest the following interpre-tation. First, the whole group of circles in the panel to the left has a higher average (i.e., lower performance) than those in the other panels. Second, the strategy used in the dual task condition has associated more differences for the panel to the left than for the other two. Third, the functions for the dual task condition are in general flatter than the functions for the single task condition.
Secondary Task and Strategy Used
We also determined how performance in the secondary task changed as a function of the strategy used in the SODT-R, both in single and dual task conditions. As explained in the Method section, we recorded both accuracy and speed measures for the secondary task. Botella et al. (2001) calculated a single score, combining accuracy and speed as a global measure of performance in the secondary task. Because it was shown to be a sensitive index, we used the same procedure in this analysis.2 We analyzed the values using a 3 × 3 ANOVA (three strategies used for the SODT-R in the single and dual task conditions, respectively). The results are shown in Figure 6, where the mean scores are plotted as a function of the strategies used for the SODT-R in both single and dual task conditions. The ANOVA showed a significant main effect of the

strategy used in the dual task condition, F(2, 1860) = 4.887, p = .008, but not of the strategy used in the single task condition, F(2, 1860) = 0.275, p = .759. The interaction revealed a marginally significant effect, F(4, 1860) = 2.138, p = .074. In short, the strategy used in the single task condition did not predict the level of performance in the secondary task of the dual task condition, whereas the strategy used in the dual task condition did. Specifically, in the dual task condition, a better strategy used in the primary task was associated with better performance in the secondary task.
Strategy Shift
We also analyzed the differences between those participants who maintained the same strategy and those who shifted strategies in the other tests assessing general capacity. Thus, when comparing those who continued using the seg-mentary strategy with those who changed from the segmentary strategy to the holistic-feedback-dependent or holistic-planned strategy (see Table 2), we found significant differences in the three capacity tests, F(2, 677) = 12.736, p < .001; F(2, 677) = 4.09, p < .02; F(2, 677) = 23.769, p < .001; for analytical reasoning, verbal comprehension, and time estimation, respectively. As is apparent in Table 2, participants who retained the segmentary strategy had the poorest average scores in all three characteristics when compared with participants who shifted to a better strategy.
Botella, Peña, Contreras, Shih, & Santacreu 59
FIGURE 6. Performance in the secondary task as a function of the strategy employed in the Spatial Orientation Dynamic Test–Revised (J. Santacreu, 1999; S = segmentary, HFD = holistic feedback dependent; HP = holistic planned) in single and dual task conditions.
Perf
orm
ance
in
Seco
ndar
y Ta
sk
S HFD HP S HFD HP S HFD HP
Strategy in Dual Task
0.3
0.2
–0.1
0
0.1
Strategy in Single Task
S HFD HP

60 The Journal of General Psychology
TAB
LE
2. M
eans
and
Sta
ndar
d D
evia
tion
s in
Thr
ee A
bilit
y Te
sts
of t
he G
roup
s R
esul
ting
Fro
m t
he C
ombi
nati
on o
f St
rate
gies
U
sed
in t
he S
pati
al O
rien
tati
on D
ynam
ic T
est–
Rev
ised
(J.
San
tacr
eu, 1
999)
in t
he S
ingl
e an
d D
ual T
ask
Con
diti
ons
S†
HFD
† H
P†
Abi
lity
test
S
HFD
H
P S
HFD
H
P S
HFD
H
P
Ana
lytic
al r
easo
ning
M
16.8
5 18
.75
18.3
3 16
.96
19.2
3 20
.02
17.8
6 19
.45
20.8
9 S
D
4.30
4.
32
3.59
4.
91
4.39
4.
63
6.52
4.
46
4.22
Ver
bal c
ompr
ehen
sion
M
24.7
2 25
.90
25.3
7 25
.29
26.4
3 26
.74
28.0
0 26
.80
27.4
0 S
D
4.56
4.
51
4.11
4.
59
4.10
3.
59
3.37
3.
73
3.67
Tim
e es
timat
ion
M
164.
64
138.
61
133.
34
140.
96
138.
22
129.
57
139.
05
138.
30
116.
50 S
D
46.5
2 49
.23
41.2
6 42
.50
47.2
8 45
.96
31.1
6 50
.89
40.3
2
Not
e. S
= s
egm
enta
ry; H
FD =
hol
istic
fee
dbac
k de
pend
ent;
HP
= h
olis
tic p
lann
ed. I
n an
alyt
ical
rea
soni
ng a
nd v
erba
l com
preh
ensi
on te
sts,
hig
her
scor
es r
efle
ct b
ette
r pe
rfor
man
ce, w
here
as in
the
time
estim
atio
n te
st, s
mal
ler
scor
e de
viat
ions
ref
lect
bet
ter
perf
orm
ance
. Bol
d ty
pe h
ighl
ight
s th
e av
erag
es o
f th
e pa
rtic
ipan
ts w
ho d
id n
ot s
hift
str
ateg
ies
betw
een
the
cond
ition
s (i
.e.,
pair
s S–
S, H
FD–H
FD, a
nd H
P–H
P).
† Str
ateg
y us
ed in
the
sing
le ta
sk.

When comparing those who continued using the holistic-feedback- dependent strategy with those who changed from the holistic-feedback-dependent strategy to the segmentary or holistic-planned strategies, we found significant differences for analytical reasoning, F(2, 690) = 10.358, p < .001, and marginal significance for the other tests, F(2, 690) = 2.899, p = .056; F(2, 690) = 1.878, p = .154; for verbal comprehension and time estimation, respectively. The trend was that participants who changed to a better strategy (holistic-planned) generally performed better than participants who changed to a worse strategy (segmentary), although not all effects were statistically significant (see Table 2).
Last, when comparing those who continued using the holistic-planned strat-egy with those who changed to the segmentary or holistic-feedback-dependent strategy, we found significant differences in analytical reasoning and verbal com-prehension, F(2, 493) = 4.134, p < .02; F(2, 493) = 7.151, p < .001, respectively, and not for time estimation, F(2, 493) = 0.717, p = .489. The trend was that participants who continued using the holistic-planned strategy generally scored better than people who changed to a worse strategy (i.e., segmentary or holistic-feedback-dependent) in analytical reasoning and time estimation, whereas there was no significant difference for verbal comprehension (see Table 2).
One of our main goals was to demonstrate that when researchers interpret changes in performance as revealing shifts in the balance of resources assign-ment or even in basic ability, strategy shifts could be a confounding factor. To test this hypothesis, we compared the performance of participants who changed their strategy with that of people who retained the same strategy. We have already shown that the average deviation did not change between single tasks and dual tasks for those who retain the same strategy. But their stability was also higher, as indicated by the correlation between performances in both applications when calculated only for those who did not shift the strategy (r = .887; r = .863 for the entire sample). However, when calculated for the participants who shifted strategy, it fell to r = .722. That is, taking the correlation as an estimation of the test–retest stability, we infer that reliability is lower if the participant changes the strategy used. Therefore, researchers’ ignoring the strategy when comparing levels of performance can have an unexpectedly strong effect if the number of participants who change strategies is moderately high.
To analyze the global effect of strategy shifts, we ran a new ANOVA with the between-participants factor of strategy shift (two levels: shift or no shift) and the within-participant factor of task (two levels: single or dual). We obtained signifi-cant effects for both main factors—strategy shift, F(1, 1867) = 9.243, p = .002; task, F(1, 1867) = 6.617, p = .01—and for their interaction, F(1, 1867) = 15.69, p < .001. The nature of the effects is shown in Figure 7. In general, participants who did not shift the strategy between the single and dual task conditions had lower scores than those who shifted to a different strategy. The most important feature of this analysis is the nature of the interaction. For those who did not shift the strategy, there was no difference between performance in the single and dual
Botella, Peña, Contreras, Shih, & Santacreu 61

62 The Journal of General Psychology
task conditions, t(1430) = –1.491, p < .136, although the average was worse for the dual task condition. However, for those who shifted to a different strategy, performance improved significantly (i.e., better scores) for the dual task condition in comparison with the single task condition, t(437) = 3.349, p < .001.
To assess the global improvement in explaining the variance observed in the scores on the SODT-R, we performed a multiple regression analysis. When the mean deviation in the dual task condition was regressed against the mean devia-tion in the single task condition, it accounted for 74.4% of the variance. Then we included the strategy used by defining dummy variables that represent the holistic-feedback-dependent and holistic-planned strategies, both in single and dual conditions, respectively (zero values represented the segmentary strategy in both cases). The regression equation obtained by the stepwise method indicated that the percentage of variance accounted for by the model increased significantly when we included three of the dummy variables, but stopped increasing before we added the last variable (i.e., holistic-planned strategy in the single task), with an R2 value of .783 in the equation with those predictors. That is, the scores on
FIGURE 7. Mean deviations for the Spatial Orientation Dynamic Test–Revised (J. Santacreu, 1999) task in the single and dual task conditions as a function of whether the participant remained on the same strategy or shifted to a different strategy.
DualSingle
M D
evia
tion
25
20
0
5
10
15
35
30
No ShiftShift

the SODT-R in the dual task condition were predicted to be significantly better by the scores in the single task condition if the strategy used in both applications was included in the predictive equation.
Discussion
The results of the present study show that for a comprehensive analysis of performance, researchers must pay attention to the strategy that individuals use to complete a task. The study of performance as a function of the task’s demands and individuals’ ability levels should not ignore the mediation of potential differences in the strategy deployed. The strategy approach must complement the parameter approach (Schunn & Reder, 2001) but not replace it. This is important both in the evaluation of individual abilities in assessment contexts and in the group analysis of experimental research endeavors. There are at least two significant reasons for not ignoring the strategy.
The first reason is that strategy shifts reflect both the level of the specific ability studied and the general ability of the participant, as stated in the main assumption of the strategy approach. As a consequence, a shift to a better strategy must be considered extra information about the performer. The results in Table 2 support this claim. We focus on the individuals who used the worst strategy (i.e., segmentary) in the single task. Among these participants, those who did not shift to another strategy showed the worse performance in the three abilities assessed than those who shifted to a better strategy (i.e., holistic- feedback-dependent or holistic-planned strategy). For those who used the holistic-feedback-dependent strategy in the single task, those shifting to a bet-ter strategy (i.e., holistic-planned) showed better performance averages in the three tests than did those shifting to a worse strategy (i.e., segmentary). Last, among those who used the best strategy (i.e., holistic-planned) in the single task, the individuals who shifted to a worse strategy had lower scores than did those who continued using the best strategy, with the exception of the verbal comprehension score for those who shifted from the holistic-planned strategy to the segmentary strategy. Nevertheless, the mean in this specific cell is rather unstable, because it includes only 7 individuals.
We also found many more shifts to a better strategy rather than to a worse strategy (71.2% vs. 28.8%, respectively). Researchers can interpret a shift to a worse strategy as reflecting low specific or general capacity, motivation losses, fatigue, or other factors. Researchers should consider this information when assessing a given ability. Schunn and Reder (2001) proposed a new source of indi-vidual differences called adaptivity—the ability to change strategies as a result of the success rate obtained previously. Adaptivity is associated with the specific ability assessed and the general intelligence of the individual. Similarly, we found that shifts to more efficient strategies are associated with higher capacity in the specific domain and with several measures of general intelligence.
Botella, Peña, Contreras, Shih, & Santacreu 63

64 The Journal of General Psychology
The second reason to identify possible strategies has to do with the interpre-tation of individual and group performance scores. A shift from one strategy to a more efficient strategy can enhance performance by a different route than the sim-ple generation and consumption of extra cognitive resources. Inducing changes in the amount of resources allocated by a given individual should produce changes in the level of performance that fit a function such as that indicated in Figure 2. However, if the participant discovers a better strategy, he or she can show changes in performance that do not fit such a continuous function. Thus, an individual who uses Strategy 2 in Figure 3 but discovers Strategy 1 can experience a change in performance that is better explained as a jump from Function 2 to Function 1. If strategy shifts are ignored, those quantal jumps can produce puzzling results that do not fit the simple relations depicted in Figures 1A and 2.
We do not question that performance reflects levels of ability, but we consid-er dangerous the blind interpretation that scores in an aptitude task reflect ability in a metric sense. For example, suppose that the mean deviation of Individuals A, B, and C in the SODT-R are 15, 20, and 25, respectively, but Individual A used the segmentary strategy, whereas Individuals B and C used the holistic-planned strategy. If we ignore the strategy, we will say that the difference between the abilities of Individuals A and B is the same as that between Individuals B and C. However, analysis of the strategy allows a more sophisticated measurement. Individual A would probably obtain a higher mean deviation under the holistic-planned strategy. We should correct the score obtained by Individual A under the segmentary strategy before making any comparison with those from Individuals B and C or any other individual who used the holistic-planned strategy.
Performance reflects an individual’s ability as modified by other factors that must be taken into account when possible. We highlight the strategies framework as a specific factor for assessment contexts in which individual scores can be better interpreted. Several decades ago, when psychologists developed paper-and-pencil tests for assessing psychological abilities, it was difficult to gather data beyond mere response accuracy. The computer age has had an unstoppable increase in computerized tests. The possibilities of computers in psychological assessment are so obvious that it is not necessary to review their advantages over paper-and-pencil tests. Item response theory and adaptive computerized tests are high-quality examples of this phenomenon. However, one of the potential benefits of this change that may not have received enough attention is that it is possible to conduct a more fine-grained analysis of what individuals do when completing these assessments. One of the possibilities is to characterize alternative strategies and specify which strategies a given performer has used.
Beyond the global score, performance factors can help to assess this and other facets of the way in which individuals operate in the task. For example, in the present application, longer delays until the first response in a trial are associ-ated with better performance (i.e., reduced deviations) The correlations between both factors range from .07 to .23 (M r = .16); although the correlations are not
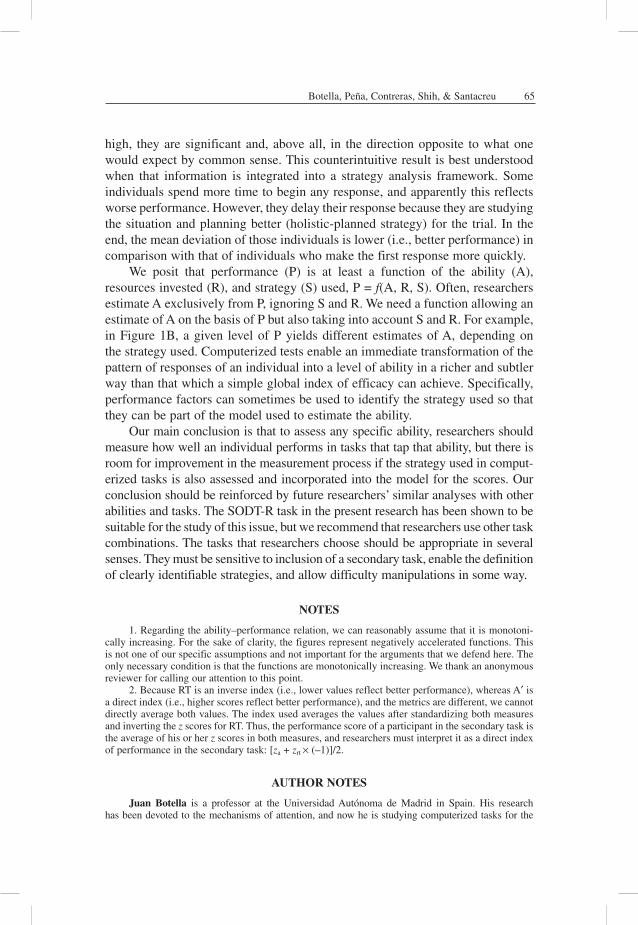
high, they are significant and, above all, in the direction opposite to what one would expect by common sense. This counterintuitive result is best understood when that information is integrated into a strategy analysis framework. Some individuals spend more time to begin any response, and apparently this reflects worse performance. However, they delay their response because they are studying the situation and planning better (holistic-planned strategy) for the trial. In the end, the mean deviation of those individuals is lower (i.e., better performance) in comparison with that of individuals who make the first response more quickly.
We posit that performance (P) is at least a function of the ability (A), resources invested (R), and strategy (S) used, P = f(A, R, S). Often, researchers estimate A exclusively from P, ignoring S and R. We need a function allowing an estimate of A on the basis of P but also taking into account S and R. For example, in Figure 1B, a given level of P yields different estimates of A, depending on the strategy used. Computerized tests enable an immediate transformation of the pattern of responses of an individual into a level of ability in a richer and subtler way than that which a simple global index of efficacy can achieve. Specifically, performance factors can sometimes be used to identify the strategy used so that they can be part of the model used to estimate the ability.
Our main conclusion is that to assess any specific ability, researchers should measure how well an individual performs in tasks that tap that ability, but there is room for improvement in the measurement process if the strategy used in comput-erized tasks is also assessed and incorporated into the model for the scores. Our conclusion should be reinforced by future researchers’ similar analyses with other abilities and tasks. The SODT-R task in the present research has been shown to be suitable for the study of this issue, but we recommend that researchers use other task combinations. The tasks that researchers choose should be appropriate in several senses. They must be sensitive to inclusion of a secondary task, enable the definition of clearly identifiable strategies, and allow difficulty manipulations in some way.
NOTES
1. Regarding the ability–performance relation, we can reasonably assume that it is monotoni-cally increasing. For the sake of clarity, the figures represent negatively accelerated functions. This is not one of our specific assumptions and not important for the arguments that we defend here. The only necessary condition is that the functions are monotonically increasing. We thank an anonymous reviewer for calling our attention to this point.
2. Because RT is an inverse index (i.e., lower values reflect better performance), whereas A′ is a direct index (i.e., higher scores reflect better performance), and the metrics are different, we cannot directly average both values. The index used averages the values after standardizing both measures and inverting the z scores for RT. Thus, the performance score of a participant in the secondary task is the average of his or her z scores in both measures, and researchers must interpret it as a direct index of performance in the secondary task: [za + zrt × (–1)]/2.
AUTHOR NOTES
Juan Botella is a professor at the Universidad Autónoma de Madrid in Spain. His research has been devoted to the mechanisms of attention, and now he is studying computerized tasks for the
Botella, Peña, Contreras, Shih, & Santacreu 65

66 The Journal of General Psychology
assessment of cognitive abilities and the objective assessment of personality. Daniel Peña is a clinical psychologist whose doctoral dissertation was about basic performance factors in tasks designed to assess abilities with computerized tasks. María José Contreras is an associate professor at the Universidad Nacional de Educación a Distancia. Her main research focus is spatial ability and dynamic testing. Pei-Chun Shih is an associate professor at the Universidad Autónoma de Madrid. Her research interest is the analysis of behavioral sequences in task performing and computational formalization of psychological models. José Santacreu is a professor at the Universidad Autónoma de Madrid and is director of the Project Computerized System for Psychological Assessment in Air Traffic Control. His main interest is in the development of tools for an objective assessment of personality.
REFERENCES
Ackerman, P. L. (1988). Determinants of individual differences during skill acquisition: Cognitive abilities and information processing. Journal of Experimental Psychology: General, 117, 288–318.
Bethell-Fox, C. E., & Shepard, R. N. (1988). Mental rotation: Effects of stimulus com-plexity and familiarity. Journal of Experimental Psychology: Human Perception & Performance, 14, 12–23.
Botella, J., Contreras, M. J., Shih, P. C., García, O., & Santacreu, J. (2001). El rendimiento en situación de doble tarea como medida de la capacidad para una tarea [Performance in dual task settings as a measure of ability for a task]. Estudios de Psicología, 67, 41–53.
Carpenter, P. A., & Just, M. A. (1988). Spatial ability: An information processing approach to psychometrics. In R. J. Sternberg (Ed.), Advances in the psychology of human intel-ligence (pp. 221–253). Hillsdale, NJ: Erlbaum.
Cohen, D., & Kubovy, M. (1993). Mental rotation, mental representation, and flat slopes. Cognitive Psychology, 25, 351–382.
Cokely, E. T., Kelley, C. M., & Gilchrist, A. L. (2006). Sources of individual differences in working memory: Contributions of strategy to capacity. Psychonomic Bulletin & Review, 13, 991–997.
Colom, R., Contreras, M. J., Arend, I., García-Leal, O., & Santacreu, J. (2004). Sex differ-ences in verbal reasoning are mediated by sex differences in spatial ability. Psychologi-cal Record, 54, 365–372.
Colom, R., Contreras, M. J., Shih, P., & Santacreu, J. (2003). The assessment of spatial ability through a single computerized test. European Journal of Psychological Assess-ment, 19, 92–100.
Colom, R., Rubio, V. J., Shih, P. C., & Santacreu, J. (2006). Fluid intelligence, working memory and executive functioning. Psicothema, 18, 816–821.
Colom, R., & Shih, P. C. (2004). Is working memory fractionated onto different com-ponents of intelligence? A reply to Mackintosh and Bennett (2003). Intelligence, 32, 431–444.
Contreras, M. J., Colom, R., Shih, P., Álava, M. J., & Santacreu, J. (2001). Dynamic spatial performance: Sex and educational differences. Personality and Individual Differences, 30, 117–126.
Contreras, M. J., Rubio, V., Peña, D., Colom, R., & Santacreu, J. (2007). Sex differences in dynamic spatial ability: The unsolved question of performance factors. Memory & Cognition, 35, 297–303.
Cooper, L. A. (1982). Strategies for visual comparison and representation: individual dif-ferences. In R. J. Sternberg (Ed.), Advances in the psychology of human intelligence (Vol. 1, pp. 77–124). Hillsdale, NJ: Erlbaum.
Engle, R. W., Tuholski, S. W., Laughlin, J. E., & Conway, A. R. A. (1999). Working memory, short-term memory, and general fluid intelligence: A latent-variable approach.

Botella, Peña, Contreras, Shih, & Santacreu 67
Journal of Experimental Psychology: General, 128, 309–331.Ericsson, K. A., & Kintsch, W. (1995). Long-term working memory. Psychological
Review, 102, 211–245.Fischer, S. C., Hickey, D. T., Pellegrino, J. W., & Law, D. J. (1994). Strategic processing
in dynamic spatial reasoning tasks. Learning & Individual Differences, 6, 65–105.Folk, M. D., & Luce, R. D. (1987). Effects of stimulus complexity on mental rotation rate
of polygons. Journal of Experimental Psychology: Human Perception & Performance, 13, 395–404.
Fry, A. F., & Hale, S. (1996). Processing speed, working memory, and fluid intelligence: Evidence for a developmental cascade. Psychological Science, 7, 237–241.
Glück, J., & Fitting, S. (2003). Spatial strategy selection: Interesting incremental informa-tion. International Journal of Testing, 3, 293–308.
Glück, J., Machat, R., Jirasko, M., & Rollett, B. (2001). Training-related changes in solution strategy in a spatial test: An application of item response models. Learning & Individual Differences, 13, 1–22.
Grier, J. B. (1971). Nonparametric indexes for sensitivity and bias: Computing formulas. Psychological Bulletin, 75, 424–429.
Hunt, E., Pellegrino, J. W., Frick, R. W., Farr, S. A., & Alderton, D. (1988). The ability to reason about movement in the visual field. Intelligence, 12, 77–100.
Just, M. A., & Carpenter, P. A. (1992). A capacity theory of comprehension: Individual differences in working memory. Psychological Review, 99, 122–149.
Kahneman, D. (1973). Attention and effort. Englewood Cliffs, NJ: Prentice Hall.Kane, M. J., Hambrick, D. Z., Tuholski, S. W., Wilhelm, O., Payne, T. W., & Engle, R.
W. (2004). The generality of working memory capacity: A latent-variable approach to verbal and visuospatial memory span and reasoning. Journal of Experimental Psychol-ogy: General, 133, 189–217.
Kyllonen, P. C. (1993). Aptitude testing inspired by information processing: A test of the four-sources model. The Journal of General Psychology, 120, 375–405.
Kyllonen, P. C., & Christal, R. E. (1990). Reasoning ability is (little more than) working-memory capacity. Intelligence, 14, 389–433.
Kyllonen, P. C., Lohman, D. F., & Snow, R. E. (1984). Effects of aptitudes, strategy train-ing, and task facets on spatial task performance. Journal of Educational Psychology, 76, 130–145.
Lajoie, S. P. (2003). Individual differences in spatial ability: Developing technologies to increase strategy awareness and skills. Educational Psychologist, 38, 115–125.
Landy, F. J., & Becker, W. S. (1987). Motivation theory reconsidered. Research in Orga-nizational Behavior, 9, 1–38.
Lemaire, P., & Siegler, R. S. (1995). Four aspects of strategic change: Contributions to children’s learning of multiplication. Journal of Experimental Psychology: General, 124, 83–97.
Lohman, D. F., & Kyllonen, P. C. (1983). Individual differences in solution strategy on spatial tasks. In D. F. Dillon & R. R. Schmeck (Eds.), Individual differences in cognition (pp. 105–135). New York: Academic.
Maruyama, K., & Kitamura, S. (1961). Speed anticipation test: A test for discrimination of accident proneness in motor driver. Tohoku Psychological Folia, 20, 13–20.
McNamara, D. S., & Scott, J. L. (2001). Working memory capacity and strategy use. Memory & Cognition, 29, 10–17.
Miyake, A., Friedman, N. P., Rettinger, D. A., Shah, P., & Hegarty, M. (2001). How are visuospatial working memory, executive functioning, and spatial abilities related? A latent-variable analysis. Journal of Experimental Psychology: General, 130, 621–640.

68 The Journal of General Psychology
Mone, M. A., & Shalley, C. E. (1995). Effects of task complexity and goal speci-ficity on change in strategy and performance over time. Human Performance, 8, 243–262.
Navon, D. (1990). Exploring two methods for estimating performance tradeoff. Bulletin of the Psychonomic Society, 28, 155–159.
Navon, D., & Gopher, D. (1979). On the economy of the human processing system. Psy-chological Review, 86, 214–255.
O’Donnell, R. D., & Eggemeier, F. T. (1986). Workload assessment methodology. In K. R. Boff, L. Kaufman, & J. P. Thomas (Eds.), Handbook of perception and human per-formance (Vol. 2, pp. 4210–4249). New York: Wiley.
Pellegrino, J. W., & Hunt, E. (1989). Computer-controlled assessment of static and dynamic spatial reasoning. In R. Dillon & J. W. Pellegrino (Eds.), Testing: Theoretical and applied perspectives (pp. 174–198). New York: Praeger.
Peña, D., Contreras, M. J., Shih, P. C., & Santacreu, J. (2008). Solution strategies as possible explanations of individual and sex differences in a dynamic spatial task. Acta Psychologica, 128, 1–14.
Reder, L. M. (1987). Strategy selection in question answering. Cognitive Psychology, 19, 90–137.
Reder, L. M., & Schunn, C. D. (1999). Bringing together the psychometric and strategy worlds: Predicting adaptivity in a dynamic task. In D. Gopher & A. Koriat (Eds.), Cogni-tive regulation of performance: Interactions of theory and applications. Attention and performance, XVII (pp. 315–342). Cambridge, MA: MIT Press.
Rubio, V. J., & Santacreu, J. (2003). Test adaptativo informatizado para la evaluación del razonamiento secuencial y la inducción como factores de la habilidad intelectual gen-eral (TRASI) [Adaptive computerized test to assess sequential reasoning and induction as factors of general intellectual ability]. Madrid, Spain: TEA Ediciones.
Salthouse, T. A. (1994). Age-related differences in basic cognitive processes: Implications for work. Experimental Aging Research, 20, 249–255.
Salthouse, T. A. (1996). The processing speed theory of adult age differences in cognition. Psychological Review, 103, 403–428.
Santacreu, J. (1999). SODT-R and SVDT-R. Dynamic computerized test for the assessment of spatial ability (revised versions) [Technical report]. Madrid, Spain: Autonomous University of Madrid.
Santacreu, J. (2001). Estimation of arrival time test (EAT-Test) [Technical report]. Madrid, Spain: Autonomous University of Madrid.
Schunn, C. D., & Reder, L. M. (2001). Another source of individual differences: Strategy adaptiv-ity to changing rates of success. Journal of Experimental Psychology: General, 130, 59–76.
Siegler, R. S. (1996). Emerging minds: The process of change in children’s thinking. New York: Oxford University Press.
Siegler, R. S., & Lemaire, P. (1997). Older and younger adults’ strategy choices in multi-plication: Testing predictions of ASCM using the choice/no-choice method. Journal of Experimental Psychology: General, 126, 71–92.
Spearman, C. (1904). “General intelligence,” objectively determined and measured. American Journal of Psychology, 15, 201–293.
Spearman, C. (1927). Abilities of man. London: Macmillan.Turley-Ames, K., & Whitfield, M. M. (2003). Strategy training and working memory task
performance. Journal of Memory & Language, 49, 446–468.Wickens, C. D. (1984). Processing resources in attention. In R. Parasuraman & D. R.
Davies (Eds.), Varieties of attention (pp. 63–101). New York: Academic Press.Wickens, C. D. (2002). Multiple resources and performance prediction. Theoretical Issues
in Ergonomics Science, 3, 159–177.

Botella, Peña, Contreras, Shih, & Santacreu 69
Wickens, T. D. (2002). Elementary signal detection theory. New York: Oxford Uni-versity Press.
Wood, R. E., Mento, A. J., & Locke, E. A. (1987). Task complexity as a moderator of goal effects: A meta-analysis. Journal of Applied Psychology, 72, 416–425.
Manuscript submitted August 14, 2007Revision accepted for publication December 8, 2007
��������������������������������������������������������������������������������������������������������������������������������������������������������������������������������������������������������������������������������������������������������������������������������������������������������������������������������������������������������������������������������������������������������������������������������������
������ ���������� ������������������ ���� ����
�����������������������������������������������������������
����������������������������������������������������������������������������������������������������������������������������
������������������������������������
�������������������������������������������������������������������������������������
������ ��� ������� ��� ������������������������������������������ �������������� � ��� �������������������������� ��� ������ ����������������������

������������������������������������������
���������������������������������������������������������������������������������������������������������������������������������������������������������������������������������������������������������������������������������������������������������������������������������������������������������������������������������������������������������������������������������������������������������������������������������������������������������������������������������������������������������������������������������������������������������������������������������������������������������������
� �� ������������������������������������������������������������������������������������������� � ����������� �� ���������������������������������������������������������� �� ��������������������������������������������������������������������������������������� � ����������������� �� ���������������������������������������������������������������������������� �� ����������������������������������������������������������������
�����������������������������������������������������������
����������������������������������������������������������������������������������������������������������������������������
������������������������������������
�������������������������������������������������������������������������������������
������ ��� ������� ���� ������������������������������������������ �������������� � ��� �������������������������� ��� ������ ����������������������