Performance and Tuning Series: Monitoring with sp_sysmon
118
PERFORMANCE AND TUNING GUIDE | PUBLIC SAP Adaptive Server Enterprise 16.0 SP03 Document Version: 1.0 – 2019-01-15 Performance and Tuning Series: Monitoring with sp_sysmon © 2019 SAP SE or an SAP affiliate company. All rights reserved. THE BEST RUN
-
Upload
khangminh22 -
Category
Documents
-
view
0 -
download
0
Transcript of Performance and Tuning Series: Monitoring with sp_sysmon

PERFORMANCE AND TUNING GUIDE | PUBLICSAP Adaptive Server Enterprise 16.0 SP03Document Version: 1.0 – 2019-01-15
Performance and Tuning Series: Monitoring with sp_sysmon
© 2
019
SAP
SE o
r an
SAP affi
liate
com
pany
. All
right
s re
serv
ed.
THE BEST RUN

Content
1 Introduction to sp_sysmon. . . . . . . . . . . . . . . . . . . . . . . . . . . . . . . . . . . . . . . . . . . . . . . . . . . . . 51.1 Using sp_sysmon. . . . . . . . . . . . . . . . . . . . . . . . . . . . . . . . . . . . . . . . . . . . . . . . . . . . . . . . . . . . . 5
When to Run sp_sysmon. . . . . . . . . . . . . . . . . . . . . . . . . . . . . . . . . . . . . . . . . . . . . . . . . . . . . 61.2 Invoking sp_sysmon. . . . . . . . . . . . . . . . . . . . . . . . . . . . . . . . . . . . . . . . . . . . . . . . . . . . . . . . . . . 7
Fixed-Time Intervals. . . . . . . . . . . . . . . . . . . . . . . . . . . . . . . . . . . . . . . . . . . . . . . . . . . . . . . . .8Using begin_sample and end_sample. . . . . . . . . . . . . . . . . . . . . . . . . . . . . . . . . . . . . . . . . . . . 8Specifying Report Sections for Output. . . . . . . . . . . . . . . . . . . . . . . . . . . . . . . . . . . . . . . . . . . .8Specifying the Application Detail Parameter. . . . . . . . . . . . . . . . . . . . . . . . . . . . . . . . . . . . . . . 10Using the noclear Option. . . . . . . . . . . . . . . . . . . . . . . . . . . . . . . . . . . . . . . . . . . . . . . . . . . . 10Using the dumpcounters Parameter. . . . . . . . . . . . . . . . . . . . . . . . . . . . . . . . . . . . . . . . . . . . . 11Redirecting Output to a File. . . . . . . . . . . . . . . . . . . . . . . . . . . . . . . . . . . . . . . . . . . . . . . . . . . 12
2 Monitoring Performance with sp_sysmon. . . . . . . . . . . . . . . . . . . . . . . . . . . . . . . . . . . . . . . . . 132.1 How to Use the Reports. . . . . . . . . . . . . . . . . . . . . . . . . . . . . . . . . . . . . . . . . . . . . . . . . . . . . . . . 13
Header Information. . . . . . . . . . . . . . . . . . . . . . . . . . . . . . . . . . . . . . . . . . . . . . . . . . . . . . . . 13Reading Output. . . . . . . . . . . . . . . . . . . . . . . . . . . . . . . . . . . . . . . . . . . . . . . . . . . . . . . . . . . 14Interpreting the Data. . . . . . . . . . . . . . . . . . . . . . . . . . . . . . . . . . . . . . . . . . . . . . . . . . . . . . . 15
2.2 Cache Wizard. . . . . . . . . . . . . . . . . . . . . . . . . . . . . . . . . . . . . . . . . . . . . . . . . . . . . . . . . . . . . . . 16Cache Wizard Syntax. . . . . . . . . . . . . . . . . . . . . . . . . . . . . . . . . . . . . . . . . . . . . . . . . . . . . . . 17Prepare to Run the Cache Wizard. . . . . . . . . . . . . . . . . . . . . . . . . . . . . . . . . . . . . . . . . . . . . . .18Understand the Cache Wizard Output. . . . . . . . . . . . . . . . . . . . . . . . . . . . . . . . . . . . . . . . . . . 18Sample Output of Cache Wizard. . . . . . . . . . . . . . . . . . . . . . . . . . . . . . . . . . . . . . . . . . . . . . . 19
2.3 Kernel Utilization. . . . . . . . . . . . . . . . . . . . . . . . . . . . . . . . . . . . . . . . . . . . . . . . . . . . . . . . . . . . .21Kernel Utilization in Threaded Mode. . . . . . . . . . . . . . . . . . . . . . . . . . . . . . . . . . . . . . . . . . . . . 21Kernel Utilization in Process Mode. . . . . . . . . . . . . . . . . . . . . . . . . . . . . . . . . . . . . . . . . . . . . .29Bucketpool Activity. . . . . . . . . . . . . . . . . . . . . . . . . . . . . . . . . . . . . . . . . . . . . . . . . . . . . . . . 36
2.4 Worker Process Management. . . . . . . . . . . . . . . . . . . . . . . . . . . . . . . . . . . . . . . . . . . . . . . . . . . .37Worker Process Requests. . . . . . . . . . . . . . . . . . . . . . . . . . . . . . . . . . . . . . . . . . . . . . . . . . . . 38Worker Process Usage. . . . . . . . . . . . . . . . . . . . . . . . . . . . . . . . . . . . . . . . . . . . . . . . . . . . . . 38Memory Requests for Worker Processes. . . . . . . . . . . . . . . . . . . . . . . . . . . . . . . . . . . . . . . . . 39Avg Mem Ever Used By a WP. . . . . . . . . . . . . . . . . . . . . . . . . . . . . . . . . . . . . . . . . . . . . . . . . 39
2.5 Parallel Query Management. . . . . . . . . . . . . . . . . . . . . . . . . . . . . . . . . . . . . . . . . . . . . . . . . . . . .40Parallel Query Usage. . . . . . . . . . . . . . . . . . . . . . . . . . . . . . . . . . . . . . . . . . . . . . . . . . . . . . . 40Merge Lock Requests. . . . . . . . . . . . . . . . . . . . . . . . . . . . . . . . . . . . . . . . . . . . . . . . . . . . . . . 41Sort Buffer Waits. . . . . . . . . . . . . . . . . . . . . . . . . . . . . . . . . . . . . . . . . . . . . . . . . . . . . . . . . . 41
2.6 Task Management. . . . . . . . . . . . . . . . . . . . . . . . . . . . . . . . . . . . . . . . . . . . . . . . . . . . . . . . . . . . 41Connections Opened. . . . . . . . . . . . . . . . . . . . . . . . . . . . . . . . . . . . . . . . . . . . . . . . . . . . . . . 42
2 P U B L I CPerformance and Tuning Series: Monitoring with sp_sysmon
Content

Task Context Switches by Engine. . . . . . . . . . . . . . . . . . . . . . . . . . . . . . . . . . . . . . . . . . . . . . .43Task Context Switches Due To. . . . . . . . . . . . . . . . . . . . . . . . . . . . . . . . . . . . . . . . . . . . . . . . .43
2.7 Application Management. . . . . . . . . . . . . . . . . . . . . . . . . . . . . . . . . . . . . . . . . . . . . . . . . . . . . . . 51Application Statistics Summary (All Applications). . . . . . . . . . . . . . . . . . . . . . . . . . . . . . . . . . 53Per Application or Per Application and Login. . . . . . . . . . . . . . . . . . . . . . . . . . . . . . . . . . . . . . .55
2.8 ESP Management. . . . . . . . . . . . . . . . . . . . . . . . . . . . . . . . . . . . . . . . . . . . . . . . . . . . . . . . . . . . 562.9 Housekeeper Task Activity. . . . . . . . . . . . . . . . . . . . . . . . . . . . . . . . . . . . . . . . . . . . . . . . . . . . . . 572.10 Monitor Access to Executing SQL. . . . . . . . . . . . . . . . . . . . . . . . . . . . . . . . . . . . . . . . . . . . . . . . . 582.11 Transaction Profile. . . . . . . . . . . . . . . . . . . . . . . . . . . . . . . . . . . . . . . . . . . . . . . . . . . . . . . . . . . 58
Transaction Summary. . . . . . . . . . . . . . . . . . . . . . . . . . . . . . . . . . . . . . . . . . . . . . . . . . . . . . 59Transaction Detail. . . . . . . . . . . . . . . . . . . . . . . . . . . . . . . . . . . . . . . . . . . . . . . . . . . . . . . . . 60Inserts. . . . . . . . . . . . . . . . . . . . . . . . . . . . . . . . . . . . . . . . . . . . . . . . . . . . . . . . . . . . . . . . . 61Updates and Update Detail Sections. . . . . . . . . . . . . . . . . . . . . . . . . . . . . . . . . . . . . . . . . . . . 63Deletes. . . . . . . . . . . . . . . . . . . . . . . . . . . . . . . . . . . . . . . . . . . . . . . . . . . . . . . . . . . . . . . . . 64
2.12 Transaction Management. . . . . . . . . . . . . . . . . . . . . . . . . . . . . . . . . . . . . . . . . . . . . . . . . . . . . . 64ULC Flushes to Xact Log. . . . . . . . . . . . . . . . . . . . . . . . . . . . . . . . . . . . . . . . . . . . . . . . . . . . .65Total ULC Flushes. . . . . . . . . . . . . . . . . . . . . . . . . . . . . . . . . . . . . . . . . . . . . . . . . . . . . . . . . 69ULC Flushes Skipped. . . . . . . . . . . . . . . . . . . . . . . . . . . . . . . . . . . . . . . . . . . . . . . . . . . . . . . 69ULC Log Records. . . . . . . . . . . . . . . . . . . . . . . . . . . . . . . . . . . . . . . . . . . . . . . . . . . . . . . . . . 69Max ULC Size During Sample. . . . . . . . . . . . . . . . . . . . . . . . . . . . . . . . . . . . . . . . . . . . . . . . . 70ML-DMLs Sub-Command Scans. . . . . . . . . . . . . . . . . . . . . . . . . . . . . . . . . . . . . . . . . . . . . . . 70ML-DMLs ULC Efficiency . . . . . . . . . . . . . . . . . . . . . . . . . . . . . . . . . . . . . . . . . . . . . . . . . . . . 70Total ML-DML Sub-Commands. . . . . . . . . . . . . . . . . . . . . . . . . . . . . . . . . . . . . . . . . . . . . . . . 71ULC Semaphore Requests. . . . . . . . . . . . . . . . . . . . . . . . . . . . . . . . . . . . . . . . . . . . . . . . . . . .71Log Semaphore Requests. . . . . . . . . . . . . . . . . . . . . . . . . . . . . . . . . . . . . . . . . . . . . . . . . . . . 71Transaction Log Writes. . . . . . . . . . . . . . . . . . . . . . . . . . . . . . . . . . . . . . . . . . . . . . . . . . . . . . 72Transaction Log Allocations. . . . . . . . . . . . . . . . . . . . . . . . . . . . . . . . . . . . . . . . . . . . . . . . . . 72Avg # Writes per Log Page. . . . . . . . . . . . . . . . . . . . . . . . . . . . . . . . . . . . . . . . . . . . . . . . . . . 72Tuning Recommendations for Transaction Management . . . . . . . . . . . . . . . . . . . . . . . . . . . . . . 72
2.13 Index Management. . . . . . . . . . . . . . . . . . . . . . . . . . . . . . . . . . . . . . . . . . . . . . . . . . . . . . . . . . . 72Nonclustered Maintenance. . . . . . . . . . . . . . . . . . . . . . . . . . . . . . . . . . . . . . . . . . . . . . . . . . . 73Page Splits. . . . . . . . . . . . . . . . . . . . . . . . . . . . . . . . . . . . . . . . . . . . . . . . . . . . . . . . . . . . . . 75Page Shrinks. . . . . . . . . . . . . . . . . . . . . . . . . . . . . . . . . . . . . . . . . . . . . . . . . . . . . . . . . . . . . 79Index Scans. . . . . . . . . . . . . . . . . . . . . . . . . . . . . . . . . . . . . . . . . . . . . . . . . . . . . . . . . . . . . 79
2.14 Metadata Cache Management. . . . . . . . . . . . . . . . . . . . . . . . . . . . . . . . . . . . . . . . . . . . . . . . . . . 79Open Object, Index, Partition, and Database Usage. . . . . . . . . . . . . . . . . . . . . . . . . . . . . . . . . . 80Descriptors Immediately Discarded. . . . . . . . . . . . . . . . . . . . . . . . . . . . . . . . . . . . . . . . . . . . . 81Object Manager Spinlock Contention. . . . . . . . . . . . . . . . . . . . . . . . . . . . . . . . . . . . . . . . . . . . 81Object and Index Spinlock Contention. . . . . . . . . . . . . . . . . . . . . . . . . . . . . . . . . . . . . . . . . . . 81Index Hash Spinlock Contention. . . . . . . . . . . . . . . . . . . . . . . . . . . . . . . . . . . . . . . . . . . . . . . 82Partition Spinlock Contention. . . . . . . . . . . . . . . . . . . . . . . . . . . . . . . . . . . . . . . . . . . . . . . . . 83
Performance and Tuning Series: Monitoring with sp_sysmonContent P U B L I C 3

Partition Hash Spinlock Contention. . . . . . . . . . . . . . . . . . . . . . . . . . . . . . . . . . . . . . . . . . . . . 832.15 Lock Management. . . . . . . . . . . . . . . . . . . . . . . . . . . . . . . . . . . . . . . . . . . . . . . . . . . . . . . . . . . 83
Sample Output. . . . . . . . . . . . . . . . . . . . . . . . . . . . . . . . . . . . . . . . . . . . . . . . . . . . . . . . . . . 85Lock Summary. . . . . . . . . . . . . . . . . . . . . . . . . . . . . . . . . . . . . . . . . . . . . . . . . . . . . . . . . . . 85Lock Detail. . . . . . . . . . . . . . . . . . . . . . . . . . . . . . . . . . . . . . . . . . . . . . . . . . . . . . . . . . . . . . 86Deadlocks by Lock Type. . . . . . . . . . . . . . . . . . . . . . . . . . . . . . . . . . . . . . . . . . . . . . . . . . . . . 88Deadlock Detection. . . . . . . . . . . . . . . . . . . . . . . . . . . . . . . . . . . . . . . . . . . . . . . . . . . . . . . . 89Lock Promotions. . . . . . . . . . . . . . . . . . . . . . . . . . . . . . . . . . . . . . . . . . . . . . . . . . . . . . . . . . 90Lock Time-out Information. . . . . . . . . . . . . . . . . . . . . . . . . . . . . . . . . . . . . . . . . . . . . . . . . . . 90Cluster Lock Summary . . . . . . . . . . . . . . . . . . . . . . . . . . . . . . . . . . . . . . . . . . . . . . . . . . . . . 90
2.16 Data Cache Management. . . . . . . . . . . . . . . . . . . . . . . . . . . . . . . . . . . . . . . . . . . . . . . . . . . . . . 92Sample Output of Data Cache Management Categories. . . . . . . . . . . . . . . . . . . . . . . . . . . . . . .92Cache Statistics Summary (All Caches). . . . . . . . . . . . . . . . . . . . . . . . . . . . . . . . . . . . . . . . . .94Cache Management by Cache. . . . . . . . . . . . . . . . . . . . . . . . . . . . . . . . . . . . . . . . . . . . . . . . .98
2.17 Procedure Cache Management. . . . . . . . . . . . . . . . . . . . . . . . . . . . . . . . . . . . . . . . . . . . . . . . . .1032.18 Memory Management. . . . . . . . . . . . . . . . . . . . . . . . . . . . . . . . . . . . . . . . . . . . . . . . . . . . . . . . 1042.19 Recovery Management. . . . . . . . . . . . . . . . . . . . . . . . . . . . . . . . . . . . . . . . . . . . . . . . . . . . . . . 104
Checkpoints. . . . . . . . . . . . . . . . . . . . . . . . . . . . . . . . . . . . . . . . . . . . . . . . . . . . . . . . . . . . 105Average Time Per Normal Checkpoint. . . . . . . . . . . . . . . . . . . . . . . . . . . . . . . . . . . . . . . . . . 106Average Time Per Free Checkpoint. . . . . . . . . . . . . . . . . . . . . . . . . . . . . . . . . . . . . . . . . . . . .106Increasing the Housekeeper Batch Limit. . . . . . . . . . . . . . . . . . . . . . . . . . . . . . . . . . . . . . . . 106
2.20 Disk I/O Management. . . . . . . . . . . . . . . . . . . . . . . . . . . . . . . . . . . . . . . . . . . . . . . . . . . . . . . . 107Maximum Outstanding I/Os. . . . . . . . . . . . . . . . . . . . . . . . . . . . . . . . . . . . . . . . . . . . . . . . . 108I/Os Delayed By. . . . . . . . . . . . . . . . . . . . . . . . . . . . . . . . . . . . . . . . . . . . . . . . . . . . . . . . . . 108Requested and Completed Disk I/Os. . . . . . . . . . . . . . . . . . . . . . . . . . . . . . . . . . . . . . . . . . . 109Device Activity Detail. . . . . . . . . . . . . . . . . . . . . . . . . . . . . . . . . . . . . . . . . . . . . . . . . . . . . . .110
2.21 Network I/O Management. . . . . . . . . . . . . . . . . . . . . . . . . . . . . . . . . . . . . . . . . . . . . . . . . . . . . .1112.22 Replication Agent. . . . . . . . . . . . . . . . . . . . . . . . . . . . . . . . . . . . . . . . . . . . . . . . . . . . . . . . . . . .112
4 P U B L I CPerformance and Tuning Series: Monitoring with sp_sysmon
Content

1 Introduction to sp_sysmon
sp_sysmon provides a detailed report of the activity on your system, and provides you with a number of ways to specify the type of information you want to receive, the time interval during which data for the report will be collected, and other options that determine how the report is generated.
1.1 Using sp_sysmon
The sp_sysmon report consists of a number of separate sections. You can run sp_sysmon to generate the complete report or only one of the individual sections. You can also specify a time interval over which the report should run or execute the stored procedure yourself at the beginning and end of the desired time period.
The syntax for sp_sysmon is:
sp_sysmon {'begin_sample' | {{'end_sample' | '<interval>'}[, section]}} [, <applmon>= {'appl_only' | 'appl_and_login' | 'no_appl' | 'noclear' | 'clear'} [, <filter>={<cache_wizard_filter_value> | 'noclear' | 'clear'} [, <dumpcounters>={'y' | 'n' | 'noclear' | 'clear' | NULL} [, <option>={'noclear' | 'clear' | NULL}]]]]
sp_sysmon reports monitoring data only from the sample period. Make sure you make decisions about tuning based on representative data. For example, to tune spinlocks, base decisions on data from a peak utilization report. However, base a decision to decrease the number of engines on a number of samples representing typical and peak workloads.
The data for the report is collected from a set of monitor counters that are maintained by SAP® Adaptive Server® Enterprise. These counters are also used by other applications. By default, sp_sysmon does not clear these counters when it is invoked, allowing you to run multiple iterations of sp_sysmon, and preventing sp_sysmon from interfering with applications that use the monitoring tables or other applications that use the monitoring counters.
Use the clear parameter only when you are running sp_sysmon with the begin_sample or end_sample parameters. sp_sysmon clears the monitor counters automatically when you specify the begin_sample parameter. sp_sysmon exits with an error if you include the begin_sample and end_sample parameter. Clearing the counters can interfere with other applications using the counters, causing the data they report to be invalid.
CautionTo control whether sp_sysmon clears the counters, specify the noclear option. The noclear parameter is enabled by default when you specify a sample interval. When you specify the noclear parameter, sp_sysmon does not clear the counters, which allows sp_sysmon to run at the same time as other sp_sysmon sessions. By default, noclear is enabled when you run sp_sysmon using a sample interval, and disabled when you run sp_sysmon using the <begin_> and <end_sample> parameters. Consquently,
Performance and Tuning Series: Monitoring with sp_sysmonIntroduction to sp_sysmon P U B L I C 5

specifing the clear parameter, or running sp_sysmon with the begin_sample parameter may impact on other sp_sysmon sessions and other applications using the monitoring tables
sp_sysmon contributes approximately 5 to 7 percent overhead while it runs on a single CPU server, and more on multiprocessor servers (the percentages may be different for your site). The amount of overhead increases with the number of CPUs.sp_sysmon noclear uses the same internal counters. When not run with the option, sp_sysmon resets these counters to 0.
There are counters shared between sp_sysmon and the monitoring tables. Executing sp_sysmon...clear may cause data reported by other, concurrently run sp_sysmon sessions to be incorrect..
The performance tuning tips for sp_sysmon are based on the sampling interval you supply with sp_sysmon. Review the recommendations thoroughly, based on your system requirements, before you incorporate them in your production system. You should set up a test area with your data, and test any changes before you implement any of the recommendations.
Since sp_sysmon provides a snapshot view of the system, you may need to reconsider recommendations when the workload changes.
NoteYou cannot run sp_sysmon on an SAP ASE server with a tempdb that is the default size. Increase the size of tempdb by at least 2MB so that the SAP ASE server does not run out of log space on the temporary databases.
Related Information
Using the noclear Option [page 10]
1.1.1 When to Run sp_sysmon
You can run sp_sysmon before and after tuning SAP ASE configuration parameters to gather data for comparison. This data gives you a basis for performance tuning and lets you observe the results of configuration changes.
Use sp_sysmon when the system exhibits behavior you want to investigate. For example, to find out how the system behaves under typically loaded conditions, run sp_sysmon when conditions are normal and typically loaded. For example, consider whether it makes sense to run sp_sysmon for 10 minutes starting at 7:00 p.m., which is before batch jobs begin and after most of the day’s OLTP users have left the site. Instead, run sp_sysmon during the normal OLTP load and during batch jobs.
In many tests, it is best to start the applications first, and start sp_sysmon when the caches are likely to have reached a steady state. If you are trying to measure capacity, be sure that the amount of work you give the server keeps it busy for the duration of the test.
Many of the statistics, especially those that measure data per second, can look extremely low if the server is idle during part of the sample interval.
6 P U B L I CPerformance and Tuning Series: Monitoring with sp_sysmon
Introduction to sp_sysmon

In general, sp_sysmon produces valuable information when you use it:
● Before and after cache or pool configuration changes● Before and after any sp_configure changes that may effect performance (for example, changes to
memory sizes, caches, or disk I/O related options)● Before and after the addition of new queries to your application mix● Before and after an increase or decrease in the number of SAP ASE engines● When adding new disk devices and assigning objects● During peak periods, to look for contention or bottlenecks● During stress tests, to evaluate an SAP ASE configuration for a maximum expected application load● When performance seems slow or behaves abnormally
You may also find sp_sysmon to be helpful during query or application development. For example, when you are:
● Working with indexes and updates to see if certain updates reported as deferred_varcol are resulting in direct versus deferred updates
● Checking the caching behavior of particular queries or a mix of queries● Tuning the parameters and cache configuration for parallel index creation
1.2 Invoking sp_sysmon
sp_sysmon requires you to set enable monitoring to true (enabled), and that the user have the mon_role role.
For example:
sp_configure 'enable monitoring', 1 grant role mon_role to sa
Use sp_sysmon with:
● A fixed time interval to provide a sample for a specified number of minutes● The begin_sample and end_sample parameters to start and stop sampling manually
Tailor the output to provide the information you need. You can:
● Print the entire report.● Print only one section of the report, such as “Cache Management” or “Lock Management.”● Include application-level detailed reporting for named applications (such as isql, bcp, or any named
application) and for combinations of named applications and user names. The default is to omit this section.
Performance and Tuning Series: Monitoring with sp_sysmonIntroduction to sp_sysmon P U B L I C 7

1.2.1 Fixed-Time Intervals
To invoke sp_sysmon, use isql to execute this command.
sp_sysmon <interval >[<, section> [, <applmon>]]
<interval> must be in the form “hh:mm:ss”. For example, to run sp_sysmon for 10 minutes, use:
sp_sysmon "00:10:00"
Related Information
Specifying the Application Detail Parameter [page 10]
1.2.2 Using begin_sample and end_sample
Use the begin_sample and end_sample parameters to invoke sp_sysmon to start sampling, issue queries, and end the sample and print the results at any point in time.
For example:
sp_sysmon begin_sample execute proc1execute proc2select sum(total_sales) from titles sp_sysmon end_sample
NoteOn systems with many CPUs and high activity, counters can overflow if the sample period is too long.
If you see negative numbers in sp_sysmon output, reduce the sample time.
1.2.3 Specifying Report Sections for Output
To print a single section of the report, use one of the values listed in in this table for the <section> parameter.
Report Section Parameter
Application Management appmgmt
Cache Wizard cache wizard
8 P U B L I CPerformance and Tuning Series: Monitoring with sp_sysmon
Introduction to sp_sysmon

Report Section Parameter
Data Cache Management dcache
Disk I/O Management diskio
ESP Management esp
Housekeeper Task Activity housekeeper
Index Management indexmgmt
Kernel Utilization kernel
Lock Management locks
Memory Management memory
Metadata Cache Management mdcache*
Monitor Access to Executing SQL monaccess
Network I/O Management netio
Parallel Query Management parallel
Procedure Cache Management pcache
Recovery Management recovery
RepAgent repagent
Task Management taskmgmt
Transaction Management xactmgmt
Transaction Profile xactsum
Worker Process Management wpm
You can also obtain most of the information available through sp_sysmon mdcache report using sp_monitorconfig. See the Reference Manual: Procedures.
Performance and Tuning Series: Monitoring with sp_sysmonIntroduction to sp_sysmon P U B L I C 9

1.2.4 Specifying the Application Detail Parameter
If you specify the <applmon> parameter to sp_sysmon, the report includes detailed information by application, or by application and login name.
This parameter is valid only when you print the entire report or when you specify appmgmt for the section parameter. If you specify the application detail parameter and request any other section of the report, the application detail parameter is ignored.
The third parameter must be one of the following:
Parameter Information Reported
appl_only CPU, I/O, priority changes, and resource limit violations by application name.
appl_and_login CPU, I/O, priority changes, and resource limit violations by application name and login name. Can be used with all sections.
no_appl Skips the application and login section of the report. This is the default.
This example runs sp_sysmon for 5 minutes and prints the “Application Management” section, including the application and login detail report:
sp_sysmon "00:05:00", appmgmt, appl_and_login
Related Information
Per Application or Per Application and Login [page 55]
1.2.5 Using the noclear Option
By default, sp_sysmon does not clear the monitor counters that are used as source data for the report. If other applications, or instances of sp_sysmon, are running while sp_sysmon is executing, clearing the counters may cause the data that they report to be invalid.
NoteThe primarily purpose of the noclear parameter is to provide backward compatibility; earlier versions of sp_sysmon cleared monitor counters by default.
sp_sysmon creates a temporary table in which it stores initial counter values. In most cases, the impact of this activity on the duration of the sp_sysmon session is negligible.
You can also run multiple concurrent sessions of sp_sysmon reports when you do not specify the noclear parameter. Consider whether other running system monitoring applications use the monitor counters. If they do, avoid using the clear parameter or running sp_sysmon with the begin_sample parameter.
10 P U B L I CPerformance and Tuning Series: Monitoring with sp_sysmon
Introduction to sp_sysmon

When you execute sp_sysmon 'end_sample' from a session that is different from the one on which you executed 'begin_sample', sp_sysmon does not decrement the monitor counter usage count, and the SAP ASE server returns error message number 19374 to the client (because the monitor counters can only be disabled by a connection or session that has enabled them). This means that, if an application enables the monitor counters and does not disable them before logging out, the usage count continues to reflect the same number of users as it did before the application logged out.
1.2.6 Using the dumpcounters Parameter
The dumpcounters parameter returns the contents of the master..sysmonitors table as a result set (after returning the requested report sections). sp_sysmon parameters are positional, so you must include the appropriate number of parameters before the <dumpcounters> parameter, even if they are NULL.
The output from sp_sysmon ... <dumpcounters> is extensive; you may want to redirect it to a file for review.
This example includes the <dumpcounters> parameter (indicated by the ‘y’ at the end of the command):
sp_sysmon '00:0:10', kernel, "no_appl", "NULL", y
Kernel Utilization ------------------ Engine Utilization (Tick %) User Busy System Busy I/O Busy Idle -------------------------- ---------- ------------ --------- --------- ThreadPool : syb_default_pool Engine 0 0.0 % 0.0 % 1.0 % 99.0 % Average Runnable Tasks 1 min 5 min 15 min % of total -------------------------- ---------- ------------ --------- --------- ThreadPool : syb_default_pool Global Queue 0.0 0.0 0.0 0.0 % Engine 0 0.0 0.0 0.0 100.0 % -------------------------- ---------- ------------ --------- Server Summary Total 0.0 0.0 0.0 Average 0.0 0.0 0.0. . . ==================== Start of Raw Monitor Counter Output ======================field_name group_name field_id value------------------ ------------- -------- --------brespasses access 0 1xacts access 15 11locklastpage access 59 22230lockfirstpage access 61 3 . . . logrec_scanned xls 49 93logrec_filtered xls 50 93 (3241 rows affected)
Performance and Tuning Series: Monitoring with sp_sysmonIntroduction to sp_sysmon P U B L I C 11

1.2.7 Redirecting Output to a File
A full sp_sysmon report contains hundreds of lines of output. Use isql input and output redirect flags to save the output to a file.
For example, if you create a file named sysmon_in that contains this command to run sp_sysmon for 10 seconds:
sp_sysmon '00:00:10' go
Use the isql -o parameter to pipe the output to a file named sysmon_out:
$SYBASE/$SYBASE_OCS/bin/isql -Usa -P -Sbig_server -isysmon_in -osysmon_out
See Utility Guide for more information on isql.
12 P U B L I CPerformance and Tuning Series: Monitoring with sp_sysmon
Introduction to sp_sysmon

2 Monitoring Performance with sp_sysmon
This section describes sp_sysmon output, including suggestions for interpreting sp_sysmon output and deducing possible implications.
sp_sysmon output is most valuable when you understand your SAP ASE environment and its applications.
2.1 How to Use the Reports
sp_sysmon can give you information about SAP ASE system behavior before and after tuning. Study the entire report to understand the full impact of the changes you make.
Sometimes removing one performance bottleneck reveals another. Similarly, tuning efforts might improve performance in one area while actually causing performance degradation in another area.
In addition to pointing out areas for tuning work, sp_sysmon output is valuable in determining when further tuning will not pay off in additional performance gains. It is just as important to know when to stop tuning SAP ASE, or when the problem resides elsewhere, as it is to know what to tune.
A single sp_sysmon run presents resource utilization during the specific time interval. Make sure that the time intervals you use clearly represent the workload and situation for which you are tuning Adaptive Server.
Other information can contribute to interpreting sp_sysmon output:
● Information on the configuration parameters in use, from sp_configure or the configuration file● Information on the cache configuration and cache bindings, from sp_cacheconfig and sp_helpcache● Information on disk devices, segments, and the objects stored on them
2.1.1 Header Information
The sp_sysmon header includes general information about the current sp_sysmon run, including the version of SAP ASE, the date you ran sp_sysmon, start and end times, the length of the sample, and whether you named the server.
The header indicates what mode you ran sp_sysmon (whether you included noclear option), and when the counters were last cleared.
The header indicates whether you need to set any configuration parameters to gather monitor table information, and if you need to grant the mon_role role to the system administrator.
Performance and Tuning Series: Monitoring with sp_sysmonMonitoring Performance with sp_sysmon P U B L I C 13

Related Information
Using sp_sysmon [page 5]
2.1.2 Reading Output
sp_sysmon displays performance statistics in a consistent tabular format.
For example, in an SMP environment running seven SAP ASE server engines, the output looks similar to:
Engine Utilization (Tick %) CPU Busy I/O Busy Idle ------------------------ -------- -------- -------- Engine 0 68.7 % 2.5 % 28.8 % Engine 1 61.9 % 3.3 % 34.8 % Engine 2 67.0 % 2.4 % 30.6 % Engine 3 69.0 % 3.8 % 27.2 % Engine 4 60.2 % 2.7 % 37.2 % Engine 5 55.7 % 3.2 % 41.1 % Engine 6 53.8 % 3.2 % 43.0 % ------------------------ -------- -------- -------- Summary Total 436.3 % 21.1 % 242.6 % Average 62.3 % 3.0 % 34.7 %
2.1.2.1 Rows
Most rows represent a specific type of activity or event, such as acquiring a lock or executing a stored procedure.
When the data is related to CPUs, the rows show performance information for each SAP ASE engine in the SMP environment. Often, when there are groups of related rows, the last row is a summary of totals and an average.
The sp_sysmon report indents some rows to show that one category is a subcategory of another. In the following example, ELC, With Spinlock Held, W/o Spinlock Held, and Found in Wash are subcategories of Cache Hits, which is a subcategory of Cache Searches:
Cache Searches per sec per xact count % of total Cache Hits 1459395.3 1669.3 176586835 98.1 % ELC 0.0 0.0 0 0.0 % With Spinlock Held 30168.4 34.2 3620177 2.0 % W/o Spinlock Held 1429476.4 1664.4 172966658 96.0 % Found in Wash 0.0 0.0 0 0.0 % Cache Misses 28752.0 32.9 3478987 1.9 % ------------------------- ------------ ------------ ---------- Total Cache Searches 1488147.3 1702.2 180065822
Many rows are not printed when the “count” value is 0.
14 P U B L I CPerformance and Tuning Series: Monitoring with sp_sysmon
Monitoring Performance with sp_sysmon

2.1.2.2 Columns in Output
Unless otherwise stated, the columns in the examples of this section represent these performance statistics.
● “per sec”– average per second during sampling interval.● “per xact” – average per committed transaction during sampling interval.● “count” – total number during the sample interval.● “% of total” – varies, depending on context, as explained for each occurrence.
2.1.3 Interpreting the Data
When tuning SAP ASE server, the fundamental measures of success appear as increases in throughput and reductions in application response time. Unfortunately, tuning SAP ASE cannot be reduced to printing these two values.
In most cases, your tuning efforts must take an iterative approach, involving a comprehensive overview of SAP ASE activity, careful tuning and analysis of queries and applications, and monitoring locking and access on an object-by-object basis.
2.1.3.1 Per-Second and Per-Transaction Data
Weigh the importance of per-second and per-transaction data on the environment and the category you are measuring. The per-transaction data is generally more meaningful in benchmarks or in test environments where the workload is well-defined.
It is likely that you will find per-transaction data more meaningful for comparing test data than per-second data alone because, in a benchmark test environment, there is usually a well-defined number of transactions, making comparison straightforward. Per-transaction data is also useful for determining the validity of percentage results.
You may find it more useful to look at the per-second averages when you analyze workloads involving a large number of queries not executed inside a transaction (for example, select statements). The per-second analysis allows you to compare the tuning that affects these queries.
2.1.3.2 Percent of Total and Count Data
The meaning of the “% of total” data varies, depending on the context of the event and the totals for the category.
NoteWhen interpreting percentages, keep in mind that they are often useful for understanding general trends, but can be misleading when taken in isolation. For example, 50 percent of 200 events is much more meaningful than 50 percent of two events.
Performance and Tuning Series: Monitoring with sp_sysmonMonitoring Performance with sp_sysmon P U B L I C 15

The “count” data is the total number of events that occurred during the sample interval. You can use count data to determine the validity of percentage results.
2.1.3.3 Per Engine Data
In most cases, per-engine data for a category shows a fairly even balance of activity across all engines.
Two exceptions are:
● If you have fewer processes than CPUs, some of the engines will show no activity.● If most processes are performing fairly uniform activity, such as simple inserts and short selects, and one
process performs some I/O-intensive operation such as a large bulk copy, you will see unbalanced network and disk I/O.
2.1.3.4 Total or Summary Data
Summary rows provide an overview of SAP ASE engine activity by reporting totals and averages.
NoteBe careful when interpreting averages because they can give false impressions of true results when the data is skewed. For example, if one SAP ASE engine is working 98 percent of the time and another is working 2 percent of the time, a 49 percent average is misleading.
2.2 Cache Wizard
Cache Wizard can help you monitor and configure caches for optimal performance.
sp_sysmon cache wizard requires that you enable the object lockwait timing configuration parameter.
Cache Wizard allows you to identify:
● Hot objects (objects that are often accessed). The output is ranked by the number of logical reads in a named cache or default data cache.
● Spinlock contention on the cache.● The usage of the cache and buffer pools.● The percentage of hits at a cache, buffer pool, and object level.● The effectiveness of large I/O.● The effectiveness of asynchronous prefetch (APF).● The cache occupancy by the various objects.
The Cache Wizard section appears in sp_sysmon output only when you specify the cache wizard in sp_sysmon syntax. You can include two parameters with Cache Wizard, topN and filter. sp_sysmon does
16 P U B L I CPerformance and Tuning Series: Monitoring with sp_sysmon
Monitoring Performance with sp_sysmon

not include other sections (Kernel Utilization, Worker Process Management, and so on) when you include cache wizard in the syntax.
sp_syntax includes a recommendation section at the end of its printout.
2.2.1 Cache Wizard Syntax
To obtain output from the cache wizard, use this syntax.
sp_sysmon begin_sample sp_sysmon { <end_sample> | <interval> } [, 'cache wizard' [, top_N [, filter] ] ]
Where:
● top_N – varchar datatype that limits the list of objects reported in the Object Section based on the ranking criteria for the number of logical reads in the specified interval (as displayed in the LR/sec column).The order of ranking is ascending or descending, based on whether the specified value is a positive or negative integer. Obtain the entire list of objects occupying the cache at the end of the interval by specifying a value of 0 (zero). The default value is 10.
● filter – varchar datatype that allows you to specify a pattern for the caches included in the report.For example, if you specify filter as default data cache, the report will contain only information about the default data cache. If you specify a filter value of emp%, the output includes information on all caches with a name matching this pattern.To display output for all caches, leave filter blank. The default data cache appears first, and is followed by the other caches in alphabetical order.
Example
This example runs the Cache Wizard against the default data cache for a 5-minute interval, showing the top 15 objects in the cache:
sp_sysmon '00:05:00','cache wizard','15','default data cache'
Related Information
Understand the Cache Wizard Output [page 18]
Performance and Tuning Series: Monitoring with sp_sysmonMonitoring Performance with sp_sysmon P U B L I C 17

2.2.2 Prepare to Run the Cache Wizard
sp_sysmon retrieves the information for the Cache Wizard from monitoring tables and monitor counters.
See Performance and Tuning Series: Monitoring Tables for more information.
The Cache Wizard report requires the following configuration parameters to be enabled. If these configuration parameters are not enabled, sp_sysmon automatically enables them at the beginning of the interval and disables them at the end (all these options are dynamic):
● enable monitoring – set to 1● per object statistics active – set to 1● object lockwait timing – set to 1
See Reference Manual: Configuration Parameters.
2.2.3 Understand the Cache Wizard Output
Cache Wizard output contains three main sections for each cache, followed by a recommendation section and a legend section at the end of the report.
● Cache section – provides summary statistics for a specific cache:
default data cache ------------------Run Size : 100.00Mb Usage% : 2.86LR/sec : 41.10 PR/sec: : 22.57 Hit%:45.9 Cache Partitions : 4 Spinlock Contention% : 0.00
○ Usage% – each time a set of pages is brought into the cache, SAP ASE tracks whether that page is referenced (used). When the page is removed from the cache, this count is reduced. Usage% is the current usage of the cache as a percentage of the cache size.
○ LR/sec (logical reads per second) – a logical read is any read from the cache (a hit) or a disk read (a miss). LR/sec is the number of logical reads in the cache during the interval divided by the length of the sample interval.
○ PR/sec (physical reads per second) – a physical read is a read from disk (miss). PR/sec is the number of physical reads in the cache during the interval divided by the sample interval.
○ Hit% – ratio of hits to total cache reads, such as the ratio of (LR/sec minus PR/sec) to LR/sec.● Buffer pool section – breaks down the cache section statistics into the various buffer pools in the cache:
Buffer Pool Information -----------------------------------------------------------------------IO Size Wash Size Run Size APF% LR/sec PR/sec Hit% APF-Eff% Usage% ------- --------- -------- ------ ------- ------ ------ -------- ------ 4 Kb 3276 Kb 16.00 Mb 10.00 0.47 0.13 71.43 n/a 0.20 2 Kb 17200 Kb 84.00 Mb 10.00 40.63 22.43 44.79 n/a 3.37
○ APF-Eff% – number of pages asynchronous prefetch uses, and the total number of pages asynchronous prefetch brings in.
○ Usage% – tracks whether a page brought into the buffer pool is referenced or not, providing the ratio of the pages referenced in the buffer pool to the run size of the buffer pool.
18 P U B L I CPerformance and Tuning Series: Monitoring with sp_sysmon
Monitoring Performance with sp_sysmon

● Object section – reports statistics on the objects occupying the cache at the end of the interval. Use the topN parameter to limit the size of this section. Objects display in the ascending order of PR/sec:
Object Statistics -----------------------------------------------------------------------Object LR/sec PR/sec Hit% Obj_Cached% Cache_Occp% ------------------------------- ------- ------- ------ ----------- ----- empdb.dbo.t1 0.57 0.30 47.06 56.25 0.02empdb.dbo.t2 0.30 0.30 0.00 56.25 0.02empdb.dbo.t3 0.30 0.30 0.00 56.25 0.02Object Obj Size Size in Cache ------------------------------- ----------- ------------ empdb.dbo.t1 32 Kb 18 Kb empdb.dbo.t2 32 Kb 18 Kb empdb.dbo.t3 32 Kb 18 Kb
● Recommendations section – gives a set of recommendations, where applicable, based on the data collected in the sample interval:
The various recommendations are as follows: Usage% for 'default data cache' is low (< 5%) Usage% for 4k buffer pool in cache:default data cache is low (< 5%)Consider using Named Caches or creating more cache partitions for'default data cache' or bothConsider increasing the 'wash size' of the 2k pool for 'default data cache' Consider adding a large I/O pool for 'default data cache'
● Legend section – explains the various terms used in the output. Some of the terms from the output are explained here in greater detail.
2.2.4 Sample Output of Cache Wizard
This sample shows output for the Cache Wizard.
sp_sysmon '00:00:30', 'cache wizard' =============================================================================Cache Wizard=============================================================================------------------default data cache------------------Run Size : 100.00 Mb Usage% : 2.86LR/sec : 41.10 PR/sec : 22.57 Hit%: 45.09 Cache Partitions: 4 Spinlock Contention%: 0.00Buffer Pool Information -----------------------------------------------------------------------------IO Size Wash Size Run Size APF% LR/sec PR/sec Hit% APF-Eff% Usage% ------- ---------- ----------- ------ -------- -------- ------ -------- ------ 4 Kb 3276 Kb 16.00 Mb 10.00 0.47 0.13 71.43 n/a 0.20 2 Kb 17200 Kb 84.00 Mb 10.00 40.63 22.43 44.79 n/a 3.37 (1 row affected)Object Statistics ----------------------------------------------------------------------------Object LR/sec PR/sec Hit% Obj_Cached% Cache_Occp% ----------------------------- ------- ------- ------ ----------- ----------- tempdb.dbo.t1 0.57 0.30 47.06 56.25 0.02 tempdb.dbo.t2 0.30 0.30 0.00 56.25 0.02 tempdb.dbo.t3 0.30 0.30 0.00 56.25 0.02 tempdb.dbo.t4 0.30 0.30 0.00 56.25 0.02 tempdb.dbo.t5 0.30 0.30 0.00 56.25 0.02 tempdb.dbo.t6 0.30 0.30 0.00 56.25 0.02
Performance and Tuning Series: Monitoring with sp_sysmonMonitoring Performance with sp_sysmon P U B L I C 19

tempdb.dbo.t8 0.30 0.30 0.00 56.25 0.02 tempdb.dbo.t7 0.57 0.20 64.71 62.50 0.02 tempdb.dbo.tempcachedobjstats 3.63 0.00 100.00 50.00 0.01 tempdb.dbo.tempobjstats 0.47 0.00 100.00 25.00 0.00 Object Obj Size Size in Cache ------------------------------ ----------- ------------- tempdb.dbo.t1 32 Kb 18 Kb tempdb.dbo.t2 32 Kb 18 Kb tempdb.dbo.t3 32 Kb 18 Kb tempdb.dbo.t4 32 Kb 18 Kb tempdb.dbo.t5 32 Kb 18 Kb tempdb.dbo.t6 32 Kb 18 Kb tempdb.dbo.t8 32 Kb 18 Kb tempdb.dbo.t7 32 Kb 20 Kb tempdb.dbo.tempcachedobjstats 16 Kb 8 Kb tempdb.dbo.tempobjstats 16 Kb 4 Kb --------- company_cache--------- Run Size : 1.00 Mb Usage% : 0.39 LR/sec : 0.07 PR/sec : 0.07 Hit%: 0.00 Cache Partitions: 1 Spinlock Contention%: 0.00Buffer Pool Information -----------------------------------------------------------------------------IO Size Wash Size Run Size APF% LR/sec PR/sec Hit% APF-Eff% Usage% ------- ---------- ----------- ------ -------- -------- ------ -------- ------ 2 Kb 204 Kb 1.00 Mb 10.00 0.07 0.07 0.00 n/a 0.39 Object Statistics -----------------------------------------------------------------------------Object LR/sec PR/sec Hit% Obj_Cached% Cache_Occp% -------------------- ------- ------- ------ ----------- ----------- empdb.dbo.history 0.07 0.07 0.00 25.00 0.39 Object Obj Size Size in Cache -------------------- ----------- ------------- empdb.dbo.history 16 Kb 4 Kb ------------- companydb_cache------------- Run Size : 5.00 Mb Usage% : 100.00 LR/sec : 380.97 PR/sec : 56.67 Hit%: 85.13 Cache Partitions: 1 Spinlock Contention%: 0.00 Buffer Pool Information -----------------------------------------------------------------------------IO Size Wash Size Run Size APF% LR/sec PR/sec Hit% APF-Eff% Usage% ------- --------- ----------- ------ ------- -------- ------ -------- ------ 2 Kb 1024 Kb 5.00 Mb 10.00 380.97 56.67 85.13 98.42 100.00 Object Statistics -----------------------------------------------------------------------------Object LR/sec PR/sec Hit% Obj_Cached% Cache_Occp%----------------------------- ------- ------- ------ ----------- ----------- company_db.dbo.emp_projects 41.07 22.80 44.48 19.64 9.45company_db.dbo.dept_det 93.03 20.67 77.79 99.08 54.53 company_db.dbo.emp_perf 116.70 2.63 97.74 97.77 34.18company_db.dbo.dept_locs 0.43 0.17 61.54 50.00 0.16 Object Obj Size Size in Cache ----------------------------- ----------- ------------- company_db.dbo.emp_projects 2464 Kb 484 Kb company_db.dbo.dept_det 2818 Kb 2792 Kb company_db.dbo.emp_perf 1790 Kb 1750 Kb company_db.dbo.dept_locs 16 Kb 8 Kb TUNING RECOMMENDATIONS -------------------------------------------------------------------- Usage% for 'default data cache' is low (< 5%) Usage% for 4k buffer pool in cache:default data cache is low (< 5%)Usage% for 2k buffer pool in cache:default data cache is low (< 5%)Usage% for 'company_cache' is low (< 5%) Usage% for 2k buffer pool in cache:company_cache is low (< 5%) Consider adding a large I/O pool for 'companydb_cache'
20 P U B L I CPerformance and Tuning Series: Monitoring with sp_sysmon
Monitoring Performance with sp_sysmon

LEGEND------ LR/sec - number of logical reads per second, i.e. sum of cache & disk readsPR/sec - number of physical reads per second i.e. disk readsRun Size - size of cache or buffer pool in KilobytesCache Partitions - number of cache partitionsSpinlock Contention% - Percentage spinlock contention for the cacheHit% - ratio of hits to total searchesUsage% - ratio of pages referenced to Run SizeWash Size - wash size of buffer pool in KilobytesAPF% - asynchronous prefetch % for this buffer poolAPF-Eff% - Ratio of buffers found in cache and brought in because of APF to the number of APF disk reads performedObject - combination of db, owner, object and index nameObj Size - size of the object in KilobytesSize in Cache - size occupied in cache in Kilobytes at the end of sampleObj_Cached% - Ratio of 'Size in Cache' to 'Obj Size' Cache_Occp% - Ratio of 'Size in Cache' to 'Run Size' of cache
2.3 Kernel Utilization
Kernel Utilization reports SAP ASE activities on how busy SAP ASE server engines were during the time the CPU was available to SAP ASE, how often the CPU yielded to the operating system, the number of times that the engines checked for network and disk I/O, and the average number of I/Os the engines found waiting at each check.
The Kernel Utilization section reports different information depending on whether you are running SAP ASE in threaded mode or process mode.
2.3.1 Kernel Utilization in Threaded Mode
This sample shows sp_sysmon output for Kernel Utilization in an environment with one thread pool, syb_default_pool, and three SAP ASE engines.
Kernel Utilization ------------------ Engine Utilization (Tick %) User Busy System Busy I/O Busy Idle ----------------------- ------------ ------------ ---------- -------- ThreadPool : syb_default_pool Engine 0 8.7 % 0.8 % 31.1 % 59.5 % Engine 1 8.0 % 0.1 % 33.2 % 58.7 % Engine 2 8.8 % 0.3 % 32.7 % 58.2 % Engine 3 15.0 % 0.3 % 32.6 % 52.0 % ------------------------- ------------ ------------ ---------- ------- Server Summary Total 40.4 % 1.6 % 129.6 % 228.4 % Average 10.1 % 0.4 % 32.4 % 57.1 % Average Runnable Tasks 1 min 5 min 15 min % of total ------------------------- ---------- ---------- ------- -------- ThreadPool : syb_default_pool Global Queue 0.0 0.0 0.0 0.0 % Engine 0 0.3 0.2 0.1 61.7 % Engine 1 0.0 0.0 0.0 0.7 % Engine 2 0.1 0.1 0.0 17.3 % ------------------------- ------------ ------------ ---------
Performance and Tuning Series: Monitoring with sp_sysmonMonitoring Performance with sp_sysmon P U B L I C 21

Pool Summary Total 0.5 0.3 0.1 Average 0.1 0.1 0.0 ------------------------- ------------ ------------ --------- Server Summary Total 0.5 0.3 0.1 Average 0.1 0.1 0.0 CPU Yields by Engine per sec per xact count % of total ------------------------- -------- ---------- -------- --------ThreadPool : syb_default_pool Engine 0 Full Sleeps 20.4 13.8 2442 4.2 % Interrupted Sleeps 81.7 55.4 9800 16.7 % Engine 1 Full Sleeps 22.8 15.5 2740 4.7 % Interrupted Sleeps 89.1 60.4 10697 18.3 % Engine 2 Full Sleeps 19.9 13.5 2390 4.1 % Interrupted Sleeps 93.4 63.3 11202 19.1 % Engine 3 Full Sleeps 17.8 12.1 2133 3.6 % Interrupted Sleeps 142.6 96.7 17113 29.2 % ------------------------- ------------ ------------ ---------- Pool Summary 487.6 330.6 58517 ------------------------- ------------ ------------ ---------- Total CPU Yields 487.6 330.6 58517 Thread Utilization (OS %) User Busy System Busy Idle ------------------------- ------------ ------------ ---------- ThreadPool : syb_blocking_pool : no activity during sample ThreadPool : syb_default_pool Thread 6 (Engine 0) 0.0 % 0.0 % 100.0 % Thread 7 (Engine 1) 0.2 % 0.0 % 99.8 % Thread 8 (Engine 2) 0.0 % 0.0 % 100.0 % ------------------------- ------------ ------------ ---------- Pool Summary Total 0.2 % 0.0 % 299.9 % Average 0.1 % 0.0 % 99.9 % ThreadPool : syb_system_pool Thread 10 (NetController) 0.1 % 0.0 % 99.9 % ------------------------- ------------ ------------ ---------- Pool Summary Total 1.1 % 0.0 % 400.0 % Average 0.0 % 0.0 % 100.0 % ------------------------- ------------ ------------ ---------- Server Summary Total 0.2 % 0.0 % 1099.8 % Average 0.0 % 0.0 % 100.0 %SAP ASE threads are consuming 0.0 CPU units.Throughput (committed xacts per CPU unit) : 275.0 Page Faults at OS per sec per xact count % of total ------------------------- -------- ---------- -------- -------- Minor Faults 0.6 0.4 69 100.0 % Major Faults 0.0 0.0 0 0.0 % ------------------------- -------- ---------- -------- -------- Total Page Faults 0.6 0.4 69 100.0 % Context Switches at OS per sec per xact count % of total ------------------------- -------- ---------- -------- -------- ThreadPool : syb_blocking_pool Voluntary 0.0 0.0 0 0.0 % Non-Voluntary 0.0 0.0 0 0.0 % ThreadPool : syb_default_pool Voluntary 43.6 130.7 1307 56.3 % Non-Voluntary 0.2 0.6 6 0.3 % ThreadPool : syb_system_pool Voluntary 33.7 101.0 1010 43.5 % Non-Voluntary 0.0 0.0 0 0.0 % ------------------------- ----------- ------------ ---------- --------- Total Context Switches 77.4 232.3 2323 100.0 % CtlibController Activity per sec per xact count % of total ------------------------- -------- ---------- -------- -------- Polls 1.0 0.7 120 n/a Polls Returning Events 0.0 0.0 0 0.0 %DiskController Activity per sec per xact count % of total
22 P U B L I CPerformance and Tuning Series: Monitoring with sp_sysmon
Monitoring Performance with sp_sysmon

------------------------- -------- ---------- -------- -------- Polls 35019.1 23741.8 4202292 n/a Polls Returning Events 351.2 238.1 42145 1.0 % Polls Returning Max Events 0.0 0.0 0 0.0 % Total Events 374.9 254.1 44984 n/a Events Per Poll n/a n/a 0.011 n/aNetController Activity per sec per xact count % of total ------------------------- -------- ---------- -------- -------- Polls 7919.5 5369.1 950338 n/a Polls Returning Events 2537.8 1720.5 304536 32.0 % Polls Returning Max Events 0.0 0.0 0 0.0 % Total Events 2537.8 1720.5 304536 n/a Events Per Poll n/a n/a 0.320 n/a Blocking Call Activity per sec per xact count % of total ------------------------- -------- ---------- -------- -------- Total Requests 0.0 0.0 0 n/aBucketpool Activity------------------- Bucketpool Name BucketSize Allocs/s AllocsMissed/s ------------------------- ----------- ---------------- -------------- Encrypted Columns Frag 32 137.6 0.0 Encrypted Columns Frag 64 85.3 0.0 Encrypted Columns Frag 96 0.0 0.0 Encrypted Columns Frag 128 12.0 0.0 Encrypted Columns Frag 160 8.0 0.0 Encrypted Columns Frag 192 4.0 0.0 Encrypted Columns Frag 224 8.2 0.0 Encrypted Columns Frag 256 0.0 0.0 Encrypted Columns Frag 288 0.0 0.0 Encrypted Columns Frag 320 0.0 0.0 Encrypted Columns Frag 352 0.0 0.0 LFB memory pool 32 0.0 0.0 LFB memory pool 64 0.0 0.0 LFB memory pool 96 0.0 0.0 LFB memory pool 128 0.0 0.0 LFB memory pool 160 0.0 0.0 LFB memory pool 192 0.0 0.0 LFB memory pool 224 0.0 0.0 LFB memory pool 256 0.0 0.0 LFB memory pool 288 0.0 0.0 LFB memory pool 320 0.0 0.0 LFB memory pool 352 0.0 0.0 LFB memory pool 384 0.0 0.0 LFB memory pool 416 0.0 0.0 LFB memory pool 448 0.0 0.0 LFB memory pool 480 0.0 0.0 LFB memory pool 512 0.0 0.0 LFB memory pool 544 0.0 0.0 LFB memory pool 576 0.0 0.0 LFB memory pool 608 0.0 0.0 LFB memory pool 640 0.0 0.0 Network Buffers 32 2416.9 0.0 Network Buffers 64 789.0 0.0 Network Buffers 96 250.9 0.0 Network Buffers 128 1147.5 0.0 Network Buffers 160 856.5 0.0 Network Buffers 192 71.7 0.0 Network Buffers 224 59.7 0.0 Network Buffers 256 71.7 0.0 Network Buffers 288 10536.5 0.0 Network Buffers 320 0.0 0.0 Network Buffers 352 35.8 0.0 -------------------------------------------------------------------
Performance and Tuning Series: Monitoring with sp_sysmonMonitoring Performance with sp_sysmon P U B L I C 23

2.3.1.1 Engine Utilization (Tick %)Engine Utilization (Tick %) reports the percentage of time the SAP ASE kernel is busy executing tasks on each SAP ASE server engine (rather than time spent idle) using an internal measurement (the “ticks”).
The output is grouped according to thread pools. Server Summary shows the total time for all pools.
Engine Utilization (Tick %) can help you decide whether there are too many or too few SAP ASE server engines.
The values reported on the Engine Utilization (Tick %) report may differ from the CPU usage values reported by operating system tools. When SAP ASE has no tasks to process, it enters a loop, looking for work before going to sleep. The alter thread pool ... idle timeout parameter controls the amount of time, in microseconds, Adaptive Server engines spend looping as they look for a runnable task before yielding the CPU.
To reduce the time that SAP ASE spends checking for runnable tasks, lower the value for the idle timeout thread pool parameter. However, decreasing the value for idle timeout can increase latency, decreasing performance.
When sp_sysmon samples the counters (by default, every 100 milliseconds), each engine indicates what it is currently doing. sp_sysmon reports how busy engines are, distinguishing between user and system tasks:
● “User Busy” – user tasks, for example, user connections.● “System Busy” – internal tasks, for example, the housekeeper.
For example, if executing a task, the engine reports "CPU Busy"; or, if idling, the engine reports "Idle". Engines are counted as "I/O Busy" if SAP ASE has any I/O outstanding and the engine is idle. If there is one I/O outstanding and three engines sitting idle, each engine is counted as "I/O Busy".
By checking sp_sysmon output for problems and tuning to alleviate contention, response time can remain high even when the engines report they are busy 80 to 90 percent of the time. If values are consistently very high (more than 90 percent), it is likely that response time and throughput could benefit from an additional engine.
The Engine Utilization (Tick %) values are averaged over the sample interval, so very high averages indicate that engines may be 100 percent busy during part of the interval. If the server experiences high CPU utilization, check for spinlock contention. In-memory table scans also increase CPU usage, which you can decrease by tuning queries appropriately.
When engine utilization is extremely high, the housekeeper wash task writes few or no pages to disk (since it runs only during idle CPU cycles.) This means that a checkpoint finds many pages that need to be written to disk, and the checkpoint process, a large batch job, or a database dump is likely to send CPU usage to 100 percent for a period of time, causing a perceptible decrease in response time.
If Engine Utilization (Tick %) percentages are consistently high, and you want to improve response time and throughput by adding SAP ASE server engines, check for increased resource contention in other areas after adding each engine.
In an environment where SAP ASE is serving a large number of users, performance is usually fairly evenly distributed across engines. However, when there are more engines than tasks, you may see some engines with a large percentage of utilization, and other engines may be idle. For example:
Engine Utilization (Tick %) User Busy System Busy I/O Busy Idle ------------------------- ------------ ------------ ---------- ------- ThreadPool : Marketing_pool Engine 3 78.0 % 4.5 % 3.4 % 18.0 %
24 P U B L I CPerformance and Tuning Series: Monitoring with sp_sysmon
Monitoring Performance with sp_sysmon

ThreadPool : syb_default_pool Engine 0 8.7 % .8 % 1.3 % 94.8 % Engine 1 87.0 % 5.2 % 3.5 % 19.4 % Engine 2 65.7 % 3.7 % 3.7 % 12.8 %
In an SMP environment, tasks have soft affinity to engines. Without other activity (such as lock contention) that might place a task in the global run queue, the task continues to run on the same engine.
2.3.1.2 Average Runnable Tasks
Average Runnable Tasks uses the runnable task averages from the monSysLoad monitoring table to provide 1-, 5-, and 15-minute averages of runnable tasks.
All running (and runnable) tasks on engines are included in this average. The minute intervals are fixed and do not vary with your configured sp_sysmon sample time.
The number of runnable tasks provides an excellent way to measure how busy the SAP ASE server is. For example, a server with an average Engine Utilization of 90 percent and a high number of runnable tasks is more likely to benefit from additional engines than a server with an average of 90 percent and a low number of runnable tasks.
Comparing the 1, 5, and 15 minute samples can help you determine if the load on the server is increasing, remaining stable, or decreasing.
2.3.1.3 CPU Yields by Engine
CPU Yields by Engine reports the number of times each SAP ASE server engine yielded to the operating system.
When an engine yields, it goes to sleep for a brief period of time. If there are no runnable tasks found when it wakes up, it goes to sleep again. The output is arranged according to thread pools and the engines associated with them. For each engine, sp_sysmon reports:
● Full Sleeps – the engine slept for its full sleep interval (that is, it did not receive a runnable task while it was sleeping). A full sleep most likely leads to another sleep. However, full sleeps do not contribute to latency.
● Interrupted Sleeps – the engine was prematurely woken from its sleep by a runnable task. An interrupted sleep most likely leads to a scheduled task. Interrupted sleeps may contribute to latency.
“% of total” data is the percentage of times an engine yielded as a percentage of the combined yields for all engines.
Total CPU Yields reports the combined data over all engines.
When an engine is not busy, it yields to the CPU after a period of time related to the idle timeout parameter.
● Engine Utilization Low/CPU Yields Low – a higher value for the I/O Busy% column than for the CPU Busy% column indicates a large amount of pending I/O. To solve bottlenecks in I/O processing, look for changes you can make at the operating system level.
● Engine Utilization Low/CPU Yields High – engine is inactive.
Performance and Tuning Series: Monitoring with sp_sysmonMonitoring Performance with sp_sysmon P U B L I C 25

● Engine Utilization High/CPU Yields Low – Adaptive Server is very busy and has jobs to run. Adding engines is likely to help performance. This value should also correlate with higher values for “Average Runnable Tasks.”
● Engine Utilization High/CPU Yields High – this should be the case when a normal number of user connections are running simple queries. Adding engines is unlikely to help, unless “Engine Utilization” is very high, or “Average Runnable” tasks is high.
● Most engine yields should be “full sleeps.” Overall latency may be increasing if “interrupted sleeps” account for more than 20 percent of total engine yields. To reduce latency, consider increasing the value for idle timeout. However, this adds to the CPU usage.
See alter thread pool in the Reference Manual: Commands.
2.3.1.4 Thread Utilization (OS %)
Thread Utilization (OS%) displays how much time each SAP ASE thread is consuming at the operating system level. This is the portion of time the thread was actually on a CPU.
Pool Summary indicates the percentage of thread use across thread pools. Server Summary describes the percentage of thread use across SAP ASE.
User time reports the percentage of time during the sp_sysmon sample interval the thread was executing code in the user space (that is, running in SAP ASE). “System time” reports the percentage of time during the sp_sysmon sample interval the thread was executing code in system space (that is, running in the operating system kernel). This distinction is unrelated to “User Busy” and “System Busy” reported in the Engine Utilization (Tick %) section.
Notesp_sysmon may show some threads with more than 100 percent utilization because of the way SAP ASE collects data.
When examining the Thread Utilization (OS%) output, consider:
● The value for Thread Utilization (OS%) should be higher than the value for Engine Utilization (Tick %). The difference between them is greatest when idle timeout is set to a high value and the workload is intermittent. For example, an engine that is 100 percent idle but has an idle timeout of -1 shows 0 percent engine utilization but 100 percent thread utilization.
● A value for Engine Utilization (Tick %) that is greater than the value for Thread Utilization (OS %) may indicate that the host is low on CPU resources. This generally indicates that the engine did not receive as much CPU time as needed, which can lead to significant performance degradations. The loss of performance may be severe if spinlock contention is also involved.
● High Thread Utilization (OS%) values for disk or network tasks may indicate that the system requires an additional disk or network task. For example, if the network task thread is 80 percent busy but the engine utilization is low, then a saturated network task is likely starving the engine for work. Adding a network task with sp_configure "number of network tasks" may alleviate the situation.
At the end of Thread Utilization (OS%), sp_sysmon reports how many CPU units Adaptive Server threads are consuming, and the throughput of committed transactions per CPU. For example:
Adaptive Server threads are consuming 5.6 CPU units.
26 P U B L I CPerformance and Tuning Series: Monitoring with sp_sysmon
Monitoring Performance with sp_sysmon

Throughput is 8238.0 commited xacts per CPU unit.
You can compare the number of CPU units consumed to the physical hardware available to SAP ASE. For example, if your system has 8 cores and 2 threads per core, it has a total of 16 available CPU units. If SAP ASE is utilizing 6 CPU units, the host can perform additional work. However, if SAP ASE is utilizing 14 CPU units, there is little capacity left and the subcore threads are heavily utilized.
2.3.1.5 Page Faults at OS
Page Faults at OS reports the number of major and minor page faults, and a summary of all page faults; sp_sysmon prints this section only if there are reported page faults.
NotePage Faults at OS does not appear for Windows.
● Minor Faults – occur when SAP ASE needed a memory page that was not marked as available in the memory management unit, but was available in physical memory.
● Major Faults – occur when SAP ASE needed a memory page that was unavailable in physical memory and had to retrieve the page from disk.
Both minor and major page faults indicate a potential shortage of physical memory. Major page faults carry a far greater performance penalty than minor page faults. Major page faults indicate that you have set the SAP ASE memory configuration too high for the host, or that other processes (such as a file system cache) are using the physical pages SAP ASE expects.
2.3.1.6 Context Switches at OS
Context Switches at OS reports the number of voluntary and involuntary context switches SAP ASE threads perform at the operating system level; sp_sysmon prints this section only if there are reported context switches, and only if the operating system supports collecting the data.
NoteContext Switches at OS does not appear for Windows, Red Hat 5, or SLES 11.
SAP ASE may perform Voluntary context switches for a number of reasons, for example an I/O poll or an engine sleep. The number of context switches depends on the workload. Non-Voluntary context switches occur when the operating system removes an SAP ASE thread from the CPU without the thread requesting the removal (for example, when the operating system preempts the thread).
Non-Voluntary context switches may indicate that the host is low on CPU resources, and that SAP ASE performance is likely to be severely impacted. You should expect a low number of nonvoluntary context switches, which does not represent a problem.
Performance and Tuning Series: Monitoring with sp_sysmonMonitoring Performance with sp_sysmon P U B L I C 27

This is sample output from a system that is not overconfigured. The number of Non-Voluntary context switches is very low:
Context Switches at OS per sec per xact count % of total ------------------------- ----------- ------------ --------- ---------- Voluntary 278.7 278.7 2787 99.7 % Non-Voluntary 0.9 0.9 9 0.3 % ------------------------- ----------- ------------ --------- ---------- Total Context Switches 279.6 279.6 2796 100.0 %
This is sample output from an overloaded machine with a very high level of Non-Voluntary context switching:
Context Switches at OS per sec per xact count % of total ------------------------- ----------- ------------ --------- ---------- Voluntary 2683.7 16370.4 163704 18.4 % Non-Voluntary 11893.0 72547.4 725474 81.6 % ------------------------- ----------- ------------ --------- ---------- Total Context Switches 14576.7 88917.8 889178 100.0 %
To improve this situation, decrease the number of engines, remove non-SAP ASE workload from the host, add additional CPUs, or migrate to a host that has additional processing power.
2.3.1.7 CtlibController, DiskController, and NetController Activity
CtlibController Activity, DiskController Activity, and NetController Activity describe how often SAP ASE checks these controller events.
Activity Description
CtlibController Activity Describes how often SAP ASE checks for Client Library (CTLIB) controller events (indicated in the Polls row), and how many times the Client Library returns an event (in the Polls Returning Events row).
DiskController Activity Describes how often SAP ASE checks for disk controller events (indicated in the Polls row), and how many times the disk returns an event (in the Polls Returning Events row).
NetController Activity Describes how often SAP ASE checks for network controller events (indicated in the Polls row), and how many times the network returns an event (in the Polls Returning Events row).
These sections include these rows:
● Polls – number of times this controller polled the operating system for a completion.● Polls Returning Events – number of times this controller polled the operating system and received at least
one event.● Polls Returning Max Events – number of times the operating system poll returned the maximum number of
events.● Total Events – total number of I/O events returned.
28 P U B L I CPerformance and Tuning Series: Monitoring with sp_sysmon
Monitoring Performance with sp_sysmon

● Events Per Poll – average events returned in each poll.
If you configure multiple disk or network tasks, the data that appears is the aggregate of all tasks for that controller.
Consider adding disk or network tasks if:
● “Polls Returning Max Events” is greater than zero.● The value for “Events per Poll” is greater than three.
However, review the values for Thread Utilization for the controllers and the overall system load before you add additional disk or network tasks.
2.3.1.8 Blocking Call Activity
Blocking Call Activity reports on blocking call tasks (that is, requests to syb_blocking_pool). Consider resizing the syb_blocking_pool if there are a high percentage of queued requests or a significant amount of wait time.
2.3.2 Kernel Utilization in Process Mode
Kernel Utilization in process mode reports SAP ASE activities on how busy SAP ASE engines were during the time the CPU was available to SAP ASE, how often the CPU yielded to the operating system, the number of times that the engines checked for network and disk I/O, and the average number of I/Os the engines found waiting at each check.
This sample shows sp_sysmon output for Kernel Utilization in an environment with eight SAP ASE engines.
Kernel Utilization ------------------Your Runnable Process Search Count is set to 2000 and I/O Polling Process Count is set to 10 Engine Busy Utilization CPU Busy I/O Busy Idle ------------------------ -------- -------- -------- Engine 0 3.3 % 13.7 % 83.0 % Engine 1 2.4 % 9.2 % 88.4 % Engine 2 4.9 % 19.9 % 75.2 % Engine 3 .8 % 19.1 % 76.1 % Engine 4 2.8 % 7.0 % 90.2 % Engine 5 1.9 % 7.3 % 90.8 % Engine 6 2.5 % 7.6 % 89.9 % Engine 7 2.0 % 8.1 % 89.9 % ------------------------ -------- -------- -------- Summary Total 24.6 % 91.9 % 683.5 % Average 3.1 % 11.5 % 85.4 % CPU Yields by Engine per sec per xact count % of total------------------------- ----------- ----------- --------- --------- Engine 0 31.5 0.0 2802 11.6 %Engine 1 38.1 0.0 3388 14.0 %Engine 2 21.8 0.0 1936 8.0 %Engine 3 30.2 0.0 2689 11.1 %Engine 4 37.9 0.0 3372 13.9 %
Performance and Tuning Series: Monitoring with sp_sysmonMonitoring Performance with sp_sysmon P U B L I C 29

Engine 5 38.4 0.0 3421 14.1 %Engine 6 36.1 0.0 3217 13.3 %Engine 7 38.4 0.0 3420 14.1 %------------------------- ---------- ----------- --------Total CPU Yields 272.4 0.2 24245 Network ChecksNon-Blocking 434722.4 366.8 38690292 99.9 %Blocking 272.4 0.2 24247 0.1 %------------------------- ---------- ----------- --------Total Network I/O Checks 434994.8 367.1 38714539Avg Net I/Os per Check n/a n/a 0.00003 n/aDisk I/O ChecksTotal Disk I/O Checks 435855.6 367.8 38791149 n/a Checks Returning I/O 125358.1 105.8 11156875 28.8 %Avg Disk I/Os Returned n/a n/a 0.00313 n/a Bucketpool Activity------------------- Bucketpool Name BucketSize Allocs/s AllocsMissed/s ------------------------- ----------- ---------------- -------------- Encrypted Columns Frag 32 137.6 0.0 Encrypted Columns Frag 64 85.3 0.0 Encrypted Columns Frag 96 0.0 0.0 Encrypted Columns Frag 128 12.0 0.0 Encrypted Columns Frag 160 8.0 0.0 Encrypted Columns Frag 192 4.0 0.0 Encrypted Columns Frag 224 8.2 0.0 Encrypted Columns Frag 256 0.0 0.0 Encrypted Columns Frag 288 0.0 0.0 Encrypted Columns Frag 320 0.0 0.0 Encrypted Columns Frag 352 0.0 0.0 LFB memory pool 32 0.0 0.0 LFB memory pool 64 0.0 0.0 LFB memory pool 96 0.0 0.0 LFB memory pool 128 0.0 0.0 LFB memory pool 160 0.0 0.0 LFB memory pool 192 0.0 0.0 LFB memory pool 224 0.0 0.0 LFB memory pool 256 0.0 0.0 LFB memory pool 288 0.0 0.0 LFB memory pool 320 0.0 0.0 LFB memory pool 352 0.0 0.0 LFB memory pool 384 0.0 0.0 LFB memory pool 416 0.0 0.0 LFB memory pool 448 0.0 0.0 LFB memory pool 480 0.0 0.0 LFB memory pool 512 0.0 0.0 LFB memory pool 544 0.0 0.0 LFB memory pool 576 0.0 0.0 LFB memory pool 608 0.0 0.0 LFB memory pool 640 0.0 0.0 Network Buffers 32 2416.9 0.0 Network Buffers 64 789.0 0.0 Network Buffers 96 250.9 0.0 Network Buffers 128 1147.5 0.0 Network Buffers 160 856.5 0.0 Network Buffers 192 71.7 0.0 Network Buffers 224 59.7 0.0 Network Buffers 256 71.7 0.0 Network Buffers 288 10536.5 0.0 Network Buffers 320 0.0 0.0 Network Buffers 352 35.8 0.0 -------------------------------------------------------------------
30 P U B L I CPerformance and Tuning Series: Monitoring with sp_sysmon
Monitoring Performance with sp_sysmon

2.3.2.1 Engine Busy Utilization
Engine Busy Utilization reports the percentage of time the SAP ASE kernel is busy executing tasks on each SAP ASE engine (rather than time spent idle). The summary row gives the total and the average active time for all engines combined.
The values reported on the Engine Busy Utilization report may differ from the CPU usage values reported by operating system tools. When SAP ASE has no tasks to process, it enters a loop that regularly checks for network I/O, completed disk I/Os, and tasks in the run queue.
One measurement that cannot be made from inside an SAP ASE server is the percentage of time that SAP ASE had control of the CPU versus the time the CPU was in use by the operating system. The operating system provides CPU time to SAP ASE. sp_sysmon reports how SAP ASE uses the time the operating system provides. You should always use sp_sysmon in conjunction with the operating system’s monitoring tools to get readings for both systems.
Check your operating system documentation for the correct commands.
To reduce the time that SAP ASE spends checking for I/O while idle, lower the sp_configure parameter runnable process search count. This parameter specifies the number of times an SAP ASE engine loops looking for a runnable task before yielding the CPU. However, decreasing the value for runnable process search count can increase latency, decreasing performance.
Engine Busy Utilization measures how busy SAP ASE engines were during the CPU time they were given. If the engine is available to SAP ASE for 80 percent of a 10-minute sample interval, and Engine Busy Utilization was 90 percent, it means that SAP ASE was busy for 7 minutes and 12 seconds and was idle for 48 seconds.
When sp_sysmon samples the counters (by default, every 100 milliseconds), each engine indicates what it is currently doing. For example, if it is executing a task, it reports that it is "CPU Busy"; if it is idling, it reports that it is "Idle"; if it is idling and has at least one pending asynchronous disk IO, it reports "IO Busy".
Engine Busy Utilization can help you decide whether there are too many or too few SAP ASE engines. SAP ASE high scalability is due to tunable mechanisms that avoid resource contention.
By checking sp_sysmon output for problems and tuning to alleviate contention, response time can remain high even at Engine Busy Utilization values in the 80 to 90 percent range. If values are consistently very high (more than 90 percent), it is likely that response time and throughput could benefit from an additional engine.
The Engine Busy Utilization values are averages over the sample interval, so very high averages indicate that engines may be 80 percent busy during part of the interval. Spinlock contention increases CPU usage, and should be checked if the server experiences high CPU utilization. In-memory table scans also increase CPU usage, which you can decrease by tuning queries appropriately.
When engine utilization is extremely high, the housekeeper wash task writes few or no pages out to disk (since it runs only during idle CPU cycles.) This means that a checkpoint finds many pages that need to be written to disk, and the checkpoint process, a large batch job, or a database dump is likely to send CPU usage to 100 percent for a period of time, causing a perceptible dip in response time.
If the Engine Busy Utilization percentages are consistently high, and you want to improve response time and throughput by adding SAP ASE engines, check for increased resource contention in other areas after adding each engine.
Performance and Tuning Series: Monitoring with sp_sysmonMonitoring Performance with sp_sysmon P U B L I C 31

In an environment where SAP ASE is serving a large number of users, performance is usually fairly evenly distributed across engines. However, when there are more engines than tasks, you may see some engines with a large percentage of utilization, and other engines may be idle. For example:
Engine Busy Utilization CPU Busy I/O Busy Idle ------------------------ --------- ------- -------- Engine 0 68.7 % 2.5 % 28.8 % Engine 1 61.9 % 3.3 % 34.8 % Engine 2 67.0 % 2.4 % 30.6 % Engine 3 69.0 % 3.8 % 27.2 % Engine 4 60.2 % 2.7 % 37.2 % Engine 5 55.7 % 3.2 % 41.1 % Engine 6 53.8 % 3.2 % 43.0 % ----------------------- -------- -------- -------- Summary Total 436.3 % 21.1 % 242.6 % Average 62.3 % 3.0 % 34.7 %
In an SMP environment, tasks have soft affinity to engines. Without other activity (such as lock contention) that could cause a task to be placed in the global run cue, the task continues to run on the same engine.
2.3.2.2 CPU Yields by Engine
CPU Yields by Engine reports the number of times each SAP ASE engine yielded to the operating system. “% of total” data is the percentage of times an engine yielded as a percentage of the combined yields for all engines.
Total CPU Yields reports the combined data over all engines. However, an engine with one or more pending asynchronous disk I/Os does not yield, even when runnable process search count is exhausted.
If the Engine Busy Utilization data indicates low engine utilization, use CPU Yields by Engine to determine whether the Engine Busy Utilization data reflects a truly inactive engine or one that is frequently starved out of the CPU by the operating system.
When an engine is not busy, it yields to the CPU after a period of time related to the runnable process search count parameter. A high value for CPU Yields by Engine indicates that the engine yielded voluntarily.
runnable process search count Parameter Description
Engine Busy Low/CPU Yields Low Higher value for the I/O Busy% column than for the CPU Busy% column indicates a large amount of pending I/O. Look for changes you can make at the operating system level to solve bottlenecks in I/O processing. If the SAP ASE system CPU time is too high (based on operating system output), decrease the value for runnable process search count.
Engine Busy Low/CPU Yields High Engine is inactive.
Engine Busy High/CPU Yields Low SAP ASE server is very busy and has jobs to run. Adding engines will probably help performance.
32 P U B L I CPerformance and Tuning Series: Monitoring with sp_sysmon
Monitoring Performance with sp_sysmon

runnable process search count Parameter Description
Engine Busy High/CPU Yields High This should be the case when a normal number of user connections running simple queries. It is likely that lowering runnable process search count will have little or no effect. Adding engines is also unlikely to help, unless Engine Busy Utilization is very high.
For example:
CPU Yields by Engine per sec per xact count % of total ------------------------ ------------ ----------- -------- ---------Engine 0 73.5 1.8 44087 26.2 %Engine 1 40.4 1.0 24224 14.4 %Engine 2 23.7 0.6 14208 8.4 %Engine 3 36.2 0.9 21746 12.9 %Engine 4 38.7 1.0 23207 13.8 %Engine 5 41.3 1.0 24760 14.7 %Engine 6 26.8 0.7 16108 9.6 %---------------------- ------------ ---------- -------- Total CPU Yields 280.6 6.9 168340
See Reference Manual: Configuration Parameters > runnable process search count.
2.3.2.3 Network Checks
Network Checks reports information about blocking and non-blocking network I/O checks, the total number of I/O checks for the interval, and the average number of network I/Os per network check.
SAP ASE has two ways to check for network I/O: blocking and non-blocking modes.
Network Checks Non-Blocking 166371.5 4098.3 99822899 99.8 %Blocking 279.0 6.9 167388 0.2 %------------------------- --------- -------- ---------Total Network I/O Checks 166650.5 4105.2 99990287 Avg Net I/Os per Check n/a n/a 0.00476 n/a
Performance and Tuning Series: Monitoring with sp_sysmonMonitoring Performance with sp_sysmon P U B L I C 33

2.3.2.3.1 Non-Blocking
Non-Blocking reports the number of times SAP ASE performed non-blocking network checks. With non-blocking network I/O checks, an engine checks the network for I/O and continues processing, whether or not it found I/O waiting (this is how an engine typically checks for network I/O.)
2.3.2.3.2 Blocking
Blocking reports the number of times SAP ASE performed blocking network checks. This is how an engine yields CPU to the operating system, and should be equal to the number of yields (it may differ because of timing issues).
After an engine completes all runnable tasks in the queue, the engine loops for a short time, polling the network and checking for the next client request. If after a certain number of loops (determined by the sp_configure parameter, runnable process search count) the engine finds no runnable tasks, and there is no pending asynchronous disk I/O, the engine performs a blocking network I/O poll, yielding its CPU to the operating system. At this point, the engine is said to be sleeping.
A sleeping engine wakes up once per clock tick to perform routine housekeeping tasks and check for runnable tasks. If there are no runnable tasks, the engine performs another blocking network check and goes back to sleep.
SAP ASE may wake a sleeping engine before the next clock tick if a different engine completes some network I/O. Once awake, the engine performs post-processing I/O work, typically resulting in a task becoming runnable (this task is unlikely to yield again until the I/O work has been processed).
2.3.2.3.3 Total Network I/O Checks
Total Network I/O Checks reports the number of times an engine polls for incoming and outgoing packets. This category is helpful when you use it with CPU Yields by Engine.
When an engine is idle, it loops while checking for network packets. If Network Checks is low and CPU Yields by Engine is high, the engine could be yielding too often and not checking the network frequently enough. If the system can afford the overhead, it might be acceptable to yield less often.
An engine loops the number of times you have defined with runnable process search count times before yielding (unless the engine has at least one pending disk I/O). Consequently, an engine that yields too often may indicate that performance is suffering because runnable process search count is set too low.
34 P U B L I CPerformance and Tuning Series: Monitoring with sp_sysmon
Monitoring Performance with sp_sysmon

2.3.2.3.4 Average Network I/Os per Check
Average Network I/Os per Check reports the average number of network I/Os (sends and receives) per check for all SAP ASE engine checks that took place during the sample interval.
The sp_configure parameter i/o polling process count specifies the maximum number of processes that SAP ASE runs before the scheduler checks for disk and network I/O completions. Tuning i/o polling process count affects both the response time and throughput of Adaptive Server.
See Reference Manual: Configuration Parameters.
If SAP ASE engines check frequently, but retrieve network I/O infrequently, you can try reducing the frequency for network I/O checking.
2.3.2.4 Disk I/O Checks
Disk I/O Checks reports the total number of disk I/O checks and the number of checks returning I/O.
Disk I/O Checks Total Disk I/O Checks 171839.7 4233.0 103103833 n/a Checks Returning I/O 31783.1 782.9 19069887 18.5 % Avg Disk I/Os Returned n/a n/a 0.01722 n/a
● Checks Returning I/O – number of actual checks.● Avg Disk I/Os Returned – percentage of Checks Returning I/O that resulted in one or more
completed I/Os.
2.3.2.5 Total Disk I/O Checks
Total Disk I/O Checks reports the number of times engines entered a routine to check for disk I/O. The io polling process count configuration parameter controls the frequency of this check.
When a task needs to perform I/O, the SAP ASE engine running the task immediately issues an I/O request and puts the task to sleep, waiting for the I/O to complete. The engine may process other tasks, but continues to check for completed I/Os. When the engine finds completed I/Os, it moves the task from the sleep queue to the run queue.
2.3.2.5.1 Checks Returning I/O
Checks Returning I/O returns the number of times an I/O was outstanding when the disk check routine was entered.
SAP ASE engines poll for network I/O when the value for "io polling process count" tasks have been run within one tick of the server or during the "idle loops". However, the engine does not poll for Disk IO unless there is at least one pending Disk IO. "Checks Returning IO" indicates the number of times the
Performance and Tuning Series: Monitoring with sp_sysmonMonitoring Performance with sp_sysmon P U B L I C 35

engine intends to check for a disk IO and the number of times Adaptive Server intended to check and there was at least one pending disk IO.
For example, if an engine checks for expected I/O 100,000 times, this average indicates the percentage of time that there actually was I/O pending. If, of those 100,000 checks, I/O was completed 10,000 times, then 10 percent of the checks were effective, and the other 90 percent were overhead.
However, you should also check the average number of I/Os returned per check, and how busy the engines were during the sample interval. If the sample includes idle time, or the I/O traffic is sporadic, it is possible that a high percentage of the checks were returning I/O during the busy period.
If the results in this category seem low or high, you can configure i/o polling process count to increase or decrease the frequency of the checks.
See Reference Manual: Configuration Parameters.
2.3.2.5.2 Average Disk I/Os Returned
Average Disk I/Os Returned displays the percentage of Checks Returning I/O that result in one or more completed I/Os.
Increasing the amount of time that SAP ASE engines wait between checks may result in better throughput because SAP ASE engines can spend more time processing if they spend less time checking for I/O. However, you should verify this for your environment. If the value for I/O Busy% is high, then SAP ASE should perform more frequent checks to pick up I/Os as soon as they are completed. The i/o polling process count configuration parameter controls how often SAP ASE performs this check.
See Reference Manual: Configuration Parameters.
2.3.3 Bucketpool Activity
Bucketpool Activity displays bucket fragment manager activity. Bucket pool activity is recorded in threaded mode and process mode.
For each bucket pool, it reports:
● Name of the bucket pool. Network Buffers,Encrypted Column Frag, and LFB memory pool are configured bucked pools.
● BucketSize - Size of bucket pool (in bytes - multiples of 32)● Allocs/s - Total number of successful and unsuccessful allocation requests made to a bucket pool per
second.● AllocsMissed/s - Number of times per second the allocation was missed due to being performed by
another engine.
A sample output for Bucketpool Activity looks like:
Bucketpool Activity ------------------- Bucketpool Name BucketSize Allocs/s AllocsMissed/s
36 P U B L I CPerformance and Tuning Series: Monitoring with sp_sysmon
Monitoring Performance with sp_sysmon

------------------------- ----------- ---------------- -------------- Encrypted Columns Frag 32 137.6 0.0 Encrypted Columns Frag 64 85.3 0.0 Encrypted Columns Frag 96 0.0 0.0 Encrypted Columns Frag 128 12.0 0.0 Encrypted Columns Frag 160 8.0 0.0 Encrypted Columns Frag 192 4.0 0.0 Encrypted Columns Frag 224 8.2 0.0 Encrypted Columns Frag 256 0.0 0.0 Encrypted Columns Frag 288 0.0 0.0 Encrypted Columns Frag 320 0.0 0.0 Encrypted Columns Frag 352 0.0 0.0 LFB memory pool 32 0.0 0.0 LFB memory pool 64 0.0 0.0 LFB memory pool 96 0.0 0.0 LFB memory pool 128 0.0 0.0 LFB memory pool 160 0.0 0.0 LFB memory pool 192 0.0 0.0 LFB memory pool 224 0.0 0.0 LFB memory pool 256 0.0 0.0 LFB memory pool 288 0.0 0.0 LFB memory pool 320 0.0 0.0 LFB memory pool 352 0.0 0.0 LFB memory pool 384 0.0 0.0 LFB memory pool 416 0.0 0.0 LFB memory pool 448 0.0 0.0 LFB memory pool 480 0.0 0.0 LFB memory pool 512 0.0 0.0 LFB memory pool 544 0.0 0.0 LFB memory pool 576 0.0 0.0 LFB memory pool 608 0.0 0.0 LFB memory pool 640 0.0 0.0 Network Buffers 32 2416.9 0.0 Network Buffers 64 789.0 0.0 Network Buffers 96 250.9 0.0 Network Buffers 128 1147.5 0.0 Network Buffers 160 856.5 0.0 Network Buffers 192 71.7 0.0 Network Buffers 224 59.7 0.0 Network Buffers 256 71.7 0.0 Network Buffers 288 10536.5 0.0 Network Buffers 320 0.0 0.0 Network Buffers 352 35.8 0.0 -------------------------------------------------------------------
You can modify bucket pool configuration with the guidance of SAP support.
2.4 Worker Process Management
Worker Process Management reports the use of worker processes, including the number of worker process requests that were granted and denied and the success and failure of memory requests for worker processes.
Analyze this output with that of Parallel Query Management:
Worker Process Management ------------------------- per sec per xact count % of total ------------ ------------ -------- ---------Worker Process RequestsRequests Granted 0.1 0.4 23 100.0 %Requests Denied 0.0 0.0 0 0.0 %
Performance and Tuning Series: Monitoring with sp_sysmonMonitoring Performance with sp_sysmon P U B L I C 37

------------------------ ------------ ------------ ------Total Requests 0.1 0.4 23Requests Terminated 0.0 0.0 0 0.0 %Worker Process UsageTotal Used 0.2 1.1 69 n/aMax Ever Used During Sample 0.0 0.1 9 n/aMemory Requests for Worker ProcessesSucceeded 2.2 10.1 646 100.0 %Failed 0.0 0.0 0 0.0 %------------------------ ----------- ------------ ------- Total Requests 2.2 10.1 646 Avg Mem Ever Used by a WP (in bytes) n/a n/a 1208.9 n/a
Related Information
Parallel Query Management [page 40]
2.4.1 Worker Process Requests
Worker Process Requests reports requests for worker processes and worker process memory. A parallel query may make multiple requests for worker processes.
For example, a parallel query that requires a sort may make one request for accessing data and a second for parallel sort.
The Requests Granted and Requests Denied rows show how many requests were granted and how many requests were denied due to a lack of available worker processes at execution time.
Requests Terminated reports the number of times a request was terminated by user action, such as pressing Ctrl-c, that cancelled the query.
Related Information
Parallel Query Usage [page 40]
2.4.2 Worker Process Usage
Worker Process Usage reports the total number of worker processes used during the sample interval. Max Ever Used During Sample reports the highest number in use at any time during sp_sysmon’s sampling period.
You can use Max Ever Used During Sample to set the configuration parameter number of worker processes.
38 P U B L I CPerformance and Tuning Series: Monitoring with sp_sysmon
Monitoring Performance with sp_sysmon

2.4.3 Memory Requests for Worker Processes
Memory Requests for Worker Processes reports the number of requests made for memory allocations for worker processes, how many of those requests succeeded and how many failed. Memory for worker processes is allocated from a memory pool configured with the parameter memory per worker process.
If “Failed” is a nonzero value, you may need to increase the value of memory per worker process.
2.4.4 Avg Mem Ever Used By a WP
Avg Mem Ever Used By a WP reports the maximum average memory used by all active worker processes at any time during the sample interval.
Each worker process requires memory, principally for exchanging coordination messages. This memory is allocated by SAP ASE from the global memory pool.
The size of the pool is determined by multiplying the two configuration parameters, number of worker processes and memory per worker process.
If number of worker processes is set to 50, and memory per worker process is set to the default value of 1024 bytes, 50K is available in the pool. Increasing memory for worker process to 2048 bytes would require 50K of additional memory.
At start-up, static structures are created for each worker process. While worker processes are in use, additional memory is allocated from the pool as needed, and deallocated when not needed. The average value printed is the average for all static and dynamically memory allocated for all worker processes, divided by the number of worker processes actually in use during the sample interval.
If a large number of worker processes are configured, but only a few are in use during the sample interval, the value printed may be inflated, due to averaging in the static memory for unused processes.
If Avg Mem Ever Used By a WP is close to the value set by memory per worker process and the number of worker processes in Max Ever Used During Sample is close to the number configured, you may want to increase the value of the parameter.
If a worker process needs memory from the pool, and no memory is available, the process prints an error message and exits.
NoteFor most parallel query processing, the default value of 1024 is more than adequate.
The exception is dbcc checkstorage, which can use up 1792 bytes if only one worker process is configured. If you are using dbcc checkstorage, and number of worker processes is set to 1, you may want to increase memory per worker process.
Performance and Tuning Series: Monitoring with sp_sysmonMonitoring Performance with sp_sysmon P U B L I C 39

2.5 Parallel Query Management
Parallel Query Management reports on the execution of parallel queries. It reports the total number of parallel queries, the number of times the number of worker processes was adjusted at runtime, and the granting of locks during merges and sorts.
A sample output of Parallel Query Management looks like:
Parallel Query Management -------------------------Parallel Query Usage per sec per xact count % of total------------------------ ------------ ---------- --------- ----------Total Parallel Queries 0.1 0.3 19 n/aWP Adjustments MadeDue to WP Limit 0.0 0.0 0 0.0 %Due to No WPs 0.0 0.0 0 0.0 %Merge Lock Requests per sec per xact count % of total------------------------ ------------ ---------- --------- ----------Network Buffer Merge LocksGranted with no wait 1.1 5.0 320 21.3 %Granted after wait 3.9 18.4 1179 78.7 %Result Buffer Merge LocksGranted with no wait 0.0 0.0 0 0.0 %Granted after wait 0.0 0.0 0 0.0 %Work Table Merge Locks Granted with no wait 0.0 0.0 0 0.0 % Granted after wait 0.0 0.0 0 0.0 %------------------------ ------------ ---------- --------- ----------Total # of Requests 5.0 23.4 1499Sort Buffer Waits per sec per xact count % of total------------------------ ------------ ---------- --------- ----------Producer Waits 0.0 0.1 8 100.0 %Consumer Waits 0.0 0.0 0 0.0 %------------------------ ------------ ---------- --------- ---------- Total # of Waits 0.0 0.1 8
2.5.1 Parallel Query Usage
Parallel Query Usage reports the total number of queries eligible to be run in parallel.
The optimizer determines the best plan, deciding whether a query should be run serially or in parallel and how many worker processes should be used for parallel queries.
WP Adjustments Made reports how many times the number of worker processes recommended by the optimizer had to be adjusted at runtime. Two possible causes are reported:
● Due to WP Limit – indicates the number of times the number of worker processes for a cached query plan was adjusted due to a session-level limit set with set parallel_degree or set scan_parallel_degree.If Due to WP Limit is a nonzero value, look for applications that set session-level limits.
● Due to No WPs – indicates the number of requests for which the number of worker processes was reduced due to lack of available worker processes. These queries may run in serial, or they may run in parallel with fewer worker processes than recommended by the optimizer. It could mean that queries are running with poorly optimized plans.
40 P U B L I CPerformance and Tuning Series: Monitoring with sp_sysmon
Monitoring Performance with sp_sysmon

If Due to No WPs is a nonzero value, and the sample was taken at a time of typical load on your system, you may want to increase the number of worker processes configuration parameter or set session-level limits for some queries.Running sp_showplan on the fid (family ID) of a login using an adjusted plan shows only the cached plan, not the adjusted plan.If the login is running an adjusted plan, sp_who shows a different number of worker processes for the fid than the number indicated by sp_showplan results.
2.5.2 Merge Lock Requests
Merge Lock Requests reports the number of parallel merge lock requests that were made, how many were granted immediately, and how many had to wait for each type of merge
. The three merge types are:
● Network Buffer Merge Locks– reports contention for the network buffers that return results to clients.
● Result Buffer Merge Locks – reports contention for the result buffers used to process results for ungrouped aggregates and nonsorted, nonaggregate variable assignment results.
● Work Table Merge Locks – reports contention for locks while results from worktables were being merged.
“Total # of Requests” prints the total of the three types of merge requests.
2.5.3 Sort Buffer Waits
Sort Buffer Waits reports contention for the sort buffers used for parallel sorts.
Parallel sort buffers are used by:
● Producers – the worker processes returning rows from parallel scans.● Consumers – the worker processes performing the parallel sort.
If the number of waits is high, you can configure number of sort buffers to a higher value.
See Using Statistics to Improve Performance in Performance and Tuning: Query Processing and Abstract Plans for guidelines.
2.6 Task Management
Task Management provides information on opened connections, task context switches by engine, and task context switches by cause.
Task Management identifies why a task stopped running; that is, the report highlights resource shortages and contention.
Performance and Tuning Series: Monitoring with sp_sysmonMonitoring Performance with sp_sysmon P U B L I C 41
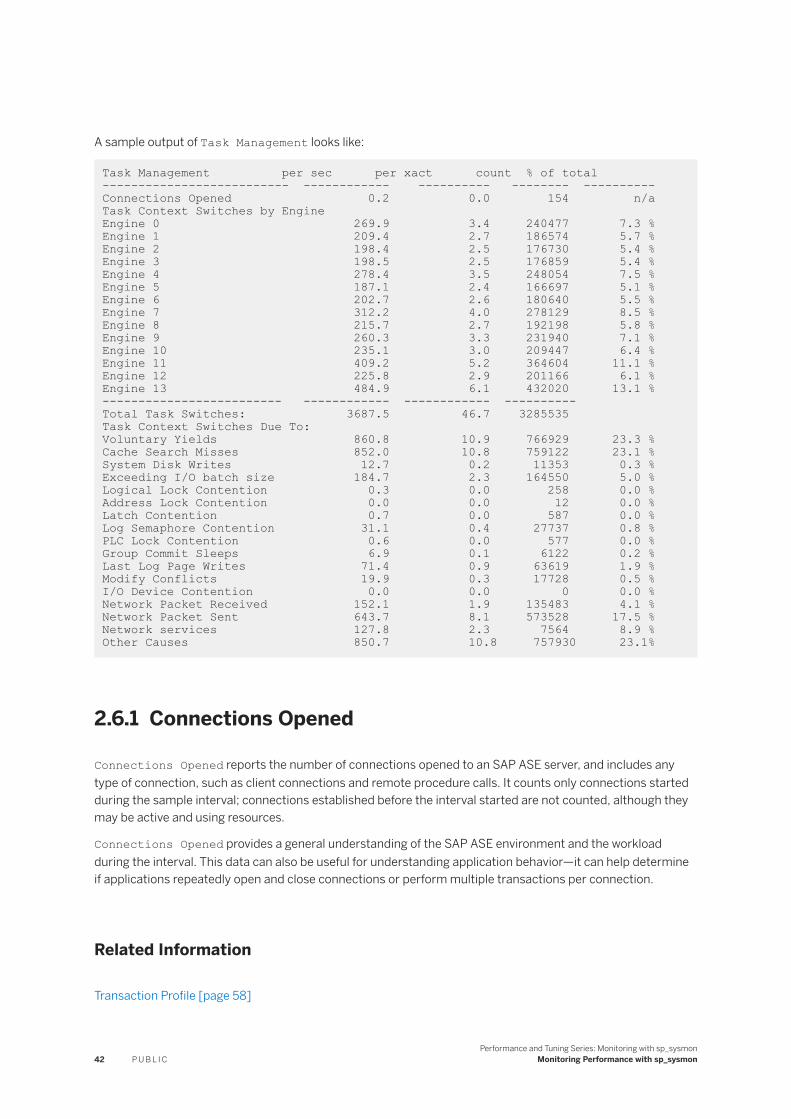
A sample output of Task Management looks like:
Task Management per sec per xact count % of total -------------------------- ------------ ---------- -------- ---------- Connections Opened 0.2 0.0 154 n/aTask Context Switches by EngineEngine 0 269.9 3.4 240477 7.3 %Engine 1 209.4 2.7 186574 5.7 %Engine 2 198.4 2.5 176730 5.4 %Engine 3 198.5 2.5 176859 5.4 %Engine 4 278.4 3.5 248054 7.5 %Engine 5 187.1 2.4 166697 5.1 %Engine 6 202.7 2.6 180640 5.5 %Engine 7 312.2 4.0 278129 8.5 %Engine 8 215.7 2.7 192198 5.8 %Engine 9 260.3 3.3 231940 7.1 %Engine 10 235.1 3.0 209447 6.4 %Engine 11 409.2 5.2 364604 11.1 %Engine 12 225.8 2.9 201166 6.1 %Engine 13 484.9 6.1 432020 13.1 %------------------------- ------------ ------------ ----------Total Task Switches: 3687.5 46.7 3285535 Task Context Switches Due To:Voluntary Yields 860.8 10.9 766929 23.3 %Cache Search Misses 852.0 10.8 759122 23.1 %System Disk Writes 12.7 0.2 11353 0.3 %Exceeding I/O batch size 184.7 2.3 164550 5.0 %Logical Lock Contention 0.3 0.0 258 0.0 %Address Lock Contention 0.0 0.0 12 0.0 %Latch Contention 0.7 0.0 587 0.0 %Log Semaphore Contention 31.1 0.4 27737 0.8 %PLC Lock Contention 0.6 0.0 577 0.0 %Group Commit Sleeps 6.9 0.1 6122 0.2 %Last Log Page Writes 71.4 0.9 63619 1.9 %Modify Conflicts 19.9 0.3 17728 0.5 %I/O Device Contention 0.0 0.0 0 0.0 %Network Packet Received 152.1 1.9 135483 4.1 %Network Packet Sent 643.7 8.1 573528 17.5 %Network services 127.8 2.3 7564 8.9 % Other Causes 850.7 10.8 757930 23.1%
2.6.1 Connections Opened
Connections Opened reports the number of connections opened to an SAP ASE server, and includes any type of connection, such as client connections and remote procedure calls. It counts only connections started during the sample interval; connections established before the interval started are not counted, although they may be active and using resources.
Connections Opened provides a general understanding of the SAP ASE environment and the workload during the interval. This data can also be useful for understanding application behavior—it can help determine if applications repeatedly open and close connections or perform multiple transactions per connection.
Related Information
Transaction Profile [page 58]
42 P U B L I CPerformance and Tuning Series: Monitoring with sp_sysmon
Monitoring Performance with sp_sysmon

2.6.2 Task Context Switches by Engine
For Task Context Switches by Engine, each process running on SAP ASE has its own “context,” or environment, which includes information about the current database, client character set, currently running query, and so on. A “context switch” occurs when SAP ASE is running one client or system process, but must switch to a different client or system process, and this switch involves changing the context under which the engine is running.
Task Context Switches by Engine reports the number of times each SAP ASE engine switched context from one user task to another. “% of total” reports the percentage of engine task switches for each SAP ASE engine as a percentage of the total number of task switches for all Adaptive Server engines combined.
Total Task Switches summarizes task-switch activity for all engines on SMP servers. You can use Total Task Switches to observe the effect of reconfigurations. You might reconfigure a cache or add memory if tasks appear to block on cache search misses and to be switched out often. Then, check the data to see if tasks tend to be switched out more or less often.
2.6.3 Task Context Switches Due To
Task Context Switches Due To reports the number of times SAP ASE switched context for a number of common reasons. “% of total” reports the percentage of times the context switch occurred as a percentage of the total number of task context switches for all SAP ASE engines combined.
Task Context Switches Due To provides an overview of the reasons that tasks were switched off engines. You can investigate the possible performance problems shown in this section by checking other sp_sysmon output, as indicated in the sections that describe the causes.
For example, if most of the task switches are caused by physical I/O, try minimizing physical I/O by adding more memory or reconfiguring caches. However, if lock contention causes most of the task switches, check the locking section of your report.
Related Information
Lock Management [page 83]
2.6.3.1 Voluntary Yields
Voluntary Yields reports the number of times a task completed without yielding. A task that completes yields is indicated in the Network Packet Sent column. A high number of voluntary yields indicates that there is little contention.
The configuration parameter time slice sets the amount of time that a process can run. A CPU-intensive task that does not switch out due to other causes yields the CPU at certain “yield points” in the code, to allow
Performance and Tuning Series: Monitoring with sp_sysmonMonitoring Performance with sp_sysmon P U B L I C 43

other processes a turn on the CPU. See Allotted Slices Exhausted to identify whether tasks are exhausting their time quota.
See Using Engines and CPUs in Performance and Tuning Series: Basics for more information.
Related Information
Allotted Slices Exhausted [page 54]
2.6.3.2 Cache Search Misses
Cache Search Misses reports the number of times a task was switched out because a required page was not in cache and had to be read from disk. For data and index pages, the task is switched out while the physical read is performed.
See Data Cache Management for information about the cache-related parts of the sp_sysmon output.
Related Information
Data Cache Management [page 92]
2.6.3.3 Exceeding I/O Batch Size
Exceeding I/O Batch Size reports the number of times an I/O-intensive task was switched from an engine because SAP ASE exceeded a I/O batch limit. However, Exceeding I/O Batch Size reports only the context switches from nonlog I/O batches.
SAP ASE paces disk writes to keep from flooding the disk I/O subsystems during operations that perform large amounts of I/O. For example, the checkpoint task writes a large number of data pages to the disk. SAP ASE switches off the checkpoint task so it sleeps until the batch of writes completes. Checkpoint then wakes and issues another batch.
Configure batch sizes—both nonlog I/O and log I/O—using the i/o batch size parameter.
By default, the number of writes per batch is set to 100. You may want to increase the number of writes per batch if:
● You have a high-throughput, high-transaction environment with a large data cache.● Your system is not I/O-bound.
44 P U B L I CPerformance and Tuning Series: Monitoring with sp_sysmon
Monitoring Performance with sp_sysmon

2.6.3.4 System Disk Writes
System Disk Writes reports the number of times a task was switched out for various reasons.
Including:
● Exceeded the log I/O batch size (10 pages)● Needed to perform a disk write● Needed to access a page that was being written by another process, such as the housekeeper or the
checkpoint process
System disk writes include waits spent by tasks to complete writes. Data pages may wait for writes they issue, or wait for writes issued by other tasks. Log page waits include only writes issued by the same task. The waits for I/O to complete on a log page for which the write was issued by another task is counted in Group Commit Sleeps.
Most SAP ASE writes happen asynchronously, but processes sleep during writes for page splits, recovery, and OAM page writes. If System Disk Writes seems high, check the value for page splits to see if the problem is caused by data page and index page splits. You cannot affect this value by tuning SAP ASE if the high value for system disk writes is not caused by page splitting.
Related Information
Page Splits [page 75]
2.6.3.5 Logical Lock Contention
Logical Lock Contention reports the number of times a task was switched out due to contention for locks on tables, data pages, or data rows.
Investigate lock contention problems by checking the transaction detail and lock management sections of the report.
● See Transaction Detail [page 60] and Lock Management [page 83].● Check to see if your queries are performing deferred and direct expensive updates, which can cause
additional index locks. See Updates [page 63].● Use sp_object_stats to report information on a per-object basis.
For additional help on locks and lock contention, see Performance and Tuning Series: Locking and Concurrency Control:
● Types of Locks – provides information about types of locks to use at server or query level.● Locking Configuration and Tuning – provides information about reducing lock contention.● Introduction to Locking – provides information on indexes and query tuning. In particular, use indexes to
ensure that updates and deletes do not lead to table scans and exclusive table locks.
Performance and Tuning Series: Monitoring with sp_sysmonMonitoring Performance with sp_sysmon P U B L I C 45

Related Information
Transaction Detail [page 60]Lock Management [page 83]Updates [page 63]
2.6.3.6 Address Lock Contention
Address Lock Contention reports the number of times a task was switched out because of address locks.
SAP ASE acquires address locks on the index pages of allpages-locked tables. These locks block access to data pages. For example, an exclusive address lock on an index page blocks another system process ID (spid) from reading that page and following that index to the data. However, tasks can still use other access methods to the data.) Also, when a leaf-level index page is exclusively locked, no modifications can be done to any data pointed to by the index rows on the locked page, since the index rows may need to be modified as well.
2.6.3.7 Latch Contention
Latch Contention reports the number of times a task was switched out because it needed to wait for a latch.
If your user tables use only allpages-locking, latch contention is taking place either on a data-only-locked system table or on allocation pages.
If your applications use data-only-locking, the contention reported here includes all waits for latches, including those on index pages and OAM pages as well as allocation pages.
2.6.3.7.1 Reducing Contention During Page Allocation
In SMP environments where inserts and expanding updates are extremely high, so that page allocations take place very frequently, contention for the allocation page latch can reduce performance. Normally, SAP ASE allocates new pages for an object on an allocation unit that is already in use by the object and is known to have free space.
For each object, SAP ASE tracks this allocation page number as a hint for any tasks that need to allocate a page for that object. When more than one task at a time needs to allocate a page on the same allocation unit, the second and subsequent tasks block on the latch on the allocation page.
You can specify a “greedy allocation” scheme, so that SAP ASE keeps a list of eight allocation hints for page allocations for a table.
This command enables greedy allocation for the salesdetail table in database 6:
dbcc tune(des_greedyalloc, 6, salesdetail, "on")
46 P U B L I CPerformance and Tuning Series: Monitoring with sp_sysmon
Monitoring Performance with sp_sysmon

To turn it off, use:
dbcc tune(des_greedyalloc, 6, salesdetail, "off")
The effects of dbcc tune(des_greedyalloc) are not persistent, so you must reissue the commands after you restart SAP ASE.
Use dbcc tune(des_greedyalloc) only if all of the following are true:
● You have multiple engines. This command is rarely useful with fewer than four engines.● A large number of pages are being allocated for the object. You can use sp_spaceused or optdiag to
track the number of pages.● The latch contention counter shows contention.
Greedy allocation is more useful when tables are assigned to their own segments. If you enable greedy allocation for several tables on the same segment, the same allocation hint could be used for more than one table.
Greedy allocation is not allowed in the master and tempdb databases, and is not allowed on system tables. Greedy page allocation is not applicable to partitioned tables.
The hints are allocation pages which potentially have free space. The maximum number of hints maintained is 16.
2.6.3.8 Physical, Logical, and Object Lock Transition
Physical, logical, and object lock transitions identify context switches related to various locks.
● Physical Lock Transition – identify context switches related to acquiring physical locks.● Logical Lock Transition – identify context switches related to acquiring cluster logical locks● Object Lock Transition – identify context switches related to acquiring object locks
For these three rows, % total represents a collective number of context switches caused by cluster messaging. Higher values for % total for this context indicates high cluster message activity. Compare this number with Number of Cluster Lock Requests to determine the number of cluster messages per lock request. Query the monSysWaits monitoring table for more information about context switches.
Assess your application partitioning if a lock requests creates too many context switches. A higher number of context switches indicates additional requirements for the cluster message buffer. monCIPC may have high values for ReceiveCount and TransmitCount if there is a shortage of CIPC message buffers. Increase the size of the CIPC message buffer to resolve this issue.
Performance and Tuning Series: Monitoring with sp_sysmonMonitoring Performance with sp_sysmon P U B L I C 47

2.6.3.9 Log Semaphore Contention
A semaphore is a simple internal locking mechanism that prevents a second task from accessing the data structure currently in use. SAP ASE uses semaphores to protect the user log caches, since more than one process can access the records of a ULC and force a flush.
Log Semaphore Contention reports the number of times a task was switched out because it needed to acquire the transaction log semaphore held by another task. This applies to SMP systems only.
If log semaphore contention is high, see Transaction Management.
Check disk queuing on the disk used by the transaction log. See Disk I/O Management.
Also see Engine Utilization (Tick %). If engine utilization reports a low value, and response time is within acceptable limits, consider reducing the number of engines. Running with fewer engines reduces contention by decreasing the number of tasks trying to access the log simultaneously.
High log semaphore contention usually points to issues with logging or the I/O subsystem. However, even a well-tuned system can have high contention on the log semaphore in a OLTP environment that uses high throughput.
Related Information
Transaction Management [page 64]Disk I/O Management [page 107]Engine Utilization (Tick %) [page 24]
2.6.3.10 PLC Lock Contention
PLC Lock Contention reports contention for a lock on a user log cache.
2.6.3.11 Group Commit Sleeps
Group Commit Sleeps reports the number of times a task performed a transaction commit and was put to sleep until the log was written to disk by another task.
When a task commits, its log records are flushed from its user log cache to the current page of the transaction log in cache. If the log page (or pages, if a large log I/O size is configured) is not full, the task is switched out and placed on the end of the run queue. The log write for the page is performed when:
● Another process fills the log pages, and flushes the log. This is presented as a Group Commit Sleep or as I/O Pacing.
● When the task reaches the head of the run queue, and no other process has flushed the log page. This is presented as a Last Log Page Write.
48 P U B L I CPerformance and Tuning Series: Monitoring with sp_sysmon
Monitoring Performance with sp_sysmon

In high throughput environments, a large log I/O size helps prevent problems in disk queuing on the log device. A high percentage of group commit sleeps should not be regarded as a problem.
2.6.3.12 Last Log Page Writes
Last Log Page Writes reports the number of times a task was switched out because it was put to sleep while writing the last log page.
The task switched out because it was responsible for writing the last log page, as opposed to sleeping while waiting for some other task to write the log page, as described in Group Commit Sleeps.
If this value is high, review Avg # Writes Per Log Page to determine whether SAP ASE is repeatedly writing the same last page to the log. If the log I/O size is greater than 2K, reducing the log I/O size might reduce the number of unneeded log writes.
See the "Optimizing Transaction Performance in Adaptive Server Enterprise 12.5" white paper (enter “Optimizing Transaction Performance” in the search field on the Sybase home page).
Related Information
Group Commit Sleeps [page 48]Avg # Writes per Log Page [page 72]
2.6.3.13 Modify Conflicts
Modify Conflicts reports the number of times that a task tried to get exclusive access to a page that was held by another task under a special lightweight protection mechanism.
For certain operations, SAP ASE uses a lightweight protection mechanism to gain exclusive access to a page without using actual page locks (for example, access to some system tables and dirty reads). These processes require exclusive access to the page, even though they do not modify it.
2.6.3.14 I/O Device Contention
I/O Device Contention reports the number of times a task was put to sleep while waiting for a semaphore for a particular device.
When a task needs to perform physical I/O, SAP ASE fills out the I/O structure and links it to a per-engine I/O queue. If two SAP ASE engines request an I/O structure from the same device at the same time, one of them sleeps while it waits for the semaphore.
Device contention occurs only when you have enabled disk mirroring (the default is “disabled”) or when I/Os are delayed. For more information about delayed I/Os, see Disk I/O Management.
Performance and Tuning Series: Monitoring with sp_sysmonMonitoring Performance with sp_sysmon P U B L I C 49

If there is significant contention for I/O device semaphores, try reducing it by redistributing the tables across devices or by adding devices and moving tables and indexes to them.
Related Information
Disk I/O Management [page 107]
2.6.3.15 Network Packet Received
When task switching is reported by Network Packet Received, the task switch is due to one of two causes.
● A task received part of a multipacket batch and was switched out waiting for the client to send the next packet of the batch, or
● A task completely finished processing the current batch and was put into a receive sleep state while waiting to receive the next command or packet from the client. This is the most common reason for task context switches due to Network Packet Received.
If Network Packet Received is high, see Network I/O Management. You can configure the network packet size for all connections or allow certain connections, to log in using larger packet sizes.
See Introduction to the Basics in Performance and Tuning Series: Basics for more information about network packet sizes.
See Reference Manual: Configuration Parameters.
Related Information
Network I/O Management [page 111]
2.6.3.16 Network Packet Sent
Network Packet Sent reports the number of times a task went into a send sleep state while waiting for the network to send each packet to the client.
The network model determines that there can be only one outstanding packet per connection at any point in time. A task can send a network packet without posting a send request to the network IO task, avoiding a task context switch.
If there is a lot of data to send, and the task is sending many small packets (512 bytes per packet), the task could end up sleeping a number of times. The data packet size is configurable, and different clients can request different packet sizes. When a query completes, this action is included in the Network Packet Send column.
See Networks and Performance in Performance and Tuning Series: Basics for more information about network packets.
50 P U B L I CPerformance and Tuning Series: Monitoring with sp_sysmon
Monitoring Performance with sp_sysmon

If Network Packet Sent is a major cause of task switching, see Network I/O Management.
Related Information
Network I/O Management [page 111]
2.6.3.17 Network Services
Network Services measures the number of context switches that are caused by sleeping on network operations (other than the send and receive operations).
2.6.3.18 Other Causes
Other Causes reports the number of tasks switched out for any reasons not described above (its value is reduced by the number of the number of waits caused by Network Services. In a well-tuned server, this value may rise as tunable sources of task switching are reduced.
2.7 Application Management
Application Management reports execution statistics for user tasks, and is useful if you use resource limits, or if you plan to tune applications by setting execution attributes and assigning engine affinity.
Before making any adjustments to applications, logins, or stored procedures, run sp_sysmon during periods of typical load, and familiarize yourself with the statistics in this section.
For related background information, see Performance and Tuning Series: Basics.
If you request information about specific tasks using the third sp_sysmon parameter (applmon), sp_sysmon output gives statistics specific to each application individually, in addition to summary information.
You can choose to display the detailed application information in one of two ways:
● Application and login information (using the sp_sysmon parameter appl_and_login) – sp_sysmon prints a separate section for each login and the applications it is executing.
● Application information only (using the sp_sysmon parameter, appl_only) – sp_sysmon prints a section for each application, which combines data for all of the logins that are executing it.
For example, if 10 users are logged in with isql, and 5 users are logged in with an application called sales_reports, requesting “application and login” information prints 15 detail sections. Requesting “application only” information prints 2 detail sections, one summarizing the activity of all isql users, and the other summarizing the activity of the sales_reports users.
Performance and Tuning Series: Monitoring with sp_sysmonMonitoring Performance with sp_sysmon P U B L I C 51

You can use appl_and_login with all sections of sp_sysmon. For example:
sp_sysmon “00:05:00”, @applmon=appl_and_login
A sample output of Application Management looks like:
Application Management ----------------------Application Statistics Summary (All Applications)-------------------------------------------------Priority Changes per sec per xact count % of total-------------------------- ------------ ---------- -------- ---------- To High Priority 3.4 0.1 2058 18.6 %To Medium Priority 9.6 0.2 5774 52.3 %To Low Priority 5.4 0.1 3217 29.1 %------------------------ ------------ ------------ --------Total Priority Changes 18.4 0.5 11049 Allotted Slices Exhausted per sec per xact count % of total-------------------------- ----------- ---------- ------- ---------- High Priority 0.0 0.0 0 0.0 %Medium Priority 13.8 0.3 8251 100.0 %Low Priority 0.0 0.0 0 0.0 %-------------------------- ----------- ---------- -------- ----------Total Slices Exhausted 13.8 0.3 8251 Skipped Tasks By Engine per sec per xact count % of total-------------------------- ----------- ---------- -------- ----------Total Engine Skips 0.0 0.0 0 n/a Engine Scope Changes 0.0 0.0 0 n/a
This example shows output for application and login; only the information for one application and login is included. The first line identifies the application name (before the arrow) and the login name (after the arrow).
----------------------------------------------------------------------- Application->Login: ctisql->adonis Application Activity per sec per xact count % of total-------------------------- ------------ ---------- -------- ---------- CPU Busy 0.1 0.0 27 2.8 % I/O Busy 1.3 0.1 461 47.3 % Idle 1.4 0.2 486 49.9 % Number of Times Scheduled 1.7 0.2 597 n/a Application Priority Changes per sec per xact count % of total-------------------------- ------------ ---------- -------- ---------- To High Priority 0.2 0.0 72 50.0 % To Medium Priority 0.2 0.0 72 50.0 % To Low Priority 0.0 0.0 0 0.0 %-------------------------- ------------ ---------- -------- ---------- Total Priority Changes 0.4 0.0 144 Application I/Os Completed per sec per xact count % of total-------------------------- ------------ ---------- -------- ---------- Disk I/Os Completed 0.6 0.1 220 53.9 % Network I/Os Completed 0.5 0.1 188 46.1 %------------------------- ------------ ------- -------- Total I/Os Completed 1.1 0.1 408 Resource Limits Violated per sec per xact count % of total-------------------------- ------------ ---------- -------- ---------- IO Limit Violations Estimated 0.0 0.0 0 0.0 % Actual 0.1 4.0 4 50.0 % Time Limit Violations Batch 0.0 0.0 0 0.0 % Xact 0.0 0.0 0 0.0 % RowCount Limit Violations 0.1 4.0 4 50.0 %
52 P U B L I CPerformance and Tuning Series: Monitoring with sp_sysmon
Monitoring Performance with sp_sysmon

------------------------- ----------- ------- -------- Total Limits Violated 0.1 8.0 8
Related Information
Specifying the Application Detail Parameter [page 10]
2.7.1 Application Statistics Summary (All Applications)
The sp_sysmon statistics in the summary section can help you determine whether there are any anomalies in resource utilization. If there are, you can investigate further using the detailed report.
Applications statistics show:
● Whether tasks are switching back and forth between different priority levels● Whether the assigned time that tasks are allowed to run is appropriate● Whether tasks to which you have assigned low priority are starved for CPU time● Whether engine bindings with respect to load balancing is correct
Application Statistics Summary includes data for system tasks as well as for user tasks. If the summary report indicates a resource issue, but you do not see supporting evidence in the application or application and login information, investigate the sp_sysmon kernel section of the report (Kernel Utilization).
Related Information
Kernel Utilization [page 21]
2.7.1.1 Priority Changes
Priority Changes reports the priority changes that took place for all user tasks in each priority run queue during the sample interval. It is normal to see some priority switching due to system-related activity.
For example, such priority switching occurs when:
● A task sleeps while waiting on a lock – SAP ASE temporarily raises the task’s priority.● A housekeeper task sleeps – SAP ASE raises the priority to medium when the housekeeper wash and
housekeeper chores task wake up, and changes them back to low priority when they go back to sleep.● A task executes a stored procedure – the task assumes the priority of the stored procedure and resumes
its previous priority level after executing the procedure.
If you are using logical process management and there are a high number of priority changes compared to steady state values, it may indicate that an application, or a user task related to that application, is changing
Performance and Tuning Series: Monitoring with sp_sysmonMonitoring Performance with sp_sysmon P U B L I C 53

priorities frequently. Check priority change data for individual applications. Verify that applications and logins are behaving as you expect.
If you determine that a high-priority change rate is not due to an application or to related tasks, then it is likely due to system activity.
2.7.1.1.1 Total Priority Changes
Total Priority Changes reports the total number of priority changes during the sample period. This section gives you a quick way to determine if there are a high number of run queue priority changes occurring.
2.7.1.2 Allotted Slices Exhausted
Allotted Slices Exhausted reports the number of times user tasks in each run queue exceeded the time allotted for execution.
Once a user task gains access to an engine, the task is allowed to execute for a given period of time. If the task has not yielded the engine before the time is exhausted, Adaptive Server requires it to yield as soon as possible without holding critical resources. After yielding, the task is returned to the run queue.
Allocated Slices Exhausted helps you to determine whether there are CPU-intensive applications for which you should tune execution attributes or engine associations. If these numbers are high, it indicates that an application is CPU intensive. Application-level information can help you figure out which application to tune. Some tasks, especially those which perform large sort operations, are CPU intensive.
Use Allocated Slices Exhausted to assess new hardware requirements. Faster CPUs are typically beneficial, and the more exhausted timeslices you encounter, the more your site will benefit from upgrading to faster CPUs.
2.7.1.3 Skipped Tasks By Engine
Skipped Tasks By Engine reports the number of times engines skipped a user task at the head of a run queue.
This happens when the task at the head of the run queue has affinity to an engine group and was bypassed in the queue by an engine that is not part of the engine group.
The value is affected by configuring engine groups and engine group bindings. A high number in this category might be acceptable if low priority tasks are bypassed for more critical tasks. It is possible that an engine group is bound so that a task that is ready to run might not be able to find a compatible engine. In this case, a task might wait to execute while an engine sits idle. Investigate engine groups and how they are bound, and check load balancing.
54 P U B L I CPerformance and Tuning Series: Monitoring with sp_sysmon
Monitoring Performance with sp_sysmon

2.7.1.4 Engine Scope Changes
Engine Scope Changes reports the number of times a user changed the engine group binding of any user task during the sample interval.
2.7.2 Per Application or Per Application and Login
This section gives detailed information about system resources used by particular application and login tasks, or by all users of each application.
2.7.2.1 Application Activity
Application Activity helps you to determine whether an application is I/O intensive or CPU intensive. It reports how much time all user tasks in the application spend executing, doing I/O, or being idle. It also reports the number of times a task is scheduled and chosen to run.
● CPU Busy – reports the number of clock ticks during which the user task was executing during the sample interval. When the numbers in this category are high, it indicates a CPU-bound application. If this is a problem, you may want to consider engine binding.
● I/O Busy – reports the number of clock ticks during which the user task was performing I/O during the sample interval. If the numbers in this category are high, it indicates an I/O-intensive process. If idle time is also high, the application could be I/O bound.The application might achieve better throughput if you assign it a higher priority, bind it to a lightly loaded engine or engine group, or partition the application’s data onto multiple devices.
● Idle – reports the number of clock ticks during which the user task was idle during the sample interval.● Number of Times Scheduled – reports the number of times a user task is scheduled and chosen to run
on an engine. This data can help you determine whether an application has sufficient resources. If this number is low for a task that normally requires substantial CPU time, it may indicate insufficient resources. Consider changing priority in a loaded system with sufficient engine resources.
2.7.2.2 Application Priority Changes
Application Priority Changes reports the number times this application had its priority changed during the sample interval.
When the Application Management category indicates a problem, use this section to pinpoint the source.
Performance and Tuning Series: Monitoring with sp_sysmonMonitoring Performance with sp_sysmon P U B L I C 55

2.7.2.3 Application I/Os Completed
Application I/Os Completed reports the disk and network I/Os completed by this application during the sample interval.
This category indicates the total number of disk and network I/Os completed.
If you suspect a problem with I/O completion, see Disk I/O Management and Network I/O Management.
Related Information
Disk I/O Management [page 107]Network I/O Management [page 111]
2.7.2.4 Resource Limits Violated
Resource Limits Violated reports the number and types of violations.
● I/O Limit Violations—Estimated and Actual● Time Limits—Batch and Transaction● RowCount Limit Violations● Total Limits Violated
If no limits are exceeded during the sample period, only the total line is printed.
2.8 ESP Management
ESP Management reports on the use of extended stored procedures.
A sample output of ESP Management looks like:
============================================================================= ESP Management per sec per xact count % of total-------------------------- ------------ ----------- ---------- --------- ESP Requests 0.0 0.0 0 n/a
● ESP Requests – reports the number extended stored procedure calls during the sample interval.● Avg. Time to Execute an ESP – reports the average length of time for all extended stored procedures
executed during the sample interval.
56 P U B L I CPerformance and Tuning Series: Monitoring with sp_sysmon
Monitoring Performance with sp_sysmon

2.9 Housekeeper Task Activity
Housekeeper Task Activity reports on housekeeper tasks.
If the configuration parameter housekeeper free write percent is set to 0, the housekeeper task HK WASH does not run. Enable space reclamation by setting enable housekeeper GC to a value between 1 and 5. Disable space reclamation by setting enable housekeeper GC to 0.
A sample output of Housekeeper Task Activity looks like:
============================================================================= Housekeeper Task Activity------------------------- per sec per xact count % of total --------- -------- -------- -----------Buffer Cache Washes Clean 228.0 5.6 136828 100.0 % Dirty 0.0 0.0 12 0.0 % --------- -------- --------Total Washes 228.1 5.6 136840 Garbage Collections 1.3 0.0 791 n/aPages Processed in GC 0.0 0.0 0 n/a Statistics Updates 12.0 0.3 7196 n/a
● Buffer Cache Washes – reports:○ The number of buffers examined by the housekeeper wash task○ The number of buffers that were found clean○ The number of buffers that were found dirty
A buffer is considered “dirty” when the data page it represents in a data cache includes changes that Adaptive Server has not written to disk. A buffer is considered “clean” when the data page it represents it is a copy of the data on disk.The number of dirty buffers includes those already in I/O due to writes being started at the wash marker.The Recovery Management section of sp_sysmon reports how many times the housekeeper wash task was able to write all dirty buffers for a database.
● Garbage Collections – reports the number times the housekeeper garbage collection task checked to determine whether there were committed deletes that indicated that there was space that could be reclaimed on data pages.
● Pages Processed in GC – reports the number pages where the housekeeper garbage collection task succeeded in reclaiming unused space on a page of a data-only-locked table.
● Statistics Updates – reports the number times the housekeeper chores task checked to see if statistics needed to be written.
For more information, see:
● Using Engines and CPUs in Performance and Tuning: Basics● Diagnosing System Problems in System Administration Guide, Volume One
Related Information
Recovery Management [page 104]
Performance and Tuning Series: Monitoring with sp_sysmonMonitoring Performance with sp_sysmon P U B L I C 57

2.10 Monitor Access to Executing SQL
Monitor Access to Executing SQL reports the number of overflows in SQL batch text buffers and the maximum size of SQL batch text sent during the sample interval, and contention that occurs when sp_showplan accesses query plans.
NoteQuerying monitoring tables (for example, monProcessSQLText and monSysSQLText) does not update these counters
A sample output of Monitor Access to Executing SQL looks like:
Monitor Access to Executing SQL ------------------------------- per sec per xact count % of total ----------- ---------- ------- ---------- Waits on Execution Plans 0.0 0.0 0 n/a Number of SQL Text Overflows 8.6 .2 5138 n/a Maximum SQL Text Requested n/a n/a 588307 n/a (since beginning of sample)
● Waits on Execution Plans – reports the number times that a process attempting to use sp_showplan had to wait to acquire read access to the query plan. Query plans may be unavailable if sp_showplan is run before the compiled plan is completed or after the query plan finished executing. In these cases, Adaptive Server tries to access the plan three times and then returns a message to the user.
● Number of SQL Text Overflows – reports the number times that SQL batch text exceeded the text buffer size.
● Maximum SQL Text Requested – reports the maximum size of a batch of SQL text since the sample interval began. You can use this value to set the configuration parameter max SQL text monitored.See Diagnosing System Problems in System Administration Guide: Volume 1.
2.11 Transaction Profile
Transaction Profile reports on data modifications by type of command and table locking scheme.
A sample output of Transaction Profile looks like:
============================================================================= Transaction Profile------------------- Transaction Summary per sec per xact count % of total------------------- -------- -------- ------- --------- Committed Xacts 40.6 n/a 24357 n/a Transaction Detail per sec per xact count % of total ------------------- -------- -------- ------- --------- Inserts Fully Logged APL Heap Table 0.0 0.0 0 0.0 % APL Clustered Table 0.0 0.0 0 0.0 % Data Only Lock Table 1337.3 906.7 160479 100.0 %
58 P U B L I CPerformance and Tuning Series: Monitoring with sp_sysmon
Monitoring Performance with sp_sysmon

Fast Bulk Insert 0.0 0.0 0 0.0 % Minimally Logged APL Heap Table 0.0 0.0 0 0.0 % APL Clustered Table 0.0 0.0 0 0.0 % Data Only Lock Table 0.0 0.0 0 0.0 % ----------------------- ----------- --------- ------- --------- Total Rows Inserted 1337.3 906.7 160479 100.0 % Updates Total Rows Updated 0.0 0.0 0 n/a ----------------------- ----------- --------- ------- --------- Total Rows Updated 0.0 0.0 0 0.0 % Data Only Locked Updates Total Rows Updated 0.0 0.0 0 n/a ----------------------- ----------- --------- ------- --------- Total DOL Rows Updated 0.0 0.0 0 0.0 % Deletes Fully Logged APL Deferred 0.0 0.0 0 0.0 % APL Direct 0.0 0.0 0 0.0 % DOL 0.3 0.2 36 100.0 % Minimally Logged APL Direct 0.0 0.0 0 0.0 % DOL 0.0 0.0 0 0.0 % ----------------------- ----------- --------- ------- --------- Total Rows Deleted 0.3 0.2 36 0.0 % ====================== ============ ========== ======== Total Rows Affected 1337.6 906.9 160515 ====================== ============ ========== ========
2.11.1 Transaction Summary
Transaction Summary reports committed transactions. Committed Xacts reports the number of transactions committed during the sample interval.
The transactions counted include implicit and explicit, chained (ANSI-style), or unchained:
● An implicit transaction executes data modification commands such as insert, update, or delete. If you do not specify a begin transaction statement, SAP ASE interprets every operation as a separate transaction; an explicit commit transaction statement is not required. For example, the following is counted as three transactions.
1> insert … 2> go1> insert …2> go1> insert … 2> go
● An explicit transaction encloses data modification commands within begin transaction and commit transaction statements and counts the number of transactions by the number of commit statements. For example, the following set of statements is counted as one transaction:
1> begin transaction 2> insert …3> insert …4> insert …5> commit transaction 6> go
Performance and Tuning Series: Monitoring with sp_sysmonMonitoring Performance with sp_sysmon P U B L I C 59

● In the ANSI transaction model, any select or data modification command starts a transaction, but a commit transaction statement must complete the transaction. sp_sysmon counts the number of transactions by the number of commit transaction statements. For example, the following set of statements is counted as one transaction:
1> insert … 2> insert …3> insert …4> commit transaction 5> go
If there were transactions that started before the sample interval began and completed during the interval, Committed Xacts reports a larger number of transactions than the number that started and completed during the sample interval. If transactions do not complete during the interval, “Total # of Xacts” does not include them. In the following figure, both T1 and T2 are counted, but T3 is not.
Figure 1: How transactions are counted
2.11.1.1 How to Count Multidatabase Transactions
Multidatabase transactions are also counted. For example, a transaction that modifies three databases counts as three transactions.
Multidatabase transactions incur more overhead than single database transactions: they require more log records and more user log cache (ULC) flushes, and they involve two-phase commit between the databases.
You can improve performance by reducing the number of multidatabase transactions whenever possible.
2.11.2 Transaction Detail
Transaction Detail provides statistical detail about data modification operations by type. The work performed by rolled back transactions is included in the output below, although the transaction is not counted in the number of transactions.
For the Total Rows for inserts, updates, and deletes, the “% of total” column reports the percentage of the transaction type as a percentage of all transactions.
See How Update Operations are Performed in Performance and Tuning Series: Query Processing and Abstract Plans for more information on deferred and direct inserts, updates, and deletes.
In the output for this section, APL indicates allpages-locked tables and DOL indicates data-only-locked tables.
60 P U B L I CPerformance and Tuning Series: Monitoring with sp_sysmon
Monitoring Performance with sp_sysmon

2.11.3 Inserts
Inserts provides detailed information about the types of inserts taking place on heap tables (including partitioned heap tables), clustered tables, and all inserts as a percentage of all insert, update, and delete operations.
“Inserts” displays the number of inserts performed on:
● Allpages-locked heap tables● Allpages-locked tables with clustered indexes● Data-only locked tables
Insert statistics do not include fast bulk copy inserts, because those are written directly to the data pages and to disk without the normal insert and logging mechanisms.
2.11.3.1 Fully and Minimally Logged
Fully and Minimally Logged reports on Fully Logged, for fully logged operations, and Minimally Logged, for minimally logged operations. Occasionally items are in the Fully Logged subsection but not in the Minimally Logged because the item is not applicable to minimal logging.
2.11.3.1.1 APL Heap Tables
APL Heap Tables reports the number row inserts that took place on allpages-locked heap tables—all tables that do not have a clustered index.
This includes:
● Partitioned heap tables● Unpartitioned heap tables● Slow bulk copy inserts into heap tables● select into commands● Inserts into worktables. This is the most common case unless the application heavily uses APL tables
without clustered indexes.
The “% of total” column shows the percentage of row inserts into heap tables as a percentage of the total number of inserts.
If there are a large number of inserts to heap tables, determine if these inserts are generating contention.
Check the sp_sysmon report for data on last page locks on heaps in Lock Detail. If there appears to be a contention problem, you can query the monitoring tables to determine which tables are involved.
In many cases, creating a clustered index that randomizes insert activity solves the performance problems for heaps. In other cases, you might need to establish partitions on an unpartitioned table or increase the number of partitions on a partitioned table.
Performance and Tuning Series: Monitoring with sp_sysmonMonitoring Performance with sp_sysmon P U B L I C 61
Related Information
Lock Detail [page 86]
2.11.3.1.2 APL Clustered Table
APL Clustered Table reports the number row inserts to allpages-locked tables with clustered indexes. The “% of total” column shows the percentage of row inserts to tables with clustered indexes as a percentage of the total number of rows inserted.
Inserts into allpages-locked clustered tables can lead to page splitting.
SAP ASE may use worktables with clustered indexes to perform vector aggregates (for example, group by), although a hash-based algorithm is more common for SAP ASE release 15.0 and later.
Related Information
RID Upd from Clust Split [page 75]Page Splits [page 75]
2.11.3.1.3 Data Only Lock Table
Data Only Lock Table reports the number inserts for all data-only-locked tables. The “% of total” column shows the percentage of inserts to data-only-locked tables as a percentage of all inserts.
2.11.3.1.4 Fast Bulk Insert
Fast Bulk Insert reports the number inserts by a partially-logged fast bcp.
2.11.3.2 Total Rows Inserted
Total Rows Inserted reports all row inserts to all tables.
It gives the average number of all inserts per second, the average number of all inserts per transaction, and the total number of inserts. “% of total” shows the percentage of rows inserted compared to the total number of rows affected by data modification operations.
62 P U B L I CPerformance and Tuning Series: Monitoring with sp_sysmon
Monitoring Performance with sp_sysmon

2.11.4 Updates and Update Detail Sections
Updates has two sections: Updates and Data Only Locked Updates, and includes reports on Fully Loggedfor fully logged operations, and Minimally Logged for minimally logged operations.
Occasionally, items are in the Fully Logged subsection but not in the Minimally Logged because the item is not applicable to minimal logging.
2.11.4.1 Updates
Updates reports the number deferred and direct row updates. The “% of total” column reports the percentage of each type of update as a percentage of the total number of row updates.
sp_sysmon reports the following types of updates:
● APL Deferred● APL Direct In-place● APL Direct Cheap● APL Direct Expensive● DOL Deferred● DOL Direct
“APL Direct Cheap” in the Fully Logged section indicates the number of fully logged all-pages-locked direct updates. “APL Direct Cheap” in the Minimally Logged section, refers to the number of minimally-logged all-pages-locked direct updates that occured.
Direct updates incur less overhead than deferred updates and are generally faster because they limit the number of log scans, reduce locking, save traversal of index B-trees (reducing lock contention), and can save I/O because Adaptive Server does not have to prefetch pages to perform modification based on log records.
For a description of update types, see Understanding Query Processing in Performance and Tuning Series: Query Processing and Abstract Plans.
2.11.4.1.1 Total Rows Updated
Total Rows Updated reports all deferred and direct updates combined. The “% of total” columns shows the percentage of rows updated, based on all rows modified.
2.11.4.2 Data-Only-Locked Updates
Data-Only-Locked Updates reports more detail on updates to data-only-locked tables.
● DOL Replace – the update did not change the length of the row; some or all of the row was changed, resulting in the same row length.
Performance and Tuning Series: Monitoring with sp_sysmonMonitoring Performance with sp_sysmon P U B L I C 63

● DOL Shrink – the update shortened the row, leaving noncontiguous empty space on the page to be collected during space reclamation.
● DOL Cheap Expand – the row grew in length; it was the last row on the page, so expanding the length of the row did not require moving other rows on the page.
● DOL Expensive Expand – the row grew in length and required movement of other rows on the page.● DOL Expand and Forward – the row grew in length, and did not fit on the page. The row was forwarded to a
new location.● DOL Fwd Row Returned – the update affected a forwarded row; the row fit on the page at its original
location and was returned to that page.
Includes reports on Fully Logged, for fully logged operations, and Minimally Logged, for minimally logged operations. Occasionally items are in the Fully Logged subsection but not in the Minimally Logged because the item is not applicable to minimal logging.
The total reported in “Total DOL Rows Updated” is not included in the “Total Rows Affected” sum at the end of the section, since the updates in this group provide a different breakdown of the updates already reported in “DOL Deferred” and “DOL Direct.”
2.11.5 Deletes
Deletes has two sections, Fully and Minimally Logged and Total Rows Deleted.
● Fully and Minimally Logged – reports on Fully Logged, for fully logged operations, and Minimally Logged, for minimally logged operations. Occasionally items are in the Fully Logged subsection but not in the Minimally Logged because the item is not applicable to minimal logging.
● Total Rows Deleted – reports all deferred and direct deletes combined. The “% of total” column reports the percentage of deleted rows as compared to all rows inserted, updated, or deleted.
2.12 Transaction Management
Transaction Management reports transaction management activities, including user log cache (ULC) flushes to transaction logs, ULC log records, ULC semaphore requests, log semaphore requests, transaction log writes, and transaction log allocations.
A sample output of Transaction Management looks like:
Transaction Management ---------------------- ULC Flushes to Xact Log per sec per xact count % of total --------------------- ------------ ------------ ---------- ---------- Any Logging Mode DMLs by End Transaction 1.6 1.1 189 1.0 % by Change of Database 0.0 0.0 4 0.0 % by Unpin 0.0 0.0 2 0.0 % by Log markers 0.0 0.0 0 0.0 % Fully Logged DMLs by Full ULC 145.5 98.6 17458 95.9 % by Single Log Record 4.5 3.1 544 3.0 % Minimally Logged DMLs
64 P U B L I CPerformance and Tuning Series: Monitoring with sp_sysmon
Monitoring Performance with sp_sysmon

by Full ULC 0.0 0.0 0 0.0 % by Single Log Record 0.0 0.0 0 0.0 % by Start of Sub-Command 0.0 0.0 0 0.0 % by End of Sub-Command 0.0 0.0 0 0.0 % --------------------- ------------ ------------ ---------- Total ULC Flushes 151.6 102.8 18197 ULC Flushes Skipped per sec per xact count % of total --------------------- ------------ ------------ ---------- ---------- Fully Logged DMLs by ULC Discards 0.2 0.1 21 100 % Minimally Logged DMLs by ULC Discards 0.0 0.0 0 0.0 % --------------------- ------------ ------------ ---------- Total ULC Flushes Skips 0.2 0.1 21 ULC Log Records per sec per xact count % of total --------------------- ------------ ------------ ---------- ---------- Fully Logged DMLs 6662.3 4516.8 799476 100.0 Minimally Logged DMLs 0.0 0.0 0 0.0 --------------------- ------------ ------------ ---------- Total ULC Log Records 6662.3 4516.8 799476 Max ULC Size During Sample -------------------------- Fully Logged DMLs n/a n/a 16384 n/a Minimally Logged DMLs n/a n/a 0 n/a ML-DMLs Sub-Command Scans per sec per xact count % of total --------------------- ------------ ------------ ---------- ---------- --- Total Sub-Command Scans 0.0 0.0 0 n/a ML-DMLs ULC Efficiency per sec per xact count % of total --------------------- ------------ ------------ ---------- ---------- Total ML-DML Sub-Commands 0.0 0.0 0 n/a ULC Semaphore Requests Granted 13727.0 9306.4 1647239 100.0 % Waited 0.0 0.0 0 0.0 % --------------------- ------------ ------------ ---------- Total ULC Semaphore Req 13727.0 9306.4 1647239 Log Semaphore Requests Granted 184.0 124.7 22076 100.0 % Local Waited 0.0 0.0 0 0.0 % Global Waited 0.0 0.0 0 0.0 % --------------------- ------------ ------------ ---------- Total Log Semaphore Req 184.0 124.7 22076 Transaction Log Writes 167.5 113.6 20102 n/a Transaction Log Alloc 167.4 113.5 20092 n/a Avg # Writes per Log Page n/a n/a 1.00050 n/a Tuning Recommendations for Transaction Management ------------------------------------------------- - Consider increasing the 'user log cache size' configuration parameter.
2.12.1 ULC Flushes to Xact LogULC Flushes to Xact Log reports the total number of times that user log caches (ULCs) were flushed to a transaction log.
The “% of total” column reports the percentage of times the type of flush took place, for each category, as a percentage of the total number of ULC flushes. This category can help you identify areas in the application that cause problems with ULC flushes.
There is one ULC for each configured user connection. SAP ASE uses ULCs to buffer transaction log records. On both SMP and single-processor systems, this helps reduce transaction log I/O. For SMP systems, it reduces the contention on the current page of the transaction log.
Performance and Tuning Series: Monitoring with sp_sysmonMonitoring Performance with sp_sysmon P U B L I C 65

You can configure ULC size with the configuration parameter user log cache size.
See Reference Manual: Configuration Parameters.
ULC flushes are caused by the following activities:
● “by Full ULC” – a process’s ULC becomes full.● “by End Transaction” – a transaction ended (rollback or commit, either implicit or explicit).● “by Change of Database” – a transaction modified an object in a different database (a multidatabase
transaction).● “by System Log Record” – a system transaction (such as an OAM page allocation) occurred within the user
transaction.● “by Unpin” – two transactions are trying to update the same page of a DOL table.● "by Log markers" – there are no permanent log markers available.● "by No Free Plcblock" – there are no plc blocks available.● "by Start of Sub-Command" or "by End of Sub-Command" – the ULC needed to be flushed at the start or
the end of a subcommand of a minimally logged DML.● “by Other” – any other reason, including needing to write to disk.
When one of these activities causes a ULC flush, SAP ASE copies all log records from the user log cache to the database transaction log.
“Total ULC Flushes” reports the total number of all ULC flushes that took place during the sample interval.
2.12.1.1 Any Logging Mode DMLs
Any Logging Mode DMLs includes five subcategories.
Subcategory Description
by End Transaction A high value for “by End Transaction” indicates a healthy number of short, simple transactions.
by Change of Database The ULC is flushed every time there is a database change. If this value is high, consider decreasing the size of the ULC if it is greater than 2K.
66 P U B L I CPerformance and Tuning Series: Monitoring with sp_sysmon
Monitoring Performance with sp_sysmon

Subcategory Description
by Unpin “Unpinning” occurs when two transactions attempt to update the same data page, causing the second transaction to flush the first transaction’s user log cache, unpinning the data page from the first transaction’s ULC.
SAP ASE typically uses row-level locking for increased concurrency, since both transactions are trying to update the same page.
Unpinning occurs when:
1. Transaction T1 updates row R1.2. Adaptive Server logs the update in P1’s ULC, ensuring that this data page is pinned to
T1’s ULC.3. When T2 tries to update a different row on page P1, it finds that this page is pinned to
T1’s ULC.4. To update the page, T2 flushes T1’s ULC, unpinning the data page.
To reduce the number of unpins:
● If possible, redesign the application so that it directly requests different data pages.● If row locking is inevitable, spread the data to more data pages with
sp_chgattribute max_rows_per_page.
by Log markers A high value for by Log markers indicates that SAP ASE is flushing the ULCs because of permanent log marker scans (a permanent log marker scan indicate that syslogs includes the log record). SAP ASE uses the log records for operations like executing triggers, rollbacks, aborts, and so on. When SAP ASE needs a permanent log marker but does not have one, it flushes the ULC to create a new log marker.
When by Log markers displays a large percentage of ULC flushes, you may need to reduce the number of unnecessary or redundant triggers, rollbacks, or aborts.
by No Free Plcblock A high value for by No Free Plcblock indicates that all plc blocks of the current transaction’s ULC are already queued in the global queue due to buffer unpinning. Since no additional free plc blocks are available in the current ULC, plc blocks from the global queue must be flushed to syslogs until a plc block from the current ULC is freed. by No Free Plcblock indicates the number of these flushes that occurred.
Increase the value for the user log cache size configuration parameter when by No Free Plcblock is a high value.
by System Log Record and By Other
If either of these values is higher than approximately 20 percent, and the size of your ULC is more than 2048, consider reducing the ULC size.
Check sections of your sp_sysmon report that relate to log activity:
● Contention for semaphore on the user log caches (SMP only); see ULC Semaphore Requests
● Contention for the log semaphore. (SMP only); see ULC Semaphore Requests● The number of transaction log writes; see Transaction Log Writes
Performance and Tuning Series: Monitoring with sp_sysmonMonitoring Performance with sp_sysmon P U B L I C 67

Related Information
ULC Semaphore Requests [page 71]Log Semaphore Requests [page 71]Transaction Log Writes [page 72]
2.12.1.2 Fully Logged DMLs
Fully Logged DMLs includes two subcategories: by Full ULC and by Single Log Record.
● by Full ULC – a high value for by Full ULC indicates that SAP ASE is flushing the ULCs more than once per transaction, negating some performance benefits of user log caches. If the “% of total” value for by Full ULC is greater than 20 percent, consider increasing the size of the user log cache size parameter.Increasing the ULC size increases the amount of memory required for each user connection, so you do not want to configure the ULC size to suit a small percentage of large transactions.
● by Single Log Record – single log records cannot live in the ULC, and therefore must cause a ULC flush.
2.12.1.3 Minimally Logged DMLs
If the values of any of the ULC Flushes to Xact Log for Minimally Logged DMLs are high, the ULC cannot fully contain the log records for each subcommand that makes up the minimally logged DML. In this case, SAP ASE performance does not fully benefit from minimal logging because the log records cannot be discarded.
Increase the size of the user log cache size configuration parameter, then re-run sp_sysmon to see if the values for ULC Flushes to Xact Log have decreased. A smaller number should indicate that the ULC no longer needs to be flushed to syslogs.
● by Full ULC – indicates that a single subcommand of a minimally-logged DML has logged more log records than can be accommodated within the ULC and must be flushed to syslogs. Minimal logging is only effective if all the log records of a subcommand can be logged within a single ULC. When the subcommand completes and all its log records fit in the ULC, the log records are discarded and are not flushed to syslogs.
● by Single Log Record – single log records cannot live in the ULC, and therefore must cause a ULC flush.
● by Start of Sub-Command – log records from a fully-logged command executed in the same transaction as a minimally logged DML had to be flushed from the ULC to syslogs before the minimally logged DML was able to start.
● by End of Sub-Command – a single sub-command of a minimally logged DML had to be logged because of a previously full ULC, single log record, an so on. The ULC required flushing at the end of the sub-command to preserve all log records of the subcommand.
68 P U B L I CPerformance and Tuning Series: Monitoring with sp_sysmon
Monitoring Performance with sp_sysmon
2.12.2 Total ULC Flushes
Total ULC Flushes reports the total number of ULC flushes during the sample interval.
2.12.3 ULC Flushes Skipped
ULC Flushes Skipped reports the number user log cache flushes that SAP ASE skips.
● Fully Logged DMLs – If all log records for the transaction fit in the ULC when you execute fully logged DMLs, Adaptive Server can discard all log records.Higher values for Fully Logged DMLs indicate better performance.
● Minimally Logged DMLs – reports the number times the log records in the ULC could be discarded because all log records for a subcommand of the minimally logged DML fit in the ULC.Higher values for Minimally Logged DMLs indicate better performance.
● Total ULC Flushes Skips – reports all user log cache flushes combined. The total is per column.
2.12.4 ULC Log Records
ULC Log Records provides an average number of log records per transaction. It is useful in benchmarking or in controlled development environments to determine the number of log records written to ULCs per transaction.
Many transactions, such as those that affect several indexes or deferred updates or deletes, require several log records for a single data modification. Queries that modify a large number of rows use one or more records for each row.
If this data is unusual, study the data in the next section, and look at your application for long-running transactions and for transactions that modify large numbers of rows.
● Fully Logged DMLs – indicates the number of log records per transaction from fully logged DMLs.● Minimally Logged DMLs – indicates the number of log records per transaction from minimally logged
DMLs.● Total ULC Log Records – reports all user log cache log records combined. The total is per column.
Related Information
Max ULC Size During Sample [page 70]
Performance and Tuning Series: Monitoring with sp_sysmonMonitoring Performance with sp_sysmon P U B L I C 69

2.12.5 Max ULC Size During Sample
Max ULC Size During Sample reports the value in the “count” column is the maximum number of bytes used in any ULC, across all ULCs. This data can help you determine if ULC size is correctly configured.
Since SAP ASE flushes the ULC when a transaction completes, any unused memory allocated to the ULCs is wasted. If the value in the “count” column is consistently less than the defined value for the user log cache size configuration parameter, reduce user log cache size to the value in the “count” column (but no smaller than 2048 bytes).
When Max ULC Size During Sample equals the user log cache size, check the number of flushes due to transactions that fill the user log cache (see the information for by Full ULC in Minimally Logged DMLs). If the number of times that logs were flushed due to a full ULC is more than 20 percent, consider increasing the user log cache size configuration parameter.
See Reference Manual: Configuration Parameters.
● Fully Logged DMLs – reports the maximum number of bytes used for any user log cache for fully logged DMLs.
● Minimally Logged DMLs – reports the maximum number of bytes used for any user log cache for minimally logged DMLs.
Related Information
Minimally Logged DMLs [page 68]
2.12.6 ML-DMLs Sub-Command Scans
When executing some minimally logged commands, SAP ASE must scan the log records for subcommands. The value for ML-DMLs Sub-Command Scans refers to the number of scans SAP ASE performed.
● ULC scans – the scan could be performed entirely within the ULC because it contained all log records to be scanned.
● syslogs Scans – the scan had to be performed using syslogs because the ULC no longer contained the log records to be scanned.
● Total Sub-Command Scans – totals the number of ULC and syslogs scans.
2.12.7 ML-DMLs ULC Efficiency
ML-DMLs ULC Efficiency includes Discarded Sub-Commands and Logged Sub-Commands.
● Discarded Sub-Commands – reports the number times SAP ASE could discard the log records from a subcommand of a minimally logged DML (that is, the log records were not flushed from the ULC to syslogs).
70 P U B L I CPerformance and Tuning Series: Monitoring with sp_sysmon
Monitoring Performance with sp_sysmon

The higher the number for Discarded Sub-Commands, the more efficiently Adaptive Server is performing minimally logged DMLs because the amount of logging is minimized.
● Logged Sub-Commands – reports the number times Adaptive Server could not discard the log records from a subcommand of a minimally logged DML (that is, the log records in the ULC needed to be flushed to syslogs).
2.12.8 Total ML-DML Sub-Commands
Total for Discarded Sub-Commands and Logged Sub-Commands.
2.12.9 ULC Semaphore Requests
ULC Semaphore Requests reports the number times a user task was immediately granted a semaphore or had to wait for it. “% of total” shows the percentage of tasks granted semaphores and the percentage of tasks that waited for semaphores as a percentage of the total number of ULC semaphore requests. This is relevant only in SMP environments.
ULC Semaphore Requests provides the following information:
● Granted – the number of times a task was granted a ULC semaphore immediately upon request. There was no contention for the ULC.
● Local Waited – the number of times a task tried to write to ULCs and encountered semaphore contention.● Total ULC Semaphore Requests – the total number of ULC semaphore requests that took place during the
interval, including requests that were granted or had to wait.
2.12.10 Log Semaphore Requests
Log Semaphore Requests reports of contention for the log semaphore that protects the current page of the transaction log in cache. This data is meaningful for SMP environments only.
This category provides the following information:
● Granted – number of times a task was granted the log semaphore immediately after it was requested. “% of total” reports the percentage of immediately granted requests as a percentage of the total number of log semaphore requests.
● Local Waited – number of times a task that tried to flush its ULC had to wait for the log semaphore because it was already acquired by another task. “% of total” reports the percentage of tasks that had to wait for a log semaphore as a percentage of the total number of log semaphore requests.
● Global Waited – number of times in a a shared disk cluster that a task that tried to flush its ULC had to wait for the log semaphore because another task had already acquired it on this or another node.
● Total Log Semaphore Requests – total number of times tasks requested a log semaphore, including those granted immediately and those for which the task had to wait.
Performance and Tuning Series: Monitoring with sp_sysmonMonitoring Performance with sp_sysmon P U B L I C 71

2.12.11 Transaction Log Writes
Transaction Log Writes reports the total number of times Adaptive Server wrote a transaction log page to disk. Transaction log pages are written to disk when a transaction commits (after a wait for a group commit sleep) or when the current log pages become full.
2.12.12 Transaction Log Allocations
Transaction Log Allocations reports the number times additional pages were allocated to the transaction log. This data is useful for comparing to other data in this section and for tracking the rate of transaction log growth.
2.12.13 Avg # Writes per Log Page
Avg # Writes per Log Page reports the average number of times each log page was written to disk. The value is reported in the “count” column.
In high throughput applications, this number should be as low as possible. If the transaction log uses 2K I/O, the lowest possible value is 1; with 4K log I/O, the lowest possible value is .5, since one log I/O can write 2 log pages.
In low throughput applications, the number will be significantly higher. In very low throughput environments, it may be as high as one write per completed transaction.
2.12.14 Tuning Recommendations for Transaction Management
sp_sysmon describes any tuning it recommends based on the results of the Transaction Management section.
2.13 Index Management
Index Management reports index management activity, including nonclustered maintenance, page splits, and index shrinks.
A sample output of Index Management looks like:
Index Management ---------------- Nonclustered Maintenance per sec per xact count % of total
72 P U B L I CPerformance and Tuning Series: Monitoring with sp_sysmon
Monitoring Performance with sp_sysmon
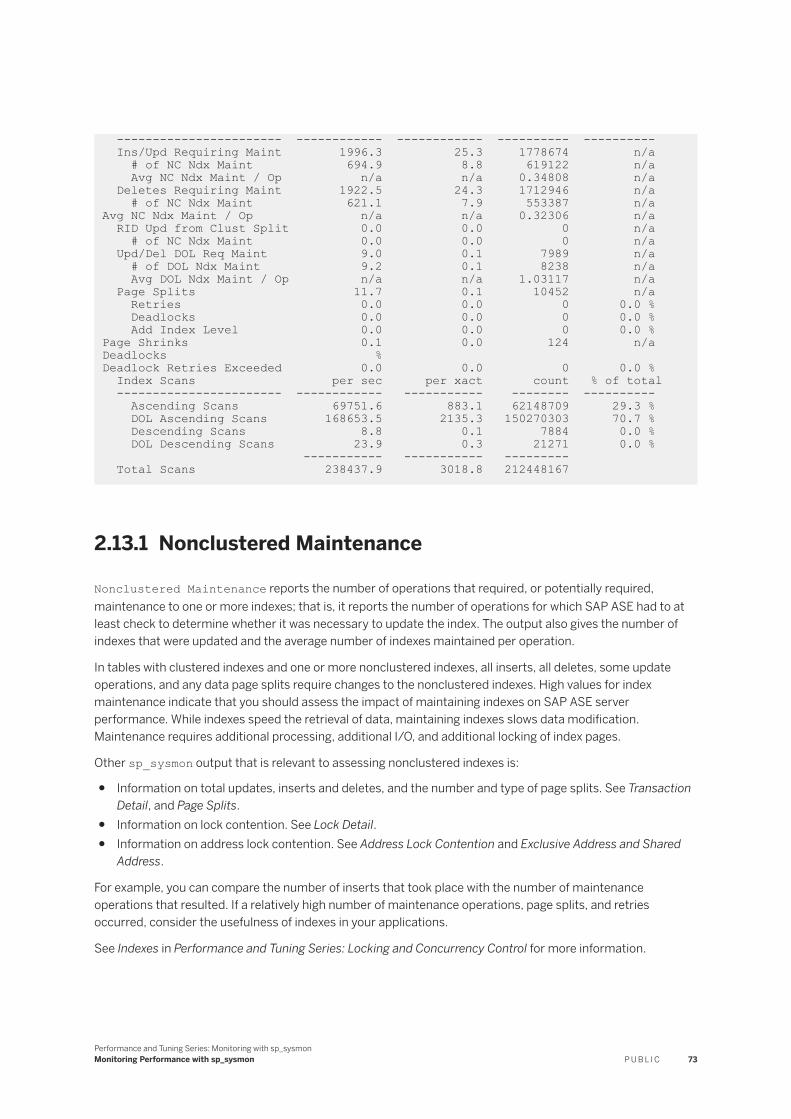
----------------------- ------------ ------------ ---------- ---------- Ins/Upd Requiring Maint 1996.3 25.3 1778674 n/a # of NC Ndx Maint 694.9 8.8 619122 n/a Avg NC Ndx Maint / Op n/a n/a 0.34808 n/a Deletes Requiring Maint 1922.5 24.3 1712946 n/a # of NC Ndx Maint 621.1 7.9 553387 n/aAvg NC Ndx Maint / Op n/a n/a 0.32306 n/a RID Upd from Clust Split 0.0 0.0 0 n/a # of NC Ndx Maint 0.0 0.0 0 n/a Upd/Del DOL Req Maint 9.0 0.1 7989 n/a # of DOL Ndx Maint 9.2 0.1 8238 n/a Avg DOL Ndx Maint / Op n/a n/a 1.03117 n/a Page Splits 11.7 0.1 10452 n/a Retries 0.0 0.0 0 0.0 % Deadlocks 0.0 0.0 0 0.0 % Add Index Level 0.0 0.0 0 0.0 %Page Shrinks 0.1 0.0 124 n/aDeadlocks % Deadlock Retries Exceeded 0.0 0.0 0 0.0 % Index Scans per sec per xact count % of total ----------------------- ------------ ----------- -------- ---------- Ascending Scans 69751.6 883.1 62148709 29.3 % DOL Ascending Scans 168653.5 2135.3 150270303 70.7 % Descending Scans 8.8 0.1 7884 0.0 % DOL Descending Scans 23.9 0.3 21271 0.0 % ----------- ----------- --------- Total Scans 238437.9 3018.8 212448167
2.13.1 Nonclustered Maintenance
Nonclustered Maintenance reports the number of operations that required, or potentially required, maintenance to one or more indexes; that is, it reports the number of operations for which SAP ASE had to at least check to determine whether it was necessary to update the index. The output also gives the number of indexes that were updated and the average number of indexes maintained per operation.
In tables with clustered indexes and one or more nonclustered indexes, all inserts, all deletes, some update operations, and any data page splits require changes to the nonclustered indexes. High values for index maintenance indicate that you should assess the impact of maintaining indexes on SAP ASE server performance. While indexes speed the retrieval of data, maintaining indexes slows data modification. Maintenance requires additional processing, additional I/O, and additional locking of index pages.
Other sp_sysmon output that is relevant to assessing nonclustered indexes is:
● Information on total updates, inserts and deletes, and the number and type of page splits. See Transaction Detail, and Page Splits.
● Information on lock contention. See Lock Detail.● Information on address lock contention. See Address Lock Contention and Exclusive Address and Shared
Address.
For example, you can compare the number of inserts that took place with the number of maintenance operations that resulted. If a relatively high number of maintenance operations, page splits, and retries occurred, consider the usefulness of indexes in your applications.
See Indexes in Performance and Tuning Series: Locking and Concurrency Control for more information.
Performance and Tuning Series: Monitoring with sp_sysmonMonitoring Performance with sp_sysmon P U B L I C 73

Related Information
Transaction Detail [page 60]Page Splits [page 75]Lock Detail [page 86]Address Lock Contention [page 46]Exclusive Address and Shared Address [page 87]
2.13.1.1 Ins/Upd Requiring Maint
The data in the Ins/Upd Requiring Maint section gives information about how insert and update operations affect indexes on allpages-locked tables.
For example, an insert to a clustered table with three nonclustered indexes requires updates to all three indexes, so the average number of operations that resulted in maintenance to nonclustered indexes is three.
However, an update to the same table may require only one maintenance operation—to the index for which key value was changed.
● Ins/Upd Requiring Maint – reports the number of insert and update operations to a table with indexes that potentially required modifications to one or more indexes.
● # of NC Ndx Maint – reports the number of nonclustered indexes that required maintenance as a result of insert and update operations.
● Avg NC Ndx Maint/Op – reports the average number of nonclustered indexes per insert or update operation that required maintenance.
For data-only-locked tables, inserts are reported in Ins/Upd Requiring Maint, and deletes and inserts are reported in Upd/Del DOL Req Maint.
2.13.1.2 Deletes Requiring Maintenance
The data in the Deletes Requiring Maintenance section gives information about how delete operations affected indexes on allpages-locked tables.
● Deletes Requiring Maint – reports the number of delete operations that potentially required modification to one or more indexes.
● # of NC Ndx Maint – reports the number of nonclustered indexes that required maintenance as a result of delete operations.
● Avg NC Ndx Maint/Op – reports the average number of nonclustered indexes per delete operation that required maintenance.
74 P U B L I CPerformance and Tuning Series: Monitoring with sp_sysmon
Monitoring Performance with sp_sysmon

Related Information
Deletes [page 64]
2.13.1.3 RID Upd from Clust Split
RID Upd from Clust Split reports index maintenance activity caused by page splits in allpages-locked tables with clustered indexes.
These splits require updating the nonclustered indexes for all of the rows that move to the new data page.
● RID Upd from Clust Split – reports the total number of page splits that required maintenance of a nonclustered index.
● # of NC Ndx Maint – reports the number of nonclustered rows that required maintenance as a result of row ID update operations.
● Avg NC Ndx Maint/Op – reports the average number of nonclustered indexes entries that were updated for each page split.
2.13.1.4 Upd/Del DOL Req Maint
The data in the Upd/Del DOL Req Maint section gives information about how updates and deletes affected indexes on data-only-locked tables.
● Upd/Del DOL Req Maint reports the number of update and delete operations that potentially required modification to one or more indexes.
● # of DOL Ndx Main reports the number of indexes that required maintenance as a result of update or delete operations.
● Avg DOL Ndx Maint/Op reports the average number of indexes per update or delete operation that required maintenance.
2.13.2 Page Splits
Page Splits reports the number page splits for data pages, clustered index pages, or nonclustered index pages that occurred because there was not enough room for a new row.
When a data row is inserted into an allpages-locked table with a clustered index, the row must be placed in physical order according to the key value. Index rows must also be placed in physical order on the pages. If there is not enough room on a page for a new row, the SAP ASE server splits the page, allocates a new page, and moves some rows to the new page. Page splitting incurs overhead because it updates the parent index page and the page pointers on the adjoining pages and adds lock contention. For clustered indexes, page splitting also updates all nonclustered indexes that point to the rows on the new page.
See Indexes in Performance and Tuning Series: Locking and Concurrency Control for more information.
Performance and Tuning Series: Monitoring with sp_sysmonMonitoring Performance with sp_sysmon P U B L I C 75

2.13.2.1 Reduce Page Splits for Ascending Key InsertsIf Page Splits is high and your application is inserting values into an allpages-locked table with a clustered index on a compound key, you may be able to reduce the number of page splits through a special optimization that changes the page split point for these indexes.
The special optimization is designed to reduce page splitting and to result in more completely filled data pages. This affects only clustered indexes with compound keys, where the first key is already in use in the table, and the second column is based on an increasing value.
2.13.2.2 Default Data Page SplittingFigures explain how default data page splitting works.
The table sales has a clustered index on store_id, customer_id. There are three stores (A, B, and C). Each store adds customer records in ascending numerical order. The table contains rows for the key values A,1; A,2; A,3; B,1; B,2; C,1; C,2; and C,3, and each page holds four rows, as shown in the figure:
Using the normal page-splitting mechanism, inserting “A,4” results in allocating a new page and moving half of the rows to it, and inserting the new row in place, as shown in the figure:
When “A,5” is inserted, no split is needed, but when “A,6” is inserted, another split takes place, as shown in the figure:
Adding “A,7” and “A,8” results in yet another page split, as shown in the figure:
76 P U B L I CPerformance and Tuning Series: Monitoring with sp_sysmon
Monitoring Performance with sp_sysmon

For more information about data page splits, see How Indexes Work in the Performance and Tuning: Basics
2.13.2.3 Effects of Ascending Inserts
You can set ascending inserts mode for a table, so that pages are split at the point of the inserted row rather than in the middle of the page.
Starting from the original table shown in Clustered Table Before Inserts, the insertion of “A,4” results in a split at the insertion point, with the remaining rows on the page moving to a newly allocated page, as shown in the figure:
Inserting “A,5” causes a new page to be allocated, as shown in the figure:
Adding “A,6”, “A,7”, and “A,8” fills the new page, as shown in the figure:
2.13.2.4 Setting Ascending Inserts Mode for a Table
Use these commands to update the status2 bit of sysindexes.
Context
If tables sometimes experience random inserts and have more ordered inserts during batch jobs, enable dbcc tune (ascinserts) only for the period during which the batch job runs.
Performance and Tuning Series: Monitoring with sp_sysmonMonitoring Performance with sp_sysmon P U B L I C 77

Procedure
● To turn on ascending insert mode for the sales table, use:
dbcc tune (ascinserts, 1, "sales")
● To turn ascending insert mode off, use:
dbcc tune (ascinserts, 0, "sales")
2.13.2.5 Retries and Deadlocks
Retries and Deadlocks reports the number index page splits and shrinks that resulted in deadlocks. SAP ASE has a mechanism called deadlock retries that attempts to avoid transaction rollbacks caused by index page deadlocks. “Retries” reports the number of times the SAP ASE server used this mechanism.
Deadlocks on index pages take place when each of two transactions needs to acquire locks held by the other transaction. On data pages, deadlocks result in choosing one process (the one with the least accumulated CPU time) as a deadlock victim and rolling back the process.
By the time an index deadlock takes place, the transaction has already updated the data page and is holding data page locks, so rolling back the transaction causes overhead.
In a large percentage of index deadlocks caused by page splits and shrinks, both transactions can succeed by dropping one set of index locks, and restarting the index scan. The index locks for one of the processes are released (locks on the data pages are still held), and Adaptive Server tries the index scan again, traversing the index from the root page of the index.
Usually, by the time the scan reaches the index page that needs to be split, the other transaction has completed, and no deadlock takes place. By default, any index deadlock that is due to a page split or shrink is retried up to five times before the transaction is considered deadlocked and is rolled back.
For information on changing the default value for the number of deadlock retries with sp_configure “deadlock retries”, see Reference Manual: Configuration Parameters.
The deadlock retries mechanism causes the locks on data pages to be held slightly longer than usual and causes increased locking and overhead. However, the mechanism reduces the number of transactions that are rolled back due to deadlocks. The default setting provides a reasonable compromise between the overhead of holding data page locks longer and the overhead of rolling back transactions that have to be reissued.
A high number of index deadlocks and deadlock retries indicates high contention in a small area of the index B-tree.
If your application encounters a high number of deadlock retries, reduce page splits using fillfactor when you re-create the index.
See Indexes in Performance and Tuning Series: Locking and Concurrency Control for more information.
78 P U B L I CPerformance and Tuning Series: Monitoring with sp_sysmon
Monitoring Performance with sp_sysmon

2.13.2.6 Add Index Level
Add Index Level reports the number times a new index level was added.
This happens infrequently, so expect to see result values of 0 most of the time. The count could have a value of 1 or 2 if your sample includes inserts into an empty table or into a small table with indexes.
2.13.3 Page Shrinks
Page Shrinks report the number times that deleting index rows caused the index to shrink off a page.
Shrinks incur overhead due to locking in the index and the need to update pointers on adjacent pages. Repeated “count” values greater than 0 indicate there may be many pages in the index with fairly small numbers of rows per page due to delete and update operations. If there are a high number of shrinks, consider rebuilding the indexes.
2.13.4 Index Scans
Index Scans report forward and backward scans by lock scheme.
● Ascending Scans – reports the number of forward scans on allpages-locked tables.● DOL Ascending Scans – reports the number of forward scans on data-only-locked tables.● Descending Scans – reports the number of backward scans on allpages-locked tables.● DOL Descending Scans – reports the number of backward scans on data-only-locked tables.
For more information on forward and backward scans, see Indexes in Performance and Tuning Series: Locking and Concurrency Control.
2.14 Metadata Cache Management
Metadata Cache Management reports the use of the metadata caches that store information about the three types of metadata: objects, indexes, and databases.
Metadata Cache Management also reports the number of object, index, and database descriptors that were active during the sample interval, and the maximum number of descriptors used since the server was last started. It also reports spinlock contention for the object and index metadata caches.
A sample output for Metadata Cache Management looks like:
Metadata Cache Management ------------------------- Metadata Cache Summary per sec per xact count % of total ------------------------- --------- -------- -------- --------- Open Object Usage Active n/a n/a 4604 n/a
Performance and Tuning Series: Monitoring with sp_sysmonMonitoring Performance with sp_sysmon P U B L I C 79

Max Ever Used Since Boot n/a n/a 4612 n/a Free n/a n/a 25396 n/a Reuse Requests Succeeded n/a n/a 0 n/a Failed n/a n/a 0 n/a Open Index Usage Active n/a n/a 2747 n/a Max Ever Used Since Boot n/a n/a 2753 n/a Free n/a n/a 2253 n/a Reuse Requests Succeeded n/a n/a 0 n/a Failed n/a n/a 0 n/a Open Partition Usage Active n/a n/a 2747 n/a Max Ever Used Since Boot n/a n/a 2753 n/a Free n/a n/a 2253 n/a Reuse Requests Succeeded n/a n/a 0 n/a Failed n/a n/a 0 n/a Open Database Usage Active n/a n/a 32 n/a Max Ever Used Since Boot n/a n/a 32 n/a Free n/a n/a 18 n/a Reuse Requests Succeeded n/a n/a 0 n/a Failed n/a n/a 0 n/a Object Manager Spinlock Contention n/a n/a n/a 1.3 % Object Spinlock Contention n/a n/a n/a 0.0 Index Spinlock Contention n/a n/a n/a 0.0 % Index Hash Spinlock Contention n/a n/a n/a 0.0 Partition Spinlock Contention n/a n/a n/a 0.0 % Partition Hash Spinlock Contention n/a n/a n/a 0.0 %
2.14.1 Open Object, Index, Partition, and Database Usage
Each of these sections contains the same information for the three types of metadata caches.
The output provides this information:
● Active – reports the number of objects, indexes, or databases that were active during the sample interval.● Max Ever Used Since Boot – reports the maximum number of descriptors used since the last restart
of an SAP ASE server.● Free – reports the number of free descriptors in the cache.● Reuse Requests – reports the number of times that the cache had to be searched for reusable
descriptors:○ “Failed” means that all descriptors in cache were in use and that the client issuing the request received
an error message.○ “Succeeded” means the request found a reusable descriptor in cache. Even though “Succeeded”
means that the client did not get an error message, Adaptive Server is doing extra work to locate reusable descriptors in the cache and to read metadata information from disk.
80 P U B L I CPerformance and Tuning Series: Monitoring with sp_sysmon
Monitoring Performance with sp_sysmon

You can use this information to set the configuration parameters number of open indexes, number of open objects, and number of open databases:
sp_sysmon Output Action
Large number of “Free” descriptors Set parameter lower
Very few “Free” descriptors Set parameter higher
“Reuse Requests Succeeded” nonzero Set parameter higher
“Reuse Requests Failed” nonzero Set parameter higher
2.14.2 Descriptors Immediately Discarded
Descriptors Immediately Discarded reports the number all descriptors immediately discarded.
A number of configuration parameters determine the number of descriptors an SAP ASE server uses (for example, o/s file descriptors and txn to pss ratio).
See Reference Manual: Configuration Parameters.
2.14.3 Object Manager Spinlock Contention
Object Manager Spinlock Contention is a server-wide spinlock used to manage internal states of the object descriptor.
If the contention on this spinlock is greater than 10 percent, use dbcc tune(des_bind) to reduce contention and improve the server’s scalability. See dbcc tune(des_bind) in the Adaptive Server Enterprise Reference Manual.
2.14.4 Object and Index Spinlock Contention
Object and Index Spinlock Contention reports on spinlock contention on the object descriptor and index descriptor caches.
Use this information to tune the configuration parameters open object spinlock ratio and open index spinlock ratio. If the reported contention is more than 3 percent, decrease the value of the corresponding parameter to lower the number of objects or indexes protected by a single spinlock.
Performance and Tuning Series: Monitoring with sp_sysmonMonitoring Performance with sp_sysmon P U B L I C 81
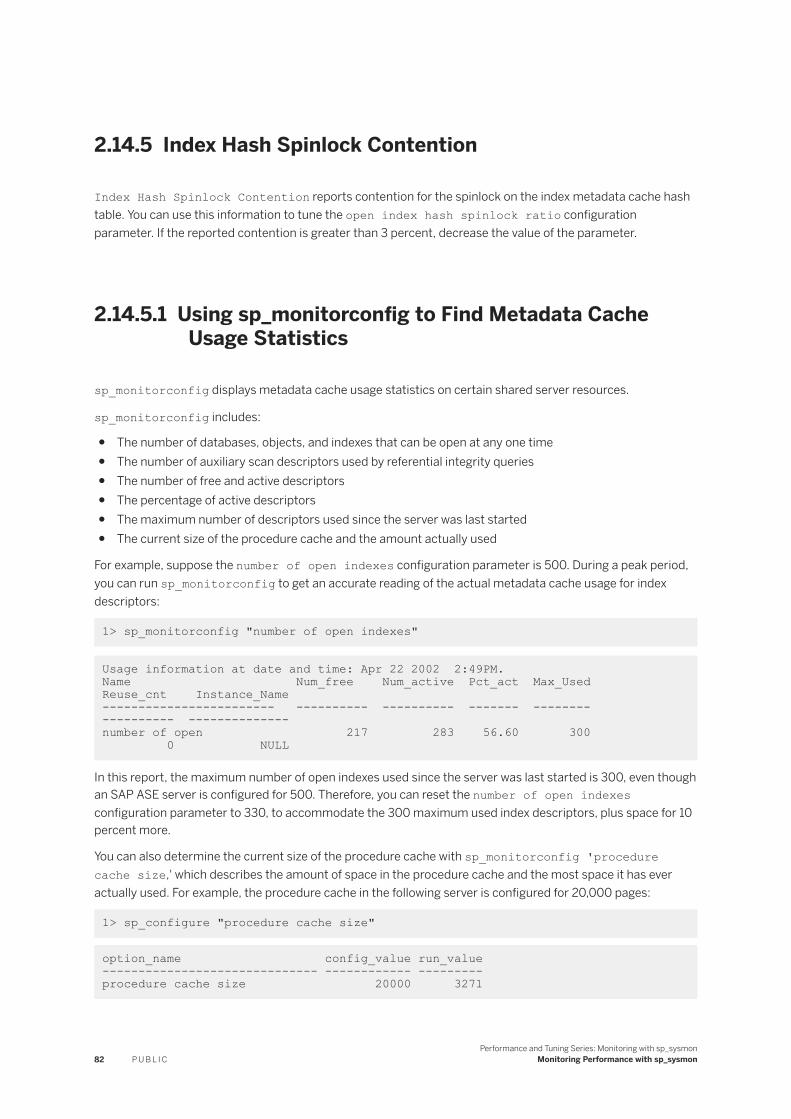
2.14.5 Index Hash Spinlock Contention
Index Hash Spinlock Contention reports contention for the spinlock on the index metadata cache hash table. You can use this information to tune the open index hash spinlock ratio configuration parameter. If the reported contention is greater than 3 percent, decrease the value of the parameter.
2.14.5.1 Using sp_monitorconfig to Find Metadata Cache Usage Statistics
sp_monitorconfig displays metadata cache usage statistics on certain shared server resources.
sp_monitorconfig includes:
● The number of databases, objects, and indexes that can be open at any one time● The number of auxiliary scan descriptors used by referential integrity queries● The number of free and active descriptors● The percentage of active descriptors● The maximum number of descriptors used since the server was last started● The current size of the procedure cache and the amount actually used
For example, suppose the number of open indexes configuration parameter is 500. During a peak period, you can run sp_monitorconfig to get an accurate reading of the actual metadata cache usage for index descriptors:
1> sp_monitorconfig "number of open indexes"
Usage information at date and time: Apr 22 2002 2:49PM. Name Num_free Num_active Pct_act Max_UsedReuse_cnt Instance_Name------------------------ ---------- ---------- ------- ------------------ --------------number of open 217 283 56.60 300 0 NULL
In this report, the maximum number of open indexes used since the server was last started is 300, even though an SAP ASE server is configured for 500. Therefore, you can reset the number of open indexes configuration parameter to 330, to accommodate the 300 maximum used index descriptors, plus space for 10 percent more.
You can also determine the current size of the procedure cache with sp_monitorconfig 'procedure cache size,' which describes the amount of space in the procedure cache and the most space it has ever actually used. For example, the procedure cache in the following server is configured for 20,000 pages:
1> sp_configure "procedure cache size"
option_name config_value run_value------------------------------ ------------ --------- procedure cache size 20000 3271
82 P U B L I CPerformance and Tuning Series: Monitoring with sp_sysmon
Monitoring Performance with sp_sysmon

However, when you run sp_montorconfig “procedure cache size”, you find that the most the procedure cache has ever used is 14241 pages, which means you can save memory by lowering the run value of the procedure cache:
1> sp_monitorconfig "procedure cache size"
Usage information at date and time: Apr 22 2002 2:49PM. Name Num_free Num_active Pct_act Max_Used Reuse_cnt Instance_Name------------------- ---------- ---------- ------- ----------- ---------- --------------procedure cache 5878 14122 70.61 14241 0 NULL
2.14.6 Partition Spinlock Contention
Partition Spinlock Contention indicates the amount of spinlock contention for partitions.
Reduce partition spinlock contention by dividing the cache into additional partitions.
See Memory User and Performance in the System Administration Guide, Volume 2 and Locking Configuration and Tuning in the Performance and Tuning Series: Locking and Concurrency Control.
2.14.7 Partition Hash Spinlock Contention
Partition Hash Spinlock Contention indicates the amount of hash spinlock contention for partitions.
See Memory User and Performance in the System Administration Guide, Volume 2 and Locking Configuration and Tuning in the Performance and Tuning Series: Locking and Concurrency Control.
2.15 Lock Management
Lock Management reports locks, deadlocks, lock promotions, and lock contention.
A sample output for Lock Management looks like:
Lock Management ---------------Lock Summary per sec per xact count % of total------------------------ ------------ ----------- --------- --------- Total Lock Requests 279236.5 6878.6 167541893 n/aAvg Lock Contention 1.2 0.0 691 0.0 %Cluster Locks Retained 0.0 0.0 0 0.0 %Deadlock Percentage 0.0 0.0 0 0.0 %Lock Detail per sec per xact count % of total------------------------ ------------ ----------- --------- --------- Table Lock Hashtable Lookups 9571.4 235.8 5742818 n/a
Performance and Tuning Series: Monitoring with sp_sysmonMonitoring Performance with sp_sysmon P U B L I C 83

Avg Chain Length n/a n/a 0.00981 n/a Spinlock Contention n/a n/a n/a 0.2 %Exclusive Table Granted 14.3 0.4 8580 100.0 % Waited 0.0 0.0 0 0.0 %------------------------- ------------ ------------ ---------- ----------Total EX-Table Requests 14.3 0.4 8580 0.0 %Shared Table Total SH-Table Requests 0.0 0.0 0 n/aExclusive Intent Granted 139.7 3.4 83793 100.0 % Waited 0.0 0.0 0 0.%------------------------- ------------ ------------ ---------- ----------Total EX-Intent Requests 139.7 3.4 83793 0.1 %Shared Intent Granted 9412.9 231.9 5647759 100.0 % Waited 0.0 0.0 0 0.0 %------------------------- ------------ ------------ ---------- ----------Total SH-Intent Requests 9412.9 231.9 5647759 3.4 %Page & Row Lock HashTable Lookups 173637.2 4277.3 104182335 n/a Avg Chain Length n/a n/a 0.01387 n/a Spinlock Contention n/a n/a n/a 0.4 %Exclusive Page Granted 306.5 7.6 183911 100.0 % Waited 0.0 0.0 2 0.0 %------------------------- ------------ ------------ ---------- ----------Total EX-Page Requests 306.5 7.6 183913 0.1 %Update Page Granted 19052.6 469.3 11431583 100.0 % Waited 0.1 0.0 60 0.0 %------------------------- ------------ ------------ ---------- ----------Total UP-Page Requests 19052.7 469.3 11431643 6.8 %Shared Page Granted 63587.2 1566.4 38152347 100.0 % Waited 0.0 0.0 0 0.0 %------------------------- ------------ ------------ ---------- ----------Total SH-Page Requests 63587.2 1566.4 38152347 22.8 %Exclusive Row Granted 33.9 0.8 20326 100.0 % Waited 0.0 0.0 0 0.0 %------------------------- ------------ ------------ ---------- ----------Total EX-Row Requests 33.9 0.8 20326 0.0 %Update Row Granted 10.1 0.2 6030 98.2 % Waited 0.2 0.0 108 1.8 %------------------------- ------------ ------------ ---------- ----------Total UP-Row Requests 10.2 0.3 6138 0.0 %Shared Row Granted 88431.3 2178.4 53058781 100.0 % Waited 0.0 0.0 0 0.0 %------------------------- ------------ ------------ ---------- ----------Total SH-Row Requests 88431.3 2178.4 53058781 31.7 %Next-Key Total Next-Key Requests 0.0 0.0 0 n/aAddress Lock Hashtable Lookups 98247.7 2420.2 58948613 n/a Avg Chain Length n/a n/a 0.00019 n/a Spinlock Contention n/a n/a n/a 0.5 %Exclusive Address Granted 2758.9 68.0 1655359 100.0 % Waited 0.6 0.0 380 0.0 %------------------------- ------------ ------------ ---------- ----------Total EX-Address Requests 2759.6 68.0 1655739 1.0 %Shared Address Granted 95487.9 2352.2 57292733 100.0 % Waited 0.2 0.0 141 0.0 %------------------------- ------------ ------------ ---------- ----------
84 P U B L I CPerformance and Tuning Series: Monitoring with sp_sysmon
Monitoring Performance with sp_sysmon

Total SH-Address Requests 95488.1 2352.2 57292874 34.2 %Last Page Locks on Heaps Granted 799.4 19.7 479637 100.0 % Waited 0.0 0.0 0 0.0 %------------------------- ------------ ------------ ---------- ----------Total Last Pg Locks 799.4 19.7 479637 100.0 %Deadlocks by Lock Type per sec per xact count % of total------------------------ ------------ ----------- --------- --------- Total Deadlocks 0.0 0.0 0 n/aDeadlock Detection Deadlock Searches 0.0 0.0 19 n/a Searches Skipped 0.0 0.0 0 0.0 % Avg Deadlocks per Search n/a n/a 0.00000 n/aLock Promotions Total Lock Promotions 0.0 0.0 0 n/aLock Timeouts by Lock Type per sec per xact count % of total------------------------ ------------ ----------- --------- --------- Total Timeouts 0.0 0.0 0 n/aCluster Lock Summary per sec per xact count % of total------------------------ ------------ ----------- --------- --------- Physical Locks Summary per sec per xact count % of total------------------------ ------------ ----------- --------- --------- No physical locks are acquiredLogical Locks Summary per sec per xact count % of total------------------------ ------------ ----------- --------- --------- Object Locks Summary per sec per xact count % of total ------------------------ ------------ ----------- --------- ---------
2.15.1 Sample Output
Sample output reports detail rows even if there were no occurrences of them during the sample interval; for example, “Deadlocks by Lock Type” in the sample output.
2.15.2 Lock Summary
Lock Summary provides overview statistics about lock activity that took place during the sample interval.
● Total Lock Requests – reports the total number of lock requests.● Avg Lock Contention – reports the average number of times there was lock contention as a percentage
of the total number of lock requests.This value is insufficient in determining how severe the lock contention is. To determine the severity of the lock contention, query the monSysWaits, monProcessWaits, and monLocks monitoring tables, or use sp_object_stats. For more information, see Performance and Tuning Series: Monitoring Tables. See the Adaptive Server Reference Manual: Procedures for more information about sp_object_stats. See Performance and Tuning Series: Locking and Concurrency Control for more information on tuning locking behavior.
● Cluster Locks Retained – reports the number of cluster locks retained. A high number indicates a well-partitioned application and that most of the cluster locks are already granted to the current instance. A lower value may indicate that you should reassess the object’s schema and workload pattern to reduce conflicting data access across multiple instances.monCLMobjectActivity includes values for cluster-level lock activity for each object. These values are helpful for making locking decisions at the object level.
Performance and Tuning Series: Monitoring with sp_sysmonMonitoring Performance with sp_sysmon P U B L I C 85

● Deadlock Percentage – reports the percentage of deadlocks as a percentage of the total number lock requests. If this value is high, see Deadlocks by Lock Type.
Related Information
Deadlocks by Lock Type [page 88]
2.15.3 Lock Detail
Lock Detail provides information that helps you determine whether an application is causing a lock contention or deadlock-related problem.
Lock contention can have a large impact on SAP ASE performance. Table locks generate more lock contention than page or row locks because no other tasks can access a table while there is an exclusive table lock on it, and, if a task requires an exclusive table lock, it must wait until all shared locks are released. If lock contention is high, run sp_object_stats to help pinpoint the tables involved.
Lock Detail reports locks by type:
● Granted – the number of times that each lock type was immediately granted to the application.● Waited – the number of times that each lock type waited a particular lock type.● Lookups● Avg Hash Chain Length – the average number of locks per hash bucket during the sample interval.● Spinlock Contention – number of times an engine encountered spinlock contention.
Lock Detail reports on the values for Granted and Waited for these lock types:
● Exclusive Table● Exclusive Intent● Shared Intent● Exclusive Page● Exclusive Row● Update Row● Shared Row● Shared Address● Last Page Locks on Heaps
Lock Detail reports on Avg Hash Chain Length, Lookups, and Spinlock Contention for these lock types:
● Shared Table● Page & Row Lock HashTable● Update Page● Shared Page● Next-Key● Address Lock Hashtable
86 P U B L I CPerformance and Tuning Series: Monitoring with sp_sysmon
Monitoring Performance with sp_sysmon

You can configure the size of the lock hash table using lock hashtable size. If the average number of locks per hash chain is more than four, consider increasing the size of the hash table.
The “% of total” column displays the percentage of the specific lock type that was granted or had to wait with respect to the total number of lock requests.
Large inserts with bulk copy are an exception to this guideline. Lock hash chain lengths may be longer during large bulk copies.
See Locking Configuration and Tuning in Performance and Tuning Series: Locking and Concurrency Control, and Reference Manual: Configuration Parameters.
.
2.15.3.1 Exclusive Address and Shared Address
Exclusive Address and Shared Address reports the number times address locks were immediately granted or the number of times the task had to wait for the lock.
Address locks are held on index pages of allpages-locked tables. Address locks can have serious impact, since a lock on an index page blocks access to all data pages pointed to by the index page.
2.15.3.2 Last Page Locks on Heaps
Last Page Locks on Heaps reports locking attempts on the last page of a partitioned or unpartitioned heap table. It only reports on allpages-locked tables.
This information can indicate whether there are tables in the system that would benefit from using data-only-locking from partitioning, or from increasing the number of partitions. Adding a clustered index that distributes inserts randomly across the data pages may also help. If you know that one or more tables is experiencing a problem with contention for the last page, the monitoring tables can help determine which table is experiencing the problem. See the Performance and Tuning Series: Monitoring Tables.
See Controlling Physical Data Placement in Performance and Tuning Series: Physical Database Tuning for information on how partitions can help solve the problem of last-page locking on unpartitioned heap tables.
2.15.3.3 Table Lock Hashtable
Table Lock Hashtable reports the number times the lock hash table was searched for a lock on a page, row, or table.
Table Lock Hashtable reports on:
● Lookups● Avg Chain Length● Spinlock Contention
Performance and Tuning Series: Monitoring with sp_sysmonMonitoring Performance with sp_sysmon P U B L I C 87

Configure the size of the lock hash table with the configuration parameter lock hashtable size. If the average number of locks per hash chain is more than four, consider increasing the size of the hash table.
See Locking Configuration and Tuning in Performance and Tuning Series: Locking and Concurrency Control for more information.
2.15.4 Deadlocks by Lock Type
Deadlocks by Lock Type reports the number specific types of deadlocks. “% of total” gives the number of each deadlock type as a percentage of the total number of deadlocks.
Deadlocks may occur when many transactions execute at the same time in the same database. They become more common as the lock contention increases between the transactions.
This category reports data for these deadlock types:
● Exclusive Table● Shared Table● Exclusive Intent● Shared Intent● Exclusive Page● Update Page● Shared Page● Exclusive Row● Update Row● Shared Row● Shared Next-Key● Exclusive Address● Shared Address● Others
“Total Deadlocks” summarizes the data for all lock types.
As in the example for this section, if there are no deadlocks, sp_sysmon does not display any detail information, it only prints the “Total Deadlocks” row with zero values.
To pinpoint where deadlocks occur, perform one or both of:
● Use sp_object_stats. See Locking Configuration and Tuning in Performance and Tuning Series: Locking and Concurrency Control for more information.
● Enable printing of detailed deadlock information to the log. See Locking Reports in Performance and Tuning Series: Locking and Concurrency Control for more information.
88 P U B L I CPerformance and Tuning Series: Monitoring with sp_sysmon
Monitoring Performance with sp_sysmon

2.15.5 Deadlock Detection
Deadlock Detection reports the number deadlock searches that found deadlocks and the number of deadlock searches that were skipped during the sample interval.
See Locking Reports in Performance and Tuning Series: Locking and Concurrency Control for more information.
2.15.5.1 Deadlock Searches
Deadlock Searches reports the number times that an SAP ASE server initiated a deadlock search during the sample interval.
Deadlock checking is time-consuming overhead for applications that experience no deadlocks or very low levels of deadlocking. You can use this data with Average Deadlocks Per Search to determine if the SAP ASE server is checking for deadlocks too frequently.
Related Information
Average Deadlocks Per Search [page 89]
2.15.5.2 Searches Skipped
Searches Skipped reports the number times that a task started to perform deadlock checking, but found deadlock checking in progress and skipped its check. “% of total” reports the percentage of deadlock searches that were skipped as a percentage of the total number of searches.
When a process is blocked by lock contention, it waits for an interval of time set by the configuration parameter deadlock checking period. When this period elapses, the process starts deadlock checking. If a search is already in progress, the process skips the search.
If you see some number of searches skipped, but some of the searches are finding deadlocks, increase the parameter slightly. If you see a lot of searches skipped, and no deadlocks, or very few, increase the parameter by a larger amount.
See Reference Manual: Configuration Parameters.
2.15.5.3 Average Deadlocks Per Search
Average Deadlocks per Search reports the average number of deadlocks found per search, measuring whether an SAP ASE server is checking for deadlocks too frequently.
If your applications rarely deadlock, adjust the frequency with which tasks search for deadlocks by increasing the value of the deadlock checking period configuration parameter.
Performance and Tuning Series: Monitoring with sp_sysmonMonitoring Performance with sp_sysmon P U B L I C 89

See Reference Manual: Configuration Parameters.
2.15.6 Lock Promotions
Lock Promotions reports the number times that the following escalations took place.
● Ex-Page to Ex-Table – exclusive page to exclusive table.● Sh-Page to Sh-Table – shared page to shared table.● Ex-Row to Ex-Table – exclusive row to exclusive table.● Sh-Row to Sh-Table – shared row to shared table.● Sh-Next-Key to Sh-Table – shared next-key to shared table.
Total Lock Promotions reports the average number of lock promotion types combined per second and per transaction.
If no lock promotions took place during the sample interval, only the total row is printed.
If there are no lock promotions, sp_sysmon does not display the detail information.
Lock Promotions data can:
● Help you to detect whether lock promotion in your application is a cause of lock contention and deadlocks● Be used before and after tuning lock promotion variables to determine the effectiveness of the values.
Look at the Granted and Waited data for signs of contention. If lock contention is high and lock promotion is frequent, consider changing the lock promotion thresholds for the tables involved.
You can configure the lock promotion threshold either server-wide or for individual tables.
See Reference Manual: Configuration Parameters.
2.15.7 Lock Time-out Information
Lock Time-out Information reports the number times a task was waiting for a lock and the transaction was rolled back due to a session-level or server-level lock timeout.
The detail rows that show the lock types are printed only if lock timeouts occurred during the sample period. If no lock time-outs occurred, “Total Lock Time-outs” is displayed with all values equal to 0.
For more information on lock time-outs, see Using Locking Commands in Performance and Tuning Series: Locking and Concurrency Control.
2.15.8 Cluster Lock Summary
sp_sysmon reports on the following activities for cluster locks.
● Lock Garbage Collection – number of times lock garbage collection ran. A large number of garbage collections per second indicates the cluster has an insufficient number of locks.
90 P U B L I CPerformance and Tuning Series: Monitoring with sp_sysmon
Monitoring Performance with sp_sysmon

● Targeted Collection Success – number of times Lock Garbage Collection was able to successfully reclaim the targeted number of locks. The Cluster Edition determines the target number for locks internally, and is not a configurable parameter. A low percentage of successes indicates the cluster has an insufficient number of locks or an insufficient amount of CIPC message space available.The low percentage of successes indicates an insufficient number of unused locks to successfully reach the targeted collection amount. For example, if a SAP ASE server has 1000 locks and 900 are in use, it would not be able to reach the targeted collection amount, resulting in a low percentage of successes.Another possibility for the low percentage of successes is insufficient number of CIPC messages, causing delays that prevent the garbage collection process from reaching the targeted collection amount. To determine if insufficient CIPC messages are causing the low percentage of successes, check the value for Max_Used with:
sp_monitorconfig "CIPC regular message pool size"
Usage information at date and time: Feb 8 2012 8:39PM. Name Num_free Num_active Pct_act Max_Used Reuse_cnt Instance_Name ------------------------- ---------- ---------- ------- --------------------- ------------------------------CIPC regular message pool 32602 166 0.51 293 0 wsc1
If Max_Used is within 20 percent of the pool size (which is equal to Num_free + Num_active), increase the value for CIPC regular message pool size. If Max_Used is not within 20 percent, increase the value for number of locks.
● Cluster Lock Requests – number of user physical, logical, or object lock requests that cannot be granted because of retention and require cluster communication. A high value indicates a lot of cluster traffic.
● Local Master – number of physical, logical, or object locks that have a local master. A higher value indicates ideal lock, possibly indicating smaller overhead while serving cluster lock requests.If the Cluster Edition cannot find the local master:○ You may need to reassess your application partitioning.○ A single instance has too great a load, which is leading to load balancing of master to remote instance.
Consider changing your workload pattern and schema (such as partitioning your data).● Lock Granted – number of cluster lock requests that wait for a remote instance that owns the cluster
lock with no conflicting task ownership. A high value for Lock Granted indicates conflicting lock requests from multiple instances in cluster. Reassess your application partitioning.
● Lock Waited – number of cluster lock requests that wait for a remote instance that owns the cluster lock with conflicting task ownership. A high value for Lock Waited indicates lock level contention: two tasks on different instances are attempting to acquire the same lock and are in conflict. To rectify, reassess your application partitioning.
● Downgrade Req Recv – displays the number of downgrade requests sent by a remote instance when it asks for a lock that is owned by the local instance.
Performance and Tuning Series: Monitoring with sp_sysmonMonitoring Performance with sp_sysmon P U B L I C 91

2.16 Data Cache Management
sp_sysmon reports summary statistics for all caches, followed by statistics for each named cache.
sp_sysmon reports these activities for the default data cache and for each named cache:
● Spinlock contention● Utilization● Cache searches, including hits and misses● Pool turnover for all configured pools● Buffer wash behavior, including buffers passed clean, buffers already in I/O, and buffers washed dirty● Prefetch requests performed and denied● Dirty read page requests
Use sp_cacheconfig and sp_helpcache output to help analyze the data from this section of the report. sp_cacheconfig provides information about caches and pools, and sp_helpcache provides information about objects bound to caches.
See Configuring Data Caches in System Administration Guide: Volume 2 for information on how to use these system procedures.
See Memory Use and Performance in Performance and Tuning Series: Basics for more information on performance issues and named caches.
2.16.1 Sample Output of Data Cache Management Categories
This sample shows sp_sysmon output for the Data Cache Management categories.
The first block of data, Cache Statistics Summary, includes information for all caches. sp_sysmon reports a separate block of data for each cache. These blocks are identified by the cache name. The sample output shown here includes only the default data cache, although there were more caches configured during the interval.
Data Cache Management --------------------- Cache Statistics Summary (All Caches) ------------------------------------- per sec per xact count % of total ------------ ------------ ---------- ---------- Cache Search Summary Total Cache Hits 1369.3 5868.3 41078 100.0 % Total Cache Misses 0.2 0.9 6 0.0 % ------------------------- ------------ ------------ ---------- Total Cache Searches 1369.5 5869.1 41084 Cache Turnover Buffers Grabbed 0.5 2.1 15 n/a Buffers Grabbed Dirty 0.0 0.0 0 0.0 % Cache Strategy Summary Cached (LRU) Buffers 76.3 327.1 2290 99.9 % Discarded (MRU) Buffers 0.1 0.3 2 0.1 % Large I/O Usage 0.0 0.0 0 n/a Large I/O Effectiveness Pages by Lrg I/O Cached 0.0 0.0 0 n/a
92 P U B L I CPerformance and Tuning Series: Monitoring with sp_sysmon
Monitoring Performance with sp_sysmon

Asynchronous Prefetch Activity APFs Issued 0.1 0.6 4 100.0 % APFs Denied Due To APF I/O Overloads 0.0 0.0 0 0.0 % APF Limit Overloads 0.0 0.0 0 0.0 % APF Reused Overloads 0.0 0.0 0 0.0 % APF Buffers Found in Cache With Spinlock Held 0.0 0.0 0 0.0 % W/o Spinlock Held 0.0 0.0 0 0.0 % ------------------------- ------------ ------------ ---------- Total APFs Requested 0.1 0.6 4 Other Asynchronous Prefetch Statistics APFs Used 0.1 0.6 4 n/a APF Waits for I/O 0.0 0.0 0 n/a APF Discards 0.0 0.0 0 n/a Dirty Read Behavior Page Requests 0.0 0.0 0 n/a------------------------------------------------------------------------------- Cache: default data cache per sec per xact count % of total ------------------------- ------------ ------------ ---------- ---------- Spinlock Contention n/a n/a n/a 0.0 % Utilization n/a n/a n/a 100.0 % Cache Searches Cache Hits 1369.3 5868.3 41078 100.0 % Found in Wash 0.0 0.0 0 0.0 % ELC 0.0 0.0 0 0.0 % w/o spinlockheld 1321.5 5663.7 39646 96.5 % with spinlockheld 47.7 204.6 1432 3.5 % Cache Misses 0.2 0.9 6 0.0 % ------------------------- ------------ ------------ ---------- Total Cache Searches 1369.5 5869.1 41084 Pool Turnover 2 Kb Pool LRU Buffer Grab 0.5 2.1 15 100.0 % Grabbed Locked Buffer 0.0 0.0 0 0.0 % Grabbed Dirty 0.0 0.0 0 0.0 % ------------------------- ------------ ------------ ---------- Total Cache Turnover 0.5 2.1 15 Cluster Cache Behavior No physical locks are acquired on buffers in this cache Buffer Wash Behavior Statistics Not Available - No Buffers Entered Wash Section Yet Cache Strategy Cached (LRU) Buffers 76.3 327.1 2290 99.9 % Discarded (MRU) Buffers 0.1 0.3 2 0.1 % Large I/O Usage Total Large I/O Requests 0.0 0.0 0 n/a Large I/O Detail No Large Pool(s) In This Cache Dirty Read Behavior Page Requests 0.0 0.0 0 n/a Tuning Recommendations for Data cache : default data cache ------------------------------------- - Consider adding a large I/O pool for this cache.------------------------------------------------------------------------------- Cache: sy_resol_cache per sec per xact count % of total ------------------------- ------------ ------------ ---------- ---------- Spinlock Contention n/a n/a n/a 0.0 % Utilization n/a n/a n/a 0.0 % Cache Searches Total Cache Searches 0.0 0.0 0 n/a ------------------------- ------------ ------------ ---------- Total Cache Searches 0.0 0.0 0 Pool Turnover 0.0 0.0 0 n/a Cluster Cache Behavior No physical locks are acquired on buffers in this cache
Performance and Tuning Series: Monitoring with sp_sysmonMonitoring Performance with sp_sysmon P U B L I C 93

Buffer Wash Behavior Statistics Not Available - No Buffers Entered Wash Section Yet Cache Strategy Statistics Not Available - No Buffers Displaced Yet Large I/O Usage Total Large I/O Requests 0.0 0.0 0 n/a Large I/O Detail No Large Pool(s) In This Cache Dirty Read Behavior Page Requests 0.0 0.0 0 n/a
2.16.2 Cache Statistics Summary (All Caches)
This section summarizes behavior for the default data cache and all named data caches combined.
Corresponding information is printed for each data cache.
Related Information
Cache Management by Cache [page 98]
2.16.2.1 Cache Search Summary
Cache Search Summary provides summary information about cache hits and misses. Use this data as an overview of how effective cache design is. A high number of cache misses indicates that you should investigate statistics for each cache.
● Total Cache Hits – reports the number of times that a needed page was found in any cache. “% of total” reports the percentage of cache hits as a percentage of the total number of cache searches.
● Total Cache Misses – reports the number of times that a needed page was not found in a cache and had to be read from disk. “% of total” reports the percentage of times that the buffer was not found in the cache as a percentage of all cache searches.
● Total Cache Searches – reports the total number of cache searches, including hits and misses for all caches combined.
2.16.2.2 Cache Turnover
Cache Turnover provides a summary of cache turnover.
● Buffers Grabbed – reports the number of buffers that were replaced in all of the caches. The “count” column represents the number of times that Adaptive Server fetched a buffer from the LRU end of the cache, replacing a database page. If the server was recently restarted, so that the buffers are empty, reading a page into an empty buffer is not counted here.
94 P U B L I CPerformance and Tuning Series: Monitoring with sp_sysmon
Monitoring Performance with sp_sysmon
● Buffers Grabbed Dirty – reports the number of times that fetching a buffer found a dirty page at the LRU end of the cache and had to wait while the buffer was written to disk. If this value is nonzero, find out which caches are affected and disk IO are performing adequately and increase the pool wash size. This represents a serious performance hit.
2.16.2.3 Cache Strategy Summary
Cache Strategy Summary provides a summary of the caching strategy used.
● Cached (LRU) Buffers – reports the total number of buffers placed at the head of the most-recently used and last-recently used (MRU, LRU) chain in all caches.
● Discarded (MRU) Buffers – reports the total number of buffers in all caches following the fetch-and-discard strategy—the buffers placed at the wash marker.
2.16.2.4 Large I/O Usage
Large I/O Usage provides summary information about the large I/O requests in all caches. If Large I/Os Denied is high, investigate individual caches to determine the cause.
● Large I/Os Performed – measures the number of times that the requested large I/O was performed. “% of total” is the percentage of large I/O requests performed as a percentage of the total number of I/O requests made.
● Large I/Os Denied – reports the number of times that large I/O could not be performed. “% of total” reports the percentage of large I/O requests denied as a percentage of the total number of requests made.
● Total Large I/O Requests – reports the number of all large I/O requests (both granted and denied) for all caches.
2.16.2.5 Large I/O Effectiveness
Large I/O Effectiveness helps determine the performance benefits of large I/O, comparing the number of pages that were brought into cache by a large I/O to the number of pages actually referenced while in the cache. If the percentage for Pages by Lrg I/O Used is low, few of the pages brought into cache are being accessed by queries.
Investigate the individual caches to determine the source of the problem. Use optdiag to check the value for Large I/O Efficiency for each table and index.
● Pages by Lrg I/O Cached – reports the number of pages brought into all caches by all large I/O operations that took place during the sample interval. Low percentages could indicate one of:○ Allocation fragmentation in the table’s storage○ Inappropriate caching strategy
● Pages by Lrg I/O Used – reports the total number of pages that were used after being brought into cache by large I/O. sp_sysmon does not print output for this category if there were no Pages by Lrg I/O Cached.
Performance and Tuning Series: Monitoring with sp_sysmonMonitoring Performance with sp_sysmon P U B L I C 95

2.16.2.6 Asynchronous Prefetch Activity Report
Asynchronous Prefetch Activity Report reports asynchronous prefetch activity for all caches.
For information on asynchronous prefetch for each database device, see Disk I/O Management. For information about asynchronous prefetch, see Tuning Asynchronous Prefetch in Performance and Tuning Series: Basics.
● Total APFs Requested – reports the total number of pages eligible to be prefetched, that is, the sum of the look-ahead set sizes of all queries issued during the sample interval. Other rows in Asynchronous Prefetch Activity provide detailed information about:○ The pages that were prefetched (“APFs Issued”)○ The reasons that prefetch was denied○ The page was found in the cache
● APFs Issued – reports the number asynchronous prefetch requests issued by the system during the sample interval.
● APFs Denied Due To – reports the reasons that APFs were not issued:○ APF I/O Overloads reports the number of times APF usage was denied because of a lack of disk I/O
structures or because of disk semaphore contention.If this number is high, check the following information in Disk I/O Management:○ The value of the disk i/o structures configuration parameter. See Disk I/O Structures
in I/Os Delayed By.○ Values for contention for device semaphores for each database device to determine the source of
the problem. See Mirror Semaphore Granted and Waited.If the problem is due to a shortage of disk I/O structures, set the configuration parameter higher, and repeat your tests. If the problem is due to high disk semaphore contention, examine the physical placement of the objects where high I/O takes place.
○ APF Limit Overloads indicates that the percentage of buffer pools that can be used for asynchronous prefetch was exceeded. This limit is set for the server as a whole by the global async prefetch limit configuration parameter. Use sp_poolconfig to tune each pool individually.
○ APF Reused Overloads indicates that APF usage was denied due to a kinked page chain or because the buffers brought in by APF were swapped out before they could be accessed.Ideally, consecutive pages contain consecutive rows. However, if the page chain jumped from its present position to a distant piece of disk for a few pages then jumped back to its original position, the page is considered “kinked”. For example, a page chain that uses pages 1, 2, 396, 397, 3, 4 is kinked.
● APF Buffers Found in Cache – reports the number buffers from APF look-ahead sets that were found in the data cache during the sample interval. Asynchronous prefetch tries to find a page to read in the data cache using a quick scan, without holding the cache spinlock. If that does not succeed, APF then performs a thorough scan holding the spinlock.
Related Information
Disk I/O Management [page 107]I/Os Delayed By [page 108]Mirror Semaphore Granted and Waited [page 110]
96 P U B L I CPerformance and Tuning Series: Monitoring with sp_sysmon
Monitoring Performance with sp_sysmon

2.16.2.7 Other Asynchronous Prefetch Statistics
Other Asynchronous Prefetch Statistics reports three additional asynchronous prefetch statistics.
● APFs Used – reports the number of pages that were brought into the cache by asynchronous prefetch and used during the sample interval. The pages counted for this report may have been brought into cache during the sample interval or by asynchronous prefetch requests that were issued before the sample interval started.
● APF Waits for I/O – reports the number of times a process had to wait for an asynchronous prefetch to complete. This indicates that the prefetch was not issued early enough for the pages to be in cache before the query needed them. It is reasonable to expect some percentage of “APF Waits.” Some reasons that tasks may have to wait are:○ The first asynchronous prefetch request for a query is generally included in “APF Waits.”○ Each time a sequential scan moves to a new allocation unit and issues prefetch requests, the query
must wait until the first I/O completes.○ Each time a nonclustered index scan finds a set of qualified rows and issues prefetch requests for the
pages, it must wait for the first pages to be returned.Other factors that can affect APF Waits for I/O are the amount of processing that needs to be done on each page, and the speed of the I/O subsystem.
● APF Discards – indicates the number of pages that were read in by asynchronous prefetch and discarded before they were used. A high value for APFs Discards may indicate that increasing the size of the buffer pools could help performance, or it may indicate that APF is bringing pages into cache that are not needed by the query.
2.16.2.8 Dirty Read Behavior
Dirty Read Behavior provides information to help you analyze how dirty reads (isolation level 0 reads) affect the system.
● Page Requests – reports the average number of pages that were requested at isolation level 0. The “% of total” column reports the percentage of dirty reads with respect to the total number of page reads.Dirty read page requests incur high overhead if they lead to many dirty read restarts.
● Dirty Read Re-starts – reports the number dirty read restarts that took place. This category is reported only for the server as a whole, and not for individual caches. sp_sysmon does not print output for this category if there were no Dirty Read Page Requests.A dirty read restart occurs when a dirty read is active on a page and another process makes changes to the page that cause the page to be deallocated. The scan for the level 0 must be restarted.The “% of total” output is the percentage of dirty read restarts done with isolation level 0 as a percentage of the total number of page reads.If these values are high, you might take steps to reduce them through application modifications, because overhead associated with dirty reads and resulting restarts is very expensive. Most applications should avoid restarts because of the large overhead they incur.
Performance and Tuning Series: Monitoring with sp_sysmonMonitoring Performance with sp_sysmon P U B L I C 97

2.16.3 Cache Management by Cache
Cache Management by Cache reports cache utilization for each active cache on the server. The sample output shows results for the default data cache.
2.16.3.1 Cache Spinlock Contention
Cache Spinlock Contention reports the number times an engine encountered spinlock contention on the cache, and had to wait, as a percentage of the total spinlock requests for that cache. This is meaningful only in SMP environments.
When a user task makes any changes to a cache, a spinlock denies all other tasks access to the cache while the changes are being made. Although spinlocks are held for extremely brief durations, they can slow performance in multiprocessor systems with high transaction rates. If spinlock contention is more than 10 percent, consider using named caches or adding cache partitions.
See Memory Use and Performance in Performance and Tuning: Basics for information on adding caches.
2.16.3.2 Utilization
Utilization reports the percentage of searches using this cache as a percentage of searches across all caches.You can compare this value for each cache to determine if there are caches that are over- or under-utilized.
If you decide that a cache is not well utilized, you can:
● Change the cache bindings to balance utilization. For more information, see Memory Use and Performance in Performance and Tuning: Basics.
● Resize the cache to correspond more appropriately to its utilization. For more information, see Configuring Data Caches in System Administration Guide: Volume 2.
2.16.3.3 Cache Search, Hit, and Miss Information
Cache Search, Hit, and Miss Information reports the number hits and misses and the total number of searches for this cache.
Cache hits are roughly comparable to the logical reads values reported by statistics io; cache misses are roughly equivalent to physical reads. sp_sysmon always reports values that are higher than those shown by statistics io, since sp_sysmon also reports the I/O for system tables, log pages, OAM pages, and other system overhead.
Interpreting cache hit data requires that you understand how applications use each cache. In caches that are created to hold specific objects such as indexes or lookup tables, cache hit ratios may reach 100 percent. In caches used for random point queries on huge tables, cache hit ratios may be quite low but still represent effective cache use.
98 P U B L I CPerformance and Tuning Series: Monitoring with sp_sysmon
Monitoring Performance with sp_sysmon

Cache hits and misses can also help you to determine if adding more memory would improve performance. For example, if Cache Hits is high, adding memory probably would not help much.
● Cache Hits – reports the number times that a needed page was found in the data cache. “% of total” reports the percentage of cache hits compared to the total number of cache searches. Cache Hits counter includes three subcategories:○ ELC – the number of cache hits through the engine local cache.○ With Spinlock Held – the number of cache hits from the buffer searches performed by taking
cache spinlock.○ W/o Spinlock Held – the number of cache hits from the buffer searches performed without cache
spinlock.● Found in Wash – reports the number times that the needed page was found in the wash section of the
cache. “% of total” reports the percentage of times that the buffer was found in the wash area as a percentage of the total number of hits. If the data indicates a large percentage of cache hits found in the wash section, it may mean the wash area is too big. However, a large number of hits is not a problem for caches that are read-only or that have a low number of writes.A large wash section might lead to increased physical I/O because SAP ASE initiates a write on all dirty pages as they cross the wash marker. If a page in the wash area is written to disk, and is then updated a second time, I/O has been wasted. Check to see whether a large number of buffers are being written at the wash marker. See Buffer Wash Behavior for more information.If queries on tables in the cache use a “fetch-and-discard” strategy for a non-APF I/O, the first cache hit for a page finds it in the wash. The buffer is moved to the MRU end of the chain, so a second cache hit soon after the first cache hit will find the buffer still outside the wash area. See Cache Strategy for information.You can change the wash size. If you make the wash size smaller, run sp_sysmon again under fully loaded conditions and check the output for “Grabbed Dirty” values greater than 0. See Cache Turnover.See .
● Cache Misses – reports the number times that a needed page was not found in the cache and had to be read from disk. “% of total” is the percentage of times that the buffer was not found in the cache as a percentage of the total searches.
● Total Cache Searches – summarizes cache search activity. The Found in Wash data is a subcategory of the Cache Hits number and is not used in the summary calculation.
Related Information
Buffer Wash Behavior [page 101]Cache Strategy [page 101]Cache Turnover [page 94]
2.16.3.4 Pool Turnover
Pool Turnover reports the number times that a buffer was replaced from each pool in a cache.
Each cache can have up to 4 pools, with I/O sizes of 2K, 4K, 8K, and 16K. If there is any Pool Turnover, sp_sysmon prints the LRU Buffer Grab and Grabbed Dirty information for each pool that is configured
Performance and Tuning Series: Monitoring with sp_sysmonMonitoring Performance with sp_sysmon P U B L I C 99
and a total turnover figure for the entire cache. If there is no Pool Turnover, sp_sysmon prints zeros for Total Cache Turnover.
This information helps you to determine if the pools and cache are the right size.
● LRU Buffer Grab – is incremented only when a page is replaced by another page. If you have recently restarted the SAP ASE server, or if you have just unbound and rebound the object or database to the cache, turnover does not count reading pages into empty buffers.If memory pools are too small for the throughput, you may see high turnover in the pools, reduced cache hit rates, and increased I/O rates. If turnover is high in some pools and low in other pools, you might want to move space from the less active pool to the more active pool, especially if it can improve the cache-hit ratio.If the pool has 1000 buffers, and the SAP ASE server is replacing 100 buffers every second, 10 percent of the buffers are being turned over every second. This might be an indication that the buffers do not remain in cache for long enough for the objects using that cache.
● Grabbed Dirty – provides statistics for the number of dirty buffers that reached the LRU before they could be written to disk. When the SAP ASE server needs to grab a buffer from the LRU end of the cache to fetch a page from disk, and finds a dirty buffer instead of a clean one, it must wait for I/O on the dirty buffer to complete. “% of total” reports the percentage of buffers grabbed dirty as a percentage of the total number of buffers grabbed.A nonzero value for Grabbed Dirty indicates that the wash area of the pool is too small for the throughput in the pool. Remedial actions depend on the pool configuration and usage:○ If the pool is very small and has high turnover, consider increasing the size of the pool and the wash
area.○ If the pool is large, and it is used for a large number of data modification operations, increase the size
of the wash area.○ If several objects use the cache, moving some of them to another cache could help.○ If the cache is being used by create index, the high I/O rate can cause dirty buffer grabs, especially
in a small (16K) pool. In these cases, set the wash size for the pool as high as possible, to 80 percent of the buffers in the pool.
○ If the cache is partitioned, reduce the number of partitions.○ Check query plans and I/O statistics for objects that use the cache for queries that perform a lot of
physical I/O in the pool. Tune queries, if possible, by adding indexes.Check the “per second” values for Buffers Already in I/O and Buffers Washed Dirty in Buffer Wash Behavior. The wash area should be large enough to allow I/O to be completed on dirty buffers before they reach the LRU. The time required to complete the I/O depends on the actual number of physical writes per second achieved by your disk drives.Also check Disk I/O Management to see if I/O contention is slowing disk writes.Also, it might help to increase the value of the housekeeper free write percent configuration parameter. See System Administration Guide: Volume 1.
● Total Cache Turnover – provides the total number of buffers grabbed in all pools in the cache.
Related Information
Buffer Wash Behavior [page 101]Disk I/O Management [page 107]
100 P U B L I CPerformance and Tuning Series: Monitoring with sp_sysmon
Monitoring Performance with sp_sysmon

2.16.3.5 Cluster Cache Behavior
sp_sysmon describes any locks acquired for buffers for a clustered environment.
2.16.3.6 Buffer Wash Behavior
Buffer Wash Behavior reports information about the state of buffers when they reach the pool’s wash marker.
When a buffer reaches the wash marker, it is in one of three states:
● Buffers Passed Clean – reports the number of buffers that were clean when they passed the wash marker. The buffer was not changed while it was in the cache, or it was changed, and has already been written to disk by the housekeeper or a checkpoint. “% of total” reports the percentage of buffers passed clean as a percentage of the total number of buffers that passed the wash marker.
● Buffers Already in I/O – reports the number of times that I/O was already active on a buffer when it entered the wash area. The page was modified while in the cache. The housekeeper or a checkpoint has started I/O on the page, but the I/O has not completed. “% of total” reports the percentage of buffers already in I/O as a percentage of the total number of buffers that entered the wash area.
● Buffers Washed Dirty – reports the number of times that a buffer entered the wash area dirty and not already in I/O. The buffer was changed while in the cache and has not been written to disk. An asynchronous I/O is started on the page as it passes the wash marker. “% of total” reports the percentage of buffers washed dirty as a percentage of the total number of buffers that entered the wash area.
If no buffers pass the wash marker during the sample interval, sp_sysmon prints:
Statistics Not Available - No Buffers Entered Wash Section Yet!
2.16.3.7 Cache Strategy
Cache Strategy reports the number buffers placed in cache following the fetch-and-discard (MRU) or normal (LRU) caching strategies.
● Cached (LRU) Buffers – reports the number of buffers that used normal cache strategy and were placed at the MRU end of the cache. This includes all buffers read directly from disk and placed at the MRU end, and all buffers that were found in cache. At the completion of the logical I/O, the buffer was placed at the MRU end of the cache.
● Discarded (MRU) Buffers – reports the number of buffers that were placed at the wash marker, using the fetch-and-discard strategy.If you expect an entire table to be cached, but you see a high value for Discarded (MRU) Buffers, use showplan to see if the optimizer is generating the fetch-and-discard strategy when it should be using the normal cache strategy.See Using showplan in Performance and Tuning Series: Query Processing and Abstract Plans for more information.
Performance and Tuning Series: Monitoring with sp_sysmonMonitoring Performance with sp_sysmon P U B L I C 101

2.16.3.8 Large I/O Usage
Large I/O Usage provides data about Adaptive Server prefetch requests for large I/O. It reports statistics on the numbers of large I/O requests performed and denied.
● Large I/Os Performed – measures the number of times that a requested large I/O was performed. “% of total” reports the percentage of large I/O requests performed as a percentage of the total number of requests made.sp_sysmon displays this section only if SAP ASE performs large I/Os in the cache.
● Large I/Os Denied – reports the number times that large I/O could not be performed. “% of total” reports the percentage of large I/O requests denied as a percentage of the total number of requests made.Adaptive Server cannot perform large I/O:○ If any page in a buffer already resides in another pool.○ When there are no buffers available in the requested pool.○ On the first extent of an allocation unit, since it contains the allocation page, which is always read into
the 2K pool.If a high percentage of large I/Os were denied, the use of the larger pools might not be as effective as it could be. If a cache contains a large I/O pool, and queries perform both 2K and 16K I/O on the same objects, there will always be some percentage of large I/Os that cannot be performed because pages are in the 2K pool.If more than half of the large I/Os were denied, and you are using 16K I/O, try moving all of the space from the 16K pool to the 8K pool. Re-run the test to see if total I/O is reduced. When a 16K I/O is denied, SAP ASE does not check for 8K or 4K pools, but uses the 2K pool.Use information from this category and “Pool Turnover” to help judge the correct size for pools.sp_sysmon displays this section only if SAP ASE performs large I/Os in the cache.
● Total large I/O Requests – provides summary statistics for large I/Os performed and denied.
2.16.3.9 Large I/O Detail
Large I/O Detail provides summary information for each pool individually. It contains a block of information for each 4K, 8K, or 16K pool configured in cache. It prints the pages brought in (“Pages Cached”) and pages referenced (“Pages Used”) for each I/O size that is configured.
For example, if a query performs a 16K I/O and reads a single data page, the “Pages Cached” value is 8, and “Pages Used” value is 1.
● Pages by Lrg I/O Cached – prints the total number of pages read into the cache.● Pages by Lrg I/O Used – reports the number of pages used by a query while in cache.
2.16.3.10 Dirty Read Behavior
Dirty Read Behavior reports the average number of pages requested at isolation level 0.
The “% of total” output for Dirty Read Page Requests shows the percentage of dirty reads with respect to the total number of page reads.
102 P U B L I CPerformance and Tuning Series: Monitoring with sp_sysmon
Monitoring Performance with sp_sysmon

2.17 Procedure Cache Management
Procedure Cache Management displays the number of times stored procedures are recompiled; the phase that triggered the recompilations, such as execution time and recompilation; and the cause of recompilation, such as table missing or permissions change.
A sample output of Procedure Cache Management looks like:
Procedure Cache Management per sec per xact count % of total -------------------------- ------------ ----------- --------- --------- Procedure Requests 14.2 0.3 8499 n/a Procedure Reads from Disk 0.0 0.0 27 0.6% Procedure Writes to Disk 0.0 0.0 0 0.0% Procedure Removals 0.0 0.0 0 n/a Procedure Recompilations 0.0 0.0 0 n/aSQL Statement Cache: Statements Cached 0.6 2.7 171 n/a Statements Found in Cache 2.0 9.5 1529 n/a Statements Not Found 0.6 2.7 171 n/a Statements Dropped 0.2 0.8 52 n/a Statements Restored 0.0 0.0 0 n/a Statements Not Cached 0.0 0.0 0 n/a
The procedure cache contains most execution plans for requested procedures. In this example, the procedure cache reads only 0.6 percent from disk.
This system’s statement cache is effective, since the value for Statements Found in Cache is 611. This value is much higher than the values for Statements Not Found and Statements Cached, so the reuse rate of statements is high.
● Procedure Requests – reports the number times stored procedures were executed. When a procedure is executed, either:○ An idle copy of the query plan is in memory, so it is copied and used or,○ No copy of the procedure is in memory, or all copies of the plan in memory are in use, so the procedure
must be read from disk.● Procedure Reads from Disk – reports the number times idle copies were not available and the SAP
ASE server had to read procedures from disk (that is, Adaptive Server could not copy what was already in cache).“% of total” reports the percentage of procedure reads from disk as a percentage of the total number of procedure requests. A relatively high percentage may indicate that the procedure cache is too small.
● Procedure Writes to Disk – reports the number procedures created during the interval. This can be significant if application programs generate stored procedures.
● Procedure Removals – reports the number times that a procedure aged out of cache.● Procedure Recompilations – reports the number times stored procedures were recompiled.● SQL Statement Cache – reports the number statements during the interval that were cached, found in
cache, not found, dropped, restored, and not cached.A sample output of SQL Statement Cache looks like:
SQL Statement Cache: Statements Cached 0.6 2.7 171 n/aStatements Found in Cache 2.0 9.5 611 n/aStatements Not Found 0.6 2.7 171 n/aStatements Dropped 0.2 0.8 52 n/aStatements Restored 0.0 0.0 0 n/a
Performance and Tuning Series: Monitoring with sp_sysmonMonitoring Performance with sp_sysmon P U B L I C 103

Statements Not Cached 0.0 0.0 0 n/a
○ Statements Cached – number of statements added to the statement cache during the sample period.
○ Statements Found in Cache – number of statements found in the statement cache. This value represents the number of times Adaptive Server used the statement cache to avoid recompiling a statement.
○ Statements Not Found – number of times SAP ASE looked for, but did not find, a statement in the statement cache.
○ Statements Dropped – number of times SAP ASE removed a statement already in the statement cache to make room for a new statement being cached.
○ Statements Restored – number of query plans restored after an existing plan was invalidated by a schema change to an object referenced by the statement.
○ Statements Not Cached – number of statements the SAP ASE server compiled, but did not enter, into the statement cache. If you have set statement cache size to 0 (disabling the statement cache), Statements Not Cached is the number of statements that the SAP ASE server could have cached.
2.18 Memory Management
Memory Management reports the number pages allocated and deallocated during the sample interval.
A sample output of Memory Management looks like:
Memory Management per sec per xact count % of total ------------------------ ------------ ----------- -------- --------Pages Allocated 2565.7 63.2 1539423 n/a Pages Released 2565.7 63.2 1539423 n/a
● Pages Allocated reports the number times that a new page was allocated in memory.● Pages Released reports the number times that a page was freed.
2.19 Recovery Management
The data from Recovery Management indicates the number of checkpoints caused by the normal checkpoint process, the number of checkpoints initiated by the housekeeper task, and the average length of time for each type. Use information to correctly set the recovery and housekeeper parameters.
A sample ouput of Recovery Management looks like:
============================================================================= Recovery Management-------------------Checkpoints per sec per xact count % of total------------------------ ----------- ---------- ------- -------- # of Normal Checkpoints 0.2 0.0 106 100.0 %# of Free Checkpoints 0.0 0.0 0 0.0 %
104 P U B L I CPerformance and Tuning Series: Monitoring with sp_sysmon
Monitoring Performance with sp_sysmon

------------------------- ------------ ---------- ------- Total Checkpoints 0.2 0.0 106 Average Time per Normal Chkpt
2.19.1 Checkpoints
Checkpoints write dirty pages—that is, pages that have been modified in memory, but not written to disk—to the database device.
The SAP ASE automatic (normal) checkpoint mechanism works to maintain a minimum recovery interval. By tracking the number of log records in the transaction log since the last checkpoint was performed, the mechanism estimates whether the time required to recover the transactions exceeds the recovery interval. If so, the checkpoint process scans all data caches and writes out all changed data pages.
When the SAP ASE server has no user tasks to process, the housekeeper wash task begins writing dirty buffers to disk. These writes are done during the server’s idle cycles, so they are known as “free writes.” They result in improved CPU usage and a decreased need for buffer washing during transaction processing.
● # of Normal Checkpoints – reports the number checkpoints performed by the normal checkpoint process.If the normal checkpoint is doing most of the work, especially if the time required for the checkout is lengthy, it might make sense to increase the number of writes performed by the housekeeper wash task.
● # of Free Checkpoints – reports the number checkpoints performed by the housekeeper wash task. The housekeeper wash task performs checkpoints only when it has cleared all dirty pages from all configured caches.If the housekeeper wash task finishes writing all dirty pages in all caches to disk, it checks the number of rows in the transaction log since the last checkpoint. If there are more than 100 log records, it issues a checkpoint. This is called a “free checkpoint” because it requires very little overhead. In addition, it reduces future overhead for normal checkpoints.You can use the housekeeper free write percent parameter to configure the maximum percentage by which the housekeeper wash task can increase database writes.
● Total Checkpoints – reports the combined number of normal and free checkpoints that occurred during the sample interval.
See Reference Manual: Configuration Parameters.
Performance and Tuning Series: Monitoring with sp_sysmonMonitoring Performance with sp_sysmon P U B L I C 105

2.19.2 Average Time Per Normal Checkpoint
Average Time per Normal Checkpoint reports the average time that normal checkpoints lasted.
2.19.3 Average Time Per Free Checkpoint
Average Time per Free Checkpoint reports the average time that free (or housekeeper) checkpoints lasted.
2.19.4 Increasing the Housekeeper Batch Limit
The housekeeper wash task has a built-in batch limit to avoid overloading disk I/O for individual devices.
By default, the batch size for housekeeper writes is 3. As soon as the housekeeper detects that it has issued three I/Os to a single device, it stops processing in the current buffer pool and begins checking for dirty pages in another pool. If the writes from the next pool are assigned to the same device, it moves on to another pool. Once the housekeeper has checked all of the pools, the housekeeper waits until the last I/O it has issued has completed, and then begins the cycle again.
The default batch limit is designed to provide good device I/O characteristics for slow disks. You may get better performance by increasing the batch size for fast disk drives. Set this limit globally for all devices on the server or to different values for disks with different speeds. You must reset the limits each time the SAP ASE server is restarted.
This command sets the batch size to 10 for a single device, using the virtual device number from sysdevices:
dbcc tune(deviochar, 8, "10")
To see the device number, use sp_helpdevice, or:
select name, vdevno from sysdevices
To change the housekeeper’s batch size for all devices on the server, use -1 in place of a device number:
dbcc tune(deviochar, -1, "5")
For very fast drives, setting the batch size as high as 50 has yielded performance improvements during testing.
You may want to try setting the batch size higher if:
● The average time for normal checkpoints is high.● There are no problems with exceeding I/O configuration limits or contention on the semaphores for the
devices.
106 P U B L I CPerformance and Tuning Series: Monitoring with sp_sysmon
Monitoring Performance with sp_sysmon

2.20 Disk I/O ManagementDisk I/O Management reports on disk I/O. It provides an overview of disk I/O activity for the server as a whole and reports on reads, writes, and semaphore contention for each logical device.
A sample output of Disk I/O Management looks like:
Disk I/O Management -------------------Max Outstanding I/Os per sec per xact count % of total------------------------ ----------- ----------- --------- --------- Server n/a n/a 527 n/a Engine 0 n/a n/a 429 n/a Engine 1 n/a n/a 448 n/a Engine 2 n/a n/a 457 n/a Engine 3 n/a n/a 508 n/a Engine 4 n/a n/a 526 n/a Engine 5 n/a n/a 416 n/a Engine 6 n/a n/a 425 n/aI/Os Delayed by Disk I/O Structures n/a n/a 0 n/a Server Config Limit n/a n/a 0 n/a Engine Config Limit n/a n/a 0 n/a Operating System Limit n/a n/a 0 n/aTotal Requested Disk I/Os 547.2 13.5 328339Completed Disk I/O'sAsynchronous I/O's Engine 0 135.0 3.3 81017 24.7 % Engine 1 70.3 1.7 42172 12.8 % Engine 2 50.1 1.2 30083 9.2 % Engine 3 68.0 1.7 40789 12.4 % Engine 4 72.5 1.8 43473 13.2 % Engine 5 81.2 2.0 48749 14.8 % Engine 6 70.1 1.7 42070 12.8 %Synchronous I/O's Total Completed I/Os 0.0 0.0 0 n/a------------------------ ------------ ----------- ---------Total Completed I/Os 547.3 13.5 328353Device Activity Detail----------------------Device: /dev/sap/c1t0d0s0r master per sec per xact count % of total------------------------ ----------- ----------- --------- --------- Reads APF 0.0 0.0 2 0.2 % Non-APF 0.3 0.0 154 17.5 % Writes 1.2 0.0 723 82.3 %------------------------- ---------- ----------- --------- ---------Total I/Os 1.5 0.0 879 0.3 %-----------------------------------------------------------------------------Device: /dev/sap/c1t0d0s1r dev01 per sec per xact count % of total------------------------ ----------- ----------- --------- --------- Reads APF 1.0 0.0 584 0.5 % Non-APF 8.5 0.2 5075 4.3 % Writes 185.6 4.6 111355 95.2 %------------------------- ----------- ----------- --------- --------- Total I/Os 195.0 4.8 117014 35.6 %----------------------------------------------------------------------------- Device: /dev/sap/c1t0d0s3r dev02 per sec per xact count % of total
Performance and Tuning Series: Monitoring with sp_sysmonMonitoring Performance with sp_sysmon P U B L I C 107
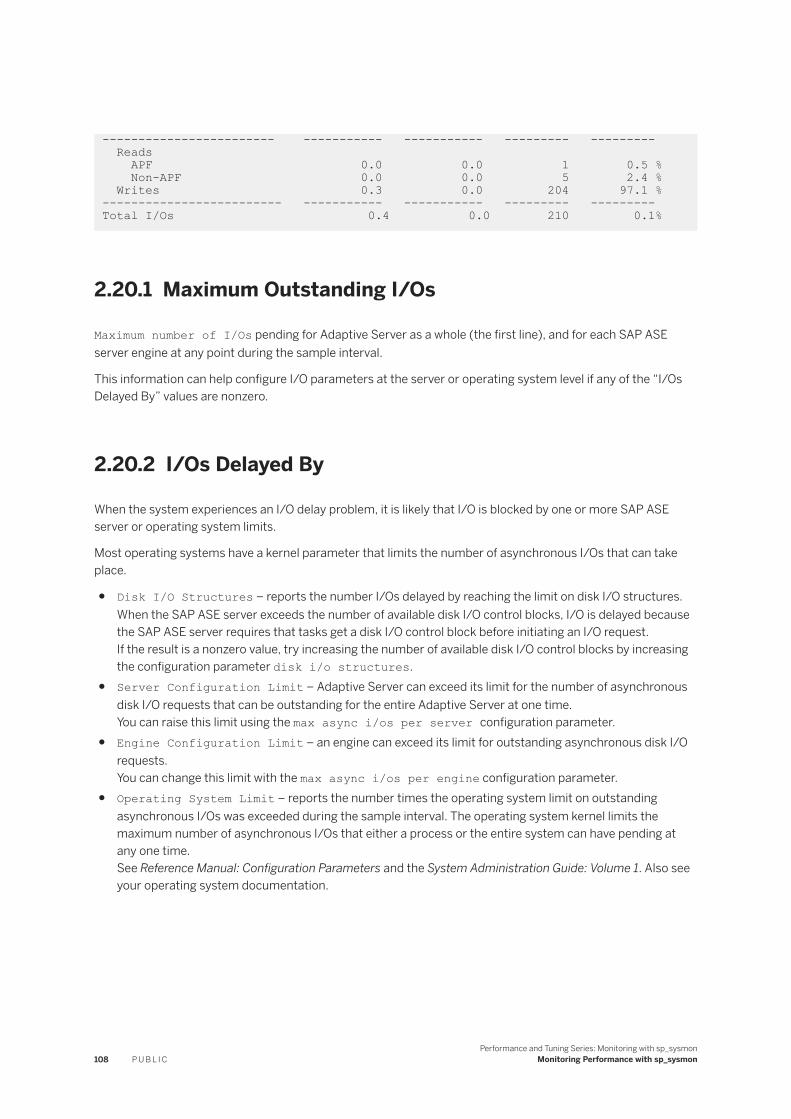
------------------------ ----------- ----------- --------- --------- Reads APF 0.0 0.0 1 0.5 % Non-APF 0.0 0.0 5 2.4 % Writes 0.3 0.0 204 97.1 %------------------------- ----------- ----------- --------- --------- Total I/Os 0.4 0.0 210 0.1%
2.20.1 Maximum Outstanding I/Os
Maximum number of I/Os pending for Adaptive Server as a whole (the first line), and for each SAP ASE server engine at any point during the sample interval.
This information can help configure I/O parameters at the server or operating system level if any of the “I/Os Delayed By” values are nonzero.
2.20.2 I/Os Delayed By
When the system experiences an I/O delay problem, it is likely that I/O is blocked by one or more SAP ASE server or operating system limits.
Most operating systems have a kernel parameter that limits the number of asynchronous I/Os that can take place.
● Disk I/O Structures – reports the number I/Os delayed by reaching the limit on disk I/O structures. When the SAP ASE server exceeds the number of available disk I/O control blocks, I/O is delayed because the SAP ASE server requires that tasks get a disk I/O control block before initiating an I/O request.If the result is a nonzero value, try increasing the number of available disk I/O control blocks by increasing the configuration parameter disk i/o structures.
● Server Configuration Limit – Adaptive Server can exceed its limit for the number of asynchronous disk I/O requests that can be outstanding for the entire Adaptive Server at one time.You can raise this limit using the max async i/os per server configuration parameter.
● Engine Configuration Limit – an engine can exceed its limit for outstanding asynchronous disk I/O requests.You can change this limit with the max async i/os per engine configuration parameter.
● Operating System Limit – reports the number times the operating system limit on outstanding asynchronous I/Os was exceeded during the sample interval. The operating system kernel limits the maximum number of asynchronous I/Os that either a process or the entire system can have pending at any one time.See Reference Manual: Configuration Parameters and the System Administration Guide: Volume 1. Also see your operating system documentation.
108 P U B L I CPerformance and Tuning Series: Monitoring with sp_sysmon
Monitoring Performance with sp_sysmon

2.20.3 Requested and Completed Disk I/Os
This data shows the total number of disk I/Os requested and the number and percentage of I/Os completed by each SAP ASE server engine.
Total Requested Disk I/Os and Total Completed I/Os should be the same or very close. These values vary greatly if requested I/Os are not completing due to saturation.
The value for requested I/Os includes all requests initiated during the sample interval, and it is possible that some of them completed after the sample interval ended. These I/Os are not included in Total Completed I/Os, and cause the percentage to be less than 100, when there are no saturation problems.
The reverse is also true. If I/O requests were made before the sample interval began and they completed during the period, you see a value for “% of total” for Total Completed I/Os that is more than 100 percent.
If the data indicates a large number of requested disk I/Os and a smaller number of completed disk I/Os, there could be a bottleneck in the operating system that is delaying I/Os.
● Total Requested Disk I/Os – reports the number times that the SAP ASE server requested disk I/Os.● Completed Disk I/Os – reports the number times that each engine completed I/O. “% of total” reports
the percentage of times each engine completed I/Os as a percentage of the total number of I/Os completed by all SAP ASE server engines combined.In threaded mode, SAP ASE does not print the completed disk I/Os on a per-engine basis. Instead, it prints a server-wide summary:
Disk I/O Management ------------------- Max Outstanding I/Os per sec per xact count % of total ------------------- ------------ ------------ -------- --------- Server n/a n/a 17 n/a Engine 0 n/a n/a 5 n/a Engine 1 n/a n/a 5 n/a Engine 2 n/a n/a 17 n/a I/Os Delayed by Disk I/O Structures n/a n/a 0 n/a Server Config Limit n/a n/a 0 n/a Engine Config Limit n/a n/a 0 n/a Operating System Limit n/a n/a 20 n/a Total Requested Disk I/Os 12.6 104.3 417 Completed Disk I/O's Asynchronous I/O's Total Completed I/Os 12.6 104.3 41 100.0 % Synchronous I/O's Total Completed I/Os 0.0 0.0 0 n/a ------------------------- ------------ ---------- ---------- Total Completed I/Os 12.6 104.3 417
You can also use this information to determine whether the operating system can keep pace with the disk I/O requests made by all of the engines.
Performance and Tuning Series: Monitoring with sp_sysmonMonitoring Performance with sp_sysmon P U B L I C 109

2.20.4 Device Activity Detail
Device Activity Detail reports activity on each logical device. It is useful for checking that I/O is well balanced across the database devices and for finding a device that might be delaying I/O.
For example, if the “Task Context Switches Due To” data indicates a heavy amount of device contention, use Device Activity Detail to figure out which devices are causing the problem.
This section prints the following information about I/O for each data device on the server:
● The logical and physical device names● The number of reads and writes and the total number of I/Os● The number of device semaphore requests immediately granted on the device and the number of times a
process had to wait for a device semaphore
2.20.4.1 Reads and Writes
Reads and Writes reports the number times that reads or writes to a device took place. “Reads” reports the number of pages that were read by asynchronous prefetch and those brought into cache by other I/O activity.
The “% of total” column reports the percentage of reads or writes as a percentage of the total number of I/Os to the device.
2.20.4.2 Total I/Os
Total I/Os reports the combined number of reads and writes to a device.
The “% of total” column is the percentage of combined reads and writes for each named device as a percentage of the number of reads and writes that went to all devices.
You can use this information to check I/O distribution patterns over the disks and to make object placement decisions that can help balance disk I/O across devices. For example, the data may indicate some disks are more heavily used than others. If you see that a large percentage of all I/O went to a specific named device, you can investigate the tables residing on the device and then determine how to remedy the problem.
See Controlling Physical Data Placement in Performance and Tuning Series: Physical Database Tuning.
2.20.4.3 Mirror Semaphore Granted and Waited
Mirror Semaphore Granted and Waited reports the number times that a request for a mirror semaphore was granted immediately and the number of times the semaphore was busy and the task had to wait for the semaphore to be released.
The “% of total” column is the percentage of times the device the semaphore was granted (or the task had to wait) as a percentage of the total number of mirror semaphores requested. This data is meaningful only in SMP environments.
110 P U B L I CPerformance and Tuning Series: Monitoring with sp_sysmon
Monitoring Performance with sp_sysmon

SAP ASE uses the semaphore only when either disk mirroring is enabled or when disk I/Os are delayed. Disk mirroring is enabled when you change the configuration parameter from is “disabled” default.
A large percentage of I/O requests that waited could indicate a semaphore contention issue. You may want to try redistributing the data on the physical devices.
2.21 Network I/O ManagementNetwork I/O Management reports network activities for each Adaptive Server engine
● Total requested network I/Os● Network I/Os delayed● Total tabular data stream (TDS) packets and bytes received and sent● Average size of packets received and sent
This data is broken down by engine, because each engine does its own network I/O. Imbalances are usually caused by one of the following condition:
● There are more engines than tasks, so the engines with no work to perform report no I/O, or● Most tasks are sending and receiving short packets, but another task is performing heavy I/O, such as a
bulk copy.
A sample output for Network I/O Management looks like:
Network I/O Management ---------------------- Network I/O Requests per sec per xact count % of total ------------------------- ------------ ----------- -------- -------- Total Network I/O Requests 1384.2 938.4 166099 n/a Network I/Os Delayed 0.0 0.0 0 0.0 % Network Receive Activity per sec per xact count ------------------------- ------------ ------------ ---------- Total TDS Packets Rec'd 1380.7 936.1 165684 Total Bytes Rec'd 2267752.3 1537459.1 272130277 Avg Bytes Rec'd per Packet n/a n/a 1642 Network Send Activity per sec per xact count ------------------------- ------------ ----------- ---------- Total TDS Packets Sent 1339.5 908.2 160743 Total Bytes Sent 56194.2 38097.8 6743306 Avg Bytes Sent per Packet n/a n/a 41
● Total Network I/Os Requests – reports the total number of packets received and sent.If you know how many packets per second the network can handle, you can determine whether the SAP ASE server is challenging the network bandwidth.The issues are the same whether the I/O is inbound or outbound. If the SAP ASE server receives a command that is larger than the packet size, it waits to begin processing until it receives the full command. Therefore, commands that require more than one packet are slower to execute and take up more I/O resources.If the average bytes per packet is near the default packet size configured for your server, you may want to configure larger packet sizes for some connections. You can configure the network packet size for all connections or allow certain connections to log in using larger packet sizes.See Networks and Performance in the Performance and Tuning Series: Basics.
● Network I/Os Delayed – reports the number times I/O was delayed. If this number is consistently nonzero, consult with your network administrator.
Performance and Tuning Series: Monitoring with sp_sysmonMonitoring Performance with sp_sysmon P U B L I C 111

● Total TDS Packets Received – reports the number TDS packets received per engine. Total TDS Packets Received reports the number of packets received during the sample interval.
● Total Bytes Received – reports the number of bytes received per engine. Total Bytes Received reports the total number of bytes received during the sample interval.
● Average Bytes Received per Packet – reports the average number of bytes for all packets received during the sample interval.
● Total TDS Packets Sent– reports the number packets sent by each engine, and a total for the server as a whole.
● Total Bytes Sent – reports the number bytes sent by each Adaptive Server engine, and by the server as a whole, during the sample interval.
● Average Bytes Sent per Packet – reports the average number of bytes for all packets sent during the sample interval.
2.22 Replication Agent
Replication Agent displays activity specific to Replication Agent for all databases configured to use a Replication Agent.
A sample output of Replication Agent looks like:
Replication Agent ----------------Replication Agent: primdbReplication Server: MRP_REPSRVR1 per sec per xact count % of total ------------ ----------- -------- -------- Log Scan Summary Log Records Scanned n/a n/a 710273 n/a Log Records Processed n/a n/a 127098 n/a Number of Log Scans n/a n/a 0 n/a Amount of Time for Log Scans (ms) n/a n/a 19868 n/a Longest Time for Log Scan (ms) n/a n/a 19868 n/a Average Time per Log Scan (ms) n/a n/a 0.0 n/a Log Scan Activity Updates n/a n/a 0 n/a Inserts n/a n/a 66380 n/a Deletes n/a n/a 0 n/a Store Procedures n/a n/a 2 n/a DDL Log Records n/a n/a 0 n/a Writetext Log Records n/a n/a 0 n/a Text/Image Log Records n/a n/a 60420 n/a CLRs n/a n/a 0 n/a Checkpoints Processed n/a n/a 4 n/a SQL Statements Processed n/a n/a 0 n/a Transaction Activity Opened n/a n/a 140 n/a Commited n/a n/a 141 n/a Aborted n/a n/a 1 n/a Prepared n/a n/a 1 n/a Delayed Commit n/a n/a 0 n/a Maintenance User n/a n/a 4 n/a Log Extension Wait Count n/a n/a 2 n/a Amount of time (ms) n/a n/a 14346 n/a Longest Wait (ms) n/a n/a 14346 n/a Average Time (ms) n/a n/a 7173.0 n/a
112 P U B L I CPerformance and Tuning Series: Monitoring with sp_sysmon
Monitoring Performance with sp_sysmon

Schema Cache Usage Max Ever Used n/a n/a 4 n/a Schemas reused n/a n/a 0 n/a Forward Schema Lookups Count n/a n/a 0 n/a Total Wait (ms) n/a n/a 0 n/a Longest Wait (ms) n/a n/a 0 n/a Average Time (ms) n/a n/a 0.0 n/a Backward Schema Lookups Count n/a n/a 0 n/a Total Wait (ms) n/a n/a 0 n/a Longest Wait (ms) n/a n/a 0 n/a Average Time (ms) n/a n/a 0.0 n/a Truncation Point Movement Moved n/a n/a 0 n/a Gotten from RS n/a n/a 0 n/a Connections to Replication Server Success n/a n/a 0 n/a Failed n/a n/a 0 n/a Network Packet Information Packets Sent n/a n/a 39429 n/a Full Packets Sent n/a n/a 4381 n/a Largest Packet n/a n/a 0 n/a Amount of Bytes Sent n/a n/a 73240036 n/a Average Packet n/a n/a 1857.5 n/a I/O Wait from RS Count n/a n/a 48191 n/a Amount of Time (ms n/a n/a 58995 n/a Longest Wait (ms) n/a n/a 17 n/a Average Wait (ms) n/a n/a 1.2 n/a
Subcategory Description
Log Scan Summary Summary of the log activity to Replication Server. Replication Agent scans the transaction log of the database in which it is running, and sends the scanned information to Replication Server.
The transaction log of the primary database contains modifications that Replication Agent does not process because they belong to objects not marked for replication.
Log Records Scanned reports the total number of log records the Replication Agent scanned.
Log Records Processed Reports the total number of log records sent to the Replication Server because they contained objects marked for replication.
Number of Log Scans Total number of times Rep Agent scanned the log.
Amount of Time for Log Scans
Amount of time, in milliseconds, Rep Agent spent scanning the log.
Longest Time for Log Scan Longest amount of time, in milliseconds, Rep Agent spent on a log scan.
Average Time per Log Scan The average amount of time, in milliseconds, Rep Agent spent on a log scan.
Performance and Tuning Series: Monitoring with sp_sysmonMonitoring Performance with sp_sysmon P U B L I C 113

Subcategory Description
Log Scan Activity Reports these activities from the log:
● Updates – number of updates processed.
● Inserts – number of inserts processed.
● Deletes – number of deletes processed.
● Store Procedures – number of executed stored procedures marked for replication.
● DDL Log Records – number of log records containing Data Definition Language (DDL) to be replicated. This value may not correspond to the number of DDL commands executed in the primary database because a single DDL command executed on the primary database may result in more than one DDL command log record.
● Writetext Log Records – number of log records processed that were generated by writetext.
● Text/Image Log Records – number of Data Manipulation Language (DML) log records for a table with text or image data marked for replication.
● CLRs – number of Compensation Log Records (CLRs) processed.
● Checkpoints Processed – number of checkpoints taken.
● SQL Statements Processed – number of SQL statements processed.
Transaction Activity reports these activities:
● Opened – number of begin transaction commands found in the primary log.
● Committed – number of committed transactions.
● Aborted – number of aborted transactions.
● Prepared – number of transactions in the “prepare” state.
● Delayed Commit – number of delayed commit transactions
● Maintenance User – number of transactions the Maintenance user opened.
114 P U B L I CPerformance and Tuning Series: Monitoring with sp_sysmon
Monitoring Performance with sp_sysmon

Subcategory Description
Log Extension Wait When the Replication Agent reaches the end of the transaction log during normal processing, it must wait for Adaptive Server to extend the log (so the primary database resumes activity).
Log Extension Wait reports on these activities:
● Count – number of times Replication Agent waited for Adaptive Server to extend the log.
● Amount of time – length of time, in milliseconds, Replication Agent waited for Adaptive Server to extend the log.
● Longest Wait – longest length of time, in milliseconds, Replication Agent had to wait for Adaptive Server to extend the log.
● Average Time – average length of time, in milliseconds, Replication Agent waited for Adaptive Server to extend the log.
Schema Cache Schema Cache reports these activities. Usage:
● Max Ever Used – maximum number of schema in the schema cache.
● Schemas Reused – number of schema reused during processing.
Forward Schema Lookups:
● Forward Schema – occasionally, Replication Agent must perform a forward scan on the primary transaction log looking for object schema changes.
● Count – number of times Replication Agent performed a forward scan.
● Total Wait – length of time, in milliseconds, Replication Agent spent performing forward scans.
● Longest Wait – longest length of time, in milliseconds, Replication Agent spent performing a forward scan.
● Average Time – average length of time, in milliseconds, Replication Agent spent performing forward scans.
Backward Schema When Adaptive Server performs DDL inside a transaction, Replication Agent must perform a backward scan in the primary transaction log. Backward Schema reports on these activities:
● Count – number of times Replication Agent performed a backward scan.
● Total Wait – length of time, in milliseconds, Replication Agent spent performing backward scans.
● Longest Wait – longest length of time, in milliseconds, Replication Agent spent performing a backward scan.
● Average Time – average length of time, in milliseconds, Replication Agent spent performing backward scans.
Performance and Tuning Series: Monitoring with sp_sysmonMonitoring Performance with sp_sysmon P U B L I C 115

Subcategory Description
Truncation Point Movement Truncation Point Movement reports on these activities:
● Moved – number of times Replication Agent moved the secondary truncation point on the primary database.
● Gotten from RS – number of times Replication Agent queried Replication Server for a new secondary truncation point.
Connections to Replication Server
Connections to Replication Server rports on these activities:
● Success – number of successful connections to Replication Server.
● Failed – number of failed connections to Replication Server.
Network Packet Information
Network Packet Information reports on these activities:
● Packets Sent – number of packets sent to Replication Server.
● Full Packets Sent – number of full packets sent to Replication Server.
● Largest Packet – largest packet sent to Replication Server.
● Amount of Bytes Sent – number of bytes sent to Replication Server.
● Average Packet – average packet size.
I/O Wait from RS I/O Wait from RS reports:
● Count – number of times Replication Agent issued a ct_sendpassthru to Replication Server.
● Amount of Time – length of time, in milliseconds, Replication Agent spent processing results from Replication Server.
● Longest Wait – longest elapsed time, in milliseconds, the Replication Agent spent processing results.
● Average Wait – average length of time, in milliseconds, Replication Agent spent processing results
116 P U B L I CPerformance and Tuning Series: Monitoring with sp_sysmon
Monitoring Performance with sp_sysmon

Important Disclaimers and Legal Information
HyperlinksSome links are classified by an icon and/or a mouseover text. These links provide additional information.About the icons:
● Links with the icon : You are entering a Web site that is not hosted by SAP. By using such links, you agree (unless expressly stated otherwise in your agreements with SAP) to this:
● The content of the linked-to site is not SAP documentation. You may not infer any product claims against SAP based on this information.● SAP does not agree or disagree with the content on the linked-to site, nor does SAP warrant the availability and correctness. SAP shall not be liable for any
damages caused by the use of such content unless damages have been caused by SAP's gross negligence or willful misconduct.
● Links with the icon : You are leaving the documentation for that particular SAP product or service and are entering a SAP-hosted Web site. By using such links, you agree that (unless expressly stated otherwise in your agreements with SAP) you may not infer any product claims against SAP based on this information.
Beta and Other Experimental FeaturesExperimental features are not part of the officially delivered scope that SAP guarantees for future releases. This means that experimental features may be changed by SAP at any time for any reason without notice. Experimental features are not for productive use. You may not demonstrate, test, examine, evaluate or otherwise use the experimental features in a live operating environment or with data that has not been sufficiently backed up.The purpose of experimental features is to get feedback early on, allowing customers and partners to influence the future product accordingly. By providing your feedback (e.g. in the SAP Community), you accept that intellectual property rights of the contributions or derivative works shall remain the exclusive property of SAP.
Example CodeAny software coding and/or code snippets are examples. They are not for productive use. The example code is only intended to better explain and visualize the syntax and phrasing rules. SAP does not warrant the correctness and completeness of the example code. SAP shall not be liable for errors or damages caused by the use of example code unless damages have been caused by SAP's gross negligence or willful misconduct.
Gender-Related LanguageWe try not to use gender-specific word forms and formulations. As appropriate for context and readability, SAP may use masculine word forms to refer to all genders.
Performance and Tuning Series: Monitoring with sp_sysmonImportant Disclaimers and Legal Information P U B L I C 117

www.sap.com/contactsap
© 2019 SAP SE or an SAP affiliate company. All rights reserved.
No part of this publication may be reproduced or transmitted in any form or for any purpose without the express permission of SAP SE or an SAP affiliate company. The information contained herein may be changed without prior notice.
Some software products marketed by SAP SE and its distributors contain proprietary software components of other software vendors. National product specifications may vary.
These materials are provided by SAP SE or an SAP affiliate company for informational purposes only, without representation or warranty of any kind, and SAP or its affiliated companies shall not be liable for errors or omissions with respect to the materials. The only warranties for SAP or SAP affiliate company products and services are those that are set forth in the express warranty statements accompanying such products and services, if any. Nothing herein should be construed as constituting an additional warranty.
SAP and other SAP products and services mentioned herein as well as their respective logos are trademarks or registered trademarks of SAP SE (or an SAP affiliate company) in Germany and other countries. All other product and service names mentioned are the trademarks of their respective companies.
Please see https://www.sap.com/about/legal/trademark.html for additional trademark information and notices.
THE BEST RUN