Perception or real illness? How chronic conditions contribute to gender inequalities in self-rated...
18
1 Perception or real illness? How chronic conditions contribute to gender inequalities in self-rated health. European Journal of Public Health, 2012, 22(6), 781-6. Unformatted, pre-print manuscript. Article available at http://dx.doi.org/10.1093/eurpub/ckr184 Davide Malmusi 1,2,3 , Carme Borrell 1,2,4,5 , Lucía Artazcoz 1,2,4 , Joan Benach 4,6 . 1 Agència de Salut Pública de Barcelona 2 Institut d’Investigació Biomèdica (IIB-Sant Pau) 3 Unitat Docent de Medicina Preventiva i Salut Pública IMAS-UPF-ASPB 4 CIBER Epidemiología y Salud Pública (CIBERESP), Spain 5 Universitat Pompeu Fabra (UPF) 6 Health Inequalities Research Group (GREDS), Employment Conditions Network (EMCONET), UPF. Address for correspondence: Davide Malmusi Agència de Salut Pública de Barcelona Pl. Lesseps, 1 08023 Barcelona, Spain Phone: +34 932027798 Fax: +34 933686943 [email protected]
Transcript of Perception or real illness? How chronic conditions contribute to gender inequalities in self-rated...
1
Perception or real illness? How chronic conditions contribute to gender
inequalities in self-rated health.
European Journal of Public Health, 2012, 22(6), 781-6.
Unformatted, pre-print manuscript. Article available at http://dx.doi.org/10.1093/eurpub/ckr184
Davide Malmusi 1,2,3, Carme Borrell 1,2,4,5, Lucía Artazcoz 1,2,4, Joan Benach4,6.
1 Agència de Salut Pública de Barcelona
2 Institut d’Investigació Biomèdica (IIB-Sant Pau)
3 Unitat Docent de Medicina Preventiva i Salut Pública IMAS-UPF-ASPB
4 CIBER Epidemiología y Salud Pública (CIBERESP), Spain
5 Universitat Pompeu Fabra (UPF)
6 Health Inequalities Research Group (GREDS), Employment Conditions Network (EMCONET), UPF.
Address for correspondence:
Davide Malmusi
Agència de Salut Pública de Barcelona
Pl. Lesseps, 1
08023 Barcelona, Spain
Phone: +34 932027798
Fax: +34 933686943
2
ABSTRACT
Background: In Spain, like in many countries, women report poorer general health and more
daily activity limitations due to health reasons when compared to men. This study aims to
examine whether these poorer indicators are due to a greater prevalence of health
problems, and to identify the types of problems that contribute most to gender inequalities.
Methods: Cross-sectional study on the population aged over 15 and residing in Spain, with
data from the 2006 National Health Survey (n=29,139). The sex prevalence ratios (PR) of
poor self-rated health and chronic limitation of activity are sequentially adjusted by age and
the presence of 27 chronic conditions by means of robust Poisson regression.
Results: At equal number of disorders, women reported equal or even better health than
men. The excess of poor health in women (age-adjusted PR and 95% CI: self-rated health =
1.36, 1.29-1.41; chronic limitation = 1.25, 1.18-1.32) disappeared when adjusting for the
number of chronic diseases (self-rated health = 1.00, 0.96-1.04; chronic limitation = 0.90,
0.85-0.96). Musculoskeletal, mental and other pain disorders accounted for most of the
association. The results were consistent in different strata of age, social class and type of
country of birth.
Conclusion: These results suggest that the poorer self-rated health of women is a reflection
of the higher burden of disease they suffer. A health system responsive to gender
inequalities should increase its efforts in addressing and resolving musculoskeletal, mental
and other pain disorders, usually less considered in favour of disorders with greater impact
on mortality.
KEYWORDS
Gender inequalities; Health Status; Chronic Limitation of Activity; Musculoskeletal Diseases.
3
Introduction
The health of women and men is different and inequitable. The paradox is described that in
most countries of the world women have longer life expectancy but poorer health status1,2,
although this latter finding is more consistent for indicators of mental health, chronic illness
or disability than in the case of self-rated health3-5. Most of these differences are unfair and
avoidable inequalities derived from the unequal hazards of social positions, roles and
expectations of men and women in society because of the gender system6,7. While men’s
shorter life expectancy can be attributed to both biological disadvantages and gendered
patterns of health-related behaviours and risk-taking8, the poorer health status of women
has been interpreted as a result of patriarchy, the systematic domination of women by men,
which restricts women's access to social privileges, paid work and economic resources, while
allocating them the majority of domestic and family responsibilities9-11.
It has been argued that differences in symptoms perception, evaluation and reporting may
account for sex differences in illness reports12. This view transcends into practice where
studies conducted in the US found that women are more likely than men to be told by
physicians that their problems are “in their heads” and to have their symptoms attributed to
“over-anxiousness”, even when results indicated an organic disorder13. However, it has been
shown that women are not more prone to report illness14,15, and that their higher
expressiveness doesn’t account for their increased distress16. In some studies it is possible to
appreciate that, once adjusted for other measures of morbidity or functional capacity,
gender differences in self-rated health are eliminated or reversed17-19. Nevertheless, no
studies have been conducted focusing on this specific issue and particularly exploring the
individual and joint contribution of different chronic conditions to the disadvantage of
women in general health status. We hypothesise that inequalities in general indicators of
health status, quality of life or activity limitation, shall reflect the differences in the burden
of disease that women and men experience. This information could be useful to introduce
gender equity as a criterion for prioritising health problems in the health system as well as
for implementing policies related to the social determinants of these conditions.
Therefore, the objectives of this study are; 1) to assess whether, within the Spanish
population, poorer general health outcomes in women compared to men are attributable to
4
a higher prevalence of chronic conditions and 2) to identify the type of conditions that
contribute most to these inequalities.
Methods
Study population and data source
The study population consisted of all persons living in Spain in 2006, aged 16 years and
above and not institutionalised. The data source is the 2006 Spanish National Health Survey,
representative of the whole population living in households. Data were collected through
face-to-face interviews at home between June 2006 and June 2007. A stratified multistage
sampling was applied, the units being census tracts at first stage, main family dwellings at
second stage, and individuals at third stage20. The total number of people interviewed was
29,476. Analyses were performed on subjects with valid answers to all general health and
chronic conditions variables (N=29,139).
Variables
Dependent variables. The following health indicators were used as the main dependent
variables:
Self-rated general health status. It was derived from the single question “Over the last
twelve months, would you say your overall health has been very good, good, fair, poor,
very poor?”. This widely used indicator has predictive power on mortality, morbidity and
use of health services, and reflects a global evaluation of diseases, symptoms, functional
abilities and overall well-being21. A dichotomous outcome variable was created (very
good, good = good health; fair, poor, very poor = poor health)22.
Chronic limitation of activity. It was determined from the question "During the last six
months, to what extent have you been limited due to a health problem in the activities
people usually do?". Answers "severely limited" and "limited but not seriously" were
considered as having a chronic limitation.
Self-rated health was the main study variable, while activity limitation was used to test the
robustness of the findings.
5
Sex. The sex of the respondent (man or woman) was used as the main stratification variable
or independent variable depending on the analysis.
Specific chronic conditions. These were used as dependent, stratification and adjustment
variables depending on the analysis. The 27 conditions included in the survey were used,
which ranged from risk factors (high cholesterol) to chronic pain (e.g. back pain or headache)
or diseases with high mortality (e.g. stroke): for each, respondents stated whether they have
ever suffered from the condition; during the last twelve months; a physician has diagnosed
them; and have taken medication for it. The following variables were used:
o Number of prevalent conditions (suffered in the last 12 months);
o Number of diagnosed conditions (suffered in the past 12 months and diagnosed by
a physician at any time);
o Each prevalent condition individually;
o Groups of conditions. Starting from those conditions that individually reduced the
association between sex and self-rated health more than 10% (see Table 2), two
groups were created:
musculoskeletal disorders: a) arthrosis, arthritis or rheumatism; b) neck pain; c)
back pain; and d) osteoporosis;
mental disorders: a) reporting the disorders themselves, identified by a single
question (depression, anxiety or other); or b) having poor mental health (score
higher than two on the 12-item version of General Health Questionnaire, GHQ-
1223);
These variables were included in the models separately.
Stratification variables. As a way to test the consistency of results in different population
groups, some analyses were repeated in the following strata:
Age: 16 to 44 years, 45 to 64, and 65 years or older (representing respectively the
younger active age, adults in active age but who experience increasing health limitations,
and the legal inactive age in Spain).
Social class was assigned according to the current or last occupation of the respondent,
or of the household reference person for those never engaged in paid work, and
classified following the recommendations of the Spanish Society of Epidemiology24. The
five original classes were collapsed into two groups: non-manual (I-III) and manual (IV-V).
6
Type of country of birth was categorized as “Spanish-born”, “born in another high
income country” (countries with human development indexes greater than 0.9 in 2006,
year of the survey 25), and “born in middle or low income countries” (all other countries).
Due to the small sample size in some categories, the stratified analysis of social class and
type of country of birth was simplified in three categories: non-manual social classes (any
origin), Spanish-born manual social classes, or manual class born in middle or low income
countries (excluding from this analysis people of manual social classes from other high-
income countries).
Statistical analysis
All the analyses included weights derived from the complex sample design. The sample
distribution is described, as well as crude prevalence by sex of the general health indicators
and the 27 chronic conditions. Sex differences are tested with Pearson’s chi-square.
To analyse the contribution of specific chronic conditions to gender inequalities in general
health indicators (self-rated health and limitation of activity), we first described these
indicators by sex and number of chronic conditions. Then we calculated the prevalence
ratios (PR), with their confidence intervals at 95%, of the health indicators by sex by means
of robust Poisson regression models26, first entering age as the only adjustment variable, and
then adding to the model one or more variables of specific chronic conditions. An approach
to the contribution size was obtained by calculating the percentage reduction in the strength
of association between sex and the health indicator while adjustment variables were added
with the formula 100*(PRmodel 1-PRmodel 2)/ (PRmodel 1-1)27.
The regression analysis with and without adjustment for the number of chronic conditions
was repeated with stratification by age group, social class and type of country of birth.
Results
A total of 14,249 men and 14,746 women had valid answers for general health indicators
and chronic conditions. Of the participants, 52.4% were aged 16 to 44, 58.5% were in
manual social class, and 87.6% were born in Spain.
7
Inequalities in health indicators and in chronic conditions
Prevalences by sex of poor self-rated health, chronic activity limitation and the 27 chronic
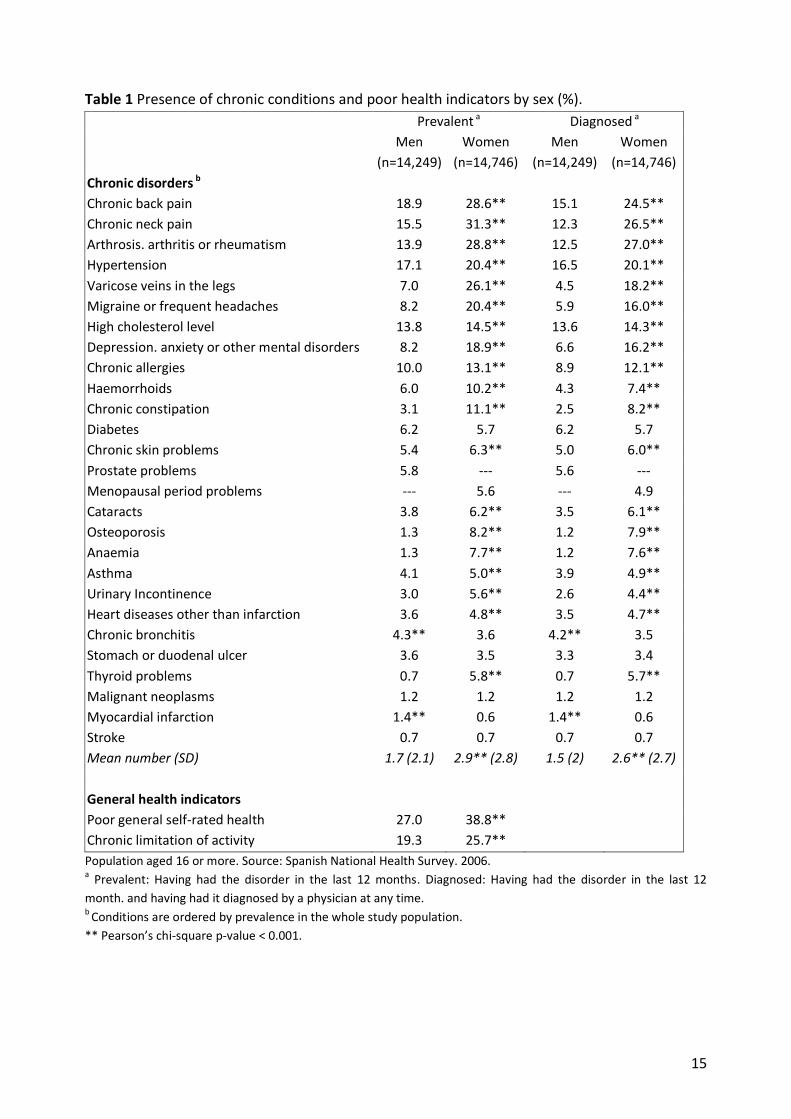
conditions included, are shown in Table 1. Women reported poorer health (38.8% vs. 27%,
p<0.001) and more activity limitation (25.7% vs. 19.3%, p<0.001) than men. Women also had
higher prevalence for most specific chronic conditions. The prevalence was higher in women
within the 11 most common conditions (all p<0.001), and in 6 of these conditions prevalence
in women was more than double that of men. These results were consistent when the
criterion was restricted to conditions diagnosed by a physician.
The contribution of chronic conditions to gender inequalities in general health
Figure 1 describes the distribution of the number of chronic conditions, with more men than
women reporting no condition (37% vs. 22%) or one condition (23% vs. 17%) and more
women reporting three or more (46% vs. 25%). Furthermore, it shows the proportion of men
and women reporting poor health or chronic limitation for each category of the number of
conditions. It is quite evident that in this case, women did not report poorer health than
men with the same number of conditions; on the contrary, men appeared to report poorer
health and more chronic limitations than women with the same number of conditions,
especially from three conditions on.
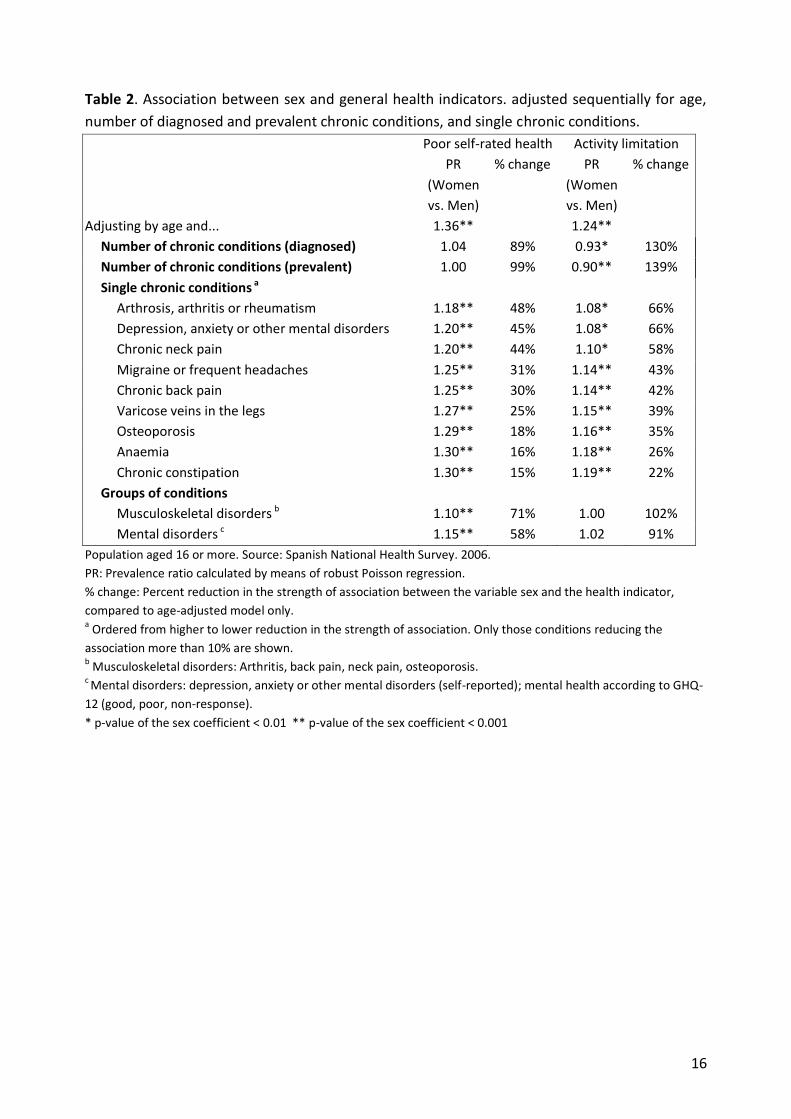
Table 2 shows the same phenomenon in terms of multivariate analysis. Adjusted only by
age, women reported significantly poorer health (PR = 1.36, 95% CI= 1.29-1.41) and more
activity limitation (PR = 1.24, 1.18-1.32). Once further adjusted by the number of conditions,
there were no differences between women and men in the likelihood to report poor self-
rated health (PR adjusted by age and number of prevalent conditions = 1.00, 0.96-1.04),
while women had a lower risk of reporting activity limitation compared to men (PR adjusted
by age and number of prevalent conditions = 0.90, 0.85-0.96).
Table 2 also displays the conditions that reduced 10% or more, on their own, the strength of
the association between sex and self-rated health. Five disorders (arthritis, mental disorders,
neck pain, headache and back pain) individually reduced the association by 30% or more.
With limitation of activity as the dependent variable, the order of importance was consistent
8
but reductions were more emphasised. The same table shows the result of adjusting
simultaneously for groups of variables that accounted for similar health problems:
musculoskeletal disorders alone accounted for most of the association (71% with self-rated
health, 102% with chronic limitation), and so did the available mental disorder variables
(58% and 91%).
Stratification by age, social class and type of country of birth
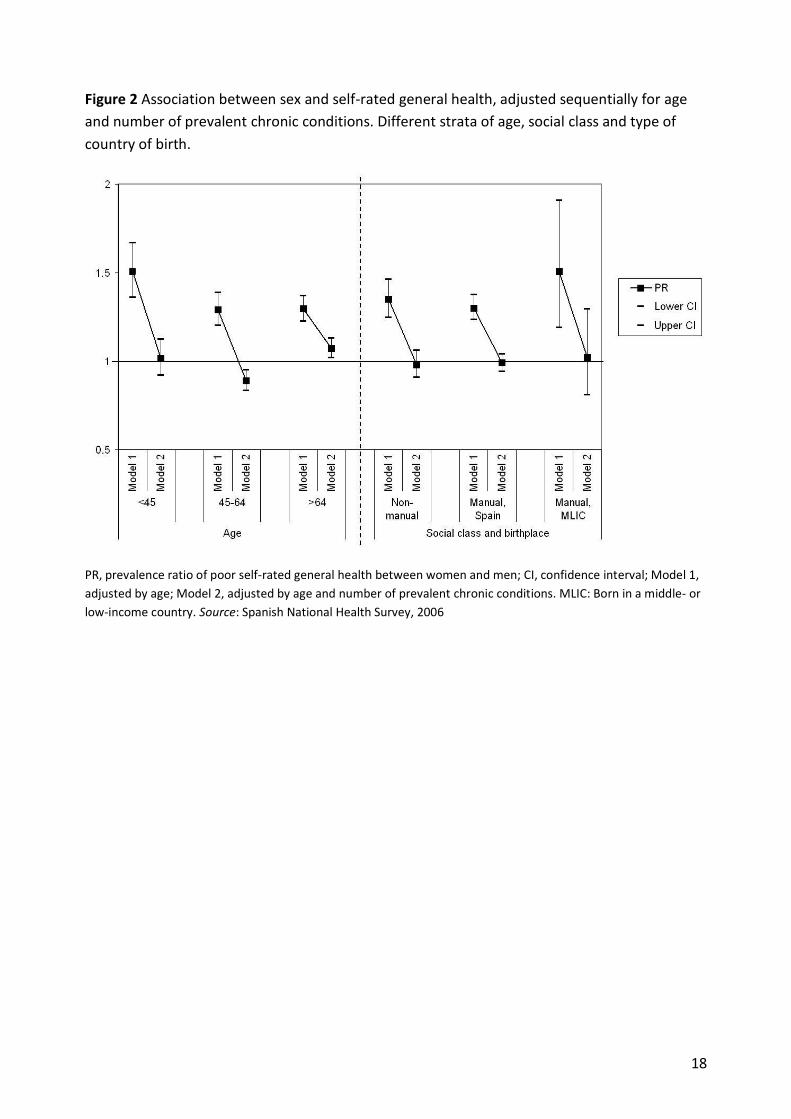
Figure 2 shows that the findings of Table 2 are substantially similar in all subgroups: that is,
the probability of poorer health of women versus men disappears when adjusting for the
number of prevalent chronic conditions. For self-rated health, this was the case for younger
than 45 and the three groups by social class and type of country of birth; for those aged 45
to 64, the association was even reversed (PR 0.89, 95% CI 0.83-0.95), while for those over
64, it was reduced but still minimally significant (PR 1.07, 1.02-1.13). In the case of activity
limitation, the association was significantly reversed, as in the whole population, in the 16-
44 and 45-64 age groups and in the manual Spanish-born; disappeared in non-manual; and
was reduced while loosing significance in those over 64 and in manual from low-income
countries.
Discussion
In Spain, women reported poorer general health status and more chronic limitations of
activity than men. This article shows that these reports reflect or even underestimate the
fact that women suffer more often from a wide range of chronic conditions, where women
reported equal health and less activity limitation compared to men with the same number of
conditions. Musculoskeletal and other pain disorders, as well as mental health, account for
most of the excess of poor health of women.
Major strengths of the study include the use of a large population sample, and the
consistency of results with more than one health indicator, and in the various population
subgroups analyzed. In all the subgroups, sex differences disappeared when adjusting for the
number of reported conditions, except in the oldest group where a significant but very slight

9
excess persisted. This latter finding deserves replication, though it might be attributed to
residual confounding such as the severity of conditions.
Musculoskeletal, mental and other pain disorders were the primary causes of the excess of
poor health of women. Many other studies have shown that these groups of conditions are
also the ones with the strongest impact on well-being, disability and burden of ill health of
the entire population 28-32. In spite of their relevance, and the existence of effective
interventions for their management in primary care 33,34, they have been largely overlooked
in favour of other chronic diseases or cardiovascular risk factors 35,36. Previous studies have
pointed out the strict relation between physical and mental disorders37, and argued that
gender inequalities in mental illness may contribute to the gap in chronic physical conditions
15,38, although both may also share a common cause, and women’s higher rates of
depression themselves reflect real health differences rooted in disadvantages rather than
artifacts39.
The main finding of this study – gender differences in self-rated health disappear when
adjusting for number of chronic conditions – has also been observed in other studies in
Southern European cities such as Florence 17 and Barcelona 19. However, results could be
different in countries such as the UK and Finland where several studies have shown higher
morbidity in women but equal or poorer self-rated health in men 3,5,17,18. These contradictory
findings point out to the importance of examining social determinants of health status in
different contexts in order to tailor policies to reduce gender inequalities in health, which
are rooted in large inequities in socialisation, power, and exposures to determinants such as
employment status and working conditions, income, or the burden of unpaid work2,10.
The study has some potential limitations. One may arise from the use of self-reporting for
both the general health and chronic conditions variables, that may therefore share a
common variance. Nevertheless, checklists of conditions have been shown to encourage
reporting by the genuinely ill and give an accurate reflection of health needs29. Results were
also consistent when using the number of physician diagnosed disorders: although the same
diagnosis is self-reported, and often dependent on having posed the problem to a health
professional, we found no sex differences in the ratio between diagnosed and prevalent
disorders. Finally, other studies using different approaches have ruled out reporting bias as a
cause of gender differences in health indicators 14, 16.

10
The results can also be influenced by the use of a concrete checklist of conditions, which
despite being large, does not include all possible conditions. For example, externalising
mental disorders, such as those related with substance abuse, which are usually more
frequent in men, were not included. However, their impact on quality of life (not mortality)
at the population level is generally lower than that of internalising disorders28.
Because of the high level of correlation between different chronic conditions, the
percentages of contribution to gender inequalities of single conditions could be
overestimated. However, despite that, they are useful to approximate the relative
importance of one disorder over the other. For this same reason, the joint contribution of
chronic conditions was examined with summary variables such as the total number of
conditions. The alternative option of including each condition separately produces nearly
identical results (data not shown).
This study adds to the literature demonstrating that reporting bias is not an explanation for
gender differences in self-rated general health, whereas musculoskeletal and mental
disorders emerge as major contributors, a finding that also has new implications for both
health policy and research. A health care system responsive to gender inequalities should
increase its efforts in addressing and resolving these groups of disorders, which despite their
limited impact on mortality, have a strong impact on everyday health and well-being of not
only women but the entire population28, and are usually insufficiently addressed by health
systems vis-à-vis potentially fatal conditions with similar impacts13,36. At the same time,
research and policy on gender equity in health care have mainly focused so far on
inequalities in the quality of care provided for certain conditions, such as coronary heart
disease, or on women's specific issues such as reproductive health. However, these policies
should go beyond to include the prioritisation of health problems according to their impact
on gender inequalities, and the study of dimensions such as somatic pain or mental distress
from a gender perspective.
11
ACKNOWLEDGMENTS
This work was undertaken as part of Davide Malmusi’s doctoral dissertation at the
Universitat Pompeu Fabra.
FUNDING
This work was partially funded by Observatorio de Salud de las Mujeres, Dirección General
de la Agencia de Calidad, Ministerio de Sanidad, Política Social e Igualdad.
Davide Malmusi was partially supported by the IV grant for young epidemiologists “Enrique
Nájera” awarded by the Sociedad Española de Epidemiología and sponsored by the Escuela
Nacional de Sanidad.
Conflicts of interest: None declared.
KEYPOINTS
Women’s disadvantage in general health reports can be explained by their higher
prevalence of chronic conditions.
Musculoskeletal, mental and other pain disorders account for most of this
disadvantage.
A health care system responsive to gender inequalities should increase its efforts in
addressing and resolving these groups of disorders while considering their social
determinants.

12
References
1. Case A, Paxson C. Sex differences in morbidity and mortality. Demography 2005;42:189-214.
2. Cherepanov D, Palta M, Fryback DG, Robert SA. Gender differences in health-related
quality-of-life are partly explained by sociodemographic and socioeconomic variation
between adult men and women in the US: evidence from four US nationally representative
data sets. Qual Life Res 2010;19(8):1115-24.
3. Lahelma E, Martikainen P, Rahkonen O, Silventoinen K. Gender differences in illhealth in
Finland: patterns, magnitude and change. Soc Sci Med 1999; 1;48(1):7-19.
4. Rueda S, Artazcoz L, Navarro V. Health inequalities among the elderly in western Europe. J
Epidemiol Community Health 2008;62(6):492-8.
5. Bambra C, Pope D, Swami V, et al. Gender, health inequalities and welfare state regimes: a
cross-national study of 13 European countries. J Epidemiol Community Health 2009;63:38-
44.
6. Verbrugge LM. Gender and health: an update on hypotheses and evidence. J Health Soc
Behav 1985;26(3):156-82.
7. Krieger N. Genders, sexes, and health: what are the connections—and why does it matter?.
Int J Epidemiol 2003;32(4):652-7.
8. Bird CE, Rieker PP. Gender matters: an integrated model for understanding men's and
women's health. Soc Sci Med 1999;48(6):745-55.
9. Bird CE, Fremont AM. Gender, time use, and health. J Health Soc Behav 1991;32(2):114-29.
10. Ross CE, Bird CE. Sex stratification and health lifestyle: consequences for men's and
women's perceived health. J Health Soc Behav 1994;35(2):161-78.
11. Doyal L. What makes women sick: gender and the political economy of health. London:
MacMillan; 1995.
12. Hibbard JH, Pope CR. Another look at sex differences in the use of medical care: illness
orientation and the types of morbidities for which services are used. Women Health 1986;
11(2):21-36.
13. Tannenbaum C, Mayo N. Women's health priorities and perceptions of care: a survey to
identify opportunities for improving preventative health care delivery for older women. Age
Ageing 2003;32(6):626-35.
13
14. Macintyre S, Ford G, Hunt K. Do women ‘over-report' morbidity? Men's and women's
responses to structured prompting on a standard question on long standing illness. Soc Sci
Med 1999;48(1):89-98.
15. Gijsbers van Wijk CM, Huisman H, Kolk AM. Gender differences in physical symptoms and
illness behavior. A health diary study. Soc Sci Med 1999;49(8):1061-74.
16. Mirowsky J, Ross CE. Sex differences in distress: Real or artifact?. Am Sociol Rev
1995;60(3):449-68.
17. Jylhä M, Guralnik JM, Ferrucci L, Jokela J, Heikkinen E. Is self-rated health comparable across
cultures and genders?. J Gerontol B Psychol Sci Soc Sci 1998;53(3):S144-52.
18. Arber S, Cooper H. Gender differences in health in later life: the new paradox?. Soc Sci Med
1999; 48(1):61-76.
19. Orfila F, Ferrer M, Lamarca R, Tebe C, Domingo-Salvany A, Alonso J. Gender differences in
health-related quality of life among the elderly: The role of objective functional capacity
and chronic conditions. Soc Sci Med 2006;63(9):2367-80.
20. Ministerio de Sanidad y Consumo. Encuesta Nacional de Salud de 2006, Metodología
detallada.
www.msc.es/estadEstudios/estadisticas/encuestaNacional/encuestaNac2006/metodENS20
06.pdf Accessed March 2011.
21. Quesnel–Vallée A. Self-rated health: caught in the crossfire of the quest for ‘true’health?.
Int J Epidemiol 2007;36(6):1161-4.
22. Manor O, Matthews S, Power C. Dichotomous or categorical response? Analysing self-rated
health and lifetime social class. Int J Epidemiol 2000;29(1):149-57.
23. Goldberg D. Manual of the general health questionnaire. Windsor, England: NFER
Publishing; 1978.
24. Domingo-Salvany A, Regidor E, Alonso J, Alvarez-Dardet C. Una propuesta de medida de la
clase social. Aten Primaria 2000;25:350-63.
25. United Nations Development Programme. Human Development Report 2006: beyond
scarcity: power, poverty and the global water crisis. New York: United Nations Development
Programme; 2006.
26. Barros AJD, Hirakata VN. Alternatives for logistic regression in cross-sectional studies: an
empirical comparison of models that directly estimate the prevalence ratio. BMC Medical
Research Methodology 2003;3(1):21.
14
27. Szklo M, Nieto FJ. Epidemiology: beyond the basics. Gaithersburg, MD: Aspen; 2000.
28. Saarni SI, Härkänen T, Sintonen H, et al. The impact of 29 chronic conditions on health-
related quality of life: a general population survey in Finland using 15D and EQ-5D. Quality
of Life Research 2006;15(8):1403-14.
29. Knight M, Stewart-Brown S, Fletcher L. Estimating health needs: the impact of a checklist of
conditions and quality of life measurement on health information derived from community
surveys. J Public Health Med 2001; 23(3):179-86.
30. Moussavi S, Chatterji S, Verdes E, Tandon A, Patel V, Ustun B. Depression, chronic diseases,
and decrements in health: results from the World Health Surveys. Lancet 2007; 370:851-8.
31. Centers for Disease Control and Prevention (CDC). Prevalence and most common causes of
disability among adults--United States, 2005. MMWR Morb Mortal Wkly Rep 2009;
58(16):421-6.
32. Pueyo MJ, Surís X, Larrosa M, et al. [Importance of chronic musculoskeletal problems in the
population of Catalonia (Spain): prevalence and effect on self-perceived health, activity
restriction and use of health services.]. Gac Sanit 2011. doi:10.1016/j.gaceta.2011.03.008 .
Spanish.
33. Rost K, Nutting P, Smith JL, Elliott CE, Dickinson M. Managing depression as a chronic
disease: a randomised trial of ongoing treatment in primary care. BMJ 2002; 325(7370):934.
34. Dobscha SK, Corson K, Perrin NA, et al. Collaborative Care for Chronic Pain in Primary Care.
JAMA 2009; 301(12):1242-52.
35. Eisenberg L. Treating depression and anxiety in primary care. N Engl J Med 1992;326:1080-
4.
36. Verbrugge LM, Patrick DL. Seven chronic conditions: their impact on US adults' activity
levels and use of medical services. Am J Public Health 1995; Feb;85(2):173-82.
37. Gureje O, Von Korff M, Simon GE, Gater R. Persistent Pain and Well-being. JAMA 1998; July
08;280(2):147-51.
38. Needham B, Hill TD. Do gender differences in mental health contribute to gender
differences in physical health?. Soc Sci Med 2010; 71(8):1472-9.
39. Piccinelli M, Wilkinson G. Gender differences in depression. Critical review. Br J Psychiatry
2000; 177:486-92.
15
Table 1 Presence of chronic conditions and poor health indicators by sex (%).
Prevalent a Diagnosed a
Men
(n=14,249)
Women
(n=14,746)
Men
(n=14,249)
Women
(n=14,746)
Chronic disorders b
Chronic back pain 18.9 28.6** 15.1 24.5**
Chronic neck pain 15.5 31.3** 12.3 26.5**
Arthrosis. arthritis or rheumatism 13.9 28.8** 12.5 27.0**
Hypertension 17.1 20.4** 16.5 20.1**
Varicose veins in the legs 7.0 26.1** 4.5 18.2**
Migraine or frequent headaches 8.2 20.4** 5.9 16.0**
High cholesterol level 13.8 14.5** 13.6 14.3**
Depression. anxiety or other mental disorders 8.2 18.9** 6.6 16.2**
Chronic allergies 10.0 13.1** 8.9 12.1**
Haemorrhoids 6.0 10.2** 4.3 7.4**
Chronic constipation 3.1 11.1** 2.5 8.2**
Diabetes 6.2 5.7 6.2 5.7
Chronic skin problems 5.4 6.3** 5.0 6.0**
Prostate problems 5.8 --- 5.6 ---
Menopausal period problems --- 5.6 --- 4.9
Cataracts 3.8 6.2** 3.5 6.1**
Osteoporosis 1.3 8.2** 1.2 7.9**
Anaemia 1.3 7.7** 1.2 7.6**
Asthma 4.1 5.0** 3.9 4.9**
Urinary Incontinence 3.0 5.6** 2.6 4.4**
Heart diseases other than infarction 3.6 4.8** 3.5 4.7**
Chronic bronchitis 4.3** 3.6 4.2** 3.5
Stomach or duodenal ulcer 3.6 3.5 3.3 3.4
Thyroid problems 0.7 5.8** 0.7 5.7**
Malignant neoplasms 1.2 1.2 1.2 1.2
Myocardial infarction 1.4** 0.6 1.4** 0.6
Stroke 0.7 0.7 0.7 0.7
Mean number (SD) 1.7 (2.1) 2.9** (2.8) 1.5 (2) 2.6** (2.7)
General health indicators
Poor general self-rated health 27.0 38.8**
Chronic limitation of activity 19.3 25.7**
Population aged 16 or more. Source: Spanish National Health Survey. 2006. a Prevalent: Having had the disorder in the last 12 months. Diagnosed: Having had the disorder in the last 12
month. and having had it diagnosed by a physician at any time. b Conditions are ordered by prevalence in the whole study population.
** Pearson’s chi-square p-value < 0.001.
16
Table 2. Association between sex and general health indicators. adjusted sequentially for age,
number of diagnosed and prevalent chronic conditions, and single chronic conditions.
Poor self-rated health Activity limitation
PR
(Women
vs. Men)
% change PR
(Women
vs. Men)
% change
Adjusting by age and... 1.36** 1.24**
Number of chronic conditions (diagnosed) 1.04 89% 0.93* 130%
Number of chronic conditions (prevalent) 1.00 99% 0.90** 139%
Single chronic conditions a
Arthrosis, arthritis or rheumatism 1.18** 48% 1.08* 66%
Depression, anxiety or other mental disorders 1.20** 45% 1.08* 66%
Chronic neck pain 1.20** 44% 1.10* 58%
Migraine or frequent headaches 1.25** 31% 1.14** 43%
Chronic back pain 1.25** 30% 1.14** 42%
Varicose veins in the legs 1.27** 25% 1.15** 39%
Osteoporosis 1.29** 18% 1.16** 35%
Anaemia 1.30** 16% 1.18** 26%
Chronic constipation 1.30** 15% 1.19** 22%
Groups of conditions
Musculoskeletal disorders b 1.10** 71% 1.00 102%
Mental disorders c 1.15** 58% 1.02 91%
Population aged 16 or more. Source: Spanish National Health Survey. 2006.
PR: Prevalence ratio calculated by means of robust Poisson regression.
% change: Percent reduction in the strength of association between the variable sex and the health indicator,
compared to age-adjusted model only. a Ordered from higher to lower reduction in the strength of association. Only those conditions reducing the
association more than 10% are shown. b Musculoskeletal disorders: Arthritis, back pain, neck pain, osteoporosis. c Mental disorders: depression, anxiety or other mental disorders (self-reported); mental health according to GHQ-
12 (good, poor, non-response).
* p-value of the sex coefficient < 0.01 ** p-value of the sex coefficient < 0.001

17
Figure 1 Prevalence of poor health and activity limitation by sex and number of prevalent
chronic conditions.
Population aged 16 years or more. Source: Spanish National Health Survey, 2006
18
Figure 2 Association between sex and self-rated general health, adjusted sequentially for age
and number of prevalent chronic conditions. Different strata of age, social class and type of
country of birth.
PR, prevalence ratio of poor self-rated general health between women and men; CI, confidence interval; Model 1,
adjusted by age; Model 2, adjusted by age and number of prevalent chronic conditions. MLIC: Born in a middle- or
low-income country. Source: Spanish National Health Survey, 2006