Perceived Influence of the Work Environment on Productivity ...
77
Z f fc w x PERCEIVED INFLUENCE OF THE WORK ENVIRONMENT ON PRODUCTIVITY AMONG ADMINISTRATIVE STAFF: A CASE OF UNIVERSITY OF NAIROBI BY [MUSEMBI MERCY NDILA C50/61997/2010 University ot NAIROBI Library II! A RESEARCH PROJECT REPORT PRESENTED IN PARTIAL FULFILLMENT OF THE REQUIREMENTS FOR THE DEGREE OF MASTER OF ARTS IN SOCIOLOGY (MEDICAL SOCIOLOGY) 2012
-
Upload
khangminh22 -
Category
Documents
-
view
5 -
download
0
Transcript of Perceived Influence of the Work Environment on Productivity ...
Z f fc w x
PERCEIVED INFLUENCE OF THE WORK ENVIRONMENT ON
PRODUCTIVITY AMONG ADMINISTRATIVE STAFF: A CASE OF
UNIVERSITY OF NAIROBI
BY
[MUSEMBI MERCY NDILA
C50/61997/2010
University ot NAIROBI Library
II!
A RESEARCH PROJECT REPORT PRESENTED IN PARTIAL FULFILLMENT
OF THE REQUIREMENTS FOR THE DEGREE OF MASTER OF ARTS IN
SOCIOLOGY (MEDICAL SOCIOLOGY)
2012
DECLARATION
This research project is my original work and has not been presented for a degree in any
other university:
Name:
Registration No:
Signature:
Date:
MUSEMBI MERCY NDILA
C50/61997/2010
Supervisor's Approval
This research project has been submitted for examination with my approval as university
supervisor:
PROF. E. K. MBURUGU
PROFESSOR, DEPARTMENT OF SOCIOLOGY
FAULTY OF ARTS
COLLEGE OF HUMANITIES & SOCIAL SCIENCES
Signature
Date:
University of Nairobi

DEDICATION
This work is dedicated to my beloved children and their father who have given me the
support and motivation i needed to undertake this research.
•
i i i
ACKNOWLEDGEMENTS
I give thanks to the almighty God for enabling me to pursue this study. Great appreciation
also to the University of Nairobi Management for partially sponsoring me. My deepest
appreciation goes to my supervisor, Prof. E. K. Mburugu for his relentless guidance,
understanding and patience. May the Almighty God bless you all.
i v
TABLE OF CONTENT
DECLARATION "
DEDICATION Hi
ACKNOWLEDGEMENT iv
TABLE OF CONTENTS v
LIST OF FIGURES viii
LIST OF TABLES ix
ABBREVIATIONS AND ACRONYMS x
ABSTRACT xi
CHAPTER ONE: INTRODUCTION 1
1.1 Background to the Study 1
1.2 Problem Statement 4
1.3 Research Questions 5
1.4 Research Objectives 5
1.5 Justification of the Study 6
1.6 Scope and Limitations of the Study 6
CHAPTER TWO: LITERATURE REVIEW 7
2.1 Introduction 7
2.2The Concept of Work Environment and Productivity 7
2.3 Physical Environment and Employee Productivity 9
2.3.1 Lighting 11
2.3.2 Noise 11
2.3.3 Temperature 12
2.4 Social Support and Employee Productivity 12
2.5 Fringe Benefits and Employee Productivity 14
2.6 Summary 15
2.7 Theoretical Framework , 16
v
2.7.1 Social Exchange Theory 16
2.7.2 Person-Environment Fit Theory 18
2.8 Conceptual Framework Description 19
2.9 Summary and Gaps in the Literature Review 20
CHAPTER THREE: RESEARCH METHODOLOGY 22
3.1 Introduction 22
3.2 Site Description 22
3.4 Target Population 23
3.5 Sample Size and Sampling Procedures 23
3.6 Data Collection Methods 23
3.6.1 Survey 24
3.6.2 Key Informant Interv iew 24
3.6.3 Secondary Data 25
3.7 Validity and Reliability of Research Instruments 25
3.8 Ethical Considerations 25
3.9 Data Analysis and Presentation 26
CHAPTER FOUR: DATA ANALYSIS AND INTERPRETATION 27
4.1 Introduction 27
4.2 Socio - Demographic Data 27
4.2.1 Age Distribution 28
4.2.2 Levels of Education 28
4.2.3 Administrative Level 30
4.2.4 Duration in Current Position 30
4.3 Physical Environment Impact on Productivity 31
4.3.1 Noise 32
4.3.2 Effect of noise distraction 32
4.3.3 Temperature 33
v i
4.3.4 Variation in room temperature in the workplace 34
4.3.5 Lighting in the workplace 36
4.3.6 Lighting 37
4.4 Job related factors influencing Productivity 38
4.5 Fringe benefits influence on work environment 40
CHAPTER FIVE: SUMMARY, CONCLUSION AND RECOMMENDATIONS ...44
5.1 Introduction 44
5.2 Summary 44
5.2.1 Physical factors affecting productivity 44
5.2.2 Job related factors influence on productivity 45
5.2.3 Fringe benefits influence on productivity 45
5.3 Conclusion 45
5.4 Recommendations 46
REFERENCES 48
APPENDICES 59
APPENDIX ONE: LETTER OF INTRODUCTION 59
APPENDIX TWO: QUESTIONNAIRE FOR ADMINISTRATIVE EMPLOYEES 60
APPENDIX 3: KEY INFORMANT INTERVIEW GUIDE 65
«
v i i

LIST OF FIGURES
Page
Figure 1: Conceptual Framework 21
v i i i
LIST OF TABLES
Page
Table 3.1: Sample of the Population 23
Table 4.1 Gender of Respondents 28
Table 4.2: Age of Respondents 28
Table 4.3: Level of Education among Respondents 29
Table 4.4: Administrative Level of Employees 30
Table 4.5: Years at Current Position 31
Table 4.6: Physical Environment Impact on Productivity 32
Table 4.7: Work Environment is Quiet 32
Table 4.8: Quiet and Undisturbed Time Alone 32
Table 4.9: Workspace has Many Noise Distractions 33
Table 4.9: Extent to Which Room Temperature Affects Work Productivity 34
Table 4.10: Overall Temperature of Workspace in Cold Season 34
Table 4.11: Overall Temperature in the Hot Season 35
Table 4.12: Control of Airflow or Temperature in Workspaces 36
Table 4.13: Efficient Lighting in Workspace 37
Table 4.14: Amount of Natural Light in Office 37
Table 4.15: Job Related Factors Impact on Productivity 40
Table 4.16: Knowledge of Fringe Benefits in the Organisation 40
Table 4.17: Fringe Benefits Offered in the Organisation 41
Table 4.18: Satisfaction with Fringe Benefits Offered in Organisation 42
Table 4.19: Number of Days absent from Work 43
Table 4.20: Frequency of Sick Leave Days 42
i x

ABBREVIATIONS AND ACRONYMS
SET Social Exchange Theory
UoN University of Nairobi
SPSS Statistical Package for Social Scientists
DSP Direct Service Providers
x
ABSTRACT
The purpose of the study was to investigate the influence of the work environment on the
productivity of administrative staff. The factors under investigation in the study were the
physical environment, job related factors and the fringe benefits impact on administrative
staff productivity. The study was guided by the specific objectives; to identify influence
of physical work environment on productivity among administrative employees in the
University of Nairobi; to assess the relationship between the office ergonomics and
employee productivity among administrative staff in the University of Nairobi and to
establish the extent that job - related factors affect employee productivity among
administrative staff at the University of Nairobi.
The target population of the study consisted of 161 Senior Administrative staff and
Administrative Assistant staff in six colleges, Central Administration and Students'
Welfare Authority where a sample of 93 respondents was carried out. The researcher
used both qualitative and quantitative methods to collect data which included the
questionnaires and five key informant interviews. Data was analyzed using the Statistical
Package for Social Scientists (SPSS). Study findings indicated that there is an impact of
the physical environment with regard to the noise factor which was identified to be
disruptive and difficult to control particularly among the open plan office design some
offices. Job related factors were also indicated to have an impact on the productivity of
employees which was ranked poorly by the study participants.
The study respondents acknowledged the management's effort to provide fringe benefits
in the course of their work among which medical cover was the most coveted.
Respondents indicated that management should consider the harmonization of fringe
benefits offered to staff across Departments and Colleges. Based on these findings the
study made the following recommendations, the University of Nairobi should
continuously assess the physical working conditions of administrative staff and
implement measures. University management to increase the number of potted plants in
x i

staff work spaces to counter the effect of high humidity which has been observed to
contribute to illness; The university of Nairobi management should consider
harmonization of fringe benefits offered to administrative employees across the colleges.
x i i
CHAPTER ONE
INTRODUCTION
1.1 Background to the Study
Human Resource Managers nowadays are faced with crucial issues of occupational
health and safety than before. This is because the workers just like any other resources
require maintenance and care in order to maximize their productivity (Casio, 1996). Most
people spend fifty percent of their lives within indoor environments, which greatly
influence their mental status, actions, abilities and performance (Sundstrom, 1994). Better
outcomes and increased productivity is assumed to be the result of better workplace
environment. Better physical environment of office will boost the employees and
ultimately improve their productivity. The constitution of Kenya (2010) Article (41)
Section 2 (b) states that "every worker has the right to reasonable working conditions."
Conducive work environment ensures the well-being of employees which invariably will
enable them exert themselves to their roles with all vigour that may translate to higher
productivity (Akinyele, 2007).
The concept of productivity is often measured differently, however. Sometimes in a more
subjective manner, by asking about the degree to which the work environment influences
productivity (Vischer, 1989) sometimes in a more objective manner by asking about the
number of hours or percentage of time that is lost (Raw, 1990; Learnan, 1994). Some
researchers use the term "job performance". A number of indicators are scored to provide
an indication of this. Brill (1984) uses; the quantity of work, quality of work, meeting
deadlines, frequency of errors, responsibilities, creativity, interpersonal relations,
independence. Creating a work environment in which employees are productive is
essential to increased profits for an organization, corporation or small business. Principles
ot management dictate that, to maximize employee productivity center around two major
areas of focus: personal motivation and the infrastructure of the work environment
(Chandrasekar, 2011).
1
According to Beer et al. (1994) model of human resource management, work systems
cannot only affect commitment, competence, cost effectiveness and congruence but also
have long term consequence for workers' well being; there is some evidence to indicate
that work systems designs may have effects on physical health, mental health and
longevity of life itself. The mind and body need to be in a state of health and well-being
for work and concentration. This is a prime prerequisite for productivity. High
productivity brings a sense of achievement for the individual as well as increased profits
for the work organization (Al-Anzi, 2009).
Kohun (1992) defines work environment as "an entirety" which comprises the totality of
forces, actions and other influential factors that are currently and/or potentially
contending with the employee's activities and performance. Brenner (2004) argued that
work environment designed to suit employee's satisfaction and free flow of exchange of
ideas is a better medium of motivating employees towards higher productivity. Job -
related issues are also a factor within the work environment which has a bearing on the
job satisfaction which in turn influences productivity of staff. According to the Steadman
Report (2007) 29% of University of Nairobi staff identified job-related factors as a key
satisfaction driver coming second after Organisation focus at 49% which was the most
popular.
Work environment includes some factors, which either contributes positively or
negatively to achieving maximum employee productivity (Elywood, 1999). The factors
which either contributes positively or negatively to employee productivity are:
temperature, humidity and air flow, noise, lighting, employee personal aspects,
contaminants and hazards in the working environment, types of sub-environment. How
well employees engage with the organization, especially with their immediate
environment, influences to a great extent their error rate, level of innovation and
collaboration with other employees, absenteeism and, ultimately, how long they stay in
the job (Al-Anzi, 2009). Brown et al. (2003) suggests a positive relationship between
employees' perception of perforitiance-related pay plans and management-employee
2
relations. For instance, administrative staff in the University of Nairobi have to undergo
performance appraisal from their immediate supervisors for promotion purposes (UoN
Strategic Plan 2008-2013).
The quality of work depends upon safe and healthy working conditions in determining
employee's job behavior. The organizational climate is an important indicator of
employee behavior as a combination of social and psychological factors. It is found that
working conditions are attached with employees' job involvement and job satisfaction
that ultimately leads to better performance of the employees (Scott et al., 2000).
In discussing the notion of the work environment, it is important to include the concept of
office ergonomics. Ergonomics is the scientific study of human work. It considers the
physical and mental capabilities and limits of the worker as he or she interacts with tools,
equipment, work methods, tasks and the working environment. (Hayworth, 1991)
Ergonomics reduces the risk of injury by adapting the work to fit the person instead of
forcing the person to adapt to the work. In addition to injury prevention, ergonomics is
also concerned with enhancing work performance, by removing the barriers that exist in
many work places that prevent employees from performing to the best of their abilities.
Another benefit of applying ergonomics to office work is that it helps people work more
effectively, efficiently, and productively at their jobs. Office design incorporates both
ergonomics and work flow, which examine the way in which work is performed in order
to optimize layout (Hameed & Amjad, 2009). Miles (2000) found that the additional
investment in ergonomic tables and chairs for workers yielded a 5-month payback in
terms of increased productivity.
According to Hameed and Amjad (2009) the performance of an employee is measured by
the output that the individual produces and it is related to productivity. At corporate level,
productivity is affected by factors such as employees, technology and objectives of the
organization. It is also dependent on the physical environment and its affect on health and
employees' performance.
3

The word 'administration' derives from the Middle English word administracioun, which
has particular meanings in various contexts, but all retain a sense of service. In the
administrative environment, hierarchy means a graded organization of several successive
steps or levels that are interlinked, integrating the efforts of various individuals with one
another (Collins, 1999). Administrative employees are referred to as non-managerial staff
or employees. Their output is usually monitored and managed from the top to the bottom
level, in other words in a top-down approach.
1.2 Problem Statement
Recently public universities have received an influx of students through different
programs such as the parallel programmes. This has led to an increase in management
and administration challenges to be able to effectively and efficiently ensure the smooth
operations aimed at facilitating students' and academic staff operations. The ability of
administrative staff to undertake these duties and responsibilities have received much
discussion and have led to implementation of performance measurements to influence
delegation of duties among administrative professionals. However, hardly any research
has been undertaken to identify the work environment in which university administrative
staff operate and how this influences their performance and inevitably contributes to their
productivity. Despite improved pay packages and promotions based on these
performance appraisal, workers productivity is affected by their well-being in the
workplace given that employees spend a considerable amount of time in their workplace.
Employee absenteeism is major constraint to productivity in the workplace. For instance
the University of Nairobi Strategic Plan 2008-2013 identifies absenteeism among
university staff to be at 12%.
There is therefore a need for organizations and employers to acknowledge the
environment in which their employees are working in order to sustain and promote
employee well-being which invariably leads to productivity. The study focused on the
intrinsic and extrinsic needs of administrative employees that might affect their
4

performance and well-being. If the needs regarding the working environment of these
employees can be identified and met - at least to some extent - the morale and
productivity of employees should increase.
1.3 Research Questions
1. To what extent does the physical work environment influence productivity among
administrative staff at the University of Nairobi?
2. To what extent do office ergonomics affect administrative staff at the University
of Nairobi?
3. To what extent do job-related factors influence administrative staff at the
University of Nairobi?
4. What approaches can be adopted to improve the work environment for
administrative staff at the University of Nairobi
1.4 Research Objectives
The overall objective of the study was to identify the influence of the work environment
on the productivity among administrative employees at the University of Nairobi. The
study was guided by the following objectives.
1. To identify influence of physical work environment on productivity among
administrative employees in the University of Nairobi
2. To assess the effects of office ergonomics among administrative staff in the
University of Nairobi
3. To establish the extent that job - related factors affect employee productivity
among administrative staff at the University of Nairobi
4. To recommend ways of improving work environment to increase employee
productivity among administrative staff at the university of Nairobi

1.5 Justification of the Study
The present study will contribute to the body of knowledge on the concept of the work
environment and employee productivity in the service sector particularly in public
universities institutions which continue to register high number of students given their
role in national development. Secondly, the study will also assess the effect of work
environment and identify efforts towards the improvement of the work environment by
employers to introduce and promote employee well being. The study will assist
departmental manager and supervisors to identify strategies they can implement to
increase employee performance and productivity at the work place by providing a
conducive work environment. The study will also inform policy and decision makers on
the importance of a conducive work environment on the well being of their employees
thus improving on productivity and organizational performance.
1.6 Scope and Limitations of the Study
The study focused on the University of Nairobi which comprises six colleges located
within Nairobi and Kiambu counties; although there are other centers around the country
the study would not be able to undertake the research among all centers due to the
resource constraints. The study focused on the organizational conditions that may be
important for the psychosocial work environment and for health. The study further
limited its scope to the University of Nairobi administrative employees.
6
CHAPTER TWO
LITERATURE REVIEW
2.1 Introduction
This section reviewed empirical and theoretical literature on the concept of th e w o r k
environment and the perceived impact that it has on employee productivity. The section includes topics on the concept of work environment and employee productivity t h e
physical environment and employee productivity and. social support and e m p l o y e e
productivity. The theoretical and conceptual frameworks of the study are also introdU c e d
2.2 Concept of the Work Environment and Productivity
According to Leblebici ( 2 0 1 2 ) , many executives are under the mistaken impressi0 n t h a l
the level of employee performance on the job is proportional to the size of t h e
employee's compensation package. Work environment is the combination of f a c t o r s
(social support, physical working conditions, job characteristics, training a n d
development and communication process) that influence work. Wells ( 2 0 0 0 ) in re cent
years, says that employees comfort on the job, determined by workplace conditions a n d
environment has been recognized as an important factor for measuring their productivity.
Researchers have demonstrated that the physical environmental quality expectation 0f
employees' facilities affect job perception, attitudes, and job satisfaction (Leather et al.,
2 0 0 3 ; Lee & Brand, 2 0 0 5 ) . Evidence is accumulating that the physical e n v i r o n m e n t in
which people work affects both job performance and job satisfaction (Clements-Cro0 m e ,
2 0 0 0 ; Shaw & Readon, 2 0 0 4 ) .
Srivastava (2008) argues that perceived adequacy or inadequacy of work environm e n t 5
both physical and psychosocial, extends noticeable effect on employees' job satisfaCtion>
performance and perception of effectiveness of an organization. Productivity is an
important factor in every organization. The term 'work environment' is used in stress
7
research to incorporate psychosocial dimensions as well as employee-employer relations,
motivation and advancement, job demands and social support.
Barber (2001) undertaking a study to ascertain factors that affect employees' productivity
found that aspects regarding technology, storage space, quiet space, climate control,
personalizing the workspace and its visual appeal were the most important factors.
Research indicates that improving the working environment reduces complaints and
absenteeism while increasing productivity (Roelofsen, 2002). Wells (2000) notes
workplace satisfaction has been associated with job satisfaction. Studies show the link
between employee health and aspects of the physical environment at work such as indoor
air quality, ergonomic furniture and lighting (Dilani, 2004; Milton, Glencross, &Walters,
2000; Veitch & Newsham, 2000).
Block and Stokes (1989) also found that the layout of an office influences productivity,
with the extent of influence depending on the kind of work being undertaken. People
carrying out difficult tasks are happier and also perform better in private offices than in
non-private offices. Conversely, employees performing simple tasks perform better in
non-private settings. Working in an open-plan office can, however, lead to distraction and
disruption, which have a negative effect on performance (Hedge, 1982). A study by de
Frias and Schaie (2001) found significant differences in perceived work environment
based on age, gender, and occupation type. Employees aged 50-56 had the highest
perceived autonomy, control, and innovation in the workplace. Men, in all occupation
types exceptblue collar, tended to have a higher perception of the work environment.
Patterson et al., (2003) found that the more satisfied workers are with their jobs the better
the company is likely to perform in terms of subsequent profitability and particularly
productivity. Sekar (2011) argues that the relationship between work, the workplace and
the tools of work, workplace becomes an integral part of work itself.
8
2.3 The Physical Environment and Employee Productivity
Contemporary literature on stress in the work environment typically focuses on psycho-
social factors that affect job performance, strain and employee health. Some theoretical
models of stress at work have included the physical environment as a factor (Matteson &
Ivancevich, 1987). McCoy and Evans (2005) say that physical elements and workspace
design have an important role in determining social relationships and networks that
develop at work. In addition, the researcher increasingly found many links between
employee health and aspects of the physical environment at work such as indoor air
quality, ergonomic furniture and lighting (Dilani, 2004; Milton, Glencross, & Walters,
2000; Veitch & Newsham, 2000).
In their overview of stress related to the physical work environment, McCoy and Evans
(2005) go beyond ergonomics to characterize as stressful those situations where elements
of the physical environment interfere with the attainment of work objectives. Studies
have found that aspects such as openness, noise, lighting and temperature can affect
productivity. Lan et al., (2010); Niemela et al., (2002) have revealed that temperature has
an effect as long as the task concerned lasts at least 60 minutes (Lorsch & Ossama (1994)
in Lan et al., (2009). Lan et al. (2010) investigated the impact of three different indoor
temperatures (17°C, 21°C and 28°C) on productivity. They found that employees felt
slightly uncomfortable in both the coolest and warmest of these climates and were less
motivated and that they experienced their workload as more onerous, with a consequent
decline in productivity.
Leblebici (2012) acknowledges that higher salaries and compensation benefits may seem
the most likely way to attract employees. However, quality of the physical workplace
environment may also have a strong influence on a company's ability to recruit and retain
talented people. Ryan and Deci (2000) also note that although compensation package is
one of the extrinsic motivation tools, it has a limited short term effect on employees'
performance. A widely accepted^ assumption is that better workplace environment
9
motivates employees and produces better results. Some factors in workplace
environment may be considered keys affecting employee's engagement and productivity.
It is found that working conditions are attached with employees' job involvement and job
satisfaction that ultimately leads to better performance of the employees (Scott et al.,
2000). Studies indicate that, the physical layout of the workspace, along with efficient
management processes, is playing a major role in boosting employees' productivity and
improving organizational performance (Uzee, 1999; Leaman and Bordass, 1993;
Williams et al. 1985).
An organization's physical environment and its design and layout can affect employee
behavior in the workplace. Brill (1992) estimates that improvements in the physical
design of the workplace may result in a 5-10 percent increase in employee productivity.
Statt (1994) argues that the modern work physical environment is characterized by
technology; computers and machines as well as general furniture and furnishings. To
achieve high levels of employee productivity, organizations must ensure that the physical
environment is conducive to organizational needs facilitating interaction and privacy,
formality and informality, functionality and cross-disciplinarily. Consequently, the
physical environment is a tool that can be leveraged both to improve business results
(Mohr, 1996) and employee well-being (Huang, Robertson & Chang, 2004).
Rowan and Wright (1995) highlight the importance of ergonomics in a workplace, as
injuries and illnesses interface the employee and machine system. So, they opine the need
tor ergonomics in a workplace. They proposed that physical environmental factors like
temperature, noise, flow of air, humidity, and furniture affects the employees•
productivity. The office environment in which employees work and undertake most of
their activities can impact on their productivity. The quality and quantity of work
generated by employees are influenced by the office environment (Keeling & Kallaus,
1996), while Quible (2000) points out those poor environmental conditions can increase
mneficiency as well as reduce their job satisfaction, which in turn will impact on the
financial well-being of the organisation. Huges (2007) survey of two thousand employees
1 0
in various organizations and industries at multiple levels found that a better workplace
affects attitude of employees and enhance their productivity. There are several elements
of the physical work environment that may affect the productivity of the staff in the
organisation. The next section of the study literature review covers these sub - themes.
2.3.1 Lighting
Employees use lighting for visual tasks. Indoor lighting is relied upon because of lack of
external or natural light inside office spaces (Mills et al. 2007). Therefore bad lighting can
be defined as incorrect lighting for a particular task and 'good lighting' is said to increase
productivity, reduce stress and may also assist in making indoor environments more
pleasant and Mills et al. (2007). Cushman. (n.d.) stated that problems caused by bad
lighting include headaches, eyestrain, general bodily discomfort, rates of human error may
increase and bad light which and also reduce alertness. Taking these complaints into
consideration, the researcher may conclude that bad lighting may have an impact on the
economics of the business (Cushman, n.d.).
2.3 2 Noise
Cohen and Weinstein 1982 in Navai and Veitch (2003) defined noise as a physiological
concept involving unwanted sound perceived by the listener as being unpleasant,
bothersome, distracting or physiologically harmful. Irregular sound such as speech is said
to be the most bothersome. The hum of a computer is less stressful because it is a constant
sound. Glass et al. (1971) in Navai & Veitch, (2003) suggest that sound that is controlled
by the individual is also seen as less stressful. Therefore conversations from co-workers
and music are seen as more stressful because they are uncontrollable sounds. Noise
stemmed from communication is not the only cause of noise on office environments.
External noise including traffic and other external noises such as office equipment may also
cause discomfort in office environments.
1 1
2.3.3 Temperature
There have been contradicting statements about the optimum comfort temperature for
humans. Bennett (1977) in Abdou's (2007) paper states that the optimum temperature for a
comfortable environment is twenty five degrees Celsius. Seppanen; Fisk William & Lei,
(2006) says that the optimum temperature for productivity is about twenty two degrees
Celsius. Both sources agree that incorrect temperature decreases productivity and both
suggest that temperature is an important factor to consider when analyzing work
environments. A Dutch study showed that absenteeism could be reduced by thirty four
percent when employees were able to control their own temperature in their environments.
(Abdou 2007)
2.4 Social Support and Employee Productivity
There are several factors that influence job satisfaction include pay, promotion,
recognition, working conditions, supervision and leadership, skills and abilities,
organizational policies and procedures. The level of job satisfaction is affected by
intrinsic and extrinsic motivating factors, the quality of supervision, social relationships
with the work group and degree to which individuals succeed or fail in their work
(Armstrong, 2006). Social support has been defined by Theorell et al (2003) as good
relations between employees and between employees and managers. Support is also
perceived as having two separate components, one being emotional and the other
instrumental. Emotional support concerns the employee's personal feelings, while
instrumental support refers to practical help and relief among employees. Job -related
factors refer to the support that an employee receives from their supervisor and also from
their colleagues in the workplace.
Hall (2007) studying the relationship between supervisor support and Registered Nurses
outcome in nursing care units found a positive correlation between perceived supervisor
support and nurse occupation-related outcomes. According to Karasek & Theorell (1990)
psycho-social stressors in the., work environment, such as quantitative overload,
1 2

qualitative under-load, lack of control and lack of social support, and the interaction of
such conditions, may have harmful effects on an individual's health and well-being.
The term 'work environment' is used in stress research to incorporate psychosocial
dimensions such as employee-employer relations, motivation and advancement, job
demands and social support. The social support means the help that an individual receives
from his/her co-workers, supervisor and colleagues to perform his/her work effectively.
The literature reveals social support as the structure of relationships. Greenhaus and
Parasuraman (1994) maintain it can be divided into two categories such as the work
related social support and the personal social support. The present study deals with work
social support that may come from the work place within organizations including the
supervisor and the co-workers.
Research indicates that people having social support at work are more productive than
people who do not have social support at work (Castilla, 2005). The co-workers provide a
sense of identity, support and friendship to other individuals (Bowler and Brass, 2006).
Lambert (2005) was able to show in his findings that it is the number of management
functions in the work environment which appear to have been the key factor inhibiting
higher productivity. Imtiaz and Ahmad (2010) study on the impact Of Stress On
Employee Productivity, Performance and turnover found many workers express that their
job is prominent source of stress in their life but reduced workload, improve management
and supervision, better pay, benefits, and vacation times can reduce the stress among
employees.
Accordingly Lambert (2005) identifies the management functions to provision of
adequate fringe benefits, supervision, work method and organization. Nwachukwu (1987)
also identified supervision, subordinates, the environment and outcome as the major
variables that influence productivity. In his study on the influence of the work
environment on employee productivity in Nigeria Taiwo (2010) found that only a small
fraction of employees' indicated strict supervision as an approach that would increase
1 3
their productivity levels. Abualrub (2004) in a study of the nurse working environment
found that, perceived social support from co-workers enhance job performance and
decrease job stress. Similarly, it is suggested that supportive management practices are
crucial to achieve high performance (Drach-Zahavy, 2004).
Another related aspect of social support is communication defined as the transmission of
meaning from one person to another or many people, verbally or non-verbally. Chen et
al. (2006) found that there are positive relationships between organization
communication, organizational commitment and job performance. Effective
interpersonal communication skills are essential for social interaction, building and
maintenance of relationships. Poor communication skills can cause irrevocable damage to
relationships; affecting productivity, satisfaction, performance, morale, trust, respect,
self confidence and even physical health (Matin et al., 2010).
Backhouse and Drew (1992) discovered that 80 per cent of meetings between colleagues
occur spontaneously - when, for example, they encounter each other by chance in a
corridor or the staff canteen. Although communication is not the same as productivity,
organisations often assume that the former promotes the latter. Collaborative learning can
have a more positive effect than individual learning on deep learning of complex
cognitive tasks (Kirschner et al., 2009) and according to Strubler and York (2007)
collaboration can lead to an enhancement of productivity.
2.5 Fringe Benefits and Employee Productivity
A study conducted by Ellickson and Logsdon (2002) reflected that job satisfaction of
public sector employees was significantly influenced by perceptions of employee
satisfaction in terms of pay, promotional opportunities, relationships with supervisors,
employees' performance management systems and fringe benefits. Taiwo (2010) notes
that both management and workers of enterprises are less considerate of work
environment as having a great influence on productivity of workers as resulting from
1 4
workers' negative attitude to work while the workers' view of low productivity may
stem from poor pay system, absence of fringe benefits, inappropriate leadership style,
wrong job location and unfavorable organizational change.
Taiwo (2010) study on the influence of work environment on workers' productivity
found factors in the internal work environment particularly; the job related pressures also
have their negative effect on labour productivity. Coupled with these are the human
factors, namely, the worker's relationship with management and, or co-workers, the
level of fringe benefits particularly the non-cash benefits, as well as factors associated
with the workers' place of residents.
2.6 Summary
Job performance is the result of three factors: skill, effort and the nature of work
conditions. The skills include knowledge, abilities and competencies the employee brings
to the job; effort is the degree of motivation the employee puts forth toward getting the
job done and the nature of work conditions is the degree of accommodation of these
conditions in facilitating the employee's productivity (Kazmi et al., 2008). Conducive
work environment including friendly human resource policies may enhance employee
productivity, organizational commitment and overall performance (Chiang & Birtch,
2010).
The literature reviewed suggests the work environment can be described in terms of
physical and behavioral components. These components can further be divided in the
form of different independent variables. Office environment can be described in terms
ot physical and behavioral components. These components can further be divided in
the form of different independent variables. Stallworth and Kleiner (1996) argue that
increasingly an organization's physical layout is designed around employee needs in
order to maximize productivity and satisfaction.
1 5
There are also several definitions of productivity in the reviewed literature. For instance
Rolloos (1997) defined the productivity as that which people can produce with the least
effort. Productivity is also defined by Sutermeister (1976) as output per employee hour,
quality considered. Productivity is a ratio to measure how well an organization (or
individual, industry, country) converts input resources (labour, materials, machines etc.)
into goods and services. Another proxy to measure productivity involves considering
performance increase as when there is less absenteeism, fewer employee leaving early
and less breaks; whereas increase in performance can be measured by the number of units
produced per employee per hour.
2.7 Theoretical Framework
The following section draws on theoretical models that have been used in the study of the
work environment and its impact to employees' productivity. The research adopted the
social exchange theory while making a case for the person - fit environment theory
which has also been used to explain and discuss the work environment in organizations.
2.7.1 Social Exchange Theory
Social Exchange Theory (SET) is among the most influential conceptual paradigms for
understanding workplace behavior. Its venerable roots can be traced back to the 1920s
(Malinowski, 1922; Mauss, 1925), bridging such disciplines as anthropology (Firth,
1967; Sahlins, 1972), social psychology (Gouldner, 1960; Homans, 1958; Thibault &
Kelley, 1959), and sociology (Blau, 1964). Social exchange involves a series of
interactions that generate obligations (Emerson, 1976). These interactions are usually
seen as interdependent and contingent on the actions of another person.
One ot the basic tenets of SET is that relationships evolve over time into trusting, loyal,
and mutual commitments. To do so, parties must abide by certain "rules" of exchange.
Rules of exchange form a "normative definition of the situation that forms among or is
adopted by the participants in an exchange relation" (Emerson, 1976). The study borrows
1 6
from contemporary management research; the aspect of SET that has garnered by far the
most research attention has been the notion of workplace relationships (Shore, Tetrick, &
Barksdale, 1999; Shore et al., 2004). Social exchange relationships evolve when
employers "take care of employees," which thereby creating beneficial consequences.
This implies that the social exchange relationship is a mediator or intervening variable;
advantageous and fair transactions between strong relationships and these relationships
produce effective work behavior and positive employee attitudes.
The general presumption is that workers can form distinguish-able social exchange
relationships, however operationalized, with their immediate supervisor (Liden et al.,
1997), coworkers (Deckop, Cirka, & Andersson, 2003; Flynn, 2003), employing
organizations (Moorman, Blakely & Niehoff, 1998) these relationships have an impact on
employee behaviour. Individuals (employees) return the benefits they receive; they are
likely to match goodwill and helpfulness toward the party with whom they have a social
exchange relationship (Masterson, Lewis, Goldman & Taylor, 2000). Literature reviewed
exhibits different models used in reference to the social exchange theory but for the scope
of the study the researcher adopts the perceived organizational support and leader-
member exchange model and the supervisory support model. The social exchange
therefore is relevant for the study as it provide a basis for the work environment influence
to employee job performance, productivity while reducing instance of absenteeism. The
models described below provide a theoretical guidance and understanding of the study
phenomenon.
Perceived organizational support has long been conceptualized in SET terms
(Eisenberger et al., 1986; Eisenberger et al., 1990; Eisenberger et al., 2002). The benefits
of perceived organizational support often are understood in reciprocal terms—an
employee who sees the employer as supportive is likely to return the gesture. When
perceived organizational support is high, workers are (under some conditions) more
likely to engage in organizational citizenship behavior (Lynch, Eisenberger, & Armeli,
1999; Moorman et al., 1998), higher job performance (Eisenbergeret al., 2001) and
1 7
reduced absenteeism (Eisenberger et al., 1986). Adding supervisory support which posits
that support leads to commitment raises interest in a supervisory focus as a manifestation
of the exchange process. Although evidence is sparse, this dynamic does seem likely.
Supervisory support and perceived organizational support are consistently related.
2.7.2 Person-Environment Fit Theory
One of the prominent models used in the psychosocial research to explain illnesses
related to working conditions is the Person-Environment Fit (PE fit) model that was
developed at the beginning of the 1970's. The Person - Environment fit theory was
developed among others by French and colleagues (French & R. Kahn, 1962; French et
al., 1974) through later developments and refinements by Caplan (1983, 1987), Harrison
(1978, 1985), and Edwards, 1996; Edwards & Cooper, 1990).
This model concerns the interaction between the individual and his/her environment
where it is assumed strain arises when there is a gap between personal motives (e.g.,
involvement, economic benefit and self-development) and work feedback, or between job
demands (e.g., work load and complexity) and the individual's ability to deal with these
requirements.
The core premise of Person -Environment fit theory is that stress arises not from the
person or environment separately, but rather by their fit or congruence with one another.
According to Yang, Che & Spector, 2008) strain increases when there is a misfit in the
interaction between people and their work environment. The individual's perceived well-
being is maximized when the actual job characteristics are aligned with his/her
preterences. The Person - Fit model emphasizes the need for a good fit between a
person's abilities, skills and degree of control—or decision latitude—and the work
environment's demands, complexity, expectations and challenges. An imbalance in either
direction (too many skills, not enough demands, or too many demands and insufficient
control) generates stress Czikszentmihalyi (1990).
i
1 8
According to Person-Environment fit theory, subjective P-E misfit leads to two sets of
outcomes. One set of outcomes comprises psychological, physical, and behavioral
strains, defined as deviations from normal functioning (Caplan et al., 1980; Harrison,
1978). This implies that an individual well being is compromised when there is a
mismatch between the person and the environment and will inversely have an impact on
their productivity. For instance, sick off days may reduce the output of employee and thus
have an effect on the performance of their duties. Conversely, sustained good Person -
Environment fit can produce positive health outcomes (Edwards & Cooper, 1988;
Harrison, 1978; 1985).
A second set of outcomes involves efforts to resolve Person - Environment misfit is the
coping mechanism. Coping entails efforts to improve objective P-E fit, either by
changing the objective person (i.e., adaptation) or the objective environment (i.e.,
environmental mastery) (French et al., 1974). For example, a person experiencing excess
work demands may seek training to enhance his or her abilities or attempt to negotiate a
decreased work load with his or her supervisor (Harrison, 1978). This implies the
importance of the social support that is available within the work environment for the
employee. Communication becomes an integral part of the working environment as it
provides the opportunity for workers to interact with their supervisors and co-workers.
The Person - Environment Fit theory presents a unique opportunity for the present study
to investigate the different variables of the work environment and how this influence
employee productivity. The theory is the most applicable as it discusses the interaction
between the person and the environment and the strategies that employees deal with a
positive of negative working environment.
2.8 Conceptual Framework Description
Figure 1 represents the conceptual framework of the study where the independent
variables comprise of the physical work environment, behavioural work environment
components and the office ergonomics component and their influence on the dependent
1 9
variable which is employee productivity. The intervening variables of the study are age
and gender of the employees along with the organizational culture of the organ under
study which is the University of Nairobi. The conceptual framework is developed from
the reviewed literature in this section.
2.9 Summary and Gaps in the Literature Review
The researcher undertook an extensive literature review of published non-published
journals and articles related to the concept of the work environment; this material was
related to the concept of employee productivity. The researcher identified the different
factors of the work environment that have an effect on employee productivity such as the
physical environment, peer and supervisor support in the workplace and fringe benefits
influence on job performance vis - a - vis employee productivity. The literature exhibits
extensive research on work environment for instance in the banking sector (Leblebici,
2012), academic staff research productivity (Usang et al., 2007), work environment of IT
consultants (Wallgren, 2011) and petroleum and gas industry (Taiwo, 2010). The
researcher also found that there has been no research on the work environment on
administrative employees in the university work environment.
2 0
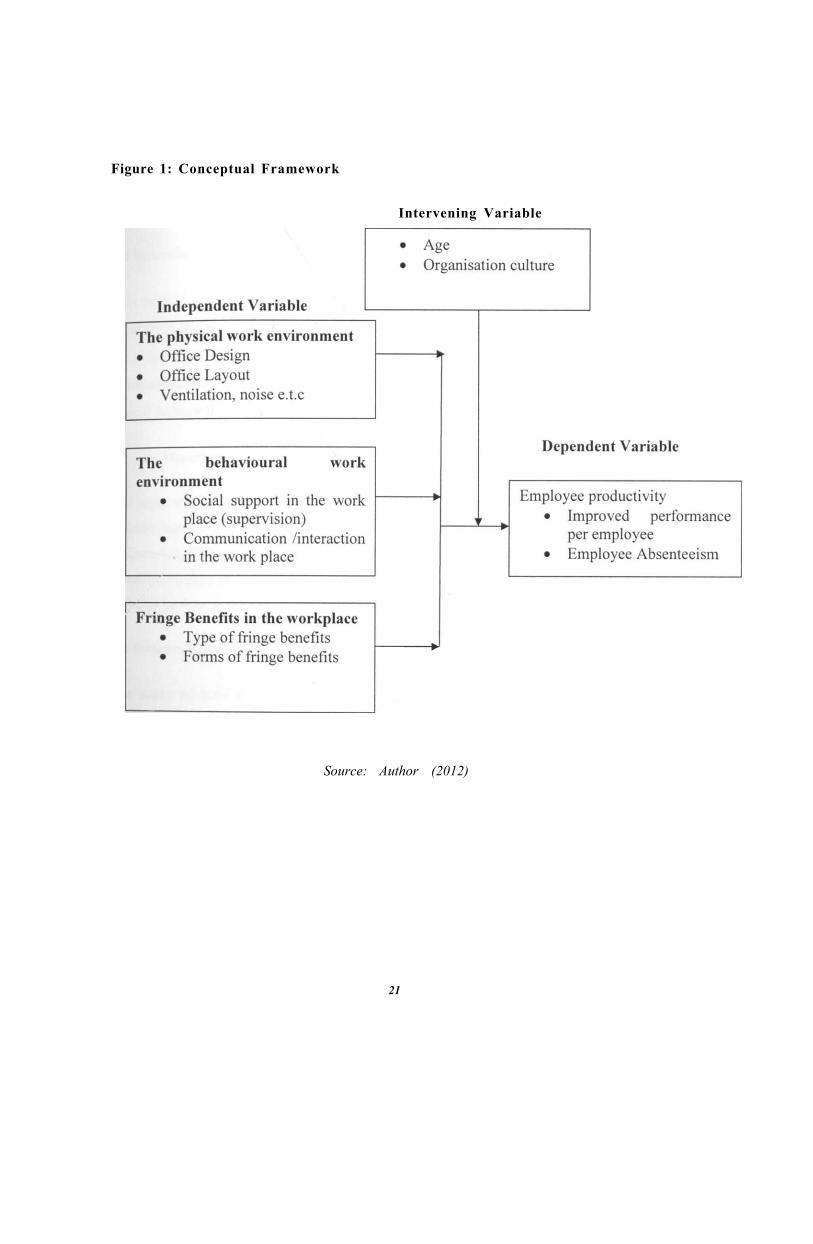
Figure 1: Conceptual Framework
Intervening Variable
Source: Author (2012)
21
CHAPTER THREE
RESEARCH METHODOLOGY
3.1 Introduction
This section of the study encompasses the different approaches which the researcher used
to address the methodological issues. The chapter is presented in the different topics of
the research design, target population, sampling procedures and sample, data collection
instruments, data collection procedures, validity and reliability of the study instruments,
ethical considerations and data analysis techniques used for the study.
3.2 Site Description
The study will be conducted in administrative off ices found in six colleges of the University of
Nairobi namely:- the College of Humanit ies and Social Sciences, College of Architecture and
Engineering, College of Biological and Physical Sciences, College of Agriculture and Veterinary
Sciences, College of Education and external Studies and College of Health Sciences. The study
will also be done in the Central Administration off ices and also the Students ' Welfare Authority.
3.3 Research Design
The study adopted the Descriptive Study design; this allowed the researcher to identify
the state of the study problem and to represent it in a temporary determined moment, but
they do not establish causal inferences. Descriptive studies generally use the survey as
methodology, in which the most important thing is the correct elaboration of questions, as
much in quantity as in quality. Samples of the population are selected to find the
incidence, distribution and relative interrelations among social and psychological
variables. Descriptive research allows the researcher to generate new knowledge of the
subject by describing characteristics of persons, situation and the frequency with which
certain phenomena occur (Burns & Grove, 1993).
2 2
3.4 Target Population
The target population of the study was the administrative level employees of the
University of Nairobi. The study targeted employees within the senior - administrative
assistants and administrative assistant cadre of administrative employees who are 161 in
total. The justification for sampling these employees is that they are involved in the day -
to - day administrative operations within the university. The unit of analysis for the study
was the composite environment in which administrative employees work and this is the
university of Nairobi and the units of observation are the administrative employees from
whom the researcher will acquire data as described in Mugenda and Mugenda (1999).
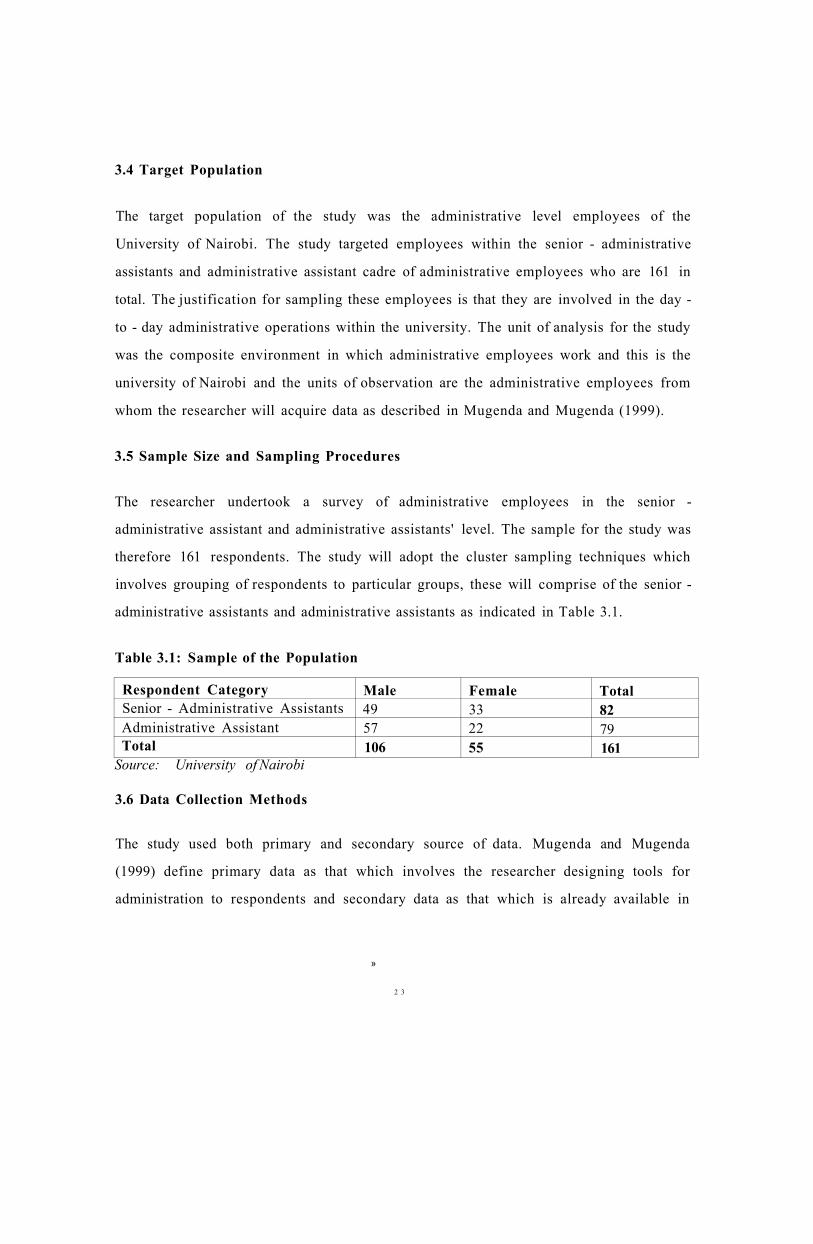
3.5 Sample Size and Sampling Procedures
The researcher undertook a survey of administrative employees in the senior -
administrative assistant and administrative assistants' level. The sample for the study was
therefore 161 respondents. The study will adopt the cluster sampling techniques which
involves grouping of respondents to particular groups, these will comprise of the senior -
administrative assistants and administrative assistants as indicated in Table 3.1.
Table 3.1: Sample of the Population
Respondent Category Male Female Total Senior - Administrative Assistants 49 33 82 Administrative Assistant 57 22 79 Total 106 55 161
Source: University of Nairobi
3.6 Data Collection Methods
The study used both primary and secondary source of data. Mugenda and Mugenda
(1999) define primary data as that which involves the researcher designing tools for
administration to respondents and secondary data as that which is already available in
»
2 3
published or non - published existing material. Inorder to gather primary data for the
study the researcher will seek to use survey and observation methods.
3.6.1 Survey
A survey questionnaire is a popular means of collecting different types of data in a
research problem (Jones, 1985). It is widely used in research to obtain information about
certain conditions and practices, and to inquire into opinions and attitudes of individuals
or groups (Koul, 1986). The researcher designed the questionnaire with guidance from
the university supervisor and in a manner which acquired information from respondents
to answer the research objectives and research questions. The questionnaire included the
respondent background section inorder to determine the demographics of the sample and
relevant sections to address the research objectives. The researcher used self -
administration process of distribution as this assisted in providing clarity and
completeness of the instrument from the respondents.
3.6.2 Key Informant Interview
The study used key informant interviews for data collection. In-depth interviews are
useful when you want detailed information about a person's thoughts and behaviors or
want to explore new issues in depth. The primary advantage of in-depth interviews is that
they provide much more detailed information than what is available through other data
collection methods, such as surveys. The researcher used this information to complement
data gathered from the survey instrument. The researcher involved the Senior
Administrative Registrar of the University of Nairobi in an interview to provide
information on his experience with employees on issues regarding the work environment;
employee reward incentives, absenteeism and performance trends. The researcher
developed a key informant guide to facilitate the process of the interview.
2 4

3.6.3 Secondary Data
Secondary data refers to data that was collected prior to the present study and for other
purposes such as reports or studies on the phenomenon under study. The researcher used
published and unpublished material on the work environment on productivity from
newspaper articles, magazines or journals. Organizational records were also used; for
instance records on annual leave and sick off days complemented primary data collected.
3.7 Validity and Reliability of Research Instruments
Validity refers to the degree to which an instrument measures what it is supposed to be
measuring (Polit & Hungler, 1989). The validity of the research instrument was
established by constant interaction with the university supervisor and academic peers to
ascertain whether identified constructs for the questionnaire elicit the required
information from respondents. Polit and Hungler (1989) define reliability of an
instrument as the clarity, stability and consistency and accuracy of a measuring tool.
There are different methods of establishing the reliability of an instrument. Internal
consistency reliability refers to the extent to which all the subparts of an instrument will
measure the attributes, the researcher will use the Chronbach's Alpha test to test the
internal consistency of the questionnaire instrument. This involved undertaking a pilot
study; Burns and Grove (2003) define a pilot study as a smaller version of the proposed
study which is conducted inorder to refine the methodology adopted in a study. The pilot
study is used to help to identify possible problems in the proposed study and allows the
researcher to revise the methods and instruments before the actual study (De Vos et al.
2005).
3.8 Ethical Considerations
Social investigations require informed consent. Before initiating the study the
investigator and the subject created an agreement that clarifies the obligations and
responsibilities for each of them. The nature of the investigation was carefully explained.
2 5
The subjects were asked to express their acceptance of participating and the researcher
guaranteed the confidentiality and the welfare of the participants. The researcher also
guaranteed the respondents that their anonymity would be safeguarded and that the
information they provide will only be used for academic purposes.
3.9 Data Analysis and Presentation
According to De Vos et al., (2005) data analysis refers to the systematic organization and
synthesis of research data, and the testing of research questions. Data analysis gives
meaning to data collected during research. The data analysis involved several processes
which included checking for the completeness of the data collected, coding and data entry
into a computer package. The researcher used the Statistical Package for Social Scientists
(SPSS) to undertake the data analysis. Descriptive statistics were used for summarizing
the collected data according to the frequency and percentages and interpretations were
complemented by the researcher's own contributions.
»
2 6
CHAPTER FOUR
DATA ANALYSIS AND INTERPRETATION
4.1 Introduction
This chapter focuses on the findings of the study which are presented in tables, charts and
graphs of responses from the sample of the study. The section is presented in subtopics
related to three study objectives of the study and a description of the socio - demographic
characteristics of the study respondents.
4.2 Socio - Demographic Data
The purpose of the study was to identify the influence of the work environment on the
productivity of administrative staff in the University of Nairobi. The study was guided by
specific objectives which include; to identify influence of physical work environment on
productivity among administrative employees in the University of Nairobi; to assess the
relationship between the office ergonomics and employee productivity among
administrative staff in the University of Nairobi; to establish the extent that job - related
factors affect employee productivity among administrative staff at the University of
Nairobi and to recommend ways of improving work environment to increase employee
productivity among administrative staff at the university of Nairobi.
The sample of the middle level administrators comprised of 136 respondents after the test
- retest reliability test where the 15 percent of the sample used was not included in the
final data collection exercise. A total of 93 complete questionnaires were collected and
satisfied the criteria for data analysis and these accounted for 67 percent response rate
which is acceptable in social research. In regard to the variable of gender 60.2 percent of
the respondents were females compared to their male counterparts who accounted for
39.8 percent as shown in Table 4.1.
2 7
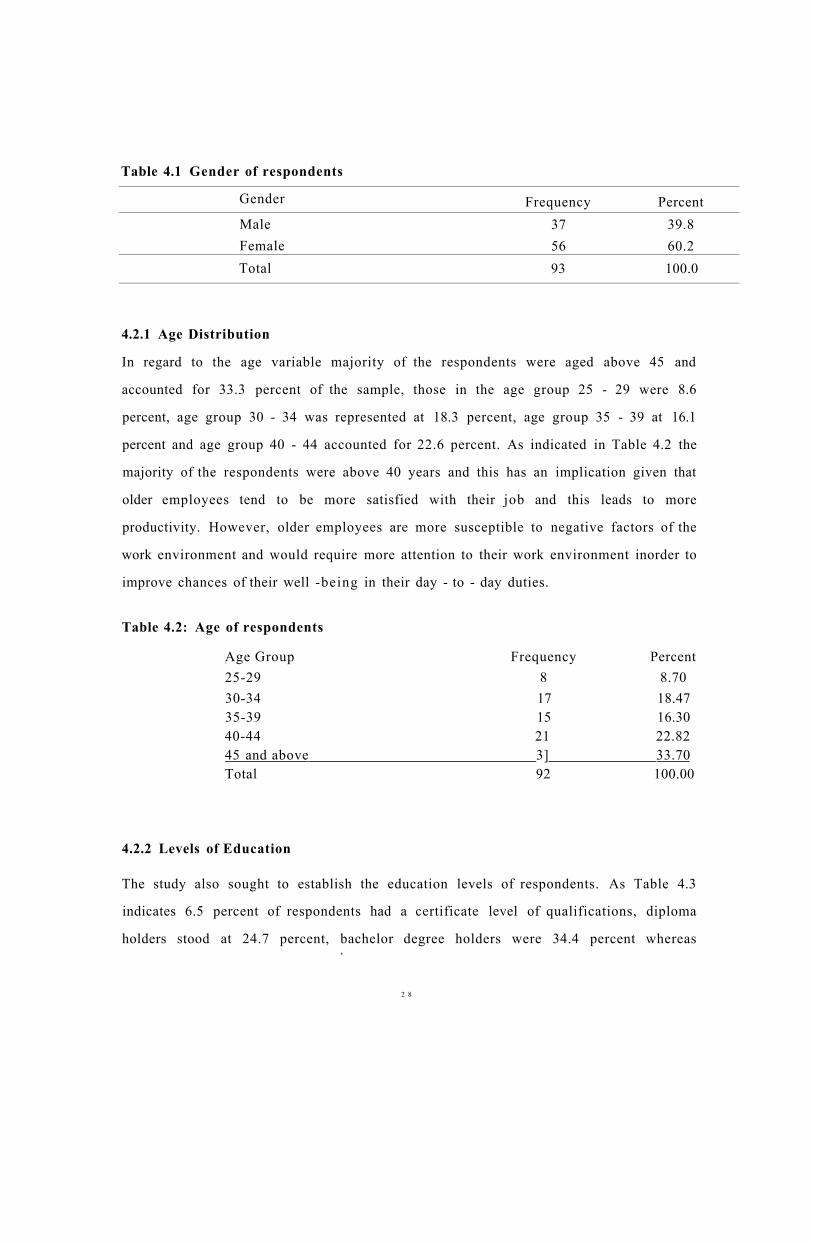
Table 4.1 Gender of respondents
Gender Frequency Percent Male 37 39.8 Female 56 60.2 Total 93 100.0
4.2.1 Age Distribution
In regard to the age variable majority of the respondents were aged above 45 and
accounted for 33.3 percent of the sample, those in the age group 25 - 29 were 8.6
percent, age group 30 - 34 was represented at 18.3 percent, age group 35 - 39 at 16.1
percent and age group 40 - 44 accounted for 22.6 percent. As indicated in Table 4.2 the
majority of the respondents were above 40 years and this has an implication given that
older employees tend to be more satisfied with their job and this leads to more
productivity. However, older employees are more susceptible to negative factors of the
work environment and would require more attention to their work environment inorder to
improve chances of their well -being in their day - to - day duties.
Table 4.2: Age of respondents
Age Group Frequency Percent 25-29 8 8.70 30-34 17 18.47 35-39 15 16.30 40-44 21 22.82 45 and above 3] 33.70 Total 92 100.00
4.2.2 Levels of Education
The study also sought to establish the education levels of respondents. As Table 4.3
indicates 6.5 percent of respondents had a certificate level of qualifications, diploma
holders stood at 24.7 percent, bachelor degree holders were 34.4 percent whereas *
2 8

postgraduate holders were represented at 34.4 percent. Key Informants reported that
Administrative staff are required by Policy on Recruitment & Training to have at least a
first degree. They went on to say that those with a Diploma or a certificate are the olders
Administrators who were employed when a degree was no a requirement to be recruited
as an Administrator.
Table 4.3: Level of Education among Respondents
Level of Education Frequency Percent
Certificate 6 6.5 Diploma 23 24.7 Bachelor Degree 32 34.4 Postgraduate 32 34.4 Total 93 100.0
2 9

4.2.3 Administrative Level
Level of administrative staff was sought among the demographic characteristics of
employees where Senior Administrative Staff accounted for 38.7 percent of respondents
compared to the Administrative Assistants were 36.6 percent. Respondents who marked
not applicable in the analysis were 6.4 percent while those who were missing responses
in the questionnaire item were 17.2 percent as shown in Table 4.4. Key Inforamnts said
that Administrative Assistants at grade CD level in the University of Nairobi cadre
system are the lowest cadre in the administrative ladder. The Recruitment & Training
Policy regards the grade CD as a training grade for Administrators. Senior Administrative
Assistants at grade EF are normally promoted fro the lower grade CD grade after being in
the grade for at least three years. They do carry higher responsibilities like the Faculty
Administrative units under the headship of a Dean of a Faculty. Those indicated in table
4.4 as not applicable are mainly drawn from the Halls Department, who although they are
designated as Halls Officers, are nonetheless administrative officers doing halls
administration work.
Table 4.4: Administrative level of employees
Position in administration Frequency Percent Senior Administrative Assistant 37 48.05 Administrative Assistant 34 44.15 Not Applicable 3 3.89 Total 77 100.00
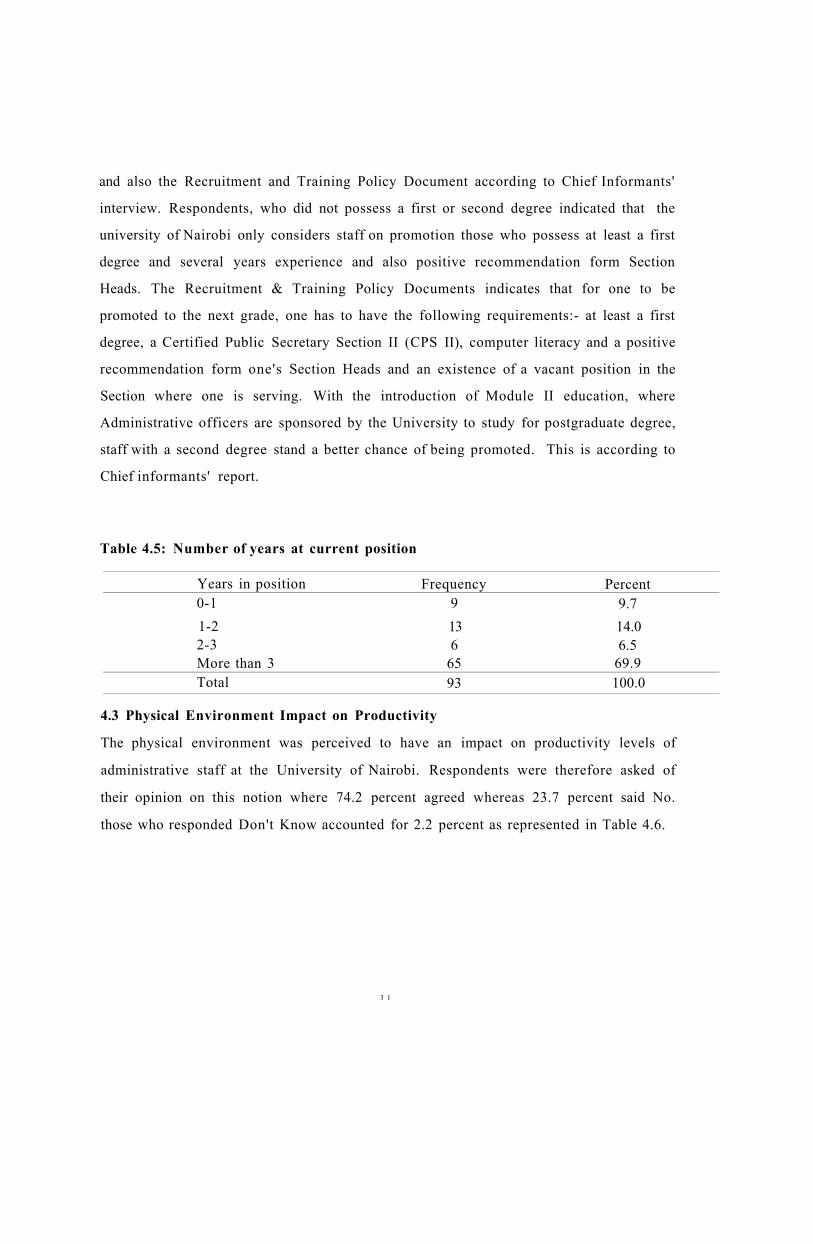
4.2.4 Duration in Current Position
Majority of the sampled university of Nairobi staff in their current positions for less than
1 year accounted for 9.7 percent, those who had stayed for 1 - 2 years were 14.0 percent,
those with duration of 2 - 3 years were 6.5 percent and those who were in their current
positions for more than three years accounted for 69.9 percent as indicated in Table 4.5.
The large percentage of Administrative Officers who have served in for at least three
years in one grade could be because of several reasons as advanced by the respondents
3 0
and also the Recruitment and Training Policy Document according to Chief Informants'
interview. Respondents, who did not possess a first or second degree indicated that the
university of Nairobi only considers staff on promotion those who possess at least a first
degree and several years experience and also positive recommendation form Section
Heads. The Recruitment & Training Policy Documents indicates that for one to be
promoted to the next grade, one has to have the following requirements:- at least a first
degree, a Certified Public Secretary Section II (CPS II), computer literacy and a positive
recommendation form one's Section Heads and an existence of a vacant position in the
Section where one is serving. With the introduction of Module II education, where
Administrative officers are sponsored by the University to study for postgraduate degree,
staff with a second degree stand a better chance of being promoted. This is according to
Chief informants' report.
Table 4.5: Number of years at current position
Years in position Frequency Percent 0-1 9 9.7 1-2 13 14.0 2-3 6 6.5 More than 3 65 69.9 Total 93 100.0
4.3 Physical Environment Impact on Productivity
The physical environment was perceived to have an impact on productivity levels of
administrative staff at the University of Nairobi. Respondents were therefore asked of
their opinion on this notion where 74.2 percent agreed whereas 23.7 percent said No.
those who responded Don't Know accounted for 2.2 percent as represented in Table 4.6.
3 1
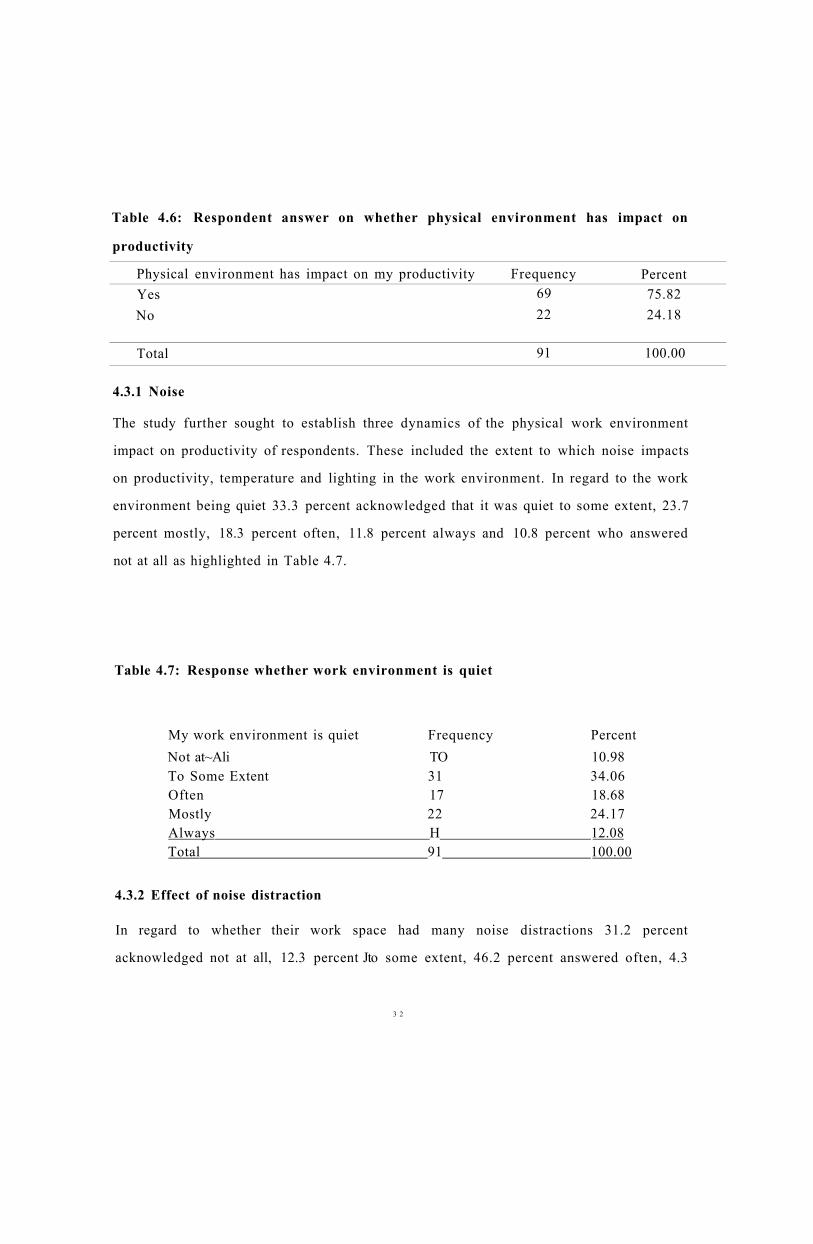
Table 4.6: Respondent answer on whether physical environment has impact on
productivity
Physical environment has impact on my productivity Frequency Percent Yes 69 75.82 No 22 24.18
Total 91 100.00
4.3.1 Noise
The study further sought to establish three dynamics of the physical work environment
impact on productivity of respondents. These included the extent to which noise impacts
on productivity, temperature and lighting in the work environment. In regard to the work
environment being quiet 33.3 percent acknowledged that it was quiet to some extent, 23.7
percent mostly, 18.3 percent often, 11.8 percent always and 10.8 percent who answered
not at all as highlighted in Table 4.7.
Table 4.7: Response whether work environment is quiet
My work environment is quiet Frequency Percent Not at~Ali TO 10.98 To Some Extent 31 34.06 Often 17 18.68 Mostly 22 24.17 Always H 12.08 Total 91 100.00
4.3.2 Effect of noise distraction
In regard to whether their work space had many noise distractions 31.2 percent
acknowledged not at all, 12.3 percent Jto some extent, 46.2 percent answered often, 4.3
3 2

percent said most of the time and 5.4 percent responded always as shown in Table 4.8.
Key Informants acknowledged that noise from co-workers was the most disruptive type of
noise and the literature states that this type of noise is also seen as the most stressful. Navai
& Veitch (2003) state that co-worker's conversations and music is seen to be the most
stressful type of noise because it is uncontrollable. This was observed in open plan offices
where there was an element of closed offices but there was room for sound to travel to
respondents' work space. This corresponds with the research that states that open plan
office spaces tend to be noisier because of the lack of barriers. In many instances especially
in the Central Administration offices, Administrative Officers worked in Pre-fabricated
offices that were next to each other. One could easily hear noises clearly from the next
office. This tends to disrupt easily. This is according to Key Informants' report.
Table 4.8: Response whether workspace has many noise distractions
Whether workspace has many distractions Frequency Percent Not at All 29 31.2 To Some Extent 12 12.3 Often 43 46.2 Most of the time 4 4.3 Always 5 5.4 Total 93 100.0
4.3.3 Temperature
Respondents were asked to what extent their room temperature affected their level of
productivity where 22.6 percent said that this had no effect on their productivity, 10.8
percent acknowledged it had a positive effect, 16.1 percent accepted that it had a normal
effect, 7.5 percent quite a good effect, 16.1 percent bad effect with 1.1 percent as
indicated in Table 4.9. A share of the respondents 41.9 percent indicated that the room
temperature in their work environment affected their productivity which agree with the
findings of Seppanen et al (2006) who argue that indoor temperature is one of the
fundamental characteristics of the indoor environment. Floors that were cemented and that
3 3
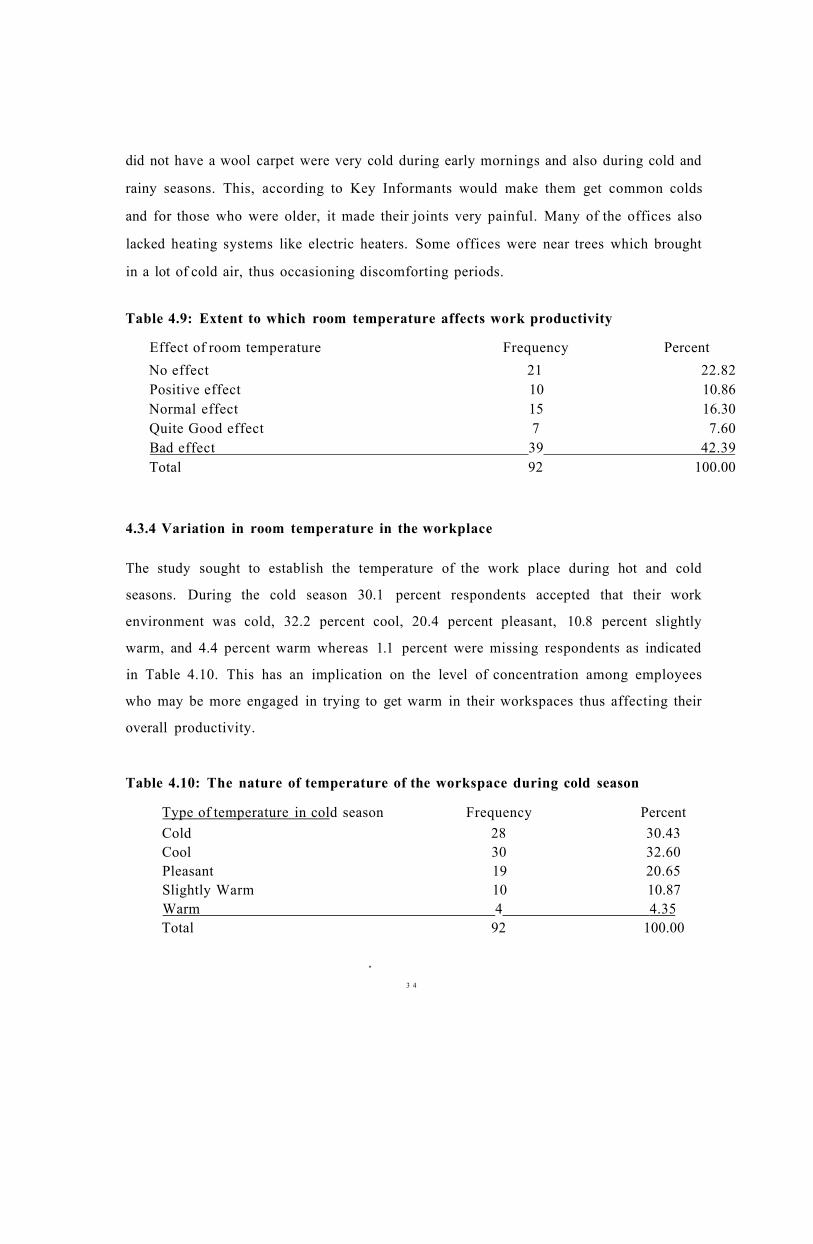
did not have a wool carpet were very cold during early mornings and also during cold and
rainy seasons. This, according to Key Informants would make them get common colds
and for those who were older, it made their joints very painful. Many of the offices also
lacked heating systems like electric heaters. Some offices were near trees which brought
in a lot of cold air, thus occasioning discomforting periods.
Table 4.9: Extent to which room temperature affects work productivity
Effect of room temperature Frequency Percent No effect 21 22.82 Positive effect 10 10.86 Normal effect 15 16.30 Quite Good effect 7 7.60 Bad effect 39 42.39 Total 92 100.00
4.3.4 Variation in room temperature in the workplace
The study sought to establish the temperature of the work place during hot and cold
seasons. During the cold season 30.1 percent respondents accepted that their work
environment was cold, 32.2 percent cool, 20.4 percent pleasant, 10.8 percent slightly
warm, and 4.4 percent warm whereas 1.1 percent were missing respondents as indicated
in Table 4.10. This has an implication on the level of concentration among employees
who may be more engaged in trying to get warm in their workspaces thus affecting their
overall productivity.
Table 4.10: The nature of temperature of the workspace during cold season
Type of temperature in cold season Frequency Percent Cold 28 30.43 Cool 30 32.60 Pleasant 19 20.65 Slightly Warm 10 10.87 Warm 4 4.35 Total 92 100.00
*
3 4
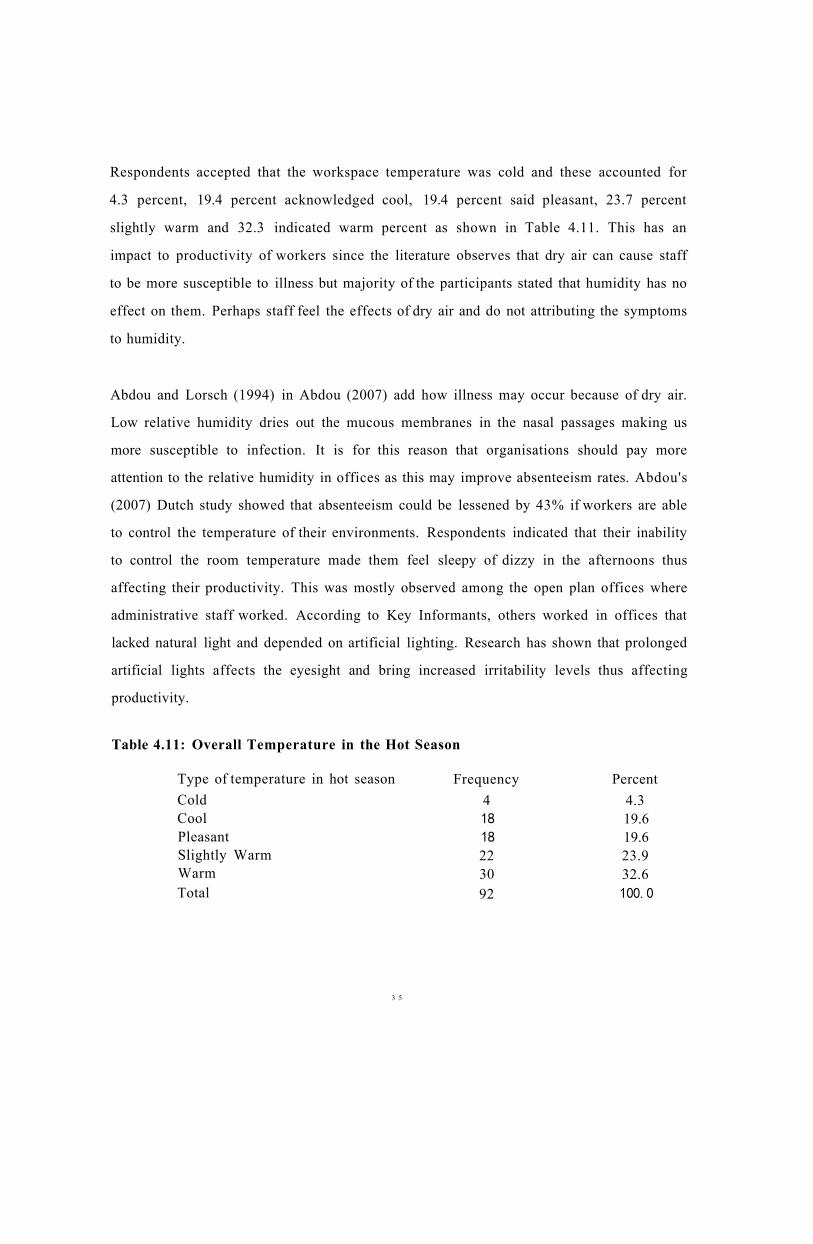
Respondents accepted that the workspace temperature was cold and these accounted for
4.3 percent, 19.4 percent acknowledged cool, 19.4 percent said pleasant, 23.7 percent
slightly warm and 32.3 indicated warm percent as shown in Table 4.11. This has an
impact to productivity of workers since the literature observes that dry air can cause staff
to be more susceptible to illness but majority of the participants stated that humidity has no
effect on them. Perhaps staff feel the effects of dry air and do not attributing the symptoms
to humidity.
Abdou and Lorsch (1994) in Abdou (2007) add how illness may occur because of dry air.
Low relative humidity dries out the mucous membranes in the nasal passages making us
more susceptible to infection. It is for this reason that organisations should pay more
attention to the relative humidity in offices as this may improve absenteeism rates. Abdou's
(2007) Dutch study showed that absenteeism could be lessened by 43% if workers are able
to control the temperature of their environments. Respondents indicated that their inability
to control the room temperature made them feel sleepy of dizzy in the afternoons thus
affecting their productivity. This was mostly observed among the open plan offices where
administrative staff worked. According to Key Informants, others worked in offices that
lacked natural light and depended on artificial lighting. Research has shown that prolonged
artificial lights affects the eyesight and bring increased irritability levels thus affecting
productivity.
Table 4.11: Overall Temperature in the Hot Season
Type of temperature in hot season Frequency Percent Cold Cool
4 18 18 22 30
4.3 19.6 19.6 23.9 32.6
Pleasant Slightly Warm Warm Total 92 100.0
3 5
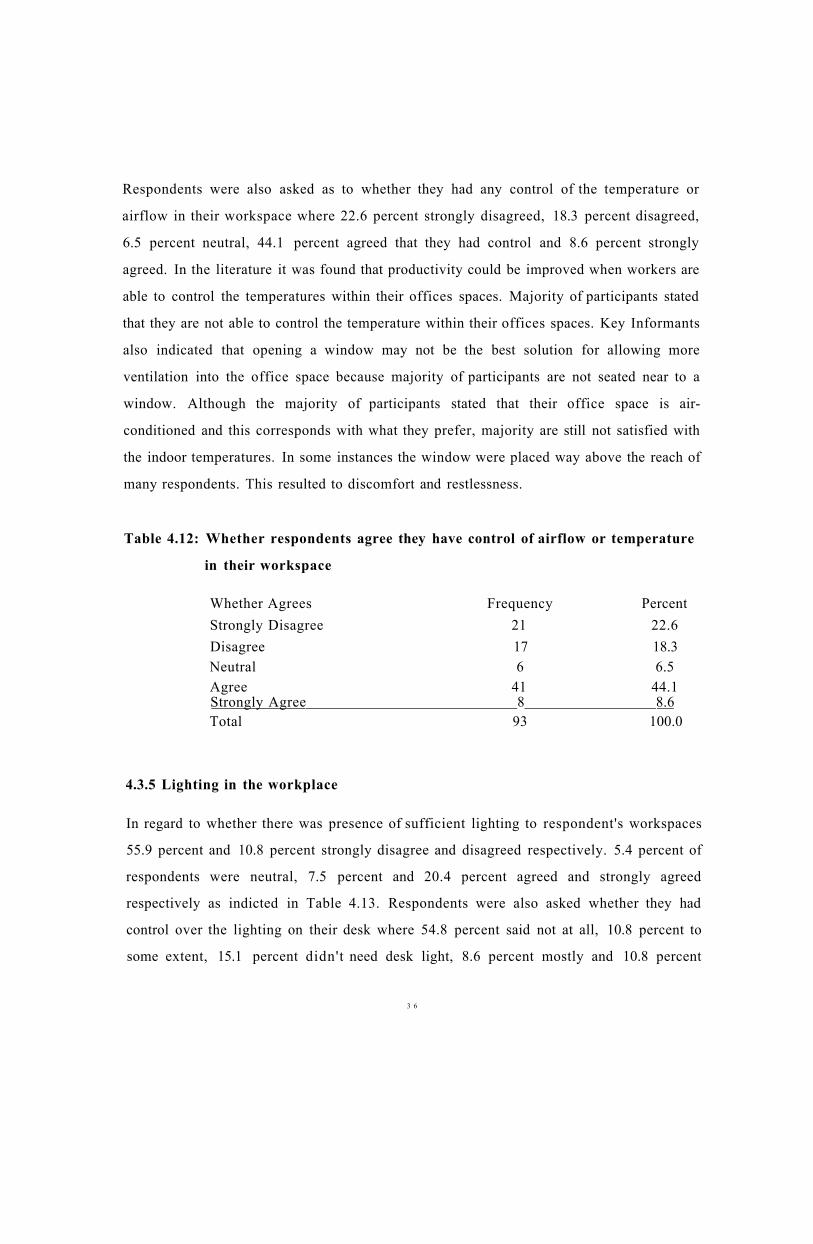
Respondents were also asked as to whether they had any control of the temperature or
airflow in their workspace where 22.6 percent strongly disagreed, 18.3 percent disagreed,
6.5 percent neutral, 44.1 percent agreed that they had control and 8.6 percent strongly
agreed. In the literature it was found that productivity could be improved when workers are
able to control the temperatures within their offices spaces. Majority of participants stated
that they are not able to control the temperature within their offices spaces. Key Informants
also indicated that opening a window may not be the best solution for allowing more
ventilation into the office space because majority of participants are not seated near to a
window. Although the majority of participants stated that their office space is air-
conditioned and this corresponds with what they prefer, majority are still not satisfied with
the indoor temperatures. In some instances the window were placed way above the reach of
many respondents. This resulted to discomfort and restlessness.
Table 4.12: Whether respondents agree they have control of airflow or temperature
in their workspace
Whether Agrees Frequency Percent Strongly Disagree 21 22.6 Disagree 17 18.3 Neutral 6 6.5 Agree 41 44.1 Strongly Agree 8 8.6 Total 93 100.0
4.3.5 Lighting in the workplace
In regard to whether there was presence of sufficient lighting to respondent's workspaces
55.9 percent and 10.8 percent strongly disagree and disagreed respectively. 5.4 percent of
respondents were neutral, 7.5 percent and 20.4 percent agreed and strongly agreed
respectively as indicted in Table 4.13. Respondents were also asked whether they had
control over the lighting on their desk where 54.8 percent said not at all, 10.8 percent to
some extent, 15.1 percent didn't need desk light, 8.6 percent mostly and 10.8 percent
3 6
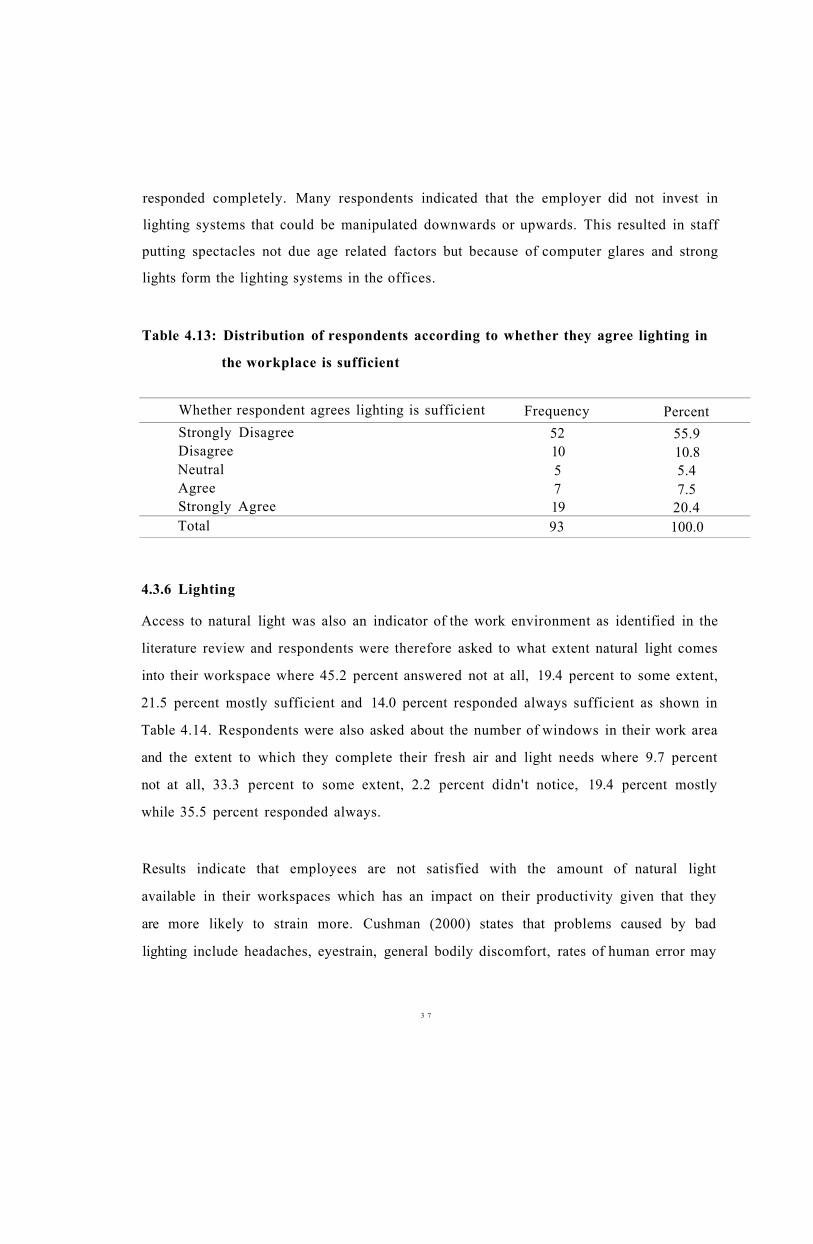
responded completely. Many respondents indicated that the employer did not invest in
lighting systems that could be manipulated downwards or upwards. This resulted in staff
putting spectacles not due age related factors but because of computer glares and strong
lights form the lighting systems in the offices.
Table 4.13: Distribution of respondents according to whether they agree lighting in
the workplace is sufficient
Whether respondent agrees lighting is sufficient Frequency Percent Strongly Disagree 52 55.9 Disagree 10 10.8 Neutral 5 5.4 Agree 7 7.5 Strongly Agree 19 20.4 Total 93 100.0
4.3.6 Lighting
Access to natural light was also an indicator of the work environment as identified in the
literature review and respondents were therefore asked to what extent natural light comes
into their workspace where 45.2 percent answered not at all, 19.4 percent to some extent,
21.5 percent mostly sufficient and 14.0 percent responded always sufficient as shown in
Table 4.14. Respondents were also asked about the number of windows in their work area
and the extent to which they complete their fresh air and light needs where 9.7 percent
not at all, 33.3 percent to some extent, 2.2 percent didn't notice, 19.4 percent mostly
while 35.5 percent responded always.
Results indicate that employees are not satisfied with the amount of natural light
available in their workspaces which has an impact on their productivity given that they
are more likely to strain more. Cushman (2000) states that problems caused by bad
lighting include headaches, eyestrain, general bodily discomfort, rates of human error may
3 7
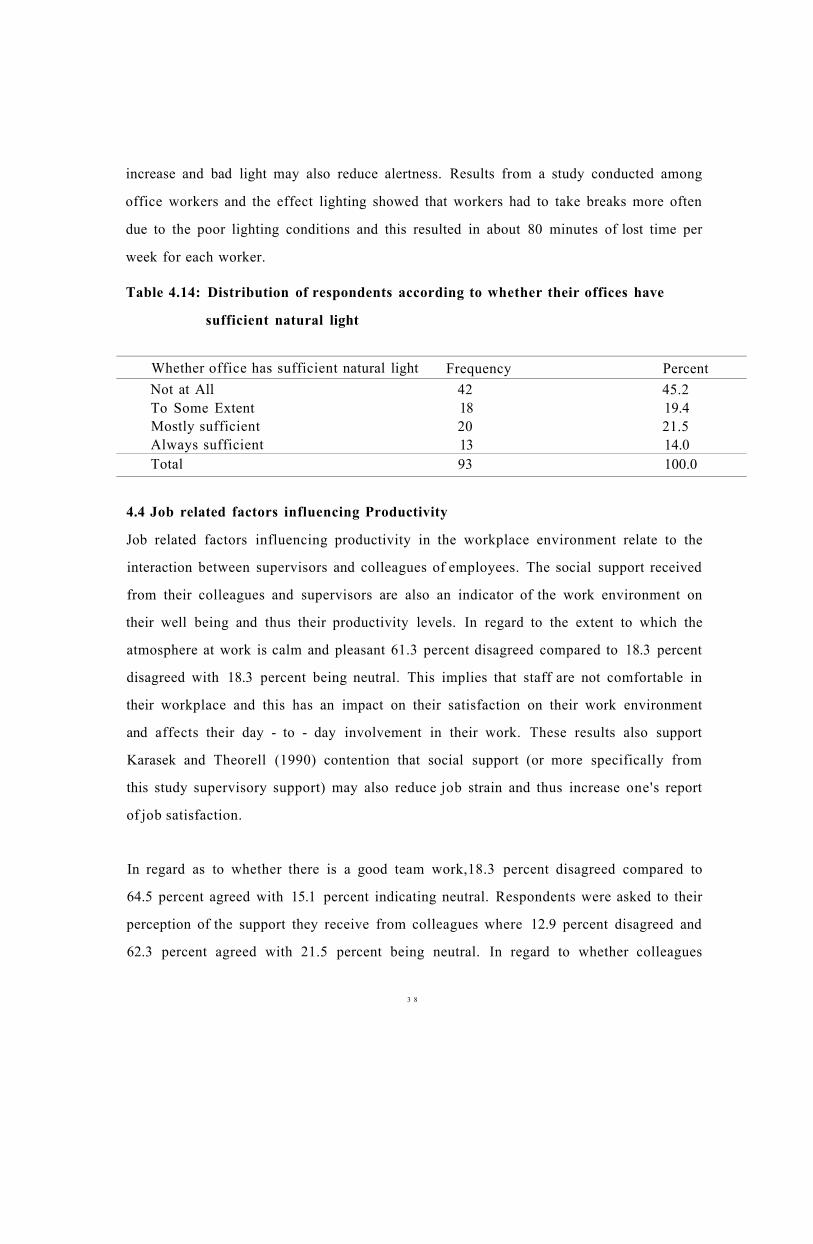
increase and bad light may also reduce alertness. Results from a study conducted among
office workers and the effect lighting showed that workers had to take breaks more often
due to the poor lighting conditions and this resulted in about 80 minutes of lost time per
week for each worker.
Table 4.14: Distribution of respondents according to whether their offices have
sufficient natural light
Whether office has sufficient natural light Frequency Percent Not at All 42 45.2 To Some Extent 18 19.4 Mostly sufficient 20 21.5 Always sufficient 13 14.0 Total 93 100.0
4.4 Job related factors influencing Productivity
Job related factors influencing productivity in the workplace environment relate to the
interaction between supervisors and colleagues of employees. The social support received
from their colleagues and supervisors are also an indicator of the work environment on
their well being and thus their productivity levels. In regard to the extent to which the
atmosphere at work is calm and pleasant 61.3 percent disagreed compared to 18.3 percent
disagreed with 18.3 percent being neutral. This implies that staff are not comfortable in
their workplace and this has an impact on their satisfaction on their work environment
and affects their day - to - day involvement in their work. These results also support
Karasek and Theorell (1990) contention that social support (or more specifically from
this study supervisory support) may also reduce job strain and thus increase one's report
of job satisfaction.
In regard as to whether there is a good team work,18.3 percent disagreed compared to
64.5 percent agreed with 15.1 percent indicating neutral. Respondents were asked to their
perception of the support they receive from colleagues where 12.9 percent disagreed and
62.3 percent agreed with 21.5 percent being neutral. In regard to whether colleagues
3 8

understand that one could have a bad day 22.6 percent disagreed relative to 46.3 percent
who agreed with 25.8 percent neutral.
Key Informants were also asked about their perception of the relationship with their
supervisors to which majority of the respondents 24.8 percent was cordial with 60.3
percent indicating the relationship was poor. In regard to whether supervisor encourages
employees to make recommendations where 58.1 percent disagreed and 14.0 percent
agreed with 25.8 percent being neutral. Findings indicate that the implication of this
perception of relationships with their supervisors would lead to high levels of strain and
burn - out among administrative staff. Savicki and Cooley (1987) work environments
associated with high burnout were those that required adherence to work through
restriction of worker freedom and that deemphasized planning and efficiency. Higher
levels of burnout were also associated with vague job expectations, extensive rules and
regulations, and minimal support of new ideas and procedures
In regard to whether they receive leadership for the type of work performed 16.2 percent
disagreed compared to 50.8 percent who agreed with 21.5 percent neutral. Respondents
were also asked the extent to which they get along with their colleagues where 9.7
percent disagreed with 73.2 percent agreed with 15.1 percent being neutral as indicted in
Table 4.15.
Respondents indicated that support from their supervisors can be indicated in the
following ways:- Positive recommendations in the Staff performance appraisal exercise
done yearly. Supervisors can also show support through recommending frequent in-house
bonding sessions where staff could be allowed to ventilate their frustrations and also in
staff meetings which were free of manipulations by section Heads.
3 9
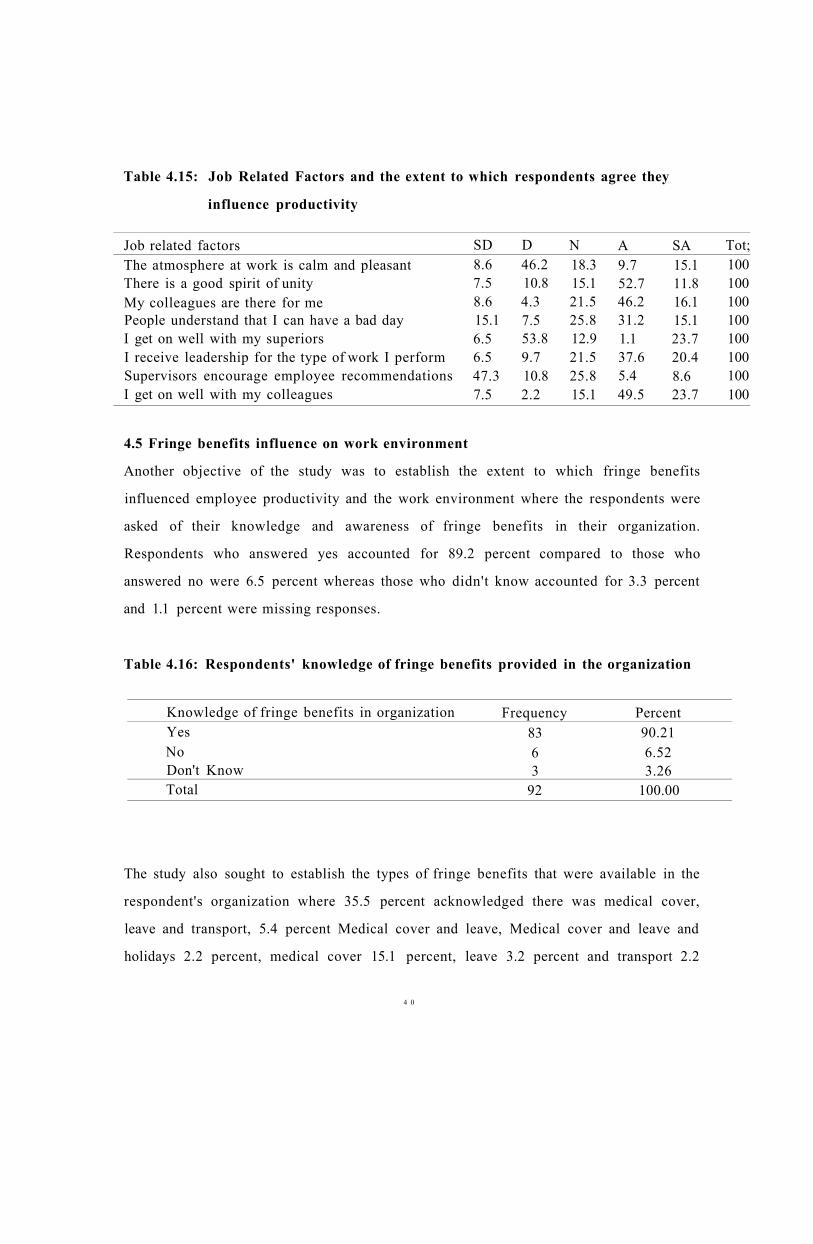
Table 4.15: Job Related Factors and the extent to which respondents agree they
influence productivity
Job related factors SD D N A SA Tot; The atmosphere at work is calm and pleasant 8.6 46.2 18.3 9.7 15.1 100 There is a good spirit of unity 7.5 10.8 15.1 52.7 11.8 100 My colleagues are there for me 8.6 4.3 21.5 46.2 16.1 100 People understand that I can have a bad day 15.1 7.5 25.8 31.2 15.1 100 I get on well with my superiors 6.5 53.8 12.9 1.1 23.7 100 I receive leadership for the type of work I perform 6.5 9.7 21.5 37.6 20.4 100 Supervisors encourage employee recommendations 47.3 10.8 25.8 5.4 8.6 100 I get on well with my colleagues 7.5 2.2 15.1 49.5 23.7 100
4.5 Fringe benefits influence on work environment
Another objective of the study was to establish the extent to which fringe benefits
influenced employee productivity and the work environment where the respondents were
asked of their knowledge and awareness of fringe benefits in their organization.
Respondents who answered yes accounted for 89.2 percent compared to those who
answered no were 6.5 percent whereas those who didn't know accounted for 3.3 percent
and 1.1 percent were missing responses.
Table 4.16: Respondents' knowledge of fringe benefits provided in the organization
Knowledge of fringe benefits in organization Frequency Percent Yes 83 90.21 No 6 6.52 Don't Know 3 3.26 Total 92 100.00
The study also sought to establish the types of fringe benefits that were available in the
respondent's organization where 35.5 percent acknowledged there was medical cover,
leave and transport, 5.4 percent Medical cover and leave, Medical cover and leave and
holidays 2.2 percent, medical cover 15.1 percent, leave 3.2 percent and transport 2.2
4 0
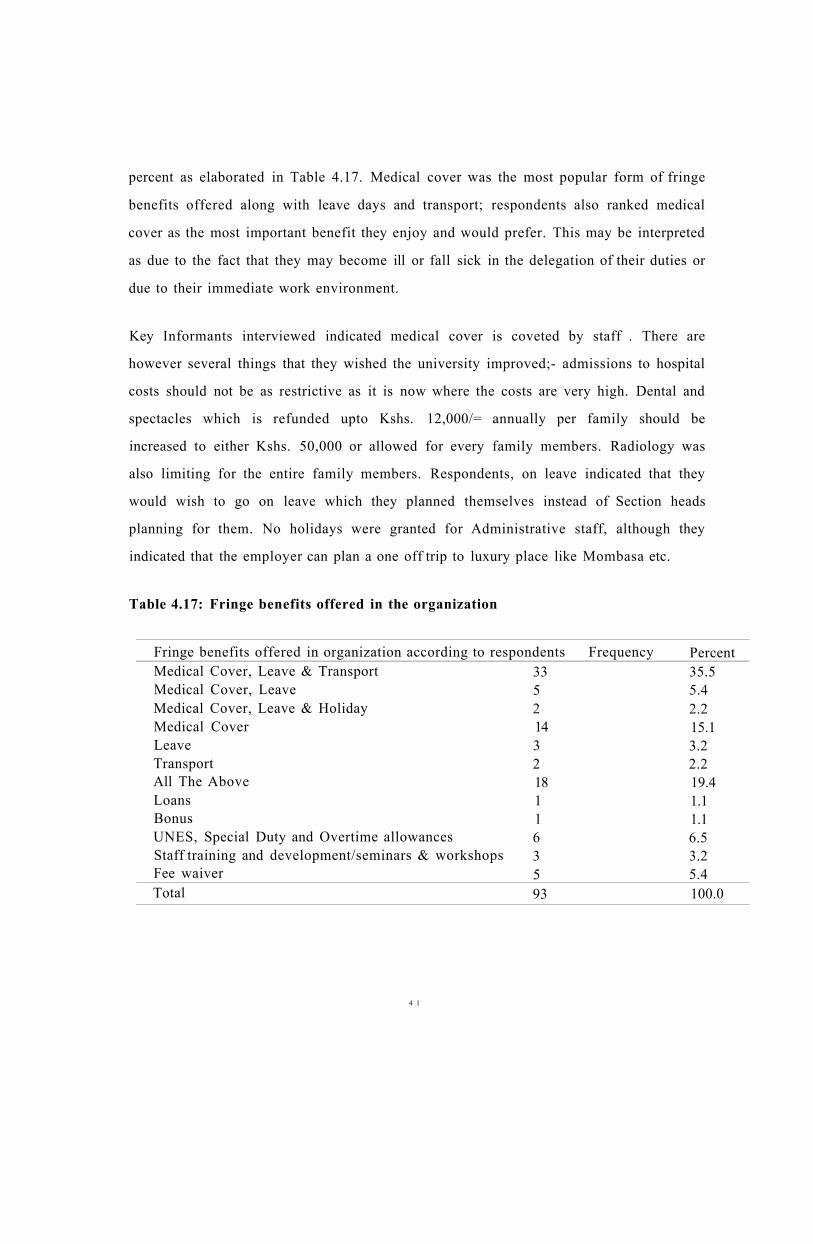
percent as elaborated in Table 4.17. Medical cover was the most popular form of fringe
benefits offered along with leave days and transport; respondents also ranked medical
cover as the most important benefit they enjoy and would prefer. This may be interpreted
as due to the fact that they may become ill or fall sick in the delegation of their duties or
due to their immediate work environment.
Key Informants interviewed indicated medical cover is coveted by staff . There are
however several things that they wished the university improved;- admissions to hospital
costs should not be as restrictive as it is now where the costs are very high. Dental and
spectacles which is refunded upto Kshs. 12,000/= annually per family should be
increased to either Kshs. 50,000 or allowed for every family members. Radiology was
also limiting for the entire family members. Respondents, on leave indicated that they
would wish to go on leave which they planned themselves instead of Section heads
planning for them. No holidays were granted for Administrative staff, although they
indicated that the employer can plan a one off trip to luxury place like Mombasa etc.
Table 4.17: Fringe benefits offered in the organization
Fringe benefits offered in organization according to respondents Frequency Percent Medical Cover, Leave & Transport 33 35.5 Medical Cover, Leave 5 5.4 Medical Cover, Leave & Holiday 2 2.2 Medical Cover 14 15.1 Leave 3 3.2 Transport 2 2.2 All The Above 18 19.4 Loans 1 1.1 Bonus 1 1.1 UNES, Special Duty and Overtime allowances 6 6.5 Staff training and development/seminars & workshops 3 3.2 Fee waiver 5 5.4 Total 93 100.0
4 1
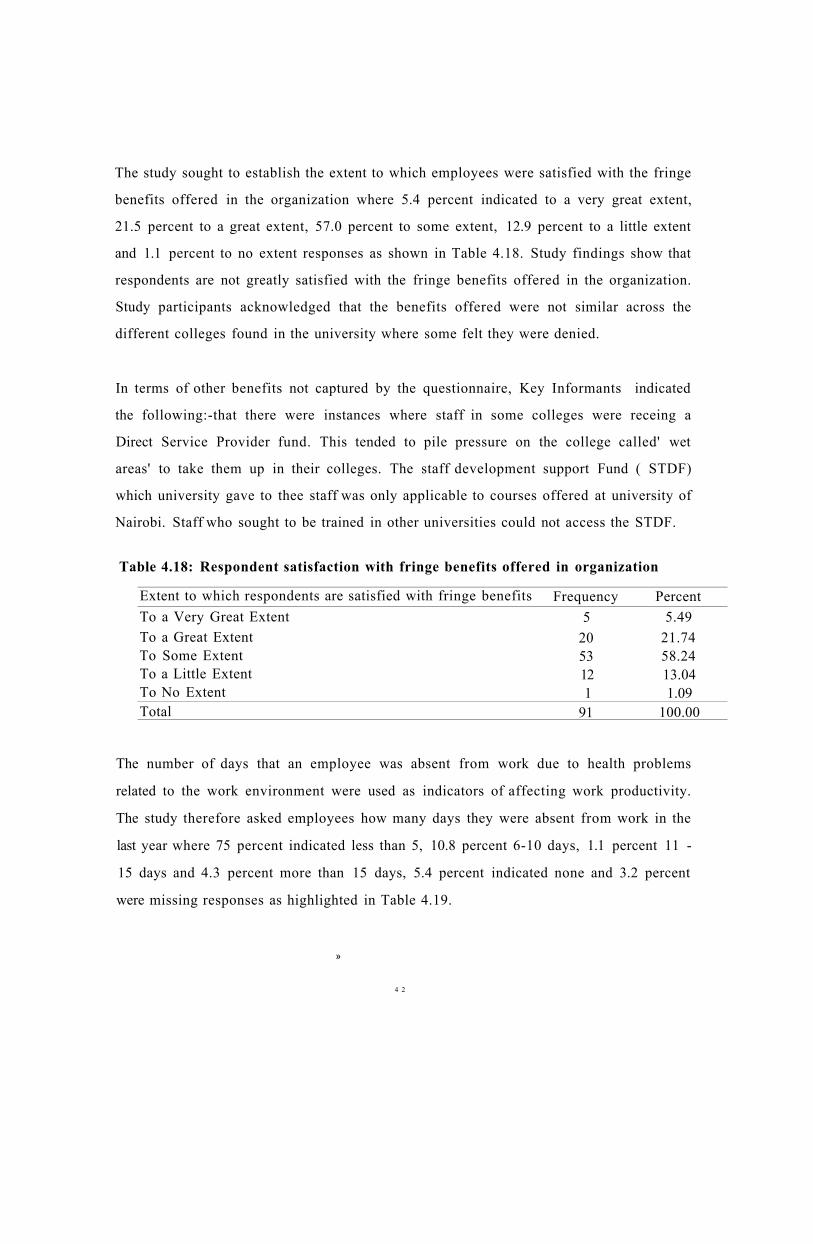
The study sought to establish the extent to which employees were satisfied with the fringe
benefits offered in the organization where 5.4 percent indicated to a very great extent,
21.5 percent to a great extent, 57.0 percent to some extent, 12.9 percent to a little extent
and 1.1 percent to no extent responses as shown in Table 4.18. Study findings show that
respondents are not greatly satisfied with the fringe benefits offered in the organization.
Study participants acknowledged that the benefits offered were not similar across the
different colleges found in the university where some felt they were denied.
In terms of other benefits not captured by the questionnaire, Key Informants indicated
the following:-that there were instances where staff in some colleges were receing a
Direct Service Provider fund. This tended to pile pressure on the college called' wet
areas' to take them up in their colleges. The staff development support Fund ( STDF)
which university gave to thee staff was only applicable to courses offered at university of
Nairobi. Staff who sought to be trained in other universities could not access the STDF.
Table 4.18: Respondent satisfaction with fringe benefits offered in organization
Extent to which respondents are satisfied with fringe benefits Frequency Percent To a Very Great Extent 5 5.49 To a Great Extent 20 21.74 To Some Extent 53 58.24 To a Little Extent 12 13.04 To No Extent 1 1.09 Total 91 100.00
The number of days that an employee was absent from work due to health problems
related to the work environment were used as indicators of affecting work productivity.
The study therefore asked employees how many days they were absent from work in the
last year where 75 percent indicated less than 5, 10.8 percent 6-10 days, 1.1 percent 11 -
15 days and 4.3 percent more than 15 days, 5.4 percent indicated none and 3.2 percent
were missing responses as highlighted in Table 4.19.
»
4 2

Table 4.19: Number of days absent from work
Respondent duration absent from work Frequency Percent Less Than 5 70
10 76.08 11.1 1.1
4.44 5.43
6-10
11-15 More Than 15 None
4 5
Total 90 100.00
The researcher also sought to establish the number of times employees applied for sick
leave days as another indicator of the independent variables of productivity. Respondents
accounting for 51.6 percent indicated once, those who had applied twice or thrice
represented 3.2 percent of the sample with those who had applied for more than four
times accounted for 2.2 percent and 34.4 percent had not applied for any sick leave days.
According to Key Informants, although staff absence was minimal, respondents indicated
that during a Staff Appraisal Exercise held yearly, staff who absented them selves
frequently received lower ratings compared to those who absented themselves
infrequently.
4 3
CHAPTER FIVE
SUMMARY, CONCLUSION AND RECOMMENDATIONS
5.1 Introduction
The purpose of this chapter is to summarize the major findings of this study and
to draw conclusions based on the findings. The chapter also comprises of the
recommendation which may be useful to the University of Nairobi management to
provide a work environment for administrative staff to improve their productivity.
5.2 Summary
The study sought to establish the influence of the work environment on productivity
among administrative staff in the University of Nairobi, the study was guided by the
following specific objectives; To identify influence of physical work environment on
productivity among administrative employees in the University of Nairobi; assess the
relationship between the office ergonomics and employee productivity among
administrative staff in the University of Nairobi and to establish the extent that job -
related factors affect employee productivity among administrative staff at the University
of Nairobi.
5.2.1 Physical factors affecting productivity
The study found that physical factors in the work environment do have an impact on the
productivity of administrative employees. The investigated factors were noise, lighting
and temperatures of their work spaces. Findings show that study participants were not
satisfied with their work environment with regard to the noise factor. Noise that was most
disruptive according to respondents was from co - workers conversing in the office. This
was due to the fact that it is a kind of noise which is difficult to control. The study was
able to establish that open plan offices had higher incidences of noise compared to closed
office environments.
4 4

5.2.2 Job related factors influence on productivity
Job related factors affecting the work environments were envisaged as the relationships
between the individual worker and other members of staff. The relationships between co
-workers and supervisors are an important ingredient of job satisfaction which has an
impact on productivity of the individual employee. Study findings show that
administrative staff employees rank their relationships with co - workers and supervisors
poorly. Respondents characterized the work environment as stressful due to the work
demands and job specifications which were not strictly adhered to and therefore caused
discomfort among administrative staff.
5.2.3 Fringe benefits influence on productivity
Human resource management literature indicates fringe benefits as an effective tool for
motivating of employees. Employees can be motivated and therefore increase their
performance based on the fringe benefits which the employer provides. Study participants
indicted they were knowledgeable of the fringe benefits offered in the organization.
Medical cover was the most popular fringe benefit that employees preferred and staff
ranked as important. However there was discontentment among staff due to the fact that
fringe benefits offered by the university were not harmonized across the different
colleges.
5.3 Conclusion
In regard to the variable of the physical environment it is the study's conclusion that this
has an impact on the productivity of administrative employees given their responses on
the indictors. This is similar to the findings of Brill et al. (1984) where he identifies
several factors which affect productivity as furniture, noise, flexibility, comfort,
communication, lighting, temperature and the air quality. The study findings also support
Leaman (1995) findings that the productivity of the work is affected because the people
were unhappy with temperature, air quality, light and noise levels in the office.
»
4 5
In regard to the variable of job - related factors and social support in the workplace it is
the study's conclusion that there is a positive perception of the social support among
administrative staff at the university of Nairobi. Respondents agreed that they received
the support they needed from colleagues and supervisors in the delegation of their duties
which were rated on a likert scale from strongly disagree to strongly agree. These
findings are consistent with those of Abualrub (2004) who found that, perceived social
support from co-workers enhance job performance and decrease job stress. Similarly
Drach-Zahavy (2004) suggests that supportive management practices are crucial to
achieve high performance.
Fringe benefits comprise of the non - monetary compensation packages given to
employees of an organization. Employees listed a number of different types of fringe
benefits offered by the organization ranging from medical cover, leave days, transport to
training opportunities and different types of allowances. Respondents however indicted
that they were not satisfied with the fringe benefits offered and would prefer a revision of
these.
5.4 Recommendations
Based on the study findings the researcher makes the following recommendations;
1. The University of Nairobi should continuously assess the physical working
conditions of administrative staff and implement measures based on these
findings.
2. The study recommends the University of Nairobi to increase the number of potted
plants in staff work spaces to counter the effect of high humidity which has been
observed to contribute to illnesses.
3. The university of Nairobi management should consider harmonization of fringe
benefits offered to administrative employees across the colleges.
4. The University of Nairobi management should undertake fringe benefits
evaluations to determine what would improve the performance of their staff.
4 6

5. The study recommends that the University of Nairobi should engage their staff in
determining the most appropriate fringe benefits.
6. The study also recommends the University of Nairobi staff to increase efforts to
encourage social support among staff at all levels through team building activities
and excursions
4 7
REFERENCES
Abualrub, R. (2004). Job stress, job performance and social support among hospital
nurses. Journal Nurses Scholarship. 36(1): 73-78.
Abdou, A. O., Kholy, E. I. M and Abdou, A. A. (2007). Correlation between Indoor
Environmental Quality and Productivity in Buildings. Journal of architectural
engineering 3, 1-15
Abdullah, W. (2002). Human resources management: A comprehensive guide. Cape
Town: Heinemann Publishers, (Pty) Limited.
Al-Anzi, M. N. (2009). Workplace environment and its impact on employee performance.
Project Paper. Master of Business Administration. Open University of Malaysia
Akinyele, S. T. (2007). A Critical Assessment of Environmental Impact on Workers
Productivity in Nigeria. Res. J. Bus. Manage. 1(1): 50-61.
Armstrong, M. (2006). A Handbook of Human Resource Management Practice (10th ed.)
London, Kogan page
Arnolds, C. A. and Boshoff, C. (2001). The challenge of motivating top management: A
need satisfaction perspective. Journal of Industrial Psychology, 27(1), 39-42.
Backhouse A. and Drew, A. (1992). The design implications of social-interaction in a
workplace setting. Environment and Planning B: Planning and design, 19, 5, 573-
584.
Blau, P. M. (1964). Exchange and power in social life. New York: John Wiley.
Block, L. K. and Stokes, G. S. (1989). Performance and satisfaction in private versus
non-private work settings. Environment and Behavior, 21,3, 277-297.
Bowler, M. and Brass, D (2006). Relational Correlates of Interpersonal Citizenship
Behavior: A Social Network Perspective, J. Appl. Psychol., 91: 70-82.
Brill, M. M. (1992) Using Office Design to Increase Productivity. Vol. 1, 1984: Vol.2,
1984. Buffalo, N.Y.: Workplace Design and Productivity. Buildings /IAQ,
pp.495-500.
Brown, S. and Sessions, J. G. (2003). Attitudes, Expectations, and Sharing, Labour,
17(4): 543-569.

Burns, N. and Grove, S. K. (1993). The practice of nursing research conduct, critique and
utilization. 2nd Edition. Philadelphia. W. B. Saunders Company.
Burns, N. and Grove, S. K. (2003). Understanding nursing research. 3rd Edition.
Philadelphia. W. B. Saunders Company.
Casio, W. (1996). Managing Human Resources: Productivity, Quality and Working Life
and Profits; United States: McGraw Hill.
Castilla, E. J. (2005). Social Networks and Employee Performance in a Call Center, Am.
J. Sociol., 110(5): 1243-1283.
Caplan, R. D., Cobb, S., French, J. R. P., Jr., Harrison, R. V., & Pinneau, S. R. (1980).
Job demands and worker health: Main effects and occupational differences. Ann
Arbor, Mich.: Institute for Social Research.
Chandrasekar, K. (2011). Workplace Environment and its Impact on Organizational
Performance in Public Sector Organizations. International Journal of Enterprise
Computing and Business Systems, Vol: 1, Issue: 1
Chen, J., Silverthorne, C. and Hung, J. (2006). Organization communication, job stress,
organizational commitment and job performance of accounting professionals in
Taiwan and America. Leadership Organizational Development Journal. 27(4):
242-249.
Chiang, F. F. T. and Birtch, T. A. (2010). Pay for performance and work attitudes: The
mediating role of employee-organization service value congruence. Int. J. Hosp.
Manage., 29: 632-640.
Czikszentmihalyi, M. (1990). Flow: The psychology of optimal experience. New York:
Harper Collins.
Deckop, J. R., Cirka, C. C., and Anderson, L. M. (2003). Doing unto others: The
reciprocity of helping behavior in organizations. Journal of Business Ethics, 47:
101-114.
de Frias, C. M. and Schaie, K. W. (2001). Perceived work environment and cognitive
style. Experimental Aging Research, 27, 67-81.
4 9
De Vos, A. S., Strydom, H., Fouch, C. B. and Delport, C. S. L. (2005) Research at grass
roots for the social sciences and human services professions. 3rd Edition. Pretoria.
Van Shalik Publishers.
Dilani, A. (2004). Design and health III: Health promotion through environmental design.
Stockholm, Sweden: Inter-national Academy for Design and Health.
Dorgan, C. E. (1994). Productivity: Link to the Indoor Environment Estimated Relative
to ASHRAE 62-1989 Proceedings of Health Buildings '94, Budapest, pp.461 472.
Drach-Zahavy, A. (2004). Primary nurses' performance: role of supportive management.
Journal of Advanced Nursing. 45(1): 7-16.
Edwards, J. R., and Cooper, C. L. (1990). The person-environment fit approach to stress:
Recurring problems and some suggested solutions. Journal of Organizational
Behavior, 11,293-307.
Edwards, J. R. (1996). An examination of competing versions of the person-environment
fit approach to stress. Academy of Management Journal, 39, 292-339.
Ellickson, M. C. and Logsdon, K. (2002). Determinants of job satisfaction of municipal
government employees. Public Personnel Management. 31(3). 343-358.
Ely wood, J. (1999). Models for productions and operation Design. Berkeley University
of California Press.
Eisenberger, R., Armeli, S., Rexwinkel, B., Lynch, P. D., and Rhoades, L. (2001).
Reciprocation of perceived organizational support. Journal of Applied
Psychology. 86: 42-51.
Eisenberger, R., Cotterell, N., & Marvel, J. (1987). Reciprocation ideology. Journal of
Personality & Social Psychology. 53: 743-750.
Eisenberger, R., Fasolo, P., and Davis-LaMastro, V. (1990). Perceived organizational
support and employee diligence, commitment, and innovation. Journal of Applied
Psychology. 75: 51-59.
Eisenberger, R., Huntington, R., Hutchison, S., and Sowa, D. (1986). Perceived
organizational support. Journal of Applied Psychology. 71: 500-507.
»
5 0
Eisenberger, R., Lynch, P., Aselage, J., and Rohdieck, S. (2004). Who takes the most
revenge? Individual differences in negative reciprocity norm endorsement.
Personality & Social Psychology Bulletin. 30: 789-799.
Eisenberger, R., Stinglhamber, F., Vandenberghe, C., Sucharski, I. L., and Rhoades, L.
(2002). Perceived supervisor sup-port: Contributions to perceived organizational
support and employee retention. Journal of Applied Psychology. 87: 565-573
Firth, R. (1967). Themes in economic anthropology. London: Tavistock.
Flynn, F. J. (2003). How much should I give and how often? The effects of generosity
and frequency of favor exchange on social status and productivity. Academy of
Management Journal. 46: 539-553.
French, J. R. P., Jr., and Kahn, R. L. (1962). A programmatic approach to studying the
industrial environment and mental health. Journal of Social Issues, 18, 1-48.
French, J. R. P., Jr., Rodgers, W. L., and Cobb, S. (1974). Adjustment as person-
environment fit. In G. Coelho, D. Hamburg, & J. Adams (Eds.), Coping and
adaptation (pp. 316-333). New York: Basic Books.
Gouldner, A. W. (1960). The norm of reciprocity: A preliminary statement. American
Sociological Review, 25: 161-178.
Greenhaus, J. and Parasuraman, S. (1994). Work-family conflict, social support and well-
being, in Davidson, M. and Burke, R. (Eds), Women in Management: Current
Research Issues, Paul Chapman, London, pp. 213-29.
Haynes. B. P. (2008). An Evaluation of the Impact of the Office Environment on
Productivity. Journal of Facilities, 26 (5/6), pp. 178-19
Hall, D. S. (2007). The relationship between supervisor support and registered nurse
outcomes in nursing care units. Nursing Administration Quarterly. 31(1), 68-80.
Hameed, A. and Amjad, S. (2009). Impact of Office Design on Employees' Productivity:
A Case study of Banking. Journal of Public Affairs, Administration and
management. Volume 3, Issue 1. Organizations of Abbottabad, Pakistan
Harrison, R. V. (1978). Person-environment fit and job stress. In C. L. Cooper and R.
Payne (Eds.), Stress at work*(pp. 175-205). New York: Wiley.
5 1

Harrison, R. V. (1985). The person-environment fit model and the study of job stress. In
T. A. Beehr & R. S. Bhagat (Eds.), Human stress and cognition in organizations
(pp. 23-55).
Hayworth (1991). Ergonomics and Office Design. Holland, Michigan: Hayworth, Inc.,
Hedge, A. (1982). The open-plan office. A systematic investigation of employee reaction
to their work environment. Environment and Behavior, 14, 5, 519-542.
Heller, R. and Hindle, T. (1998). Essential manager's manual. London: Dorling
Kindersley Ltd.
Homans, G. C. (1958). Social behavior as exchange. American Journal of Sociology, 63:
597 -606.
Huang, Y. H., Robertson, M. M. and Chang, K. I. (2004). The role of environmental
control on environmental satisfaction, communication, and psychological stress:
effects of office ergonomics training. Environment and Behavior, 36(1), 617-638
Huges, J. (2007). Office design is pivotal to employee productivity. San Diego Source the
Daily Transcript.
Imtiaz, S. and Ahmad, S. (2010). Impact of Stress on Employee Productivity,
Performance and Turnover: An Important Managerial Issue. COMSATS Institute
of Information Technology, Attock Campus, Pakistan.
Jones, R. (1985). Research Methods in the Social and Behavioral Sciences.
Massachusetts, Sinauer Associates, Inc. Publishers.
Joubert, L. (2000). Work motivation and job satisfaction. Retrieved April 29, 2005, from:
http://www.iol.co.za/index.php?set_id=3&click_id=428&art_id=io
1962377903498M214
Karasek, R., & Theorell, T. (1990). Healthy work: Stress, productivity and the
reconstruction of working life. New York: Basic Books.
Kazmi, R., Amjad, S. and Khan, D. (2008). Occupational Stress and its Effect on Job
Performance: A Case Study of Medical House Officers of District Abbottabad, J.
Ayub Med. Coll. Abbotabad, 20(3): 135-139.
»
5 2
Keeling, B. L. and Kallaus, N. F. (1996, 11th Ed.). Administrative Office Management.
Ohio: International Thompson Publishing.
Keller, R. T. and Holland, W. E. (1983). Communicators and innovators in research and
development organizations", Academy of Management Journal, 26, 4, 742-749.
Kirschner, F., Paas, F. and Kirschner, P. (2009). Individual and group-based learning
from complex cognitive tasks: Effects on retention and transfer efficiency",
Computers in human behavior, 25, 2, 306 - 314.
Kohun, S. (1992). Business Environment. Ibadan: University Press
Koul, L. (1986). Methodology of Educational Research. Shimla, Vikas Publishing
House.
Lambert, S. (2005). Added Benefits: The Link between work life benefits and
organizational citizenship. Acad. Manage. J. 43: 5.
Lan, L., Lian, Z., Pan, L. and Ye., Q. (2009). Neurobehavioral approach for evaluation of
office workers' productivity: The effects of room temperature", Building and
Environment, 44, 8, 1578 - 1588.
Lantrip, D. B. (1993). Predicting satisfaction with the office environment by measuring
constraints to worker activities. Proceedings of the Human Factor and
Ergonomics Society 37th Annual Meeting, pp. 489-93.
Leaman, A. and Bordass, B. (1993). Building design, complexity and manageability.
Facilities 11(9), 16-27.
Leather, P., Beale, D. and Sullivan, L. (2003), "Noise, psychosocial stress and their
interaction in the workplace", Journal of Environmental Psychology, Vol. 23 No.
2, pp. 213-22.
Leblebici, D. (2012) Impact of workplace quality on employee's productivity: case study
of a bank in Turkey. Journal of Business, Economics and Finance. ISNN 2146 -
2943
Lee, S. Y. and Brand, J. M. (2005). Effects of control over office workspace on
perceptions of the work environment and work outcomes. Journal of
Environmental Psychology, Vol. 25 No. 3, pp. 323-33.
5 3

Levine, H. Z. (1994). Why incentive plans cannot work? Compensation and benefits
review, 26,(1), 77-78.
Liden, R. C., Sparrowe, R. T., and Wayne, S. J. (1997). Leader-member exchange theory:
The past and potential for the future. In G. R. Ferris (Ed.) Research in personnel
and human resources management, Vol. 15: 47-119: Greenwich, CT: JAI
Lynch, P. D., Eisenberger, R., and Armeli, S. (1999). Perceived organizational support:
Inferior versus superior performance by wary employees. Journal of Applied
Psychology, 84: 467-483.
Makori, E. M., Nandi, O. M. J., Thuo, J. K. and Wanyonyi, K. W. (2012) Influence of
occupational health and safety programmers on performance of manufacturing
firms in Western Province, Kenya. African Journal of History and Culture Vol. 4
(4), pp. 46-58.
Malik, M. I., Ahmad, A., Gomez, S. F. and Ali, M. (2011). A study of work environment
and employees' performance in Pakistan. African Journal of Business
Management Vol. 5(34), pp. 13227-13232
Malinowski, B. (1922). Argonauts of the western Pacific: An account of native enterprise
and adventure in the archipelagoes of Melanesian New Guinea. London:
Routledge.
Maslow, A. H. (1954). Motivation and personality. New York: Harper & Row.
Matteson, M. T. and Ivancevich, J. M. (1987). Controlling work stress: Effective human
resource and management strategies . San Francisco, CA: Jossey-Bass Inc.
Matin, H. Z., Jandaghi, G., Karimi, F. H. and Hamidizadeh, A. (2010). Relationship
between Interpersonal Communication Skills and Organizational Commitment
(Case Study: Jahad Keshavarzi and University of Qom, Iran). European Journal of
Social Sciences. 13(3): 387-398.
Masterson, S. S., Lewis, K., Goldman, B. M., and Taylor, M. S. 2000. Integrating justice
and social exchange: The dif-fering effects of fair procedures and treatment on
work relationships. Academy of Management Journal, 43: 738-748.
»
5 4
Mauss, M. (1925). The gift: Forms and functions of exchange in archaic societies. New
York: The Norton Library.
McCoy, J. M. and Evans, G. (2005). Physical work environment. In J. Barling, E.K.
Kelloway, and M. Frone (Eds), Handbook of work stress (pp. 219-245).
Thousand Oaks, CA: Sage Publications.
Miles, A. K. (2000). The ergonomics and organizational stress relationship. PhD Thesis.
Florida State University School of Business, micro. 9994574.
Mills, R.P.; Tomkins, C.S and Schlangen, J. M. L. (2007). The effect of high correlated
colour temperature office lighting on employee wellbeing and work performance.
Journal of Circadian Rhythms 5:2, 1-9.
Milton, D. K., Glencross, P. M., and Walters, M.D. (2000). Risk of sick leave associated
with outdoor air supply rate, humidification and occupant complaints. Indoor Air,
10(4),212-221.
Mohr, R. (1996). Office Space is a Revenue Enhancer, Not an Expense. National Real
Estate Investor, 38(7), 46-47.
Moorman, R. H., Blakely, G. L., and Niehoff, B. P. 1998. Does perceived organizational
support mediate the relationship between procedural justice and organizational
citizenship behavior? Academy of Management Journal, 41: 351-357.
Nwachukwu, C. C. (1987). Management Theory and Practice. Onitsha: Africana FEB
Publisher Limited.
Navai, M. and Veitch, J. A. (2003). Acoustic Satisfaction in Open-Plan Offices: Review
and Recommendations. Research Report RR-151
Opperman, C. S. (2002). Tropical Business Issues. Partner Price Water House Coopers.
Patterson. M. G., West, M. A., Lawthorn, R. and Nickell, S. (1997). Impact of People
Management Practices on Business Performance, (Issues in People Management
No 22), Institute of Personnel and Development, London
Penn, A., Desyllas, J. and Vaughan, L. (1999). The space of innovation: interaction and
communication in the work environment. Environment and Planning B: Planning
and Design, 26, 2, 193-218. •$
5 5
Polit, D. F. and Beck, C. T. (1989). Essentials of nursing research methods, appraisal and
utilization, 2nd edition. Philadelphia: Lippincott.
Polit, D. F. and Beck, C. T. (2004). Nursing research principles and methods. 7th Edition.
Philadelphia: Lippincott, Williams and Wilkins.
Quible, Z. K. (2000, 7th Ed.). Administrative Office Management: An Introduction. New
Jersey, Upper Saddle River: Prentice-Hall.
Roeloelofsen, P. (2002). The impact of office environments on employee Performance:
The design of the workplace as a strategy for productivity enhancement. Journal
of Facilities Management; 1 (3), ABI/INFORM Global pp. 247 - 264.
Rolloos, M. (1997). Een gezond binnenmilieu betaalt zichzelf terug Praktijkboek
Gezonde Gebouwen.October, A2001-3 18. As cited in Chandrasekar, 2011
Rowan, M. P. and Wright, P. C. (1995). Ergonomics is good for business. Facilities,
13(8), 18-25.
Ryan, R. M. and Deci, E. L. (2000). Self-determination theory and the facilitation of
intrinsic motivation, social development, and well-being. American Psychologist,
55, 68-78.
Savicki, V. and Cooley, E. (1987). The relationship of work environment and client
contact to burnout in mental health professionals. Journal of Counseling &
Development, 85, 249-252.
Scott, K. D., Jusanne, M. and Steven, M. E. (2000). Factors influencing employee
benefits beliefs that pay is tied to performance. J. Bus. Psychol., 14: 553-562.
Seppanen, O., Fisk William, J. and Lei, Q. H. (2006). Effect of Temperature on Task
Performance in Office Environment. LBNL- 60946
Shore, L. M., Tetrick, L. E., and Barksdale, K. (1999). Measurement of transactional and
exchange relationships. Paper presented at the annual meeting of the Society for
Industrial and Organizational Psychology, Atlanta, GA.
Shore, L. M., Tetrick, L. E., Taylor, M. S., Coyle-Shapiro, J., Liden, R. C., McLean-
Parks, J., et al. (2004). The employee-organization relationship: A timely concept
5 6
Uzee, J. (1999). The inclusive approach: creating a place where people want to work.
Facility Management. Journal of the International Facility Management
Association 26-30.
Veitch, J. A. and Newsham, G. R. (2000). Exercised control, lighting choices, and energy
use: An office simulation experiment. Journal of Environmental Psychology,
20(3). 219-237
Vischer, J. C. (2005). Space meets status: Designing work-place performance. Oxford,
UK: Taylor and Francis / Routledge.
Vischer, J. C. (2007). The effects of the physical environment on job performance:
towards a theoretical model of workspace stress. Stress and Health 23: 175-184
Waalgren, G. L. (2011). Work motivation and the work environment of IT consultants.
Phd. University of Gothenburg. Sweden
Yesufu, T. M. (2000). The Human Factor in national Development: Nigeria, Spectrum
Books Limited, Ibadan, Nigeria.
»
5 8
APPENDICES
APPENDIX ONE: LETTER OF INTRODUCTION
Mercy Musembi
University Of Nairobi
P.O Box 30191- 00100
Nairobi
Dear Sir/Madam
Re: Research Project Data Collection Exercise.
I am a post graduate student undertaking a Master of Arts degree in Project Planning a n d
Management at the University of Nairobi. I am required to submit as part ot my cour se
work assessment a research project report on the "influence of the work enwronment
on employee productivity among administrative staff. The University ot Nairobi h a s
been chosen to participate in the study and you are asked to assist the study by g i v i n g
responses to the questionnaire to the best of your ability. The information you \v\[ \
provide will be used exclusively for academic purposes and I assure you that it will
treated with strict confidence. A copy of the same will be availed upon request.
Thank You in Advance
Yours sincerely
Mercy Musembi
C50/61997/2010
5 9
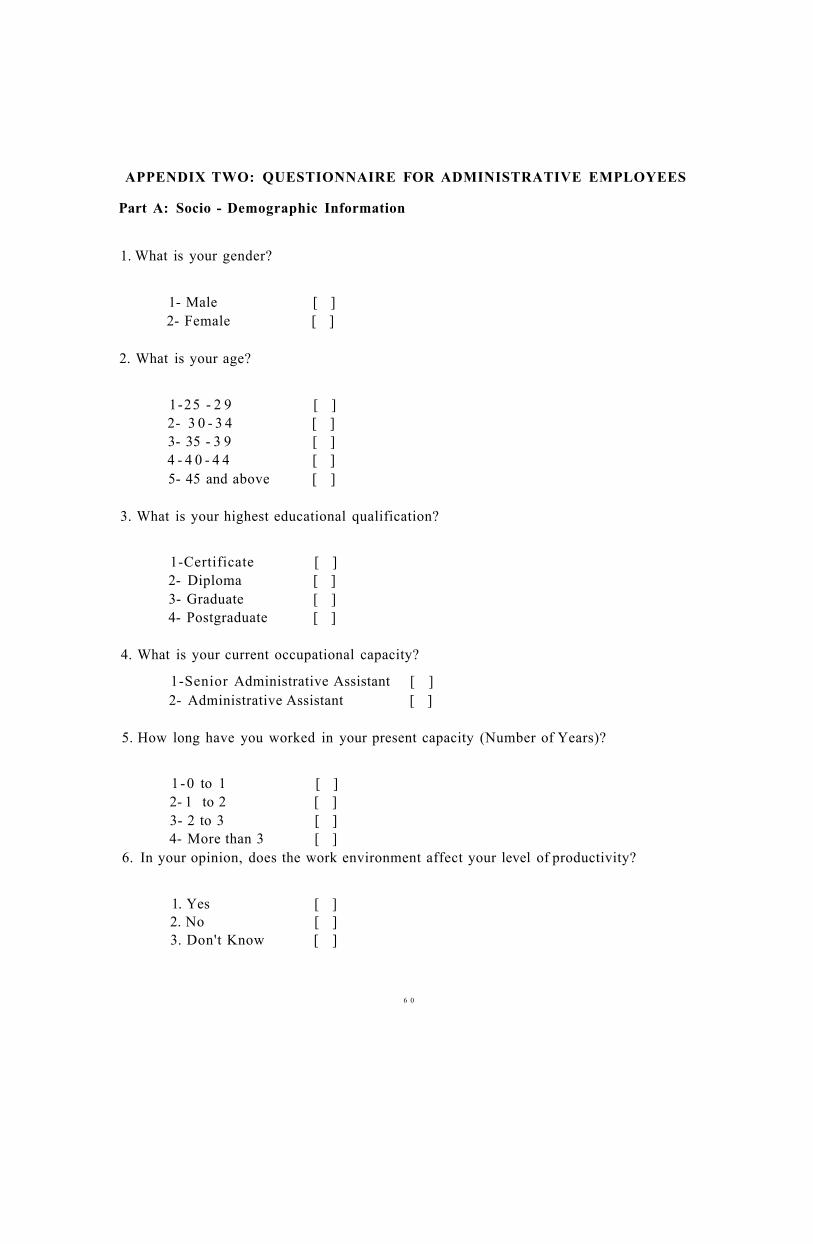
APPENDIX TWO: QUESTIONNAIRE FOR ADMINISTRATIVE EMPLOYEES
Part A: Socio - Demographic Information
1. What is your gender?
1- Male [ ] 2- Female [ ]
2. What is your age?
1-25 - 2 9 [ ] 2- 3 0 - 3 4 [ ] 3- 35 - 3 9 [ ] 4 - 4 0 - 4 4 [ ] 5- 45 and above [ ]
3. What is your highest educational qualification?
1-Certificate [ ] 2- Diploma [ ] 3- Graduate [ ] 4- Postgraduate [ ]
4. What is your current occupational capacity?
1-Senior Administrative Assistant [ ] 2- Administrative Assistant [ ]
5. How long have you worked in your present capacity (Number of Years)?
1 -0 to 1 [ ] 2- 1 to 2 [ ] 3- 2 to 3 [ ] 4- More than 3 [ ]
6. In your opinion, does the work environment affect your level of productivity?
1. Yes [ ] 2. No [ ] 3. Don't Know [ ]
6 0

Part B: Physical Environment Impact on Productivity (Noise, Lighting,
Temperature)
7. My work environment is quiet
1- Not at all [ ] 2- To some extent [ 1 3- Often [ ] 4- Mostly [ ] 5- Always [ ]
8. I am able to have quiet and undisturbed time alone
1- Not at all [ i 2- To some extent [ i 3- Often [ ] 4- Mostly [ ] 5- Always [ i
9. My workspace has many noise distractions
1-Not at all [ ] 2- To some extent [ ] 3- Often [ ] 4- Mostly [ ] 5- Always [ ]
10. To what extent your room temperature affects your normal level of productivity.
1 -No effect [ ] 2- Positive effect [ ] 3- Normal effect [ ] 4- Quite good effect [ ] 5- Bad effect [ ]
11. The overall temperature of my workspace in cold season is
1- Cold [ ] 2-Cool [ J 3-Pleasant [ ] 4- Slightly warm [ ]
6 1
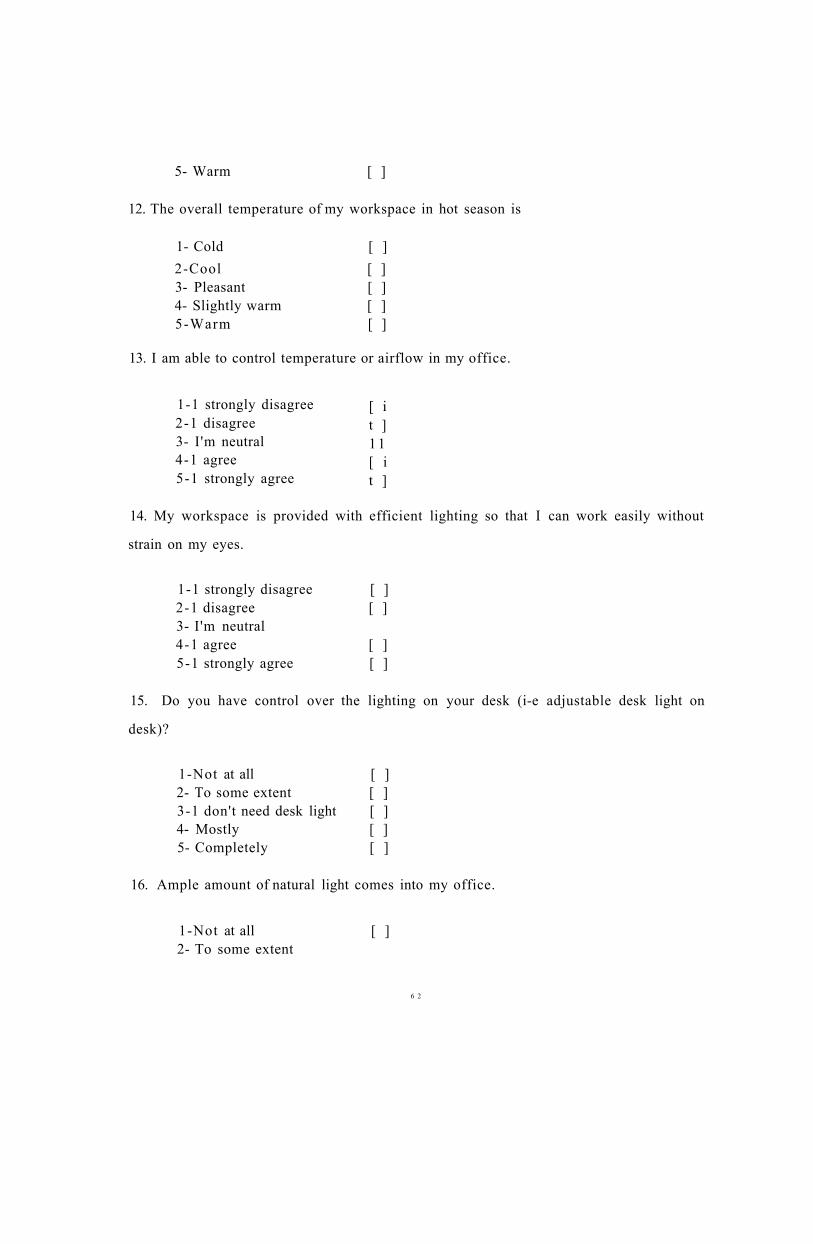
5- Warm [ ]
12. The overall temperature of my workspace in hot season is
1- Cold [ ] 2-Cool [ ] 3- Pleasant [ ] 4- Slightly warm [ ] 5-Warm [ ]
13. I am able to control temperature or airflow in my office.
1-1 strongly disagree [ i 2-1 disagree t ] 3- I'm neutral 1 1 4-1 agree [ i 5-1 strongly agree t ]
14. My workspace is provided with efficient lighting so that I can work easily without
strain on my eyes.
1-1 strongly disagree [ ] 2-1 disagree [ ] 3- I'm neutral 4-1 agree [ ] 5-1 strongly agree [ ]
15. Do you have control over the lighting on your desk (i-e adjustable desk light on
desk)?
1-Not at all [ ] 2- To some extent [ ] 3-1 don't need desk light [ ] 4- Mostly [ ] 5- Completely [ ]
16. Ample amount of natural light comes into my office.
1-Not at all [ ] 2- To some extent
6 2
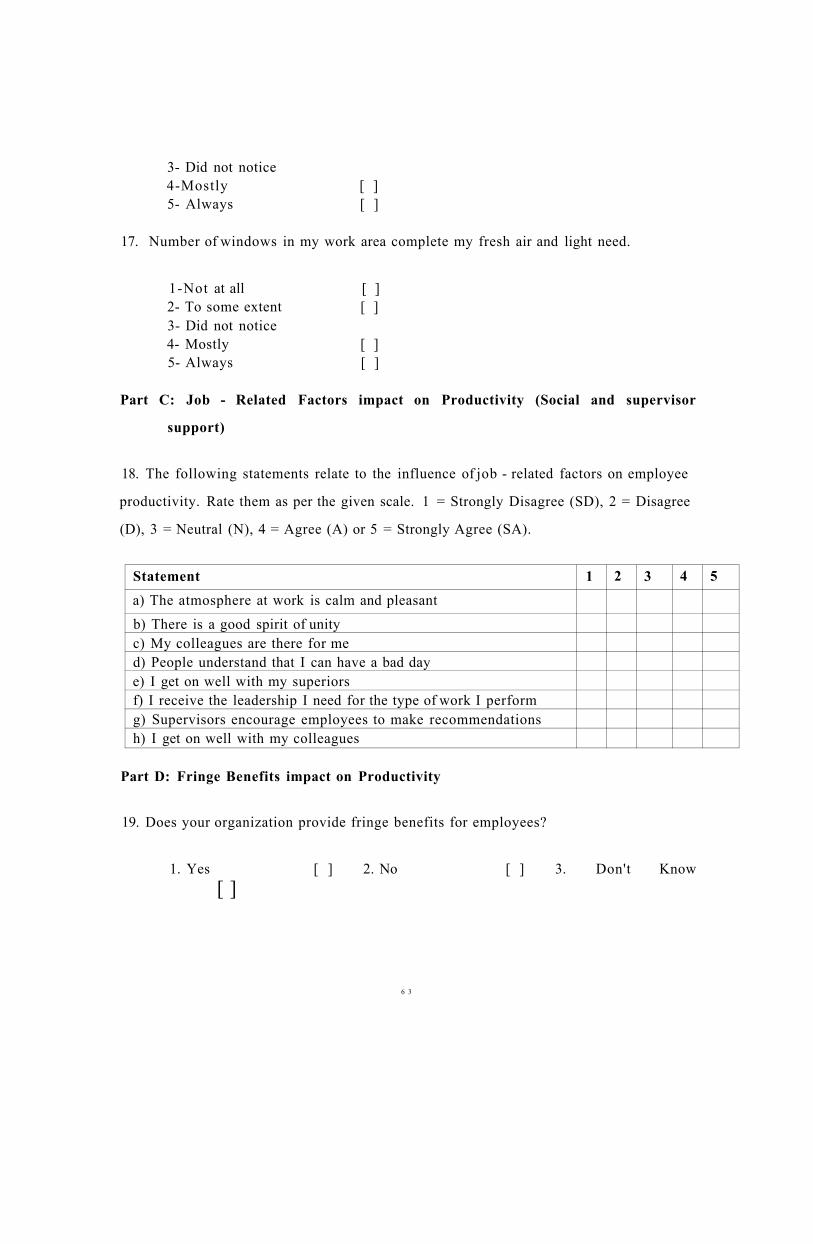
3- Did not notice 4-Mostly [ ] 5- Always [ ]
17. Number of windows in my work area complete my fresh air and light need.
1-Not at all [ ] 2- To some extent [ ] 3- Did not notice 4- Mostly [ ] 5- Always [ ]
Part C: Job - Related Factors impact on Productivity (Social and supervisor
support)
18. The following statements relate to the influence of job - related factors on employee
productivity. Rate them as per the given scale. 1 = Strongly Disagree (SD), 2 = Disagree
(D), 3 = Neutral (N), 4 = Agree (A) or 5 = Strongly Agree (SA).
Statement 1 2 3 4 5 a) The atmosphere at work is calm and pleasant b) There is a good spirit of unity c) My colleagues are there for me d) People understand that I can have a bad day e) I get on well with my superiors f) I receive the leadership I need for the type of work I perform g) Supervisors encourage employees to make recommendations h) I get on well with my colleagues
Part D: Fringe Benefits impact on Productivity
19. Does your organization provide fringe benefits for employees?
1. Yes [ ] 2. No [ ] 3. Don't Know [ ]
6 3
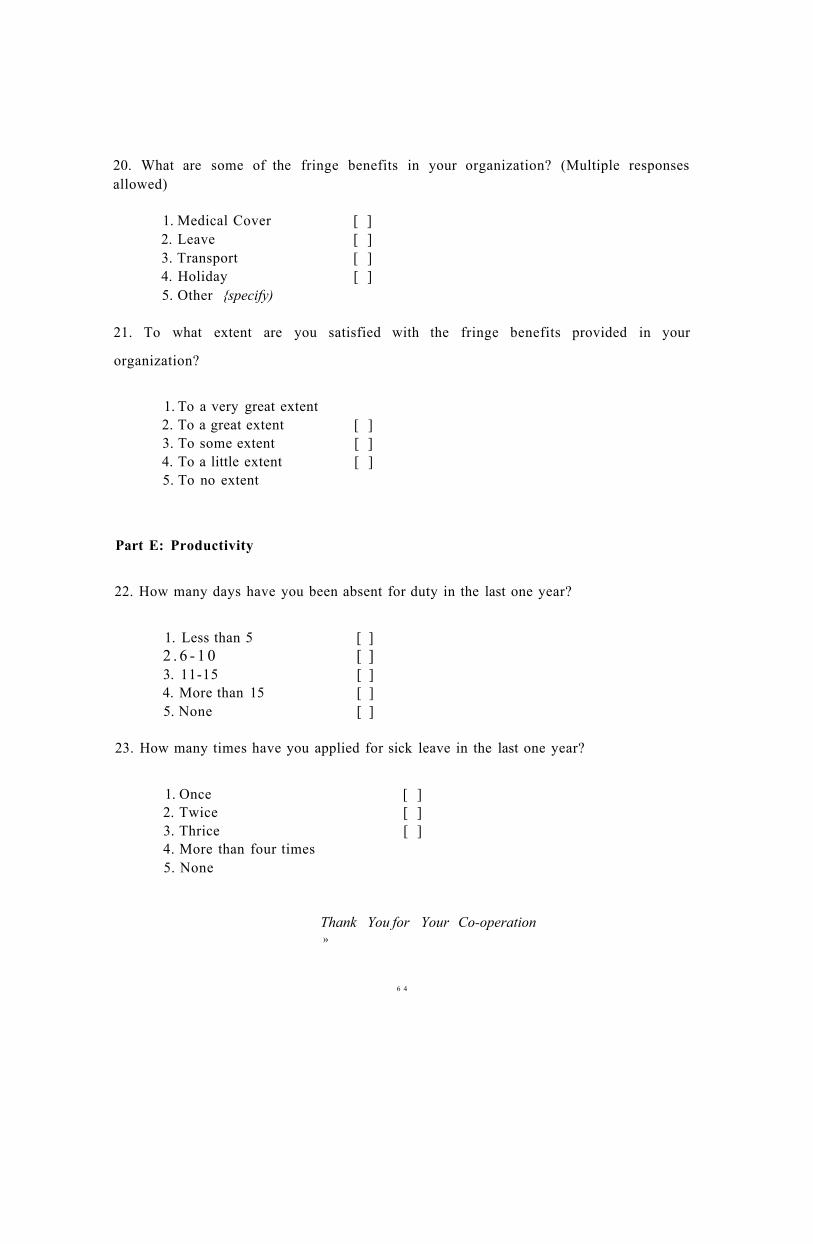
20. What are some of the fringe benefits in your organization? (Multiple responses allowed)
1. Medical Cover [ ] 2. Leave [ ] 3. Transport [ ] 4. Holiday [ ] 5. Other {specify)
21. To what extent are you satisfied with the fringe benefits provided in your
organization?
1. To a very great extent 2. To a great extent [ ] 3. To some extent [ ] 4. To a little extent [ ] 5. To no extent
Part E: Productivity
22. How many days have you been absent for duty in the last one year?
1. Less than 5 [ ] 2 . 6 - 1 0 [ ] 3. 11-15 [ ] 4. More than 15 [ ] 5. None [ ]
23. How many times have you applied for sick leave in the last one year?
1. Once [ ] 2. Twice [ ] 3. Thrice [ ] 4. More than four times 5. None
Thank You for Your Co-operation »
6 4
APPENDIX 3: KEY INFORMANT INTERVIEW GUIDE
1. How long have you worked at the University of Nairobi as the Senior
Administrative Registrar?
2. In your opinion, what are some of the work environmental factors influencing
administrative employees' productivity?
3. Would you please describe how these factors in (2) above influence the
productivity of administrative employees?
4. What are the major contributors to employee absenteeism among administrative
staff?
5. What are some of the fringe benefits afforded to administrative employees?
6. Are these employee incentives reviewed? If Yes, How is this does and after a
period of how long
6 5