Penetrance of hemochromatosis
15
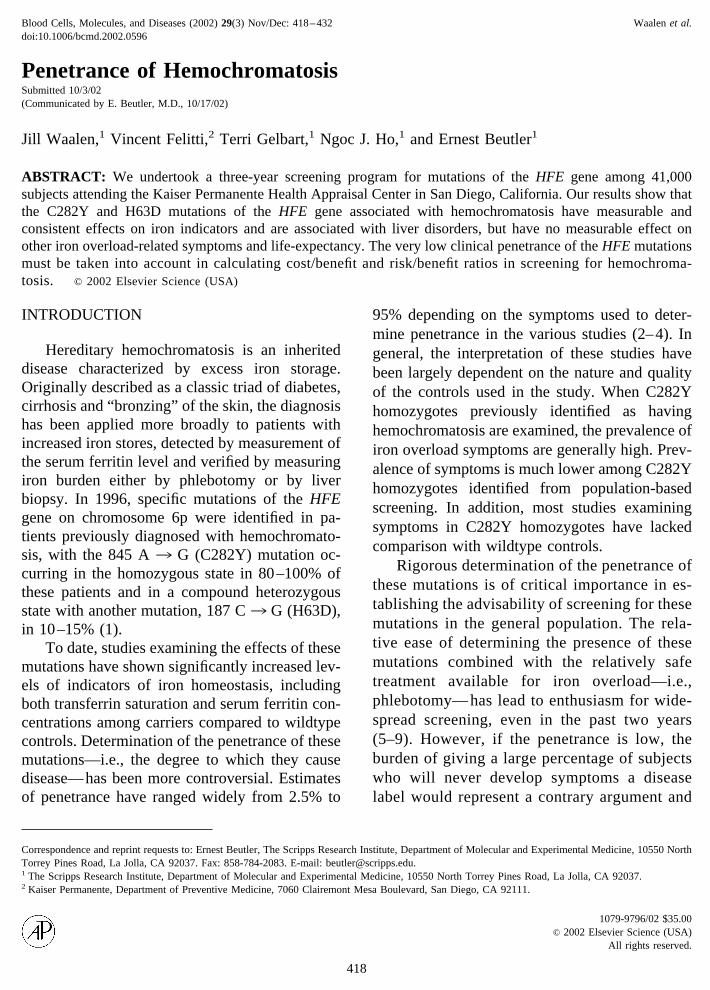
Penetrance of Hemochromatosis Submitted 10/3/02 (Communicated by E. Beutler, M.D., 10/17/02) Jill Waalen, 1 Vincent Felitti, 2 Terri Gelbart, 1 Ngoc J. Ho, 1 and Ernest Beutler 1 ABSTRACT: We undertook a three-year screening program for mutations of the HFE gene among 41,000 subjects attending the Kaiser Permanente Health Appraisal Center in San Diego, California. Our results show that the C282Y and H63D mutations of the HFE gene associated with hemochromatosis have measurable and consistent effects on iron indicators and are associated with liver disorders, but have no measurable effect on other iron overload-related symptoms and life-expectancy. The very low clinical penetrance of the HFE mutations must be taken into account in calculating cost/benefit and risk/benefit ratios in screening for hemochroma- tosis. © 2002 Elsevier Science (USA) INTRODUCTION Hereditary hemochromatosis is an inherited disease characterized by excess iron storage. Originally described as a classic triad of diabetes, cirrhosis and “bronzing” of the skin, the diagnosis has been applied more broadly to patients with increased iron stores, detected by measurement of the serum ferritin level and verified by measuring iron burden either by phlebotomy or by liver biopsy. In 1996, specific mutations of the HFE gene on chromosome 6p were identified in pa- tients previously diagnosed with hemochromato- sis, with the 845 A 3 G (C282Y) mutation oc- curring in the homozygous state in 80 –100% of these patients and in a compound heterozygous state with another mutation, 187 C 3 G (H63D), in 10 –15% (1). To date, studies examining the effects of these mutations have shown significantly increased lev- els of indicators of iron homeostasis, including both transferrin saturation and serum ferritin con- centrations among carriers compared to wildtype controls. Determination of the penetrance of these mutations—i.e., the degree to which they cause disease— has been more controversial. Estimates of penetrance have ranged widely from 2.5% to 95% depending on the symptoms used to deter- mine penetrance in the various studies (2– 4). In general, the interpretation of these studies have been largely dependent on the nature and quality of the controls used in the study. When C282Y homozygotes previously identified as having hemochromatosis are examined, the prevalence of iron overload symptoms are generally high. Prev- alence of symptoms is much lower among C282Y homozygotes identified from population-based screening. In addition, most studies examining symptoms in C282Y homozygotes have lacked comparison with wildtype controls. Rigorous determination of the penetrance of these mutations is of critical importance in es- tablishing the advisability of screening for these mutations in the general population. The rela- tive ease of determining the presence of these mutations combined with the relatively safe treatment available for iron overload—i.e., phlebotomy— has lead to enthusiasm for wide- spread screening, even in the past two years (5–9). However, if the penetrance is low, the burden of giving a large percentage of subjects who will never develop symptoms a disease label would represent a contrary argument and Correspondence and reprint requests to: Ernest Beutler, The Scripps Research Institute, Department of Molecular and Experimental Medicine, 10550 North Torrey Pines Road, La Jolla, CA 92037. Fax: 858-784-2083. E-mail: [email protected]. 1 The Scripps Research Institute, Department of Molecular and Experimental Medicine, 10550 North Torrey Pines Road, La Jolla, CA 92037. 2 Kaiser Permanente, Department of Preventive Medicine, 7060 Clairemont Mesa Boulevard, San Diego, CA 92111. Blood Cells, Molecules, and Diseases (2002) 29(3) Nov/Dec: 418 – 432 Waalen et al. doi:10.1006/bcmd.2002.0596 1079-9796/02 $35.00 © 2002 Elsevier Science (USA) All rights reserved. 418
Transcript of Penetrance of hemochromatosis
Blood Cells, Molecules, and Diseases (2002) 29(3) Nov/Dec: 418–432 Waalen et al.doi:10.1006/bcmd.2002.0596
Penetrance of HemochromatosisSubmitted 10/3/02(Communicated by E. Beutler, M.D., 10/17/02)
Jill Waalen,1 Vincent Felitti,2 Terri Gelbart,1 Ngoc J. Ho,1 and Ernest Beutler1
ABSTRACT: We undertook a three-year screening program for mutations of the HFE gene among 41,000subjects attending the Kaiser Permanente Health Appraisal Center in San Diego, California. Our results show thatthe C282Y and H63D mutations of the HFE gene associated with hemochromatosis have measurable andconsistent effects on iron indicators and are associated with liver disorders, but have no measurable effect onother iron overload-related symptoms and life-expectancy. The very low clinical penetrance of the HFE mutationsmust be taken into account in calculating cost/benefit and risk/benefit ratios in screening for hemochroma-
INTRODUCTION
Hereditary hemochromatosis is an inheriteddisease characterized by excess iron storage.Originally described as a classic triad of diabetes,cirrhosis and “bronzing” of the skin, the diagnosishas been applied more broadly to patients withincreased iron stores, detected by measurement ofthe serum ferritin level and verified by measuringiron burden either by phlebotomy or by liverbiopsy. In 1996, specific mutations of the HFEgene on chromosome 6p were identified in pa-tients previously diagnosed with hemochromato-sis, with the 845 A 3 G (C282Y) mutation oc-curring in the homozygous state in 80–100% ofthese patients and in a compound heterozygousstate with another mutation, 187 C3 G (H63D),in 10–15% (1).
To date, studies examining the effects of thesemutations have shown significantly increased lev-els of indicators of iron homeostasis, includingboth transferrin saturation and serum ferritin con-centrations among carriers compared to wildtypecontrols. Determination of the penetrance of thesemutations—i.e., the degree to which they causedisease—has been more controversial. Estimatesof penetrance have ranged widely from 2.5% to
Correspondence and reprint requests to: Ernest Beutler, The Scripps ReseaTorrey Pines Road, La Jolla, CA 92037. Fax: 858-784-2083. E-mail: beu1
418
95% depending on the symptoms used to deter-mine penetrance in the various studies (2–4). Ingeneral, the interpretation of these studies havebeen largely dependent on the nature and qualityof the controls used in the study. When C282Yhomozygotes previously identified as havinghemochromatosis are examined, the prevalence ofiron overload symptoms are generally high. Prev-alence of symptoms is much lower among C282Yhomozygotes identified from population-basedscreening. In addition, most studies examiningsymptoms in C282Y homozygotes have lackedcomparison with wildtype controls.
Rigorous determination of the penetrance ofthese mutations is of critical importance in es-tablishing the advisability of screening for thesemutations in the general population. The rela-tive ease of determining the presence of thesemutations combined with the relatively safetreatment available for iron overload—i.e.,phlebotomy— has lead to enthusiasm for wide-spread screening, even in the past two years(5–9). However, if the penetrance is low, theburden of giving a large percentage of subjectswho will never develop symptoms a diseaselabel would represent a contrary argument and
titute, Department of Molecular and Experimental Medicine, 10550 Northripps.edu.
tosis. © 2002 Elsevier Science (USA)
The Scripps Research Institute, Department of Molecular and Experime2 Kaiser Permanente, Department of Preventive Medicine, 7060 Clairemo
dicine, 10550 North Torrey Pines Road, La Jolla, CA 92037.Boulevard, San Diego, CA 92111.
1079-9796/02 $35.00
rch Instler@scntal Ment Mesa
© 2002 Elsevier Science (USA)All rights reserved.
some skepticism about the value of screeninghas been expressed (10 –12).
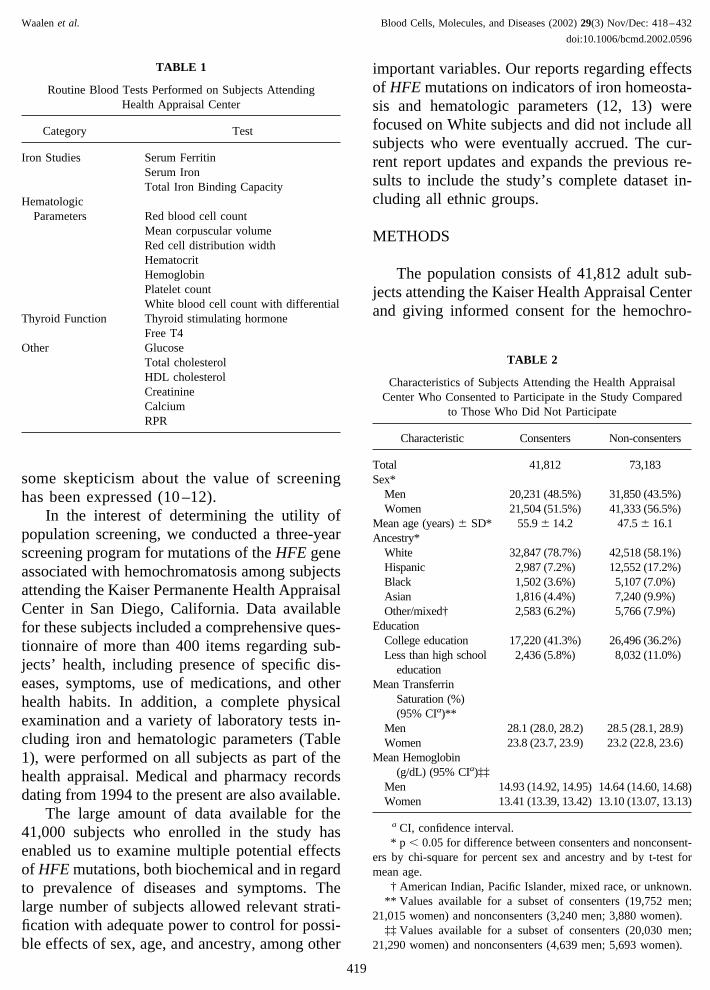
In the interest of determining the utility ofpopulation screening, we conducted a three-yearscreening program for mutations of the HFE geneassociated with hemochromatosis among subjectsattending the Kaiser Permanente Health AppraisalCenter in San Diego, California. Data availablefor these subjects included a comprehensive ques-tionnaire of more than 400 items regarding sub-jects’ health, including presence of specific dis-eases, symptoms, use of medications, and otherhealth habits. In addition, a complete physicalexamination and a variety of laboratory tests in-cluding iron and hematologic parameters (Table1), were performed on all subjects as part of thehealth appraisal. Medical and pharmacy recordsdating from 1994 to the present are also available.
The large amount of data available for the41,000 subjects who enrolled in the study hasenabled us to examine multiple potential effectsof HFE mutations, both biochemical and in regardto prevalence of diseases and symptoms. Thelarge number of subjects allowed relevant strati-fication with adequate power to control for possi-ble effects of sex, age, and ancestry, among other
important variables. Our reports regarding effectsof HFE mutations on indicators of iron homeosta-sis and hematologic parameters (12, 13) werefocused on White subjects and did not include allsubjects who were eventually accrued. The cur-rent report updates and expands the previous re-sults to include the study’s complete dataset in-cluding all ethnic groups.
METHODS
The population consists of 41,812 adult sub-jects attending the Kaiser Health Appraisal Centerand giving informed consent for the hemochro-
TABLE 1
Routine Blood Tests Performed on Subjects AttendingHealth Appraisal Center
Category Test
Iron Studies Serum FerritinSerum IronTotal Iron Binding Capacity
HematologicParameters Red blood cell count
Mean corpuscular volumeRed cell distribution widthHematocritHemoglobinPlatelet countWhite blood cell count with differential
Thyroid Function Thyroid stimulating hormoneFree T4
Other GlucoseTotal cholesterolHDL cholesterolCreatinineCalciumRPR
TABLE 2
Characteristics of Subjects Attending the Health AppraisalCenter Who Consented to Participate in the Study Compared
to Those Who Did Not Participate
Characteristic Consenters Non-consenters
Total 41,812 73,183Sex*
Men 20,231 (48.5%) 31,850 (43.5%)Women 21,504 (51.5%) 41,333 (56.5%)
Mean age (years) � SD* 55.9 � 14.2 47.5 � 16.1Ancestry*
White 32,847 (78.7%) 42,518 (58.1%)Hispanic 2,987 (7.2%) 12,552 (17.2%)Black 1,502 (3.6%) 5,107 (7.0%)Asian 1,816 (4.4%) 7,240 (9.9%)Other/mixed† 2,583 (6.2%) 5,766 (7.9%)
EducationCollege education 17,220 (41.3%) 26,496 (36.2%)Less than high school
education2,436 (5.8%) 8,032 (11.0%)
Mean TransferrinSaturation (%)(95% CIa)**
Men 28.1 (28.0, 28.2) 28.5 (28.1, 28.9)Women 23.8 (23.7, 23.9) 23.2 (22.8, 23.6)
Mean Hemoglobin(g/dL) (95% CIa)‡‡
Men 14.93 (14.92, 14.95) 14.64 (14.60, 14.68)Women 13.41 (13.39, 13.42) 13.10 (13.07, 13.13)
a CI, confidence interval.* p � 0.05 for difference between consenters and nonconsent-
ers by chi-square for percent sex and ancestry and by t-test formean age.
† American Indian, Pacific Islander, mixed race, or unknown.** Values available for a subset of consenters (19,752 men;
21,015 women) and nonconsenters (3,240 men; 3,880 women).‡‡ Values available for a subset of consenters (20,030 men;
21,290 women) and nonconsenters (4,639 men; 5,693 women).
Waalen et al. Blood Cells, Molecules, and Diseases (2002) 29(3) Nov/Dec: 418–432
doi:10.1006/bcmd.2002.0596
419

matosis screening study. Kaiser Permanente SanDiego has approximately 500,000 enrollees rep-resenting one-third of the area’s population. Inany given four year period, 81% of all adultmembers over the age of 25 will have attended theHealth Appraisal Center at least once. Membersof the health plan choose to be examined at thiscenter for a variety of reasons. Some are aware ofexisting health problems; others attend becausethey wish to avoid the development of prevent-able disease. Patients complete a 400-item vali-dated questionnaire that includes informationabout their previous and current health and abouttheir ethnic origin, including specific regions ofEurope or Asia, educational status and other de-mographic information. All patients undergo a
complete physical examination and a standard setof tests that include serum iron and total ironbinding capacity, among many other tests (Table 1).
All patients over the age of 25 who registeredfor an appointment at the Health Appraisal Centerwere offered participation in a research projectin which analysis of DNA and the determinationof serum ferritin would be added to the testsnormally performed. Aspartate aminotransferaseconcentrations were also measured on C282Yhomozygotes and all subjects in the study attend-ing the Health Appraisal Center during part ofJanuary and September 2000. The study was ap-proved by the Institutional Review Boards of Kai-ser Permanente and The Scripps Research Insti-tute.
TABLE 3
Demographic Characteristics of Participants
Ancestry and sexNumber ofparticipants Mean age (years) � SD
Number with collegeeducation*
Number with less thanhigh school education
WhiteMen 16,237 56.9 � 13.7 8,062 (49.7%) 585 (3.6%)Women 16,583 57.1 � 13.9 6,263 (37.8%) 722 (4.4%)
HispanicMen 1,302 51.5 � 13.8 333 (25.6%) 271 (20.9%)Women 1,684 47.2 � 13.8 396 (21.9%) 421 (25.0%)
BlackMen 766 51.5 � 12.5 267 (36.3%) 27 (3.7%)Women 735 49.8 � 12.7 278 (36.3%) 34 (4.4%)
AsianMen 749 50.8 � 12.5 396 (52.9%) 43 (5.7%)Women 1,065 49.4 � 12.6 579 (54.4%) 82 (7.7%)
Other/mixed†Men 1,188 53.0 � 14.5 330 (27.8%) 81 (6.8%)Women 1,393 50.7 � 15.5 328 (23.5%) 105 (7.5%)
* 4-year college degree or higher.† American Indian, Pacific Islander, mixed race, or unknown.
TABLE 4
Prevalence of HFE Genotypes by Ancestry
Genotype White (n � 32,820) Hispanic (n � 2,986) Black (n � 1,501) Asian (n � 1,814) Other/mixed (n � 2,581)
C282Y/C282Y 145 (0.4%) 5 (0.2%) 0 (0%) 0 (0%) 6 (0.2%)C282Y/H63D 574 (1.7%) 21 (0.7%) 4 (0.3%) 0 (0%) 30 (1.2%)H63D/H63D 771 (2.3%) 40 (1.3%) 3 (0.2%) 5 (0.3%) 39 (1.5%)C282Y/wt* 3,145 (9.6%) 91 (3.0%) 53 (3.5%) 4 (0.2%) 164 (6.4%)H63D/wt 7,609 (23.2%) 600 (20.1%) 126 (8.4%) 124 (6.8%) 440 (17.0%)wt/wt 20,576 (62.7%) 2,229 (74.6%) 1,315 (87.6%) 1,681 (92.7%) 1,902 (73.7%)
wt � wildtype. Samples without the C282Y and the H63D mutation are classified as wt. A very small percentage of these chromosomescontain the S65C mutation (see Table 5).
Blood Cells, Molecules, and Diseases (2002) 29(3) Nov/Dec: 418–432 Waalen et al.doi:10.1006/bcmd.2002.0596
420
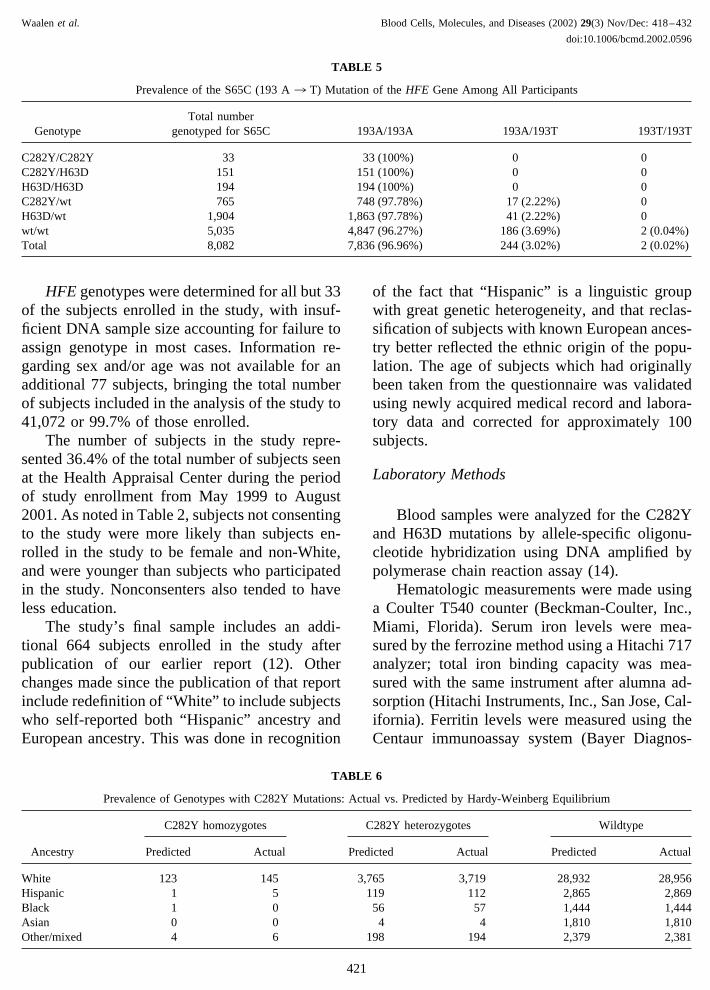
HFE genotypes were determined for all but 33of the subjects enrolled in the study, with insuf-ficient DNA sample size accounting for failure toassign genotype in most cases. Information re-garding sex and/or age was not available for anadditional 77 subjects, bringing the total numberof subjects included in the analysis of the study to41,072 or 99.7% of those enrolled.
The number of subjects in the study repre-sented 36.4% of the total number of subjects seenat the Health Appraisal Center during the periodof study enrollment from May 1999 to August2001. As noted in Table 2, subjects not consentingto the study were more likely than subjects en-rolled in the study to be female and non-White,and were younger than subjects who participatedin the study. Nonconsenters also tended to haveless education.
The study’s final sample includes an addi-tional 664 subjects enrolled in the study afterpublication of our earlier report (12). Otherchanges made since the publication of that reportinclude redefinition of “White” to include subjectswho self-reported both “Hispanic” ancestry andEuropean ancestry. This was done in recognition
of the fact that “Hispanic” is a linguistic groupwith great genetic heterogeneity, and that reclas-sification of subjects with known European ances-try better reflected the ethnic origin of the popu-lation. The age of subjects which had originallybeen taken from the questionnaire was validatedusing newly acquired medical record and labora-tory data and corrected for approximately 100subjects.
Laboratory Methods
Blood samples were analyzed for the C282Yand H63D mutations by allele-specific oligonu-cleotide hybridization using DNA amplified bypolymerase chain reaction assay (14).
Hematologic measurements were made usinga Coulter T540 counter (Beckman-Coulter, Inc.,Miami, Florida). Serum iron levels were mea-sured by the ferrozine method using a Hitachi 717analyzer; total iron binding capacity was mea-sured with the same instrument after alumna ad-sorption (Hitachi Instruments, Inc., San Jose, Cal-ifornia). Ferritin levels were measured using theCentaur immunoassay system (Bayer Diagnos-
TABLE 5
Prevalence of the S65C (193 A 3 T) Mutation of the HFE Gene Among All Participants
GenotypeTotal number
genotyped for S65C 193A/193A 193A/193T 193T/193T
C282Y/C282Y 33 33 (100%) 0 0C282Y/H63D 151 151 (100%) 0 0H63D/H63D 194 194 (100%) 0 0C282Y/wt 765 748 (97.78%) 17 (2.22%) 0H63D/wt 1,904 1,863 (97.78%) 41 (2.22%) 0wt/wt 5,035 4,847 (96.27%) 186 (3.69%) 2 (0.04%)Total 8,082 7,836 (96.96%) 244 (3.02%) 2 (0.02%)
TABLE 6
Prevalence of Genotypes with C282Y Mutations: Actual vs. Predicted by Hardy-Weinberg Equilibrium
Ancestry
C282Y homozygotes C282Y heterozygotes Wildtype
Predicted Actual Predicted Actual Predicted Actual
White 123 145 3,765 3,719 28,932 28,956Hispanic 1 5 119 112 2,865 2,869Black 1 0 56 57 1,444 1,444Asian 0 0 4 4 1,810 1,810Other/mixed 4 6 198 194 2,379 2,381
Waalen et al. Blood Cells, Molecules, and Diseases (2002) 29(3) Nov/Dec: 418–432
doi:10.1006/bcmd.2002.0596
421
tics, Tarrytown, New York). Transferrin satura-tion was calculated as ([serum iron]/[total ironbinding capacity]) � 100%.
Statistical Analysis
Mean transferrin saturation, serum ferritin,and serum iron were calculated with 95% confi-dence intervals. Serum ferritin levels were logtransformed to correct for the skewed distribution.The distribution of ages of C282Y homozygoteswas compared to that of wildtype using quantile:quantile plots and the 2-sample Kolmogorov-Smirnov statistic. Prevalence of symptoms ofC282Y homozygotes and wildtype controls wascompared using chi-square or Fisher’s exact testwhen appropriate. Logistic regression models
were also used to compare prevalence of symp-toms between C282Y homozygotes and wildtypecontrols adjusted for the effects of age, sex, andknowledge of hemochromatosis diagnosis prior toanswering the questionnaire. Definitions of the 12signs and symptoms used in this analysis werebased on questionnaire data and laboratory valueswhen appropriate as described in our previousreport (12).
RESULTS
Demographics
The majority of the subjects enrolled in thestudy were White (78.7%). Hispanics, the nextlargest self-reported ancestry group, represented
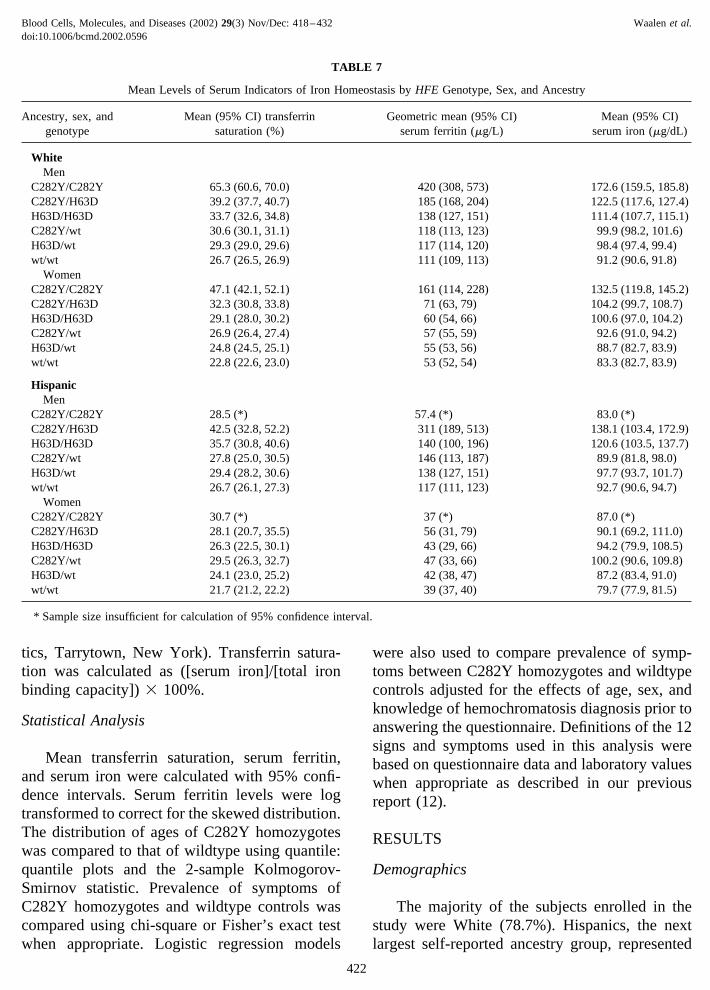
TABLE 7
Mean Levels of Serum Indicators of Iron Homeostasis by HFE Genotype, Sex, and Ancestry
Ancestry, sex, andgenotype
Mean (95% CI) transferrinsaturation (%)
Geometric mean (95% CI)serum ferritin (�g/L)
Mean (95% CI)serum iron (�g/dL)
WhiteMen
C282Y/C282Y 65.3 (60.6, 70.0) 420 (308, 573) 172.6 (159.5, 185.8)C282Y/H63D 39.2 (37.7, 40.7) 185 (168, 204) 122.5 (117.6, 127.4)H63D/H63D 33.7 (32.6, 34.8) 138 (127, 151) 111.4 (107.7, 115.1)C282Y/wt 30.6 (30.1, 31.1) 118 (113, 123) 99.9 (98.2, 101.6)H63D/wt 29.3 (29.0, 29.6) 117 (114, 120) 98.4 (97.4, 99.4)wt/wt 26.7 (26.5, 26.9) 111 (109, 113) 91.2 (90.6, 91.8)
WomenC282Y/C282Y 47.1 (42.1, 52.1) 161 (114, 228) 132.5 (119.8, 145.2)C282Y/H63D 32.3 (30.8, 33.8) 71 (63, 79) 104.2 (99.7, 108.7)H63D/H63D 29.1 (28.0, 30.2) 60 (54, 66) 100.6 (97.0, 104.2)C282Y/wt 26.9 (26.4, 27.4) 57 (55, 59) 92.6 (91.0, 94.2)H63D/wt 24.8 (24.5, 25.1) 55 (53, 56) 88.7 (82.7, 83.9)wt/wt 22.8 (22.6, 23.0) 53 (52, 54) 83.3 (82.7, 83.9)
HispanicMen
C282Y/C282Y 28.5 (*) 57.4 (*) 83.0 (*)C282Y/H63D 42.5 (32.8, 52.2) 311 (189, 513) 138.1 (103.4, 172.9)H63D/H63D 35.7 (30.8, 40.6) 140 (100, 196) 120.6 (103.5, 137.7)C282Y/wt 27.8 (25.0, 30.5) 146 (113, 187) 89.9 (81.8, 98.0)H63D/wt 29.4 (28.2, 30.6) 138 (127, 151) 97.7 (93.7, 101.7)wt/wt 26.7 (26.1, 27.3) 117 (111, 123) 92.7 (90.6, 94.7)
WomenC282Y/C282Y 30.7 (*) 37 (*) 87.0 (*)C282Y/H63D 28.1 (20.7, 35.5) 56 (31, 79) 90.1 (69.2, 111.0)H63D/H63D 26.3 (22.5, 30.1) 43 (29, 66) 94.2 (79.9, 108.5)C282Y/wt 29.5 (26.3, 32.7) 47 (33, 66) 100.2 (90.6, 109.8)H63D/wt 24.1 (23.0, 25.2) 42 (38, 47) 87.2 (83.4, 91.0)wt/wt 21.7 (21.2, 22.2) 39 (37, 40) 79.7 (77.9, 81.5)
* Sample size insufficient for calculation of 95% confidence interval.
Blood Cells, Molecules, and Diseases (2002) 29(3) Nov/Dec: 418–432 Waalen et al.doi:10.1006/bcmd.2002.0596
422
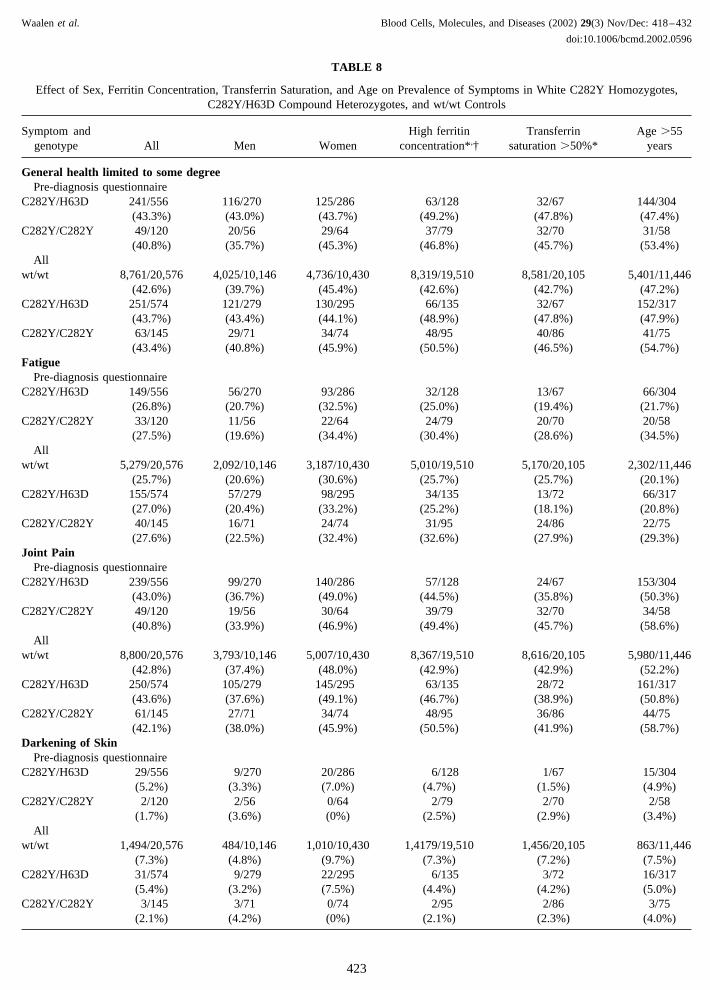
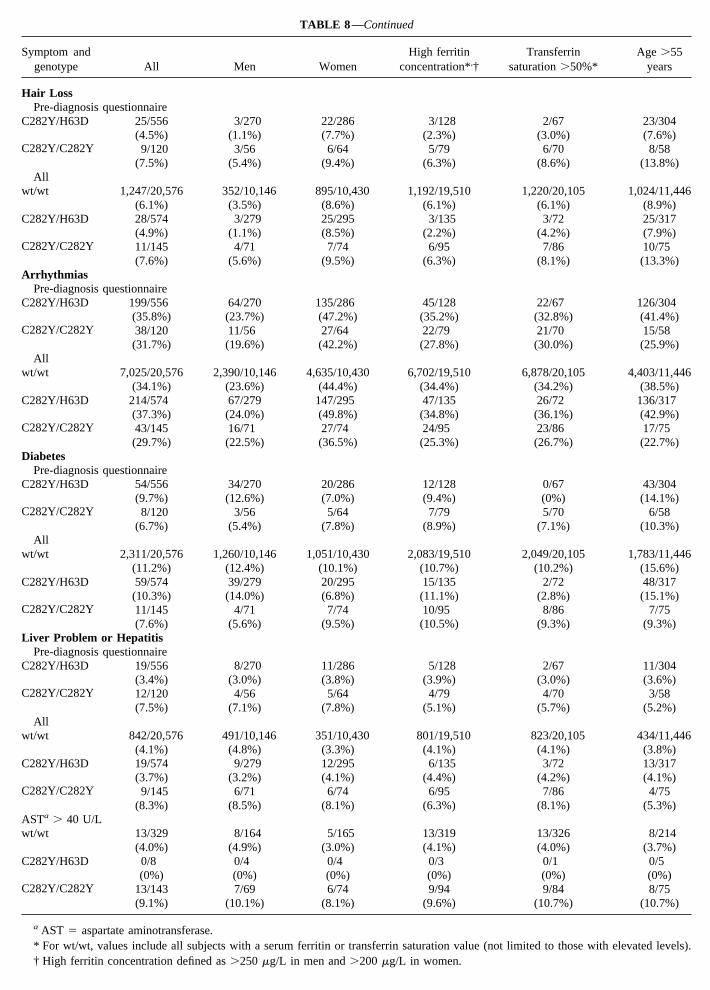
TABLE 8
Effect of Sex, Ferritin Concentration, Transferrin Saturation, and Age on Prevalence of Symptoms in White C282Y Homozygotes,C282Y/H63D Compound Heterozygotes, and wt/wt Controls
Symptom andgenotype All Men Women
High ferritinconcentration*,†
Transferrinsaturation �50%*
Age �55years
General health limited to some degreePre-diagnosis questionnaire
C282Y/H63D 241/556 116/270 125/286 63/128 32/67 144/304(43.3%) (43.0%) (43.7%) (49.2%) (47.8%) (47.4%)
C282Y/C282Y 49/120 20/56 29/64 37/79 32/70 31/58(40.8%) (35.7%) (45.3%) (46.8%) (45.7%) (53.4%)
Allwt/wt 8,761/20,576 4,025/10,146 4,736/10,430 8,319/19,510 8,581/20,105 5,401/11,446
(42.6%) (39.7%) (45.4%) (42.6%) (42.7%) (47.2%)C282Y/H63D 251/574 121/279 130/295 66/135 32/67 152/317
(43.7%) (43.4%) (44.1%) (48.9%) (47.8%) (47.9%)C282Y/C282Y 63/145 29/71 34/74 48/95 40/86 41/75
(43.4%) (40.8%) (45.9%) (50.5%) (46.5%) (54.7%)Fatigue
Pre-diagnosis questionnaireC282Y/H63D 149/556 56/270 93/286 32/128 13/67 66/304
(26.8%) (20.7%) (32.5%) (25.0%) (19.4%) (21.7%)C282Y/C282Y 33/120 11/56 22/64 24/79 20/70 20/58
(27.5%) (19.6%) (34.4%) (30.4%) (28.6%) (34.5%)All
wt/wt 5,279/20,576 2,092/10,146 3,187/10,430 5,010/19,510 5,170/20,105 2,302/11,446(25.7%) (20.6%) (30.6%) (25.7%) (25.7%) (20.1%)
C282Y/H63D 155/574 57/279 98/295 34/135 13/72 66/317(27.0%) (20.4%) (33.2%) (25.2%) (18.1%) (20.8%)
C282Y/C282Y 40/145 16/71 24/74 31/95 24/86 22/75(27.6%) (22.5%) (32.4%) (32.6%) (27.9%) (29.3%)
Joint PainPre-diagnosis questionnaire
C282Y/H63D 239/556 99/270 140/286 57/128 24/67 153/304(43.0%) (36.7%) (49.0%) (44.5%) (35.8%) (50.3%)
C282Y/C282Y 49/120 19/56 30/64 39/79 32/70 34/58(40.8%) (33.9%) (46.9%) (49.4%) (45.7%) (58.6%)
Allwt/wt 8,800/20,576 3,793/10,146 5,007/10,430 8,367/19,510 8,616/20,105 5,980/11,446
(42.8%) (37.4%) (48.0%) (42.9%) (42.9%) (52.2%)C282Y/H63D 250/574 105/279 145/295 63/135 28/72 161/317
(43.6%) (37.6%) (49.1%) (46.7%) (38.9%) (50.8%)C282Y/C282Y 61/145 27/71 34/74 48/95 36/86 44/75
(42.1%) (38.0%) (45.9%) (50.5%) (41.9%) (58.7%)Darkening of Skin
Pre-diagnosis questionnaireC282Y/H63D 29/556 9/270 20/286 6/128 1/67 15/304
(5.2%) (3.3%) (7.0%) (4.7%) (1.5%) (4.9%)C282Y/C282Y 2/120 2/56 0/64 2/79 2/70 2/58
(1.7%) (3.6%) (0%) (2.5%) (2.9%) (3.4%)All
wt/wt 1,494/20,576 484/10,146 1,010/10,430 1,4179/19,510 1,456/20,105 863/11,446(7.3%) (4.8%) (9.7%) (7.3%) (7.2%) (7.5%)
C282Y/H63D 31/574 9/279 22/295 6/135 3/72 16/317(5.4%) (3.2%) (7.5%) (4.4%) (4.2%) (5.0%)
C282Y/C282Y 3/145 3/71 0/74 2/95 2/86 3/75(2.1%) (4.2%) (0%) (2.1%) (2.3%) (4.0%)
Waalen et al. Blood Cells, Molecules, and Diseases (2002) 29(3) Nov/Dec: 418–432
doi:10.1006/bcmd.2002.0596
423
Symptom andgenotype All Men Women
High ferritinconcentration*,†
Transferrinsaturation �50%*
Age �55years
Abdominal PainPre-diagnosis questionnaire
C282Y/H63D 57/556 16/270 41/286 8/128 5/67 25/304(10.3%) (5.9%) (14.3%) (6.3%) (7.5%) (8.2%)
C282Y/C282Y 12/120 5/56 7/64 9/79 6/70 6/58(10.0%) (8.9%) (10.9%) (11.4%) (8.6%) (10.3%)
Allwt/wt 1,931/20,576 650/10,146 1,281/10,430 1,830/19,510 1,883/20,105 1,008/11,446
(9.4%) (6.4%) (12.3%) (9.4%) (9.4%) (8.8%)C282Y/H63D 57/574 16/279 41/295 8/135 5/72 26/317
(9.9%) (5.7%) (13.9%) (5.9%) (6.9%) (8.2%)C282Y/C282Y 13/145 6/71 7/74 10/95 6/86 7/75
(9.0%) (8.5%) (9.5%) (10.5%) (7.0%) (9.3%)Impotence
Pre-diagnosis questionnaireC282Y/H63D 113/270 42/92 15/43 91/148
(41.9%) (45.7%) (34.9%) (61.5%)C282Y/C282Y 15/56 12/44 14/45 11/24
(26.8%) (27.3%) (31.1%) (45.8%)All
wt/wt 3,716/10,146 3,571/9,619 3,630/9,897 3,074/5,726(36.6%) (37.1%) (36.7%) (53.7%)
C282Y/H63D 117/279 45/95 16/46 95/156(41.9%) (47.4%) (34.8%) (60.9%)
C282Y/C282Y 20/71 15/51 18/56 16/33(28.2%) (29.4%) (32.1%) (48.5%)
DepressionPre-diagnosis questionnaire
C282Y/H63D 97/556 29/270 68/286 13/128 16/67 41/304(17.4%) (10.7%) (23.8%) (10.2%) (23.9%) (13.5%)
C282Y/C282Y 20/120 4/56 16/64 13/79 8/70 6/58(16.7%) (7.1%) (25.0%) (16.5%) (11.4%) (10.3%)
Allwt/wt 3,600/20,576 1,142/10,146 2,458/10,430 3,396/19,510 3,523/20,105 1,616/11,446
(17.5%) (11.3%) (23.6%) (17.4%) (17.5%) (14.1%)C282Y/H63D 101/574 29/279 72/295 13/135 17/72 44/317
(17.6%) (10.4%) (24.4%) (9.6%) (23.6%) (13.9%)C282Y/C282Y 22/145 5/71 17/74 14/95 9/86 8/75
(15.2%) (7.0%) (23.0%) (14.7%) (10.5%) (10.7%)Weight Loss
Pre-diagnosis questionnaireC282Y/H63D 41/556 16/270 25/286 8/128 9/67 24/304
(7.4%) (5.9%) (8.7%) (6.3%) (13.4%) (7.9%)C282Y/C282Y 8/120 2/56 6/64 6/79 4/70 3/58
(6.7%) (3.6%) (9.4%) (7.6%) (5.7%) (5.2%)All
wt/wt 1,500/20,576 719/10,146 781/10,430 1,422/19,510 1,459/20,105 826/11,446(7.3%) (7.1%) (7.5%) (7.3%) (7.3%) (7.2%)
C282Y/H63D 42/574 16/279 26/295 8/135 10/72 25/317(7.3%) (5.7%) (8.8%) (5.9%) (13.9%) (7.9%)
C282Y/C282Y 10/145 3/71 7/74 8/95 6/86 5/75(6.9%) (4.2%) (9.5%) (8.4%) (7.0%) (6.7%)
Blood Cells, Molecules, and Diseases (2002) 29(3) Nov/Dec: 418–432 Waalen et al.doi:10.1006/bcmd.2002.0596
424
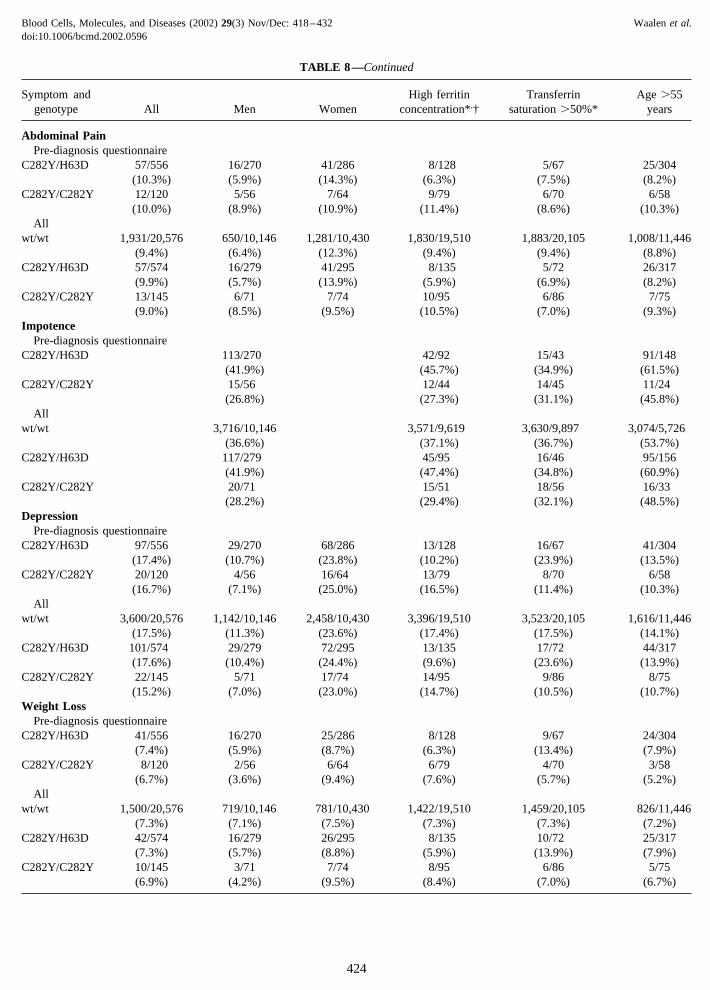
TABLE 8—Continued
Symptom andgenotype All Men Women
High ferritinconcentration*,†
Transferrinsaturation �50%*
Age �55years
Hair LossPre-diagnosis questionnaire
C282Y/H63D 25/556 3/270 22/286 3/128 2/67 23/304(4.5%) (1.1%) (7.7%) (2.3%) (3.0%) (7.6%)
C282Y/C282Y 9/120 3/56 6/64 5/79 6/70 8/58(7.5%) (5.4%) (9.4%) (6.3%) (8.6%) (13.8%)
Allwt/wt 1,247/20,576 352/10,146 895/10,430 1,192/19,510 1,220/20,105 1,024/11,446
(6.1%) (3.5%) (8.6%) (6.1%) (6.1%) (8.9%)C282Y/H63D 28/574 3/279 25/295 3/135 3/72 25/317
(4.9%) (1.1%) (8.5%) (2.2%) (4.2%) (7.9%)C282Y/C282Y 11/145 4/71 7/74 6/95 7/86 10/75
(7.6%) (5.6%) (9.5%) (6.3%) (8.1%) (13.3%)Arrhythmias
Pre-diagnosis questionnaireC282Y/H63D 199/556 64/270 135/286 45/128 22/67 126/304
(35.8%) (23.7%) (47.2%) (35.2%) (32.8%) (41.4%)C282Y/C282Y 38/120 11/56 27/64 22/79 21/70 15/58
(31.7%) (19.6%) (42.2%) (27.8%) (30.0%) (25.9%)All
wt/wt 7,025/20,576 2,390/10,146 4,635/10,430 6,702/19,510 6,878/20,105 4,403/11,446(34.1%) (23.6%) (44.4%) (34.4%) (34.2%) (38.5%)
C282Y/H63D 214/574 67/279 147/295 47/135 26/72 136/317(37.3%) (24.0%) (49.8%) (34.8%) (36.1%) (42.9%)
C282Y/C282Y 43/145 16/71 27/74 24/95 23/86 17/75(29.7%) (22.5%) (36.5%) (25.3%) (26.7%) (22.7%)
DiabetesPre-diagnosis questionnaire
C282Y/H63D 54/556 34/270 20/286 12/128 0/67 43/304(9.7%) (12.6%) (7.0%) (9.4%) (0%) (14.1%)
C282Y/C282Y 8/120 3/56 5/64 7/79 5/70 6/58(6.7%) (5.4%) (7.8%) (8.9%) (7.1%) (10.3%)
Allwt/wt 2,311/20,576 1,260/10,146 1,051/10,430 2,083/19,510 2,049/20,105 1,783/11,446
(11.2%) (12.4%) (10.1%) (10.7%) (10.2%) (15.6%)C282Y/H63D 59/574 39/279 20/295 15/135 2/72 48/317
(10.3%) (14.0%) (6.8%) (11.1%) (2.8%) (15.1%)C282Y/C282Y 11/145 4/71 7/74 10/95 8/86 7/75
(7.6%) (5.6%) (9.5%) (10.5%) (9.3%) (9.3%)Liver Problem or Hepatitis
Pre-diagnosis questionnaireC282Y/H63D 19/556 8/270 11/286 5/128 2/67 11/304
(3.4%) (3.0%) (3.8%) (3.9%) (3.0%) (3.6%)C282Y/C282Y 12/120 4/56 5/64 4/79 4/70 3/58
(7.5%) (7.1%) (7.8%) (5.1%) (5.7%) (5.2%)All
wt/wt 842/20,576 491/10,146 351/10,430 801/19,510 823/20,105 434/11,446(4.1%) (4.8%) (3.3%) (4.1%) (4.1%) (3.8%)
C282Y/H63D 19/574 9/279 12/295 6/135 3/72 13/317(3.7%) (3.2%) (4.1%) (4.4%) (4.2%) (4.1%)
C282Y/C282Y 9/145 6/71 6/74 6/95 7/86 4/75(8.3%) (8.5%) (8.1%) (6.3%) (8.1%) (5.3%)
ASTa � 40 U/Lwt/wt 13/329 8/164 5/165 13/319 13/326 8/214
(4.0%) (4.9%) (3.0%) (4.1%) (4.0%) (3.7%)C282Y/H63D 0/8 0/4 0/4 0/3 0/1 0/5
(0%) (0%) (0%) (0%) (0%) (0%)C282Y/C282Y 13/143 7/69 6/74 9/94 9/84 8/75
(9.1%) (10.1%) (8.1%) (9.6%) (10.7%) (10.7%)
a AST � aspartate aminotransferase.* For wt/wt, values include all subjects with a serum ferritin or transferrin saturation value (not limited to those with elevated levels).† High ferritin concentration defined as �250 �g/L in men and �200 �g/L in women.
TABLE 8—Continued
an additional 7.2%. Additional demographic in-formation is given in Table 3.
Frequency of HFE Genotypes
Breakdown of HFE genotype by self-reportedancestry is given in Table 4 and prevalence of theS65C mutation is given in Table 5. Prevalence ofthe C282Y homozygous genotype closely approx-imated that predicted by the Hardy-Weinbergequilibrium for all ancestry groups except His-panic (Table 6). Before reclassification of somepatients designating themselves as “Hispanic” to“White” based on European ancestry (see above),the aberration from the values predicted was evenlarger.
Levels of Indicators of Iron Homeostasis
Mean levels of indicators of iron homeostasis,including transferrin saturation, serum ferritin,and serum iron, were highest in C282Y homozy-
gotes followed by C282Y/H63D compound het-erozygotes, H63D/H63D homozygotes, C282Yheterozygotes, H63D heterozygotes, and wild-type among Whites of both sexes (Table 7). Asimilar trend was seen for Hispanics, although thelow numbers of male and female C282Y homozy-gotes (n � 2 and n � 3 respectively) precludedstatistical comparisons for this group.
Prevalence of Symptoms Associated with IronOverload
A serum transferrin saturation and ferritin-based screening program had been carried out atthe same facility several years earlier and there-fore clinic records or questionnaire responses in-dicated that 204 of the participants had been pre-viously diagnosed with hemochromatosis. Ofthese, 44 proved to be homozygotes for theC282Y mutation, including 42 Whites, and 22proved to be compound heterozygotes (C282Y/
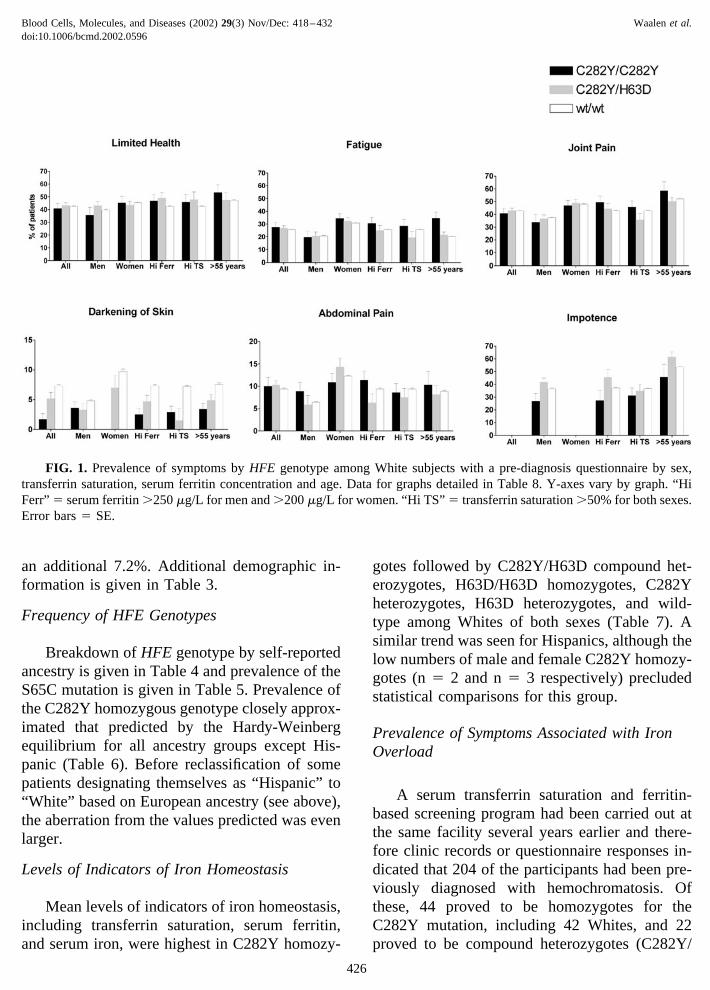
FIG. 1. Prevalence of symptoms by HFE genotype among White subjects with a pre-diagnosis questionnaire by sex,transferrin saturation, serum ferritin concentration and age. Data for graphs detailed in Table 8. Y-axes vary by graph. “HiFerr” � serum ferritin �250 �g/L for men and �200 �g/L for women. “Hi TS” � transferrin saturation �50% for both sexes.Error bars � SE.
Blood Cells, Molecules, and Diseases (2002) 29(3) Nov/Dec: 418–432 Waalen et al.doi:10.1006/bcmd.2002.0596
426
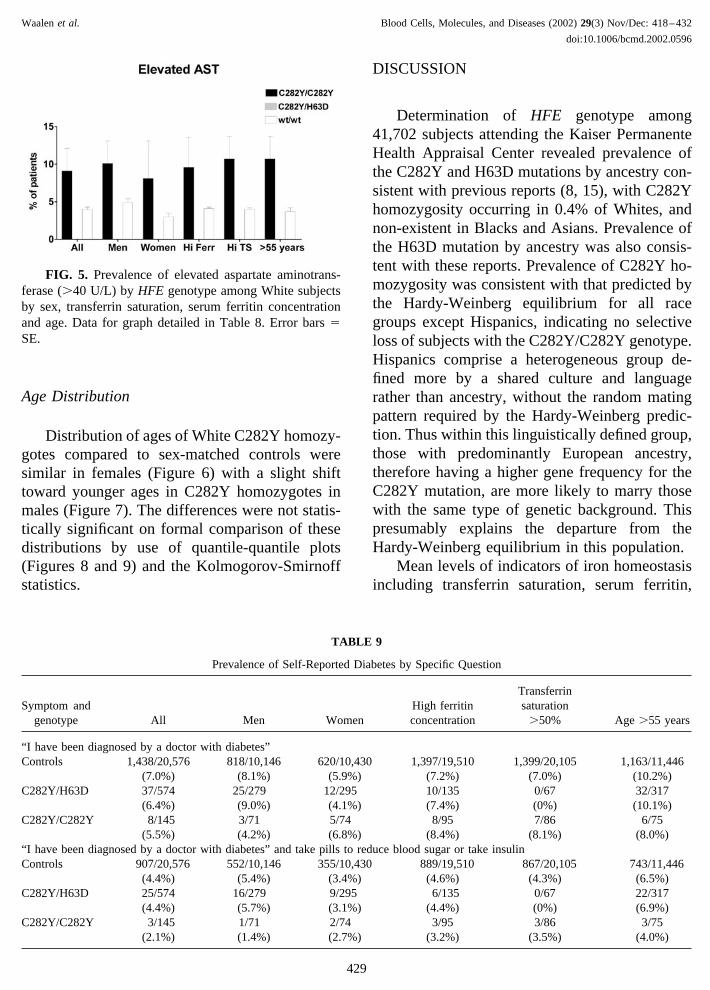
H63D), including 18 Whites. However, pre-diag-nosis questionnaires were available for 17 WhiteC282Y homozygotes, and therefore their re-sponses were deemed to be unbiased by knowl-edge of the diagnosis and they were included inthe assessment of symptoms. The prevalence of12 symptoms commonly associated with hemo-chromatosis and prevalence of elevated aspartateaminotransferase (AST) levels as an indicator ofliver function were compared in the White C282Yhomozygotes, C282Y/H63D compound heterozy-gotes and sex- and ancestry-matched wildtypecontrols (Table 8, Figures 1–5). Only the preva-lence of liver problems or hepatitis and of ele-vated AST levels were statistically significantlyincreased in C282Y homozygotes compared tosex-matched wildtype controls when a correctionwas applied for multiple comparisons. Resultswere the same when analysis was limited to sub-jects 55 years and older. Prevalence of symptomswas not higher among C282Y homozygotes or
C282Y/H63D compound heterozygotes with ele-vated transferrin saturation (defined as �50%) orelevated serum ferritin (defined as �250 �g/L inmen and �200 �g/L in women).
The definition of some symptoms includedanswers to more than one question and in the caseof diabetes included a random glucose measure-ment. No differences in prevalence of symptomsby genotype existed when questions used to de-fine diabetes (Table 9) and impotence (Table 10)were examined separately.
Logistic regression models for prevalence ofgeneral health and fatigue respectively revealedthat genotype did not have a significant effect onthe prevalence of either of these symptoms con-trolling for age, sex, and prior diagnosis. In thesemodels, limited general health was significantly as-sociated with increasing age, female sex, and knowl-edge of diagnosis of hemochromatosis independentof genotype. Fatigue was significantly associatedwith lower ages, female sex and prior diagnosis.
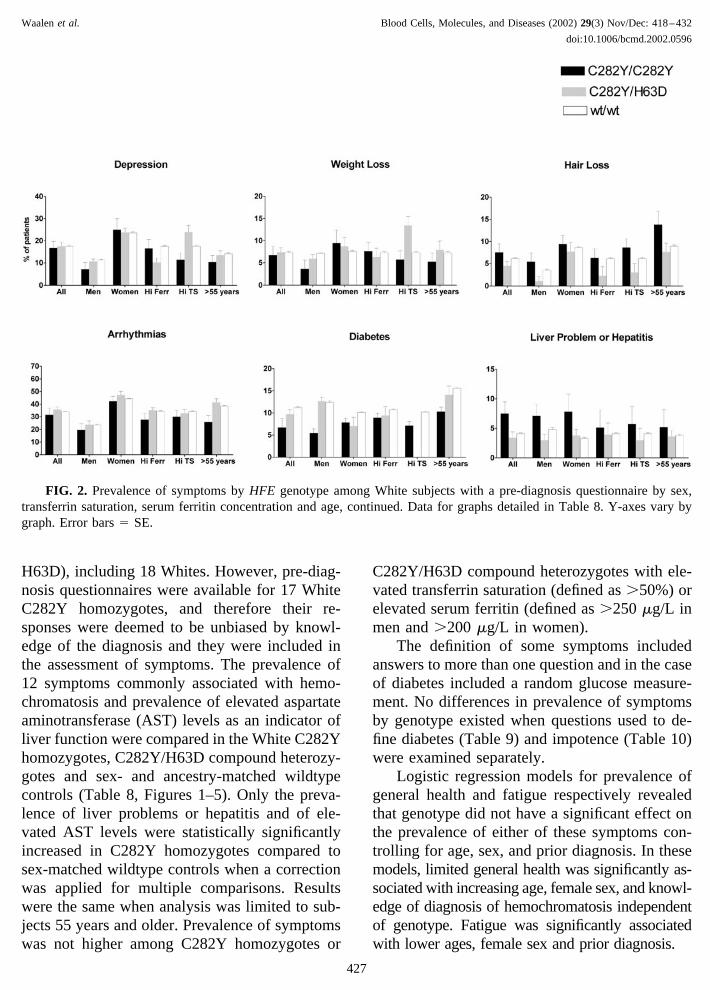
FIG. 2. Prevalence of symptoms by HFE genotype among White subjects with a pre-diagnosis questionnaire by sex,transferrin saturation, serum ferritin concentration and age, continued. Data for graphs detailed in Table 8. Y-axes vary bygraph. Error bars � SE.
Waalen et al. Blood Cells, Molecules, and Diseases (2002) 29(3) Nov/Dec: 418–432
doi:10.1006/bcmd.2002.0596
427
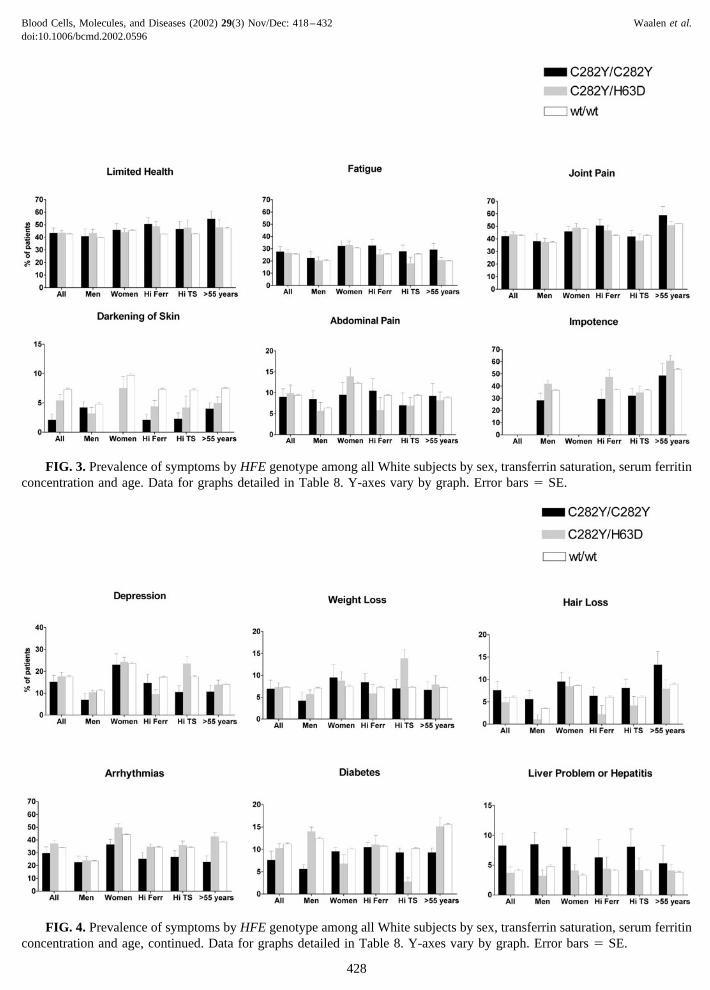
FIG. 3. Prevalence of symptoms by HFE genotype among all White subjects by sex, transferrin saturation, serum ferritinconcentration and age. Data for graphs detailed in Table 8. Y-axes vary by graph. Error bars � SE.
FIG. 4. Prevalence of symptoms by HFE genotype among all White subjects by sex, transferrin saturation, serum ferritinconcentration and age, continued. Data for graphs detailed in Table 8. Y-axes vary by graph. Error bars � SE.
Blood Cells, Molecules, and Diseases (2002) 29(3) Nov/Dec: 418–432 Waalen et al.doi:10.1006/bcmd.2002.0596
428
Age Distribution
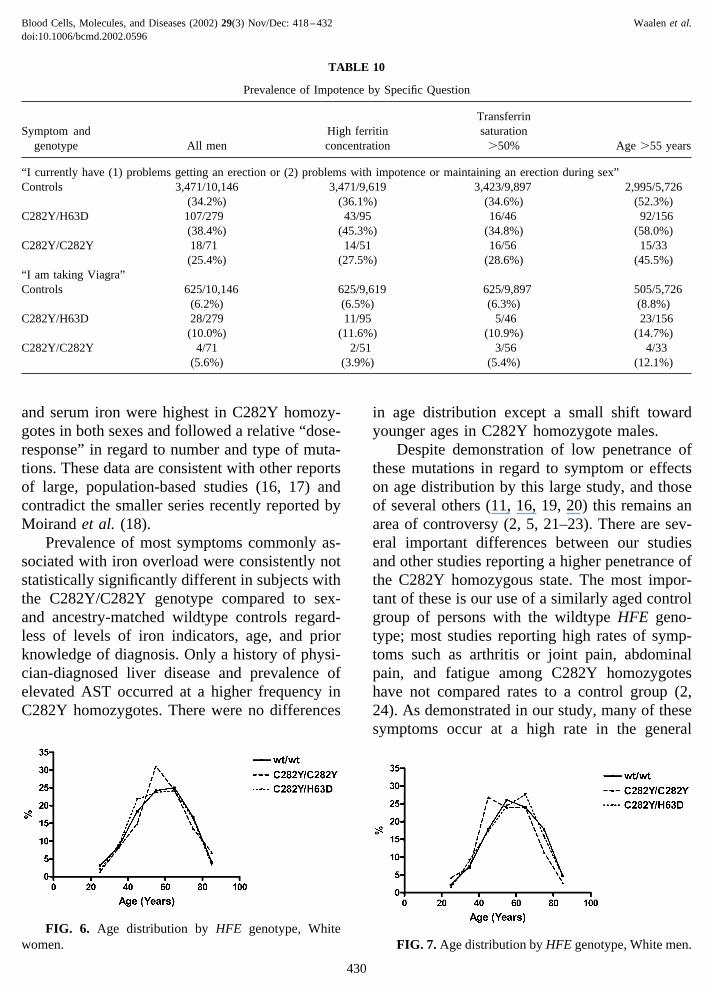
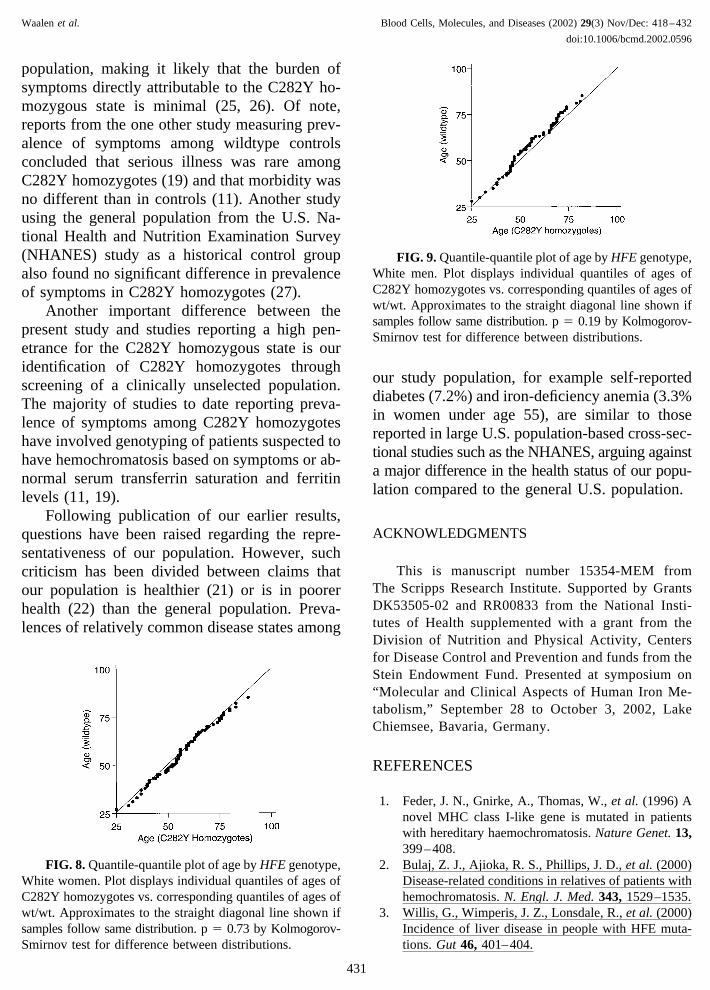
Distribution of ages of White C282Y homozy-gotes compared to sex-matched controls weresimilar in females (Figure 6) with a slight shifttoward younger ages in C282Y homozygotes inmales (Figure 7). The differences were not statis-tically significant on formal comparison of thesedistributions by use of quantile-quantile plots(Figures 8 and 9) and the Kolmogorov-Smirnoffstatistics.
DISCUSSION
Determination of HFE genotype among41,702 subjects attending the Kaiser PermanenteHealth Appraisal Center revealed prevalence ofthe C282Y and H63D mutations by ancestry con-sistent with previous reports (8, 15), with C282Yhomozygosity occurring in 0.4% of Whites, andnon-existent in Blacks and Asians. Prevalence ofthe H63D mutation by ancestry was also consis-tent with these reports. Prevalence of C282Y ho-mozygosity was consistent with that predicted bythe Hardy-Weinberg equilibrium for all racegroups except Hispanics, indicating no selectiveloss of subjects with the C282Y/C282Y genotype.Hispanics comprise a heterogeneous group de-fined more by a shared culture and languagerather than ancestry, without the random matingpattern required by the Hardy-Weinberg predic-tion. Thus within this linguistically defined group,those with predominantly European ancestry,therefore having a higher gene frequency for theC282Y mutation, are more likely to marry thosewith the same type of genetic background. Thispresumably explains the departure from theHardy-Weinberg equilibrium in this population.
Mean levels of indicators of iron homeostasisincluding transferrin saturation, serum ferritin,
TABLE 9
Prevalence of Self-Reported Diabetes by Specific Question
Symptom andgenotype All Men Women
High ferritinconcentration
Transferrinsaturation
�50% Age �55 years
“I have been diagnosed by a doctor with diabetes”Controls 1,438/20,576 818/10,146 620/10,430 1,397/19,510 1,399/20,105 1,163/11,446
(7.0%) (8.1%) (5.9%) (7.2%) (7.0%) (10.2%)C282Y/H63D 37/574 25/279 12/295 10/135 0/67 32/317
(6.4%) (9.0%) (4.1%) (7.4%) (0%) (10.1%)C282Y/C282Y 8/145 3/71 5/74 8/95 7/86 6/75
(5.5%) (4.2%) (6.8%) (8.4%) (8.1%) (8.0%)“I have been diagnosed by a doctor with diabetes” and take pills to reduce blood sugar or take insulinControls 907/20,576 552/10,146 355/10,430 889/19,510 867/20,105 743/11,446
(4.4%) (5.4%) (3.4%) (4.6%) (4.3%) (6.5%)C282Y/H63D 25/574 16/279 9/295 6/135 0/67 22/317
(4.4%) (5.7%) (3.1%) (4.4%) (0%) (6.9%)C282Y/C282Y 3/145 1/71 2/74 3/95 3/86 3/75
(2.1%) (1.4%) (2.7%) (3.2%) (3.5%) (4.0%)
FIG. 5. Prevalence of elevated aspartate aminotrans-ferase (�40 U/L) by HFE genotype among White subjectsby sex, transferrin saturation, serum ferritin concentrationand age. Data for graph detailed in Table 8. Error bars �SE.
Waalen et al. Blood Cells, Molecules, and Diseases (2002) 29(3) Nov/Dec: 418–432
doi:10.1006/bcmd.2002.0596
429
and serum iron were highest in C282Y homozy-gotes in both sexes and followed a relative “dose-response” in regard to number and type of muta-tions. These data are consistent with other reportsof large, population-based studies (16, 17) andcontradict the smaller series recently reported byMoirand et al. (18).
Prevalence of most symptoms commonly as-sociated with iron overload were consistently notstatistically significantly different in subjects withthe C282Y/C282Y genotype compared to sex-and ancestry-matched wildtype controls regard-less of levels of iron indicators, age, and priorknowledge of diagnosis. Only a history of physi-cian-diagnosed liver disease and prevalence ofelevated AST occurred at a higher frequency inC282Y homozygotes. There were no differences
in age distribution except a small shift towardyounger ages in C282Y homozygote males.
Despite demonstration of low penetrance ofthese mutations in regard to symptom or effectson age distribution by this large study, and thoseof several others (11, 16, 19, 20) this remains anarea of controversy (2, 5, 21–23). There are sev-eral important differences between our studiesand other studies reporting a higher penetrance ofthe C282Y homozygous state. The most impor-tant of these is our use of a similarly aged controlgroup of persons with the wildtype HFE geno-type; most studies reporting high rates of symp-toms such as arthritis or joint pain, abdominalpain, and fatigue among C282Y homozygoteshave not compared rates to a control group (2,24). As demonstrated in our study, many of thesesymptoms occur at a high rate in the general
TABLE 10
Prevalence of Impotence by Specific Question
Symptom andgenotype All men
High ferritinconcentration
Transferrinsaturation
�50% Age �55 years
“I currently have (1) problems getting an erection or (2) problems with impotence or maintaining an erection during sex”Controls 3,471/10,146 3,471/9,619 3,423/9,897 2,995/5,726
(34.2%) (36.1%) (34.6%) (52.3%)C282Y/H63D 107/279 43/95 16/46 92/156
(38.4%) (45.3%) (34.8%) (58.0%)C282Y/C282Y 18/71 14/51 16/56 15/33
(25.4%) (27.5%) (28.6%) (45.5%)“I am taking Viagra”Controls 625/10,146 625/9,619 625/9,897 505/5,726
(6.2%) (6.5%) (6.3%) (8.8%)C282Y/H63D 28/279 11/95 5/46 23/156
(10.0%) (11.6%) (10.9%) (14.7%)C282Y/C282Y 4/71 2/51 3/56 4/33
(5.6%) (3.9%) (5.4%) (12.1%)
FIG. 6. Age distribution by HFE genotype, Whitewomen. FIG. 7. Age distribution by HFE genotype, White men.
Blood Cells, Molecules, and Diseases (2002) 29(3) Nov/Dec: 418–432 Waalen et al.doi:10.1006/bcmd.2002.0596
430
population, making it likely that the burden ofsymptoms directly attributable to the C282Y ho-mozygous state is minimal (25, 26). Of note,reports from the one other study measuring prev-alence of symptoms among wildtype controlsconcluded that serious illness was rare amongC282Y homozygotes (19) and that morbidity wasno different than in controls (11). Another studyusing the general population from the U.S. Na-tional Health and Nutrition Examination Survey(NHANES) study as a historical control groupalso found no significant difference in prevalenceof symptoms in C282Y homozygotes (27).
Another important difference between thepresent study and studies reporting a high pen-etrance for the C282Y homozygous state is ouridentification of C282Y homozygotes throughscreening of a clinically unselected population.The majority of studies to date reporting preva-lence of symptoms among C282Y homozygoteshave involved genotyping of patients suspected tohave hemochromatosis based on symptoms or ab-normal serum transferrin saturation and ferritinlevels (11, 19).
Following publication of our earlier results,questions have been raised regarding the repre-sentativeness of our population. However, suchcriticism has been divided between claims thatour population is healthier (21) or is in poorerhealth (22) than the general population. Preva-lences of relatively common disease states among
our study population, for example self-reporteddiabetes (7.2%) and iron-deficiency anemia (3.3%in women under age 55), are similar to thosereported in large U.S. population-based cross-sec-tional studies such as the NHANES, arguing againsta major difference in the health status of our popu-lation compared to the general U.S. population.
ACKNOWLEDGMENTS
This is manuscript number 15354-MEM fromThe Scripps Research Institute. Supported by GrantsDK53505-02 and RR00833 from the National Insti-tutes of Health supplemented with a grant from theDivision of Nutrition and Physical Activity, Centersfor Disease Control and Prevention and funds from theStein Endowment Fund. Presented at symposium on“Molecular and Clinical Aspects of Human Iron Me-tabolism,” September 28 to October 3, 2002, LakeChiemsee, Bavaria, Germany.
REFERENCES
1. Feder, J. N., Gnirke, A., Thomas, W., et al. (1996) Anovel MHC class I-like gene is mutated in patientswith hereditary haemochromatosis. Nature Genet. 13,399–408.
2. Bulaj, Z. J., Ajioka, R. S., Phillips, J. D., et al. (2000)Disease-related conditions in relatives of patients withhemochromatosis. N. Engl. J. Med. 343, 1529–1535.
3. Willis, G., Wimperis, J. Z., Lonsdale, R., et al. (2000)Incidence of liver disease in people with HFE muta-tions. Gut 46, 401–404.
FIG. 8. Quantile-quantile plot of age by HFE genotype,White women. Plot displays individual quantiles of ages ofC282Y homozygotes vs. corresponding quantiles of ages ofwt/wt. Approximates to the straight diagonal line shown ifsamples follow same distribution. p � 0.73 by Kolmogorov-Smirnov test for difference between distributions.
FIG. 9. Quantile-quantile plot of age by HFE genotype,White men. Plot displays individual quantiles of ages ofC282Y homozygotes vs. corresponding quantiles of ages ofwt/wt. Approximates to the straight diagonal line shown ifsamples follow same distribution. p � 0.19 by Kolmogorov-Smirnov test for difference between distributions.
Waalen et al. Blood Cells, Molecules, and Diseases (2002) 29(3) Nov/Dec: 418–432
doi:10.1006/bcmd.2002.0596
431
4. Adams, P., Brissot, P., and Powell, L. (2000) EASLInternational Consensus Conference on Haemochro-matosis—Part II. Expert document. J. Hepatol. 33,487–496.
5. Deugnier, Y., Jouanolle, A. M., Chaperon, J., et al.(2002) Gender-specific phenotypic expression andscreening strategies in C282Y-linked haemochroma-tosis: a study of 9396 French people. Br. J. Haematol.118, 1170–1178.
6. Barton, J. C., Cheatwood, S. M., Key, T. J., andActon, R. T. (2002) Hemochromatosis detection in ahealth screening program at an Alabama forest prod-ucts mill. J. Occup. Environ. Med. 44, 745–751.
7. Niederau, C., and Strohmeyer, G. (2002) Strategies forearly diagnosis of haemochromatosis. Eur. J. Gastro-enterol. Hepatol. 14, 217–221.
8. Steinberg, K. K., Cogswell, M. E., Chang, J. C., et al.(2001) Prevalence of CY282Y and H63D mutations inthe hemochromatosis (HFE) gene in the United States.JAMA 285, 2216–2222.
9. Yapp, T. R., Eijkelkamp, E. J., and Powell, L. W.(2001) Population screening for HFE-associated hae-mochromatosis: should we have to pay for our genes?Internal Medicine Journal 31, 48–52.
10. Burke, W., Thomson, E., Khoury, M. J., et al. (1998)Hereditary hemochromatosis—Gene discovery and itsimplications for population-based screening. JAMA280, 172–178.
11. Åsberg, A., Hveem, K., Kruger, O., and Bjerve, K. S.(2002) Persons with screening-detected haemochro-matosis: as healthy as the general population? Scand.J. Gastroenterol. 37, 719–724.
12. Beutler, E., Felitti, V. J., Koziol, J. A., Ho, N. J., andGelbart, T. (2002) Penetrance of the 845G 3 A(C282Y) HFE hereditary haemochromatosis mutationin the USA. Lancet 359, 211–218.
13. Beutler, E., Felitti, V., Gelbart, T., and Ho, N. (2000)The effect of HFE genotypes in patients attending ahealth appraisal clinic. Ann. Intern. Med. 133, 329–337.
14. Beutler, E., and Gelbart, T. (2000) Large-scale screen-ing for HFE mutations: Methodology and cost. Genet.Testing 4, 131–142.
15. Merryweather-Clarke, A. T., Pointon, J. J., Jouanolle,A. M., Rochette, J., and Robson, K. J. H. (2000)Geography of HFE C282Y and H63D mutations.Genet. Testing 4, 183–198.
16. Jackson, H. A., Carter, K., Darke, C., et al. (2001)HFE mutations, iron deficiency and overload in 10500 blood donors. Br. J. Haematol. 114, 474–484.
17. Burt, M. J., George, P. M., Upton, J. D., et al. (1998)The significance of haemochromatosis gene mutationsin the general population: implications for screening.Gut 43, 830–836.
18. Moirand, R., Guyader, D., Mendler, M. H., et al.(2002) HFE based re-evaluation of heterozygoushemochromatosis. Am. J. Med. Genet. 111, 356 –361.
19. Åsberg, A., Hveem, K., Thorstensen, K., et al. (2001)Screening for hemochromatosis: High prevalence andlow morbidity in an unselected population of 65,238persons. Scand. J. Gastroenterol. 36, 1108–1115.
20. Phatak, P. D., Ryan, D. H., Cappuccio, J., et al. (2002)Prevalence and penetrance of HFE mutations in 4865unselected primary care patients. Blood Cells Mol.Dis. 29, 41–47.
21. Allen, K. J., Warner, B., and Delatycki, M. B. (2002)Clinical haemochromatosis in HFE carriers. Lancet360, 412–413.
22. Cox, T., Rochette, J., Camaschella, C., Walker, A.,and Robson, K. (2002) Clinical haemochromatosis inHFE carriers. Lancet 360, 412.
23. Niederau, C., Niederau, C. M., Lange, S., et al. (1998)Screening for hemochromatosis and iron deficiency inemployees and primary care patients in western Ger-many. Ann. Intern. Med. 128, 337–345.
24. Olynyk, J. K., Cullen, D. J., Aquilia, S., Rossi, E.,Summerville, L., and Powell, L. W. (1999) A popu-lation-based study of the clinical expression of thehemochromatosis gene. N. Engl. J. Med. 341, 718–724.
25. Looker, A. C., Dallman, P. R., Carroll, M. D., Gunter,E. W., and Johnson, C. L. (1997) Prevalence of irondeficiency in the United States. JAMA 277, 973–976.
26. Mokdad, A. H., Bowman, B. A., Ford, E. S., Vinicor,F., Marks, J. S., and Koplan, J. P. (2001) The con-tinuing epidemics of obesity and diabetes in theUnited States. JAMA 286, 1195–1200.
27. McDonnell, S. M., Preston, B. L., Jewell, S. A., et al.(1999) A survey of 2,851 patients with hemochroma-tosis: Symptoms and response to treatment. Am. J.Med. 106, 619–624.
Blood Cells, Molecules, and Diseases (2002) 29(3) Nov/Dec: 418–432 Waalen et al.doi:10.1006/bcmd.2002.0596
432