Peer Review vs Metric‐based Assessment: Testing for Bias in the RAE Ratings of UK Economics...
27
DEPARTMENT OF ECONOMICS UNIVERSITY OF CYPRUS PEER REVIEW vs METRIC-BASED ASSESSMENT: TESTING FOR BIAS IN THE RAE RATINGS OF UK ECONOMICS DEPARTMENTS Sofronis Clerides, Panos Pashardes and Alexandros Polycarpou Discussion Paper 2006-07 P.O. Box 20537, 1678 Nicosia, CYPRUS Tel.: ++357-2-892430, Fax: ++357-2-892432 Web site: http://www.econ.ucy.ac.cy
Transcript of Peer Review vs Metric‐based Assessment: Testing for Bias in the RAE Ratings of UK Economics...

DEPARTMENT OF ECONOMICS UNIVERSITY OF CYPRUS
PEER REVIEW vs METRIC-BASED ASSESSMENT: TESTING FOR BIAS IN THE RAE RATINGS OF UK ECONOMICS DEPARTMENTS Sofronis Clerides, Panos Pashardes and Alexandros Polycarpou Discussion Paper 2006-07
P.O. Box 20537, 1678 Nicosia, CYPRUS Tel.: ++357-2-892430, Fax: ++357-2-892432 Web site: http://www.econ.ucy.ac.cy

1
Peer Review vs Metric-Based Assessment:
Testing for Bias in the RAE Ratings of UK Economics Departments
Sofronis Clerides* Panos Pashardes† Alexandros Polycarpou‡
June 2009
Abstract
RAE ratings have been criticised as biased in favour of universities that are old, located in England, large and represented on the assessment panel. We investigate these accusations for the 1996 and 2001 RAE ratings of economics departments using independent rankings from the academic literature as quality controls. We find RAE ratings to be largely in agreement with the profession’s view of research quality as documented by independent rankings, although the latter appear to me more focused on research quality at the top end of academic achievement. Accusations of bias find no support in the data, with the exception of panel membership in 1996.
JEL: A14, L15
Keywords: RAE ratings, university rankings, research assessment, research funding, peer review
* University of Cyprus and CEPR; [email protected].
† Corresponding author: Economics Research Centre, University of Cyprus, P.O.Box 20537, 1678 Nicosia, Cyprus; [email protected].
‡ Economics Research Centre, University of Cyprus; [email protected].
2
INTRODUCTION
Academic economists have long been interested in the assessment of
research quality and the ranking of individual researchers and academic
departments. Initially these rankings served as an internal self-evaluation
mechanism for the economics profession and had little impact outside its narrow
confines. In recent years, the assessment of research quality has entered the
public domain as grant-giving bodies are seeking ways to increase their
effectiveness. The UK Research Assessment Exercise (RAE) is perhaps the best-
known example of a process whose stated purpose is ‘‘to provide ratings of the
quality of research conducted in universities and higher education colleges in the
UK’’ in order ‘‘to enable the higher education funding bodies to distribute
public funds for research selectively on the basis of quality’’.1 The RAE started
off as a low-key affair but has grown in significance over time and its outcome is
now anxiously anticipated and closely scrutinised. The prestige that comes with
a five-star RAE rating is a badge of honour but also an important selling point
for departments trying to recruit top faculty. RAE ratings also figure
prominently in the recruitment of students, especially postgraduates, and are
widely interpreted as rough-and-ready quality indicators for academic
departments in the UK.
Given the high stakes, it is not surprising that the RAE has also been
controversial. Questions about the integrity and scientific merit of the RAE
have been raised in a wide spectrum of scientific areas, with much of the
criticism targeting the subjective nature of the process. Williams (1998), a
professor of medicine, has gone as far as to label the RAE as ‘‘misleading,
unscientific and unjust’’. Gambrill (2002), a US-based professor who served as
an evaluator of the RAE process, gave a scathing critique in which she
particularly condemned the lack of transparency and the vagueness of the
criteria used. Accusations of bias of various types have been levelled at the
exercise and many researchers have advocated an increased reliance on metrics
in order to minimize the influence of subjective judgements.2
The possibility of favouritism within a subjective evaluation mechanism is a
problem faced by many organizations that need to assess the performance of
individuals or the quality of their output: firms evaluating current and
prospective employees; universities evaluating student applications; and
scientific journals reviewing submitted manuscripts.3 Attempts to alleviate this
problem are often directed towards selecting reviewers who are expected to use
objective criteria and superior information in the evaluation. For example,
Clerides et al. (2008) show that hotel ratings provided by tour operators are

3
more accurate descriptors of quality than those provided by national authorities
because the former are better informed. The same applies to recruitment firms
specialising in evaluating job candidates on behalf of interested organisations.
Scientific journals similarly enlist the services of peers whose task is to provide
independent and objective reviews of submitted manuscripts. The use of
specialist and independent reviewers can improve the quality of an evaluation
by eliciting information that would otherwise be difficult to obtain but cannot
eliminate bias, as opinion is always open to manipulation. Several examples of
such bias have been documented in the literature, one of them being the case of
referees in sports events. Garicano et al. (2005) find evidence that referees in
Spanish soccer games favour the home team, something they attribute to social
pressure from the fans. Rickman and Witt (2008) find that the same was true in
the English Premier League until the League started providing increased
financial incentives to referees. On the other hand, studies of editorial decisions
at economics journals typically find no evidence of favouritism (Laband and
Piette, 1994; Medoff, 2003).
Organisations under pressure to eliminate suspicion of bias in their
evaluations can resort to methods based entirely on the use of ex-ante defined
formulas to aggregate various metrics of performance. Most higher education
establishments, for example, follow this route for student admission and
grading. Yet accurate and objective measures of performance are often difficult
to obtain. The literature on incentive contracts has shown that reliance on
objective measures when these are imperfectly measured can lead to suboptimal
outcomes because of gaming on the part of the agents.4 Principals are thus faced
with a dilemma. They can either take a purely metric-based approach, which is
objective, transparent and easy to implement but can lead to distorted
outcomes. Or they can opt to incorporate subjective information, which can
provide comprehensively accurate assessments but is open to criticism that it
may reflect bias.5 The UK RAE has opted for the latter route and has
steadfastly resisted calls for a more mechanistic approach. The report prepared
by Sir Gareth Roberts (2003) states that ‘‘any system of research assessment
designed to identify the best research must be based upon the judgement of
experts, who may, if they choose, employ performance indicators to inform their
judgement.’’6
A question that naturally arises is, how different would the outcome of the
RAE be had it relied exclusively on performance indicators? This paper aims to
shed some light on that issue by empirically analysing how the RAE ratings of
UK Economics departments relate to quality rankings developed independently
by academic economists. The paper focuses on the 1996 and 2001 RAEs because
they cover periods for which several independent quality rankings are available.
4
As ad hoc indicators of research quality rigorously constructed by independent
economists, these rankings are probably the most appropriate indicators for this
kind of analysis. Our approach also allows us to investigate whether the
accusations of bias in the RAE ratings can be empirically substantiated in the
case of economic departments. To our knowledge this is the first study
investigating accusations of bias in the RAE ratings of economics departments
and the first one in any field that controls for quality by using independent
rankings (in addition to other measures used as inputs in the RAE assessment).
The analysis also touches on interesting issues pertaining to assessments made
by review panels at large, such as how rankings and ratings can be compared;
how the results can change when alternative metrics are used to control for
quality; whether departures of panel ratings from metric-based rankings can be
linked to observed variables; and whether such a link can be construed as
evidence of favouritism by the panel.
I. RATINGS AND RANKINGS
The RAE covers 69 academic areas (Units of Assessment or UA). Our
analysis focuses on the Economics and Econometrics UA (EEUA) which ranked
60 departments in 1992, 50 departments in 1996 and 41 departments in 2001.
Each UA has a panel of between 9 and 18 experts who are selected primarily
from academia through a process of consultation and invitation. The EEUA
panel had nine members in 1996 (all from academia) and twelve in 2001 (ten
from academia). In 1992 departments were ranked on a five-point scale, taking
from one to five stars. In the 1996 and 2001 RAEs an expanded, seven-point
scale was used: 1, 2, 3b, 3a, 4, 5, 5*, with 5* being the highest grade. Our
analysis is restricted to the 1996 and 2001 RAEs because there are no rankings
of economics departments in the literature covering periods corresponding to
earlier RAEs and including UK universities.
Detailed information about each assessment is available on the websites of
the RAE and the Higher Education Funding Council for England.7 From these
sources we obtained the ratings, the composition of the panels, and all the
information submitted by each university, including the various types of
research output, external income, and the number of PhDs awarded. The major
categories of research output are books, chapters in books, articles in journals,
and conference contributions. A maximum of four pieces of output could be
submitted for each researcher.8 Institutions could also put before the panel any
other indicators of esteem, including information on the numbers of research
students and the level of research income.
5
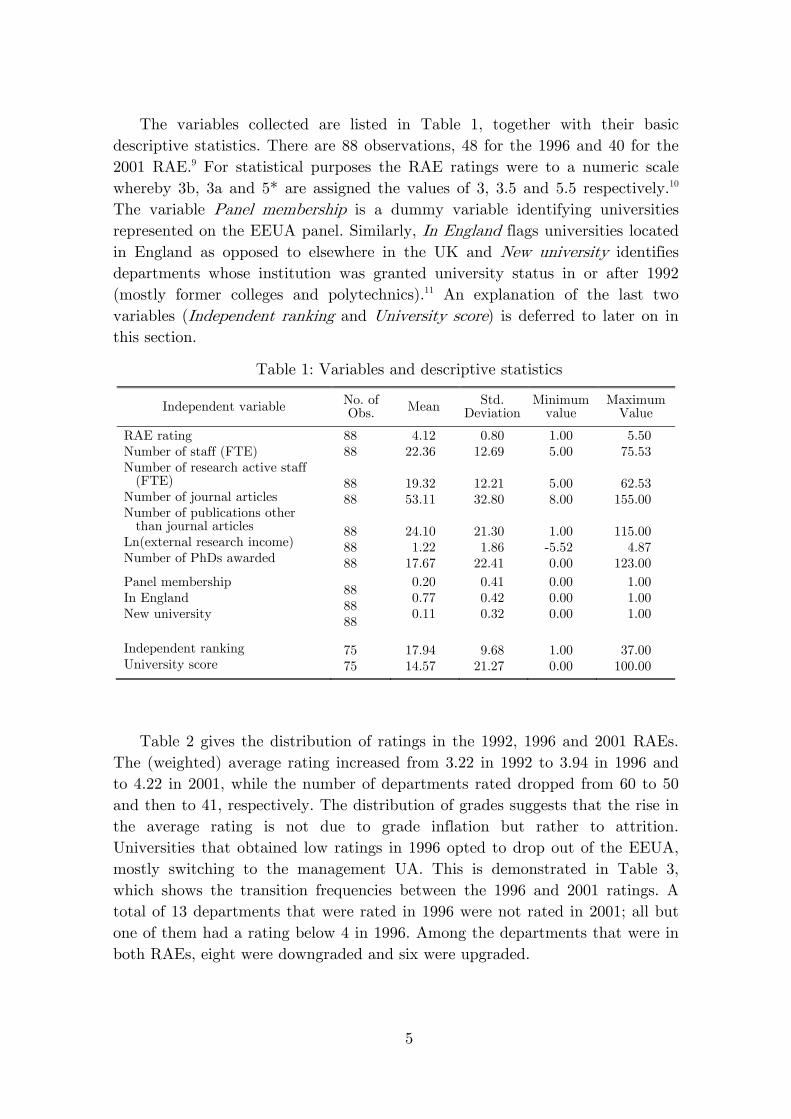
The variables collected are listed in Table 1, together with their basic
descriptive statistics. There are 88 observations, 48 for the 1996 and 40 for the
2001 RAE.9 For statistical purposes the RAE ratings were to a numeric scale
whereby 3b, 3a and 5* are assigned the values of 3, 3.5 and 5.5 respectively.10
The variable Panel membership is a dummy variable identifying universities
represented on the EEUA panel. Similarly, In England flags universities located
in England as opposed to elsewhere in the UK and New university identifies
departments whose institution was granted university status in or after 1992
(mostly former colleges and polytechnics).11 An explanation of the last two
variables (Independent ranking and University score) is deferred to later on in
this section.
Table 1: Variables and descriptive statistics
Independent variable No. of Obs. Mean
Std. Deviation
Minimum value
Maximum Value
RAE rating Number of staff (FTE) Number of research active staff
(FTE) Number of journal articles Number of publications other
than journal articles Ln(external research income) Number of PhDs awarded
88 88
88 88
88 88 88
4.12 22.36
19.32 53.11
24.10 1.22
17.67
0.80 12.69
12.21 32.80
21.30 1.86
22.41
1.00 5.00
5.00 8.00
1.00
-5.52 0.00
5.50 75.53
62.53
155.00
115.00 4.87
123.00
Panel membership In England New university
88 88 88
0.20 0.77 0.11
0.41 0.42 0.32
0.00 0.00 0.00
1.00 1.00 1.00
Independent ranking University score
75 75
17.94 14.57
9.68 21.27
1.00 0.00
37.00 100.00
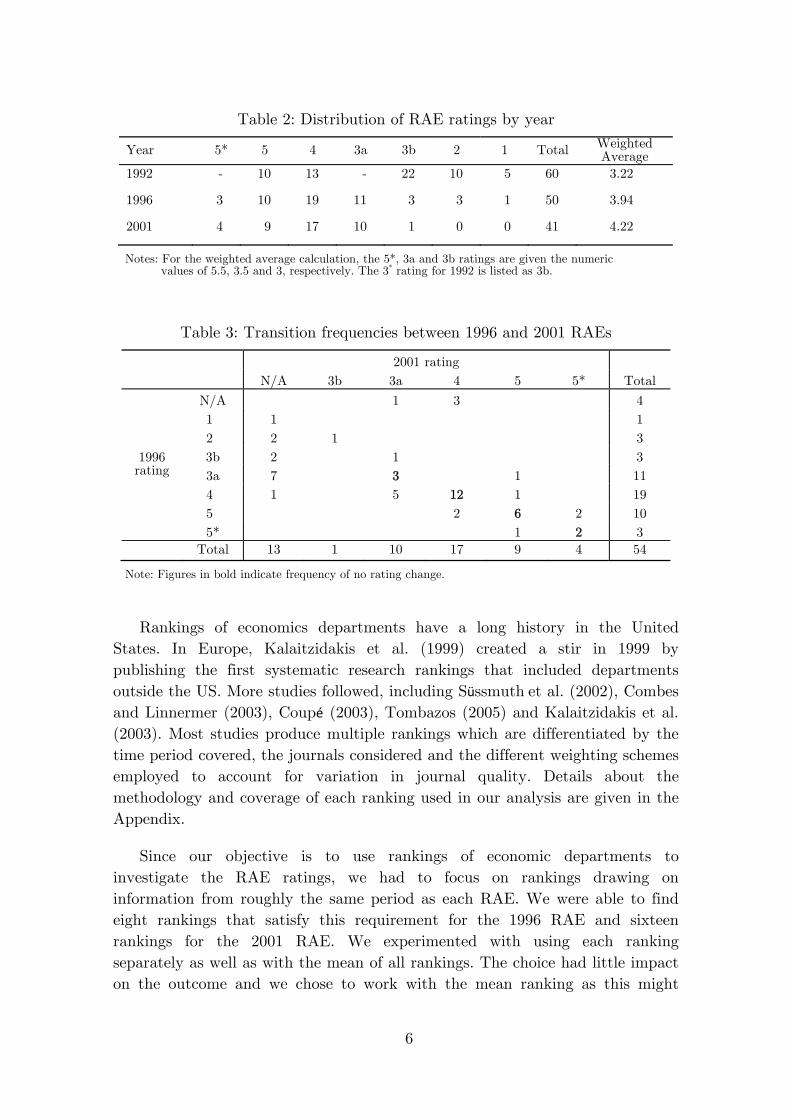
Table 2 gives the distribution of ratings in the 1992, 1996 and 2001 RAEs.
The (weighted) average rating increased from 3.22 in 1992 to 3.94 in 1996 and
to 4.22 in 2001, while the number of departments rated dropped from 60 to 50
and then to 41, respectively. The distribution of grades suggests that the rise in
the average rating is not due to grade inflation but rather to attrition.
Universities that obtained low ratings in 1996 opted to drop out of the EEUA,
mostly switching to the management UA. This is demonstrated in Table 3,
which shows the transition frequencies between the 1996 and 2001 ratings. A
total of 13 departments that were rated in 1996 were not rated in 2001; all but
one of them had a rating below 4 in 1996. Among the departments that were in
both RAEs, eight were downgraded and six were upgraded.
6
Table 2: Distribution of RAE ratings by year
Year 5* 5 4 3a 3b 2 1 Total Weighted Average
1992 - 10 13 - 22 10 5 60 3.22
1996 3 10 19 11 3 3 1 50 3.94
2001 4 9 17 10 1 0 0 41 4.22
Notes: For the weighted average calculation, the 5*, 3a and 3b ratings are given the numeric values of 5.5, 3.5 and 3, respectively. The 3* rating for 1992 is listed as 3b.
Table 3: Transition frequencies between 1996 and 2001 RAEs
2001 rating
N/A 3b 3a 4 5 5* Total
1996 rating
N/A 1 3 4
10 1 1
20 2 1 3
3b 2 1 3
3a 7 3 1 11
40 1 5 12 1 19
50 2 6 2 10
5* 1 2 3
Total 13 1 10 17 9 4 54
Note: Figures in bold indicate frequency of no rating change.
Rankings of economics departments have a long history in the United
States. In Europe, Kalaitzidakis et al. (1999) created a stir in 1999 by
publishing the first systematic research rankings that included departments
outside the US. More studies followed, including Süssmuth et al. (2002), Combes
and Linnermer (2003), Coupé (2003), Tombazos (2005) and Kalaitzidakis et al.
(2003). Most studies produce multiple rankings which are differentiated by the
time period covered, the journals considered and the different weighting schemes
employed to account for variation in journal quality. Details about the
methodology and coverage of each ranking used in our analysis are given in the
Appendix.
Since our objective is to use rankings of economic departments to
investigate the RAE ratings, we had to focus on rankings drawing on
information from roughly the same period as each RAE. We were able to find
eight rankings that satisfy this requirement for the 1996 RAE and sixteen
rankings for the 2001 RAE. We experimented with using each ranking
separately as well as with the mean of all rankings. The choice had little impact
on the outcome and we chose to work with the mean ranking as this might
7
depend less on specific methodologies. Furthermore, given that the number of
universities ranked differs across studies, we had to decide whether to use the
mean ranking obtained by each UK university in the whole population or to
construct a UK-only ranking. We tried both approaches, again with very similar
results. We report the results obtained from using the mean ranking constructed
from the UK-only sample.12 This is the Independent ranking that is listed in
Table 1 and forms the basis of our analysis. The final variable listed in Table 1
is University score, which is the score on which the rankings are based and is
used as an alternative measure of quality in our analysis. Note that only 75 out
of the 88 departments appear in the independent rankings (38 out of 48 in 1996
and 37 out of 40 in 2001). In order to be able to include unranked departments
in the econometric analysis we assigned to them a rank one position below the
lowest ranked department (38 for 1996 and 33 for 2001). Full details on the
construction of these variables are given in Table A2 in the Appendix.
Comparing ratings with rankings is not a straightforward task. A ranking is
a strictly ordinal measure. A rating could be interpreted as being either an
ordinal measure (with many ties) or as a cardinal measure with each grade
corresponding to a specific level of quality. The RAE ratings probably lie
somewhere in between: they cannot be considered strictly cardinal (e.g. one
cannot say that a grade of 4 indicates twice as much research output as a grade
of 2) and cannot be considered strictly ordinal because grades per se seem to
make a difference. For instance, the implied difference between 3 and 3a or
between 5 and 5* is smaller than that between 4 and 5. Therefore, comparing
rankings with ratings one needs to remember that distance between institutions
does not have meaning in the first, even though it may do in the second.
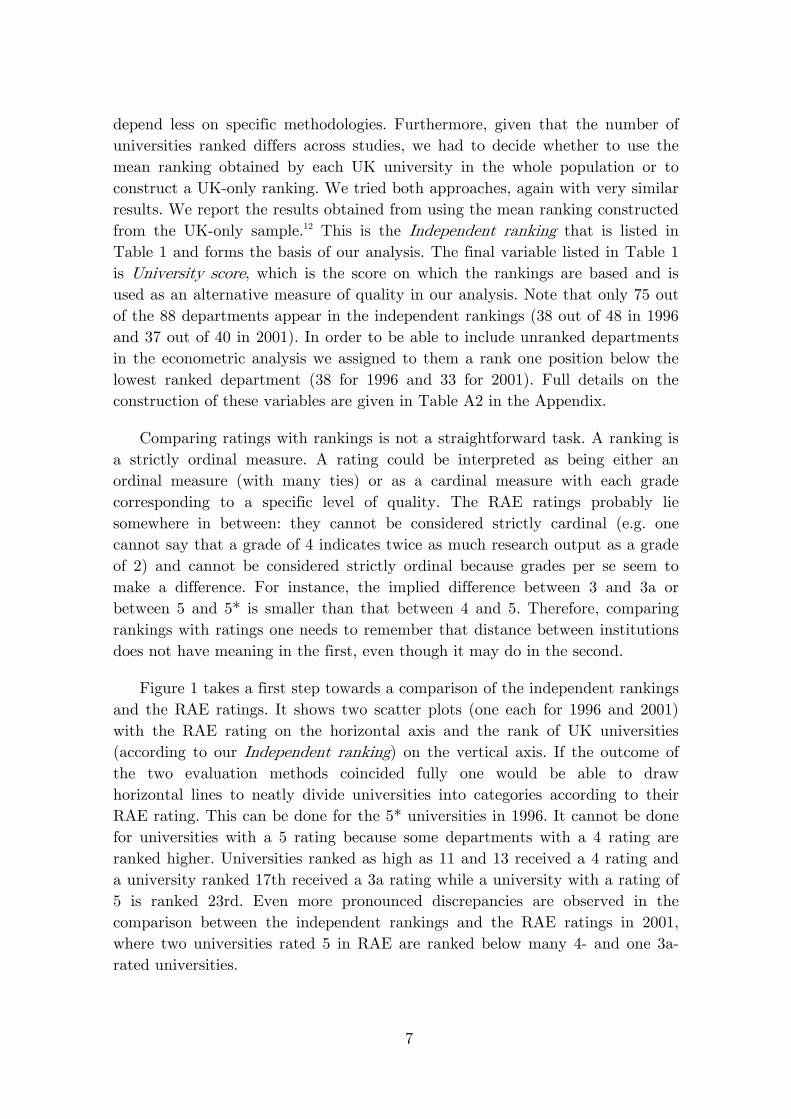
Figure 1 takes a first step towards a comparison of the independent rankings
and the RAE ratings. It shows two scatter plots (one each for 1996 and 2001)
with the RAE rating on the horizontal axis and the rank of UK universities
(according to our Independent ranking) on the vertical axis. If the outcome of
the two evaluation methods coincided fully one would be able to draw
horizontal lines to neatly divide universities into categories according to their
RAE rating. This can be done for the 5* universities in 1996. It cannot be done
for universities with a 5 rating because some departments with a 4 rating are
ranked higher. Universities ranked as high as 11 and 13 received a 4 rating and
a university ranked 17th received a 3a rating while a university with a rating of
5 is ranked 23rd. Even more pronounced discrepancies are observed in the
comparison between the independent rankings and the RAE ratings in 2001,
where two universities rated 5 in RAE are ranked below many 4- and one 3a-
rated universities.
8
The overall picture that emerges is that rankings and ratings are generally
aligned quite closely, but there are also some notable differences that warrant
some further investigation. It would have been surprising if the two measures
coincided completely for several reasons that make the comparison imperfect:
the periods covered by each RAE and the corresponding rankings do not
completely overlap; author affiliation in the independent rankings is not
scrutinised with the same criteria as in the RAE ratings; the definition of the
institution may not be the same in the two assessments.13 Perhaps more
importantly, observed discrepancies between rankings and ratings may reflect
conceptual differences in what constitutes high research quality. For example,
the RAE panel might have different perceptions about the quality of different
journals or it might consider a university’s ability to attract external research
income as a signal of quality. In this case one might wish to question the
wisdom of departing from the profession’s standard on quality assessment but it
would be wrong to infer that observed discrepancies are evidence of bias. In
order to make such a claim one would have to link such discrepancies to
Figure 1: Independent rankings vs RAE ratings
Birkbeck
Manchester
LSE
Kent
Queen Mary
Aberdeen
Essex
Loughborough
Reading
UCLOxford
Hull
Strathclyde
Leicester
Dundee
Wales
Keele
Birmingham
Liverpool
YorkEast Anglia
Surrey
Bristol
SussexBath
St Andrews
City
Glasgow
Southampton , Warwick
Cambridge
Stirling
Guildhall
Nottingham
Queen's
Edinburgh
Exeter
Newcastle
010
2030
40R
anki
ng
23b3a455*RAE Rating
1996LSE
OxfordUCL
CambridgeWarwickEssex
YorkSouthampton
BristolNottinghamExeterBirkbeck
St AndrewsEast AngliaManchester
KeeleNewcastleLiverpoolEdinburgh
CityQueen Mary
SussexBirmingham , DurhamLeicester
GlasgowWalesBrunel, Royal Holloway
SurreyStrathclydeKent
East LondonDundee
StirlingLoughborough,Sheffield
010
2030
40R
anki
ng
23b3a455*RAE Rating
2001
Note: The ranking is based on the mean rankings calculated as reported in Table A2.

9
observed variables (such as university location) that should not in principle
relate to research quality. Making such a claim convincingly requires great care
in objectively controlling for research quality. This is the approach we take in
the next section.
II. EMPIRICAL ANALYSIS
Our analysis revolves around estimating an equation with the RAE rating as
the dependent variable and different combinations of the variables reported in
Table 1 as the explanatory ones. We use an ordered probit specification to
account for the fact that the ratings are on an ordered categorical scale and
allow the parameters to differ between the 1996 and 2001 RAE ratings in order
to allow for heterogeneity in the two assessments.
Accusations of bias can be easily tested in this framework via the inclusion
of dummy variables corresponding to specific hypotheses. We focus on four
hypotheses of bias that have been entertained in the literature. One of the most
common findings is that of bias against new universities (former colleges and
polytechnics). Johnes et al. (1993) and Taylor (1995) report such evidence in
their cross-disciplinary analysis of the 1989 and 1992 RAE, respectively. Sharp
and Coleman (2005) reach the same conclusion in a study of the 2001 RAE, as
well as Doyle et al. (1996) and McKay (2003) for the 1992 Business and
Management Studies and the 2001 Social Policy and Administration fields
respectively. Another controversial finding is bias in favour of universities with
faculty serving on the RAE panel. Doyle et al. (1996) report evidence in support
of such bias. Coupé (2001) finds the same bias in cross-sectional analysis of the
1992 and 1996 RAEs, though the result goes away when intertemporal variation
to better account for quality is allowed. McKay (2003) and Sharp and Coleman
(2005) find no association between panel membership and RAE ratings. It has
also been claimed that institutions in England are favoured at the expense of
those in other parts of the UK (Doyle et al., 1996). Finally, most studies report
evidence suggesting large departments (in terms of FTE faculty submitted) are
favoured over smaller ones (Johnes et al., 1993; Taylor, 1995; Doyle et al., 1996;
McKay, 2003; Guermat et al., 2004).
As said earlier, in order for the test to be valid one needs to be certain that
research quality has been adequately controlled for. If not, explanatory variables
may be correlated with unaccounted-for quality leading to biased estimates. All
of the above studies can be criticised to some extent for controlling for quality
using publication counts, research income, number of doctorates awarded and
other measures accounting for research volume rather than quality. Even the
use of co-authorship and classification of journals into broad quality categories
10
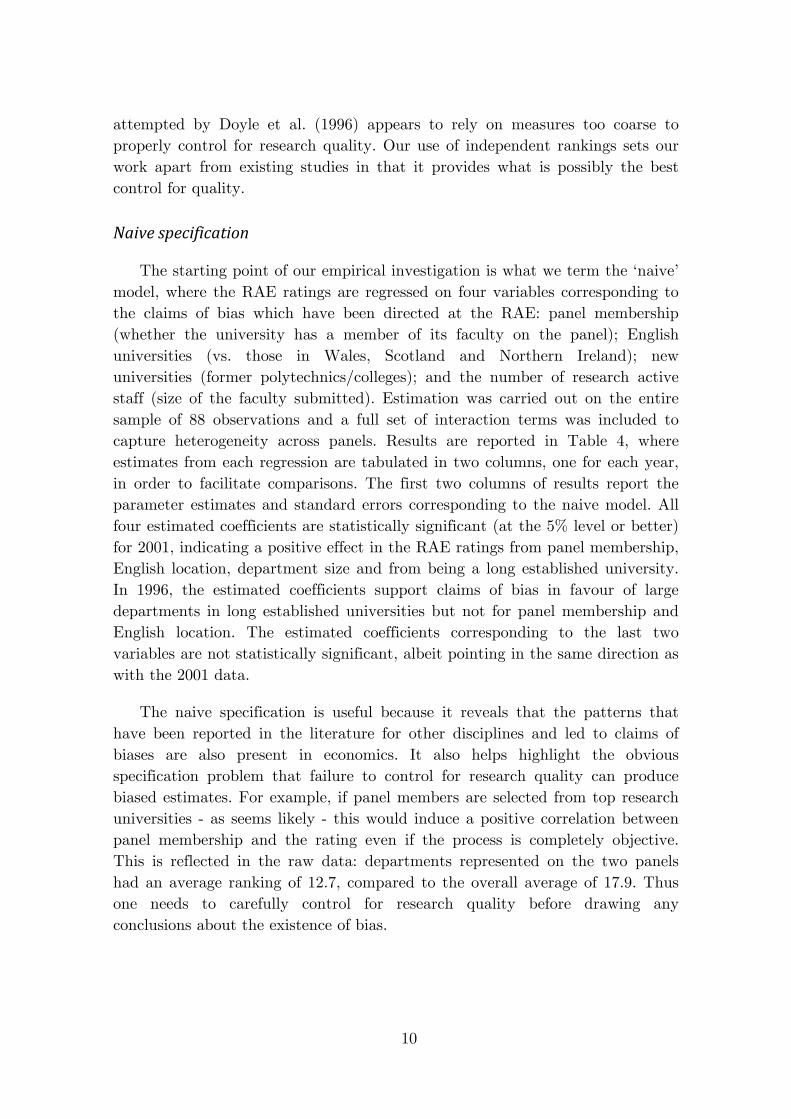
attempted by Doyle et al. (1996) appears to rely on measures too coarse to
properly control for research quality. Our use of independent rankings sets our
work apart from existing studies in that it provides what is possibly the best
control for quality.
Naive specification
The starting point of our empirical investigation is what we term the ‘naive’
model, where the RAE ratings are regressed on four variables corresponding to
the claims of bias which have been directed at the RAE: panel membership
(whether the university has a member of its faculty on the panel); English
universities (vs. those in Wales, Scotland and Northern Ireland); new
universities (former polytechnics/colleges); and the number of research active
staff (size of the faculty submitted). Estimation was carried out on the entire
sample of 88 observations and a full set of interaction terms was included to
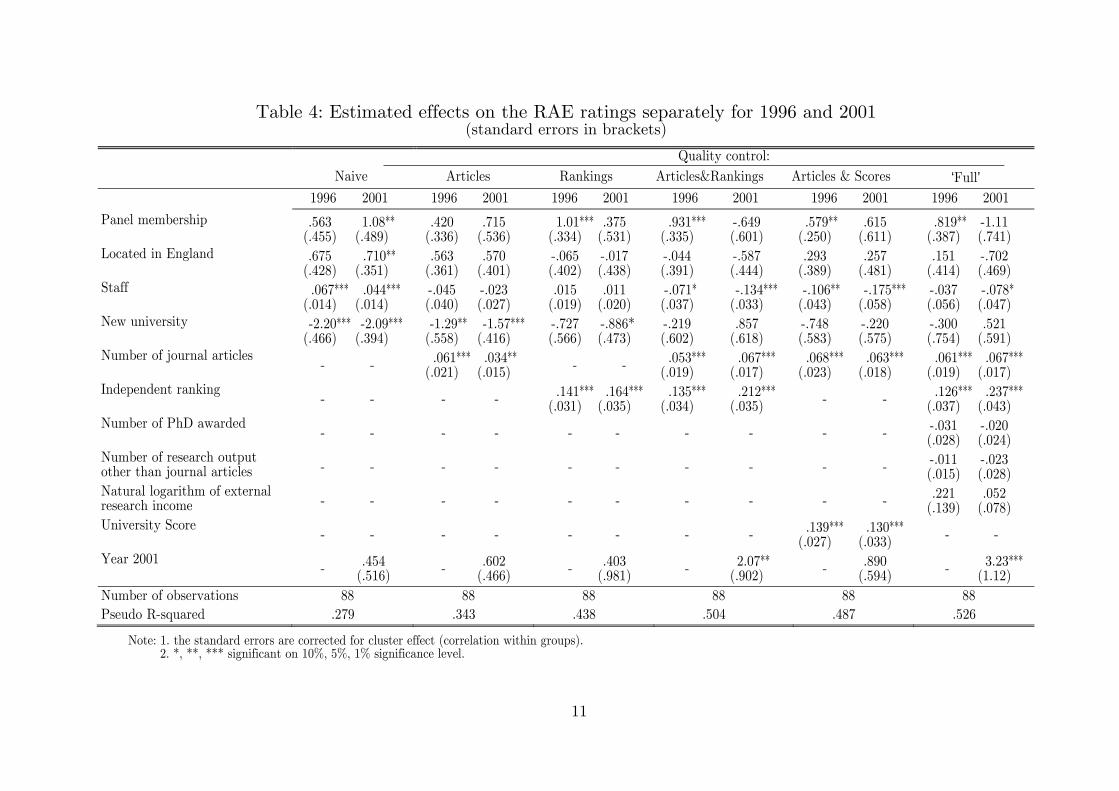
capture heterogeneity across panels. Results are reported in Table 4, where
estimates from each regression are tabulated in two columns, one for each year,
in order to facilitate comparisons. The first two columns of results report the
parameter estimates and standard errors corresponding to the naive model. All
four estimated coefficients are statistically significant (at the 5% level or better)
for 2001, indicating a positive effect in the RAE ratings from panel membership,
English location, department size and from being a long established university.
In 1996, the estimated coefficients support claims of bias in favour of large
departments in long established universities but not for panel membership and
English location. The estimated coefficients corresponding to the last two
variables are not statistically significant, albeit pointing in the same direction as
with the 2001 data.
The naive specification is useful because it reveals that the patterns that
have been reported in the literature for other disciplines and led to claims of
biases are also present in economics. It also helps highlight the obvious
specification problem that failure to control for research quality can produce
biased estimates. For example, if panel members are selected from top research
universities - as seems likely - this would induce a positive correlation between
panel membership and the rating even if the process is completely objective.
This is reflected in the raw data: departments represented on the two panels
had an average ranking of 12.7, compared to the overall average of 17.9. Thus
one needs to carefully control for research quality before drawing any
conclusions about the existence of bias.
11
Table 4: Estimated effects on the RAE ratings separately for 1996 and 2001 (standard errors in brackets)
Quality control:
Naive Articles Rankings Articles&Rankings Articles & Scores ‘Full’ 1996** 2001** 1996** 2001** 1996** 2001** 1996** 2001** 1996** 2001** 1996** 2001** Panel membership .563***
(.455)***1.08***
(.489)***.420***
(.336)***.715***
(.536)***1.01***
(.334)**.375***
(.531)*** .931***
(.335)***-.649*** (.601)***
.579*** (.250)***
.615*** (.611)***
.819***(.387)**
-1.11*** (.741)***
Located in England .675***(.428)***
.710*** (.351)***
.563***(.361)***
.570*** (.401)***
-.065***(.402)**
-.017*** (.438)***
-.044***(.391)***
-.587*** (.444)***
.293*** (.389)***
.257*** (.481)***
.151***(.414)**
-.702*** (.469)***
Staff .067***(.014)***
.044*** (.014)***
-.045***(.040)***
-.023***(.027)***
.015***(.019)**
.011*** (.020)***
-.071***(.037)***
-.134*** (.033)***
-.106***(.043)***
-.175*** (.058)***
-.037***(.056)**
-.078*** (.047)***
New university -2.20***(.466)***
-2.09*** (.394)***
-1.29***(.558)***
-1.57*** (.416)***
-.727***(.566)**
-.886*** (.473)***
-.219***(.602)***
.857*** (.618)***
-.748***(.583)***
-.220***(.575)***
-.300***(.754)**
.521*** (.591)***
Number of journal articles - - .061***
(.021)***.034***
(.015)***- - .053***
(.019)***.067***
(.017)*** .068***
(.023)***.063***
(.018)***.061***
(.019)**.067***
(.017)*** Independent ranking
- - - - .141***(.031)**
.164*** (.035)***
.135*** (.034)***
.212*** (.035)*** - - .126***
(.037)**.237***
(.043)*** Number of PhD awarded
- - - - - - - - - - -.031***(.028)**
-.020*** (.024)***
Number of research output other than journal articles - - - - - - - - - - -.011***
(.015)**-.023*** (.028)***
Natural logarithm of external research income - - - - - - - - - - .221***
(.139)**.052***
(.078)*** University Score
- - - - - - - - .139*** (.027)***
.130*** (.033)***
- -
Year 2001 - .454***
(.516)***- .602***
(.466)***- .403***
(.981)*** - 2.07*** (.902)*** - .890***
(.594)***- 3.23***
(1.12)*** Number of observations 88 88 88 88 88 88 Pseudo R-squared .279 .343 .438 .504 .487 .526
Note: 1. the standard errors are corrected for cluster effect (correlation within groups). 2. *, **, *** significant on 10%, 5%, 1% significance level.
12
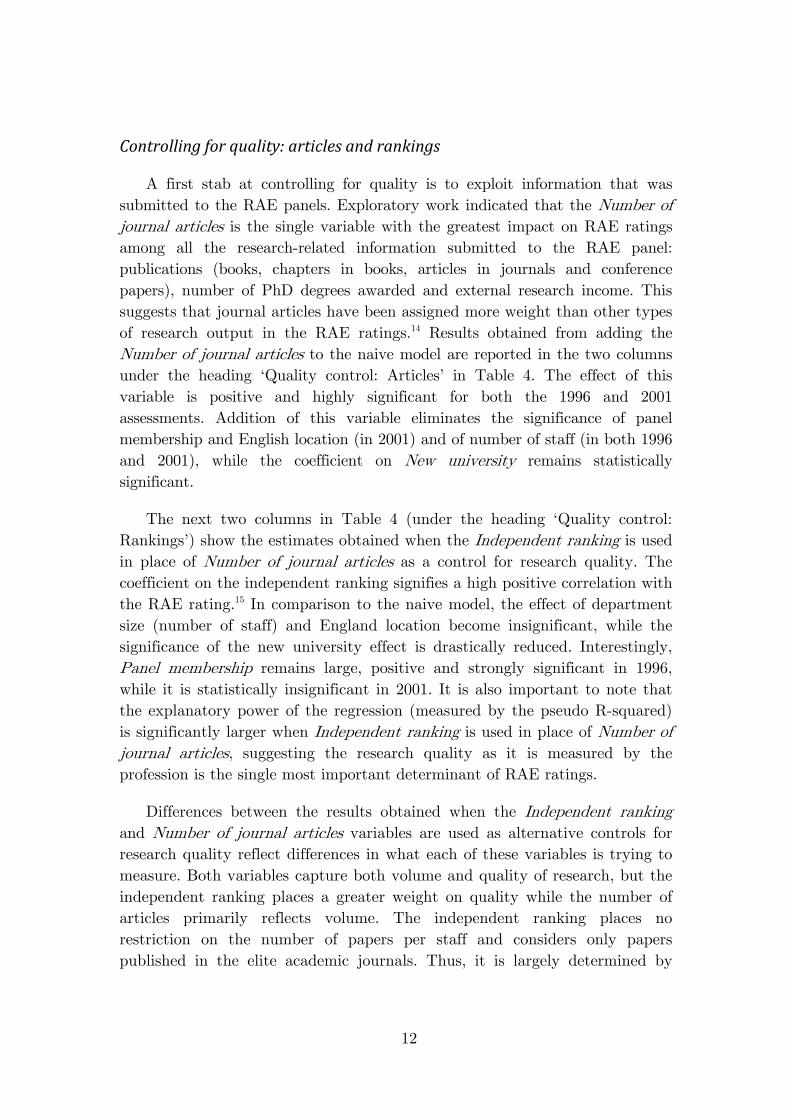
Controlling for quality: articles and rankings
A first stab at controlling for quality is to exploit information that was
submitted to the RAE panels. Exploratory work indicated that the Number of
journal articles is the single variable with the greatest impact on RAE ratings
among all the research-related information submitted to the RAE panel:
publications (books, chapters in books, articles in journals and conference
papers), number of PhD degrees awarded and external research income. This
suggests that journal articles have been assigned more weight than other types
of research output in the RAE ratings.14 Results obtained from adding the
Number of journal articles to the naive model are reported in the two columns
under the heading ‘Quality control: Articles’ in Table 4. The effect of this
variable is positive and highly significant for both the 1996 and 2001
assessments. Addition of this variable eliminates the significance of panel
membership and English location (in 2001) and of number of staff (in both 1996
and 2001), while the coefficient on New university remains statistically
significant.
The next two columns in Table 4 (under the heading ‘Quality control:
Rankings’) show the estimates obtained when the Independent ranking is used
in place of Number of journal articles as a control for research quality. The
coefficient on the independent ranking signifies a high positive correlation with
the RAE rating.15 In comparison to the naive model, the effect of department
size (number of staff) and England location become insignificant, while the
significance of the new university effect is drastically reduced. Interestingly,
Panel membership remains large, positive and strongly significant in 1996,
while it is statistically insignificant in 2001. It is also important to note that
the explanatory power of the regression (measured by the pseudo R-squared)
is significantly larger when Independent ranking is used in place of Number of
journal articles, suggesting the research quality as it is measured by the
profession is the single most important determinant of RAE ratings.
Differences between the results obtained when the Independent ranking
and Number of journal articles variables are used as alternative controls for
research quality reflect differences in what each of these variables is trying to
measure. Both variables capture both volume and quality of research, but the
independent ranking places a greater weight on quality while the number of
articles primarily reflects volume. The independent ranking places no
restriction on the number of papers per staff and considers only papers
published in the elite academic journals. Thus, it is largely determined by
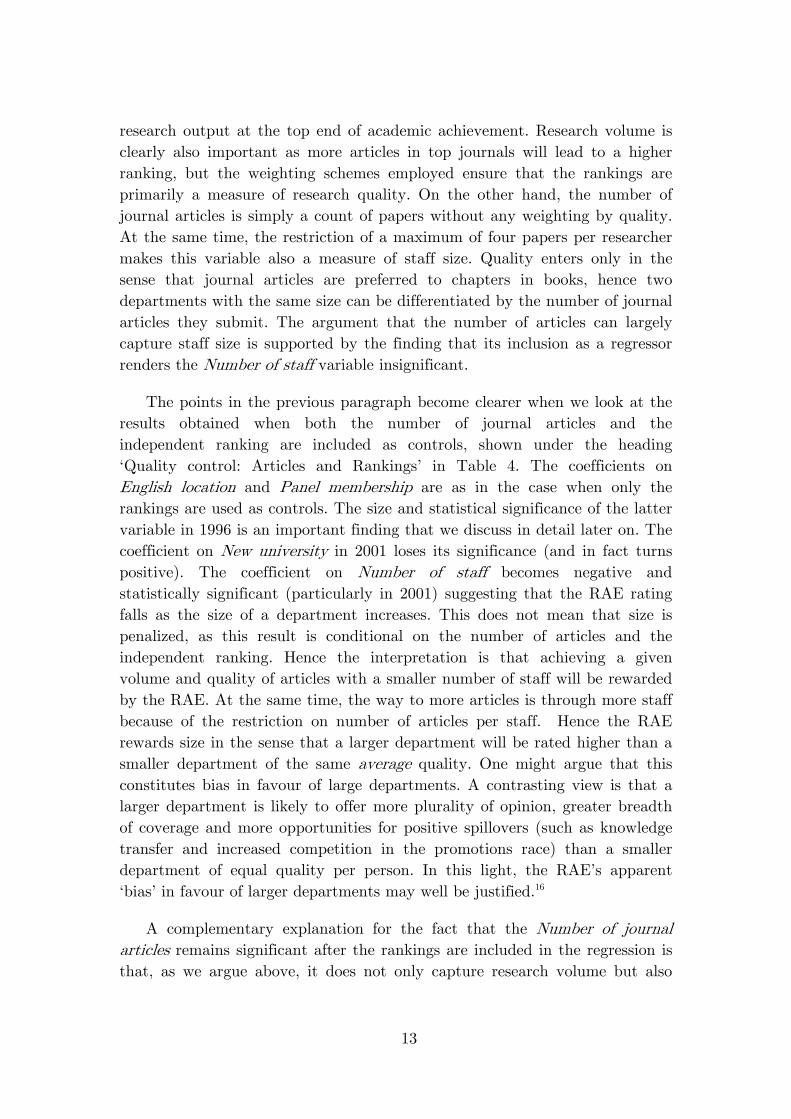
13
research output at the top end of academic achievement. Research volume is
clearly also important as more articles in top journals will lead to a higher
ranking, but the weighting schemes employed ensure that the rankings are
primarily a measure of research quality. On the other hand, the number of
journal articles is simply a count of papers without any weighting by quality.
At the same time, the restriction of a maximum of four papers per researcher
makes this variable also a measure of staff size. Quality enters only in the
sense that journal articles are preferred to chapters in books, hence two
departments with the same size can be differentiated by the number of journal
articles they submit. The argument that the number of articles can largely
capture staff size is supported by the finding that its inclusion as a regressor
renders the Number of staff variable insignificant.
The points in the previous paragraph become clearer when we look at the
results obtained when both the number of journal articles and the
independent ranking are included as controls, shown under the heading
‘Quality control: Articles and Rankings’ in Table 4. The coefficients on
English location and Panel membership are as in the case when only the
rankings are used as controls. The size and statistical significance of the latter
variable in 1996 is an important finding that we discuss in detail later on. The
coefficient on New university in 2001 loses its significance (and in fact turns
positive). The coefficient on Number of staff becomes negative and
statistically significant (particularly in 2001) suggesting that the RAE rating
falls as the size of a department increases. This does not mean that size is
penalized, as this result is conditional on the number of articles and the
independent ranking. Hence the interpretation is that achieving a given
volume and quality of articles with a smaller number of staff will be rewarded
by the RAE. At the same time, the way to more articles is through more staff
because of the restriction on number of articles per staff. Hence the RAE
rewards size in the sense that a larger department will be rated higher than a
smaller department of the same average quality. One might argue that this
constitutes bias in favour of large departments. A contrasting view is that a
larger department is likely to offer more plurality of opinion, greater breadth
of coverage and more opportunities for positive spillovers (such as knowledge
transfer and increased competition in the promotions race) than a smaller
department of equal quality per person. In this light, the RAE’s apparent
‘bias’ in favour of larger departments may well be justified.16
A complementary explanation for the fact that the Number of journal
articles remains significant after the rankings are included in the regression is
that, as we argue above, it does not only capture research volume but also
14
quality. Independent rankings mostly ignore differences in research output at
a quality level below the top, as seen from the journals on which these are
based. For instance, two similar-sized departments are considered to be of
similar research quality if they publish the same number of papers in highly
rated journals, even when one of them also publishes articles in mid-level
journals and the other does not. Therefore, while the independent rankings
explain a large part of the variation in the RAE ratings because more top
achievers raise the quality of the institutional average, the effect of the
number of journal articles submitted to the RAE panel also remain significant
in the ordered probit regression because they convey research quality
information at a level not high enough to be captured by the independent
rankings. In the terminology employed by Neary et al. (2003), independent
rankings are elitist while the RAE approach is more egalitarian. This is
reinforced by the RAE’s restriction of the number of outputs per researcher to
four, which limits the impact a small number of highly prolific authors can
have on the measured research quality of a department. Independent rankings
place no such restrictions, hence a handful of star researchers can give a
department a very high ranking.
Differences between 1996 and 2001
The most notable difference in the results for the two exercises is the
positive and statistically significant coefficient on Panel membership in 1996
and its lack of significance in 2001. This is a very robust result that showed
up across a large variety of specifications. An intuitive (but not sufficient)
explanation of this finding can be obtained from a comparison of the rankings
and ratings of the departments represented in each of the two panels. The
average rankings of the departments represented in the 2001 and 1996 panel
are, respectively, 82.4% and 19.8% above the mean of all departments assessed
in the same year. Yet, the RAE ratings reflect a much smaller difference in
the relative performance of the two panels: the departments represented in the
2001 panel had average ratings 12.8% above the overall mean; while the
corresponding figure for the 1996 panel was 10.4%.17 Thus, the high RAE
ratings which the 2001 panel awarded to their own departments are matched
with equally high independent rankings, whereas the high ratings which the
1996 panel awarded to their own departments are not so matched.
One can, of course, be sceptical whether statistical evidence alone can
establish that the economics departments that were represented on the panel
in 1996 gain an unfair advantage from that participation. One reason for this
is that it is never possible to be sure that quality has been fully controlled for.

15
On the other hand, critics of the RAE may point to our results as evidence of
a faulty process that needs to be corrected by minimizing the weight of
subjective judgements. Certainly, a more mechanistic approach - like the one
adopted by academic economists - is more transparent and would eliminate
much of the criticism. On the other hand, the mechanistic approach has the
disadvantage that it assigns equal importance to all papers appearing in the
same journal. This means that any paper published in the American Economic
Review will count for more than any paper published in the Economic
Journal. Yet it is well known - and it has recently been documented
convincingly by Oswald (2007) - that there is tremendous variation in the
impact of papers in the same journal and that many important articles are
published in ‘lesser’ journals. Mechanistic approaches can account for an
article’s impact to some degree by weighing articles by the number of
citations, but the use of citations is no panacea.18 A practical disadvantage is
that it takes a long time for citations to accumulate, while one can also
plausibly argue that the number of citations received is a highly imperfect
measure of quality.
There was some criticism after the 2001 RAE that the panel was not
generous with its ratings, resulting in squeezed funding for economics relative
to other disciplines. In our analysis the Year 2001 dummy is positive in all
models in our analysis and significant when both the number of journal
articles and the independent rankings are used as controls for research quality.
The criticism of a tough 2001 panel is therefore not substantiated, as the
evidence points in the opposite direction (although it is not strong enough to
allow one to infer that the 2001 panel was more generous than the 1996 one).
The three coefficients capturing size and quality - staff, articles, rankings -
are all larger in magnitude in 2001 than in 1996. In particular, the lower
penalty for increasing staff - with journal articles and independent rankings
held constant – in 1996 suggests that in this year the panel was less generous
than the 2001 panel in rewarding research output at the top end of academic
quality. To test further the observed heterogeneity between the two panels,
we estimated the equations for each year separately to assess their fit. We find
that our explanatory variables explain more of the variation in RAE ratings in
2001 than in 1996 (pseudo-R 2 of .550 versus .482). Hence there is a tighter
correlation between ratings and rankings in 2001 than in 1996. It is not clear
whether this is a chance outcome or the result of a conscious decision to move
towards greater reliance on metrics. The results of future RAEs might shed
some light on this issue.
16
Robustness
The last four columns of Table 4 report estimates from two more
specifications that serve as robustness checks. Under the heading ‘Quality
control: Articles and Scores’ we present results obtained from using the
variable University score instead of Independent ranking, the rationale being
that the cardinal nature of the former might be more informative and lead to
different results. It turns out that this is not the case, suggesting that the
information content of the two measures is similar. The column labelled
‘Quality control: Full’ reports the results obtained from including among the
explanatory variables all the research-related information available to the
RAE panel: articles in journals, other publications (books, chapters in books
and conference papers), number of PhD degrees awarded and external
research income. None of the added variables appears to have a significant
effect on the RAE ratings.19 One can, of course, play down the importance of
these results on the grounds that estimating so many parameters from only 88
observations is asking too much of the data. Yet, the fact that adding more
explanatory variables does not influence the size and significance of the
coefficients on Number of journal articles and Independent rankings
underscores the robustness of these effects.
Arriving at an index of research quality requires aggregating different
components (compressing different dimensions) of this quality into a single
scalar. This aggregation procedure can give rise to different rankings or scores,
depending on how the dimensions of research quality are measured and/or the
particular weights attached to them. In investigating whether the biases in the
RAE ratings implied by the ‘naive’ model can survive controls reflecting
research quality, we experimented with several alternative measures of this
quality. Given the small number of observations in our analysis, our
presentation has focused on results obtained from using one or two such
measures as explanatory variables in each ordered probit estimation. This
alleviates concerns that biases in RAE ratings might be diffused in an over-
fitted equation giving rise to Type II errors; a concern often confounded by
the inevitably high positive correlation between the alternative research
quality measures themselves.20
A possible criticism of the use of independent rankings as controls for
quality in an investigation of bias is that the information used to compute
them is different from that used in the RAE process. In particular,
independent rankings typically only consider publications in a relatively small
set of elite journals while the RAE process considers all journals. On the other
17
hand, the RAE limits the number of articles per researcher to four while
independent rankings place no such restriction. A further concern is that
rankings use the affiliation reported on the publication which may not
coincide with the affiliation at the date of the RAE. Hence the independent
rankings can be criticised for not focusing on the information which the RAE
panel had access to at the time of assessment. In order to partially address
this issue we constructed an alternative measure of quality using only
information on all publications submitted to the 2001 RAE, appropriately
weighed by the number of AER-adjusted pages (see Appendix for details).
Using this variable instead of Independent ranking did not produce any
significant change in the results. Unfortunately this robustness check could
not be done for 1996 because we were unable to obtain the list of papers
submitted for that exercise.
We have also used the information available for 2001 to test more formally
the RAE’s treatment of the distribution of research quality within a
department. We constructed a score for each researcher based on the articles
submitted in his name and the rankings of the corresponding journals and
then calculated the skewness of these scores within each department. Keeping
average research quality constant, a department with positive skewness will
have a few star researchers and a relatively low quality for the typical (modal)
staff member, while a department with negative skewness will have a typical
member of relatively high quality and a few mediocre researchers. When
added to our basic regression (‘Quality control: Articles and rankings’) this
variable came out negative and significant at the 10% level (-.573 with a
standard error of .320). The finding that negative skewness is associated with
a higher rating conforms with our conjecture that - relative to independent
rankings - the RAE places less weight on star researchers and more weight at
research below the very top level.
III. CONCLUSIONS
This paper investigates empirically how far the RAE ratings, used for the
allocation of funding to economics departments in the UK, reflect on different
measures of research output submitted to the review panel; and how they
compare with the research quality reflected in the rankings of economics
departments which appear in the literature. In doing so it also throws some
light to accusations of bias in the RAE ratings arising from panel membership
and the age, location and size of institutions. The analysis focuses on the 1996
and 2001 RAEs and uses research quality measures drawn from several
independent rankings covering the same periods as the corresponding RAEs.
18
The estimates obtained from the empirical analysis suggest that without
controlling for quality the RAE ratings appear biased in favour of universities
in England or represented in the panel and against newer universities. Most of
these apparent biases persist even when the research output variables
submitted to the panel are considered, either individually or collectively. Only
when the average ranking obtained by departments in academic economists’ rankings is also included as a control variable do those effects become
statistically insignificant. The only evidence of bias that survives our quality
controls is that of the 1996 panel appearing to favour departments represented
in it. Overall, 2001 ratings seem to be more in line with independent rankings
than those from 1996.
If the goal of the RAE is to maximize UK institutions’ performance in
independent rankings then it should simply adopt the methodology used in
constructing the rankings. The fact that it has not done so suggests that the
RAE has somewhat different objectives. This is supported by our findings: the
RAE tends to reward balance within a department by limiting the extent to
which individuals with high quality research output can dominate the ratings
and by giving consideration to a broader range of the research quality
spectrum. One could still argue that the RAE’s objectives - whatever they
might be - could be made more explicit through the introduction of specific
performance measures. Our investigation shows that metric-based performance
indicators submitted to the RAE panel do not fully explain the RAE ratings,
implying the exercise of discretion by the panel. Naturally, the use of
subjective judgement raises accusations of bias that are hard to defuse, even
when unjustified. One way to make the RAE more transparent and less open
to disconcerting accusations of bias is to add explicitly a metric-based
indicator reflecting research quality as understood by the economics profession
at large: the quality of journals in which research output is published.
In conclusion, the UK RAE of the Economics departments conforms to its
stated objective of producing ratings of research quality, although the level at
which this quality is benchmarked may not be always clear, as evidenced by
the heterogeneity between the 1996 and 2001 RAE ratings. Incorporating a
metric-based measure of this level can make the ratings less open to
interpretation that encourages confusion and accusations. But the benefits of
transparency will need to be weighed against the possible costs of relying on
measures of research quality that are inevitably imperfect. Interestingly, the
2008 RAE has moved away from the broad categorization that the rating
scheme imposes and has instead provided a quality profile for each
department. By making available the entire distribution of research quality
19
rather than just a rating, the 2008 RAE has provided more information to
interested parties and at the same time has shielded itself from criticism that
is inevitable whenever broad categorizations are involved. A comparison of
this approach and its outcome with other rankings will make an interesting
research topic in the near future.
APPENDIX
Computation of independent rankings and additional results
To create the independent measures of research quality, we use the number of pages of the university’s publications and the rankings from Tombazos (2005), Kalaitzidakis et al. (1999
and 2003), Süssmuth et al. (2006), Coupé (2003) and Combes et al. (2003). These are described in detail in Table A1 and explained as follows.
• Kalaitzidakis et al. (1999) construct two sets of rankings of European economics institutions, KMS2a and KMS3c. The KMS2a ranking uses publications in all ten KMS99 journals while the KMS3c excludes publications in EJ and EER. Both sets are based on publications from 1991 to 1996 with pages allocated to authors and their affiliation on a per capita basis. In each set there are two rankings: one constructed by converting article pages to AER standardized pages to account for differences in the quality and size of the journals by employing an impact adjusted citation per character index (IACC); and the other by using unadjusted pages. For the independent measures of research quality in this paper we use the number of AER-standardised pages of the university’s publications and the standardized ranking using all ten KMS99 journals.
• Kalaitzidakis et al. (2003) construct a ranking of economics institutions throughout the world (and renumber it to create a European-only economics institutions ranking) based on articles published in 30 selected (KMS03) journals from 1995 to 1999. In this paper a character index is created and used to account for journal size and convert the pages to AER standardized pages. Both standardised rankings and number of pages of publications were used in this paper as measures of research quality.
• In Tombazos (2005) there is one ranking relying on publications from 1991 to 1996, and three rankings relying on publications from 1997 to 2002. The first ranking is based on articles in the KMS99 journals, with article pages converted to AER standardised pages by using a composite size and quality conversion factor (CSQCF). The same methodology but publications in a different group of journal are used for the three ranking relying on publications from 1997 to 2002. One of these rankings is based on publications in the 10 journals used by KMS (KMS99), the other on publications in the 8 journal used by Dusansky and Vernon (1998), while the third one is based on publications in the 15 journals used by Kocher and Sutter (2001). In the paper we use the standardised number of pages of the publications and ranking relying on publications from 1991 to 1996 and for the period 1997 to 2002 we use the standardised number of pages of the publications and the ranking based on the publications in the 15 journals used by Kocher and Sutter (2001).
• In Süssmuth et al. (2002) there are two sets of rankings, one for the period from 1991 to 1996 and the other one for the period from 1997 to 1999. In each set there are two rankings: one uses all publications in KMS99 journals and the other excludes publications in EER and EJ. All rankings adopt the AER standardised pages and the weighting method as in KMS99. In this paper we use the two rankings and the number of pages of

20
publications (one from each set) relying on publications in all ten KMS99 journals.
• Coupé (2003) uses fourteen different methodologies to compute eleven world rankings based on publications;21 and three world rankings based on citations for the period 1990-2000. The overall article-based rankings, based on the average of the eleven different rankings (methodologies), is also computed for sub-periods. In the paper we only use the overall article-based rankings for the period 1992-1996 and 1996-2000 since the standardised number of pages of publications is not publicly available.
• In Combes and Linnemer (2003) there are three rankings (differing in the output index used) of European research centres for three time periods, covering both total and per member output in EconLit journals. In addition, for the period 1996-2000, there are three ranking based on the output of the ten most productive researchers of each centre. The three output indices used are: (a) the Eln, which is the most elementary one and weights equally all EconLit journals; (b) the Blue, which is very selective and gives weights only to the eight Blue Ribbon journals of Dusansky and Vernon (1998); and (c) the Clpn, which is probably better balanced in the sense that it takes into account all journals but gives more weight to publications in quality journals. In this paper we use the number of pages of the publications and the ranking for the time period 1996-2000 based on total output as weighted by the CLpn index.
The number of publications and rankings covering the period 1991 and 1996 are used to construct respectively the university score and independent ranking for the 1996 RAE and the ones between 1997 and 2002 to construct the university scores and independent ranking for the 2001 RAE. For each period the selected rankings for each UK university were renumbered to yield a UK-only ranking and then summed up and divided by the number of available rankings to compute the average. To construct the university scores, the number of university publications were first divided (weighted) with the number of pages of the publications of the university with the highest number of publications and then multiply by 100. Thus the university with the highest number of publications has a weighted number of publications of 100 and the other universities have lower number. Then the average of the weighted number of pages of publications for each university in each period, was computed.
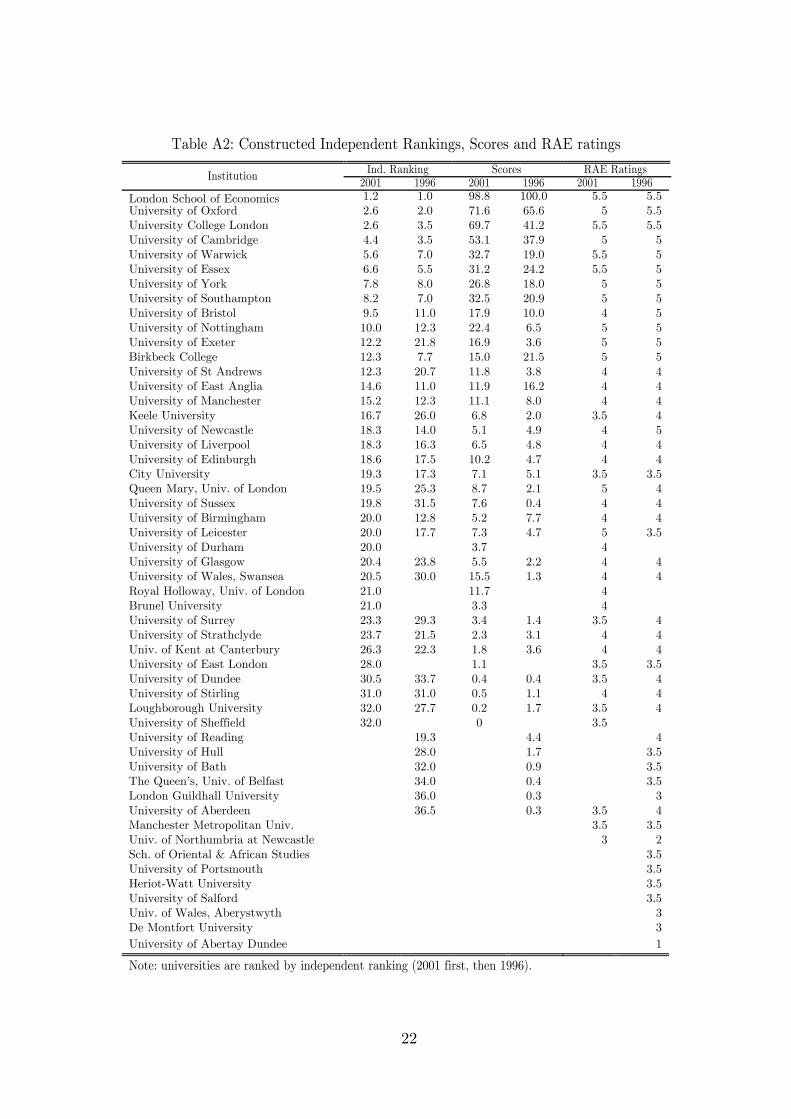
Table A2 reports the university scores and independent rankings used in our empirical analysis, together with the RAE ratings. As regards the independent measures of research quality, 10 universities that appear in the 1996 RAE and 3 universities that appear in the 2001 RAE are not included. These universities are assigned the values of 38 for 1996 and of 33 for 2001 as their independent ranking and the value of zero as their university scores, i.e. they are placed at the bottom of the respective university scores and rankings. Notably, the majority of the universities without information in the independent measures of research quality are new universities (six out of seven in the 1996 RAE and two out of three in the 2001 RAE). The conclusions obtained from the empirical analysis in the paper are not affected when universities without independent quality information are excluded from the sample or included with a low ranking assigned to them. The exclusion of these simply reduces the significance of some parameters (e.g. the t-statistic corresponding to external income decreases from 2.40 to 2.25); however, such reductions are not large enough to render one parameter significant (at 5% level) with and insignificant without the new universities.

21
Table A1: Independent Rankings
Authors Code Name
Period cover
# of common inst. with
RAE
Rankings based on
Sussmuth, Steinger and Ghio
SSG2a SSG4a
1991-19961997-1999
34 33
Code name ending with:
a: journals nominated by KMS991, AER standardized pages
b: journals nominated by Kocker and Sutter2
c: journals nominated by KMS033 , AER standardized pages
Kalaitzidakis, Mamuneas and Stengos
KMS2a KMS3c
1991-19961995-1999
38 26
Tombazos CT2a
CT5b
1991-19961997-2002
38 33
Coupe TC1
TC6
1992-19961996-2000
23 22
Combes and Linnemer
CL6
1996-2000 21
1KMS99 journals: American Economic Review (AER), Econometrica (ECMCA), Journal of Political Economy (JPE), Quarterly Journal of Economics (QJE), Journal of Monetary Economics (JME), Journal of Economic Theory (JET), Review of Economic Studies (REStud), Review of Economics and Statistics (REStat), The Economic Journal (EJ) and European Economic Review (EER).
2Kocher and Sutter journals: Journal of Economic Literature (JEL), Brookings Papers on Economic Activity (BPEA), Journal of Financial Economics (JFE), Journal of Political Economy (JPE), Econometrica (ECMCA), Quarterly Journal of Economics (QJE), American Economic Review (AER), Journal of Law Economics (JLE), Journal of Monetary Economics (JME), Rand Journal of Economics (RJE), Review of Economics and Statistics (REStat), Economic Journal (EJ), Journal of Human Resources (JHR), Economic Geography Journal (JEG), The Economic History Review (HER).
3KMS03 journals: American Economic Review (AER), Journal of Political Economy (JPE), Econometrica (ECMCA), Quarterly Journal of Economics (QJE), Journal of Econometrics (JEcon), Journal of Economic Perspectives (JEP), Journal of Economic Theory (JET), Journal of Monentary Economics (JME), Review of Economic Studies (REStud), The Economic Journal (EJ), European Economic Review (EER), Games and Economic Behavior (GEB), Journal of Business and Economic Statistics (JBES), Journal of Public Economics (JPE), Journal of Human Resources (JHR), Journal of Economic Literature (JEL), Econometric Theory (ET), Journal of Labor Economics (JLE), International Economic Review (IER), Economic Theory (ET), Journal of Environmental Economics and Management (JEEM), Rand Journal of Economics (RJE), Journal of Financial Economics (JFE), Economics Letters (EL), Journal of Applied Econometrics (JAE), Oxford Bulletin of Economics and Statistics (OBES), Scandinavian Journal of Economics (SJE), Journal of Economic Dynamics and Control (JEDC), Journal of International Economics (JIE).
22
Table A2: Constructed Independent Rankings, Scores and RAE ratings
Institution Ind. Ranking Scores RAE Ratings
2001 1996 2001 1996 2001 1996
London School of Economics 1.2 1.0 98.8 100.0 5.5 5.5University of Oxford 2.6 2.0 71.6 65.6 5 5.5University College London 2.6 3.5 69.7 41.2 5.5 5.5University of Cambridge 4.4 3.5 53.1 37.9 5 5University of Warwick 5.6 7.0 32.7 19.0 5.5 5University of Essex 6.6 5.5 31.2 24.2 5.5 5University of York 7.8 8.0 26.8 18.0 5 5University of Southampton 8.2 7.0 32.5 20.9 5 5University of Bristol 9.5 11.0 17.9 10.0 4 5University of Nottingham 10.0 12.3 22.4 6.5 5 5University of Exeter 12.2 21.8 16.9 3.6 5 5Birkbeck College 12.3 7.7 15.0 21.5 5 5University of St Andrews 12.3 20.7 11.8 3.8 4 4University of East Anglia 14.6 11.0 11.9 16.2 4 4University of Manchester 15.2 12.3 11.1 8.0 4 4Keele University 16.7 26.0 6.8 2.0 3.5 4University of Newcastle 18.3 14.0 5.1 4.9 4 5University of Liverpool 18.3 16.3 6.5 4.8 4 4University of Edinburgh 18.6 17.5 10.2 4.7 4 4City University 19.3 17.3 7.1 5.1 3.5 3.5Queen Mary, Univ. of London 19.5 25.3 8.7 2.1 5 4University of Sussex 19.8 31.5 7.6 0.4 4 4University of Birmingham 20.0 12.8 5.2 7.7 4 4University of Leicester 20.0 17.7 7.3 4.7 5 3.5University of Durham 20.0 3.7 4 University of Glasgow 20.4 23.8 5.5 2.2 4 4University of Wales, Swansea 20.5 30.0 15.5 1.3 4 4Royal Holloway, Univ. of London 21.0 11.7 4 Brunel University 21.0 3.3 4 University of Surrey 23.3 29.3 3.4 1.4 3.5 4University of Strathclyde 23.7 21.5 2.3 3.1 4 4Univ. of Kent at Canterbury 26.3 22.3 1.8 3.6 4 4University of East London 28.0 1.1 3.5 3.5University of Dundee 30.5 33.7 0.4 0.4 3.5 4University of Stirling 31.0 31.0 0.5 1.1 4 4Loughborough University 32.0 27.7 0.2 1.7 3.5 4University of Sheffield 32.0 0 3.5 University of Reading 19.3 4.4 4University of Hull 28.0 1.7 3.5University of Bath 32.0 0.9 3.5The Queen’s, Univ. of Belfast 34.0 0.4 3.5London Guildhall University 36.0 0.3 3University of Aberdeen 36.5 0.3 3.5 4Manchester Metropolitan Univ. 3.5 3.5Univ. of Northumbria at Newcastle 3 2Sch. of Oriental & African Studies 3.5University of Portsmouth 3.5Heriot-Watt University 3.5University of Salford 3.5Univ. of Wales, Aberystwyth 3De Montfort University 3
University of Abertay Dundee 1
Note: universities are ranked by independent ranking (2001 first, then 1996).
23
ACKNOWLEDGEMENTS
We would like to thank Philip Arestis, John Beath, Richard Blundell, Alison Booth, David F. Hendry, Norman Ireland, Jim Malcomson, Anton Muscatelli, Carol Propper and Peter Sloane for comments and suggestions on an earlier draft. We are grateful for helpful comments from seminar participants at the European University Institute. Erma Michael provided enthusiastic research assistance. We are solely responsible for errors and omissions.
NOTES
1 Source: “A Guide to the 2001 Research Assessment Exercise,’’ available at http://www.rae.ac.uk/2001/Pubs/.
2 The specific accusations of bias and the statistical analyses that investigate them are reviewed in section II.
3 Prendergast and Topel (1996) have provided a theoretical treatment of the subjective nature of supervisor evaluations and show how they may lead to favouritism in organizations.
4 See Baker (1992) for an early theoretical contribution and Courty and Marschke (2008) for an empirical study.
5 Motivated by the RAE process, Guermat et al. (2004) provide a theoretical analysis of a decision maker’s problem in a ‘rules versus discretion’ context, where discretion is modelled as the use of private information.
6 Report available at http://www.ra-review.ac.uk/.
7 http://www.rae.ac.uk and http://www.hefce.ac.uk respectively. We had obtained the information from the Higher Education and Research Opportunities in the United Kingdom website (http://www.hero.ac.uk), which has since been closed.
8 Universities could submit up to four pieces of research output for staff in categories A or C and up to two pieces of output for staff in category A*. Category A includes staff in post at the submitting institution on the census date (not falling in category A*); category A* is staff who have transferred employment between eligible UK Higher Education institutions in the period between 1 April 2000 and 30 March 2001, inclusive; category C is other individuals active in research in the department at the census date. In 1996 RAE category A* did not exist and universities could not submit research output for academic staff who left the institution.
9 Three of the 91 departments that were assessed in the two exercises had to be dropped from the sample because of missing data: in the RAE 1996 there is no information on the research output and external income of Nottingham Trent University and on the number of PhDs awarded for Staffordshire University; in the RAE 2001 there is no information on the external income of London Guildhall University.
10 The same convention was implemented in the econometric analysis in the next section. We have found that experimenting with other values for 3a and 5* (e.g. 3.3 and 5.3, respectively) does not alter the conclusions of the analysis.
11 The information required for the construction of the last two variables was obtained from each university’s website.
12 One can argue that using the original rankings (based on the entire population) is more appropriate in the sense that the interpolation of more non-UK universities between two UK ones can be an indication of a greater quality gap. On the other hand, the margin of error in these studies is quite large as we move down the rankings and the quality difference between, say, a rank of 100 and 110 is likely to be very small.
24
13 For example, it is not clear in some ratings whether City University includes the Business
School. Although we have taken the utmost care to minimise such problems, one can never be certain that the data are completely free of measurement errors.
14 It should also be noted here that we have found the total number of journal articles to explain more of the variation in RAE ratings than when this variable is used in per capita terms (i.e. journal articles per staff or journal articles per research active staff). Furthermore, the choice between the two specifications does not change the conclusions of the empirical analysis.
15 The independent ranking variable has a negative coefficient because quality decreases as one starts from 1 and moves down the list. Here we reverse the sign of the coefficients to ease interpretation.
16 The lack of critical mass has been argued to be the reason why Scottish economics departments had lower RAE ratings than the English ones in 1996 and 2001. Pooling research resources to obtain such mass is said to be the reason behind the recent initiative by the Scottish Funding Council to create a Scottish Institute for Research in Economics (SIRE).
17 The departments represented in the 2001 have average rankings 9.3 and average ratings 4.78. The corresponding figures for the departments represented in the 1996 panel are 15.8; and 4.44, respectively.
18 Coupé (2003) employs this weighting scheme in some of his rankings. It would be interesting to test whether those rankings correspond more closely to RAE ratings than rankings that do not adjust for article quality. Unfortunately this can not be done as citation-adjusted rankings are only available for the 1990-2000 period and they only include about half the UK departments.
19 In other specifications we tested External research income came out significant in 1996.
20 Interested readers can obtain additional empirical results from the authors on request.
21 The three methodologies used for the citation-based articles are: citation count,citation count weighted for coauthorship, time adjusted citation count weighted for coauthorship.
REFERENCES
BAKER, G.P. (1992). Incentive Contracts and Performance Measurement. The Journal of
Political Economy, 100, 598–614.
CLERIDES, S., NEARCHOU, P. and PASHARDES, P. (2008). Intermediaries as Quality Assessors: The Case of Tour Operators. International Journal of Industrial Organization,
26, 372–92.
COMBES, P.P. and LINNEMER, L. (2003). Where are the Economists Who Publish? Publication Concentration and Rankings in Europe Based on Cumulative Publications.
Journal of the European Economic Association, 1, 1250–1308.
COUPÉ, T. (2001). Can Peer Review Be Trusted? The UK’s ‘Research Assessment Exercise’ on Trial. In M. Dewatripont, F. Thys-Cljement and L. Wilkin (eds.), The Strategic Analysis of Universities: Microeconomic and Management Perspectives, Editions de
l’Universitje de Bruxelles, Universitje de Bruxelles, Brussels.
˙˙˙˙˙˙˙˙˙˙˙ (2003). Revealed Performances: Worldwide Rankings of Economists and Economics
Departments, 1990-2000. Journal of the European Economic Association, 1, 1309–45.

25
COURTY, P. and MARSCHKE, G. (2008). A General Test for Distortions in Performance
Measures. Review of Economics and Statistics, 90, 428–41.
DOYLE, J., ARTHURS, A., GREEN, R., MCAULAY, L., PITT, M., BOTTOM-LEY, P. and EVANS, W. (1996). The Judge, the Model of the Judge, and the Model of the Judged as Judge: Analyses of the UK 1992 Research Assessment Exercise Data for Business and
Management Studies. Omega: International Journal of Management Science, 24, 13–28.
DUSANSKY, R. and VERNON, C.J. (1998). Rankings of U.S. Economics Departments. Journal of Economic Perspectives, 12, 157–70.
GAMBRILL, E. (2002). I Am Not a Rubber Stamp: My Experience as a Non-UK RAE Adviser. Journal of Social Work, 2, 169–85.
GARICANO, L., PALACIOS-HUERTA, I. and PRENDERGAST, C. (2005). Favoritism
Under Social Pressure. Review of Economics and Statistics, 87, 208–16.
GUERMAT, C., HARRIS, R.D. and HASHIMZADE, N. (2004). Rules versus Discretion in Committee Decision Making: An Application to the 2001 RAE for UK Economic Departments. unpublished manuscript.
JOHNES, J., TAYLOR, J. and FRANCIS, B. (1993). The Research Performance of UK Universities: A Statistical Analysis of the Results of the 1989 Research Selectivity Exercise.
Journal of the Royal Statistical Society, Series A, 156, 271–86.
KALAITZIDAKIS, P., MAMUNEAS, T. and STENGOS, T. (1999). European Economics: An Analysis Based on Publications in the Core Journals. European Economic Review, 43,
1150–68.
˙˙˙˙˙˙˙˙˙˙˙ (2003). Rankings of Academic Journals and Institutions in Economics. Journal of the
European Economic Association, 1, 1346–66.
KOCHER, M.G. and SUTTER, M. (2001). The institutional concentration of authors in top
journals of economics during the last two decades. Economic Journal, 111, 405–21.
LABAND, D.N. and PIETTE, M.J. (1994). Favoritism versus Search for Good Papers: Empirical Evidence Regarding the Behavior of Journal Editors. The Journal of Political
Economy, 102, 194–203.
MCKAY, S. (2003). Quantifying Quality: Can Quantitative Data (‘Metrics’) Explain the 2001 RAE Ratings for Social Policy and Administration?. Social Policy and Administration, 37,
444–67.
MEDOFF, M.H. (2003). Editorial Favoritism in Economics?. Southern Economic Journal, 70,
425–34.
NEARY, J.P., MIRRLEES, J.A. and TIROLE, J. (2003). Evaluating Economics Research in
Europe: An Introduction. Journal of the European Economic Association, 1, 1239–49.
OSWALD, A.J. (2007). An Examination of the Reliability of Prestigious Scholarly Journals:
Evidence and Implications for Decision-Makers. Economica, 74, 21–31.
PRENDERGAST, C., and TOPEL, R.H. (1996). Favoritism in Organizations. The Journal of
26
Political Economy, 104, 958–78.
RICKMAN, N. and WITT, R. (2008). Favouritism and Financial Incentives: A Natural
Experiment. Economica, 75, 296–309.
ROBERTS, G. (2003). Review of Research Assessment: Report by Sir Gareth Roberts to the UK Funding Bodies, http://www.ra-review.ac.uk.
SHARP, S. and COLEMAN, S. (2005). Ratings in the Research Assessment Exercise 2001 -The Patterns of University Status and Panel Membership. Higher Education Quarterly, 59,
153–71.
SÜSSMUTH, B., STEININGER, M. and GHIO, S. (2002). Towards a European Economics of Economics: Monitoring a Decade of Top Research and Providing Some Explanation.
Scientometrics, 66, 579–612.
TAYLOR, J. (1995). A Statistical Analysis of the 1992 Research Assessment Exercise. Journal
of the Royal Statistical Society, Series A, 158, 241–61.
TOMBAZOS, C.G. (2005). A Revisionist Perspective of European Research in Economics.
European Economic Review, 49, 251–77.
WILLIAMS, G. (1998). Misleading, Unscientific and Unjust: the United Kingdom’s Research
Assessment Exercise. British Medical Journal, 316, 1079–82.