PC 3 2013 Javadi 220
11
Petroleum & Coal ISSN 1337-7027 Available online at www.vurup.sk/petroleum-coal Petroleum & Coal 55 (3) 196-206, 2013 MATHEMATICAL MODELING AND COMPARISON OF TWO RISER REACTORS IN CONVENTIONAL FCCU AND FCCU ASSISTED BY MICROWAVE ENERGY Ehsan Javadi Shokrooi, Mohammad Shahcheraghi, Mehdi Farniaei The Parthia Chemistry Company, Knowledge Based Companies Campus, Martyr Fahmideh Talent Foundation, Shiraz, Iran, E-mail: [email protected] Received April 5, 2013, Accepted August 1, 2013 Abstract A one dimensional dynamic model for a riser reactor in a fluidized bed catalytic cracking unit (FCCU) for gasoil feed has been developed in two distinct conditions, one for industrial FCCU and another for FCCU using various frequencies of microwave energy spaced at the height of the riser reactor (FCCU- MW). In addition, in order to increase the accuracy of component and bulk diffusion, instantaneous and overall fractional yield is used in a heuristic manner. Furthermore, the effect of various input temperatures on gasoline yield with FCCU-MW has been studied. The results of the convectional FCCU simulation show great compatibility with the plant data in hand. Comparison of the two models shows that microwave energy gives better results in terms of gasoline yield. Also it has been shown that the increase of feed temperature leads to the increase of gas oil conversion and especially gasoline yield. Keywords: Fluidized bed catalytic cracking; Riser reactor; Mathematical modeling; Microwave energy; Four-lump kinetic model. 1. Introduction Cracking is definitely a key process in petroleum refinery. During the cracking process heavier petroleum fractions with higher boiling points crack into more valuable products with lower boiling points such as transportation fuel. Cracking is classified as thermal cracking and catalytic cracking. The presence of catalyst in catalytic processes, improves the progression of the reaction. Three types of catalytic cracking are known, moving bed catalytic cracking, fluidized bed catalytic cracking (FCC) and thermoform catalytic cracking. There are approximately 400 catalytic crackers operating worldwide, with a total processing capacity of over 45,000 m 3 /day (12 million barrels per day) [8] . A conventional FCC unit (FCCU) is composed of two main sections, a riser reactor that all endothermic reactions and coke deposition are accrued in it and a regenerator section which removes the deposited coke from the catalyst by burning it off. Heat generated from burning the coke in the regenerator, provides the required temperature for high endothermic cracking reaction in the riser. The riser-regenerator assembly is usually maintained in heat balance. In this process, the preheated heavy gas oil is mixed with the hot regenerated catalyst at the base of the riser, then the cracking reactions take place. After the reaction, the volatile products and the spent catalyst are separated, after which the spent catalyst is immediately stripped of entrained and adsorbed hydrocarbons in a high efficiency multi-stage stripper. The stripped catalyst gravitates through a short standpipe into a single- vessel, simple, reliable, and yet efficient catalyst regenerator [20] . Many efforts have been made in many ways to evolve and improve the accuracy of the model’s predictions with a real process for industrial FCCU, which are mostly based on both the fluid flow of the process and kinetic models. Han et al. [9] carried out a mathematical modeling for the reactor, regenerator, main-fractionator, and most of the auxiliary parts. In another study, Fernandes et al. [6] presented the mathematical model of the riser section of a FCCU and the simulation results for typical industrial conditions both in steady-state and dynamic mode with six-lump kinetic models. Sousa et al. [19] provided a simplified transient
-
Upload
independent -
Category
Documents
-
view
1 -
download
0
Transcript of PC 3 2013 Javadi 220

Petroleum & Coal ISSN 1337-7027
Available online at www.vurup.sk/petroleum-coal Petroleum & Coal 55 (3) 196-206, 2013
MATHEMATICAL MODELING AND COMPARISON OF TWO RISER REACTORS IN
CONVENTIONAL FCCU AND FCCU ASSISTED BY MICROWAVE ENERGY
Ehsan Javadi Shokrooi, Mohammad Shahcheraghi, Mehdi Farniaei
The Parthia Chemistry Company, Knowledge Based Companies Campus, Martyr Fahmideh Talent Foundation, Shiraz, Iran, E-mail: [email protected]
Received April 5, 2013, Accepted August 1, 2013
Abstract
A one dimensional dynamic model for a riser reactor in a fluidized bed catalytic cracking unit (FCCU) for gasoil feed has been developed in two distinct conditions, one for industrial FCCU and another for FCCU using various frequencies of microwave energy spaced at the height of the riser reactor (FCCU-MW). In addition, in order to increase the accuracy of component and bulk diffusion, instantaneous and overall fractional yield is used in a heuristic manner. Furthermore, the effect of various input temperatures on gasoline yield with FCCU-MW has been studied. The results of the convectional FCCU simulation show great compatibility with the plant data in hand. Comparison of the two models shows that microwave energy gives better results in terms of gasoline yield. Also it has been shown that the increase of feed temperature leads to the increase of gas oil conversion and especially gasoline yield. Keywords: Fluidized bed catalytic cracking; Riser reactor; Mathematical modeling; Microwave energy; Four-lump kinetic model.
1. Introduction
Cracking is definitely a key process in petroleum refinery. During the cracking process heavier petroleum fractions with higher boiling points crack into more valuable products with lower boiling points such as transportation fuel. Cracking is classified as thermal cracking and catalytic cracking. The presence of catalyst in catalytic processes, improves the progression of the reaction. Three types of catalytic cracking are known, moving bed catalytic cracking, fluidized bed catalytic cracking (FCC) and thermoform catalytic cracking. There are approximately 400 catalytic crackers operating worldwide, with a total processing capacity of over 45,000 m3/day (12 million barrels per day) [8]. A conventional FCC unit (FCCU) is composed of two main sections, a riser reactor that all endothermic reactions and coke deposition are accrued in it and a regenerator section which removes the deposited coke from the catalyst by burning it off. Heat generated from burning the coke in the regenerator, provides the required temperature for high endothermic cracking reaction in the riser. The riser-regenerator assembly is usually maintained in heat balance. In this process, the preheated heavy gas oil is mixed with the hot regenerated catalyst at the base of the riser, then the cracking reactions take place. After the reaction, the volatile products and the spent catalyst are separated, after which the spent catalyst is immediately stripped of entrained and adsorbed hydrocarbons in a high efficiency multi-stage stripper. The stripped catalyst gravitates through a short standpipe into a single-vessel, simple, reliable, and yet efficient catalyst regenerator [20].
Many efforts have been made in many ways to evolve and improve the accuracy of the model’s predictions with a real process for industrial FCCU, which are mostly based on both the fluid flow of the process and kinetic models. Han et al. [9] carried out a mathematical modeling for the reactor, regenerator, main-fractionator, and most of the auxiliary parts. In another study, Fernandes et al. [6] presented the mathematical model of the riser section of a FCCU and the simulation results for typical industrial conditions both in steady-state and dynamic mode with six-lump kinetic models. Sousa et al. [19] provided a simplified transient
model to predict the performance of a FCC riser reactor. They used a bi-dimensional fluid flow field combined with a six-lump kinetic model and two energy equations to model the gas oil mixture flow and the cracking process inside the riser reactor. Baudrez et al. [2] represented a steady state, two phase gas-solid simulation of a FCC riser using a decoupled solution method. They also considered the four-lump kinetic model to demonstrate the feasibility of the method in their simulation. Also, a three-dimensional, two-phase flow model to predict the dynamic behavior of a fluid catalytic cracking industrial reactor has been developed by Lopes et al. [14]. They also used a four-lump model to represent the catalytic cracking reactions. Heydari et al. [10] studied a steady-state model of an industrial riser of a FCCU without any partial differential equations.
Moreover, researchers have studied other issues in catalytic cracking processes, the most significant one being loss and deactivation of the catalyst in conventional FCCU. Although the stripper and regeneration section can remove most of the bothersome and unwanted hydrocarbons from the catalyst surface, but still catalyst injection is a necessary process in some time intervals. In order to decrease the injection of fresh catalyst, several methods have been suggested in various patents which use of microwave energy in the unit in different manners. Kirkbride [11] describes a process for regenerating spent cracking catalyst in FCCU. He claimed that the optimum activation takes place if the hydrogen is substituted for air or oxygen and the microwave heat source is positioned in the regenerator. Furthermore, he provides a method to increase FCCU performance by introducing some different frequencies of microwave energy in height of the riser reactor [12,18,]. Sarivker et al. [18] described a process for the desulfurization and cracking of hydrocarbons to produce fuel oil. In this process, fuel oils are mixed with sensitizer, solid sources of hydrogen and catalyst. The mixture is then subjected to microwave energy to reduce the sulphur content of fuel oil which cracks the fuel oil into useful sources of clean and burnable energy. Fanson et al. [5] described a process for catalytic cracking of hydrocarbons by exposing the catalyst to microwave energy with 2.0 to 4.0 GHz frequencies. They also explained that microwave heating is fundamentally different from conventional heating. In oppose to the generation of heat by external source as in conventional heating, the generation of heat in microwave is produced by the interaction between molecules in the heated material and the electromagnetic field created in a microwave oven. Compared to conventional heating, microwave allows faster, more uniform heating with higher efficiency. Al-Quraishi [17] provides a new method for decoking of spent catalyst using microwave energy with 2.45 GHz frequency in his patent. In this method pellets of material called susceptures are mixed with spent catalyst and then subjected to microwave energy to treat the spent catalyst.
In this paper a one dimensional dynamic, four-lump kinetic model has been developed for FCCU which uses microwave energy as a heat source in height of the riser reactor based on Kirkbride’s patent [11]. The greatest advantage of microwave energy in such a case is the increase of catalyst activation by direct delivery of energy from the source to the sample and the ability of selectiveness heating. Also the results of both units (FCC and FCC-MW) have been compared mathematically to demonstrate the positive effects of microwave energy on gasoline yield. In addition, the effects of feed input temperature have been investigated to study the FCCU-MW performance. Inside the riser reactor all the cracking reactions lead to the conversion of heavy gas oil products and the production of more valuable petroleum fractions, so the present work is mainly focused on the modeling and simulation of the riser reactor.
2. Mathematical Modeling
To develop a mathematical model for a FCCU the main assumptions are: a. Ideal behavior of gas. b. Application of one-dimensional transported plug flow. c. The reactor wall is adiabatic. d. Constancy of gas viscosity. e. Dispersion and adsorption inside the catalyst particles are negligible. f. The coke deposited on the catalyst does not affect the fluid flow. g. Instantaneous vaporization occurs just before the gas-solid mixture flows into the riser reactor.
The gas phase energy balance is based on the thermo physical properties of the components:
⎟⎟⎠
⎞⎜⎜⎝
⎛+Δ⎟⎟
⎠
⎞⎜⎜⎝
⎛ −+⎟⎠⎞
⎜⎝⎛
∂∂
∂∂
=∂
∂+
∂∂ ∑ =
'''1
).(.1...)..(
.).( QrHzTK
zCpMPTR
zTu
tT N
i iibed
bedcatmix
mix εερ (1)
In the FCCU-MW the heat source term (Q΄΄΄) takes into account the assisted energy of microwave, needless to say that this term is zero in convectional FCCU.
For an ideal gas mixture,
∑=
=N
iiimix yCpCp
1
. (2)
TRMP
mix ..
=ρ (3)
The correlation of Patience et al. [16] for slip factor was used:
47.0 47.06.51. t
pbed
FrFru
u++==
ευ (4)
In which,
)1.( beds
sp
Guερ −
= (5)
Combining the eqns. (4) and (5) gives an expression for the average voidage:
ss
sbed G
G..u
.10 υρ
υε+
−= (6)
The heat source term is calculated from Lambert’s law without solving the electromagnetic field. Volumetric heating rate according to Lambert’s law is explained using the exponential drop of microwave power as the microwave penetrates the components [3].
⎥⎥⎦
⎤
⎢⎢⎣
⎡−= ∫
z
pzp zddz
dFzQ
0)(
0
)(exp)( (7)
Absorption depth, dp, is defined as the distance at which the microwave power represents 1/e of the power flux. Mathematically, absorption depth depends on the dielectric properties of materials.
21
21
2''
' )]1))'
(1((2[2
−−+=
εεε
πfC
d op (8)
Dielectric constants at specific temperatures are presented in Table 1.
Table 1 Dielectric constants (Formerly ASI Instruments).
Component Gas oil Gasoline Light gas Coke Dielectric constant 2.1-3.0 (68 oF) 2.0 (70 oF) 1.6-1.9 1.1-2.2
For a sinusoidal the microwave surface flux is expressed by (Akkari et al.) [1]:
)(sin.2)0,( 20 a
zab
Pzf π= (9)
The thermal conductivity (K) of hydrocarbons (in CGS units) is given by the equation[20]:
310).00054.0.(28.0
−−=
ldk
ii (10)
For an ideal gas mixture,
∑=
=N
iiimix ykk
1. (11)
The gas phase mass balance is represented as below:
⎟⎟⎠
⎞⎜⎜⎝
⎛ −⎟⎠⎞
⎜⎝⎛+⎟
⎠⎞
⎜⎝⎛
∂∂
∂∂
=∂
∂+
∂∂
bed
bedicatimi
ii
PTRr
zyD
zzyu
ty
εερ 1....).(
, (12)

In which (Treybal) [21],
∑
∑
=
=
−
−= N
Ajjiij
ji
N
jiii
mi
NyNyD
NyND
).(1
.
,
1, (13)
The equation of Wilke-Lee is used to predict multi-component diffusivity (Treybal) [21]:
)(.).(
1111249.0084.110
,
2,
23
4
,
jiji
jijiji KTfrP
MMT
MMD
ε
+⎟⎟⎠
⎞⎜⎜⎝
⎛+−
=
−
(14)
The dependency of component’s mass fluxes in Eq. (13) can be derived from a mass balance for the reactionary system. In fact, the rate of decomposition and production of any component in bulk phase is related to the diffusion rate of components per system area. For those systems involving simple reaction rates, the mass fluxes dependencies are easily achieved directly from the proportionality of the components. On the other hand, the dependency of fluxes in systems with complicated reaction rates are not attained in this manner and require a great contemplation. In this work, the instantaneous and overall fractional yield [13] was used to estimate the relationship between the component’s mass fluxes. In fact, the overall fractional yield (or overall fractional consumption) of each compound shows its share of participation in the related reactions. In other words, each compound participates in related reactions proportional to the quantity of its diffusion in the bulk fluid. The overall fractional yield (or consumption) of ith compound versus jth compound:
j
y
y ji
jojji dy
yy
j
j
∫⎟⎟⎠
⎞⎜⎜⎝
⎛⎟⎟⎠
⎞⎜⎜⎝
⎛ ⎟⎟⎠
⎞⎜⎜⎝
⎛
−−
=0,
.1
,
ξζ (15)
The instantaneous fractional yield (or consumption) of ith compound versus jth compound:
j
i
j
i
ji dy
dyrr
−==
⎟⎟⎠
⎞⎜⎜⎝
⎛ξ (16)
Therefore,
12
.)(
+=
−N
Ngl
gogoglζ
12lg
.lg
+=
−N
N gogo
ζ
12
.
)(
+=
−NN
ckgo
gockζ
(17-1)
And,
11lg
.
)lg
(
+=
−NN gl
glζ
11
.
)(
+=
−NN
ckgl
glckζ
(17-2)
For example, replacing eqns. (17-1) and (17-2) into eqn. (13), for gasoline component, gives:
⎟⎟⎠
⎞⎜⎜⎝
⎛++⎟
⎟⎠
⎞⎜⎜⎝
⎛++
⎟⎟⎟⎟
⎠
⎞
⎜⎜⎜⎜
⎝
⎛
+
⎟⎟⎟⎟
⎠
⎞
⎜⎜⎜⎜
⎝
⎛
−−−−
=
ζζζ
ζζζ
)(,
)lg(lglg,)(,
)()lg()(
,
..1..12..1
21.1
glckglck
ckglglgl
glgogl
glgogogl
glck
glgogl
gl
mgl
yyD
yyD
yyD
y
D (18)
The overall mass balance for gas phase is presented as below:

∑=⎟⎟⎠
⎞⎜⎜⎝
⎛ −+⎟⎟⎠
⎞⎜⎜⎝
⎛⎟⎠⎞
⎜⎝⎛
∂∂
∂∂
=⎟⎠⎞
⎜⎝⎛
∂∂
+⎟⎠⎞
⎜⎝⎛
∂∂ N
i ibed
bedcatmix rR
TP
zD
zTuP
zTP
t 1.1..
εερ (19)
For ideal gas mixtures,
∑=
=N
iimimix yDD
1, . (20)
The pressure drop throughout the riser is assumed to be the static head of the catalyst in the riser:
)1(. beds gzp ερ −−=∂∂
(21)
This work uses a four-lump model to take into account the catalytic cracking reactions. The representative reactions of this kinetic model are shown in Fig. 1.
Figure 1 Kinetic scheme of the four-lump reaction model
It is assumed that the cracking of gas oil is a second-order reaction but that of gasoline is a first-order reaction, and that the reactions take place only in the gas phase. The kinetic constants, given in Table 2, were evaluated at 550oC.
( ) φ.2321 gogo ykkkr ++−= (22-1)
( )( )φ..542
2 glgogl ykkykr +−= (22-2)
( )φ... 42
1lg glgo ykykr += (22-3)
( )φ... 52
3 glgock ykykr += (22-4)
Table 2 Kinetic constants, activation energies and heats of reaction.
Reaction kr|550ºc(m6kmol-1kgcat
-1s-1) Er(J mol-1) ΔHr(kJ kg-1) Gas oil to gasoline (Lopes et al. [14]) 20.4 57.360 195 Gas oil to light gases (Lopes et al. [14])
7.8 52.750 670
Gas oil to coke (Lopes et al. [14]) 3.0 31.820 745 Gasoline to light gases (Han et al. [9]) 256.81 65.73 530 Gasoline to coke (Han et al. [9]) 6.24x10⁻⁴ 66.57 690 Catalyst deactivation (Han et al. [9]) 8.38x10⁴ 117.72 ----
The parameter φ appearing in eqns. (22-1) to (22-4) is the deactivation function which is related to the temperature and the catalyst residence time [22]:
( )tc.exp αφ −= (23) Where, α is the catalysts decay coefficient which is related to the riser temperature by
an Arrhenius equation [22]:
⎟⎠⎞
⎜⎝⎛−=
TRE.
exp0αα (24)
The energy and mass balances at the riser entrance are presented as below: Energy balance
( ) ( ) ( )( ) 0.
.....
=∂∂
+−
+Δ+−+−+−
zTkTTCpF
HFTTCpFTTCpFTTCpF
mixdsdsds
vapgo
lgovap
vgo
vgogovap
lgo
lgocatcatcat
(25)
Mass balance
( ) 0,0,0,95.0;. 00lg
0000, ====−=∂∂
− ====== −+ zck
zzgl
zgo
zi
zi
imi yyyyyyu
zyD (26)
Where yiz=0- is the feed composition for ith component.
The mass and energy balances at the top of the riser are:
0=∂∂
=∂∂
zT
zyi (27)
And the initial conditions are ( ) ( ) ( ) atmi TzTzuzy === 0,,00,,00,
(28)
3. Results and discussion
The implicit finite difference scheme was used to solve a mathematical model which is consisted of coupled partial differential equations. The central first order difference is used to discretize the first order space derivatives and the second order derivatives are discretized using second order central difference. Forward finite differences are used to discretize time intervals.
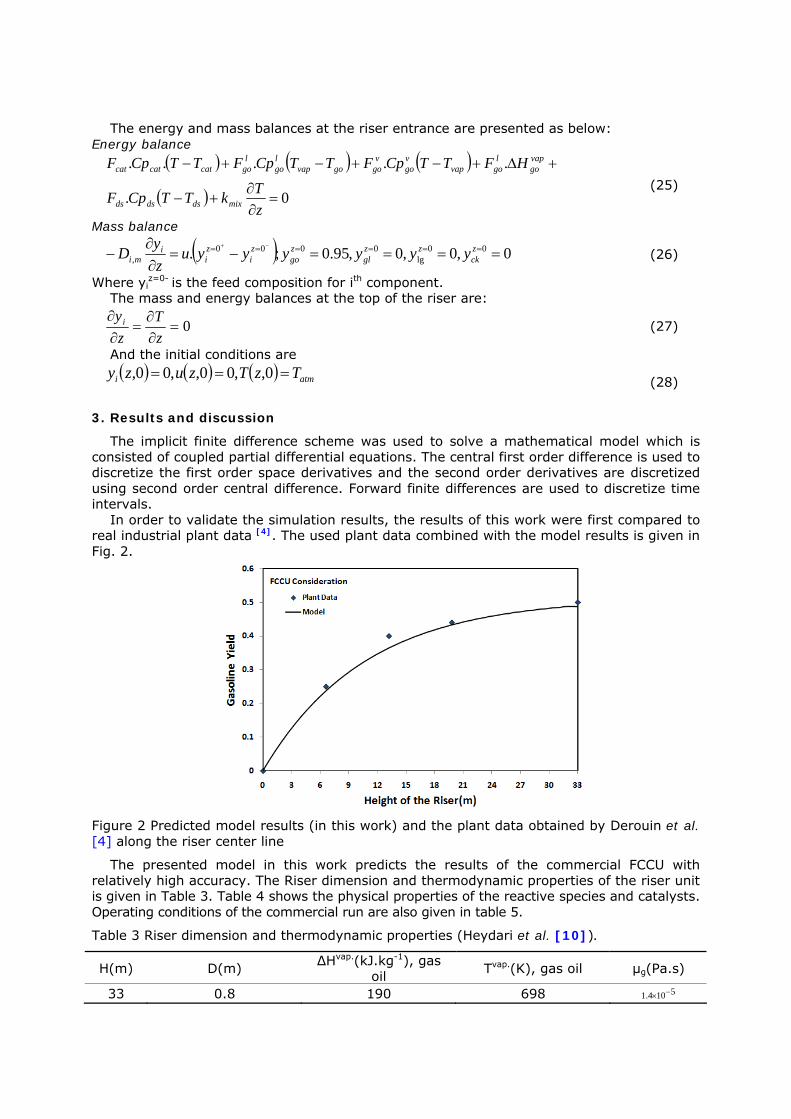
In order to validate the simulation results, the results of this work were first compared to real industrial plant data [4]. The used plant data combined with the model results is given in Fig. 2.
Figure 2 Predicted model results (in this work) and the plant data obtained by Derouin et al. [4] along the riser center line
The presented model in this work predicts the results of the commercial FCCU with relatively high accuracy. The Riser dimension and thermodynamic properties of the riser unit is given in Table 3. Table 4 shows the physical properties of the reactive species and catalysts. Operating conditions of the commercial run are also given in table 5.
Table 3 Riser dimension and thermodynamic properties (Heydari et al. [10]).
H(m) D(m) ΔHvap.(kJ.kg-1), gas oil
Tvap.(K), gas oil μg(Pa.s)
33 0.8 190 698 5104.1 −×

Table 4 Physical properties of reactive species and catalyst (Lopes et al. [14]).
Species Gas oil Gasoline Light gases Coke Steam Catalyst
Density(kg.m-3) 6 1.5 0.8 1400 0.98 1400
Specific heat(kJ.kg-1.K-1) 2.67(Liq.), 3.3(Gas)
3.3 3.3 1.087 1.9 1.087
Thermal conductivity(W.m-1.K-1) 0.025 0.025 0.025 0.045 0.045 Molecular weight(kg.kmol-1) 333 106.7 40.0 14.4 18.0 ---
Table 5 Operating conditions of commercial run (Heydari et al. [10]).
Feed rate (kg.s-1)
Feed quality (API)
CTO (kgcat.kgfeed
-1) Inlet
pressure (kPa)
Feed temperature
(K)
Catalyst inlet temperature
(K)
Steam (%)
Steam temperature
(K) 26.9 22.18 5.43 294 494 1004 5 773
Fig. 3 shows the simulated profiles along the riser reactor in a FCCU. As expected, gas oil concentration was reduced throughout the reactor, and other components are produced instead. In Fig. 4 the temperature profile of the reactions in the riser has been illustrated. As it was expected, due to the nature of endothermic reaction, the temperature profile is descending. Furthermore, it can be seen that the temperature drop is greater in the FCCU than the FCCU-MW. The reason for this is the positioning of the microwave energy source along the riser reactor. In addition, according to Fig. 4, gasoil conversion has increased in FCCU-MW due to the existence of the microwave energy heat source. It can be seen that the gas oil conversion is equal in the first few meters of the riser for both methods; however the gas oil conversion value rises relatively in the case of FCCU-MW after a specific height. The higher conversion value in FCCU-MW after the first few meters is due to lower temperature drop relative to conventional FCCU.
Fig. 3 Components profiles along the riser height (FCCU, CTO=3, time=5sec.)
Fig. 4 Temperature and gas oil conversion profile along the riser height, compare the FCCU and FCCU-MW. (CTO=5, time=5sec, Tin=860 K)
As illustrated in Fig. 5, using microwave energy in the riser reactor will cause the increase of the gasoline mole fraction based on activation energies. According to Table 2, in gas oil reactions gasoline activation energy has a higher value than other products. In FCCU-MW the lower temperature drop helps the progression of those endothermic reactions with higher activation energy. On the other hand, compared to conventional FCCU, gas oil conversion in FCCU-MW is increased due to the existence of more activated catalyst. In other words, more portion of the feed is converted to desirable products. Fig. 6-a shows the gas oil conversion versus riser height for FCCU-MW case in various input feed temperatures. The temperature effect is most obvious at the end of the riser, so Fig. 6-b gives more useful comparisons. Rising input temperature can be affected by different frequencies of microwave on the riser height. According to Fig. 6-b, the increase of the input temperature can lead to the increase of the gasoil conversion. The variation of gas oil conversion is negligible between the 860K

and 900k curves, but the temperature can affect the production of gasoline dramatically. The effects of input temperature on gasoline yield are shown in Figs. 7-a and 7-b.
Figure 5 Gasoline mole fraction along the riser height, compare the FCCU and FCCU-MW.
(CTO=5, time=5sec, Tin=860 K)
Fig. 6a Gas oil conversion profile along the riser reactor height at the various feed input temperatures. (FCCU-MW, CTO=3, time=5sec.)
Fig. 6b Gas oil conversion profile along the riser reactor height at the various feed input temperatures, zoom in Fig. 6-a. (FCCU-MW, CTO=3, time=5sec.)
Fig. 7a Gasoline mole fraction along the riser reactor height at the various feed input temperatures. (FCCU-MW, CTO=3, time=5sec.)
Fig. 7b Gasoline mole fraction along the riser reactor height at the various feed input temperatures, zoom in Fig. 7-a. (FCCU-MW, CTO=3, time=5sec.)

As indicated in Fig. 7-b, the input temperature of 900K increases the gasoline yield compared to the 860K temperature significantly. This increase in gasoline yield is due to the relation between the reaction temperature and activation energy of components that have been presented. Increasing the input temperature can help gasoline yield at the expense of operational costs. Fig. 8 shows that the pressure decrease in the riser is almost linear along its height. According to Fig. 9, gas oil conversion changes almost linearly with output temperature. Generally, this indicates that the increase in the riser temperature leads to the increase of gasoline yield, but eventually choosing the optimum feed temperature can be also based on operational costs and desired product purity.
Fig. 8 Pressure history along the riser reactor Fig. 9 Gas oil conversion as a function of riser outlet temperature.
4. Conclusions
A one dimensional adiabatic and dynamic simulation has been developed in two different conditions for FCCU with gas oil feed by mathematical modeling. Simulation results indicate a satisfactory compliance with current references. Using microwave energy as a heat source increases the gas oil conversion, gasoline purity and therefore, unit yield. In addition, microwave energy as a good heat source, can lead to the decrease of regenerator load. Furthermore, the effects of feed temperature on gasoline yield with FCCU-MW results show that the increase of input temperature can help gas oil conversion and gasoline yield significantly. But, choosing the best feed temperature should be based on the solution of the optimization problem that takes into account the operational costs and product scale. The microwave energy was shown to be effective in gasoline yield using catalytic cracking. However, because of the initial setup expenses it is not used commercially at present. We hope that industries apply this technology to improve their production in the near future.
Nomenclature
a, b Dimensions of the waveguide (m) Co Velocity of light in vacuum (m.s-1) Cpcat Heat capacity of catalyst (kJ.kg-1.K-1) Cpds Heat capacity of dispersion steam (kJ.kg-1.K-1) Cpi Heat capacity of ith component (kJ.kg-1.K-1) Cpgo
l, Cpgov Heat capacity of gas oil in liquid and vapor phase, respectively (kj.kg-1.k-1)
Cpmix Heat capacity of gas-solid mixture (kJ.kg-1.K-1) CTO Catalyst to oil ratio (kgcat.kgoil
-1) di Specific gravity of hydrocarbon Di,m Diffusivity of ith component into mixture (m.s-2) Di,j Diffusivity of ith component into jth component (m.s-2) Dmix Diffusivity of mixture (m.s-2) dp Depth of adsorption (m) E Activation energy f Frequency of electromagnetic radiation (Hz) Fcat Catalyst mass flow (kg.s-1)

Fds Dispersed steam mass flow (kg.s-1) Fgo
l, Fgov Gas oil mass flow in liquid and vapor phase, respectively (kg.s-1)
Fr Froude number Frt Froude number on terminal velocity f(KT/εij) Collision function g Gravity (m.s-2) Gs Solid mass flux (kg.m-2.s-1) ΔHi Heat of reaction for ith component (kJ.kg-1) ΔHgo
vap Heat of vaporization for gas oil component (kJ.kg-1) Ki Thermal conductivity of ith component (W.m-1.k-1) Kmix Thermal conductivity of mixture (W.m-1.k-1) k1, k2, k3, k4, k5 Reaction rate constants (m6kmol-1kgcat
-1s-1) l Length of gas in eqn. 10 (m) M Molecular weight of mixture (mol.kg-1) Mi Molecular weight of ith component (mol.kg-1) Ni ith Component mass flux (kg.m-2.s-1) P Total pressure (Pa) Q Volumetric heat generation term in eqn. 8 (W.m-3) Q΄΄΄ Volumetric heat received to gas-solid mixture in eqn. 1 (W.m-3) R Universal gas constant (J.mol-1.k-1) ri Rate of reaction for ith component (m6kmol-1kgcat
-1s-1) ri,j Molecular separation at collision (nm) T Temperature (k) Tcat Catalyst temperature at riser entrance (K) t Time (s) tc Residence time of catalyst (s) Tds Dispersed steam temperature at riser entrance (K) Tvap Vapor phase temperature at riser entrance (K) Tgo Gas oil temperature at riser entrance (K) u Velocity (m.s-1) up Particle velocity (m.s-1) uo Riser superficial velocity (m.s-1) yi ith Component mole fraction z axial coordinate (m)
Greek Letters
α Decay coefficient of catalyst μg Gas viscosity (Pa.s-1) ε΄ Dielectric constant ρcat Catalyst density (kg.m-3) ε΄΄ Dielectric loss factor ρs Dispersed steam density (kg.m-3) εbed Bed porosity ρmix Mixture density (kg.m-3) ζ(i/j) Overall fractional yield υ� Slip factor ξ(i/j) Instantaneous fractional yield
Subscripts
bed Bed go Gas oil cat Catalyst mix Mixture ck Coke lg Light gas ds Dispersed steam p Particle gl Gasoline s Solid
Superscripts
l Liquid phase v Vapor phase vap Vaporization

References
[1] Akkari E, Chevallier S, Boillereaux L. (2005). A 2D Non-linear "grey-box" Model Dedicated to Microwave Thawing: Theoretical and Experimental Investigation. Comput. & Chem. Eng., 30, 321-328.
[2] Baudrez E, Heyndrickx G, Martin Guy B. (2010). Steady-State Simulation of Fluid Catalytic Creaking Riser Reactors Using a Decoupled Solution Method With Feedback of the Cracking on Flow. Chem. Eng. Res. Des., 88, 290-303.
[3] Curet S, Rouaud O, Boillereaux L. (2006). Heat Transfer Models for Microwave Thawing Applications. Excerpt from the Proceedings of the COMSOL Users Conference, Paris.
[4] Derouin C, Nevicato D, Forissier M, Wild G, Bernard J R. (1997). Hydrodynamics of Riser Units and Their Impact on FCC Operation. Ind. and Eng. Chem. Res., 36, 4504-4515.
[5] Fanson P T, Hirata H, Ibe M, Suib S L, Chan Son Y. (2006). Process Using Microwave Energy and Catalyst to Crack Hydrocarbons. U. S. Patent, No. 0251557 A1.
[6] Fernandes J L, Pinheiro C I C, Oliveira N, Ramôa Ribeiro F. (2005). Modeling and Simulation of an Operating Industrial Fluidized Catalytic Cracking Riser. 2nd Mercosur Congress on Chemical Engineering.
[7] Formerly ASI Instruments URL: <http://www.asiinstr.com/technical/Dielectri>. [8] Gupta R S. Modeling and Simulation of Fluid Catalytic Cracking Unit. A Ph. D. Thesis,
Deemed University Patiala, India, (2008). [9] Han I-S, Riggs James B, Chung C-B. (2004). Modeling and Optimization of Fluidized
Catalytic Cracking Process Under Full and Partial Combustion Model. Chem. Eng. Process, 43, 1063-10845.
[10] Heydari A, Rohani S. (1997). Dynamic Modeling and Simulation of Riser-Type Fluid Catalytic Cracking Unit. Chem.Eng.Tech., 20, 118-130.
[11] Kirkbride. (1979). Process for Regenerating Spent Cracking Catalyst. U. S. Patent, No. 4,144,189.
[12] Kirkbride. (1981). Use of Microwave in Petroleum Refinery Operations. U. S. Patent, No. 4,279,722.
[13] Levenspiel Octave. Chemical Reaction Engineering. 3rd ed. John Wiley & Sons, (1999).
[14] Lopes G C, Rosa L M, Mori M, Nunhez J R, Martignani W P. Three-Dimensional Modeling of Fluid Catalytic Cracking Industrial Riser Flow and Reaction. doi: 10.1016/j.compchemeng; (2010).12.014.
[15] Mehran H, Habib A, Bahram D. (2010). Modeling of an Industrial Riser in the Fluid Catalytic Cracking Unit. American J. of Applied Sci., 7 (2), 221-226.
[16] Patience G S, Chaouki J, Berruti F, Wong S R. (1992). Scaling Considerations for Circulating Fluidized Bed Risers. Powder Technol., 72, 31-39.
[17] Quraishi S L. (2010). Microwave Spent Catalyst Decoking Method. U. S. Patent, No. 7,745,366 B2.
[18] Sharivker V, Honycatt T. (2004). Process for the Desulfurization and Upgrading Fuel Oil. U. S. Patent, No. 6,797,127 B2.
[19] Sousa J A, Vargas J V C, von Meine O F, Martignini W P. (2007). Modeling and Simulation of Industrial FCC Unit Riser. Thermal Engineering, 6, 19-25.
[20] Speight J G. The Chemistry and Technology of Petroleum. 4th ed. Taylor & Francis Group, (2007).
[21] Treybal Robert E. Mass Transfer Operations. 3rd ed. McGRAW- Hill, (1981). [22] Weekman. (1979). Lumps, Models and Kinetics in practice. AIChE Monograph series,
11 (75), 250-259. i To whom correspondence should be addressed. E-mail: [email protected], The N.S.F. Part Shimi Co., Postcode: 71 696 63455, Fax: +98 3125245550.