Patterns of population genetic structure for springtails and mites in southern Victoria Land,...
13
Patterns of population genetic structure for springtails and mites in southern Victoria Land, Antarctica Angela McGaughran a,b, * , Ian D. Hogg a , Mark I. Stevens b,c a Centre for Biodiversity and Ecology Research, University of Waikato, Private Bag 3105, Hamilton, New Zealand b Allan Wilson Centre for Molecular Ecology & Evolution, Massey University, Private Bag 11-222, Palmerston North, New Zealand c School of Biological Sciences, Monash University, Clayton 3800, Vic., Australia Received 25 May 2007; revised 21 September 2007; accepted 5 October 2007 Available online 23 October 2007 Abstract We sequenced the mitochondrial (mt) DNA cytochrome c oxidase subunit I gene to examine comparative phylogeographic patterns for the springtail Gomphiocephalus hodgsoni and the mite Stereotydeus mollis throughout their ranges in southern Victoria Land, Ant- arctica. Our aim was to extend previous genetic work to encompass a large ice-free area in the Dry Valleys. In particular, we sought to determine if this new region harboured high levels of genetic diversity and if patterns of genetic structure were congruent across taxa. Phylogenetic and nested clade analyses for G. hodgsoni and S. mollis showed similar patterns of population sub-structuring among loca- tions and highlighted several potential refugia that may have existed during glacial maxima. We identified greater levels of genetic diver- gence in S. mollis and suggest that there is a nucleotide substitution (mutation) rate difference between S. mollis and G. hodgsoni, and/or that S. mollis has had a longer association with the Antarctic landscape. Ó 2007 Elsevier Inc. All rights reserved. Keywords: Glacial refugia; Mitochondrial DNA; Stereotydeus mollis; Gomphiocephalus hodgsoni; Phylogeography 1. Introduction There are several processes that may influence contem- porary patterns of population genetic structure (e.g. gene flow, genetic drift, fragmentation). In particular, repeated glacial cycles are likely to have had a marked influence on contemporary species’ ranges and population sizes through their effect on habitat and/or refugial availability (e.g. Knowles, 2001; Rowe et al., 2004). Such effects are likely to be particularly strong in Antarctica, where the local fauna has been exposed to a climate of increasing severity (including more than ten glacial cycles over the last million years (Hays et al., 1976)) since its isolation in the southern ocean following the break-up of Gondwana. The continent has been covered in a permanent ice sheet for 34 My, and the variable extent of this sheet over time has likely resulted in repeated shifts of species distributions in both the land and marine realms of the Antarctic (Rog- ers, 2006). It is well documented that several Antarctic locations have remained ice-free throughout the Last Glacial Maxi- mum (e.g. coastal areas, Burgess et al., 1994; Gore et al., 2001; Hodgson et al., 2001; lakes, Cromer et al., 2006). In addition, continental regions including Dronning Maud Land (Marshall and Pugh, 1996), the Prince Charles Mountains (Fink et al., 2000), the Antarctic Peninsula (Pugh and Convey, 2000), southern Victoria Land (Stevens and Hogg, 2003, 2006) and the Ellsworth Mountains (Con- vey and McInnes, 2005) have had ice-free areas for millions of years which are likely to have enabled long-term survival of terrestrial taxa in refugia (Cromer et al., 2006; Convey 1055-7903/$ - see front matter Ó 2007 Elsevier Inc. All rights reserved. doi:10.1016/j.ympev.2007.10.003 * Corresponding author. Address: Allan Wilson Centre for Molecular Ecology & Evolution, Massey University, Private Bag 11-222, Palmerston North, New Zealand. Fax: +64 6 350 5626. E-mail address: [email protected] (A. McGaughran). www.elsevier.com/locate/ympev Available online at www.sciencedirect.com Molecular Phylogenetics and Evolution 46 (2008) 606–618
Transcript of Patterns of population genetic structure for springtails and mites in southern Victoria Land,...
Available online at www.sciencedirect.com
www.elsevier.com/locate/ympev
Molecular Phylogenetics and Evolution 46 (2008) 606–618
Patterns of population genetic structure for springtails and mitesin southern Victoria Land, Antarctica
Angela McGaughran a,b,*, Ian D. Hogg a, Mark I. Stevens b,c
a Centre for Biodiversity and Ecology Research, University of Waikato, Private Bag 3105, Hamilton, New Zealandb Allan Wilson Centre for Molecular Ecology & Evolution, Massey University, Private Bag 11-222, Palmerston North, New Zealand
c School of Biological Sciences, Monash University, Clayton 3800, Vic., Australia
Received 25 May 2007; revised 21 September 2007; accepted 5 October 2007Available online 23 October 2007
Abstract
We sequenced the mitochondrial (mt) DNA cytochrome c oxidase subunit I gene to examine comparative phylogeographic patternsfor the springtail Gomphiocephalus hodgsoni and the mite Stereotydeus mollis throughout their ranges in southern Victoria Land, Ant-arctica. Our aim was to extend previous genetic work to encompass a large ice-free area in the Dry Valleys. In particular, we sought todetermine if this new region harboured high levels of genetic diversity and if patterns of genetic structure were congruent across taxa.Phylogenetic and nested clade analyses for G. hodgsoni and S. mollis showed similar patterns of population sub-structuring among loca-tions and highlighted several potential refugia that may have existed during glacial maxima. We identified greater levels of genetic diver-gence in S. mollis and suggest that there is a nucleotide substitution (mutation) rate difference between S. mollis and G. hodgsoni, and/orthat S. mollis has had a longer association with the Antarctic landscape.� 2007 Elsevier Inc. All rights reserved.
Keywords: Glacial refugia; Mitochondrial DNA; Stereotydeus mollis; Gomphiocephalus hodgsoni; Phylogeography
1. Introduction
There are several processes that may influence contem-porary patterns of population genetic structure (e.g. geneflow, genetic drift, fragmentation). In particular, repeatedglacial cycles are likely to have had a marked influenceon contemporary species’ ranges and population sizesthrough their effect on habitat and/or refugial availability(e.g. Knowles, 2001; Rowe et al., 2004). Such effects arelikely to be particularly strong in Antarctica, where thelocal fauna has been exposed to a climate of increasingseverity (including more than ten glacial cycles over the lastmillion years (Hays et al., 1976)) since its isolation in the
1055-7903/$ - see front matter � 2007 Elsevier Inc. All rights reserved.
doi:10.1016/j.ympev.2007.10.003
* Corresponding author. Address: Allan Wilson Centre for MolecularEcology & Evolution, Massey University, Private Bag 11-222, PalmerstonNorth, New Zealand. Fax: +64 6 350 5626.
E-mail address: [email protected] (A. McGaughran).
southern ocean following the break-up of Gondwana.The continent has been covered in a permanent ice sheetfor �34 My, and the variable extent of this sheet over timehas likely resulted in repeated shifts of species distributionsin both the land and marine realms of the Antarctic (Rog-ers, 2006).
It is well documented that several Antarctic locationshave remained ice-free throughout the Last Glacial Maxi-mum (e.g. coastal areas, Burgess et al., 1994; Gore et al.,2001; Hodgson et al., 2001; lakes, Cromer et al., 2006).In addition, continental regions including Dronning MaudLand (Marshall and Pugh, 1996), the Prince CharlesMountains (Fink et al., 2000), the Antarctic Peninsula(Pugh and Convey, 2000), southern Victoria Land (Stevensand Hogg, 2003, 2006) and the Ellsworth Mountains (Con-vey and McInnes, 2005) have had ice-free areas for millionsof years which are likely to have enabled long-term survivalof terrestrial taxa in refugia (Cromer et al., 2006; Convey
A. McGaughran et al. / Molecular Phylogenetics and Evolution 46 (2008) 606–618 607
and Stevens, 2007). Consequently, refugia are likely to haveserved as centres for preservation of biodiversity in fluctu-ating environments (Garrick et al., 2007).
Populations that become restricted to refugia mayundergo divergence in isolation (e.g. through changes inpopulation size, founder events, genetic drift), especiallywhen numbers of individuals within sub-populations aresmall. Population differentiation and potentially speciationcan result (Vandergast et al., 2007), and founder eventsmay also increase genetic differences between populations(Rogers, 2006). In the Antarctic, high levels of geneticstructure have been found for several terrestrial taxa on rel-atively short spatial scales (e.g. Marshall and Coetzee,2000; Fanciulli et al., 2001; Frati et al., 2001; Stevens andHogg, 2003, 2006; Nolan et al., 2006). In particular, Ste-vens and Hogg (2003) found 14 mtDNA (COI) haplotypesfrom 45 springtail (Gomphiocephalus hodgsoni) individualsfrom throughout southern Victoria Land in a pattern con-sistent with divergence of allopatric populations located inrefugia. Across the same region, 18 haplotypes were identi-fied from 32 mite (Stereotydeus mollis) individuals (Stevensand Hogg, 2006). In northern Victoria Land, Stevens et al.(2007), found 26 mtDNA (COII) haplotypes (of which onlya single haplotype was found in more than one population)from 69 individuals for the springtail Desoria klovstadi,while Fanciulli et al. (2001) also showed a pattern of highgenetic differentiation for the springtail Gressittacantha ter-
ranova. Notably, the genetic analysis of G. terranova
showed three genetically distinct groups, with very little
ASGARD RANGE
OLYMPUSRANGE
ST JOHNS RANGE
W1W2
W3W4
W5
W6
V1 V2V3V4
V5
V6V7
V8V9
V10
V11V12
V13
162o163o
TV1
TV2
TV3TV4
TV6TV8 TV14
TV16
TV19
TV28
TV30
TV37
TV15 TV
31TV38
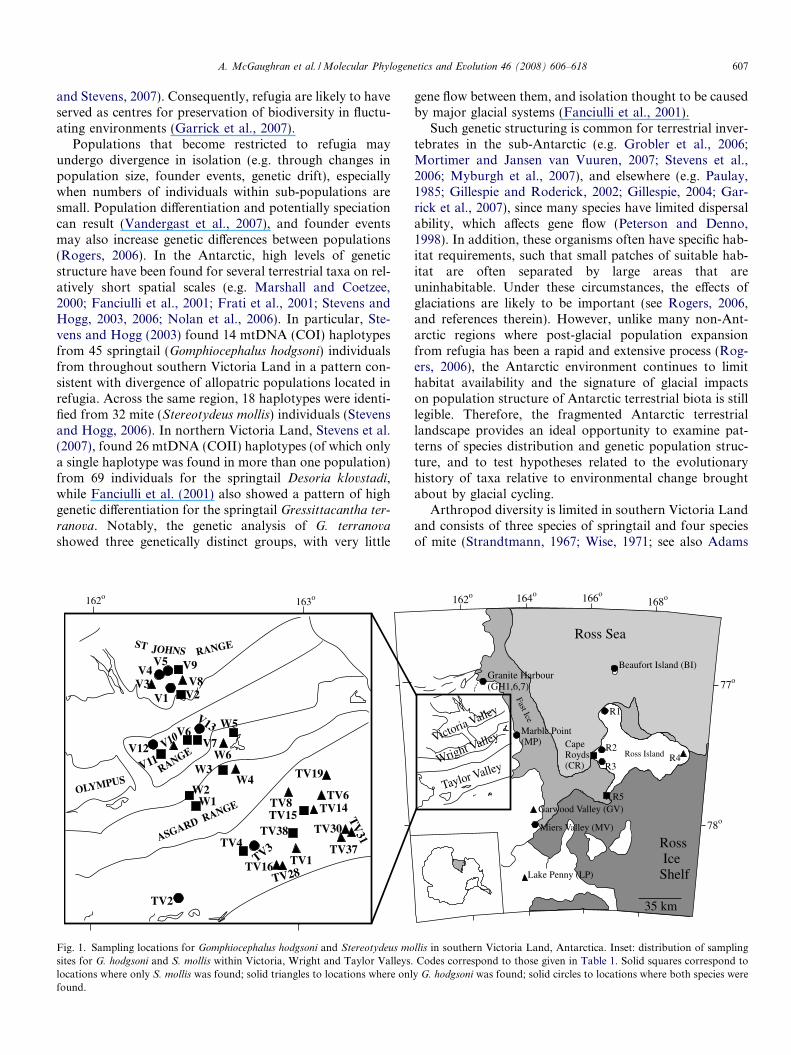
Fig. 1. Sampling locations for Gomphiocephalus hodgsoni and Stereotydeus mo
sites for G. hodgsoni and S. mollis within Victoria, Wright and Taylor Valleys.locations where only S. mollis was found; solid triangles to locations where onlfound.
gene flow between them, and isolation thought to be causedby major glacial systems (Fanciulli et al., 2001).
Such genetic structuring is common for terrestrial inver-tebrates in the sub-Antarctic (e.g. Grobler et al., 2006;Mortimer and Jansen van Vuuren, 2007; Stevens et al.,2006; Myburgh et al., 2007), and elsewhere (e.g. Paulay,1985; Gillespie and Roderick, 2002; Gillespie, 2004; Gar-rick et al., 2007), since many species have limited dispersalability, which affects gene flow (Peterson and Denno,1998). In addition, these organisms often have specific hab-itat requirements, such that small patches of suitable hab-itat are often separated by large areas that areuninhabitable. Under these circumstances, the effects ofglaciations are likely to be important (see Rogers, 2006,and references therein). However, unlike many non-Ant-arctic regions where post-glacial population expansionfrom refugia has been a rapid and extensive process (Rog-ers, 2006), the Antarctic environment continues to limithabitat availability and the signature of glacial impactson population structure of Antarctic terrestrial biota is stilllegible. Therefore, the fragmented Antarctic terrestriallandscape provides an ideal opportunity to examine pat-terns of species distribution and genetic population struc-ture, and to test hypotheses related to the evolutionaryhistory of taxa relative to environmental change broughtabout by glacial cycling.
Arthropod diversity is limited in southern Victoria Landand consists of three species of springtail and four speciesof mite (Strandtmann, 1967; Wise, 1971; see also Adams
Ross Sea
RossIceShelf
Miers Valley (MV)
Beaufort Island (BI)
162o
78o
164o 166o168o
77o
CapeRoyds(CR)
Marble Point(MP)
Garwood Valley (GV)
Granite Harbour(GH1,6,7)
Lake Penny (LP)
35 km
R1
R2
R3R4
R5Taylor Valley
Victoria Valley
Wright ValleyRoss Island
Fast Ice
llis in southern Victoria Land, Antarctica. Inset: distribution of samplingCodes correspond to those given in Table 1. Solid squares correspond to
y G. hodgsoni was found; solid circles to locations where both species were
608 A. McGaughran et al. / Molecular Phylogenetics and Evolution 46 (2008) 606–618
et al., 2006; Sinclair and Stevens, 2006). We selected Gom-
phiocephalus hodgsoni Carpenter, 1908 (Collembola: Hypo-gastruridae) and Stereotydeus mollis Womersley andStrandtmann, 1963 (Acari: Penthalodidae) for a compara-tive study because they are the most numerically dominantand widespread of the seven species, are endemic, and areoften found together across their distributional ranges.Such comparative approaches are particularly useful forphylogeographic studies as they may help to identify com-mon factors that have influenced population genetic struc-ture (e.g. Bohonak, 1999).
This study extends earlier work on G. hodgsoni and S.
mollis from southern Victoria Land (Stevens and Hogg,2003, 2006; Nolan et al., 2006), the sampling for whichomitted a large ice-free area in the McMurdo Dry Valleys.This unstudied area may be important from a genetic per-spective since it lies close to Taylor Valley, which has beensuggested as an important refugial location for extant pop-ulations in southern Victoria Land (Stevens and Hogg,2003, 2006). Here we targeted this extensive ice-free areato incorporate individuals from Wright and Victoria Val-leys (Fig. 1) into the existing dataset. Phylogenetic and phy-logeographic analyses were used to identify patterns ofhaplotype diversity and distribution, and to test thehypothesis that these valleys would harbour high levels ofgenetic diversity and thus form part of a greater Dry Valleyrefugium during glacial maxima. We predicted that geneticlinkages (represented by haplotype sharing) would existbetween Dry Valley and geographically distant popula-tions, with additional unique haplotypes at distinct loca-tions resulting from divergence in isolation sincecolonisation. Furthermore, we tested the hypothesis thatboth taxa would display similar patterns of genetic struc-turing owing to a shared phylogeographic history.
2. Materials and methods
2.1. Study area and collection of taxa
The McMurdo Dry Valleys consist of some 4000 km2 ofhigh relief ice-free mountain polar desert topography and,with a mean annual temperature of �20 �C and a precipi-tation level of �80 mm water equivalent, the area isdescribed as a hyper-arid cold polar desert (Marchantand Denton, 1996). Taylor, Wright and Victoria Valleysmake up the largest ice-free area in the region and theseare separated by the Asgard and Olympus Ranges(Fig. 1). The mountains are higher further inland(>2000 m), and become progressively lower towardscoastal regions (Marchant and Denton, 1996).
Gomphiocephalus hodgsoni and S. mollis are generallyrestricted to areas of high soil moisture and/or access towater (e.g. lake edges, snow patch edges, moist streambeds) and were collected from the underside of stones usingan aspirator. Sampling targeted more than 40 sites acrossten geographic locations. During January 2004, Wrightand Victoria Valleys were sampled, and 16 sites contained
one or both species (4 for G. hodgsoni; 8 for S. mollis, 4 forboth species) (Fig. 1 and Table 1). Further samples from 28sites (16 for G. hodgsoni; 4 for S. mollis; 8 for both species)and eight additional locations were included from previousstudies, thus extending the sample size to encompass thedistributional range for both species (Fig. 1). Upon collec-tion, G. hodgsoni and S. mollis specimens were stored in95% ethanol and identified using the original and/or rele-vant identification keys (e.g. Strandtmann, 1967; Wise,1971).
2.2. DNA extraction, amplification and sequencing
Total DNA was extracted from one to three specimensfrom each site (Table 1), following the DNeasy tissueextraction kit (Qiagen, Hilden, Germany). Upon extrac-tion, a fragment of the mitochondrial cytochrome c oxidase(COI) gene was amplified using the universal primersLCO1490 (50-ggt caa caa atc ata aag ata ttg ga-30) andHCO2198 (50-taa act tca ggg tga cca aaa aat ca-30) (Folmeret al., 1994) for G. hodgsoni, and COI-2R (50-ggr tar tcw gartaw cgt ncg wgg tat-30) and COI-2F (50-tty gay cci dyi ggrgga gga gat cc-30) for S. mollis (Otto and Wilson, 2001).Amplifications for each G. hodgsoni and S. mollis specimenused a 25 ll reaction volume containing 3 ll of theextracted DNA (unquantified), 1� PCR buffer (Roche,Penzberg, Germany) 2.2 mM MgCl2, 0.2 mM of eachdNTP (Boehringer-Mannheim, Mannheim, Germany),1.0 lM of each primer, and 0.5 U of Taq DNA polymerase(Roche). The thermal cycling conditions for G. hodgsoni
were: 94 �C for 1 min followed by five cycles of denatur-ation and polymerase amplification (94 �C for 1 min,45 �C for 1.5 min, 1 min at 72 �C followed by 35 cycles of94 �C for 1 min, 51 �C for 1.5 min and 1 min at 72 �C, fol-lowed by 5 min at 72 �C; and for S. mollis were: initialdenaturation at 94 �C for 1.5 min followed by 40 cyclesof denaturation and polymerase amplification (94 �C for20 s, 55 �C for 30 s and then 1.5 min at 72 �C), followedby 5 min at 68 �C.
All reaction products were purified using the QIAquickPCR Purification Kit (Qiagen) or using SAP/EXO (USBCorp., Cleveland, OH, USA). Sequencing used forwardand reverse primers, and was performed directly either ona MegaBACE DNA Analysis System (Amersham Biosci-ences, Buckinghamshire, England) at the University ofWaikato DNA sequencing facility, or on a capillaryABI3730 genetic analyser (Applied Biosystems Inc., FosterCity, CA) at the Allan Wilson Centre Genome Service,Massey University.
2.3. Phylogenetic analyses
Unique mtDNA sequences were lodged with GenBank(Accession Nos.: DQ305356–DQ305360 for G. hodgsoni
and DQ305361–DQ305367; DQ305369–DQ305384 for S.mollis). Previous samples already lodged with GenBankincluded AY294564–AY294566; AY294571–AY294573;

Table 1Sampling locations and site codes for Gomphiocephalus hodgsoni andStereotydeus mollis throughout southern Victoria Land, Antarctica
Location Lat (S) Long (E) Species Site
Wright Valley 77�30.520 162�10.130 S. mollis W177�31.090 162�11.260 S. mollis W277�27.500 162�33.380 S. mollis W377�26.440 162�42.520 G. hodgsoni W477�26.50’ 162�35.440 S. mollis W577�27.440 162�36.400 G. hodgsoni W6
Victoria Valley 77�19.310 161�53.540 Both species V177�21.430 162�06.060 S. mollis V277�19.310 161�52.170 G. hodgsoni V377�25.150 161�48.330 Both species V477�33.150 161�48.200 S. mollis V677�42.050 161�57.230 S. mollis V777�31.030 161�50.280 G. hodgsoni V877�31.050 161�50.460 S. mollis V977�41.550 161�57.200 Both species V1077�34.050 162�04.500 Both species V13
Taylor Valley 77�39.440 163�05.500 G. hodgsoni TV177�45.500 162�02.140 Both species TV277�38.340 162�46.300 Both species TV377�38.320 162�46.280 S. mollis TV477�36.450 163�24.080 G. hodgsoni TV677�34.080 163�09.210 G. hodgsoni TV877�38.290 163�17.410 G. hodgsoni TV1477�38.300 163�17.500 S. mollis TV1577�41.120 162�52.200 G. hodgsoni TV1677�33.050 163�20.280 G. hodgsoni TV1977�41.130 162�57.000 G. hodgsoni TV2877�36.260 163�30.030 G. hodgsoni TV3077�36.460 163�31.370 G. hodgsoni TV3177�37.160 163�29.210 G. hodgsoni TV3777�37.260 163�06.340 G. hodgsoni TV38
Garwood Valley 78�01.110 164�03.240 G. hodgsoni GVMiers Valley 78�05.460 163�45.320 Both species MV
Granite Harbour 77�00.520 162�36.050 G. hodgsoni GH177�01.520 162�30.050 G. hodgsoni GH677�02.180 162�28.110 S. mollis GH7
Marble Point 77�26.070 163�49.340 Both species MPLake Penny 78�18.360 163�24.280 G. hodgsoni LP
Ross Island 77�13.160 166�26.490 Both species R177�32.460 166�09.470 Both species R277�38.020 166�26.330 Both species R377�27.480 169�11.490 G. hodgsoni R477�51.100 166�40.480 S. mollis R5
Beaufort Island 76�55.540 166�54.490 Both species BI
A. McGaughran et al. / Molecular Phylogenetics and Evolution 46 (2008) 606–618 609
AY294575; AY294582–AY294585; AY294591;AY294603–AY294604 for G. hodgsoni (Stevens and Hogg,2003) and DQ305368; DQ305385–DQ305398 for S. mollis
(Stevens and Hogg, 2006). Individual sequences were veri-fied as being derived from the relevant taxa using the Gen-Bank BLAST algorithm, checked for open reading framesand then aligned using SEQUENCHER ver. 4.7 (GeneCodes Corp., Michigan) sequence editor. Data were thenanalysed using PAUP* ver. 4.0b10 (Swofford, 2002) andMrBayes ver. 3 (Ronquist and Huelsenbeck, 2003). Preli-minary phylogenetic analyses utilized several prostigmaticmite sequences (GenBank Accession Nos.: AF142132–
AF142143; Otto and Wilson, 2001) and hypogastruridspringtail sequences as outgroups (see also Stevens andHogg, 2006).
v2 tests as implemented in PAUP* were used to deter-mine whether the assumption of equal base frequenciesamong sequences was violated in three subsets of the data:all sites, parsimony-informative sites, and third codon posi-tions only. Modeltest ver. 3.7 (Posada and Crandall, 1998)was used to determine the appropriate substitution modelfor maximum likelihood (ML) heuristic searches (usingall unique sequences) with 500 bootstrap replicates. Themodel selected for G. hodgsoni was TrN+I and for S. mollis
was TrN+I+C (see Supplementary Information online fordetails); all other options in PAUP* remained as default.Maximum parsimony trees were also generated using thedefault settings in PAUP*. Bayesian phylogenetic analyses(MrBayes ver. 3.0b4) were used to perform a partitioned-likelihood Bayesian search (substitution model obtainedusing MrModeltest ver. 2.2 (Nylander, 2004)). Four incre-mentally heated Metropolis-coupled Markov chain MonteCarlo (MCMCMC) were each run for 10,000,000 genera-tions, sampling trees and parameters every 100 generations,with the first 100,000 generations discarded as burn-indetermined from plotting log-likelihood values against gen-eration time in TRACER 1.3 (Rambaut and Drummond,2007). The consensus (majority-rule) tree was obtainedfrom 180,000 trees sampled after the initial burn-in period,obtained with the sumt command using MrBayes, and vis-ualised using TreeView ver. 1.6.6 (Page, 1996). The Bayes-ian and MP trees displayed the same tree topologies as theML, thus ML trees (with Bayesian posterior probabilities)are presented. Distance matrices of pairwise nucleotidesequence divergence were calculated (uncorrected and cor-rected distances) using all unique sequences (see Appendi-ces; Supplementary Information online). Comparisons oflog-likelihood scores (using v2 tests) for ML trees withand without a molecular clock enforced (performed forspringtail and mite alignments using PAUP*) indicatedthat these sequences were evolving in a clocklike manner(P > 0.05, in both cases). Subsequently, we estimated ageamong lineages based on an arthropod strict molecularclock conservative calibration of 1.5–2.3% divergence permillion years derived from comparisons between geologicaland molecular data (Brower, 1994; Juan et al., 1996; Queket al., 2004).
2.4. Population structure analyses
ARLEQUIN ver. 3.01 (Excoffier et al., 2005) was usedto explore genetic characteristics and partitioning of nucle-otide diversity (presence of population structure) for G.
hodgsoni and S. mollis. We computed: haplotype (h) andnucleotide (p) diversity indices (Nei, 1987) separately foreach location; hierarchical analysis of molecular variance(AMOVA; Excoffier et al., 1992) to compare geographiclocations, with statistical significance of variance compo-nents tested with 16,000 permutations; pairwise differences
610 A. McGaughran et al. / Molecular Phylogenetics and Evolution 46 (2008) 606–618
(u-st values) between haplotypes using simple distances;and Tajima’s D (Tajima, 1989) and Fu’s Fs (Fu, 1997) totest for selective neutrality.
2.5. Nested clade analyses
For both G. hodgsoni and S. mollis, we estimated ahaplotype network using the algorithm of Templetonet al. (1992) in TCS ver. 1.21 (Clement et al., 2000).We used a connection limit of 95% for both species.For S. mollis the analysis was unable to connect allgroups when this connection limit was used, hence wealso performed an analysis where we allowed a maxi-mum number of mutational steps of 60, and used thisinformation only to suggest possible points where thedistinct groups may connect. Populations were specifiedby their GPS coordinates and sample sizes, and thendefined into a nested structure including outgroup prob-abilities (Castelloe and Templeton, 1994), following thenesting rules described in Crandall (1996). Finally, nestedgeographical distance analyses were performed usingGEODIS ver. 2.4 (Posada et al., 2000, 2002) to obtaina measure of how any one particular clade was distrib-uted geographically compared to its closest evolutionarysister clades. Clades with statistically significant valuesof Dc, Dn or I–T were assessed using Templeton’s2005 inference key (http://darwin.uvigo.es/software/geo-dis.html), allowing us to deduce which factor(s) (e.g.restricted gene flow, past fragmentation, range expan-sion), may have caused significant spatial associationamong haplotypes.
3. Results
3.1. mtDNA sequence variation
We used 471-bp (157 codons) of unambiguous align-ment (no insertions or deletions) from a total of 96 G.hodgsoni individuals and 504-bp (168 codons) of unambig-uous alignment from a total of 61 S. mollis individuals forall analyses. Nucleotide composition averaged over allsequences showed an A–T bias of 64.8% (A = 26.9%,T = 37.9%, C = 19.2%, G = 16.0%) for G. hodgsoni, and69.2% (A = 36.0%, T = 33.2%, C = 16.0%, G = 14.8%)for S. mollis. Base frequencies were not significantly heter-ogeneous among sequences for all sites, parsimony-infor-mative sites and third codon sites. There were 20variable (15 parsimony-informative) nucleotide substitu-tions for G. hodgsoni, and 103 variable (93 parsimony-informative) nucleotide substitutions for S. mollis (Appen-dix 2, Supplementary Information online). The nucleotidesubstitutions among haplotypes revealed low sequencedivergence among individuals of G. hodgsoni (up to2.1%, uncorrected p-distance), while divergence amongS. mollis individuals was considerably higher (up to14.5%, uncorrected p-distance) (Appendix 1, Supplemen-tary Information online).
3.2. Phylogenetic analyses
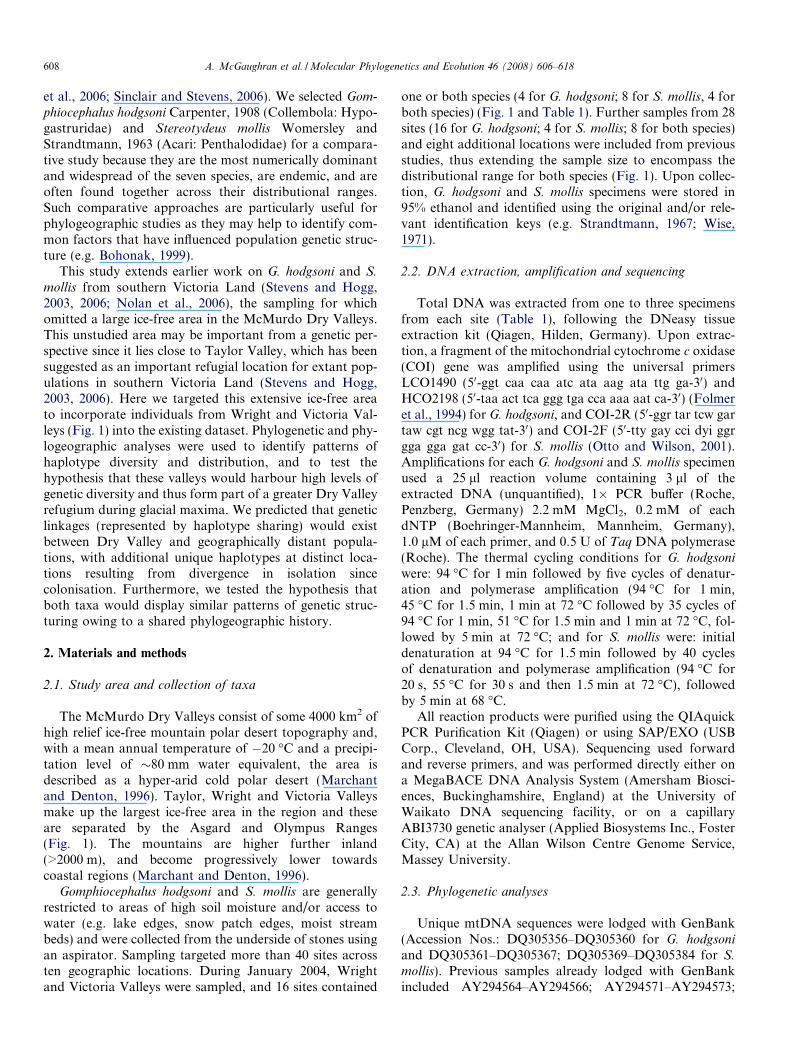
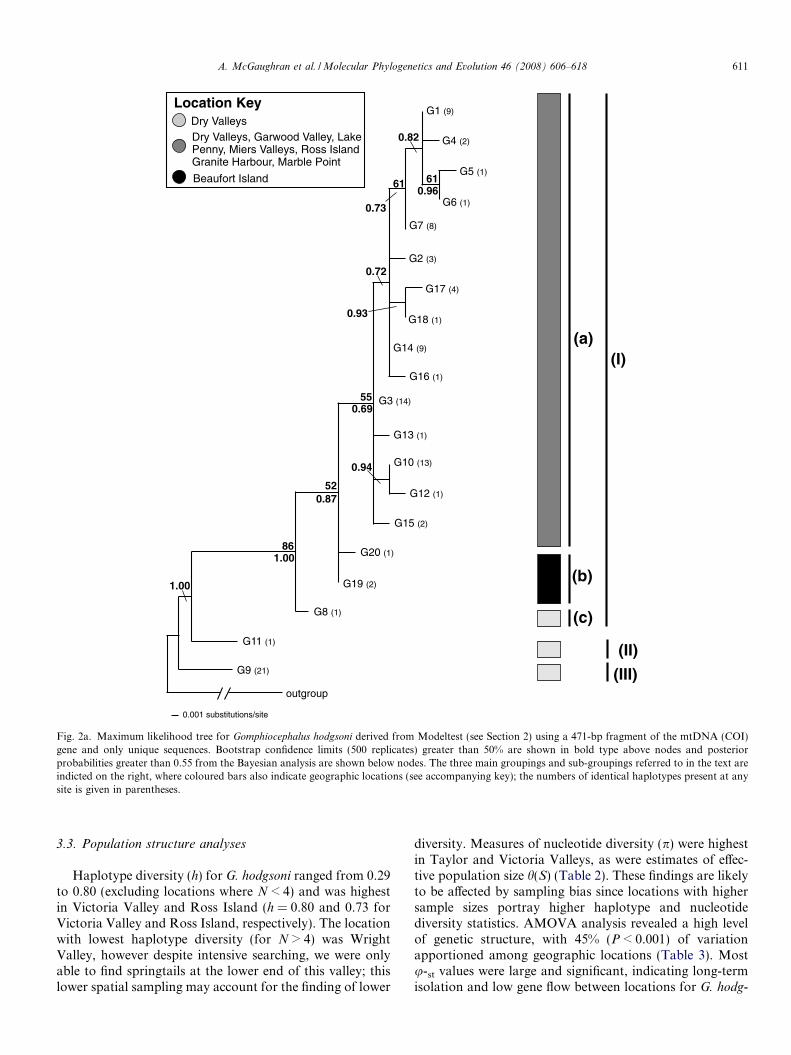
For G. hodgsoni there were 20 unique haplotypes rang-ing in sequence divergence from 0.2% to 2.1%. The ML treefor G. hodgsoni showed three main groups: (1) a disjunctmixture of haplotypes from individuals throughout south-ern Victoria Land; (2) one individual with haplotype G11from the Dry Valleys—1.9% divergent; (3) 21 individualswith haplotype G9 from the Dry Valleys—2.1% divergentfrom all other haplotypes. Within the former group, anadditional three sub-groups can be identified: (a) haplo-types from individuals from all locations except BeaufortIsland; (b) a Beaufort Island group (G19 and G20); and(c) G8 from the Dry Valleys (Fig. 2a).
Unique haplotypes were present at several locations:Victoria Valley (4), Taylor Valley (4), Beaufort Island(2), Ross Island (3), Lake Penny (1) and Garwood Valley(1) (Fig. 2a). Haplotype sharing was common, with 20haplotypes shared among 96 G. hodgsoni individuals andsix (or 30%) of the total haplotypes present in individualsfrom more than one location. For example, haplotype G7was present in Victoria Valley (V8), Granite Harbour(GH1, GH6) and Ross Island (R1), and haplotype G3was present in Victoria Valley (V1, V3, V8, V10), MiersValley (MV), Taylor Valley (TV1), and Lake Penny(LP) (Fig. 2a).
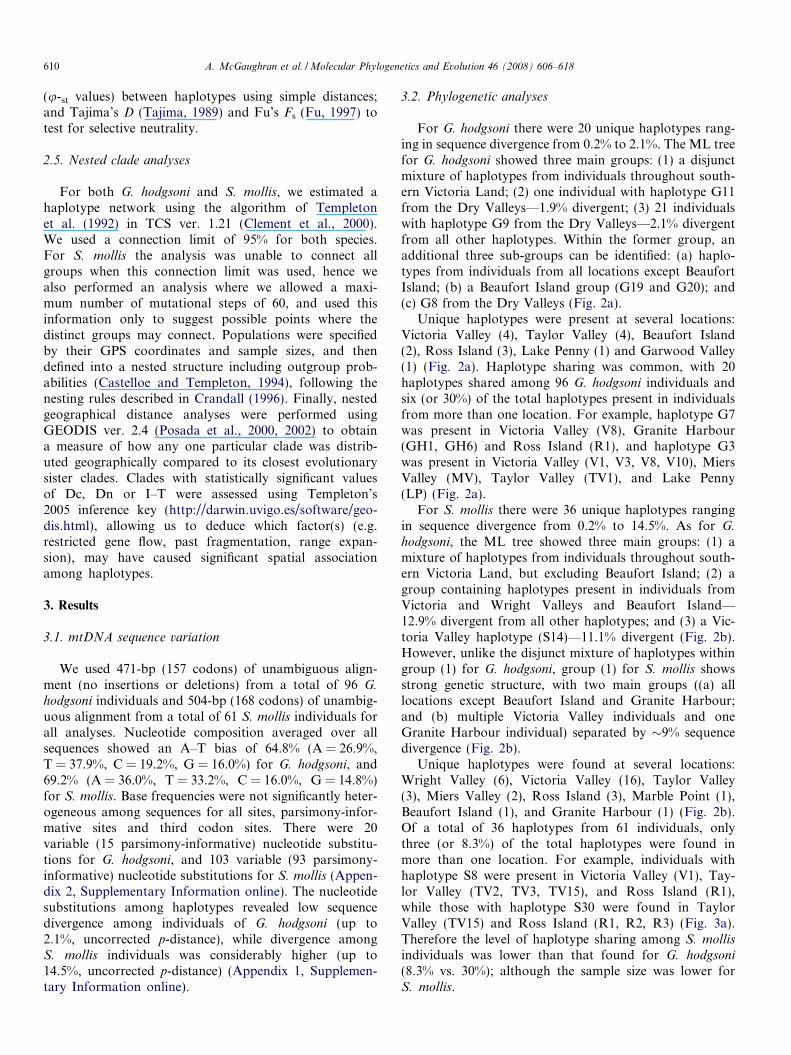
For S. mollis there were 36 unique haplotypes rangingin sequence divergence from 0.2% to 14.5%. As for G.
hodgsoni, the ML tree showed three main groups: (1) amixture of haplotypes from individuals throughout south-ern Victoria Land, but excluding Beaufort Island; (2) agroup containing haplotypes present in individuals fromVictoria and Wright Valleys and Beaufort Island—12.9% divergent from all other haplotypes; and (3) a Vic-toria Valley haplotype (S14)—11.1% divergent (Fig. 2b).However, unlike the disjunct mixture of haplotypes withingroup (1) for G. hodgsoni, group (1) for S. mollis showsstrong genetic structure, with two main groups ((a) alllocations except Beaufort Island and Granite Harbour;and (b) multiple Victoria Valley individuals and oneGranite Harbour individual) separated by �9% sequencedivergence (Fig. 2b).
Unique haplotypes were found at several locations:Wright Valley (6), Victoria Valley (16), Taylor Valley(3), Miers Valley (2), Ross Island (3), Marble Point (1),Beaufort Island (1), and Granite Harbour (1) (Fig. 2b).Of a total of 36 haplotypes from 61 individuals, onlythree (or 8.3%) of the total haplotypes were found inmore than one location. For example, individuals withhaplotype S8 were present in Victoria Valley (V1), Tay-lor Valley (TV2, TV3, TV15), and Ross Island (R1),while those with haplotype S30 were found in TaylorValley (TV15) and Ross Island (R1, R2, R3) (Fig. 3a).Therefore the level of haplotype sharing among S. mollisindividuals was lower than that found for G. hodgsoni
(8.3% vs. 30%); although the sample size was lower forS. mollis.
0.001 substitutions/site
61 61
55
52
86
G1 (9)
G2 (3)
G4 (2)
G5 (1)
G6 (1)
G7 (8)
G17 (4)
G18 (1)
G16 (1)
G14 (9)
G13 (1)
G3 (14)
G10 (13)
G12 (1)
G15 (2)
G20 (1)
G19 (2)
G11 (1)
G9 (21)
Location KeyDry ValleysDry Valleys, Garwood Valley, LakePenny, Miers Valleys, Ross IslandGranite Harbour, Marble Point
Beaufort Island
G8 (1)
(II)
(III)
(I)(a)
(b)
(c)
1.00
1.00
0.87
0.73
0.72
0.69
0.94
0.93
0.96
0.82
outgroup
Fig. 2a. Maximum likelihood tree for Gomphiocephalus hodgsoni derived from Modeltest (see Section 2) using a 471-bp fragment of the mtDNA (COI)gene and only unique sequences. Bootstrap confidence limits (500 replicates) greater than 50% are shown in bold type above nodes and posteriorprobabilities greater than 0.55 from the Bayesian analysis are shown below nodes. The three main groupings and sub-groupings referred to in the text areindicted on the right, where coloured bars also indicate geographic locations (see accompanying key); the numbers of identical haplotypes present at anysite is given in parentheses.
A. McGaughran et al. / Molecular Phylogenetics and Evolution 46 (2008) 606–618 611
3.3. Population structure analyses
Haplotype diversity (h) for G. hodgsoni ranged from 0.29to 0.80 (excluding locations where N < 4) and was highestin Victoria Valley and Ross Island (h = 0.80 and 0.73 forVictoria Valley and Ross Island, respectively). The locationwith lowest haplotype diversity (for N > 4) was WrightValley, however despite intensive searching, we were onlyable to find springtails at the lower end of this valley; thislower spatial sampling may account for the finding of lower
diversity. Measures of nucleotide diversity (p) were highestin Taylor and Victoria Valleys, as were estimates of effec-tive population size h(S) (Table 2). These findings are likelyto be affected by sampling bias since locations with highersample sizes portray higher haplotype and nucleotidediversity statistics. AMOVA analysis revealed a high levelof genetic structure, with 45% (P < 0.001) of variationapportioned among geographic locations (Table 3). Mostu-st values were large and significant, indicating long-termisolation and low gene flow between locations for G. hodg-

S1 (2)
S24 (1)
S4 (1)
S21 (1)
S35 (1)
S14 (1)
S2 (2)
S3 (1)
S16 (1)
S5 (1)
S7 (1)
S8 (6)
S9 (1)
S17 (1)
S11 (1)
S26 (3)
S28 (2)
S31 (1)
S38 (1)
S32 (1)
S37 (1)
S36 (1)
S27 (2)
S22 (1)
S20 (1)
S34 (1)
S30 (5)
S25 (1)
S10 (1)
S12 (1)
S13 (1)
S15 (1)
S23 (1)
S18 (1)
S33 (1)
S19 (1)
0.01 substitutions/site
(II)
(III)
(I)
(a)
(b)
100
64
75
66
58
76
53
85
Location Key
Dry Valleys
Granite Harbour
Dry Valleys, Marble Point,Miers Valley, Ross Island
Beaufort Island
1.00
1.00
1.00
1.00
0.99
0.61
0.83
0.79
0.60
0.57
0.75
0.70
0.84
0.58
0.79
1.00
outgroup
Fig. 2b. Maximum likelihood tree for Stereotydeus mollis derived from Modeltest (see Section 2) using a 504-bp fragment of the mitochondrial DNA(COI) gene and only unique sequences. Bootstrap confidence limits (500 replicates) greater than 50% are shown in bold type above nodes and posteriorprobabilities greater than 0.55 from the Bayesian analysis are shown below nodes. The three main groupings and two sub-groups referred to in the text areindicated on the right, where coloured bars also indicate geographic locations (see accompanying key); the numbers of identical haplotypes present at a siteis given in parentheses.
612 A. McGaughran et al. / Molecular Phylogenetics and Evolution 46 (2008) 606–618
G17(4)
G16
G181-1
1-2
1-3 1-41-10
1-9
1-8
1-7
1-61-52-1
2-2
2-5
2-4
2-3
G19 G20
G8
G11
G9(21)
G5 G6
G4 G2
G12
G3(14)
G10(13)
G1(9)
G7(8)
G13
G15
G14(9)
Location Key
Dry Valleys
Continental sites incl. Dry Valleys
Beaufort Island
Ross Island
Continental sites excl. Dry Valleys
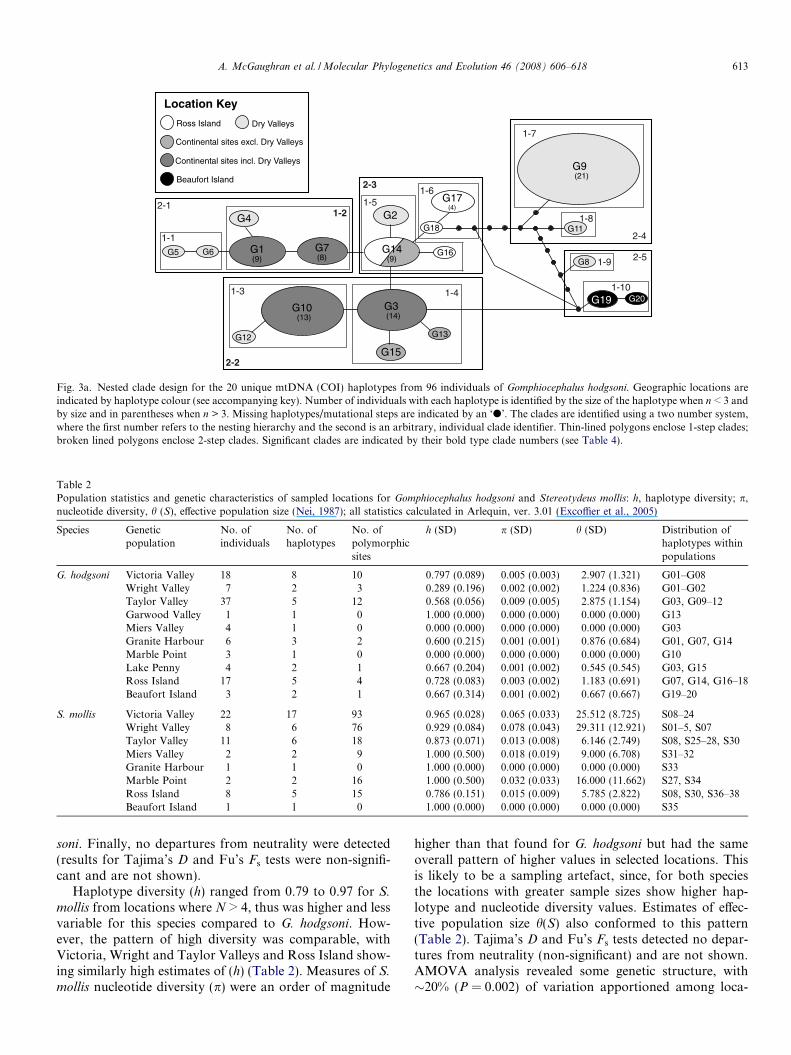
Fig. 3a. Nested clade design for the 20 unique mtDNA (COI) haplotypes from 96 individuals of Gomphiocephalus hodgsoni. Geographic locations areindicated by haplotype colour (see accompanying key). Number of individuals with each haplotype is identified by the size of the haplotype when n < 3 andby size and in parentheses when n > 3. Missing haplotypes/mutational steps are indicated by an ‘d’. The clades are identified using a two number system,where the first number refers to the nesting hierarchy and the second is an arbitrary, individual clade identifier. Thin-lined polygons enclose 1-step clades;broken lined polygons enclose 2-step clades. Significant clades are indicated by their bold type clade numbers (see Table 4).
Table 2Population statistics and genetic characteristics of sampled locations for Gomphiocephalus hodgsoni and Stereotydeus mollis: h, haplotype diversity; p,nucleotide diversity, h (S), effective population size (Nei, 1987); all statistics calculated in Arlequin, ver. 3.01 (Excoffier et al., 2005)
Species Geneticpopulation
No. ofindividuals
No. ofhaplotypes
No. ofpolymorphicsites
h (SD) p (SD) h (SD) Distribution ofhaplotypes withinpopulations
G. hodgsoni Victoria Valley 18 8 10 0.797 (0.089) 0.005 (0.003) 2.907 (1.321) G01–G08Wright Valley 7 2 3 0.289 (0.196) 0.002 (0.002) 1.224 (0.836) G01–G02Taylor Valley 37 5 12 0.568 (0.056) 0.009 (0.005) 2.875 (1.154) G03, G09–12Garwood Valley 1 1 0 1.000 (0.000) 0.000 (0.000) 0.000 (0.000) G13Miers Valley 4 1 0 0.000 (0.000) 0.000 (0.000) 0.000 (0.000) G03Granite Harbour 6 3 2 0.600 (0.215) 0.001 (0.001) 0.876 (0.684) G01, G07, G14Marble Point 3 1 0 0.000 (0.000) 0.000 (0.000) 0.000 (0.000) G10Lake Penny 4 2 1 0.667 (0.204) 0.001 (0.002) 0.545 (0.545) G03, G15Ross Island 17 5 4 0.728 (0.083) 0.003 (0.002) 1.183 (0.691) G07, G14, G16–18Beaufort Island 3 2 1 0.667 (0.314) 0.001 (0.002) 0.667 (0.667) G19–20
S. mollis Victoria Valley 22 17 93 0.965 (0.028) 0.065 (0.033) 25.512 (8.725) S08–24Wright Valley 8 6 76 0.929 (0.084) 0.078 (0.043) 29.311 (12.921) S01–5, S07Taylor Valley 11 6 18 0.873 (0.071) 0.013 (0.008) 6.146 (2.749) S08, S25–28, S30Miers Valley 2 2 9 1.000 (0.500) 0.018 (0.019) 9.000 (6.708) S31–32Granite Harbour 1 1 0 1.000 (0.000) 0.000 (0.000) 0.000 (0.000) S33Marble Point 2 2 16 1.000 (0.500) 0.032 (0.033) 16.000 (11.662) S27, S34Ross Island 8 5 15 0.786 (0.151) 0.015 (0.009) 5.785 (2.822) S08, S30, S36–38Beaufort Island 1 1 0 1.000 (0.000) 0.000 (0.000) 0.000 (0.000) S35
A. McGaughran et al. / Molecular Phylogenetics and Evolution 46 (2008) 606–618 613
soni. Finally, no departures from neutrality were detected(results for Tajima’s D and Fu’s Fs tests were non-signifi-cant and are not shown).
Haplotype diversity (h) ranged from 0.79 to 0.97 for S.
mollis from locations where N > 4, thus was higher and lessvariable for this species compared to G. hodgsoni. How-ever, the pattern of high diversity was comparable, withVictoria, Wright and Taylor Valleys and Ross Island show-ing similarly high estimates of (h) (Table 2). Measures of S.
mollis nucleotide diversity (p) were an order of magnitude
higher than that found for G. hodgsoni but had the sameoverall pattern of higher values in selected locations. Thisis likely to be a sampling artefact, since, for both speciesthe locations with greater sample sizes show higher hap-lotype and nucleotide diversity values. Estimates of effec-tive population size h(S) also conformed to this pattern(Table 2). Tajima’s D and Fu’s Fs tests detected no depar-tures from neutrality (non-significant) and are not shown.AMOVA analysis revealed some genetic structure, with�20% (P = 0.002) of variation apportioned among loca-

614 A. McGaughran et al. / Molecular Phylogenetics and Evolution 46 (2008) 606–618
tions (Table 3). A much greater proportion of variationwas partitioned within S. mollis locations (�80%) thanfor G. hodsgoni (�55%, Table 3), and this is consistent withthe low level of haplotype sharing found for this species.Fewer u-st values were large and significant for S. mollis
than for G. hodgsoni.
3.4. Nested clade analyses
The nested cladogram for the 20 unique G. hodgsoni
haplotypes (from 96 individuals) consisted of ten 1-stepclades and five 2-step clades, and the maximum numberof mutational steps between haplotypes was seven(Fig. 3a). Analysis of suitable clades with Templeton’sinference key inferred ‘‘allopatric fragmentation” for clades1-2 and 2-2 while ‘‘long distance colonisation possibly cou-pled with subsequent fragmentation or past fragmentationfollowed by range expansion” was the most likely explana-tion for the patterns observed at the total cladogram level(see Table 4).
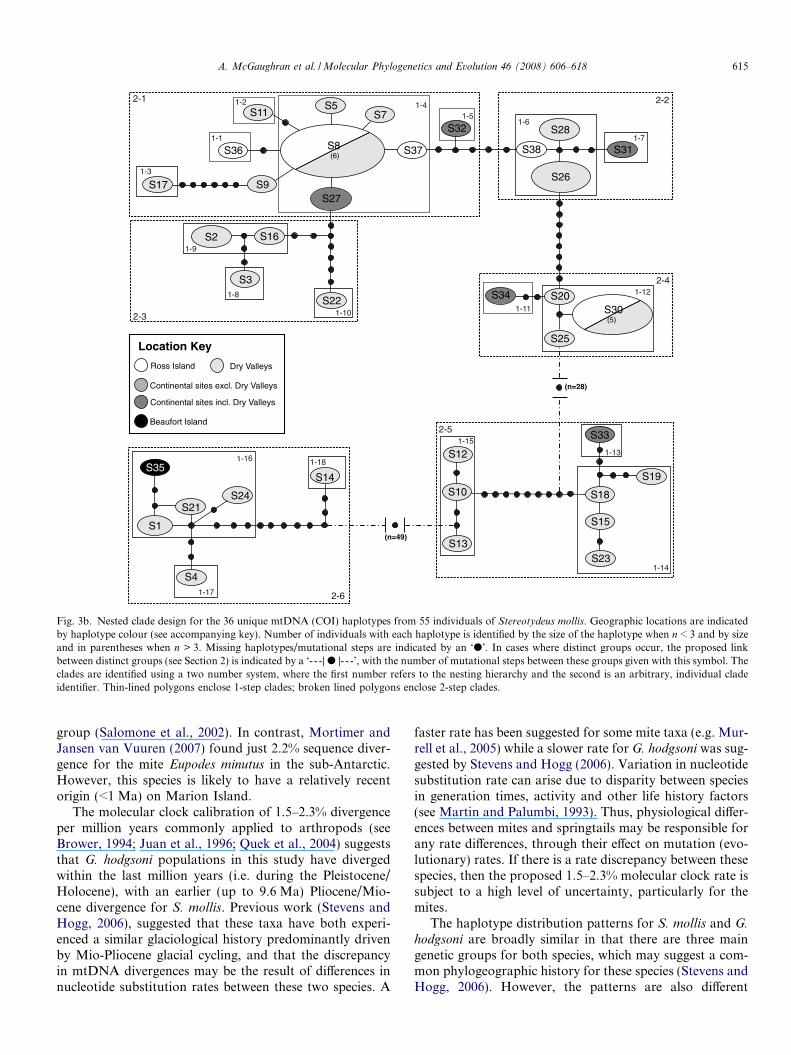
The nested cladogram for the 36 unique S. mollis hapl-otypes (from 61 individuals) consisted of eighteen 1-stepclades and six 2-step clades. The number of mutationalsteps between groups was high, thus we separated the clad-ogram into three distinct groups and proposed linkagesbetween groups based on a maximum number of 60 muta-tional steps between groups (Fig. 3b). Insight into pro-cesses shaping local population differentiation was gainedat the total cladogram level, where ‘‘restricted gene flowwith isolation by distance” was inferred (Table 4).
Table 3Analysis of molecular variance (AMOVA) (Excoffier et al., 1992) results foArlequin ver. 3.01 (Excoffier et al., 2005)
Species Source of variation df Sum of squares
G. hodgsoni Among locations 9 0.191Within locations 90 0.234Total 99 0.426Fixation Index FST: 0.450
S. mollis Among locations 7 0.399Within locations 47 1.097Total 54 1.496Fixation Index FST: 0.195
Statistical significance of variance components in AMOVA tested with 16,000
Table 4Clades with significant geographical structure (P < 0.05) and their biological(COI) data from Gomphiocephalus hodgsoni and Stereotydeus mollis
Species Clade v2-statistic P Ch
G. hodgsoni 1-2 33.514 <0.001 1-22-2 22.059 0.035 1-22-3 12.019 0.042 1-2Total cladogram 0.000 <0.001 1-2
S. mollis Total cladogram 139.193 0.014 1-2
Clades not showing genetic or geographic variation are excluded (no test is po
Nested cladograms for both taxa show a small numberof cases of unresolved relationships (e.g. for G. hodgsoni,between clades 2-2, 2-3 and 2-5; for S. mollis within clade1-16) (Figs. 2b and 3b). This can, in some cases, confoundattempts to reconstruct accurate evolutionary trees andinfer phylogenetic history (Xu, 2000; Posada et al., 2002).Consequently, any inferences made regarding these cladesneed to be interpreted with caution.
4. Discussion
The mtDNA (COI) gene was relatively homogeneousamong G. hodgsoni individuals, with only 20 variable nucle-otide sites across 471-bp. The most genetically distinct G.
hodgsoni lineages were closely related (up to 2.1% diver-gence). In contrast, 103 nucleotide sites were variable andlevels of divergence were much higher for S. mollis (up to14.5% for some individuals). Sequence divergence valuesfor G. hodgsoni were consistent with intraspecific diver-gences previously found for springtails (e.g. Soto-Adames,2002; Stevens and Hogg, 2003; Hogg and Hebert, 2004;Myburgh et al., 2007). However, sequence divergences formites are variable in the literature. Several authors havefound similarly high levels of purportedly intraspecificdivergence (e.g. Anderson and Trueman, 2000; Salomoneet al., 2002; Schaefer et al., 2005; Stevens and Hogg,2006). In particular, genetic divergence in the mite Stega-
nacarus carlosi was up to 7.8% for specimens from the samegeographic location, with values ranging from 16.8% to23.4% for populations from different islands of the Canary
r Gomphiocephalus hodgsoni and Stereotydeus mollis, as implemented in
Variance components Percentage of variation P
0.00213 Va 45.010.00260 Vb 54.99 <0.0010.00473
0.00567 Va 19.530.02335 Vb 80.47 0.0020.02901
permutations.
interpretation according to Templeton’s inference key (2005) for mtDNA
ain of inference Inference
-3-5-15-16-NO Allopatric fragmentation-3-4-9-10-YES Allopatric fragmentation-INCONCLUSIVE No tip/interior status-3-5-6-13-YES Long distance colonisation possibly coupled
with subsequent fragmentation OR pastfragmentation followed by range expansion
-3-4-NO Restricted gene flow with isolation by distance
ssible within such nested categories).
S37S36 S38
(n=28)
(n=49)
1-1
1-2
1-3
1-41-5
1-6
1-8
1-9
1-10 1-11
1-7
1-13
1-14
1-15
1-16
1-17
2-1 2-2
2-4
2-5
2-3
1-12
1-18
2-6
Location Key
Dry Valleys
Continental sites incl. Dry Valleys
Beaufort Island
Ross Island
Continental sites excl. Dry Valleys
S35
S34
S33
S31
S32 S28
S27
S26
S25
S24
S23
S22
S21
S20
S19
S18
S17
S16
S15
S14
S13
S12
S11
S10
S9
S7S5
S4
S3
S2
S1
S8(6)
S30(5)
Fig. 3b. Nested clade design for the 36 unique mtDNA (COI) haplotypes from 55 individuals of Stereotydeus mollis. Geographic locations are indicatedby haplotype colour (see accompanying key). Number of individuals with each haplotype is identified by the size of the haplotype when n < 3 and by sizeand in parentheses when n > 3. Missing haplotypes/mutational steps are indicated by an ‘d’. In cases where distinct groups occur, the proposed linkbetween distinct groups (see Section 2) is indicated by a ‘- - -| d |- - -’, with the number of mutational steps between these groups given with this symbol. Theclades are identified using a two number system, where the first number refers to the nesting hierarchy and the second is an arbitrary, individual cladeidentifier. Thin-lined polygons enclose 1-step clades; broken lined polygons enclose 2-step clades.
A. McGaughran et al. / Molecular Phylogenetics and Evolution 46 (2008) 606–618 615
group (Salomone et al., 2002). In contrast, Mortimer andJansen van Vuuren (2007) found just 2.2% sequence diver-gence for the mite Eupodes minutus in the sub-Antarctic.However, this species is likely to have a relatively recentorigin (<1 Ma) on Marion Island.
The molecular clock calibration of 1.5–2.3% divergenceper million years commonly applied to arthropods (seeBrower, 1994; Juan et al., 1996; Quek et al., 2004) suggeststhat G. hodgsoni populations in this study have divergedwithin the last million years (i.e. during the Pleistocene/Holocene), with an earlier (up to 9.6 Ma) Pliocene/Mio-cene divergence for S. mollis. Previous work (Stevens andHogg, 2006), suggested that these taxa have both experi-enced a similar glaciological history predominantly drivenby Mio-Pliocene glacial cycling, and that the discrepancyin mtDNA divergences may be the result of differences innucleotide substitution rates between these two species. A
faster rate has been suggested for some mite taxa (e.g. Mur-rell et al., 2005) while a slower rate for G. hodgsoni was sug-gested by Stevens and Hogg (2006). Variation in nucleotidesubstitution rate can arise due to disparity between speciesin generation times, activity and other life history factors(see Martin and Palumbi, 1993). Thus, physiological differ-ences between mites and springtails may be responsible forany rate differences, through their effect on mutation (evo-lutionary) rates. If there is a rate discrepancy between thesespecies, then the proposed 1.5–2.3% molecular clock rate issubject to a high level of uncertainty, particularly for themites.
The haplotype distribution patterns for S. mollis and G.
hodgsoni are broadly similar in that there are three maingenetic groups for both species, which may suggest a com-mon phylogeographic history for these species (Stevens andHogg, 2006). However, the patterns are also different
616 A. McGaughran et al. / Molecular Phylogenetics and Evolution 46 (2008) 606–618
enough to indicate that other explanations may be equallyappropriate. For example, S. mollis shows greater geneticstructure at the sub-group level than that found in G. hodg-
soni. Consistent with this, is the pattern of greater haplo-type sharing among locations in G. hodgsoni than in S.
mollis (50% and 22% and 30% and 8.3%, for G. hodgsoniand S. mollis for Stevens and Hogg (2006), and the presentstudy, respectively). While Stevens and Hogg (2006), foundsimilar numbers of haplotypes for these species (14 for G.
hodgsoni, 18 for S. mollis), here we found a much highernumber for S. mollis (36), than for G. hodsoni (20), despitea smaller sample size for S. mollis. Finally, the nested cladeand AMOVA analyses performed here provide additionalsupport for greater genetic structure in S. mollis. Com-bined, these factors suggest that S. mollis populationsmay have had a longer period of isolation (e.g. in refugia)and are more genetically differentiated as a result.
If S. mollis has been associated with the Antarctic land-scape for a longer period, then G. hodgsoni could be eithera more recent arrival or the victim of a more recent andsevere bottleneck. Certainly, the greater desiccation resis-tance and better dispersal ability of S. mollis (Sinclairand Sjursen, 2001; Sjursen and Sinclair, 2002) may meanthat this species has a greater capacity to respond to envi-ronmental disturbance and recover more rapidly from abottleneck event. Greater dispersal capacity and earlieraccess to habitats would presumably enable longer periodsin isolation (e.g. during glacial maxima), and potentiallyallow speciation to occur. A long isolated evolutionary his-tory is thought to indicate an ancient origin for the mite S.carlosi, which also exhibits surprisingly high divergencesbetween populations (Salomone et al., 2002) and Cromeret al. (2006) suggested that a series of temporally overlap-ping refugia best explained the continued presence (per-haps pre-dating the Gondwanan break-up) of thefreshwater invertebrate Daphniopsis studeri on the Antarc-tic continent. While we were unable to detect any morpho-logical differences in S. mollis, it is also possible that, withsuch high ‘intraspecific’ sequence divergences, cryptic spe-cies are present. With the isolating Antarctic conditions,genetic divergence among isolated populations may extendto speciation without reproductive isolation, leading to dif-ficulties in the definition of species.
Within the McMurdo Dry Valleys, we found: (1) morehaplotypes at inland sites at the western ends of the valleys;and (2) that inland sites (e.g. V8 and V10) of higher altitudeoften contained several different haplotypes. The formermay suggest potential expansion of extant populationsfrom western refugia following an eastern colonisationroute towards the Ross Sea. The latter may indicate thatpopulations persisted in elevated locations during glacialadvances across valley floors, as postulated by Nolanet al. (2006) for Taylor Valley during the last glacial period.The Dry Valley region harboured many of the haplotypesfound elsewhere in southern Victoria Land suggesting thatthis area may have served as a refuge during glacial peri-ods. In particular, genetic links between the Dry Valleys
and Ross Island for both species suggest an initial coloni-sation of Ross Island from a Dry Valleys individual, withsubsequent divergence in isolation at this location account-ing for those haplotypes now unique to Ross Island (e.g.G16–G18 and S36–S38). Further links between continentalAntarctic locations (e.g. Marble Point) and the Dry Valleys(e.g. G10, S27) may also have arisen via dispersal from theDry Valley region. Thus, initial dispersal from a Dry Valleyrefugium may have been followed by the formation of mul-tiple refugia at newly colonised locations (e.g. Ross Island,Beaufort Island) (see also Stevens and Hogg, 2003, 2006).
In summary, Mio-Pliocene glacial cycles, through theireffect on spatial and temporal variation in habitat structureand quality, appear to have played an active role in drivingpopulation structure for G. hodgsoni and S. mollis. Whilethese Antarctic taxa display broadly similar patterns ofphylogeographic structure, the presence of greater geneticstructure in S. mollis suggests that: (1) there is a nucleotidesubstitution rate difference between these species; and/or(2) S. mollis has persisted in southern Victoria Landthrough a greater number of glacial cycles than G. hodgson-
i. Future work focusing on investigation of physiologicalparameters capable of affecting evolutionary rates mayhelp to resolve this issue further.
Acknowledgments
We are extremely grateful to two anonymous reviewersfor their thorough and constructive comments and to R.Garrick and P. Sunnucks for comments on an earlier ver-sion of the manuscript. A.M. was supported by a KellyTarlton’s Underwater World Antarctic Postgraduate Stud-ies Scholarship and a University of Waikato PostgraduateScholarship. M.S. was supported through a NZ Founda-tion for Research, Science and Technology postdoctoralfellowship. We thank L. Nolan and A. Fjellberg for theirexpertise and assistance in the field, Antarctica New Zea-land for logistical support to I.H., and Brian Gould (for-mer Vice Chancellor, University of Waikato) for financialsupport. We thank T.G.A. Green and D. Penny for theiradvice and support; R. Garrick for assistance with Arle-quin; A. Templeton and D. Posada for guidance with thenested clade analyses, and K. McBreen for help with thenested cladogram.
Appendix A. Supplementary data
Supplementary data associated with this article can befound, in the online version, at doi:10.1016/j.ympev.2007.10.003.
References
Adams, B.J., Bardgett, R.D., Ayres, E., Wall, D.H., Aislabie, J.,Bamforth, S., Bargagli, R., Cary, C., Cavacini, P., Connell, L.,Convey, P., Fell, J.W., Frati, F., Hogg, I.D., Newsham, K.K.,O’Donnell, A., Russell, N., Seppelt, R.D., Stevens, M.I., 2006.

A. McGaughran et al. / Molecular Phylogenetics and Evolution 46 (2008) 606–618 617
Diversity and distribution of Victoria Land biota. Soil Biol. Biochem.38, 3003–3018.
Anderson, D.L., Trueman, J.W.H., 2000. Varroa jacobsoni (Acari:Varroidae) is more than one species. Exp. Appl. Acarol. 24, 165–189.
Bohonak, A.J., 1999. Dispersal, gene flow, and population structure. Q.Rev. Biol. 74, 21–45.
Brower, A.V.Z., 1994. Rapid morphological radiation and convergenceamong races of the butterfly Heliconius erato inferred from patterns ofmitochondrial DNA evolution. P. Natl. Acad. Sci. USA 91,6491–6495.
Burgess, J.S., Spate, A.P., Shevlin, J., 1994. The onset of deglaciationin the Larsemann Hills, Eastern Antarctica. Antarct. Sci. 6,491–495.
Castelloe, J., Templeton, A.R., 1994. Root probabilities for intraspecificgene trees under neutral coalescent theory. Nature 3, 102–113.
Clement, M.D., Posada, D., Crandall, K.A., 2000. TCS: a computerprogram to estimate gene genealogies. Mol. Ecol. 9, 1657–1659.
Convey, P., McInnes, S.J., 2005. Exceptional tardigrade-dominatedecosystems in Ellsworth Land, Antarctica. Ecology 86, 519–527.
Convey, P., Stevens, M.I., 2007. Antarctic biodiversity. Science 317,1877–1878.
Crandall, K.A., 1996. Multiple interspecies transmissions of human andsimian T-cell leukemia/lymphoma virus type I sequences. Mol. Biol.Evol. 13, 115–131.
Cromer, L., Gibson, J.A.E., Swadling, K.M., Hodgson, D.A., 2006.Evidence for a lacustrine faunal refuge in the Larsemann Hills, EastAntarctica, during the Last Glacial Maximum. J. Biogeog. 33,1314–1323.
Excoffier, L., Smouse, P.E., Quattro, J.M., 1992. Analysis of molecularvariance inferred from metric distances among DNA haplotypes:application to human mitochondrial DNA restriction data. Genetics131, 479–491.
Excoffier, L., Laval, G., Schneider, S., 2005. Arlequin ver. 3.0: anintegrated software package for population genetics data analysis.Evolutionary Bioinformatics Online: (http://cmpg.unibe.ch/software/arlequin3/), Zoological Institute, University of Berne, Switzerland.
Fanciulli, P.P., Summa, D., Dallai, R., Frati, F., 2001. High levels ofgenetic variability and population differentiation in Gressittacantha
terranova (Collembola, Hexapoda) from Victoria Land, Antarctica.Antarct. Sci. 13, 246–254.
Fink, D., McKelvey, B., Hannan, D., Newsome, D., 2000. Cold rocks, hotsands: in-situ cosmogenic applications in Australia at ANTARES.Nucl. Instrum. Methods B 172, 838–846.
Folmer, O., Black, M., Hoeh, W., Lutz, R., Vrijenhoek, R., 1994. DNAprimers for the amplification of mitochondrial cytochrome c oxidasesubunit I from diverse metazoan invertebrates. Mol. Mar. Biol.Biotech. 3, 294–299.
Frati, F., Spinsanti, G., Dallai, R., 2001. Genetic variation of mtCOIIgene sequences in the collembolan Isotoma klovstadi from VictoriaLand, Antarctica: evidence for population differentiation. Polar Biol.24, 934–940.
Fu, Y.-X., 1997. Statistical tests of neutrality of mutations againstpopulation growth, hitchhiking and background selection. Genetics147, 915–925.
Garrick, R.C., Sands, J., Rowell, D.M., Hillis, D.M., Sunnucks, P., 2007.Catchments catch all: long-term population history of a giantspringtail from the southeast Australian highlands—a multigeneapproach. Mol. Ecol. 16, 1865–1882.
Gillespie, R., 2004. Community assembly through adaptive radiation inHawaiian spiders. Science 303, 356–359.
Gillespie, R., Roderick, G.K., 2002. Arthropods on islands: colonization,speciation and conservation. Annu. Rev. Entomol. 47, 595–632.
Gore, D.B., Rhodes, E.J., Augustinus, P.C., Leishman, M.R., Colhoun,E.A., Rees-Jones, J., 2001. Bunger Hill, East Antarctica: ice free at thelast glacial maximum. Geology 29, 1103–1106.
Grobler, G.C., Janse van Rensburg, L., Bastos, A.D.S., Chimimba, C.T.,Chown, S.L., 2006. Molecular and morphometric assessment ofEctemnorhinus weevil species (Coleoptera, Curculionidae, Brachycer-
inae) from the sub-Antarctic Prince Edward Islands. J. Zool. Syst.Evol. Res. 44, 200–211.
Hays, J.D., Imbrie, J., Shackleton, N.J., 1976. Variations in the Earth’sorbit: pacemaker of the ice ages. Science 194, 1121–1132.
Hodgson, D.A., Noon, P.E., Vyverman, W., Bryant, C.L., Gore, D.B.,Appleby, P., Gilmour, M., Verleyen, E., Sabbe, K., Jones, V.J., Ellis-Evans, J.C., Wood, P.B., 2001. Were the Larsemann Hills ice-freethrough the Last Glacial Maximum? Antarct. Sci. 13, 440–454.
Hogg, I.D., Hebert, P.D.N., 2004. Biological identification of springtails(Hexapoda: Collembola) from the Canadian Arctic, using mitochon-drial DNA barcodes. Can. J. Zool. 82, 749–754.
Juan, C., Oromi, P., Hewitt, G.M., 1996. Phylogeny of the genus Hegeter
(Tenebrionidae, Coleoptera) and its colonisation of the Canary Islandsdeduced from cytochrome oxidase I mitochondrial DNA sequences.Heredity 76, 392–403.
Knowles, L.L., 2001. Did the Pleistocene glaciations promote divergence?Tests of explicit refugial models in montane grasshoppers. Mol. Ecol.10, 691–701.
Marchant, D.R., Denton, G.H., 1996. Miocene and Pliocene climate ofthe dry valleys region, southern Victoria Land: a geomorphologicalapproach. Mar. Micropaleontol. 27, 253–271.
Marshall, D.J., Coetzee, L., 2000. Historical biogeography and ecology ofa Continental Antarctic mite genus, Maudheimia (Acari, Oribatida):evidence for a Gondwanan origin and Pliocene–Pleistocene speciation.Zool. J. Linn. Soc-Lond. 129, 111–128.
Marshall, D.J., Pugh, P.J.A., 1996. Origin of the inland Acari ofContinental Antarctica, with particular reference to Dronning MaudLand. Zool. J. Linn. Soc-Lond. 118, 101–118.
Martin, A.P., Palumbi, S.R., 1993. Body size, metabolic rate, genera-tion time, and the molecular clock. P. Natl. Acad. Sci. USA 90,4087–4091.
Mortimer, E., Jansen van Vuuren, B., 2007. Phylogeography of Eupodes
minutus (Acari: Prostigmata) on sub-Antarctic Marion Island reflectsthe impact of historical events. Polar Biol. 30, 471–476.
Murrell, A., Dobson, S.J., Walter, D.E., Campbell, N.J.H., Shao, R.,Barker, S.C., 2005. Relationships among the three major lineages ofthe Acari (Arthropoda: Arachnida) inferred from small subunit rRNA:paraphyly of the Parasitiformes with respect to the Opolioacariformesand relative rates of nucleotide substitution. Invertebr. Syst. 19,383–389.
Myburgh, M., Chown, S.L., Daniels, S.R., Jansen van Vuuren, B., 2007.Population structure, propagule pressure, and conservation biogeog-raphy in the sub-Antarctic: lessons from indigenous and invasivespringtails. Divers. Distrib. 13, 143–154.
Nei, M., 1987. Molecular Evolutionary Genetics. Columbia UniversityPress, New York, NY, USA.
Nolan, L., Hogg, I.D., Stevens, M.I., Haase, M., 2006. Fine scaledistribution of mtDNA haplotypes for the springtail Gomphio-
cephalus hodgsoni (Collembola) corresponds to an ancient shore-line in Taylor Valley, continental Antarctica. Polar Biol. 29,813–819.
Nylander, J.A.A., 2004. MrModeltest v2. Program distributed by theauthor. Evolutionary Biology Centre, Uppsala University.
Otto, J.C., Wilson, K.J., 2001. Assessment of the usefulness of ribosomal18S and mitochondrial COI sequences in Prostigmata phylogeny. In:Halliday, R.B., Walter, D.E., Proctor, H.C., Norton, R.A., Colloff,M.J. (Eds.), Acarology: Proceedings of the 10th International Con-gress. CSIRO Publishers, Melbourne, pp. 100–109.
Page, R.D.M., 1996. TREEVIEW: an application to display phylogenetictrees on personal computers. Comput. Appl. 12, 357–358.
Paulay, G., 1985. Adaptive radiation on an isolated oceanic island: theCryptorhynchinae (Curculionidae) of Rapa revisited. Biol. J. Linn.Soc. 26, 95–187.
Peterson, M.A., Denno, R.F., 1998. The influence of dispersal and dietbreadth on patterns of genetic isolation by distance in phytophagousinsects. Am. Nat. 152, 428–446.
Posada, D., Crandall, K.A., 1998. Modeltest: testing the model of DNAsubstitution. Bioinformatics 14, 817–818.
618 A. McGaughran et al. / Molecular Phylogenetics and Evolution 46 (2008) 606–618
Posada, D., Crandall, K.A., Templeton, A.R., 2000. GeoDis: a programfor the cladistic nested analysis of the geographical distribution ofgenetic haplotypes. Mol. Ecol. 9, 487–488.
Posada, D., Crandall, K.A., Holmes, E.C., 2002. Recombination inevolutionary genomics. Annu. Rev. Genet. 36, 75–97.
Pugh, P.J.A., Convey, P., 2000. Scotia Arc Acari: antiquity and origin.Zool. J. Linn. Soc-Lon. 130, 309–328.
Quek, S.-P., Davies, S.J., Itino, T., Pierce, N.E., 2004. Codiversification inan ant-plant mutualism: stem texture and the evolution of host use inCrematogaster (Formicidae: Myrmicinae) inhabitants of Macaranga(Euphyorbiaceae). Evolution 58, 554–570.
Rambaut, A., Drummond, A.J., 2007. TRACER v1.3: available from theauthor’s website: http://tree.bio.ed.ac.uk/software/tracer/.
Rogers, A.D., 2006. Evolution and biodiversity of Antarctic organisms: amolecular perspective. Philos. T. Roy. Soc. B. doi:10.1098/rstb.2006.194.
Ronquist, F., Huelsenbeck, J.P., 2003. MrBayes 3: Bayesian phylogeneticinference under mixed models. Bioinformatics 19, 1572–1574.
Rowe, K.C., Heske, E.J., Brown, P.W., Paige, K.N., 2004. Surviving theice: northern refugia and postglacial colonization. P. Natl. Acad. Sci.USA 101, 10355–10359.
Salomone, N., Emerson, B.C., Hewitt, G.M., Bernini, F., 2002. Phyloge-netic relationships among the Canary Island Steganacaridae (Acari:Oribatida) inferred from mitochondrial DNA sequence data. Mol.Ecol. 11, 79–89.
Schaefer, I., Domes, K., Heethoff, M., Schneider, K., Schon, I., Norton,R.A., Scheu, S., Maraun, M., 2005. No evidence for the Meselsoneffect in parthenogenetic oribatid mites (Oribatida, Acari). J. Evol.Biol. 19, 184–193.
Sinclair, B.J., Sjursen, H., 2001. Cold tolerance of the Antarctic springtailGomphiocephalus hodgsoni (Collembola, Hypogastruridae). Ant. Sci.13, 271–279.
Sinclair, B.J., Stevens, M.I., 2006. Terrestrial microarthropods of VictoriaLand and Queen Maud Mountains, Antarctica: implications of climatechange. Soil Biol. Biochem. 38, 3158–3170.
Sjursen, H., Sinclair, B.J., 2002. On the cold hardiness of Stereotydeus
mollis (Acari: Prostigmata) from Ross Island, Antarctica. Pedobiolo-gia 46, 188–195.
Soto-Adames, F.N., 2002. Molecular phylogeny of the Puerto RicanLepidocyrtus and Pseudosinella (Hexapoda: Collembola), a validationof Yoshii’s color pattern species. Mol. Phylogenet. Evol. 25, 27–42.
Stevens, M.I., Hogg, I.D., 2003. Long-term isolation and recent range-expansion from glacial refugia revealed for the endemic springtailGomphiocephalus hodgsoni from Victoria Land, Antarctica. Mol. Ecol.12, 2357–2369.
Stevens, M.I., Hogg, I.D., 2006. Contrasting levels of mitochondrial DNAvariability between mites (Penthalodidae) and springtails (Hypogastr-uridae) from the Trans-Antarctic Mountains suggest long-term effectsof glaciation and life history on substitution rates, and speciationprocesses. Soil Biol. Biochem. 38, 3171–3180.
Stevens, M.I., Greenslade, P., Hogg, I.D., Sunnucks, P., 2006. Examiningsouthern hemisphere springtails: could any have survived glaciation ofAntarctica? Mol. Biol. Evol. 23, 874–882.
Stevens, M.I., Frati, F., McGaughran, A., Spinsanti, G., Hogg, I.D., 2007.Phylogeographic structure suggests multiple glacial refugia in northernVictoria Land for the endemic Antarctic springtail Desoria klovstadi,(Collembola, Isotomidae). Zool. Scripta. 36, 201–212.
Strandtmann, R.W., 1967. Terrestrial prostigmata (Trombidiform mites).Antarct. Res. Ser. 10, 51–95.
Swofford, D.L., 2002. PAUP*: Phylogenetic Analysis Using Parsimony,Version 4.0b10 for Macintosh. Sinauer Associates Incorporated,Sunderland, MA.
Tajima, F., 1989. Statistical method for testing the neutral mutationhypothesis by DNA polymorphism. Genetics 123, 585–595.
Templeton, A.R., Crandall, K.A., Sing, C.F., 1992. A cladistic analysis ofphenotypic associations with haplotypes inferred from restrictionendonuclease mapping and DNA sequence data. Genetics 132, 619–633.
Vandergast, A.G., Bohonak, A.J., Weissman, D.B., Fisher, R.N., 2007.Understanding the genetic effects of recent habitat fragmentation inthe context of evolutionary history: phylogeography and landscapegenetics of a southern California endemic Jerusalem cricket (Orthop-tera: Stenopelmatidae: Stenopelmatus). Mol. Ecol. 16, 977–992.
Wise, K.A.J., 1971. The Collembola of Antarctica. Pac. Insects Mono. 25,57–74.
Xu, S., 2000. Phylogenetic analysis under reticulate evolution. Mol. Biol.Evol. 17, 897–907.