Pattern analysis in daily physical activity data for personal health management
13
Pervasive and Mobile Computing ( ) – Contents lists available at ScienceDirect Pervasive and Mobile Computing journal homepage: www.elsevier.com/locate/pmc Pattern analysis in daily physical activity data for personal health management Jung-Hsien Chiang a,∗ , Pei-Ching Yang a , Hsuan Tu b a Department of Computer Science and Information Engineering, National Cheng Kung University Tainan, Taiwan b Institute of Medical Informatics, National Cheng Kung University Tainan, Taiwan article info Article history: Received 24 April 2013 Received in revised form 4 December 2013 Accepted 9 December 2013 Available online xxxx Keywords: Pattern recognition Daily activity habits Personal health management Health care abstract Purpose: sedentary lifestyles have resulted in an increasing number of people who are at increased risk of various conditions and diseases, including overweight, obesity, and metabolic syndromes. Our objective was to systematically record the daily life journal on a platform to increase the self-awareness and improve the sedentary lifestyle and to assist clinicians in understanding and facilitating patients’ daily physical activity. Method: we developed a portable activity pattern recognition system designed to automatically recognize the daily activity habits of users, and provide visualized life logs on the wellness self-management platform for patients and clinicians. Based on the participants’ and the clinician’s comments, appropriate modifications were made. Results: persuading people to improve their activities during non-working hours can en- hance the general physical activity. Since users’ smartphones automatically monitor their energy expenditure, healthcare professionals can use these data to assist their patients in addressing health problems stemming from the obesity or metabolic syndromes, thus em- powering users to avert or delay the progression of diabetes, cardiovascular disease and other complications. Discussion and conclusions: the clinical pilot study showed the feasibility of applying this persuasive technology to improve the physical activity of overweight people. The limitation of the study is the need for Wi-Fi and 3G environments and a smartphone. © 2013 Elsevier B.V. All rights reserved. 1. Introduction Changes in working styles and the development of unhealthy life habits have reduced the perceived importance of exercise, and experts increasingly suggest that physical inactivity will be the most important public health problem of the twenty-first century [1]. Increasingly sedentary lifestyles are putting greater numbers of people at increased risk of various conditions and diseases including overweight, obesity and metabolic-related syndromes. Overweight and obesity are associated with a higher prevalence of metabolism-related diseases [2]. According to Taiwan’s Department of Health [3], metabolic syndrome-related diseases accounted for almost 30% of deaths in 2011. Therefore, mechanisms to prevent overweight and obesity are essential components of today’s healthcare systems. Medical experts have revealed a clear correlation between the lack of physical activity and overweight, obesity and metabolism-related syndromes [4]. Several new studies suggest that breaking up sedentary time with periods of movement may help to mitigate the unhealthy effects of lack of regular movement [5]. Other research has shown that regular exercise ∗ Correspondence to: No. 1, University Road, Tainan City 701, Taiwan. Tel.: +886 6 2757575x62534; fax: +886 6 2747076. E-mail addresses: [email protected] (J.-H. Chiang), [email protected] (P.-C. Yang), [email protected] (H. Tu). 1574-1192/$ – see front matter © 2013 Elsevier B.V. All rights reserved. http://dx.doi.org/10.1016/j.pmcj.2013.12.003
Transcript of Pattern analysis in daily physical activity data for personal health management
Pervasive and Mobile Computing ( ) –
Contents lists available at ScienceDirect
Pervasive and Mobile Computing
journal homepage: www.elsevier.com/locate/pmc
Pattern analysis in daily physical activity data for personalhealth managementJung-Hsien Chiang a,∗, Pei-Ching Yang a, Hsuan Tu b
a Department of Computer Science and Information Engineering, National Cheng Kung University Tainan, Taiwanb Institute of Medical Informatics, National Cheng Kung University Tainan, Taiwan
a r t i c l e i n f o
Article history:Received 24 April 2013Received in revised form 4 December 2013Accepted 9 December 2013Available online xxxx
Keywords:Pattern recognitionDaily activity habitsPersonal health managementHealth care
a b s t r a c t
Purpose: sedentary lifestyles have resulted in an increasing number of people who areat increased risk of various conditions and diseases, including overweight, obesity, andmetabolic syndromes. Our objective was to systematically record the daily life journal ona platform to increase the self-awareness and improve the sedentary lifestyle and to assistclinicians in understanding and facilitating patients’ daily physical activity.
Method: we developed a portable activity pattern recognition system designed toautomatically recognize the daily activity habits of users, and provide visualized lifelogs on the wellness self-management platform for patients and clinicians. Based on theparticipants’ and the clinician’s comments, appropriate modifications were made.
Results:persuading people to improve their activities during non-working hours can en-hance the general physical activity. Since users’ smartphones automatically monitor theirenergy expenditure, healthcare professionals can use these data to assist their patients inaddressing health problems stemming from the obesity or metabolic syndromes, thus em-powering users to avert or delay the progression of diabetes, cardiovascular disease andother complications.
Discussion and conclusions: the clinical pilot study showed the feasibility of applying thispersuasive technology to improve the physical activity of overweight people. The limitationof the study is the need for Wi-Fi and 3G environments and a smartphone.
© 2013 Elsevier B.V. All rights reserved.
1. Introduction
Changes in working styles and the development of unhealthy life habits have reduced the perceived importance ofexercise, and experts increasingly suggest that physical inactivity will be the most important public health problem of thetwenty-first century [1]. Increasingly sedentary lifestyles are putting greater numbers of people at increased risk of variousconditions and diseases including overweight, obesity and metabolic-related syndromes.
Overweight and obesity are associated with a higher prevalence of metabolism-related diseases [2]. According toTaiwan’s Department of Health [3], metabolic syndrome-related diseases accounted for almost 30% of deaths in 2011.Therefore, mechanisms to prevent overweight and obesity are essential components of today’s healthcare systems.
Medical experts have revealed a clear correlation between the lack of physical activity and overweight, obesity andmetabolism-related syndromes [4]. Several new studies suggest that breaking up sedentary timewith periods of movementmay help to mitigate the unhealthy effects of lack of regular movement [5]. Other research has shown that regular exercise
∗ Correspondence to: No. 1, University Road, Tainan City 701, Taiwan. Tel.: +886 6 2757575x62534; fax: +886 6 2747076.E-mail addresses: [email protected] (J.-H. Chiang), [email protected] (P.-C. Yang), [email protected] (H. Tu).
1574-1192/$ – see front matter© 2013 Elsevier B.V. All rights reserved.http://dx.doi.org/10.1016/j.pmcj.2013.12.003
2 J.-H. Chiang et al. / Pervasive and Mobile Computing ( ) –
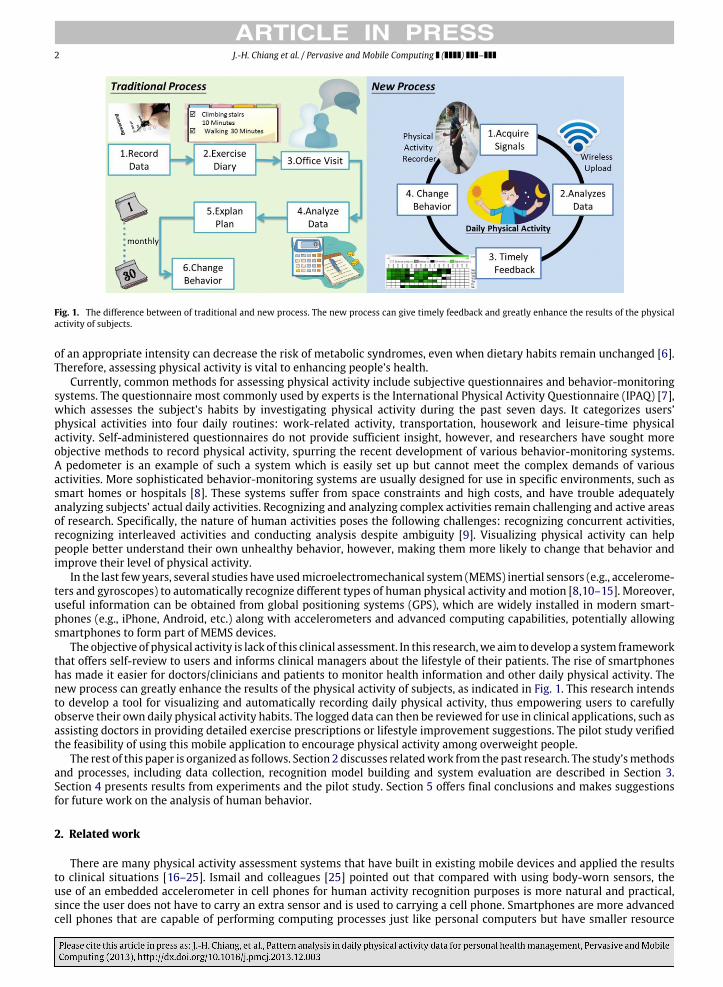
Fig. 1. The difference between of traditional and new process. The new process can give timely feedback and greatly enhance the results of the physicalactivity of subjects.
of an appropriate intensity can decrease the risk of metabolic syndromes, even when dietary habits remain unchanged [6].Therefore, assessing physical activity is vital to enhancing people’s health.
Currently, common methods for assessing physical activity include subjective questionnaires and behavior-monitoringsystems. The questionnaire most commonly used by experts is the International Physical Activity Questionnaire (IPAQ) [7],which assesses the subject’s habits by investigating physical activity during the past seven days. It categorizes users’physical activities into four daily routines: work-related activity, transportation, housework and leisure-time physicalactivity. Self-administered questionnaires do not provide sufficient insight, however, and researchers have sought moreobjective methods to record physical activity, spurring the recent development of various behavior-monitoring systems.A pedometer is an example of such a system which is easily set up but cannot meet the complex demands of variousactivities. More sophisticated behavior-monitoring systems are usually designed for use in specific environments, such assmart homes or hospitals [8]. These systems suffer from space constraints and high costs, and have trouble adequatelyanalyzing subjects’ actual daily activities. Recognizing and analyzing complex activities remain challenging and active areasof research. Specifically, the nature of human activities poses the following challenges: recognizing concurrent activities,recognizing interleaved activities and conducting analysis despite ambiguity [9]. Visualizing physical activity can helppeople better understand their own unhealthy behavior, however, making them more likely to change that behavior andimprove their level of physical activity.
In the last few years, several studies have usedmicroelectromechanical system (MEMS) inertial sensors (e.g., accelerome-ters and gyroscopes) to automatically recognize different types of human physical activity andmotion [8,10–15]. Moreover,useful information can be obtained from global positioning systems (GPS), which are widely installed in modern smart-phones (e.g., iPhone, Android, etc.) along with accelerometers and advanced computing capabilities, potentially allowingsmartphones to form part of MEMS devices.
The objective of physical activity is lack of this clinical assessment. In this research,we aim todevelop a system frameworkthat offers self-review to users and informs clinical managers about the lifestyle of their patients. The rise of smartphoneshas made it easier for doctors/clinicians and patients to monitor health information and other daily physical activity. Thenew process can greatly enhance the results of the physical activity of subjects, as indicated in Fig. 1. This research intendsto develop a tool for visualizing and automatically recording daily physical activity, thus empowering users to carefullyobserve their own daily physical activity habits. The logged data can then be reviewed for use in clinical applications, such asassisting doctors in providing detailed exercise prescriptions or lifestyle improvement suggestions. The pilot study verifiedthe feasibility of using this mobile application to encourage physical activity among overweight people.
The rest of this paper is organized as follows. Section 2 discusses relatedwork from the past research. The study’smethodsand processes, including data collection, recognition model building and system evaluation are described in Section 3.Section 4 presents results from experiments and the pilot study. Section 5 offers final conclusions and makes suggestionsfor future work on the analysis of human behavior.
2. Related work
There are many physical activity assessment systems that have built in existing mobile devices and applied the resultsto clinical situations [16–25]. Ismail and colleagues [25] pointed out that compared with using body-worn sensors, theuse of an embedded accelerometer in cell phones for human activity recognition purposes is more natural and practical,since the user does not have to carry an extra sensor and is used to carrying a cell phone. Smartphones are more advancedcell phones that are capable of performing computing processes just like personal computers but have smaller resource
J.-H. Chiang et al. / Pervasive and Mobile Computing ( ) – 3
capabilities. Moreover, they have built-in sensors that are capable of sensing contextual information from users and aresupported by a wide range of network connection capabilities. Since the emergence of the smartphone, smartphone-basedactivity recognition systemshave been utilized for unobtrusive activity recognition research especially pertaining to humansas the object of research. Wearable sensor-based systems have been reported to create discomfort for their users and asbeing devices alien to the human body. In contrast, smartphones can serve unobtrusively as such devices because it iscommon practice to carry smartphones during daily activities. Hence, smartphones are used in our study to implementa portable activity pattern recognition system designed to automatically recognize the daily activity habits of users, andprovide visualized life logs on the wellness self-management platform for patients and clinicians.
Activity recognition technology in health promotion can be applied to a variety of areas includingwellnessmanagement,weight control, lifestyle modification, calorie-consumption computation and behavior analysis [26]. Many researchers haveattempted to recognize activities and analyze behavior based on the recognized activities to discover activity patterns.Discovering activity patterns requires advanced and long-term analysis of daily activities. The activity patterns consideredin this research were user habits, and identifying such activity requires the behavior or activity recognition.
One common component of the long-term activity recognition is the observation of users’ behavior when they performactivities in a smart environment. For example, Naya and colleagues [8] attempted to analyze nurses’ routine workflowactivities by developing an infrared sensor system that recorded the motion status for different hospital wards and usedthree Bluetooth-based accelerometers to record the nurses’ actions. Thirteen workflow activities were identified, but theresults variedwidely between activities. In another example, Roy and colleagues [13] presented a formal activity-recognitionframework in a smart home, based on the possibility theory. Theymonitored behavior using pressure sensors on chairs, radiofrequency identification (RFID) antennas on cups and plates, passive infrared sensors, reed switch sensors on cupboards,video sensors and accelerometer sensors on the user’s hand.
Huynh and colleagues [11] investigated daily routines as a probabilistic combination of activity patterns. Discoveryof daily routines was based on the low-level activity recognition. They used two accelerometers to recognize low-levelactivities, identifying 34 low-level activities by analyzing accelerometer signals. To consider the probability and compositionof low-level activities, they also employed a topic-modelmethod, allowing for further identification of daily routine patternssuch as commuting, office work, lunch routines, and dinner activities.
Low-level activity recognition is the basis of long-term activity or behavior recognition. Khan and colleagues [14] usedwearable sensors (usually accelerometers but also gyroscopes and RFIDs) to recognize high-performance human activity.They divided 15 types of human activities into three states: static, transformative and dynamic. Their recognition methodproposed a hierarchical scheme using statistical features and artificial neural nets (ANNs) to determine which state anactivity belonged to [14]. The research team also studied activity recognition and position-free human-activity recognitionvia an accelerometer-enabled smartphone [10,12].
The previous study [27] by our team had used the built-in tri-axial accelerometer of an HTC Android smartphone torecognize nine activities in real time. We focused on exercise type recognition, placing the smartphone on the subject’sleft arm, and analyzing movement extracted from the resulting acceleration signals using the tree-augmented Naïve Bayesclassifier.
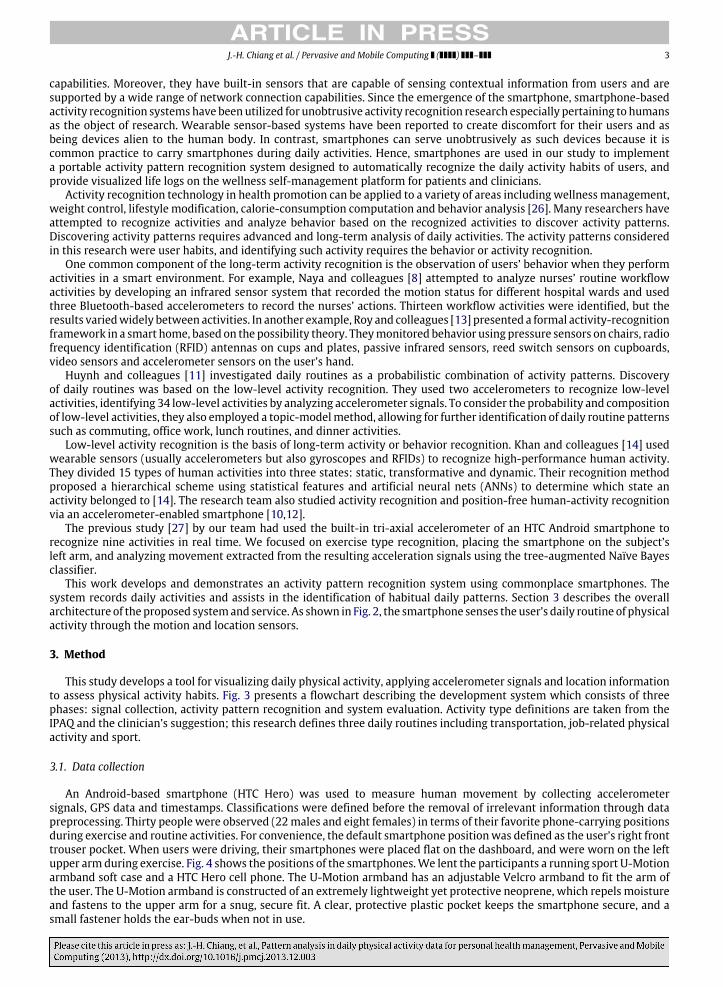
This work develops and demonstrates an activity pattern recognition system using commonplace smartphones. Thesystem records daily activities and assists in the identification of habitual daily patterns. Section 3 describes the overallarchitecture of the proposed systemand service. As shown in Fig. 2, the smartphone senses the user’s daily routine of physicalactivity through the motion and location sensors.
3. Method
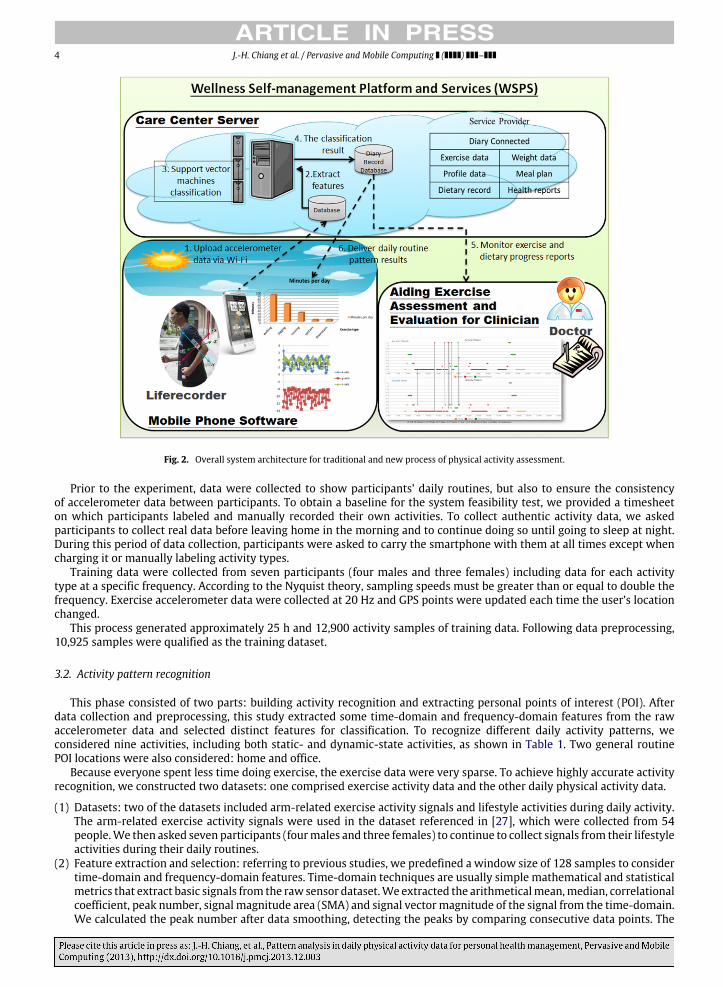
This study develops a tool for visualizing daily physical activity, applying accelerometer signals and location informationto assess physical activity habits. Fig. 3 presents a flowchart describing the development system which consists of threephases: signal collection, activity pattern recognition and system evaluation. Activity type definitions are taken from theIPAQ and the clinician’s suggestion; this research defines three daily routines including transportation, job-related physicalactivity and sport.
3.1. Data collection
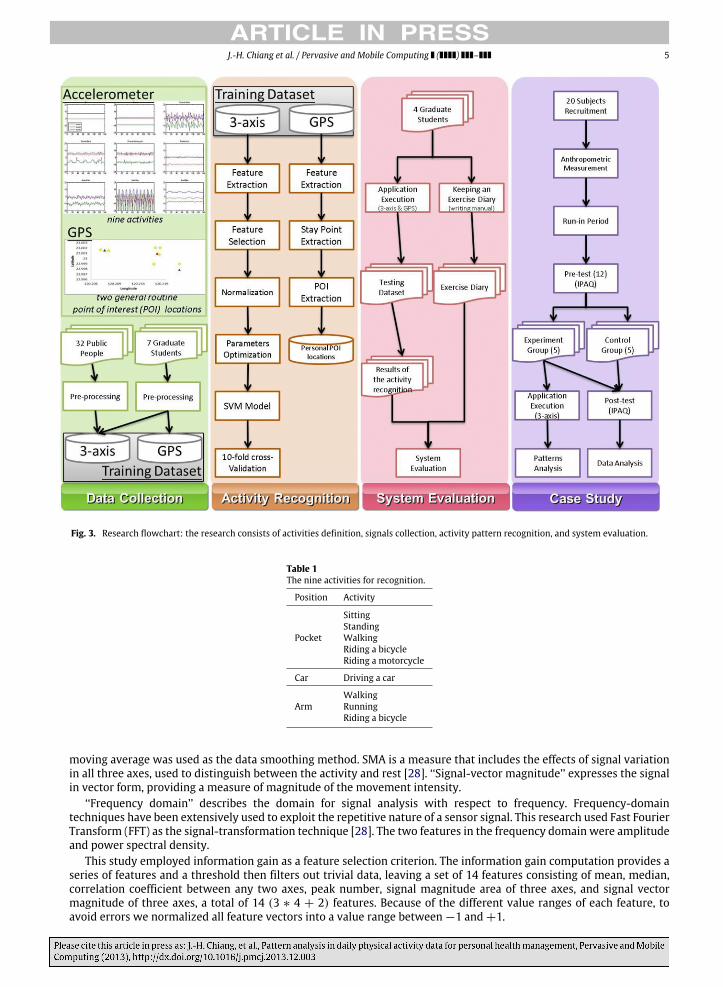
An Android-based smartphone (HTC Hero) was used to measure human movement by collecting accelerometersignals, GPS data and timestamps. Classifications were defined before the removal of irrelevant information through datapreprocessing. Thirty people were observed (22males and eight females) in terms of their favorite phone-carrying positionsduring exercise and routine activities. For convenience, the default smartphone positionwas defined as the user’s right fronttrouser pocket. When users were driving, their smartphones were placed flat on the dashboard, and were worn on the leftupper arm during exercise. Fig. 4 shows the positions of the smartphones.We lent the participants a running sport U-Motionarmband soft case and a HTC Hero cell phone. The U-Motion armband has an adjustable Velcro armband to fit the arm ofthe user. The U-Motion armband is constructed of an extremely lightweight yet protective neoprene, which repels moistureand fastens to the upper arm for a snug, secure fit. A clear, protective plastic pocket keeps the smartphone secure, and asmall fastener holds the ear-buds when not in use.
4 J.-H. Chiang et al. / Pervasive and Mobile Computing ( ) –
Fig. 2. Overall system architecture for traditional and new process of physical activity assessment.
Prior to the experiment, data were collected to show participants’ daily routines, but also to ensure the consistencyof accelerometer data between participants. To obtain a baseline for the system feasibility test, we provided a timesheeton which participants labeled and manually recorded their own activities. To collect authentic activity data, we askedparticipants to collect real data before leaving home in the morning and to continue doing so until going to sleep at night.During this period of data collection, participants were asked to carry the smartphone with them at all times except whencharging it or manually labeling activity types.
Training data were collected from seven participants (four males and three females) including data for each activitytype at a specific frequency. According to the Nyquist theory, sampling speeds must be greater than or equal to double thefrequency. Exercise accelerometer data were collected at 20 Hz and GPS points were updated each time the user’s locationchanged.
This process generated approximately 25 h and 12,900 activity samples of training data. Following data preprocessing,10,925 samples were qualified as the training dataset.
3.2. Activity pattern recognition
This phase consisted of two parts: building activity recognition and extracting personal points of interest (POI). Afterdata collection and preprocessing, this study extracted some time-domain and frequency-domain features from the rawaccelerometer data and selected distinct features for classification. To recognize different daily activity patterns, weconsidered nine activities, including both static- and dynamic-state activities, as shown in Table 1. Two general routinePOI locations were also considered: home and office.
Because everyone spent less time doing exercise, the exercise data were very sparse. To achieve highly accurate activityrecognition, we constructed two datasets: one comprised exercise activity data and the other daily physical activity data.
(1) Datasets: two of the datasets included arm-related exercise activity signals and lifestyle activities during daily activity.The arm-related exercise activity signals were used in the dataset referenced in [27], which were collected from 54people.We then asked seven participants (fourmales and three females) to continue to collect signals from their lifestyleactivities during their daily routines.
(2) Feature extraction and selection: referring to previous studies, we predefined a window size of 128 samples to considertime-domain and frequency-domain features. Time-domain techniques are usually simple mathematical and statisticalmetrics that extract basic signals from the raw sensor dataset.We extracted the arithmeticalmean,median, correlationalcoefficient, peak number, signal magnitude area (SMA) and signal vector magnitude of the signal from the time-domain.We calculated the peak number after data smoothing, detecting the peaks by comparing consecutive data points. The
J.-H. Chiang et al. / Pervasive and Mobile Computing ( ) – 5
Fig. 3. Research flowchart: the research consists of activities definition, signals collection, activity pattern recognition, and system evaluation.
Table 1The nine activities for recognition.
Position Activity
SittingStandingWalkingRiding a bicycleRiding a motorcycle
Car Driving a car
ArmWalkingRunningRiding a bicycle
moving average was used as the data smoothing method. SMA is a measure that includes the effects of signal variationin all three axes, used to distinguish between the activity and rest [28]. ‘‘Signal-vector magnitude’’ expresses the signalin vector form, providing a measure of magnitude of the movement intensity.
‘‘Frequency domain’’ describes the domain for signal analysis with respect to frequency. Frequency-domaintechniques have been extensively used to exploit the repetitive nature of a sensor signal. This research used Fast FourierTransform (FFT) as the signal-transformation technique [28]. The two features in the frequency domain were amplitudeand power spectral density.
This study employed information gain as a feature selection criterion. The information gain computation provides aseries of features and a threshold then filters out trivial data, leaving a set of 14 features consisting of mean, median,correlation coefficient between any two axes, peak number, signal magnitude area of three axes, and signal vectormagnitude of three axes, a total of 14 (3 ∗ 4 + 2) features. Because of the different value ranges of each feature, toavoid errors we normalized all feature vectors into a value range between −1 and +1.
6 J.-H. Chiang et al. / Pervasive and Mobile Computing ( ) –
Fig. 4. The placements for the smartphone: arm, on the dashboard, and front trouser pocket.
(3) POI extraction: this study gathered the location information including latitude, longitude, moving distance, speed andthe number of active GPS satellites every time the user’s location changed. The number of satellites varied with theuser’s environment. A ‘‘stay point’’ is an indoor location where the user remains for a given duration. The consideredPOI locations were home and work. Since the study required the automatic extraction of the two personal POIs, it wasnecessary to integrate the user’s stay points for analysis.
First, we filtered each user’s daily continuous stay points by means of a distance threshold to obtain effective points.For each two continuous stay points, the latter was filtered out if the distance between the two was fewer than 300 m.A POI extraction method based on k-means, a common clustering approach [29], was used to partition effective staypoints into two clusters. The two centroids represented the corresponding POIs, allowing the ‘‘home’’ and ‘‘office’’ labelsto be assigned according to the timestamps at each location.
The POI extraction method can recognize the locations of participants and can obtain more information on users’behavior. The fact that the subjects did not want to open their location information, however, compelled us to disablethe POI extraction system function.
(4) Classifier comparison:we considered themostwidely used recognition and classificationmethods using inertial sensing,including Decision Tree (DT), Nearest Neighbor (NN), Naïve Bayes (NB) and Support Vector Machine (SVM) classifiers.After the classifiers were tested and compared, the SVM classifier showed the highest accuracy. SVM was thus selectedand the labeled data were used to build the activity recognition model.
3.3. System evaluation
This section evaluates the design and implementation of the portable activity recognition system. The evaluationcontained the accuracy rates of the classifiers and activities, and a case studywas conducted in a clinical research context. Thetesting phase of the system calculated the features of the collected data, extracting them in real-time from the smartphoneand saving them automatically in daily files. These files were then transferred to a server through a Wi-Fi network.Classification and data visualization were performed on the server side. In this phase, the study also evaluated the accuracyof automatic classification and system feasibility tests.
4. Experimental results
We begin by describing parameter optimization and experimental results before presenting a comparison of SVM andthe other classifiers, activity pattern recognition results and the detailed description of a pilot study.
J.-H. Chiang et al. / Pervasive and Mobile Computing ( ) – 7
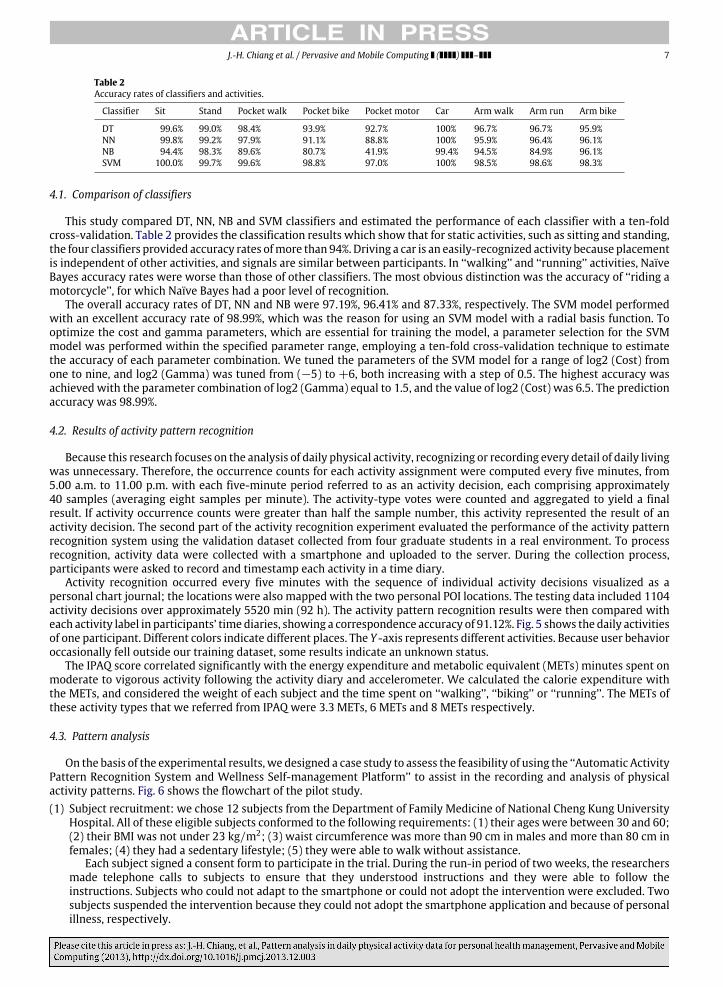
Table 2Accuracy rates of classifiers and activities.
Classifier Sit Stand Pocket walk Pocket bike Pocket motor Car Arm walk Arm run Arm bike
DT 99.6% 99.0% 98.4% 93.9% 92.7% 100% 96.7% 96.7% 95.9%NN 99.8% 99.2% 97.9% 91.1% 88.8% 100% 95.9% 96.4% 96.1%NB 94.4% 98.3% 89.6% 80.7% 41.9% 99.4% 94.5% 84.9% 96.1%SVM 100.0% 99.7% 99.6% 98.8% 97.0% 100% 98.5% 98.6% 98.3%
4.1. Comparison of classifiers
This study compared DT, NN, NB and SVM classifiers and estimated the performance of each classifier with a ten-foldcross-validation. Table 2 provides the classification results which show that for static activities, such as sitting and standing,the four classifiers provided accuracy rates ofmore than 94%. Driving a car is an easily-recognized activity because placementis independent of other activities, and signals are similar between participants. In ‘‘walking’’ and ‘‘running’’ activities, NaïveBayes accuracy rates were worse than those of other classifiers. The most obvious distinction was the accuracy of ‘‘riding amotorcycle’’, for which Naïve Bayes had a poor level of recognition.
The overall accuracy rates of DT, NN and NB were 97.19%, 96.41% and 87.33%, respectively. The SVM model performedwith an excellent accuracy rate of 98.99%, which was the reason for using an SVM model with a radial basis function. Tooptimize the cost and gamma parameters, which are essential for training the model, a parameter selection for the SVMmodel was performed within the specified parameter range, employing a ten-fold cross-validation technique to estimatethe accuracy of each parameter combination. We tuned the parameters of the SVM model for a range of log2 (Cost) fromone to nine, and log2 (Gamma) was tuned from (−5) to +6, both increasing with a step of 0.5. The highest accuracy wasachieved with the parameter combination of log2 (Gamma) equal to 1.5, and the value of log2 (Cost) was 6.5. The predictionaccuracy was 98.99%.
4.2. Results of activity pattern recognition
Because this research focuses on the analysis of daily physical activity, recognizing or recording every detail of daily livingwas unnecessary. Therefore, the occurrence counts for each activity assignment were computed every five minutes, from5.00 a.m. to 11.00 p.m. with each five-minute period referred to as an activity decision, each comprising approximately40 samples (averaging eight samples per minute). The activity-type votes were counted and aggregated to yield a finalresult. If activity occurrence counts were greater than half the sample number, this activity represented the result of anactivity decision. The second part of the activity recognition experiment evaluated the performance of the activity patternrecognition system using the validation dataset collected from four graduate students in a real environment. To processrecognition, activity data were collected with a smartphone and uploaded to the server. During the collection process,participants were asked to record and timestamp each activity in a time diary.
Activity recognition occurred every five minutes with the sequence of individual activity decisions visualized as apersonal chart journal; the locations were also mapped with the two personal POI locations. The testing data included 1104activity decisions over approximately 5520 min (92 h). The activity pattern recognition results were then compared witheach activity label in participants’ time diaries, showing a correspondence accuracy of 91.12%. Fig. 5 shows the daily activitiesof one participant. Different colors indicate different places. The Y -axis represents different activities. Because user behavioroccasionally fell outside our training dataset, some results indicate an unknown status.
The IPAQ score correlated significantly with the energy expenditure and metabolic equivalent (METs) minutes spent onmoderate to vigorous activity following the activity diary and accelerometer. We calculated the calorie expenditure withthe METs, and considered the weight of each subject and the time spent on ‘‘walking’’, ‘‘biking’’ or ‘‘running’’. The METs ofthese activity types that we referred from IPAQ were 3.3 METs, 6 METs and 8 METs respectively.
4.3. Pattern analysis
On the basis of the experimental results, we designed a case study to assess the feasibility of using the ‘‘Automatic ActivityPattern Recognition System and Wellness Self-management Platform’’ to assist in the recording and analysis of physicalactivity patterns. Fig. 6 shows the flowchart of the pilot study.(1) Subject recruitment: we chose 12 subjects from the Department of Family Medicine of National Cheng Kung University
Hospital. All of these eligible subjects conformed to the following requirements: (1) their ages were between 30 and 60;(2) their BMI was not under 23 kg/m2; (3) waist circumference was more than 90 cm in males and more than 80 cm infemales; (4) they had a sedentary lifestyle; (5) they were able to walk without assistance.
Each subject signed a consent form to participate in the trial. During the run-in period of two weeks, the researchersmade telephone calls to subjects to ensure that they understood instructions and they were able to follow theinstructions. Subjects who could not adapt to the smartphone or could not adopt the intervention were excluded. Twosubjects suspended the intervention because they could not adopt the smartphone application and because of personalillness, respectively.
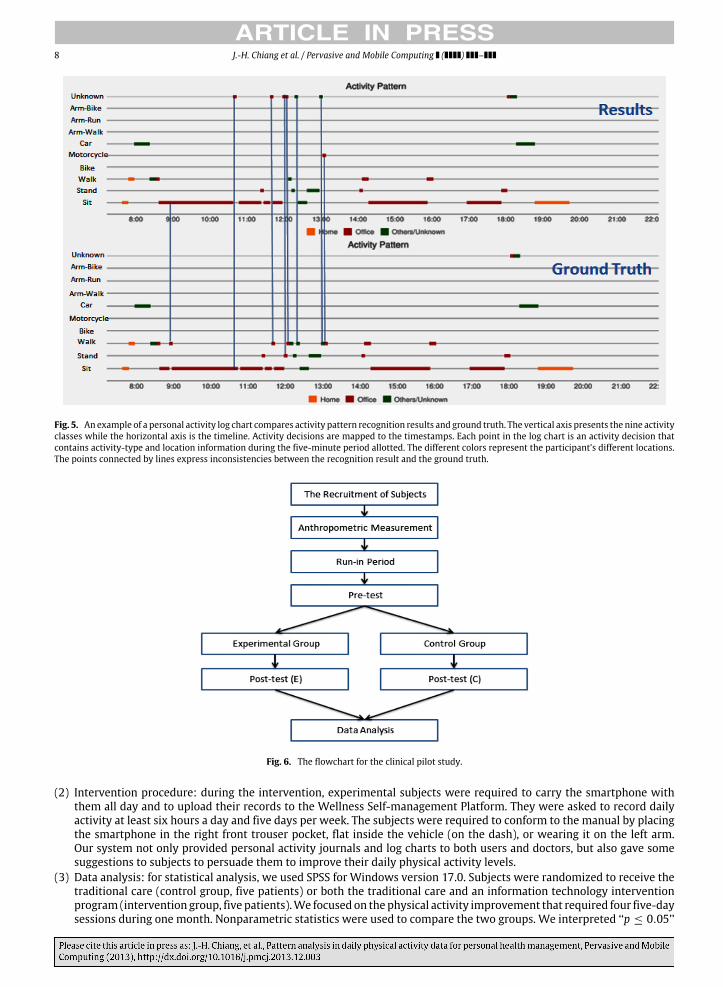
8 J.-H. Chiang et al. / Pervasive and Mobile Computing ( ) –
Fig. 5. An example of a personal activity log chart compares activity pattern recognition results and ground truth. The vertical axis presents the nine activityclasses while the horizontal axis is the timeline. Activity decisions are mapped to the timestamps. Each point in the log chart is an activity decision thatcontains activity-type and location information during the five-minute period allotted. The different colors represent the participant’s different locations.The points connected by lines express inconsistencies between the recognition result and the ground truth.
Fig. 6. The flowchart for the clinical pilot study.
(2) Intervention procedure: during the intervention, experimental subjects were required to carry the smartphone withthem all day and to upload their records to the Wellness Self-management Platform. They were asked to record dailyactivity at least six hours a day and five days per week. The subjects were required to conform to the manual by placingthe smartphone in the right front trouser pocket, flat inside the vehicle (on the dash), or wearing it on the left arm.Our system not only provided personal activity journals and log charts to both users and doctors, but also gave somesuggestions to subjects to persuade them to improve their daily physical activity levels.
(3) Data analysis: for statistical analysis, we used SPSS for Windows version 17.0. Subjects were randomized to receive thetraditional care (control group, five patients) or both the traditional care and an information technology interventionprogram (intervention group, five patients).We focused on the physical activity improvement that required four five-daysessions during one month. Nonparametric statistics were used to compare the two groups. We interpreted ‘‘p ≤ 0.05’’
J.-H. Chiang et al. / Pervasive and Mobile Computing ( ) – 9
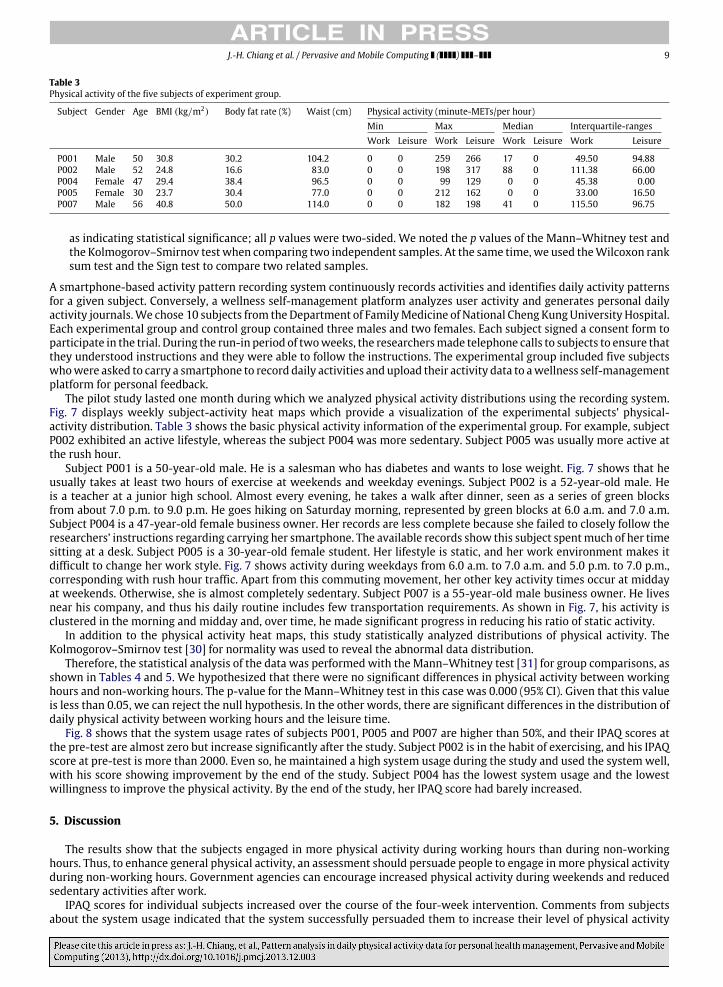
Table 3Physical activity of the five subjects of experiment group.
Subject Gender Age BMI (kg/m2) Body fat rate (%) Waist (cm) Physical activity (minute-METs/per hour)Min Max Median Interquartile-rangesWork Leisure Work Leisure Work Leisure Work Leisure
P001 Male 50 30.8 30.2 104.2 0 0 259 266 17 0 49.50 94.88P002 Male 52 24.8 16.6 83.0 0 0 198 317 88 0 111.38 66.00P004 Female 47 29.4 38.4 96.5 0 0 99 129 0 0 45.38 0.00P005 Female 30 23.7 30.4 77.0 0 0 212 162 0 0 33.00 16.50P007 Male 56 40.8 50.0 114.0 0 0 182 198 41 0 115.50 96.75
as indicating statistical significance; all p values were two-sided. We noted the p values of the Mann–Whitney test andthe Kolmogorov–Smirnov testwhen comparing two independent samples. At the same time, we used theWilcoxon ranksum test and the Sign test to compare two related samples.
A smartphone-based activity pattern recording system continuously records activities and identifies daily activity patternsfor a given subject. Conversely, a wellness self-management platform analyzes user activity and generates personal dailyactivity journals.We chose 10 subjects from theDepartment of FamilyMedicine of National Cheng KungUniversity Hospital.Each experimental group and control group contained three males and two females. Each subject signed a consent form toparticipate in the trial. During the run-in period of twoweeks, the researchersmade telephone calls to subjects to ensure thatthey understood instructions and they were able to follow the instructions. The experimental group included five subjectswhowere asked to carry a smartphone to record daily activities and upload their activity data to awellness self-managementplatform for personal feedback.
The pilot study lasted one month during which we analyzed physical activity distributions using the recording system.Fig. 7 displays weekly subject-activity heat maps which provide a visualization of the experimental subjects’ physical-activity distribution. Table 3 shows the basic physical activity information of the experimental group. For example, subjectP002 exhibited an active lifestyle, whereas the subject P004 was more sedentary. Subject P005 was usually more active atthe rush hour.
Subject P001 is a 50-year-old male. He is a salesman who has diabetes and wants to lose weight. Fig. 7 shows that heusually takes at least two hours of exercise at weekends and weekday evenings. Subject P002 is a 52-year-old male. Heis a teacher at a junior high school. Almost every evening, he takes a walk after dinner, seen as a series of green blocksfrom about 7.0 p.m. to 9.0 p.m. He goes hiking on Saturday morning, represented by green blocks at 6.0 a.m. and 7.0 a.m.Subject P004 is a 47-year-old female business owner. Her records are less complete because she failed to closely follow theresearchers’ instructions regarding carrying her smartphone. The available records show this subject spentmuch of her timesitting at a desk. Subject P005 is a 30-year-old female student. Her lifestyle is static, and her work environment makes itdifficult to change her work style. Fig. 7 shows activity during weekdays from 6.0 a.m. to 7.0 a.m. and 5.0 p.m. to 7.0 p.m.,corresponding with rush hour traffic. Apart from this commuting movement, her other key activity times occur at middayat weekends. Otherwise, she is almost completely sedentary. Subject P007 is a 55-year-old male business owner. He livesnear his company, and thus his daily routine includes few transportation requirements. As shown in Fig. 7, his activity isclustered in the morning and midday and, over time, he made significant progress in reducing his ratio of static activity.
In addition to the physical activity heat maps, this study statistically analyzed distributions of physical activity. TheKolmogorov–Smirnov test [30] for normality was used to reveal the abnormal data distribution.
Therefore, the statistical analysis of the data was performed with the Mann–Whitney test [31] for group comparisons, asshown in Tables 4 and 5. We hypothesized that there were no significant differences in physical activity between workinghours and non-working hours. The p-value for the Mann–Whitney test in this case was 0.000 (95% CI). Given that this valueis less than 0.05, we can reject the null hypothesis. In the other words, there are significant differences in the distribution ofdaily physical activity between working hours and the leisure time.
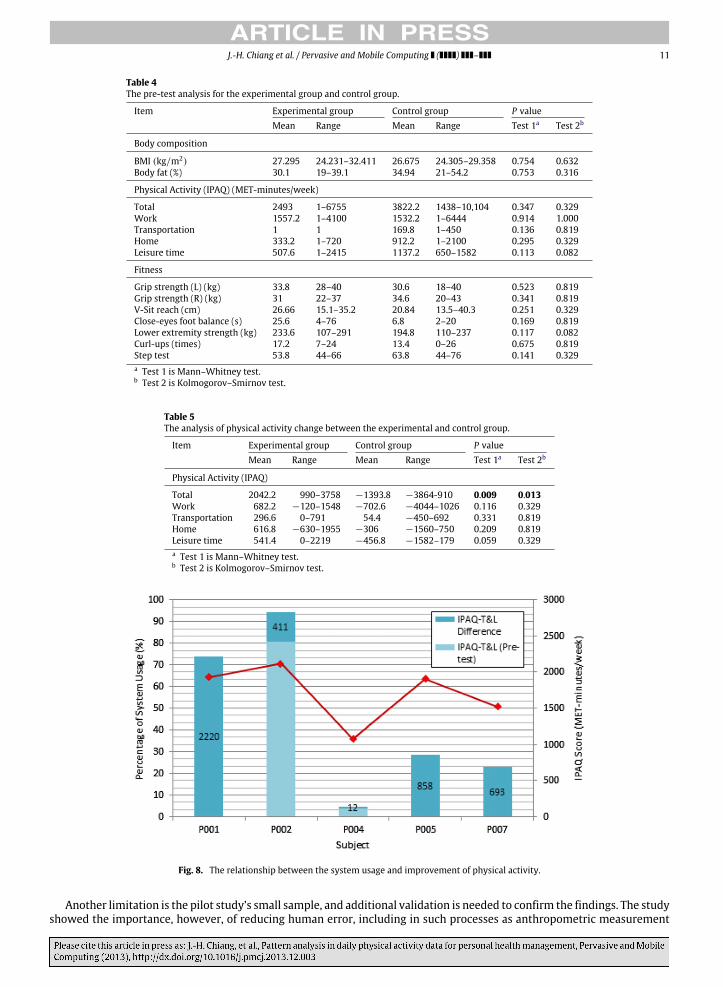
Fig. 8 shows that the system usage rates of subjects P001, P005 and P007 are higher than 50%, and their IPAQ scores atthe pre-test are almost zero but increase significantly after the study. Subject P002 is in the habit of exercising, and his IPAQscore at pre-test is more than 2000. Even so, he maintained a high system usage during the study and used the systemwell,with his score showing improvement by the end of the study. Subject P004 has the lowest system usage and the lowestwillingness to improve the physical activity. By the end of the study, her IPAQ score had barely increased.
5. Discussion
The results show that the subjects engaged in more physical activity during working hours than during non-workinghours. Thus, to enhance general physical activity, an assessment should persuade people to engage inmore physical activityduring non-working hours. Government agencies can encourage increased physical activity during weekends and reducedsedentary activities after work.
IPAQ scores for individual subjects increased over the course of the four-week intervention. Comments from subjectsabout the system usage indicated that the system successfully persuaded them to increase their level of physical activity
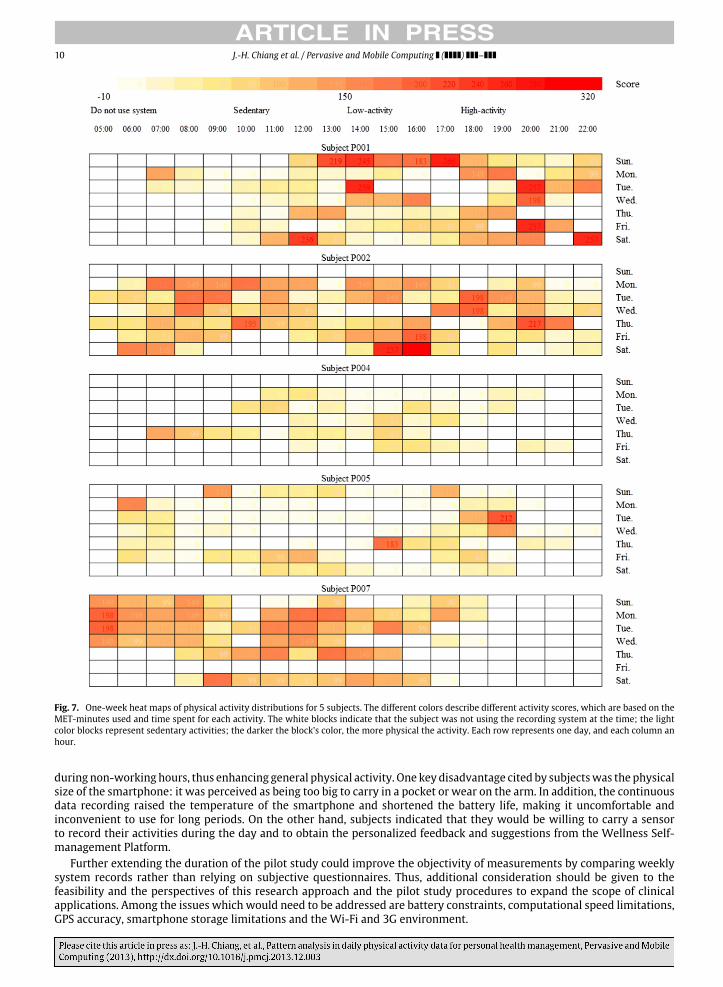
10 J.-H. Chiang et al. / Pervasive and Mobile Computing ( ) –
Fig. 7. One-week heat maps of physical activity distributions for 5 subjects. The different colors describe different activity scores, which are based on theMET-minutes used and time spent for each activity. The white blocks indicate that the subject was not using the recording system at the time; the lightcolor blocks represent sedentary activities; the darker the block’s color, the more physical the activity. Each row represents one day, and each column anhour.
during non-working hours, thus enhancing general physical activity. One key disadvantage cited by subjectswas the physicalsize of the smartphone: it was perceived as being too big to carry in a pocket or wear on the arm. In addition, the continuousdata recording raised the temperature of the smartphone and shortened the battery life, making it uncomfortable andinconvenient to use for long periods. On the other hand, subjects indicated that they would be willing to carry a sensorto record their activities during the day and to obtain the personalized feedback and suggestions from the Wellness Self-management Platform.
Further extending the duration of the pilot study could improve the objectivity of measurements by comparing weeklysystem records rather than relying on subjective questionnaires. Thus, additional consideration should be given to thefeasibility and the perspectives of this research approach and the pilot study procedures to expand the scope of clinicalapplications. Among the issues which would need to be addressed are battery constraints, computational speed limitations,GPS accuracy, smartphone storage limitations and the Wi-Fi and 3G environment.
J.-H. Chiang et al. / Pervasive and Mobile Computing ( ) – 11
Table 4The pre-test analysis for the experimental group and control group.
Item Experimental group Control group P valueMean Range Mean Range Test 1a Test 2b
Body composition
BMI (kg/m2) 27.295 24.231–32.411 26.675 24.305–29.358 0.754 0.632Body fat (%) 30.1 19–39.1 34.94 21–54.2 0.753 0.316
Physical Activity (IPAQ) (MET-minutes/week)
Total 2493 1–6755 3822.2 1438–10,104 0.347 0.329Work 1557.2 1–4100 1532.2 1–6444 0.914 1.000Transportation 1 1 169.8 1–450 0.136 0.819Home 333.2 1–720 912.2 1–2100 0.295 0.329Leisure time 507.6 1–2415 1137.2 650–1582 0.113 0.082
Fitness
Grip strength (L) (kg) 33.8 28–40 30.6 18–40 0.523 0.819Grip strength (R) (kg) 31 22–37 34.6 20–43 0.341 0.819V-Sit reach (cm) 26.66 15.1–35.2 20.84 13.5–40.3 0.251 0.329Close-eyes foot balance (s) 25.6 4–76 6.8 2–20 0.169 0.819Lower extremity strength (kg) 233.6 107–291 194.8 110–237 0.117 0.082Curl-ups (times) 17.2 7–24 13.4 0–26 0.675 0.819Step test 53.8 44–66 63.8 44–76 0.141 0.329a Test 1 is Mann–Whitney test.b Test 2 is Kolmogorov–Smirnov test.
Table 5The analysis of physical activity change between the experimental and control group.
Item Experimental group Control group P valueMean Range Mean Range Test 1a Test 2b
Physical Activity (IPAQ)
Total 2042.2 990–3758 −1393.8 −3864-910 0.009 0.013Work 682.2 −120–1548 −702.6 −4044–1026 0.116 0.329Transportation 296.6 0–791 54.4 −450–692 0.331 0.819Home 616.8 −630–1955 −306 −1560–750 0.209 0.819Leisure time 541.4 0–2219 −456.8 −1582–179 0.059 0.329a Test 1 is Mann–Whitney test.b Test 2 is Kolmogorov–Smirnov test.
Fig. 8. The relationship between the system usage and improvement of physical activity.
Another limitation is the pilot study’s small sample, and additional validation is needed to confirm the findings. The studyshowed the importance, however, of reducing human error, including in such processes as anthropometric measurement
12 J.-H. Chiang et al. / Pervasive and Mobile Computing ( ) –
and questionnaire explanation. The use of the IPAQ questionnaire as the sole criterion of physical activity measurementraises the possibility that the importance of certain influences may have been either under- or overestimated.
6. Conclusions
This research constructed a portable daily physical activity pattern recognition system designed to analyze the user’slevel of daily physical activity through a smartphone-based activity pattern recognition application. Target classes weretaken from the IPAQ questionnaire, a commonly-used physical activity assessment tool, to ensure the reliability of the dailyactivity analysis. The activity-recognition system included three different placement options and nine activities.
During the activity pattern recognition process, we collected accelerometer signals and GPS data from the test subjects’smartphones. Time-domain and frequency-domain accelerometer data features for activity recognition were extracted andselected. The support vector machine was found to provide the best classification results. The POI locations were extractedautomatically from GPS data points after the stay point extraction process. By integrating the results of activity recognitionand the POIs, we generated a personal daily-activity pattern.
The experiments indicated highly accurate activity pattern recognition, not only in estimating the recognition modelthrough cross-validation, but also in a real environment. Results were stored in a server-side database, providing healthcaremanagers and doctors with the access to useful information regarding their patients’ physical activity, allowing themto provide suggestions tailored to the daily activity patterns of specific patients. The pilot study demonstrated that theAutomatic Activity Pattern Recognition Systemand theWellness Self-management Platform can be practically implementedand can provide adequate quantification results.
The research method suffers from certain limitations related to the battery life, computational speed, GPS accuracy,smartphone storage and the Wi-Fi and 3G environment.
We hope the future work will recognize daily routines as a probabilistic combination of activity patterns. Activitypattern recognition could be refined to include many more scenarios by adding the recognition of detailed activity classes,developing a recognition algorithm for the free placement of sensors, or reducing device size to increase flexibility. Toreinforce the human behavior analysis, the POI extraction process could be advanced through improved techniques forGPS and human movement data analysis.
Rapid changes and advances in smartphone technologies provide significant potential for developing smartphone-based applications. Future smartphones may connect users to healthcare centers, allowing healthcare providers to assistoverweight patients or those with metabolic syndrome issues to avert or delay the progression of their conditions. Oncebattery limitations are resolved, the proposed system could provide longitudinal physical activity analysis and an improvedunderstanding of human activity patterns, making it a vital information technology for improving the life quality and safetywhile reducing the risk of chronic disease.
Acknowledgments
The authors wish to thank the Institutional Review Board of National Cheng Kung University Hospital for approving theclinical pilot study in this research (ER-100-082). We are grateful to Dr Yi-Ching Yang and the research assistants at theDepartment of Family Medicine of National Cheng Kung University Hospital, and to all pilot study participants.
References
[1] V. Heywood, Advanced Fitness Assessment and Exercise Prescription, sixth ed., Human Kinetics, 2010.[2] T. Fu, T. Wen, P. Yeh, H. Chang, Costs of metabolic syndrome-related diseases induced by obesity in Taiwan, Obes. Rev. 9 (s1) (2008) 68–73.[3] E. Y. Department of Health, R.O.C. (Taiwan). Cause of death statistics in Taiwan, September 1, 2013. http://www.mohw.gov.tw/cht/DOS/Statistic_P.
aspx?f_list_no=312&fod_list_no=2637&doc_no=13094.[4] J.M. Hollander, J.I. Mechanick, Complementary and alternative medicine and the management of the metabolic syndrome, J. Am. Diet. Assoc. 108 (3)
(2008) 495–509.[5] G.N. Healy, D.W. Dunstan, J. Salmon, E. Cerin, J.E. Shaw, P.Z. Zimmet, N. Owen, Breaks in sedentary time beneficial associations with metabolic risk,
Diabetes Care 31 (4) (2008) 661–666.[6] J.L. Johnson, C.A. Slentz, J.A. Houmard, G.P. Samsa, B.D. Duscha, L.B. Aiken, J.S.McCartney, C.J. Tanner,W.E. Kraus, Exercise training amount and intensity
effects on metabolic syndrome (from studies of a targeted risk reduction intervention through defined exercise), Am. J. Cardiol. 100 (12) (2007)1759–1766.
[7] International Physical Activity Questionnaires, September 1, 2013, http://www.ipaq.ki.se/ipaq.htm.[8] F. Naya, R. Ohmura, F. Takayanagi, H. Noma, K. Kogure, Workers’ routine activity recognition using body movements and location information, in:
10th IEEE International Symposium on Wearable Computers, 2006, pp. 105–108.[9] E. Kim, S. Helal, D. Cook, Human activity recognition and pattern discovery, IEEE Pervasive Comput. 9 (1) (2010) 48–53.
[10] A.M. Khan, Y.K. Lee, S.Y. Lee, Accelerometer’s position free human activity recognition using a hierarchical recognition model, in: 12th IEEEInternational Conference on e-Health Networking Applications and Services, Healthcom, 2010, pp. 296–301.
[11] T. Huynh, M. Fritz, B. Schiele, Discovery of activity patterns using topic models, in: Presented at the Proceedings of the 10th International Conferenceon Ubiquitous Computing, Seoul, Korea, 2008, pp. 10–19.
[12] A.M. Khan, Y.K. Lee, S.Y. Lee, T.S. Kim, Human activity recognition via an accelerometer-enabled-smartphone using kernel discriminant analysis, in:5th International Conference on Future Information Technology, FutureTech, 2010, pp. 1–6.
[13] P. Roy, S. Giroux, B. Bouchard, A. Bouzouane, C. Phua, A. Tolstikov, J. Biswas, Possibilistic behavior recognition in smart homes for cognitive assistance,2010.
[14] A.M. Khan, Y.-K. Lee, S.Y. Lee, T.-S. Kim, A triaxial accelerometer-based physical-activity recognition via augmented-signal features and a hierarchicalrecognizer, IEEE Trans. Inf. Technol. Biomed. 14 (5) (2010) 1166–1172.
J.-H. Chiang et al. / Pervasive and Mobile Computing ( ) – 13
[15] A. Dias, L. Gorzelniak, R.A. Jörres, R. Fischer, G. Hartvigsen, A. Horsch, Assessing physical activity in the daily life of cystic fibrosis patients, PervasiveMob. Comput. (2012) 837–844.
[16] L. Sun, D. Zhang, B. Li, B. Guo, S. Li, Activity recognition on an accelerometer embedded mobile phone with varying positions and orientations,in: Ubiquitous Intelligence and Computing, Springer, 2010, pp. 548–562.
[17] Y.-S. Lee, S.-B. Cho, Activity recognition using hierarchical hidden markov models on a smartphone with 3D accelerometer, in: Hybrid ArtificialIntelligent Systems, Springer, 2011, pp. 460–467.
[18] Z. Zhao, Y. Chen, J. Liu, Z. Shen, M. Liu, Cross-people mobile-phone based activity recognition, in: Twenty-Second International Joint Conference onArtificial intelligence, 2011, pp. 2545–2550.
[19] M.A. Awan, Z. Guangbin, S.-D. Kim, A dynamic approach to recognize activities in WSN, Int. J. Distrib. Sensor Netw. 2013 (2013).[20] E.Martin, V. Shia, P. Yan, P. Kuryloski, E. Seto, V. Ekambaram, R. Bajcsy, Enhancing context awarenesswith activity recognition and radio fingerprinting,
in: IEEE International Conference on Semantic Computing, 2011, pp. 263–266.[21] B. Longstaff, S. Reddy, D. Estrin, Improving activity classification for health applications on mobile devices using active and semi-supervised learning,
in: Proceedings of ICST Conference on Pervasive Computing Technologies for Healthcare, PervasiveHealth, 2010, pp. 1–7.[22] S.L. Lau, K. David, Movement recognition using the accelerometer in smartphones, in: Proceedings of Future Network & Mobile Summit 2010, 2010,
pp. 1–9.[23] M.A. Ayu, T. Mantoro, A.F.A. Matin, S.S.O. Basamh, Recognizing user activity based on accelerometer data from a mobile phone, in: Proceedings of the
IEEE International Symposium on Computers and Informatics, ISCI 2011, 2011, pp. 617–621.[24] C. Nickel, C. Busch, S. Rangarajan, M. Mobius, Using hidden markov models for accelerometer-based biometric gait recognition, in: 7th International
Colloquium on Signal Processing & Its Applications, CSPA 2011, 2011, pp. 58–63.[25] S.A. Ismail, A.F.A.Matin, T. Mantoro, A comparison study of classifier algorithms formobile-phone’s accelerometer based activity recognition, Procedia
Eng. 41 (2012) 224–229.[26] P. Dollár, V. Rabaud, G. Cottrell, S. Belongie, Behavior recognition via sparse spatio-temporal features, in: 2nd Joint IEEE International Workshop on
Visual Surveillance and Performance Evaluation of Tracking and Surveillance, 2005, pp. 65–72.[27] Z.-C. Luo, The Development of Activity Recognition System Using the Smartphone with Accelerometer, Institute of Medical Informatics, National
Cheng Kung University, Tainan, Taiwan, 2010.[28] D. Figo, P.C. Diniz, D.R. Ferreira, J.M. Cardoso, Preprocessing techniques for context recognition from accelerometer data, Pers. Ubiquitous Comput. 14
(7) (2010) 645–662.[29] J. MacQueen, Some methods for classification and analysis of multivariate observations, in: L. Le Cam, J. Neyman (Eds.), Proceedings 5th Berkeley
Symposium on Mathematical Statistics and Probability, University of California Press, Berkeley, 1967, pp. 281–297.[30] M. Hazewinkel, Kolmogorov–Smirnov test, in: Encyclopedia of Mathematics, Springer, 2001.[31] M. Neuhäuser, Wilcoxon–Mann–Whitney test, in: M. Lovric (Ed.), International Encyclopedia of Statistical Science, Springer, Berlin Heidelberg, 2011,
pp. 1656–1658.