Patients who leave without being seen in emergency departments: an analysis of predictive factors...
9
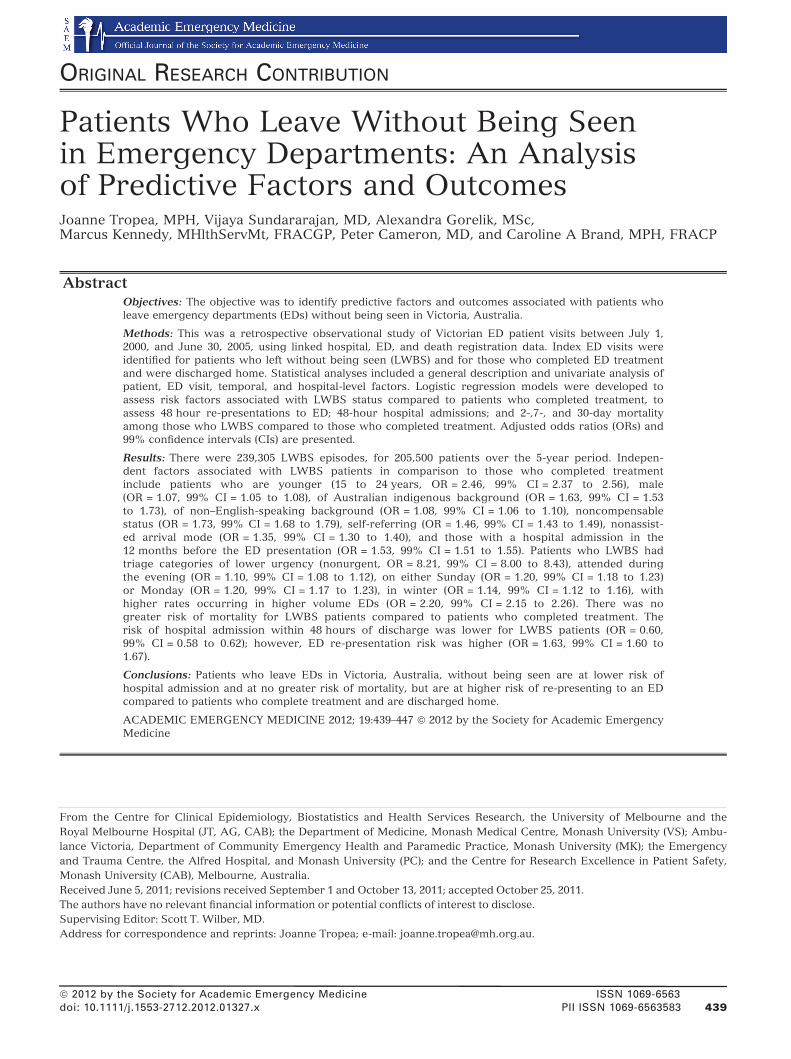
ORIGINAL RESEARCH CONTRIBUTION Patients Who Leave Without Being Seen in Emergency Departments: An Analysis of Predictive Factors and Outcomes Joanne Tropea, MPH, Vijaya Sundararajan, MD, Alexandra Gorelik, MSc, Marcus Kennedy, MHlthServMt, FRACGP, Peter Cameron, MD, and Caroline A Brand, MPH, FRACP Abstract Objectives: The objective was to identify predictive factors and outcomes associated with patients who leave emergency departments (EDs) without being seen in Victoria, Australia. Methods: This was a retrospective observational study of Victorian ED patient visits between July 1, 2000, and June 30, 2005, using linked hospital, ED, and death registration data. Index ED visits were identified for patients who left without being seen (LWBS) and for those who completed ED treatment and were discharged home. Statistical analyses included a general description and univariate analysis of patient, ED visit, temporal, and hospital-level factors. Logistic regression models were developed to assess risk factors associated with LWBS status compared to patients who completed treatment, to assess 48 hour re-presentations to ED; 48-hour hospital admissions; and 2-,7-, and 30-day mortality among those who LWBS compared to those who completed treatment. Adjusted odds ratios (ORs) and 99% confidence intervals (CIs) are presented. Results: There were 239,305 LWBS episodes, for 205,500 patients over the 5-year period. Indepen- dent factors associated with LWBS patients in comparison to those who completed treatment include patients who are younger (15 to 24 years, OR = 2.46, 99% CI = 2.37 to 2.56), male (OR = 1.07, 99% CI = 1.05 to 1.08), of Australian indigenous background (OR = 1.63, 99% CI = 1.53 to 1.73), of non–English-speaking background (OR = 1.08, 99% CI = 1.06 to 1.10), noncompensable status (OR = 1.73, 99% CI = 1.68 to 1.79), self-referring (OR = 1.46, 99% CI = 1.43 to 1.49), nonassist- ed arrival mode (OR = 1.35, 99% CI = 1.30 to 1.40), and those with a hospital admission in the 12 months before the ED presentation (OR = 1.53, 99% CI = 1.51 to 1.55). Patients who LWBS had triage categories of lower urgency (nonurgent, OR = 8.21, 99% CI = 8.00 to 8.43), attended during the evening (OR = 1.10, 99% CI = 1.08 to 1.12), on either Sunday (OR = 1.20, 99% CI = 1.18 to 1.23) or Monday (OR = 1.20, 99% CI = 1.17 to 1.23), in winter (OR = 1.14, 99% CI = 1.12 to 1.16), with higher rates occurring in higher volume EDs (OR = 2.20, 99% CI = 2.15 to 2.26). There was no greater risk of mortality for LWBS patients compared to patients who completed treatment. The risk of hospital admission within 48 hours of discharge was lower for LWBS patients (OR = 0.60, 99% CI = 0.58 to 0.62); however, ED re-presentation risk was higher (OR = 1.63, 99% CI = 1.60 to 1.67). Conclusions: Patients who leave EDs in Victoria, Australia, without being seen are at lower risk of hospital admission and at no greater risk of mortality, but are at higher risk of re-presenting to an ED compared to patients who complete treatment and are discharged home. ACADEMIC EMERGENCY MEDICINE 2012; 19:439–447 ª 2012 by the Society for Academic Emergency Medicine ª 2012 by the Society for Academic Emergency Medicine ISSN 1069-6563 doi: 10.1111/j.1553-2712.2012.01327.x PII ISSN 1069-6563583 439 From the Centre for Clinical Epidemiology, Biostatistics and Health Services Research, the University of Melbourne and the Royal Melbourne Hospital (JT, AG, CAB); the Department of Medicine, Monash Medical Centre, Monash University (VS); Ambu- lance Victoria, Department of Community Emergency Health and Paramedic Practice, Monash University (MK); the Emergency and Trauma Centre, the Alfred Hospital, and Monash University (PC); and the Centre for Research Excellence in Patient Safety, Monash University (CAB), Melbourne, Australia. Received June 5, 2011; revisions received September 1 and October 13, 2011; accepted October 25, 2011. The authors have no relevant financial information or potential conflicts of interest to disclose. Supervising Editor: Scott T. Wilber, MD. Address for correspondence and reprints: Joanne Tropea; e-mail: [email protected].
Transcript of Patients who leave without being seen in emergency departments: an analysis of predictive factors...
ORIGINAL RESEARCH CONTRIBUTION
Patients Who Leave Without Being Seenin Emergency Departments: An Analysisof Predictive Factors and OutcomesJoanne Tropea, MPH, Vijaya Sundararajan, MD, Alexandra Gorelik, MSc,Marcus Kennedy, MHlthServMt, FRACGP, Peter Cameron, MD, and Caroline A Brand, MPH, FRACP
AbstractObjectives: The objective was to identify predictive factors and outcomes associated with patients wholeave emergency departments (EDs) without being seen in Victoria, Australia.
Methods: This was a retrospective observational study of Victorian ED patient visits between July 1,2000, and June 30, 2005, using linked hospital, ED, and death registration data. Index ED visits wereidentified for patients who left without being seen (LWBS) and for those who completed ED treatmentand were discharged home. Statistical analyses included a general description and univariate analysis ofpatient, ED visit, temporal, and hospital-level factors. Logistic regression models were developed toassess risk factors associated with LWBS status compared to patients who completed treatment, toassess 48 hour re-presentations to ED; 48-hour hospital admissions; and 2-,7-, and 30-day mortalityamong those who LWBS compared to those who completed treatment. Adjusted odds ratios (ORs) and99% confidence intervals (CIs) are presented.
Results: There were 239,305 LWBS episodes, for 205,500 patients over the 5-year period. Indepen-dent factors associated with LWBS patients in comparison to those who completed treatmentinclude patients who are younger (15 to 24 years, OR = 2.46, 99% CI = 2.37 to 2.56), male(OR = 1.07, 99% CI = 1.05 to 1.08), of Australian indigenous background (OR = 1.63, 99% CI = 1.53to 1.73), of non–English-speaking background (OR = 1.08, 99% CI = 1.06 to 1.10), noncompensablestatus (OR = 1.73, 99% CI = 1.68 to 1.79), self-referring (OR = 1.46, 99% CI = 1.43 to 1.49), nonassist-ed arrival mode (OR = 1.35, 99% CI = 1.30 to 1.40), and those with a hospital admission in the12 months before the ED presentation (OR = 1.53, 99% CI = 1.51 to 1.55). Patients who LWBS hadtriage categories of lower urgency (nonurgent, OR = 8.21, 99% CI = 8.00 to 8.43), attended duringthe evening (OR = 1.10, 99% CI = 1.08 to 1.12), on either Sunday (OR = 1.20, 99% CI = 1.18 to 1.23)or Monday (OR = 1.20, 99% CI = 1.17 to 1.23), in winter (OR = 1.14, 99% CI = 1.12 to 1.16), withhigher rates occurring in higher volume EDs (OR = 2.20, 99% CI = 2.15 to 2.26). There was nogreater risk of mortality for LWBS patients compared to patients who completed treatment. Therisk of hospital admission within 48 hours of discharge was lower for LWBS patients (OR = 0.60,99% CI = 0.58 to 0.62); however, ED re-presentation risk was higher (OR = 1.63, 99% CI = 1.60 to1.67).
Conclusions: Patients who leave EDs in Victoria, Australia, without being seen are at lower risk ofhospital admission and at no greater risk of mortality, but are at higher risk of re-presenting to an EDcompared to patients who complete treatment and are discharged home.
ACADEMIC EMERGENCY MEDICINE 2012; 19:439–447 ª 2012 by the Society for Academic EmergencyMedicine
ª 2012 by the Society for Academic Emergency Medicine ISSN 1069-6563doi: 10.1111/j.1553-2712.2012.01327.x PII ISSN 1069-6563583 439
From the Centre for Clinical Epidemiology, Biostatistics and Health Services Research, the University of Melbourne and theRoyal Melbourne Hospital (JT, AG, CAB); the Department of Medicine, Monash Medical Centre, Monash University (VS); Ambu-lance Victoria, Department of Community Emergency Health and Paramedic Practice, Monash University (MK); the Emergencyand Trauma Centre, the Alfred Hospital, and Monash University (PC); and the Centre for Research Excellence in Patient Safety,Monash University (CAB), Melbourne, Australia.Received June 5, 2011; revisions received September 1 and October 13, 2011; accepted October 25, 2011.The authors have no relevant financial information or potential conflicts of interest to disclose.Supervising Editor: Scott T. Wilber, MD.Address for correspondence and reprints: Joanne Tropea; e-mail: [email protected].
P atients who arrive at emergency departments(EDs) but leave before treatment are an importantmarker of the quality of emergency care, in terms
of both access to care and the process of care. In theAustralian state of Victoria, the 2004 Auditor-General’sOffice report of metropolitan hospitals indicates that,depending on the specific hospital, up to 10% of EDpresentations did not wait for treatment, and this per-centage appears to be increasing in some larger metro-politan EDs.1 These figures underline the importance ofa more detailed understanding of patients who leavewithout being seen (LWBS) for quality improvementinitiatives to be implemented effectively.
A literature review indicates there is a limited evi-dence base about patients who LWBS,2 and that tempo-ral factors, as simple as time of presentation, ratherthan complex social characteristics, may be the reasonfor higher rates of patients leaving before treatment.2,3
Many studies, including an Australian study, havefound that almost half of the patients who LWBS do sobecause of time delay, and most would have stayed ifthe waiting time was shorter.4–6
There is also limited information regarding outcomesassociated with LWBS. Two North American studiesfound that patients who did not wait for treatmentreported their pain or condition to be worse than thosewho had received treatment in the ED.6,7 However, the30-day mortality rate from an Australian study was sig-nificantly lower among those who did not wait (0.14%),compared to those seen in the ED (0.20%, p < 0.001).8
Patients who LWBS do appear to return for care,with one study reporting that 70% of those who LWBSsought medical care within 24 hours of leaving the ED.4
Similarly, other studies have indicated that more than aquarter of these patients did return to the ED within14 days, and perhaps as many as 11% required hospi-talization during the following week after their initialLWBS visit.6,9
Additionally, the evidence base is limited by the het-erogeneity of study methods employed in studies ofLWBS. Ideally, for epidemiologic purposes, study meth-ods should facilitate capture of the whole patient popu-lation. However, most LWBS studies rely on localobservational data or self-reported data, which maylimit their generalizability.
An alternative data source that offers the whole ofpopulation data is routinely collected coded hospital dis-charge data. In Victoria, data pertaining to public hospitalED presentations and hospital admissions are collectedwithin the Victorian Emergency Minimum Dataset (VEMD)and the Victorian Admitted Episodes Dataset (VAED).
The aims of this study were to identify factors associ-ated with patients who present to public hospital EDsin the state of Victoria, Australia, but do not wait to beseen, and to evaluate subsequent outcomes for thesepatients in comparison to those who complete their EDcare and are discharged home.
METHODS
Study DesignThis was a retrospective observational study of publichospital ED presentations in the Australian state of
Victoria. This study was approved by the HumanResearch Ethics Committee Melbourne Health and theVictorian Department of Human Services ⁄ Health.
Study Setting and PopulationData Source. All residents in Australia have freeaccess to publicly funded hospitals and may also chooseto have private insurance for care in private hospitals.More than five million people reside in Victoria, thesecond-largest state in Australia.
In Victoria, data pertaining to public hospital ED pre-sentations and hospital admissions are collected withinthe VEMD and the VAED by the Victorian Departmentof Health. These have been developed to meet nationalreporting obligations, to support output-based funding,and for epidemiologic surveillance.
The VAED is based on hospital inpatient episodedata, and the VEMD includes data from Victorian pub-lic hospitals with an ED. Patients who present and aretreated within Victorian EDs have their treatment costscovered by the national medical insurance system,Medicare, or by other compensation schemes such asWorkcover, Transport Accident Commission, or Vet-eran’s Affairs. The VAED and VEMD contain demo-graphic and clinical information on each episode ofpatient care, with the clinical information coded in theformat of the International Statistical Classification ofDiseases and Related Health Problems, 10th Revision,Australian Modification (ICD-10-AM) beginning on July1, 1998. The VEMD has an abridged set of diagnosticcodes10,11 for completed episodes. Reasons for presen-tations are documented as qualitative data and werenot provided for analysis in the current data set. Thedata are subject to checks for data integrity. Victoriandeath certificate data are maintained by the Registry ofBirths, Deaths and Marriages in the State of Victoriaand is a record of all certified deaths.12
Data from the VAED and the VEMD are linked toVictorian Death Certificate data.13 The data are linkedat the Victorian Department of Health. Linkage staff usea mix of probabilistic and stepwise deterministic link-age based on a series of identifying variables. Whenthese data are released for research use, they includean encrypted linkage ID that groups ED visits, hospital-izations, and death information to a specific case group,but no identifying variables. An encrypted, derived‘‘ID’’ variable, which crosses the data sets, serves tobring together records from the same case. The linkagestaff assess data quality by a series of internal logicchecks and manual review of randomly selected casegroups. The false-positive rate is estimated to be lessthan 5%, within each case group.
Study ProtocolThe time period for the analysis was from July 1, 2000,to June 30, 2005. We chose to use the patient as theunit of analysis. Patients who left at their own riskbefore treatment were classified as ‘‘left without beingseen’’ (LWBS), based on their ED record (‘‘departurestatus’’ variable) in the VEMD. We created an ‘‘indexED visit’’ variable for each patient: the first LWBS EDpresentation was taken as the index ED visit for eachLWBS patient.
440 Tropea et al. • COMPREHENSIVE ANALYSIS OF VICTORIAN LWBS PATIENTS

The comparison group includes patients who pre-sented to Victorian EDs on one or more occasions andhad no visit for which they LWBS. The first ED visit inwhich treatment was completed and the patient wasdischarged home was defined as the index visit.
Patients who were dead on arrival or who left at ownrisk after treatment started were removed from theanalysis. In addition, patients who were triage categoryresuscitation (triage category 1) or emergency (triagecategory 2) were excluded, as there were very smallnumbers in the data set associated with LWBS, causedconsiderable skewing of data, and did not influenceoutcomes based on preliminary analysis. Patients whowere not discharged home were excluded as they wereconsidered a noncomparable group.
Key outcome measures were re-presentations to EDand admission to hospital within 48 hours, and 2-, 7-,and 30-day mortality. Patient-level factors included age,sex, socioeconomic status (SES), English-speakingcountry of birth (COB), indigenous background, referralsource (self-referred or health professional referred),compensable status (patient entitled to payment forinjury ⁄ illness for which the patient is receiving careother than by the national Medicare insurance scheme),mode of arrival (assisted transport such as arrival byambulance service or police vehicle, compared to non-assisted arrival), and hospital admission in the12 months before ED visit. Factors associated with theED visit included triage category, time of day, day ofweek, season of year, and financial year. Hospital-levelfactors included the volume of patients presenting tothe ED and median wait times. ED wait times for LWBSpatients were defined as the interval between the docu-mented arrival time and departure time and for com-pleted patients was defined as the interval betweenarrival time and time seen by a doctor or nurse if a doctorwas not seen.
Socioeconomic status was estimated using the Indexof Economic Resources (IER) of the Socio-EconomicIndexes for Areas (SEIFA) based on 2006 census dataof the Australian Bureau of Statistics based on place ofresidence.14 The IER is a composite of income, sizeof homes, and proportion of home ownership in a sta-tistical local area, of which Victoria has about 200.A dichotomous variable was generated from the IER,reflecting those in the lowest quartile on the IER incomparison with the top three quartiles. For qualityassurance, age, sex, and triage category were analyzedby year during the study period to assess for year-to-year variability and were found to be stable.
Data AnalysisThe statistical analysis consisted of three parts: adescriptive univariate analysis of those who LWBS,including patient-level characteristics such as age, sex,SES, and number of hospital admissions in previous12 months; ED visit characteristics such as triage status,time of day, day of week, season, and financial year;and hospital-level characteristics such as size of campus(based on volume of patients who attend the ED). Allcategorical data were analyzed using the chi-squaretest, and continuous data were analyzed using a t-test.The Wilcoxon signed-rank test was used to assess
differences in median wait times in the ED between thegroups.
A logistic regression model was fitted to assess riskfactors associated with patients who LWBS in com-parison to those who completed treatment and toassess the risk conferred by LWBS to re-presentationsto ED; admission to hospital within 48 hours; and 2-,7-, and 30-day mortality. All variables of interest wereincluded in the models as they were consideredpotentially significant to outcomes of interest anddemonstrated statistically significant differences ofp < 0.001 between groups in the univariate analysis.All variables were assessed for collinearity. Thereference group for variables with multiple categorieswas determined by the category with the lowest pro-portion of LWBS ED visits. The logistic regressionanalysis was evaluated using the receiver operatingcharacteristics (ROC) curve.
In view of the large data set and multiple compari-sons, the level of significance was set at p < 0.0001(99% confidence intervals [CIs]) to signify statistical sig-nificance for identified differences. Data analysis wasperformed using SAS 9.2 (SAS Institute, Cary, NC).
RESULTS
General DescriptionA total of 5,083,050 VEMD episodes of care occurredamong 2,267,523 patients during the period from July 1,2000, to June 30, 2005 (Figure 1). Once episodes withmissing data, those associated with triage category 1 or2, and those associated with hospital admission wereremoved, a final data set of 1,829, 854 individual patientED visits was identified for further analysis. Of these,205,500 (11.2%) were LWBS and 1,624,354 (88.8%) werecompleted patient index visits.
Ninety percent (n = 184,809) of those who LWBS didso on one occasion only over the 5 years, compared to62.7% (n = 101,7987) of those who completed treatment.Of those who had multiple ED presentations, 7.7%(n = 15,877) of LWBS patients did so on two occasions,1.4% (n = 2,917) on three occasions, and the remaining1% on four or more occasions (range = 4 to 135episodes).
Table 1 outlines the patient-level characteristics ofthe total patient population, comparing those whoLWBS to those who completed treatment. Those whoLWBS tended to be younger patients, with the highestnumbers occurring among those 15 to 24 years in age(20.1%, p < 0.0001), followed by those 25 to 34 years old(18.7%, p < 0.0001). Those aged 65 years and over hadthe smallest number of patients who LWBS (5.9%,p < 0.0001). In all, 50.2% of those who LWBS wereunder the age of 25, and 10.9% were aged 55 years andover, whereas among those who completed treatment,41.9% were under the age of 25, and 19.32% were overthe age of 55.
There were higher proportions of patients of an Aus-tralian indigenous background (1.02% LWBS vs. 0.67%completed, p < 0.0001) and patients who had had a hos-pital admission in the 12 months prior to the index EDvisit (45.1% LWBS vs. 38.6% completed p < 0.0001).A high proportion of both patient groups were of
ACADEMIC EMERGENCY MEDICINE • April 2012, Vol. 19, No. 4 • www.aemj.org 441

English-speaking COB, and most patients from bothgroups were male. However, higher proportions ofpatients who completed treatment compared to thosewho LWBS arrived by assisted transport (68.1% vs.64.2% completed, p < 0.0001), were compensable (7.5%vs. 3.5% completed, p < 0.0001) and did not self-refer tothe ED (13.5% vs. 9.1% completed, p < 0.0001). The twosocioeconomic variables were associated with varyingresults, with those who LWBS having a higher percent-age of disadvantage for the SEIFA Index of Educationand Occupation (27.1% LWBS vs. 25.0% completed,p < 0.0001), but a lower percentage for the SEIFA IER(5.1% LWBS vs. 7.1% completed, p < 0.0001).
Patients who presented to the ED during either thenight or the morning shift waited less time compare tothose presented between 7 PM and midnight(p < 0.0001). Almost half of the LWBS episodesoccurred between five in the evening and midnight,and close to 20% occurred on a Sunday (Table 2). Thehighest proportion of LWBS ED visits occurred in win-ter (27.0%), followed by spring (25.8%). The proportion
of LWBS ED visits has remained similar over the 5-yearstudy period.
Patients who LWBS had significantly less urgent tri-age categories designated than those in which treat-ment was completed (p < 0.001), with 26.4% of thosewho completed treatment being designated triage cate-gory 3 ‘‘urgent,’’ compared to 6.3% LWBS. However,almost two-thirds (n = 130,202; 63.4%) of LWBS ED vis-its were designated triage category 4 ‘‘semiurgent,’’compared to 54.7% of completed ED visits and 30.3%LWBS compared to 18.8% completed with triagecategory 5 ‘‘nonurgent.’’
At the hospital level, the larger the campus size(higher volume EDs), the greater the proportion ofLWBS ED visits. On average, those who LWBS had sig-nificantly greater waiting times than those who com-pleted treatment; this was seen across all triagecategories, campus sizes, and financial years (Table 3).There was within-campus category variability for med-ian ED wait times. For example, within campus cate-gory 1 (busiest EDs), the overall median wait times
5,083,050 episodes2,267,523 patients
LWBS: 239,305 episodes
Seen: 4,240,805 episodes
238,796 episodes 2,965,844 episodes
205,500 LWBS index
ED visits
Final data set: 1,829,854
patient index ED visits
1,624,354 completed
patient index ED visits
Total ED episodes 5,083,436
Exclusion: missing data, sex = 3, time error (e.g. dep< arr), (LWBS=1 and triage=death on arrival): N= 386
Exclusion: episodes with triage category 1, 2 or patients not discharged home N=1,274,961
Exclusion:episodes with triage category 1, 2 N=509
Figure 1. Summary of the data extraction process. LWBS = left without being seen.
442 Tropea et al. • COMPREHENSIVE ANALYSIS OF VICTORIAN LWBS PATIENTS

which included LWBS and completed treatment EDvisits ranged from 22 minutes (interquartile range[IQR] = 7 to 61) to 51 minutes (IQR = 23 to 113).
Adjusted Risk Factors Associated With LWBS(Table 4)The univariate analysis indicated statistically significantgroup differences for all variables (p < 0.0001). Correla-tions between the variables were not meaningful(range = )0.06 to 0.04), indicating no collinearity. Onceadjusted, those at risk of LWBS were younger patients,with highest risk occurring in the 15 to 24 years andunder 5 year old age groups. Males, patients of non–English-speaking COB, indigenous background, thosewho self-referred to the ED, noncompensable patients,those who did not arrive by assisted transport, andthose who had a hospital admission in the 12 monthsprior to the ED visit were also at greater risk of LWBS.
Other LWBS predictive factors include patients whopresented with conditions of lower urgency, those whoarrived between 5 PM and midnight, on a Sunday orMonday, during the winter or spring seasons, and athospital EDs with greater patient volumes. The areaunder the ROC curve for the logistic regression analysiswas 0.72, indicating moderate to good fit of items.
Adjusted Risk of Death, 48-Hour ED Re-presentation,and 48-Hour Hospital Admission for Those WhoLWBS (Table 5)There were no differences identified in mortality out-comes between LWBS and completed patients oncedata were adjusted for all other variables. There was alower risk of hospital admission in the 48 hours follow-ing discharge (adjusted odds ratio [OR] = 0.60,p < 0.0001). However, a higher proportion of those whoLWBS re-presented to an ED within 48 hours of theirLWBS episode, compared to those who completedtreatment (adjusted OR = 1.63, p < 0.0001). When triagecategories for re-presenting patients were analyzed, theproportion of death or urgent triage categories (resus-citation, emergency, or urgent) was nearly two-thirdsthat of the completed patient group (18.1% LWBS vs.28.8% completed). However, 21.1% of LWBS patientsre-presented to ED with a higher triage category thanthey had at their index ED visit and 5.8% with thelower triage category. This is significantly higher com-pared to the completed patient group where 6.2%re-presented with a higher triage category and 3.7%with a lower triage category (p < 0.0001).
DISCUSSION
To the best of our knowledge this study is the largestand most comprehensive analysis of LWBS patientswithin the Australian state of Victoria, and the findingsare relevant to other Australian and international juris-dictions seeking to improve ED performance. Our studyhas identified new findings. Patients who were of non-compensable status and those who had had a hospitaladmission in the 12 months prior to their ED presenta-tion were at greater risk of LWBS. In addition, unlikemost other studies, we have presented patient riskrather than episode risk, which is potentially con-founded by patients having multiple episodes.
Our study confirms a number of findings from otherresearch in this area. Like other studies, we found thatpatients who LWBS present with conditions of lowerurgency, are more likely to be younger patients, to bemale, to have arrived without assisted transport, tohave self-referred, to be of indigenous Australian back-ground, to be from non–English-speaking backgrounds,and to have arrived in the evening.2,15–17 The relation-ship of LWBS with indigenous status is important.Based on data from the Australian Bureau of Statistics,Victoria has a low level of indigenous population com-pared to the overall data for Australia;18 however, theissues contributing to higher risk of LWBS for thispatient population will need further exploration to tailoreffective interventional strategies.
We also found that hospitals with longer average EDwaiting times tended to be larger hospitals and havehigher proportions of LWBS episodes. However, unlikeother studies, we found that there was no difference inSES and that those who LWBS were less likely to be oflower SES.2,16 We used the SEIFA IER and the SEIFAIndex of Education and Occupation, whereas Mohsin etal.,16 who found an association with lower SES, usedthe SEIFA index of relative socioeconomic disadvan-tage. The SEIFA indices measure at an area level and
Table 1Characteristics of Patients Who LWBS Compared to Those WhoCompleted Treatment Based on Index Visit Data
Characteristic
LWBS Patients,n = 205,500
(11.2%)
CompletedPatients,
n = 1,624,354(88.8%)
Age group (yr)0–4 37,124 (18.07) 204,713 (12.60)5–14 24,650 (12.00) 201,497 (12.40)15–24 41,365 (20.13) 274,791 (16.92)25–34 38,394 (18.68) 271,897 (16.74)35–44 25,081 (12.20) 202,733 (12.48)45–54 16,533 (8.05) 154,772 (9.53)55–64 10,170 (4.95) 116,697 (7.18)65–74 6,808 (3.31) 93,907 (5.78)>74 5,375 (2.62) 103,347 (6.36)
SexFemale 97,361 (47.38) 788,232 (48.53)Male 108,180 (52.62) 836,122 (51.47)
SES (lowest quartile:disadvantaged)SEIFA Index ofEducation andOccupation
55,710 (27.11) 406,339 (25.02)
SEIFA IER 10,437 (5.08) 115,659 (7.12)English-speakingCOB
165,810 (80.69) 1,307,089 (80.47)
Indigenous background 2,097 (1.02) 10,942 (0.67)Referred by self 186,858 (90.90) 1,404,759 (86.48)Compensable 7,179 (3.49) 121,397 (7.47)Arrived by assistedtransport
131,924 (64.20) 1,105,736 (68.07)
Hospital admissionin 12 months priorto index episode
92,768 (45.14) 626,817 (38.59)
Data are reported as n (%).COB = country of birth; IER = Index of Economic Resources;LWBS = left without being seen by physician; SES = socio-economic status; SEIFA = Socio-Economic Indexes for Areas.
ACADEMIC EMERGENCY MEDICINE • April 2012, Vol. 19, No. 4 • www.aemj.org 443

therefore may not apply to all individuals living withinan area. Each of the SEIFA indices ‘‘… summarise dif-ferent aspects of the socioeconomic conditions of peo-ple living in an area …’’ and are derived from a
different set of social and economic information fromthe national census.14 Therefore, the differences in ourfindings may be due to methodologic heterogeneityin choice of socioeconomic indices and our use of
Table 2Summary of Characteristics for LWBS Patients and Patients Who Complete Treatment and Are Discharged From ED After an IndexVisit
Characteristic
Patient ED Index Visits (N = 1,829,854)*
Number of LWBSPatients (% of
LWBS Patients)
Number of PatientsCompleted Treatment
(% of Patients Completed Treatment)Total Patients
(% All ED Patients)
Triage category3: urgent 13,014 (6.33) 428,930 (26.41) 441,944 (24.15)4: semiurgent 130,202 (63.36) 889,223 (54.74) 1,019,425 (55.71)5: nonurgent 62,284 (30.31) 306,201 (18.85) 368,485 (20.14)
Time of day08:00–16:59 71,873 (34.97) 797,379 (49.09) 869,252 (47.5)17:00–23:59 97,515 (47.45) 590,210 (36.34) 687,725 (37.58)Overnight 36,112 (17.57) 236,765 (14.58) 272,877 (14.91)
Campus1 large 89,073 (43.34) 534,685 (32.92) 623,758 (34.09)2 medium 78,999 (38.44) 647,262 (39.85) 726,261 (39.69)3 small 20,189 (9.82) 251,122 (15.46) 271,311 (14.83)4 very small 17,239 (8.39) 191,285 (11.78) 208,524 (11.40)
Day of the weekMonday 32,094 (15.62) 231,753 (14.27) 263,847 (14.42)Tuesday 26,135 (12.72) 214,501 (13.21) 240,636 (13.15)Wednesday 24,704 (12.02) 210,431 (12.95) 235,135 (12.85)Thursday 24,207 (11.78) 209,969 (12.93) 234,176 (12.80)Friday 25,470 (12.39) 216,547 (13.33) 242,017 (13.23)Saturday 32,202 (15.67) 259,454 (15.97) 291,656 (15.94)Sunday 40,688 (19.8) 281,699 (17.34) 322,387 (17.62)
SeasonWinter 55,494 (27.00) 405,829 (24.98) 461,323 (25.21)Spring 53,029 (25.80) 405,478 (24.96) 458,507 (25.06)Summer 48,600 (23.65) 411,858 (25.36) 460,458 (25.16)Autumn 48,377 (23.54) 401,189 (24.70) 449,566 (24.57)
Financial year2000–01 41,308 (20.10) 384,427 (23.67) 425,735 (23.27)2001–02 41,607 (20.25) 330,845 (20.37) 372,452 (20.35)2002–03 43,484 (21.16) 303,266 (18.67) 346,750 (18.95)2003–04 37,948 (18.47) 310,164 (19.09) 348,112 (19.02)2004–05 41,153 (20.03) 295,652 (18.20) 336,805 (18.41)
*The number of patient index ED visits equals the number of patients.LWBS = left without being seen by physician.
Table 3A Summary of Total ED Episodes, LWBS Patients, and Patients’ Completed Treatment Index ED Visits by Campus Size and TheirRespective Waiting Times
Campus size�
Median Time (Minutes) Waited in ED (IQR)
Total EDEpisodes�
(N = 5,083,054)
Patient Index ED Visits*
LWBS(n = 205,500)
CompletedTreatment
(n = 1,624,354)Total
(n = 1,829,854)
1 large (>200,000) 33 (13–82) 113 (59–189) 40 (8–89) 47 (20–105)2 medium (150,001–200,000) 32 (13–75) 92 (44–159) 39 (18–85) 43 (19–94)3 small (100,000–150,000) 23 (10–49) 84 (43–143) 27 (13–54) 29 (14–59)4 very small (<100,000) 25 (10–57) 76 (38–132) 25 (10–58) 28 (10–63)
*The number of patient index ED visits equals the number of patients.�Campus size is based on volume of ED presentations.�ED episodes includes patients who may have had multiple visits.IQR = interquartile range; LWBS = left without being seen.
444 Tropea et al. • COMPREHENSIVE ANALYSIS OF VICTORIAN LWBS PATIENTS

patient-level data compared to Mohsin et al.’s use ofepisode-level data.
In keeping with a recently published study from Canada,we compared the LWBS patient group with a controlgroup of patients who completed ED treatment but werenot admitted to hospital.19 The choice of control is impor-tant as our preliminary analysis including admittedpatients suggested LWBS patients had a lower risk of mor-tality outcomes. This effect was not seen when the admit-ted and the potentially more severe admitted group wereexcluded from analysis. However, the positive associationwith increased likelihood of re-presentation to the EDwithin 48 hours remained. While the data suggest thatoverall the proportion of LWBS re-presenting with higherurgency triage categories is lower than for completedpatient re-presentations, the proportion of LWBS whore-present with a higher triage category than when theyfirst presented is somewhat concerning, and this too willrequire further investigation.
LIMITATIONS
We acknowledge that there are a number of limitationswith our research. We were limited by the data thatwere available from the Victorian Linked Dataset. Forexample, we would have liked to identify the hospitaltype and location, but were not given access to thesedata. We were able to include ED campus volumein the analysis, but lacked other hospital-level explana-tory data, such as staffing levels, ED occupancy, orgeographic status.
We also do not know the reason why patients LWBS,and if they sought alternative medical care, such asgeneral practice. The accuracy of the time waited in theED for those who LWBS is uncertain. The informationavailable may represent the time between the patient’sarrival and the time they were called in by ED staff orthe time staff realized the patient had left the waitingroom. Although we have triage category as a marker ofthe LWBS group’s disease or condition severity, welack further clinical information such as presentingdiagnosis or comorbidities. This may limit the use ofthe data to inform future policy and planning decisionsregarding strategic interventional targeting.
With regard to health outcomes, the 2-, 7-, and 30-day death rates among those who LWBS were low, butwe do not know what proportion of deaths were pre-ventable. However, the likelihood of re-presenting tothe ED is higher among those who LWBS, which mayadversely affect ED occupancy, utilization, and flow.
The advantage of a large data set is being able todemonstrate statistical significance between groups andover time; however, this does not necessarily correlatewith clinical significance. We have taken this issue intoaccount by setting our confidence level at a higherthreshold of 99%. In addition our data support previousdata for some covariates associated with LWBS evenwhere the adjusted ORs are low, for instance, male sexand evening arrival time. However, for other covari-ates, such as non–English-speaking COB, associatedwith low OR, there remains caution in interpreting theclinical significance without further supportive researchin this area.
Table 4Results of a Logistic Regression Analysis for Risk of LWBS Adjustedfor Patient, ED Visit, and Temporal and Hospital Characteristics
Characteristics* Adjusted OR (99% CI)
Age group (vs. ‡75 yr) 10–4 2.43 (2.33–2.53)5–14 1.85 (1.77–1.93)
15–24 2.46 (2.37–2.56)25–34 2.29 (2.20–2.39)35–44 2.01 (1.93–2.10)45–54 1.76 (1.69–1.84)55–64 1.42 (1.35–1.48)65–74 1.21 (1.16–1.28)
SexFemale 1Male 1.07 (1.05–1.08)
SEIFA Index of Education and OccupationDisadvantaged (lowest quartile) 1Advantaged 0.98 (0.96–0.99)
SEIFA IERDisadvantaged (lowest quartile) 1Advantaged 1.21 (1.18–1.25)
COBEnglish speaking 1Non–English-speaking 1.08 (1.06–1.10)
Indigenous statusNo 1Yes 1.63 (1.53–1.73)
Referral sourceOther than self 1Self-referred 1.46 (1.31–1.49)
Compensation statusCompensable third party 1Noncompensable Medicare 1.73 (1.68–1.79)
Transport statusAssisted 1Nonassisted 1.35 (1.30–1.40)
Prior hospital admission (12 months)No 1Yes 1.53 (1.51–1.55)
Triage categoryUrgent 1Semiurgent 4.93 (4.81–5.05)Nonurgent 8.21 (8.00–8.43)
Time of day24:00–07:59 108:00–16:59 0.61 (0.60–0.62)17:00–23:59 1.10 (1.08–1.12)
Day of the weekThursday 1Monday 1.20 (1.17–1.23)Tuesday 1.05 (1.02–1.07)Wednesday 1.01 (0.99–1.04)Friday 1.03 (1.00–1.06)Saturday 1.06 (1.04–1.09)Sunday 1.20 (1.18–1.23)
SeasonAutumn 1Winter 1.14 (1.12–1.16)Spring 1.09 (1.07–1.11)Summer 0.96 (0.94–0.98)
Year2003 ⁄ 2004 12000 ⁄ 2001 1.10 (1.06–1.15)2001 ⁄ 2002 1.31 (1.26–1.36)2002 ⁄ 2003 1.47 (1.41–1.53)2004 ⁄ 2005 1.14 (1.12–1.16)
ED size (volume of visits)Very small (<100,000) 1Small (100,000–150,000) 0.97 (0.94–1.00)Medium (150,001–200,000) 1.66 (1.62–1.70)Large (>200,000) 2.20 (2.15–2.26)
*p < 0.0001. Data for each characteristic have been adjustedfor all other variables included in the model.COB = country of birth; IER = Index of Economic Resources;SEIFA = Socio-Economic Indexes for Areas.
ACADEMIC EMERGENCY MEDICINE • April 2012, Vol. 19, No. 4 • www.aemj.org 445

There is a risk that changes have occurred duringor since the data observation period. The analysisadjusted for temporal-level characteristics and we didnot find a pattern in LWBS rates over the 5-year period.In the view of our clinical ED experts, there has beenno significant change in systemwide processes duringthe 5-year study period. There are delays in extractingcomplete robust death data for up to 2 years, whichwould have excluded investigating changes since intro-duction of ED time targets for time spent in the ED. Itwill be important to undertake further investigation ofchanges that occur as a result of these targets, andthe current data can serve as a baseline for such aninvestigation.
Applicability of these findings to the rest of Australiaand internationally should be the subject of furtherresearch. Qualitative analysis to further assess the rela-tionship between younger people and triage category,further exploration of the risk and reasons for LWBSamong our indigenous patient population, and researchassessing long-term effects of LWBS should also beundertaken.
CONCLUSIONS
Patients who leave Victorian EDs before being seen areat lower risk of hospital admission and no greater risk ofmortality, but at higher risk of re-presenting to an EDcompared to patients who complete treatment and gohome. Our findings can be used for policy developmentand program planning and evaluation, including effortsto reduce ED wait times, and programs to target those athighest risk of leaving without being seen by a physician.
The authors acknowledge a Melbourne Health Research LotteryGrant (JT,CB).
References
1. Victorian Auditor General. Managing EmergencyDemand in Public Hospitals. Available at: http://www.health.vic.gov.au/emergency/auditor_general_report.pdf. Accessed Jan 30, 2012.
2. Kennedy M, MacBean CE, Brand C, SundararajanV, McD Taylor D. Review article: leaving theemergency department without being seen. EmergMed Australas. 2008; 20:306–13.
3. Goodacre S, Webster A. Who waits longest in theemergency department and who leaves withoutbeing seen? Emerg Med J. 2005; 22:93–6.
4. Fry M, Thompson J, Chan A. Patients regularlyleave emergency departments before medicalassessment: a study of did not wait patients, medi-cal profile and outcome characteristics. Aust EmergNurs J. 2003; 6:21–6.
5. Arendt KW, Sadosty AT, Weaver AL, Brent CR,Boie ET. The left-without-being-seen patients: whatwould keep them from leaving? Ann Emerg Med.2003; 42:317–23.
6. Bindman AB, Grumbach K, Keane D, Rauch L, LuceJM. Consequences of queuing for care at a publichospital emergency department. JAMA. 1991;266:1091–6.
7. Monzon J, Friedman SM, Clarke C, Arenovich T.Patients who leave the emergency department with-out being seen by a physician: a control-matchedstudy. Can J Emerg Med. 2005; 7:107–13.
8. Hall J, Jelinek GA. Characteristics and outcomes ofpatients who ‘‘did not wait’’ after attending Perthpublic hospital emergency departments, 2000-2003.Med J Aust. 2007; 187:626–9.
9. Polevoi SK, Quinn JV, Kramer NR. Factors associ-ated with patients who leave without being seen.Acad Emerg Med. 2005; 12:232–6.
10. National Centre for Classification in Health, TheInternational Statistical Classification of Diseasesand Related Health Problems, 10th Revision, Aus-tralian Modification, ICD-10-AM Australian CodingStandards. Sydney, Australia: Faculty of Health Sci-ences, University of Sydney, 1998.
11. National Centre for Classification in and Health,The International Statistical Classification of Dis-eases and Related Health Problems, 10th Revision,Australian Modification, ICD-10-AM AustralianCoding Standards. Sydney Australia: Faculty ofHealth Sciences, University of Sydney, 2000.
12. Department of Justice. Victorian Registry of Births,Deaths and Marriages. Available at: http://online.justice.vic.gov.au/CA2574F700805DE7/HomePage?ReadForm&1 = Home~&2 = ~&3 = �. Accessed Jan 30.2012.
13. Victorian Department of Human Services. Informa-tion About Health Data Standards & Systems (HDSS)
Table 5Summary of Logistic Regression Models* of the Risk Outcomes of Mortality (2, 7, and 30 Days) and ED Re-presentation and HospitalAdmission (Within 48 hr) Following an Index ED Visit for LWBS and Completed Patient Visits
OutcomeLWBS Visits,n (% LWBS)
Completed Visits,n (% completed)
UnadjustedOR (99% CI)
AdjustedOR (99% CI)
Death within 2 days 334 (0.16) 2,673 (0.16) 0.99 (0.85–1.15) 1.21 (1.03–1.41)Death within 7 days 357 (0.17) 3,117 (0.19) 0.91 (0.78–1.05) 1.18 (1.02–1.37)Death within 30 days 479 (0.23) 4,886 (0.3) 0.78� (0.69–0.88) 1.19 (1.05–1.36)ED re-presentation within 48 hours� 22,063 (10.75) 117,587 (7.14) 1.57� (1.54–1.60) 1.63� (1.60–1.67)Hospital admission within 48 hours� 6,873 (3.35) 129,538 (7.99) 0.40� (0.39–0.41) 0.60� (0.58–0.62)
*All models were adjusted for all patient, ED visit, and temporal and hospital variables.�p < 0.0001.�Excluding those who died within 2 days.LWBS = left without being seen by physician.
446 Tropea et al. • COMPREHENSIVE ANALYSIS OF VICTORIAN LWBS PATIENTS

Used in Victoria’s hospitals. Available at: http://www.health.vic.gov.au/hdss/. Accessed Jan 30, 2012.
14. Australian Bureau of Statistics. SEIFA: Socio-Eco-nomic Indexes for Areas. Available at: http://www.abs.gov.au/websitedbs/D3310114.nsf/home/Seifa_entry_page. Accessed Jan 30, 2012.
15. Bourgeois FT, Shannon MW, Stack AM. ‘‘Left with-out being seen’’: a national profile of children wholeave the emergency department before evaluation.Ann Emerg Med. 2008; 52:599–605.
16. Mohsin M, Young L, Ieraci S, Bauman AE. Factorsassociated with walkout of patients from NewSouth Wales hospital emergency departments,Australia. Emerg Med Australas. 2005; 17:434–42.
17. Gilligan P, Joseph D, Winder S, et al. DNW ‘‘didnot wait’’ or ‘‘demographic needing work’’: a study
of the profile of patients who did not wait to beseen in an Irish emergency department. EmergMed J. 2009; 26:780–2.
18. Australian Bureau of Statistics. 2006 Census Com-munity Profile Series: Victoria. Available at: http://www.censusdata.abs.gov.au/ABSNavigation/prenav/LocationList?areacode=2&producttype=Community+Profiles&action=401. Accessed Jan 30,2012.
19. Guttmann A, Schull JJ, Vermeulen MJ, Stukel TA.Association between waiting times and short termmortality and hospital admission after departurefrom emergencey department: population basedcohort study from Ontario, Canada. BMJ. 2011;342(d2983):1–8.
ACADEMIC EMERGENCY MEDICINE • April 2012, Vol. 19, No. 4 • www.aemj.org 447