2D and Trap-Assisted 2D Langevin Recombination in Polymer:Fullerene Blends
11640 | Phys. Chem. Chem. Phys., 2014, 16, 11640--11646 This journal is© the Owner Societies 2014
Cite this:Phys.Chem.Chem.Phys.,
2014, 16, 11640
Pathways of energy transfer in LHCII revealed byroom-temperature 2D electronic spectroscopy
Kym L. Wells,a Petar H. Lambrev,b Zhengyang Zhang,a Gyozo Garabb andHowe-Siang Tan*a
We present here the first room-temperature 2D electronic spectroscopy study of energy transfer in the
plant light-harvesting complex II, LHCII. Two-dimensional electronic spectroscopy has been used to study
energy transfer dynamics in LHCII trimers from the chlorophyll b Qy band to the chlorophyll a Qy band.
Observing cross-peak regions corresponding to couplings between different excitonic states reveals
partially resolved fine structure at the exciton level that cannot be isolated by pump–probe or linear
spectroscopy measurements alone. Global analysis of the data has been performed to identify the pathways
and time constants of energy transfer. The measured waiting time (Tw) dependent 2D spectra are found to
be composed of 2D decay-associated spectra with three timescales (0.3 ps, 2.3 ps and 420 ps). Direct and
multistep cascading pathways from the high-energy chlorophyll b states to the lowest-energy chlorophyll
a states have been resolved occurring on time scales of hundreds of femtoseconds to picoseconds.
Introduction
Light-harvesting antenna systems such as LHCII, the primarylight-harvesting complex in plants, are essential for the photo-synthetic process that eventually powers the biological world.The excitation energy transfer (EET) processes in naturallyoccurring light-harvesting systems are therefore of strong interestto scientists. Due to the ultrafast nature of these EET processes,femtosecond optical spectroscopy has proven to be a powerfultool to study these systems. Kwa et al.1 used both one-colour andtwo-colour pump–probe spectroscopy to study the EET processesin LHCII trimers with ps time resolution. They observed energytransfer from chlorophyll b (Chl b) to chlorophyll a (Chl a)occurring in o1 ps, which they were unable to temporally resolve.They also observed a 2–6 ps process attributed to EET betweenthe luminal and stromal layers of the complex. Bittner et al.2
completed complementary studies with 250 fs time resolutionwhich revealed a faster process of only B150 fs which wasattributed to EET from Chl b to Chl a. As in the work of Kwaet al., a 3–7 ps process was observed, which could be interpretedas EET from a different Chl b pool, or as redistribution of energybetween Chl a excited states.
Separately collected transient absorption measurements ofLHCII trimers by Visser et al.3 and Connelly et al.4 completed at
77 K each observed Chl b to Chl a EET processes with consistenttime constants of 150–300 fs, 600 fs, and 4–9 ps. Similarmeasurements of LHCII monomers by Kleima et al.5 foundtwo comparable transfer times of B200 fs and 3 ps. This workalso involved global fitting of previously collected trimer3 datawith these measurements to determine that in both cases 50%of the transfer occurred on the B200 fs timescale. It wasconcluded that the 600 fs process observed in the trimer issignificantly slowed down in the monomer case to contribute tothe observed ps process. The similarity between the monomerand the trimer results led the authors to conclude that Chl b toChl a transfer is predominantly localised to individual mono-mers, which was later substantiated by theoretical studies thatidentified only one sizeable coupling between chlorophyllpigments on adjacent monomers in the trimer structure.6
Recent polarized transient absorption measurements by Marinet al. at 77 K measured inter-monomer EET occurring within3.3–5 ps across the entirety of the Qy band.7
Significant efforts to model the spectral dynamics of LHCIIhave been undertaken.8–11 Novoderezhkin et al.6 and indepen-dently Linnanto et al.9 and Renger et al.12,13 using the 2.72 Åcrystallographic LHCIIb structure14 determined the energiesof the 14 excitonic states that comprise the Qy transitions ofLHCII, encompassing both the Chl b and Chl a bands. Theyalso modelled the heavily delocalised nature of these statesusing simultaneous quantitative fits of the linear absorption,linear dichroism, fluorescence spectra and transient absorptionspectra. Other transient absorption experiments by van Grondelleand co-workers15 on several recombinant isoforms of LHCIIseparated energy transfer dynamics from ‘‘red’’ and ‘‘blue’’
a Division of Chemistry and Biological Chemistry, School of Physical and
Mathematical Sciences, Nanyang Technological University, Singapore 637371,
Singapore. E-mail: [email protected] Institute of Plant Biology, Biological Research Centre,
Hungarian Academy of Sciences, PO Box 521, H-6726, Szeged, Hungary
Received 28th February 2014,Accepted 29th April 2014
DOI: 10.1039/c4cp00876f
www.rsc.org/pccp
PCCP
PAPER

This journal is© the Owner Societies 2014 Phys. Chem. Chem. Phys., 2014, 16, 11640--11646 | 11641
Chl b states to Chl a states with a sequential global fittingroutine. They reported EET from high energy (blue) Chl b to Chla occurring with a 600 fs and 4 ps time constant, and energytransfer from low energy Chl b (red) to Chl a occurring withtime constants of 150 fs and 600 fs. However, it is not alwayspossible in transient absorption measurements to unambiguouslyisolate contributions to peaks in the transient spectra originatingfrom different initially excited states. Whilst 2D spectroscopy, byvirtue of an extra frequency axis, is able to resolve the pumpfrequency as well as the emission frequency. Recently, 2D spectro-scopy has been applied to probe LHCII. Schlau-Cohen et al.16
identified cross peaks in the non-rephasing 2D spectra corre-sponding to Chl b to Chl a energy transfer. By observing thesecross-peak amplitudes as a function of Tw, multistep dynamicsoccurring with a fastest, previously unrecorded o100 fs compo-nent were observed. These results suggest that multistep relaxa-tion is occurring but no quantitative values were given.16 Calhounet al.17 directly measured the energies of these excitonic states byobserving the Fourier transform of the diagonal of the non-rephasing 2D spectra as a function of waiting time (Tw) at 77 Kachieving excellent agreement with theory.
Presented here are 2D electronic spectroscopic studies ofpartially excitonically resolved energy transfer in LHCII at roomtemperature. At low temperatures the absorption spectra ofLHCII are better resolved, but less representative of the physio-logical conditions under which light harvesting occurs. Byperforming the study presented in this paper at room tempera-ture, we are moving to a regime which more closely mimics thein vivo conditions. Additionally, by tuning the spectrum of thefirst two interaction pulses to cover only the Chl b band, andusing a white light continuum (WLC) to act as the thirdinteraction pulse we observe the cross-peaks corresponding toChl b to Chl a energy transfer without contribution from signalsdue to coherent processes which potentially complicate theinterpretation of the collected 2D electronic spectra. In thisstudy, we elucidate the energy transfer pathway from differentspectral regions of the Chl b manifold to different spectralregions of the Chl a manifold.
In a similar approach to Schlau-Cohen’s,16 integrals corre-sponding to different excitonic couplings on a purely absorptive2D spectra are collected at a range of Tw values, to observe real-time energy transfer. To date, few room temperature multi-dimensional spectroscopy studies of light harvesting complexeshave been completed.18–20 To develop a true understanding of theefficiency of light harvesting systems in vivo, studies must start tobe tailored to more closely match physiological conditions.
Experimental
The experimental setup and theory behind the phase cyclingschemes necessary for these pump–probe geometry 2D electro-nic spectroscopy measurements have been well described21,22
and demonstrated23 previously, as has the use of a white lightcontinuum (WLC) probe and necessary chirp considerationsassociated with this.24–26 Only a brief description of the
experimental set-up is provided here. By utilizing a pump–probe geometry set-up with phase cycling the absorptive 2Dspectra are recovered directly. In a traditional boxcar arrange-ment both the 2D rephasing and 2D non-rephasing signalsneed to be collected, phased and summed to yield the purelyabsorptive 2D spectra. The phasing needs to be performed withgreat care to separate the real and imaginary parts of the 2Dpurely absorptive spectrum without causing distortion to theobserved lineshape.20,27,28 In pump–probe geometry 2DES,wherein the first two interaction pulses are collinear allowing thesimultaneous measurement of the rephasing and non-rephasingsignals, the phasing step is unnecessary. Thus, there is noambiguity in the peak shape arising from inadequate phasing.
LHCII trimers were isolated and purified from spinachthylakoid membranes, solubilized with a-dodecyl maltoside(a-DM) by sucrose-gradient ultracentrifugation as described inthe work of Caffarri et al.29 Before measurements, the LHCIIsuspension was diluted with nitrogen-flushed 0.06% a-DM and10 mM HEPES buffer solution to provide an optical density of0.27 (at the Chl a Qy maximum) in a 1 mm sapphire-windowedsample cell. All measurements were collected at room tempera-ture (298 K). A commercially available regenerative amplifierlaser system (Legend Elite, Coherent) provided pulses centredat 800 nm (0.8 W, 1 KHz, 40 fs) which pumped a home-builtoptical parametric amplifier (OPA). The near-infrared output ofthe OPA was subsequently frequency doubled to be resonantwith the Qy transition of the Chl b band of LHCII at 15 385 cm�1
(650 nm) with a FWHM of B350 cm�1 (B14 nm), which wassufficiently broad to excite the entirety of the Chl b excitonmanifold. This beam was passed through a commerciallyavailable acousto-optic programmable dispersive filter30 (Dazzler,Fastlite) to generate the first two excitation pulses, with variabletime delay and relative phase. All measurements presented herewere referenced to a carrier frequency of 14 277 cm�1 (700 nm), toplace the signal into the partially rotating frame, taken with a 1�2 phase cycling scheme22,23 and attenuated to 70 nJ sum energyfor the two pulses. The pulse shaper further compressed thepulses to 55 fs FWHM. The combined third interaction pulse andlocal oscillator was a white light continuum generated by focuss-ing a small amount of the fundamental frequency beam (800 nm)through a 2 mm sapphire window, and passing over a delay stageto enable control of the population time (Tw) after the first twoexcitation pulses. The shaped laser output and the WLC wereoverlapped on the sample cell, with the WLC subsequentlydispersed with a spectrometer (Acton SP2300, Princeton Instru-ments) onto a CCD detector (PIXIS 100B, Princeton Instru-ments). The linear absorption spectra were taken before andafter measurement scans to confirm that sample degradationhad not occurred.
The first two interaction pulses were scanned over a totaltime range of 180 fs in 3 fs steps, whilst the Tw value remainedconstant. Due to the presence of a coherent artefact at short Tw,only 2D electronic spectra (2DES) at Tw larger than 150 fs wereanalysed. 2DES were collected at Tw values extending to 12.5 ps.In each collected 2DES presented here, the two frequency axescan be viewed as ‘pump’ (ot) and ‘probe’ axes (ot) where the
Paper PCCP
11642 | Phys. Chem. Chem. Phys., 2014, 16, 11640--11646 This journal is© the Owner Societies 2014
frequency-resolved excitation of the ‘pump’ is correlated withthe frequency-resolved absorption of the ‘probe’ after a waitingtime Tw. Since for these measurements a WLC is used toprovide the third interaction field and local oscillator, the trueTw value for each ot in each 2DES is different according to thechirp of the WLC. For the data analysis presented here the Tw iscorrected according to the relative observation time of thecoherent artefact at each ot.
Results2D spectra and time evolution
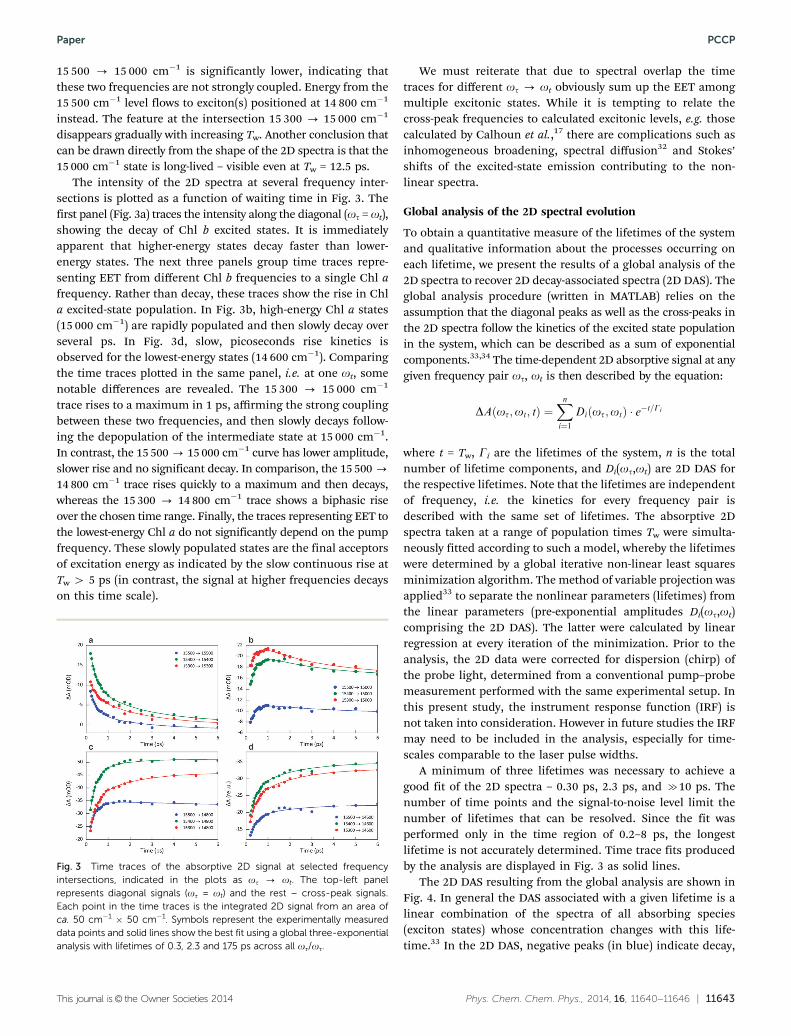
Fig. 1 shows the linear absorption spectrum of the Qy bands ofLHCII at room temperature, with the Chl a band and Chl bband centred at B14 800 cm�1 and B15 375 cm�1 respectively.The spectrum of the pump pulse (the first two interaction pulses)used in these measurements is overlaid. The stick plots indicatethe positions of the excitonic states comprising these bands,according to the model of Novoderezhkin et al.6
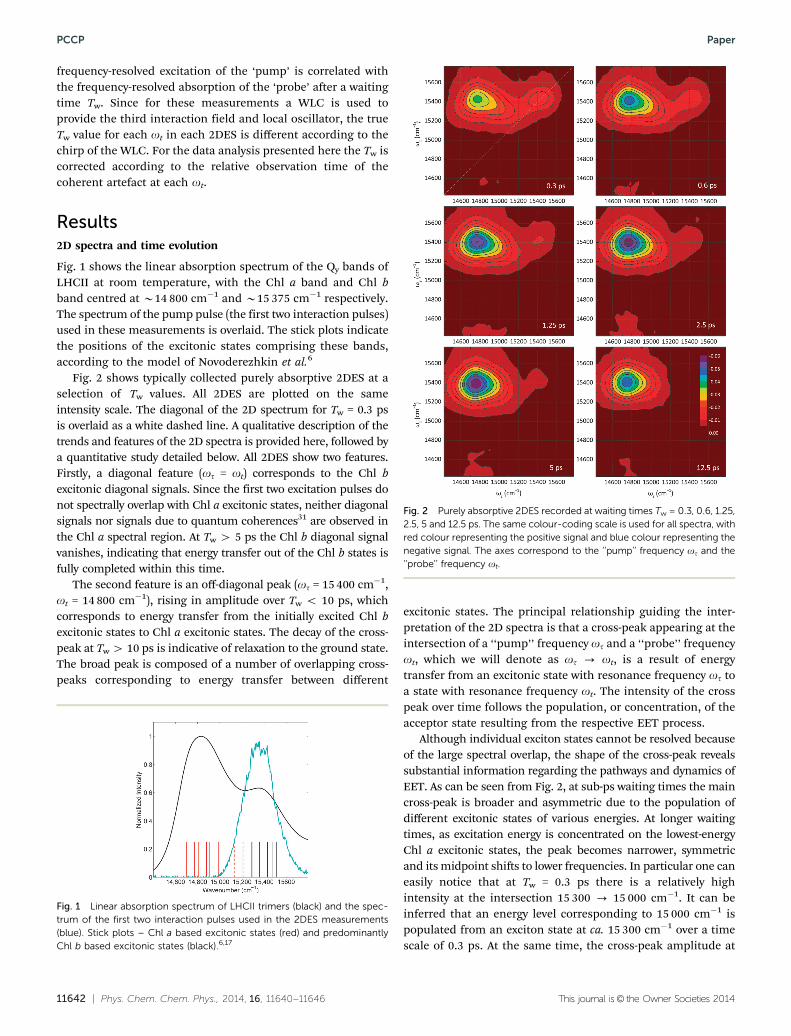
Fig. 2 shows typically collected purely absorptive 2DES at aselection of Tw values. All 2DES are plotted on the sameintensity scale. The diagonal of the 2D spectrum for Tw = 0.3 psis overlaid as a white dashed line. A qualitative description of thetrends and features of the 2D spectra is provided here, followed bya quantitative study detailed below. All 2DES show two features.Firstly, a diagonal feature (ot = ot) corresponds to the Chl bexcitonic diagonal signals. Since the first two excitation pulses donot spectrally overlap with Chl a excitonic states, neither diagonalsignals nor signals due to quantum coherences31 are observed inthe Chl a spectral region. At Tw 4 5 ps the Chl b diagonal signalvanishes, indicating that energy transfer out of the Chl b states isfully completed within this time.
The second feature is an off-diagonal peak (ot = 15 400 cm�1,ot = 14 800 cm�1), rising in amplitude over Tw o 10 ps, whichcorresponds to energy transfer from the initially excited Chl bexcitonic states to Chl a excitonic states. The decay of the cross-peak at Tw 4 10 ps is indicative of relaxation to the ground state.The broad peak is composed of a number of overlapping cross-peaks corresponding to energy transfer between different
excitonic states. The principal relationship guiding the inter-pretation of the 2D spectra is that a cross-peak appearing at theintersection of a ‘‘pump’’ frequency ot and a ‘‘probe’’ frequencyot, which we will denote as ot - ot, is a result of energytransfer from an excitonic state with resonance frequency ot toa state with resonance frequency ot. The intensity of the crosspeak over time follows the population, or concentration, of theacceptor state resulting from the respective EET process.
Although individual exciton states cannot be resolved becauseof the large spectral overlap, the shape of the cross-peak revealssubstantial information regarding the pathways and dynamics ofEET. As can be seen from Fig. 2, at sub-ps waiting times the maincross-peak is broader and asymmetric due to the population ofdifferent excitonic states of various energies. At longer waitingtimes, as excitation energy is concentrated on the lowest-energyChl a excitonic states, the peak becomes narrower, symmetricand its midpoint shifts to lower frequencies. In particular one caneasily notice that at Tw = 0.3 ps there is a relatively highintensity at the intersection 15 300 - 15 000 cm�1. It can beinferred that an energy level corresponding to 15 000 cm�1 ispopulated from an exciton state at ca. 15 300 cm�1 over a timescale of 0.3 ps. At the same time, the cross-peak amplitude at
Fig. 1 Linear absorption spectrum of LHCII trimers (black) and the spec-trum of the first two interaction pulses used in the 2DES measurements(blue). Stick plots – Chl a based excitonic states (red) and predominantlyChl b based excitonic states (black).6,17
Fig. 2 Purely absorptive 2DES recorded at waiting times Tw = 0.3, 0.6, 1.25,2.5, 5 and 12.5 ps. The same colour-coding scale is used for all spectra, withred colour representing the positive signal and blue colour representing thenegative signal. The axes correspond to the ‘‘pump’’ frequency ot and the‘‘probe’’ frequency ot.
PCCP Paper
This journal is© the Owner Societies 2014 Phys. Chem. Chem. Phys., 2014, 16, 11640--11646 | 11643
15 500 - 15 000 cm�1 is significantly lower, indicating thatthese two frequencies are not strongly coupled. Energy from the15 500 cm�1 level flows to exciton(s) positioned at 14 800 cm�1
instead. The feature at the intersection 15 300 - 15 000 cm�1
disappears gradually with increasing Tw. Another conclusion thatcan be drawn directly from the shape of the 2D spectra is that the15 000 cm�1 state is long-lived – visible even at Tw = 12.5 ps.
The intensity of the 2D spectra at several frequency inter-sections is plotted as a function of waiting time in Fig. 3. Thefirst panel (Fig. 3a) traces the intensity along the diagonal (ot = ot),showing the decay of Chl b excited states. It is immediatelyapparent that higher-energy states decay faster than lower-energy states. The next three panels group time traces repre-senting EET from different Chl b frequencies to a single Chl afrequency. Rather than decay, these traces show the rise in Chla excited-state population. In Fig. 3b, high-energy Chl a states(15 000 cm�1) are rapidly populated and then slowly decay overseveral ps. In Fig. 3d, slow, picoseconds rise kinetics isobserved for the lowest-energy states (14 600 cm�1). Comparingthe time traces plotted in the same panel, i.e. at one ot, somenotable differences are revealed. The 15 300 - 15 000 cm�1
trace rises to a maximum in 1 ps, affirming the strong couplingbetween these two frequencies, and then slowly decays follow-ing the depopulation of the intermediate state at 15 000 cm�1.In contrast, the 15 500 - 15 000 cm�1 curve has lower amplitude,slower rise and no significant decay. In comparison, the 15 500 -
14 800 cm�1 trace rises quickly to a maximum and then decays,whereas the 15 300 - 14 800 cm�1 trace shows a biphasic riseover the chosen time range. Finally, the traces representing EET tothe lowest-energy Chl a do not significantly depend on the pumpfrequency. These slowly populated states are the final acceptorsof excitation energy as indicated by the slow continuous rise atTw 4 5 ps (in contrast, the signal at higher frequencies decayson this time scale).
We must reiterate that due to spectral overlap the timetraces for different ot - ot obviously sum up the EET amongmultiple excitonic states. While it is tempting to relate thecross-peak frequencies to calculated excitonic levels, e.g. thosecalculated by Calhoun et al.,17 there are complications such asinhomogeneous broadening, spectral diffusion32 and Stokes’shifts of the excited-state emission contributing to the non-linear spectra.
Global analysis of the 2D spectral evolution
To obtain a quantitative measure of the lifetimes of the systemand qualitative information about the processes occurring oneach lifetime, we present the results of a global analysis of the2D spectra to recover 2D decay-associated spectra (2D DAS). Theglobal analysis procedure (written in MATLAB) relies on theassumption that the diagonal peaks as well as the cross-peaks inthe 2D spectra follow the kinetics of the excited state populationin the system, which can be described as a sum of exponentialcomponents.33,34 The time-dependent 2D absorptive signal at anygiven frequency pair ot, ot is then described by the equation:
DA ot;ot; tð Þ ¼Xn
i¼1Di ot;otð Þ � e�t=Gi
where t = Tw, Gi are the lifetimes of the system, n is the totalnumber of lifetime components, and Di(ot,ot) are 2D DAS forthe respective lifetimes. Note that the lifetimes are independentof frequency, i.e. the kinetics for every frequency pair isdescribed with the same set of lifetimes. The absorptive 2Dspectra taken at a range of population times Tw were simulta-neously fitted according to such a model, whereby the lifetimeswere determined by a global iterative non-linear least squaresminimization algorithm. The method of variable projection wasapplied33 to separate the nonlinear parameters (lifetimes) fromthe linear parameters (pre-exponential amplitudes Di(ot,ot)comprising the 2D DAS). The latter were calculated by linearregression at every iteration of the minimization. Prior to theanalysis, the 2D data were corrected for dispersion (chirp) ofthe probe light, determined from a conventional pump–probemeasurement performed with the same experimental setup. Inthis present study, the instrument response function (IRF) isnot taken into consideration. However in future studies the IRFmay need to be included in the analysis, especially for time-scales comparable to the laser pulse widths.
A minimum of three lifetimes was necessary to achieve agood fit of the 2D spectra – 0.30 ps, 2.3 ps, and c10 ps. Thenumber of time points and the signal-to-noise level limit thenumber of lifetimes that can be resolved. Since the fit wasperformed only in the time region of 0.2–8 ps, the longestlifetime is not accurately determined. Time trace fits producedby the analysis are displayed in Fig. 3 as solid lines.
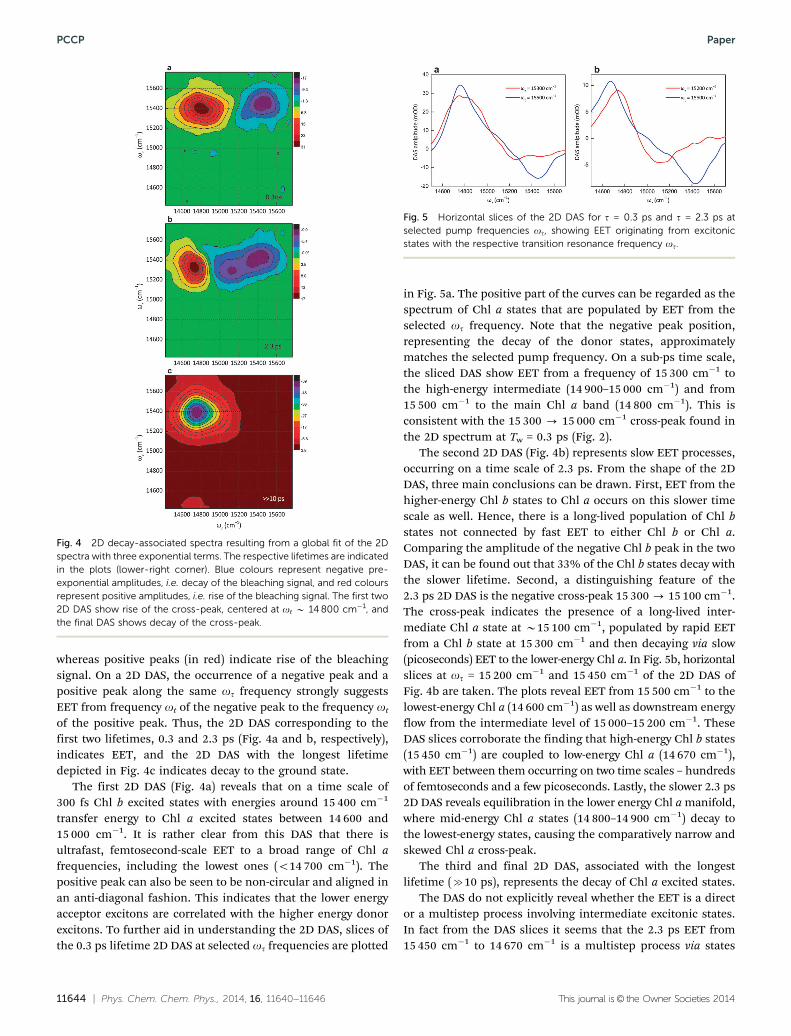
The 2D DAS resulting from the global analysis are shown inFig. 4. In general the DAS associated with a given lifetime is alinear combination of the spectra of all absorbing species(exciton states) whose concentration changes with this life-time.33 In the 2D DAS, negative peaks (in blue) indicate decay,
Fig. 3 Time traces of the absorptive 2D signal at selected frequencyintersections, indicated in the plots as ot - ot. The top-left panelrepresents diagonal signals (ot = ot) and the rest – cross-peak signals.Each point in the time traces is the integrated 2D signal from an area ofca. 50 cm�1 � 50 cm�1. Symbols represent the experimentally measureddata points and solid lines show the best fit using a global three-exponentialanalysis with lifetimes of 0.3, 2.3 and 175 ps across all ot/ot.
Paper PCCP
11644 | Phys. Chem. Chem. Phys., 2014, 16, 11640--11646 This journal is© the Owner Societies 2014
whereas positive peaks (in red) indicate rise of the bleachingsignal. On a 2D DAS, the occurrence of a negative peak and apositive peak along the same ot frequency strongly suggestsEET from frequency ot of the negative peak to the frequency ot
of the positive peak. Thus, the 2D DAS corresponding to thefirst two lifetimes, 0.3 and 2.3 ps (Fig. 4a and b, respectively),indicates EET, and the 2D DAS with the longest lifetimedepicted in Fig. 4c indicates decay to the ground state.
The first 2D DAS (Fig. 4a) reveals that on a time scale of300 fs Chl b excited states with energies around 15 400 cm�1
transfer energy to Chl a excited states between 14 600 and15 000 cm�1. It is rather clear from this DAS that there isultrafast, femtosecond-scale EET to a broad range of Chl afrequencies, including the lowest ones (o14 700 cm�1). Thepositive peak can also be seen to be non-circular and aligned inan anti-diagonal fashion. This indicates that the lower energyacceptor excitons are correlated with the higher energy donorexcitons. To further aid in understanding the 2D DAS, slices ofthe 0.3 ps lifetime 2D DAS at selected ot frequencies are plotted
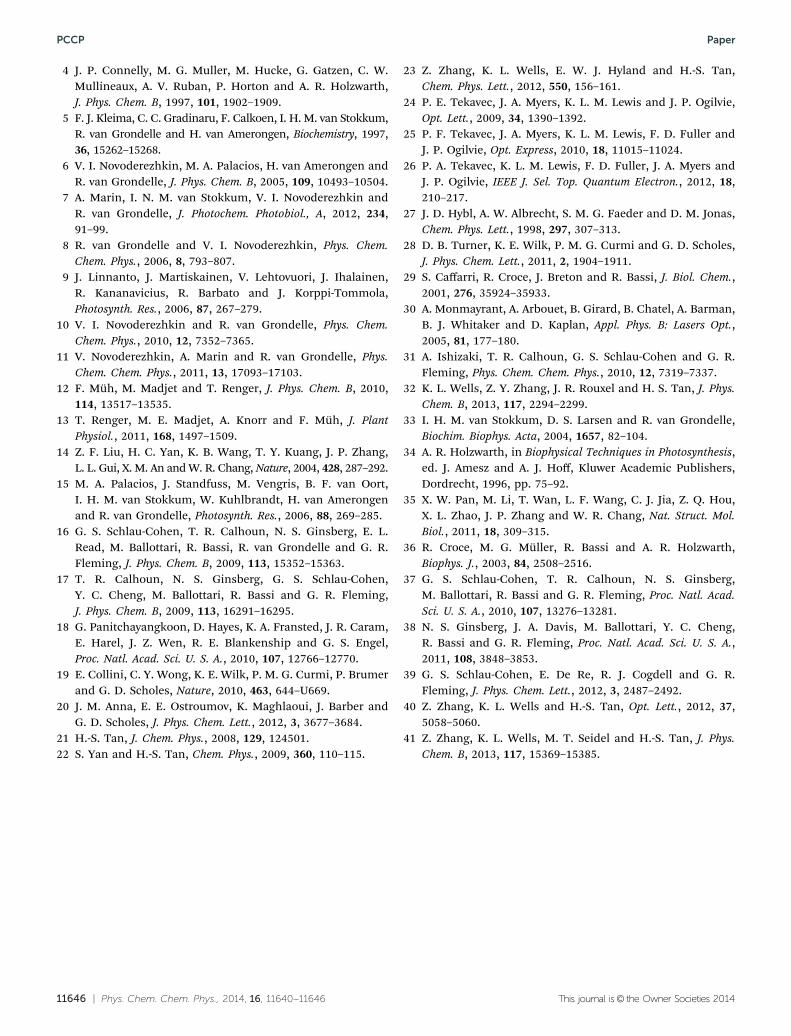
in Fig. 5a. The positive part of the curves can be regarded as thespectrum of Chl a states that are populated by EET from theselected ot frequency. Note that the negative peak position,representing the decay of the donor states, approximatelymatches the selected pump frequency. On a sub-ps time scale,the sliced DAS show EET from a frequency of 15 300 cm�1 tothe high-energy intermediate (14 900–15 000 cm�1) and from15 500 cm�1 to the main Chl a band (14 800 cm�1). This isconsistent with the 15 300 - 15 000 cm�1 cross-peak found inthe 2D spectrum at Tw = 0.3 ps (Fig. 2).
The second 2D DAS (Fig. 4b) represents slow EET processes,occurring on a time scale of 2.3 ps. From the shape of the 2DDAS, three main conclusions can be drawn. First, EET from thehigher-energy Chl b states to Chl a occurs on this slower timescale as well. Hence, there is a long-lived population of Chl bstates not connected by fast EET to either Chl b or Chl a.Comparing the amplitude of the negative Chl b peak in the twoDAS, it can be found out that 33% of the Chl b states decay withthe slower lifetime. Second, a distinguishing feature of the2.3 ps 2D DAS is the negative cross-peak 15 300 - 15 100 cm�1.The cross-peak indicates the presence of a long-lived inter-mediate Chl a state at B15 100 cm�1, populated by rapid EETfrom a Chl b state at 15 300 cm�1 and then decaying via slow(picoseconds) EET to the lower-energy Chl a. In Fig. 5b, horizontalslices at ot = 15 200 cm�1 and 15 450 cm�1 of the 2D DAS ofFig. 4b are taken. The plots reveal EET from 15 500 cm�1 to thelowest-energy Chl a (14 600 cm�1) as well as downstream energyflow from the intermediate level of 15 000–15 200 cm�1. TheseDAS slices corroborate the finding that high-energy Chl b states(15 450 cm�1) are coupled to low-energy Chl a (14 670 cm�1),with EET between them occurring on two time scales – hundredsof femtoseconds and a few picoseconds. Lastly, the slower 2.3 ps2D DAS reveals equilibration in the lower energy Chl a manifold,where mid-energy Chl a states (14 800–14 900 cm�1) decay tothe lowest-energy states, causing the comparatively narrow andskewed Chl a cross-peak.
The third and final 2D DAS, associated with the longestlifetime (c10 ps), represents the decay of Chl a excited states.
The DAS do not explicitly reveal whether the EET is a director a multistep process involving intermediate excitonic states.In fact from the DAS slices it seems that the 2.3 ps EET from15 450 cm�1 to 14 670 cm�1 is a multistep process via states
Fig. 4 2D decay-associated spectra resulting from a global fit of the 2Dspectra with three exponential terms. The respective lifetimes are indicatedin the plots (lower-right corner). Blue colours represent negative pre-exponential amplitudes, i.e. decay of the bleaching signal, and red coloursrepresent positive amplitudes, i.e. rise of the bleaching signal. The first two2D DAS show rise of the cross-peak, centered at ot B 14 800 cm�1, andthe final DAS shows decay of the cross-peak.
Fig. 5 Horizontal slices of the 2D DAS for t = 0.3 ps and t = 2.3 ps atselected pump frequencies ot, showing EET originating from excitonicstates with the respective transition resonance frequency ot.
PCCP Paper

This journal is© the Owner Societies 2014 Phys. Chem. Chem. Phys., 2014, 16, 11640--11646 | 11645
at B14 900 cm�1. For a definitive answer to the question ofmultistep EET, 2DES data of substantially higher dynamicrange and time resolution are needed (in order to resolve morelifetimes) or, alternatively, a 3D experimental setup with anadditional frequency axis.
Discussion
The pump–probe geometry 2DES results presented here partiallyresolve the EET pathways between Chl b and Chl a excitonicstates in LHCII at room temperature. To our knowledge, this isthe most detailed experimentally obtained EET kinetics schemeso far. Whilst the identified cross-peak regions studied here arenot fully resolved, differences between couplings of differentinitially excited excitonic states are clearly evident, which pump–probe measurements alone cannot observe.
In a short summary, our qualitative and quantitative globaldata analysis suggests: (1) fast (r300 fs) EET from high Chl blevels (15 400–15 500 cm�1) to middle Chl a levels (14 800 cm�1);(2) fast EET from lower Chl b levels (15 200–15 300 cm�1) to theintermediate level (15 000–15 100 cm�1); (3) on a much slower,picoseconds time scale, another population (33%) of Chl b statesdecays via EET to Chl a; (4) slow relaxation from the high-energyChl a intermediate to the lowest Chl a levels; (5) equilibrationin the low-energy Chl a manifold also occurs on this slowertime scale.
The Chl b manifold can be divided into two groups, with onelocated near the stromal side and the other near the luminalside. The two groups are physically separated from each other,which can be the reason why we can observe two distinct lifetimesof EET from Chl b. According to the theoretical models andnumerical simulations based on transient absorption, and othersteady state spectroscopies, developed in the work of van Grondelleand Novoderezhkin,8,11 there is no fast energy relaxation from theChl b manifold to the lowest-energy Chl a states. However, our2DES experiments unambiguously demonstrate such EET. Themodel of van Grondelle and Novoderezhkin predicts fast energyrelaxation from the luminal Chl b group (Chls 606 and 607) to thehigh-energy Chl a 604. This fast EET is probably the origin ofthe cross peak at 15 300 - 15 100 cm�1 in Fig. 2. Also inagreement with the model, and with previous low-temperature2DES experiments,16 the high-energy Chl a state is weaklycoupled to the low-energy Chls and is thus a bottleneck statethat decays on a time scale of several ps. Our experimentsclearly distinguish the bottleneck state with a resonant fre-quency of about 15 000 cm�1 and further show the fast couplingof this state to the low-energy Chl b (15 300 cm�1).
A parallel can also be drawn between our work and ultrafasttransient absorption experiments done on CP29, another memberof the LHCII family, which has a highly similar pigment arrange-ment, except that a few Chl b pigments found in the major LHCIIare replaced by Chl a in the CP29 structure.35 Croce et al.36 haveobserved three lifetimes of EET from Chl b (15 400 cm�1) to Chl ain CP29 – 150 fs, 1.2 ps and 5–6 ps. The present analysis of the 2Dcannot resolve all lifetimes in the system but the general finding
of a fast-decaying (300 fs) and a slow-decaying (2 ps) population ofChl b is in agreement with these earlier experiments. Probably thelongest lifetime in CP29 involves high-energy Chl a intermediatesas well. Finally, our experimental data point to a slower, pico-seconds equilibration kinetics within the Chl a domain, in linewith the structure-based theoretical predictions of Renger et al.13
Not all excitonic states can be unambiguously resolved inour experiments and therefore it is not possible to determine allstates and pathways based on these experimental data alone.Furthermore, we have not included the contributions fromdirect excitation of the first vibronic replica of the Chl a Qy
bands by the first two interaction pulses. However since absorp-tivity of these bands is much smaller than the main Chl b Qy
bands, their contributions are minor, although this warrantsfurther studies and simulations.
Whilst polarization controlled measurements have showngreat promise in isolating specific spectral features in 2DES,37–39
it is unlikely that these methods will provide unambiguousassignment of the multistep mechanisms involved here. It isthus suggested that higher dimensional spectroscopy measure-ments, such as those already demonstrated on solvated Chl a,40,41
are needed to further clarify the intermediate excitonic statesinvolved in these step-wise energy transfer processes, as higherdimensional spectroscopy will reveal higher order couplings.These multi-step pathways are most likely due to spatial overlapof excitonic states of mixed Chl a and Chl b composition withboth the high-energy Chl b excitonic states and the low-energyChl a excitonic states. To truly understand the efficiency ofnaturally occurring light-harvesting complexes, and indeedenergy transfer processes in larger pigment–protein complexes,a much refined understanding of the energy transfer mecha-nisms at physiological temperatures is required.
Acknowledgements
This work is supported by a joint grant from the HungarianNational Innovation Office and the Singapore Agency for Science,Technology and Research, A*STAR (A*STAR SERC Grant No. 102-149-0153; NIH-A*STAR TET_10-1-2011-027) and a grant from theSingapore National Research Foundation (NRF-CRP5-2009-04).Z.Z. thanks the Nanyang President’s Graduate Scholarship forsupport. P.L. acknowledges support from the Hungarian ScientificResearch Fund (OTKA-PD 104530). The authors would like toacknowledge Jeremy Rouxel for fruitful discussions.
Notes and references
1 S. L. S. Kwa, H. van Amerongen, S. Lin, J. P. Dekker,R. van Grondelle and W. S. Struve, Biochim. Biophys. Acta,1992, 1102, 202–212.
2 T. Bittner, K. D. Irrgang, G. Renger and M. R. Wasielewski,J. Phys. Chem., 1994, 98, 11821–11826.
3 H. M. Visser, F. J. Kleima, I. H. M. van Stokkum,R. van Grondelle and H. van Amerongen, Chem. Phys., 1996,210, 297–312.
Paper PCCP
11646 | Phys. Chem. Chem. Phys., 2014, 16, 11640--11646 This journal is© the Owner Societies 2014
4 J. P. Connelly, M. G. Muller, M. Hucke, G. Gatzen, C. W.Mullineaux, A. V. Ruban, P. Horton and A. R. Holzwarth,J. Phys. Chem. B, 1997, 101, 1902–1909.
5 F. J. Kleima, C. C. Gradinaru, F. Calkoen, I. H. M. van Stokkum,R. van Grondelle and H. van Amerongen, Biochemistry, 1997,36, 15262–15268.
6 V. I. Novoderezhkin, M. A. Palacios, H. van Amerongen andR. van Grondelle, J. Phys. Chem. B, 2005, 109, 10493–10504.
7 A. Marin, I. N. M. van Stokkum, V. I. Novoderezhkin andR. van Grondelle, J. Photochem. Photobiol., A, 2012, 234,91–99.
8 R. van Grondelle and V. I. Novoderezhkin, Phys. Chem.Chem. Phys., 2006, 8, 793–807.
9 J. Linnanto, J. Martiskainen, V. Lehtovuori, J. Ihalainen,R. Kananavicius, R. Barbato and J. Korppi-Tommola,Photosynth. Res., 2006, 87, 267–279.
10 V. I. Novoderezhkin and R. van Grondelle, Phys. Chem.Chem. Phys., 2010, 12, 7352–7365.
11 V. Novoderezhkin, A. Marin and R. van Grondelle, Phys.Chem. Chem. Phys., 2011, 13, 17093–17103.
12 F. Muh, M. Madjet and T. Renger, J. Phys. Chem. B, 2010,114, 13517–13535.
13 T. Renger, M. E. Madjet, A. Knorr and F. Muh, J. PlantPhysiol., 2011, 168, 1497–1509.
14 Z. F. Liu, H. C. Yan, K. B. Wang, T. Y. Kuang, J. P. Zhang,L. L. Gui, X. M. An and W. R. Chang, Nature, 2004, 428, 287–292.
15 M. A. Palacios, J. Standfuss, M. Vengris, B. F. van Oort,I. H. M. van Stokkum, W. Kuhlbrandt, H. van Amerongenand R. van Grondelle, Photosynth. Res., 2006, 88, 269–285.
16 G. S. Schlau-Cohen, T. R. Calhoun, N. S. Ginsberg, E. L.Read, M. Ballottari, R. Bassi, R. van Grondelle and G. R.Fleming, J. Phys. Chem. B, 2009, 113, 15352–15363.
17 T. R. Calhoun, N. S. Ginsberg, G. S. Schlau-Cohen,Y. C. Cheng, M. Ballottari, R. Bassi and G. R. Fleming,J. Phys. Chem. B, 2009, 113, 16291–16295.
18 G. Panitchayangkoon, D. Hayes, K. A. Fransted, J. R. Caram,E. Harel, J. Z. Wen, R. E. Blankenship and G. S. Engel,Proc. Natl. Acad. Sci. U. S. A., 2010, 107, 12766–12770.
19 E. Collini, C. Y. Wong, K. E. Wilk, P. M. G. Curmi, P. Brumerand G. D. Scholes, Nature, 2010, 463, 644–U669.
20 J. M. Anna, E. E. Ostroumov, K. Maghlaoui, J. Barber andG. D. Scholes, J. Phys. Chem. Lett., 2012, 3, 3677–3684.
21 H.-S. Tan, J. Chem. Phys., 2008, 129, 124501.22 S. Yan and H.-S. Tan, Chem. Phys., 2009, 360, 110–115.
23 Z. Zhang, K. L. Wells, E. W. J. Hyland and H.-S. Tan,Chem. Phys. Lett., 2012, 550, 156–161.
24 P. E. Tekavec, J. A. Myers, K. L. M. Lewis and J. P. Ogilvie,Opt. Lett., 2009, 34, 1390–1392.
25 P. F. Tekavec, J. A. Myers, K. L. M. Lewis, F. D. Fuller andJ. P. Ogilvie, Opt. Express, 2010, 18, 11015–11024.
26 P. A. Tekavec, K. L. M. Lewis, F. D. Fuller, J. A. Myers andJ. P. Ogilvie, IEEE J. Sel. Top. Quantum Electron., 2012, 18,210–217.
27 J. D. Hybl, A. W. Albrecht, S. M. G. Faeder and D. M. Jonas,Chem. Phys. Lett., 1998, 297, 307–313.
28 D. B. Turner, K. E. Wilk, P. M. G. Curmi and G. D. Scholes,J. Phys. Chem. Lett., 2011, 2, 1904–1911.
29 S. Caffarri, R. Croce, J. Breton and R. Bassi, J. Biol. Chem.,2001, 276, 35924–35933.
30 A. Monmayrant, A. Arbouet, B. Girard, B. Chatel, A. Barman,B. J. Whitaker and D. Kaplan, Appl. Phys. B: Lasers Opt.,2005, 81, 177–180.
31 A. Ishizaki, T. R. Calhoun, G. S. Schlau-Cohen and G. R.Fleming, Phys. Chem. Chem. Phys., 2010, 12, 7319–7337.
32 K. L. Wells, Z. Y. Zhang, J. R. Rouxel and H. S. Tan, J. Phys.Chem. B, 2013, 117, 2294–2299.
33 I. H. M. van Stokkum, D. S. Larsen and R. van Grondelle,Biochim. Biophys. Acta, 2004, 1657, 82–104.
34 A. R. Holzwarth, in Biophysical Techniques in Photosynthesis,ed. J. Amesz and A. J. Hoff, Kluwer Academic Publishers,Dordrecht, 1996, pp. 75–92.
35 X. W. Pan, M. Li, T. Wan, L. F. Wang, C. J. Jia, Z. Q. Hou,X. L. Zhao, J. P. Zhang and W. R. Chang, Nat. Struct. Mol.Biol., 2011, 18, 309–315.
36 R. Croce, M. G. Muller, R. Bassi and A. R. Holzwarth,Biophys. J., 2003, 84, 2508–2516.
37 G. S. Schlau-Cohen, T. R. Calhoun, N. S. Ginsberg,M. Ballottari, R. Bassi and G. R. Fleming, Proc. Natl. Acad.Sci. U. S. A., 2010, 107, 13276–13281.
38 N. S. Ginsberg, J. A. Davis, M. Ballottari, Y. C. Cheng,R. Bassi and G. R. Fleming, Proc. Natl. Acad. Sci. U. S. A.,2011, 108, 3848–3853.
39 G. S. Schlau-Cohen, E. De Re, R. J. Cogdell and G. R.Fleming, J. Phys. Chem. Lett., 2012, 3, 2487–2492.
40 Z. Zhang, K. L. Wells and H.-S. Tan, Opt. Lett., 2012, 37,5058–5060.
41 Z. Zhang, K. L. Wells, M. T. Seidel and H.-S. Tan, J. Phys.Chem. B, 2013, 117, 15369–15385.
PCCP Paper
Copyright © 2022 FDOKUMEN