Pathological Voice Analysis and Classification Based on Empirical Mode Decomposition
18
Pathological Voice Analysis and Classification Based on Empirical Mode Decomposition Gast´ on Schlotthauer 1,4 , Mar´ ıa E. Torres 1,3,4 , and Hugo L. Rufiner 2,3,4 1 Lab. de Se˜ nales y Din´amicas no Lineales, Fac. de Ingenier´ ıa Universidad Nacional de Entre R´ ıos, Oro Verde, Entre R´ ıos, Argentina. [email protected] 2 Lab. de Cibern´ etica, Fac. de Ingenier´ ıa, UNER, Oro Verde, Entre R´ ıos, Argentina. 3 (), Fac. de Ing. y Cs. Hs., Univ. Nac. del Litoral, Santa Fe, Argentina. 4 Consejo Nacional de Investigaciones Cient´ ıficas y T´ ecnicas (CONICET), Argentina. Abstract. Empirical mode decomposition (EMD) is an algorithm for signal analysis recently introduced by Huang. It is a completely data- driven non-linear method for the decomposition of a signal into AM - FM components. In this paper two new EMD-based methods for the analysis and classification of pathological voices are presented. They are applied to speech signals corresponding to real and simulated sustained vowels. We first introduce a method that allows the robust extraction of the fundamental frequency of sustained vowels. Its determination is crucial for pathological voice analysis and diagnosis. This new method is based on the ensemble empirical mode decomposition (EEMD) algo- rithm and its performance is compared with others from the state of the art. As a second EMD-based tool, we explore spectral properties of the intrinsic mode functions and apply them to the classification of normal and pathological sustained vowels. We show that just using a ba- sic pattern classification algorithm, the selected spectral features of only three modes are enough to discriminate between normal and pathological voices. 1 Introduction Empirical Mode Decomposition (EMD) has been recently proposed by Huang et al. [1] to adaptively decompose nonlinear and non stationary signals in a sum of well-behaved AM-FM components, called Intrinsic Mode Functions (IMFs). This new technique has received the attention of the scientific community, both in applications [2,3] and in its interpre- tation [4,5]. The method consists in a local and fully data-driven splitting of a signal, in fast and slow oscillations. The advantage of an AM-FM resonance model of speech was previously discussed in [6], where using a Gabor filter bank with six fixed band pass filters, nonlinear features were extracted for instantaneous frequency estimation, phoneme clas- sification, and automatic speech recognition. In this work, we propose two new methods based on EMD (and its variants) with focus in two pathological voice applications: differential diagnosis and fundamental sinc( i) Research Center for Signals, Systems and Computational Intelligence (fich.unl.edu.ar/sinc) G. Schlotthauer, M. E. Torres & H. L. Rufiner; "Pathological Voice Analysis and Classification Based on Empirical Mode Decomposition" Development of Multimodal Interfaces: Active Listening and Synchrony, Vol. 5967, pp. 364–-381, 2010.
Transcript of Pathological Voice Analysis and Classification Based on Empirical Mode Decomposition
Pathological Voice Analysis and ClassificationBased on Empirical Mode Decomposition
Gaston Schlotthauer1,4, Marıa E. Torres1,3,4, and Hugo L. Rufiner2,3,4
1 Lab. de Senales y Dinamicas no Lineales, Fac. de IngenierıaUniversidad Nacional de Entre Rıos, Oro Verde, Entre Rıos, Argentina.
[email protected] Lab. de Cibernetica, Fac. de Ingenierıa, UNER, Oro Verde, Entre Rıos, Argentina.
3 𝑆𝐼𝑁𝐶(𝑖), Fac. de Ing. y Cs. Hs., Univ. Nac. del Litoral, Santa Fe, Argentina.4 Consejo Nacional de Investigaciones Cientıficas y Tecnicas (CONICET), Argentina.
Abstract. Empirical mode decomposition (EMD) is an algorithm forsignal analysis recently introduced by Huang. It is a completely data-driven non-linear method for the decomposition of a signal into AM -FM components. In this paper two new EMD-based methods for theanalysis and classification of pathological voices are presented. They areapplied to speech signals corresponding to real and simulated sustainedvowels. We first introduce a method that allows the robust extractionof the fundamental frequency of sustained vowels. Its determination iscrucial for pathological voice analysis and diagnosis. This new methodis based on the ensemble empirical mode decomposition (EEMD) algo-rithm and its performance is compared with others from the state ofthe art. As a second EMD-based tool, we explore spectral propertiesof the intrinsic mode functions and apply them to the classification ofnormal and pathological sustained vowels. We show that just using a ba-sic pattern classification algorithm, the selected spectral features of onlythree modes are enough to discriminate between normal and pathologicalvoices.
1 Introduction
Empirical Mode Decomposition (EMD) has been recently proposed byHuang et al. [1] to adaptively decompose nonlinear and non stationarysignals in a sum of well-behaved AM-FM components, called IntrinsicMode Functions (IMFs). This new technique has received the attentionof the scientific community, both in applications [2,3] and in its interpre-tation [4,5]. The method consists in a local and fully data-driven splittingof a signal, in fast and slow oscillations. The advantage of an AM-FMresonance model of speech was previously discussed in [6], where usinga Gabor filter bank with six fixed band pass filters, nonlinear featureswere extracted for instantaneous frequency estimation, phoneme clas-sification, and automatic speech recognition. In this work, we proposetwo new methods based on EMD (and its variants) with focus in twopathological voice applications: differential diagnosis and fundamental
sinc
(i)
Res
earc
h C
ente
r fo
r Si
gnal
s, S
yste
ms
and
Com
puta
tiona
l Int
ellig
ence
(fi
ch.u
nl.e
du.a
r/si
nc)
G. S
chlo
tthau
er, M
. E. T
orre
s &
H. L
. Ruf
iner
; "Pa
thol
ogic
al V
oice
Ana
lysi
s an
d C
lass
ific
atio
n B
ased
on
Em
piri
cal M
ode
Dec
ompo
sitio
n"D
evel
opm
ent o
f M
ultim
odal
Int
erfa
ces:
Act
ive
Lis
teni
ng a
nd S
ynch
rony
, Vol
. 596
7, p
p. 3
64–-
381,
201
0.

frequency extraction. Preliminary versions of these algorithms were pre-sented in [7,8,9].The fundamental period 𝑇0 of a voiced speech signal can be definedas the elapsed time between two successive laryngeal pulses, and thefundamental frequency or pitch is 𝐹0 = 1/𝑇0 [10]. Even if 𝐹0 is useful fora wide range of applications, its reliable estimation is still considered oneof the most difficult tasks. In speech, 𝐹0 variations contribute to prosody,and in tonal languages, they also help to distinguish segmental categories.Current applications are related with speech and speaker recognition,speech based emotions classifications, voice morphing and the analysisof pathological voices.In the clinical evaluation of disordered voices, the analysis of 𝐹0 pertur-bation is a standard procedure in order to assess the severity of patholo-gies and in monitoring the patient progress [11]. A reliable and accurateestimation of 𝐹0 is essential for this application. Conventional 𝐹0 extrac-tion algorithms assume that speech is produced by a linear system andthat speech signals are locally stationary [10]. However, in the case ofpathological voices, these assumptions are over-simplifications.In voice pathology assessment, several parameters extracted from pitchestimation are commonly used. It is therefore important to have a goodand reliable 𝐹0 estimation. Unfortunately, no previous method for 𝐹0
extraction operates consistently in the case of pathological voices. Thisis due to the fact that the vocal folds vibrations of pathological voicespresent more serious and complex irregularities than the case of normalvoices. Some of the difficulties that arise in 𝐹0 estimation, especially whenpathological voices are analyzed, include period-doubling and period-halving.A few EMD based algorithms have been proposed for 𝐹0 extraction[12,13], however they suffer the “mode mixing” problem. Wu and Huang[14] proposed a modification of the EMD algorithm, called EnsembleEMD (EEMD), which largely alleviates this effect, but at the price of avery high computational cost. Taking advantage of its benefits, here wepresent a new method based on EEMD which is able to extract the 𝐹0
in normal and pathological sustained vowels, improving the behavior ofthe previous estimators.In the present paper, we also explore some spectral properties of theIMFs. The comparison of real data IMFs spectra allows us to presentpreliminary results of an application of this method to the analysis anddiscrimination between normal and pathological speech signals.We study a couple of dysphonias with different etiology [15], frequentlyconfused and not easily identified by local clinicians: Adductor Spas-modic Dysphonia (AdSD) and Muscular Tension Dysphonia (MTD).In recent years, the use of acoustical measures, in combination withpattern recognition techniques, has motivated the appearance of severalworks concerning the automatic discrimination between pathological andnormal voices. In [16], a database with 89 records of the sustained vowel/a/ corresponding to normal and pathological (MTD and AdSD) caseswere separated into three classes with a 93.26 % of correct classifications,and into two classes (normal and pathological) reaching a 98.94 %, over-coming the best reported results in the literature. The authors used a
sinc
(i)
Res
earc
h C
ente
r fo
r Si
gnal
s, S
yste
ms
and
Com
puta
tiona
l Int
ellig
ence
(fi
ch.u
nl.e
du.a
r/si
nc)
G. S
chlo
tthau
er, M
. E. T
orre
s &
H. L
. Ruf
iner
; "Pa
thol
ogic
al V
oice
Ana
lysi
s an
d C
lass
ific
atio
n B
ased
on
Em
piri
cal M
ode
Dec
ompo
sitio
n"D
evel
opm
ent o
f M
ultim
odal
Int
erfa
ces:
Act
ive
Lis
teni
ng a
nd S
ynch
rony
, Vol
. 596
7, p
p. 3
64–-
381,
201
0.
pattern recognition scheme with eight acoustical parameters and neuralnetworks. In this paper we show that the spectral properties of the IMFscould be useful to discriminate between normal and pathological voices.These preliminary results suggest that they might provide also clues inorder to differentiate between AdSD and MTD.
The paper is organized as follows. In Sec. 2 the data used for the experi-ments and basic concepts to be used are described. In Sec. 3 the EEMDbased 𝐹0 extraction method is presented. In Sect. 4 the pathologicalvoice classification problem is stated and a method based on EMD isdescribed. In Sect. 5 the results for both methods are shown. Finally, inSec. 6 the discussion and conclusions are presented.
2 Materials and Methods
2.1 Artificial Data
In order to explore the performances of the proposed techniques, exper-iments were performed with synthetic normal and pathological voices.These signals have been generated using a phonation model that in-corporates the perturbations involved in normal voices and in commonlaryngeal pathologies. This allowed us to maintain controlled experimen-tal conditions, making possible the discussion of the technique and theselection of the appropriate parameters.
The speech signal 𝑦[𝑛] was modeled using the classical linear predictionmodel 𝑦[𝑛] = −∑𝑃
𝑝=1 𝑦[𝑛− 𝑝]𝑎[𝑝] + 𝑥[𝑛], where 𝑎[𝑝] are the linear pre-dictor coefficients, and 𝑥[𝑛] is the input representing the glottal pulses.The input is modeled by a train of pulses, with variable period and am-plitude:
𝑥[𝑛] =𝐾∑
𝑘=1
𝐺[𝑘] 𝛿
[𝑛−
𝑘∑𝑖=1
𝑃 [𝑖]
],
where 𝐺[𝑘] are the corresponding gain coefficients and 𝑃 the periods’values. Different stochastic models for jitter and shimmer have been pro-posed in the literature. In this work we assume, for a pulse train with ajitter 𝑗𝑖𝑡𝑡%, a normal probability distribution for each period 𝑃 :
𝑝𝑑𝑓 (𝑃 [𝑘]) =1
𝜎𝑃
√2𝜋
exp
(− (𝑃 [𝑘]− 𝑃0)
2
2𝜎2𝑃
),
where 𝑃0 is the mean period and 𝜎𝑃 = 𝑃0 𝑗𝑖𝑡𝑡%200
. In order to avoid periodapproximation problems, a uniform randomized roundness function anda sampling frequency of 50 KHz have been used.
In a similar way, the gain coefficients distribution is given by:
𝑝𝑑𝑓 (𝐺[𝑘]) =1
𝜎𝐺
√2𝜋
exp
(− (𝐺[𝑘]− 1)2
2𝜎2𝐺
).
Four hundred signals were synthesized, 100 corresponding to male and100 to female, for each group of normal and pathological voices. For
sinc
(i)
Res
earc
h C
ente
r fo
r Si
gnal
s, S
yste
ms
and
Com
puta
tiona
l Int
ellig
ence
(fi
ch.u
nl.e
du.a
r/si
nc)
G. S
chlo
tthau
er, M
. E. T
orre
s &
H. L
. Ruf
iner
; "Pa
thol
ogic
al V
oice
Ana
lysi
s an
d C
lass
ific
atio
n B
ased
on
Em
piri
cal M
ode
Dec
ompo
sitio
n"D
evel
opm
ent o
f M
ultim
odal
Int
erfa
ces:
Act
ive
Lis
teni
ng a
nd S
ynch
rony
, Vol
. 596
7, p
p. 3
64–-
381,
201
0.
each situation, the model parameters were obtained from the statis-tics of real signals, adopting a fundamental frequency with a distribu-tion 𝒩 (144, 22.5) for male voices and 𝒩 (245, 24.5) for female voices; a𝒩 (0.4, 0.1) jitter distribution for normal voices and 𝒩 (5, 1) for patho-logical voices; and a shimmer with distribution 𝒩 (1, 0.2) and 𝒩 (8, 1)respectively.
2.2 Real Data
The implementation of the method proposed for estimation of 𝐹0 wasanalyzed using a database of vowel signals from 710 persons of both gen-ders [17]. It includes sustained phonation of the vowel /a/ of 53 healthyindividuals and patients with a wide variety of voice disorders (organic,neurological, traumatic and psychogenic). The healthy voices belong to21 males and 32 females, with mean ages 38.81 ± 8.49 and 34.16 ± 7.87years, respectively. The set of 657 pathological voices contains samples of169 male speakers, 238 female speakers and 247 without data about gen-der. The average ages are 49.80±17.46 years for males and 46.83±17.41years for females. Some of the present disorders are adductor and ab-ductor spasmodic dysphonia, A-P squeezing, cysts, erythema, gastric re-flux,granulation tissue, hyperfunction, interaytenoid hyperplasia, kerato-sis / leukoplakia, paralysis, polypoid degeneration, scarring, ventricularcompression, vocal fold edema, vocal fold edema, vocal fold polyp, vocaltremor, and others. In this database, the average fundamental frequencyof normal voices is between 120.39 and 316.50 Hz.For voice classification experiments a corpus of sustained vowels /a/was used. The speech utterances from this corpus were registered in ananechoic room (global reverberation time < 30 msec.). Each subject wasrequested to phonate the sustained vowels as steadily as possible towardan electrodynamic unidirectional microphone Shure SM58 at a distanceof about 15 cm from the mouth. Each vowel had a duration of 1 to 5 sec.The data was digitized with a professional Turtle Beach Multisound FIJIsound card, at 44 KHz, 16 bits and no compression was used. Later, thedata was low-pass filtered and down-sampled to 22 KHz. All the voiceswere classified by an experienced voice pathologist. It was considereda first set of 106 voices (half normal and half of diverse pathologies,randomly selected from a larger data base), here named Data Base DB1,and a second one of 14 normal voices, 13 of AdSD, and 6 of MTD, herenamed Data Base DB2.Here it is important to point out that patients affected with AdSD mayattempt to prevent their symptoms by increasing the tension in theirlaryngeal muscles in an effort to compensate their disease signs. Theconsequence is the appearance of additional physical disturbances simi-lar to MTD along with AdSD. The over-riding symptoms of MTD canescalate over time making difficult to discern the underlying symptomsof AdSD [18].
2.3 EMD and EEMD
As it was stated in Sec. 1, EMD decomposes a signal 𝑥(𝑡) into a (usually)small number of IMFs. IMFs must satisfy two conditions: (i) the number
sinc
(i)
Res
earc
h C
ente
r fo
r Si
gnal
s, S
yste
ms
and
Com
puta
tiona
l Int
ellig
ence
(fi
ch.u
nl.e
du.a
r/si
nc)
G. S
chlo
tthau
er, M
. E. T
orre
s &
H. L
. Ruf
iner
; "Pa
thol
ogic
al V
oice
Ana
lysi
s an
d C
lass
ific
atio
n B
ased
on
Em
piri
cal M
ode
Dec
ompo
sitio
n"D
evel
opm
ent o
f M
ultim
odal
Int
erfa
ces:
Act
ive
Lis
teni
ng a
nd S
ynch
rony
, Vol
. 596
7, p
p. 3
64–-
381,
201
0.
0 20 40 60-1
0
1EMD
/a/
0 20 40 60-0.5
0
0.5
IMF
2
0 20 40 60-0.5
0
0.5
IMF
3
0 20 40 60-0.2
0
0.2
IMF
4
0 20 40 60-0.2
0
0.2
IMF
5
Time (ms)
0 20 40 60-1
0
1EEMD
/a/
0 20 40 60-0.05
0
0.05
IMF
2
0 20 40 60-0.5
0
0.5
IMF
3
0 20 40 60-0.2
0
0.2
IMF
4
0 20 40 60-0.2
0
0.2
IMF
5
Time (ms)
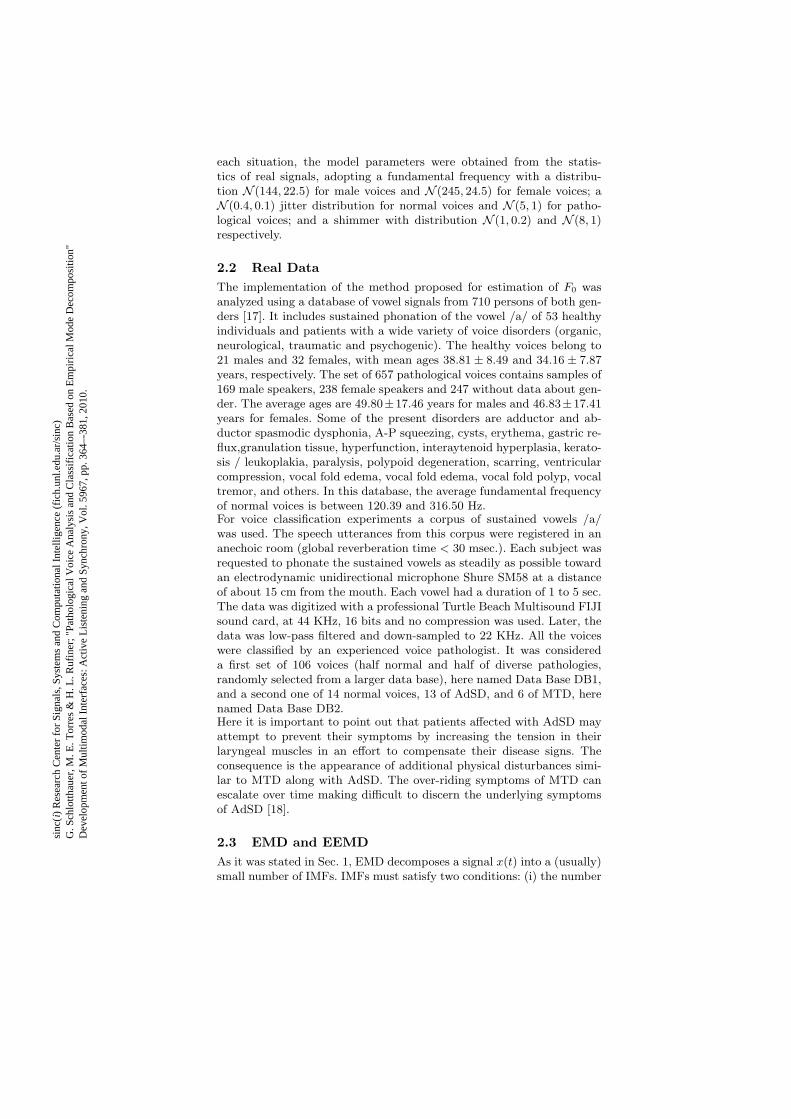
Fig. 1. A sustained real vowel /a/ corresponding to a normal subject, analyzed byEMD (left column) and EEMD (right column). The corresponding IMFs 2 to 5 areshown. In IMFs 4 and 5 corresponding to EMD two segments where “mode mixing”occurs, are marked with circles.
of extrema and the number of zero crossings must either be equal ordiffer at most by one; and (ii) at any point, the mean value of the upperand lower envelopes is zero.
Given a signal 𝑥(𝑡), the non-linear EMD algorithm, as proposed in [1],is described by the following algorithm:
1. find all extrema of 𝑥(𝑡),
2. interpolate between minima (maxima), obtaining the envelope 𝑒𝑚𝑖𝑛(𝑡)(𝑒𝑚𝑎𝑥 (𝑡)),
3. compute the local mean 𝑚(𝑡) = (𝑒𝑚𝑖𝑛(𝑡) + 𝑒𝑚𝑎𝑥(𝑡)) /2,
4. extract the IMF candidate 𝑑(𝑡) = 𝑥(𝑡)−𝑚(𝑡),
5. check the properties of 𝑑(𝑡):
– if 𝑑(𝑡) is not an IMF, replace 𝑥(𝑡) with 𝑑(𝑡) and go to step 1,
– if 𝑑(𝑡) is an IMF, evaluate 𝑟(𝑡) = 𝑥(𝑡)− 𝑑(𝑡),
6. repeat the steps 1 to 5 by sifting the residual signal 𝑟(𝑡). The siftingprocess ends when the residue satisfies a predefined stopping crite-rion [4].
As already pointed out, one of the most significant EMD drawbacks forsome applications is the so called mode mixing. It is illustrated in theleft column of Fig. 1, where 60 ms of a sustained vowel /a/ are analyzedby EMD. The four IMFs with higher energy are shown. The appearanceof oscillations of notoriously disparate scales in IMF 2 is clear. Anotherexample can be seen in IMF 5, where oscillations are marked with circles.These oscillations are very similar to those marked on IMF 4.
sinc
(i)
Res
earc
h C
ente
r fo
r Si
gnal
s, S
yste
ms
and
Com
puta
tiona
l Int
ellig
ence
(fi
ch.u
nl.e
du.a
r/si
nc)
G. S
chlo
tthau
er, M
. E. T
orre
s &
H. L
. Ruf
iner
; "Pa
thol
ogic
al V
oice
Ana
lysi
s an
d C
lass
ific
atio
n B
ased
on
Em
piri
cal M
ode
Dec
ompo
sitio
n"D
evel
opm
ent o
f M
ultim
odal
Int
erfa
ces:
Act
ive
Lis
teni
ng a
nd S
ynch
rony
, Vol
. 596
7, p
p. 3
64–-
381,
201
0.
0 10 20 30 40 50 60-0.8
-0.6
-0.4
-0.2
0
0.2
0.4
0.6
Time (ms)
Am
plit
ude
0 200 400 600 800 1000 1200 1400 1600 1800 2000
-120
-100
-80
-60
-40
-20
Frequency (Hz)
Pow
er/
Fre
quency (
dB
/Hz)
a)
b)
F0=216.5 Hz
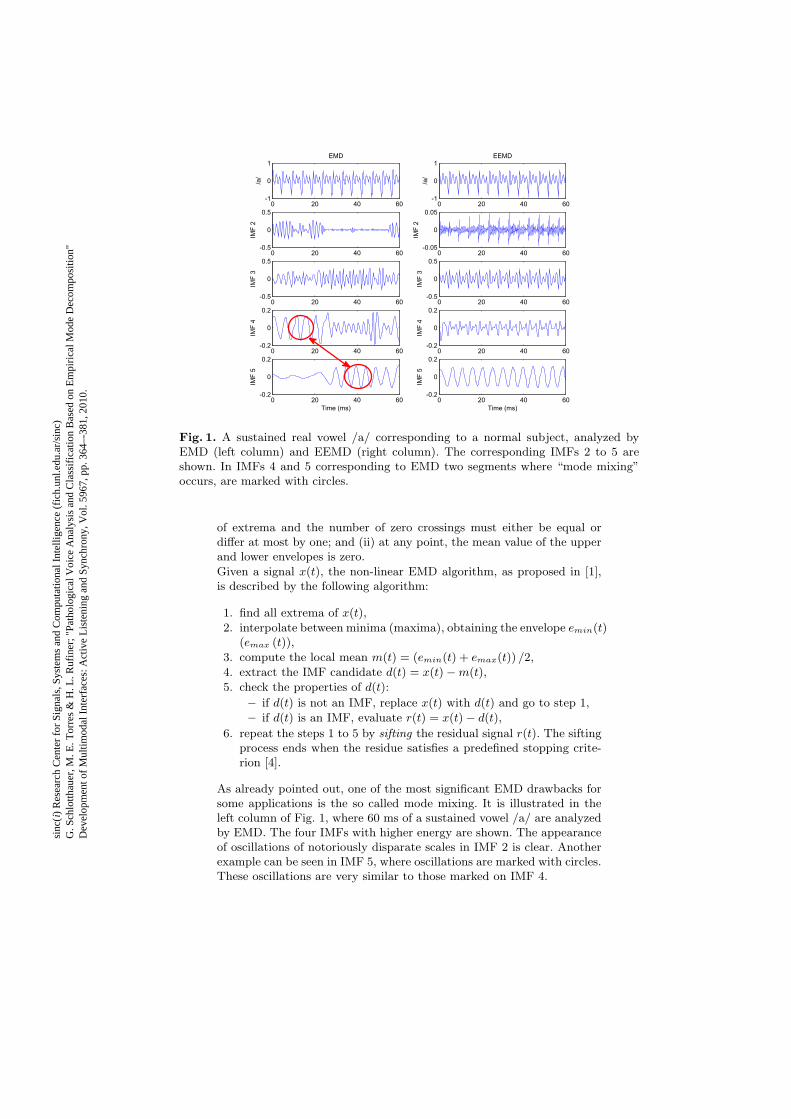
Fig. 2. a) A sustained real vowel /a/ corresponding to a normal subject (blue) andIMF 5, obtained by EEMD (red). b) PSD estimates of the sustained vowel /a/ (blue)and its EEMD based IMF 5 (red). The peak of the spectrum of the IMF 5 is markedas 𝐹0 = 216.5 Hz.
EEMD5, is an extension of the previously described EMD. It defines thetrue IMF components as the mean of certain ensemble of trials, eachobtained by adding white noise of finite variance to the original signal.This method alleviates the mode mixing of the EMD algorithm [14].An example of the EEMD abilities can be seen in the right column ofFig. 1. An ensemble size of 𝑁𝑒 = 5000 was used, and the added whitenoise in each ensemble member had a standard deviation of 𝜖 = 0.2. Ingeneral a few hundred of ensemble members provide good results [14].The remaining noise, defined as the difference between the original signaland the sum of the IMFs obtained by EEMD, has a standard deviation𝜖𝑟 = 𝜖/𝑁𝑒. For a complete discussion about the number of ensemblemembers and noise standard deviation, we refer to [14]. The IMFs 2 to5 are shown in the right column of Fig. 1, below the sustained vowel/a/. The IMFs obtained by EEMD seem to be much more regular thanthe EMD version and, additionally, we can appreciate that in IMF 5 theoscillations capture the fundamental period of the sustained /a/.
This fact is remarked in Fig. 2.a, where the sustained vowel /a/ is pic-tured and the EEMD related IMF 5 is superimposed in a red line. In Fig.2.b the power spectral densities (PSD) of /a/ and IMF 5 are plotted. ThePSD of IMF 5 has a well defined peak in the frequency 𝐹 = 216.5 Hz,which can be understood as a mean fundamental frequency. A visualinspection of the waveform (Fig. 2.a) allows the estimation of the funda-
5 Matlab software available at http://rcada.ncu.edu.tw/.
sinc
(i)
Res
earc
h C
ente
r fo
r Si
gnal
s, S
yste
ms
and
Com
puta
tiona
l Int
ellig
ence
(fi
ch.u
nl.e
du.a
r/si
nc)
G. S
chlo
tthau
er, M
. E. T
orre
s &
H. L
. Ruf
iner
; "Pa
thol
ogic
al V
oice
Ana
lysi
s an
d C
lass
ific
atio
n B
ased
on
Em
piri
cal M
ode
Dec
ompo
sitio
n"D
evel
opm
ent o
f M
ultim
odal
Int
erfa
ces:
Act
ive
Lis
teni
ng a
nd S
ynch
rony
, Vol
. 596
7, p
p. 3
64–-
381,
201
0.
0 5 10 15 20 25 30 35 40 45 50100
150
200
250
300
350
Index
F0 (
Hz)
IMF 5
IMF 6
IMF 7
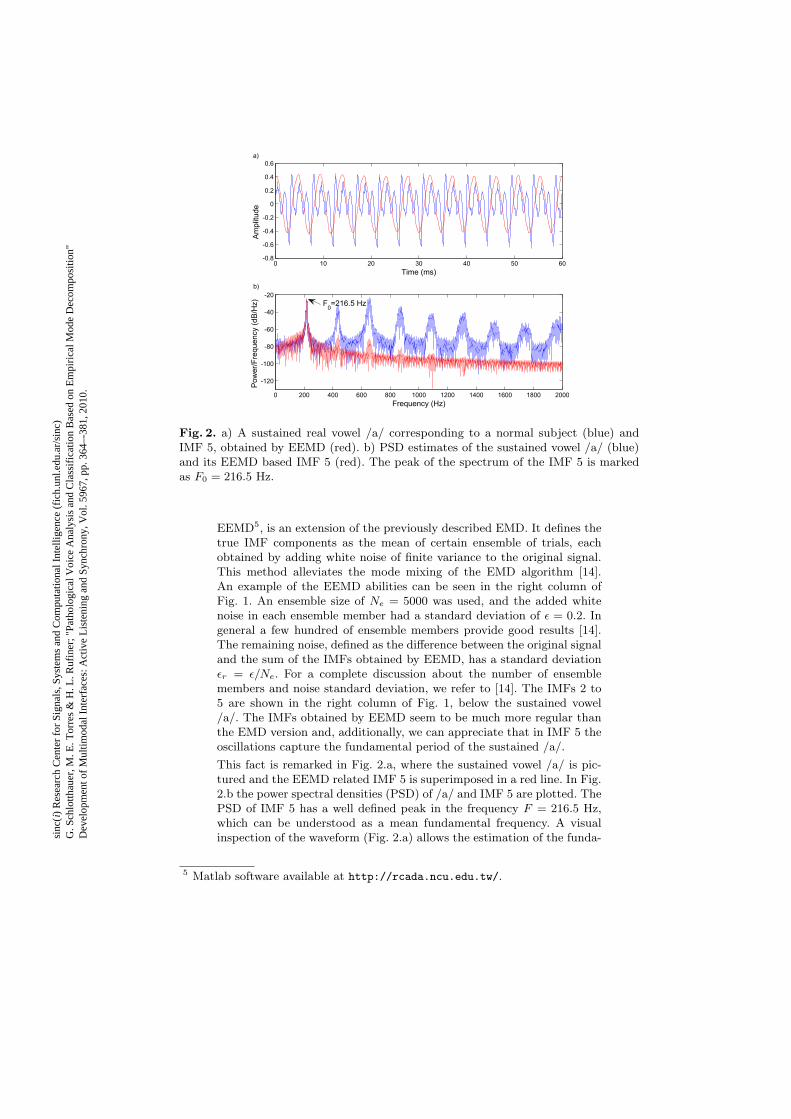
Fig. 3. 𝐹0 average over the 53 analyzed sustained real vowels corresponding to normalsubjects. Circles (red), stars (blue) and diamonds (black) indicate the signals in which𝐹0 was found in modes 5, 6 and 7 respectively.
mental frequency as close to 200 Hz, what is in agreement with the PSDof IMF 5.
3 Instantaneous Frequency Extraction
In this section we present and discuss the main ideas of the algorithm,based on EEMD, for the extraction of 𝐹0.
Once the EEMD is computed, we want to identify the mode in which𝐹0 stands almost alone. With this in mind, a visual inspection of thedecomposition of the normal voices in our database, allows to identifythe candidate mode, as can be appreciated observing the second columnin Fig. 1 and Fig. 2.a. Clearly 𝐹0 is present in modes 3, 4 and 5. In the twofirst ones it is mixed with other components of the original signal, butit appears alone in the last one. This fact is reinforced by the sinusoidallike waveform of IMF5.
In our 53 samples of normal voices, 𝐹0 was found in the IMFs 5, 6 and7. Only in two cases it has been found in IMF 7, with average valuesof 120.394 Hz and 121.102 Hz, while in nineteen cases it was found inIMF 6, with average values in between 121.652 Hz and 189.295 Hz. Inthe remaining 32 voice, 𝐹0 was found in IMF 5 with average values inbetween 193.934 Hz and 316.504 Hz.
Fig. 3 shows the average values of the instantaneous frequencies obtainedfrom the modes identified by visual inspection in each normal voice in ourdatabase. In red circles are indicated those voices whose 𝐹0 was identifiedat mode 5, while the blue stars and the black diamonds indicate thosecases corresponding to an identification in modes 6 and 7 respectively. Itcan be appreciated that it exists a relationship between the 𝐹0 averagevalue and the mode in which 𝐹0 has been identified. This is consistentwith the results of Flandrin et al.[19]. They showed that, when appliedto white noise, the EMD acts as an adaptive dyadic filter bank.
In order to obtain an automatic method to select the mode in which 𝐹0
is hidden, we explore the discrimination abilities of the Shannon entropyin the present context. In the discrete case, it is defined as: 𝐻(𝑥) =−∑𝑀
𝑖=1 𝑝𝑖 log (𝑝𝑖), with the understanding that 𝑝 log(𝑝) = 0 if 𝑝 = 0,
sinc
(i)
Res
earc
h C
ente
r fo
r Si
gnal
s, S
yste
ms
and
Com
puta
tiona
l Int
ellig
ence
(fi
ch.u
nl.e
du.a
r/si
nc)
G. S
chlo
tthau
er, M
. E. T
orre
s &
H. L
. Ruf
iner
; "Pa
thol
ogic
al V
oice
Ana
lysi
s an
d C
lass
ific
atio
n B
ased
on
Em
piri
cal M
ode
Dec
ompo
sitio
n"D
evel
opm
ent o
f M
ultim
odal
Int
erfa
ces:
Act
ive
Lis
teni
ng a
nd S
ynch
rony
, Vol
. 596
7, p
p. 3
64–-
381,
201
0.
1 2 3 4 5 6 7 8 9 10
3.5
4
4.5
5
5.5
6
H
1 2 3 4 5 6 7 8 9 10
3.5
4
4.5
5
5.5
6
1 2 3 4 5 6 7 8 9 10
-7
-6
-5
-4
-3
-2
-1
0
DH
Mode1 2 3 4 5 6 7 8 9 10
-7
-6
-5
-4
-3
-2
-1
0
Mode
a) b)
c) d)
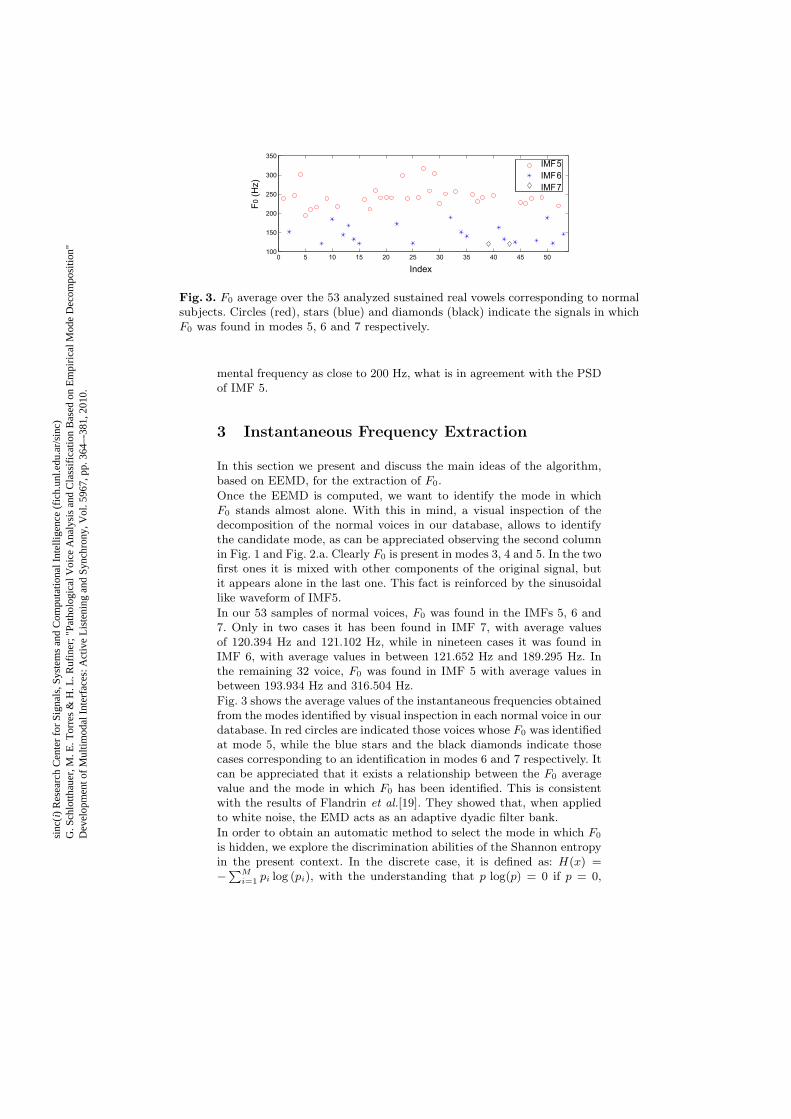
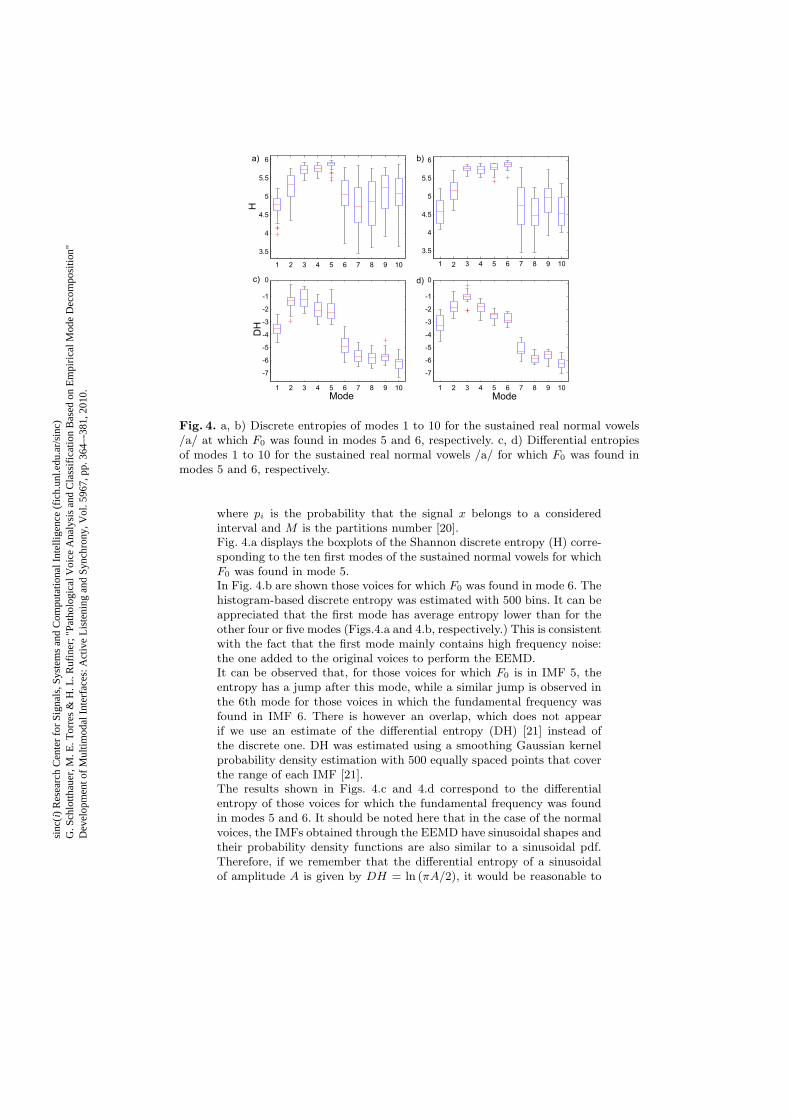
Fig. 4. a, b) Discrete entropies of modes 1 to 10 for the sustained real normal vowels/a/ at which 𝐹0 was found in modes 5 and 6, respectively. c, d) Differential entropiesof modes 1 to 10 for the sustained real normal vowels /a/ for which 𝐹0 was found inmodes 5 and 6, respectively.
where 𝑝𝑖 is the probability that the signal 𝑥 belongs to a consideredinterval and 𝑀 is the partitions number [20].Fig. 4.a displays the boxplots of the Shannon discrete entropy (H) corre-sponding to the ten first modes of the sustained normal vowels for which𝐹0 was found in mode 5.In Fig. 4.b are shown those voices for which 𝐹0 was found in mode 6. Thehistogram-based discrete entropy was estimated with 500 bins. It can beappreciated that the first mode has average entropy lower than for theother four or five modes (Figs.4.a and 4.b, respectively.) This is consistentwith the fact that the first mode mainly contains high frequency noise:the one added to the original voices to perform the EEMD.It can be observed that, for those voices for which 𝐹0 is in IMF 5, theentropy has a jump after this mode, while a similar jump is observed inthe 6th mode for those voices in which the fundamental frequency wasfound in IMF 6. There is however an overlap, which does not appearif we use an estimate of the differential entropy (DH) [21] instead ofthe discrete one. DH was estimated using a smoothing Gaussian kernelprobability density estimation with 500 equally spaced points that coverthe range of each IMF [21].The results shown in Figs. 4.c and 4.d correspond to the differentialentropy of those voices for which the fundamental frequency was foundin modes 5 and 6. It should be noted here that in the case of the normalvoices, the IMFs obtained through the EEMD have sinusoidal shapes andtheir probability density functions are also similar to a sinusoidal pdf.Therefore, if we remember that the differential entropy of a sinusoidalof amplitude 𝐴 is given by 𝐷𝐻 = ln (𝜋𝐴/2), it would be reasonable to
sinc
(i)
Res
earc
h C
ente
r fo
r Si
gnal
s, S
yste
ms
and
Com
puta
tiona
l Int
ellig
ence
(fi
ch.u
nl.e
du.a
r/si
nc)
G. S
chlo
tthau
er, M
. E. T
orre
s &
H. L
. Ruf
iner
; "Pa
thol
ogic
al V
oice
Ana
lysi
s an
d C
lass
ific
atio
n B
ased
on
Em
piri
cal M
ode
Dec
ompo
sitio
n"D
evel
opm
ent o
f M
ultim
odal
Int
erfa
ces:
Act
ive
Lis
teni
ng a
nd S
ynch
rony
, Vol
. 596
7, p
p. 3
64–-
381,
201
0.
Is
Lp(m+1) <Tm<Lp(m)
?
Apply EEMD and extract
the IMFs 1 to 10
Sustained vowel
x(n)
Find the differential entropy
for modes 5 to 8
m=5
m=m+1NO
Find mean F0(Fmean)
YES
Apply a band-pass filter
centered at Fmean
END
Find F0 using
DESA-1
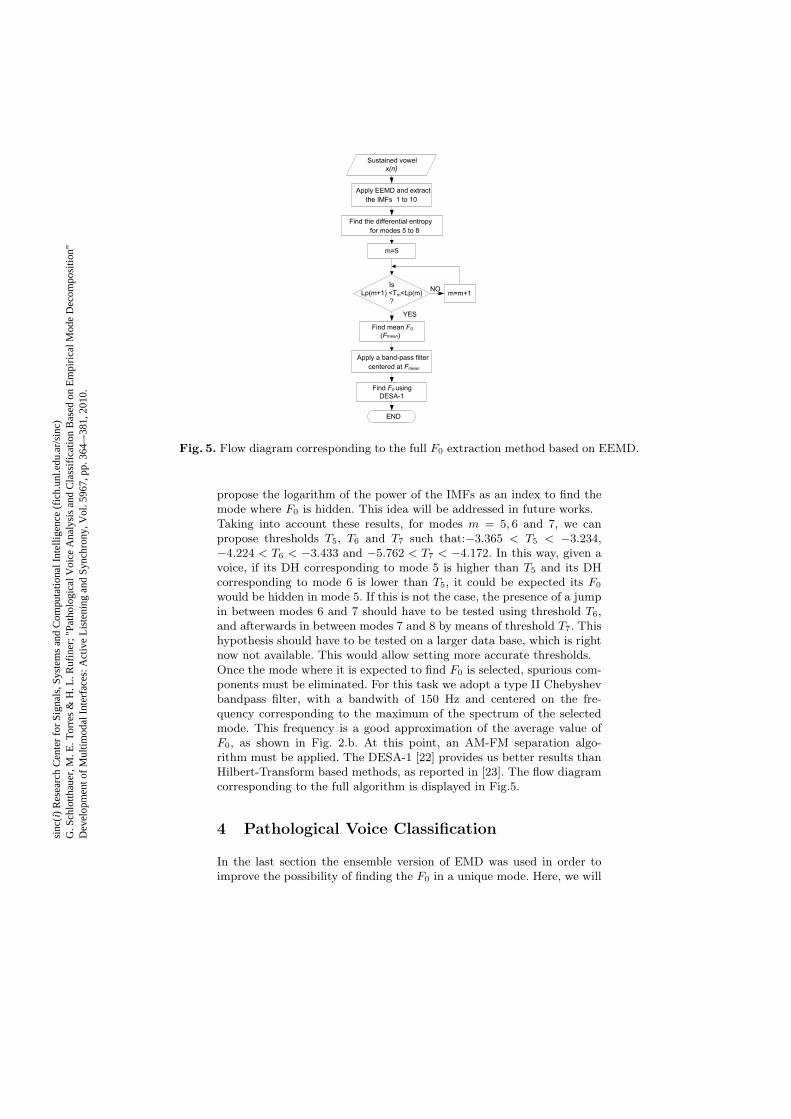
Fig. 5. Flow diagram corresponding to the full 𝐹0 extraction method based on EEMD.
propose the logarithm of the power of the IMFs as an index to find themode where 𝐹0 is hidden. This idea will be addressed in future works.Taking into account these results, for modes 𝑚 = 5, 6 and 7, we canpropose thresholds 𝑇5, 𝑇6 and 𝑇7 such that:−3.365 < 𝑇5 < −3.234,−4.224 < 𝑇6 < −3.433 and −5.762 < 𝑇7 < −4.172. In this way, given avoice, if its DH corresponding to mode 5 is higher than 𝑇5 and its DHcorresponding to mode 6 is lower than 𝑇5, it could be expected its 𝐹0
would be hidden in mode 5. If this is not the case, the presence of a jumpin between modes 6 and 7 should have to be tested using threshold 𝑇6,and afterwards in between modes 7 and 8 by means of threshold 𝑇7. Thishypothesis should have to be tested on a larger data base, which is rightnow not available. This would allow setting more accurate thresholds.Once the mode where it is expected to find 𝐹0 is selected, spurious com-ponents must be eliminated. For this task we adopt a type II Chebyshevbandpass filter, with a bandwith of 150 Hz and centered on the fre-quency corresponding to the maximum of the spectrum of the selectedmode. This frequency is a good approximation of the average value of𝐹0, as shown in Fig. 2.b. At this point, an AM-FM separation algo-rithm must be applied. The DESA-1 [22] provides us better results thanHilbert-Transform based methods, as reported in [23]. The flow diagramcorresponding to the full algorithm is displayed in Fig.5.
4 Pathological Voice Classification
In the last section the ensemble version of EMD was used in order toimprove the possibility of finding the 𝐹0 in a unique mode. Here, we will
sinc
(i)
Res
earc
h C
ente
r fo
r Si
gnal
s, S
yste
ms
and
Com
puta
tiona
l Int
ellig
ence
(fi
ch.u
nl.e
du.a
r/si
nc)
G. S
chlo
tthau
er, M
. E. T
orre
s &
H. L
. Ruf
iner
; "Pa
thol
ogic
al V
oice
Ana
lysi
s an
d C
lass
ific
atio
n B
ased
on
Em
piri
cal M
ode
Dec
ompo
sitio
n"D
evel
opm
ent o
f M
ultim
odal
Int
erfa
ces:
Act
ive
Lis
teni
ng a
nd S
ynch
rony
, Vol
. 596
7, p
p. 3
64–-
381,
201
0.
Normal Voice
EMD
/a/
IMF 1
IMF 2
IMF 3
IMF 4
IMF 5
IMF 6
IMF 7
IMF 8
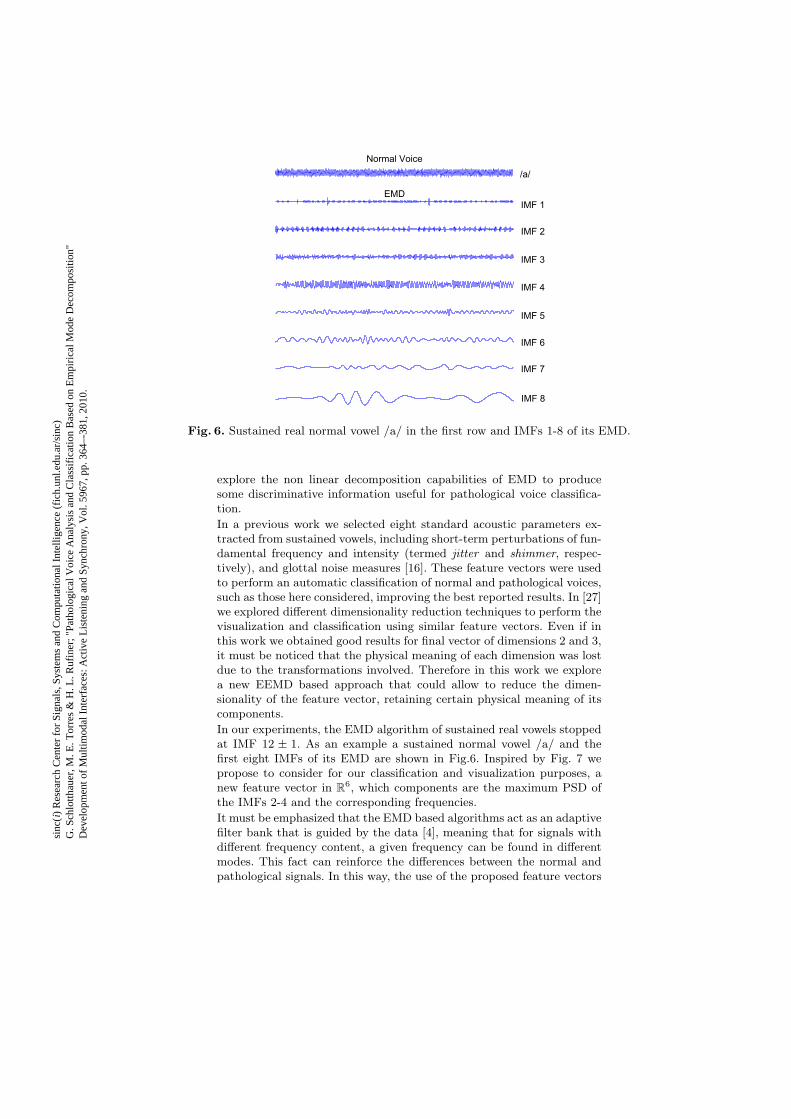
Fig. 6. Sustained real normal vowel /a/ in the first row and IMFs 1-8 of its EMD.
explore the non linear decomposition capabilities of EMD to producesome discriminative information useful for pathological voice classifica-tion.
In a previous work we selected eight standard acoustic parameters ex-tracted from sustained vowels, including short-term perturbations of fun-damental frequency and intensity (termed jitter and shimmer, respec-tively), and glottal noise measures [16]. These feature vectors were usedto perform an automatic classification of normal and pathological voices,such as those here considered, improving the best reported results. In [27]we explored different dimensionality reduction techniques to perform thevisualization and classification using similar feature vectors. Even if inthis work we obtained good results for final vector of dimensions 2 and 3,it must be noticed that the physical meaning of each dimension was lostdue to the transformations involved. Therefore in this work we explorea new EEMD based approach that could allow to reduce the dimen-sionality of the feature vector, retaining certain physical meaning of itscomponents.
In our experiments, the EMD algorithm of sustained real vowels stoppedat IMF 12 ± 1. As an example a sustained normal vowel /a/ and thefirst eight IMFs of its EMD are shown in Fig.6. Inspired by Fig. 7 wepropose to consider for our classification and visualization purposes, anew feature vector in ℝ6, which components are the maximum PSD ofthe IMFs 2-4 and the corresponding frequencies.
It must be emphasized that the EMD based algorithms act as an adaptivefilter bank that is guided by the data [4], meaning that for signals withdifferent frequency content, a given frequency can be found in differentmodes. This fact can reinforce the differences between the normal andpathological signals. In this way, the use of the proposed feature vectors
sinc
(i)
Res
earc
h C
ente
r fo
r Si
gnal
s, S
yste
ms
and
Com
puta
tiona
l Int
ellig
ence
(fi
ch.u
nl.e
du.a
r/si
nc)
G. S
chlo
tthau
er, M
. E. T
orre
s &
H. L
. Ruf
iner
; "Pa
thol
ogic
al V
oice
Ana
lysi
s an
d C
lass
ific
atio
n B
ased
on
Em
piri
cal M
ode
Dec
ompo
sitio
n"D
evel
opm
ent o
f M
ultim
odal
Int
erfa
ces:
Act
ive
Lis
teni
ng a
nd S
ynch
rony
, Vol
. 596
7, p
p. 3
64–-
381,
201
0.

−7 −6 −5 −4 −3 −2 −1 0 1 2−80
−70
−60
−50
−40
−30
−20
−10
0
log2 (f) ( f=Normalized frequency ×π rad/sample)
log 2(PSD) M(dB/rad/sample)
IMF 1
IMF 2
IMF 3IMF 4IMF 5
IMF 6
IMF 7
Fig. 7. Log-log power spectrum density, estimated with Burg algorithm, correspondingto each of the IMFs of a Spanish sustained real normal vowel /a/ displayed in theprevious figure.
could allow to provide new information to improve the discriminationbetween this kind of data.Using these new feature vectors, a𝐾-nearest neighbors’ classification rulewas applied and a 𝐾-fold cross validation method, with 20 subsamples,was used in order to estimate the classifier performance.
5 Results
5.1 Instantaneous Frequency Extraction
Simulated Normal and Pathological Voices For illustrationpurposes, 𝐹0 was extracted with the method proposed in Sec. 3 fromboth normal and pathological simulated sustained vowels /a/. The re-sults are shown in Fig. 8. For comparison, two additional pitch extractionmethods were applied to the same data and also shown in Fig. 8. TheRAPT method (black) [24] was implemented using VOICEBOX6 , whilean autocorrelation-based method (blue) [25] was implemented using thePRAAT software7. The parameters involved in these two algorithms arethe default ones. We can observe in Fig. 8 several evident errors in dou-bling or halving-period events both in RAPT and AC-based methods,specially for the pathological voice case (Fig. 8.b). On the contrary, theEEMD based method here proposed performs smoothly and without er-rors in both simulation conditions.
Real Normal and Pathological Voices As in the previous exam-ple, 𝐹0 was extracted with the method proposed in Sec. 3 and the other
6 VOICEBOX Matlab toolkit v. 1.18 (2008), http://www.ee.ic.ac.uk/hp/staff/
dmb/voicebox/voicebox.html.7 PRAAT v.5.0.32, http://www.praat.org.
sinc
(i)
Res
earc
h C
ente
r fo
r Si
gnal
s, S
yste
ms
and
Com
puta
tiona
l Int
ellig
ence
(fi
ch.u
nl.e
du.a
r/si
nc)
G. S
chlo
tthau
er, M
. E. T
orre
s &
H. L
. Ruf
iner
; "Pa
thol
ogic
al V
oice
Ana
lysi
s an
d C
lass
ific
atio
n B
ased
on
Em
piri
cal M
ode
Dec
ompo
sitio
n"D
evel
opm
ent o
f M
ultim
odal
Int
erfa
ces:
Act
ive
Lis
teni
ng a
nd S
ynch
rony
, Vol
. 596
7, p
p. 3
64–-
381,
201
0.

0.1 0.2 0.3 0.4 0.5 0.6 0.7 0.8 0.9 1
115
116
117
118
119
F0 (
Hz)
0.1 0.2 0.3 0.4 0.5 0.6 0.7 0.8 0.9 1
80
100
120
140
Time (s)
F0 (
Hz)
AC based
RAPT
EEMD based
a)
b)
Fig. 8. 𝐹0 of two simulated sustained vowels /a/ (generated as explained in Sec. 2.1)are analyzed: (a) normal simulated voice (b) pathological simulated voice. The resultsobtained by the autocorrelation based method (blue), RAPT (black) and the proposedEEMD based method (red) are shown.
two methods, from two sustained real normal vowels /a/. The resultsare presented in red in Figs. 9.a (EDC1NAL) and 9.b (JTH1NAL). Evenif the results look similar, a careful inspection would reveal the abovementioned stair-case nature of the last two methods. This windowingartifact could be a problem for instantaneous frequency estimation.
The Pearson correlation coefficient between the mean 𝐹0 of the 53 healthysustained vowels /a/ reported in [17] and the averaged instantaneousfrequency obtained by our method was 𝑟 = 0.999995.
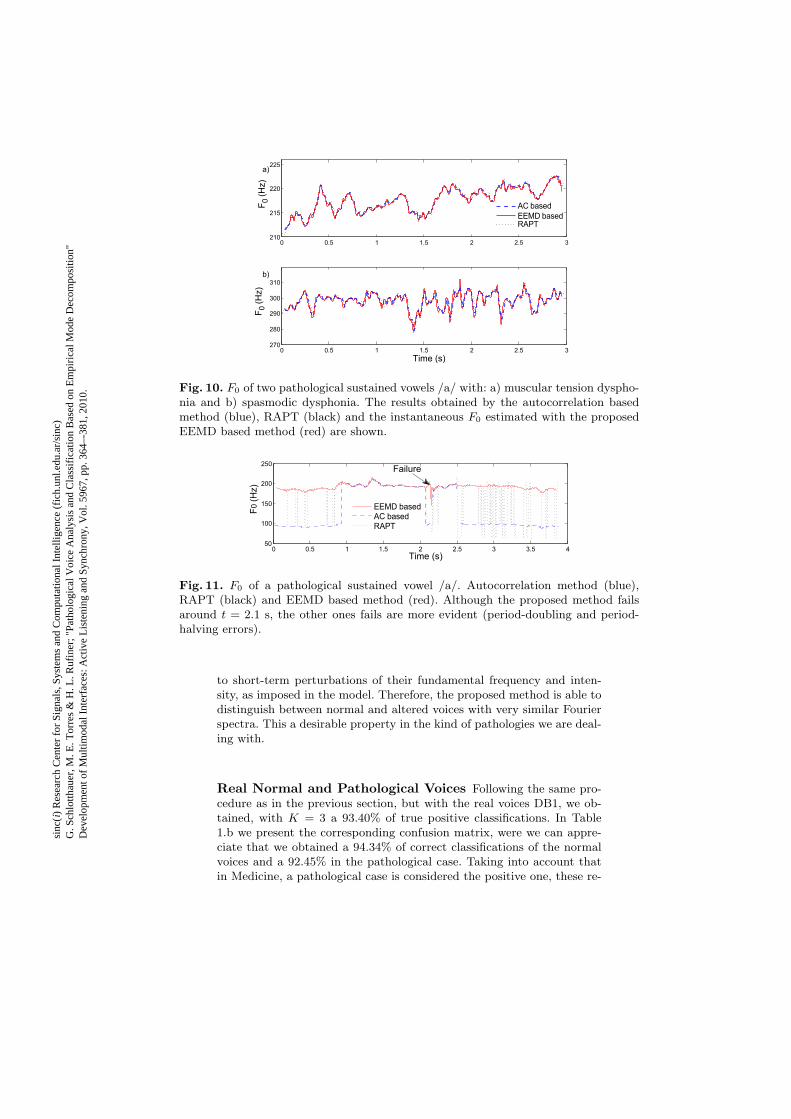
In Fig. 10 the 𝐹0 corresponding to two pathological voices are presented.In Fig. 10.a the fundamental frequency of a sustained vowel /a/ from apatient suffering muscular tension dysphonia is analyzed with the pro-posed method. On the other hand, in Fig. 10.b a voice with adductorspasmodic dysphonia is studied. As in Fig. 9, the 𝐹0 obtained with RAPTand auto-correlation based methods are also superposed in black andblue. Even if the autocorrelation based method had been reported to bethe best pitch estimation technique for the analysis of pathological sus-tained vowel /a/ [26], it can be observed in that it fails several times (SeeFig. 10). Also does RAPT algorithm, while the method here proposed,exhibits a much better behavior.
In a study with 35 disordered sustained vowels /a/ (15 from patients suf-fering muscular tension dysphonia and 20 suffering adductor spasmodicdysphonia) we have observed that, in the task of a correct 𝐹0 extrac-tion, while RAPT and auto-correlation based methods both fail in 22voices (62.86 %), the here proposed algorithm reduced the number offailures to only 10 voices (28.57 %). The 𝐹0 estimation was consideredfailed when at least one doubling or halving-period event, or a “spike-like” artifact appears. In the method here proposed, we have observedthat these spike-like artifacts were coincident with pathological voice seg-
sinc
(i)
Res
earc
h C
ente
r fo
r Si
gnal
s, S
yste
ms
and
Com
puta
tiona
l Int
ellig
ence
(fi
ch.u
nl.e
du.a
r/si
nc)
G. S
chlo
tthau
er, M
. E. T
orre
s &
H. L
. Ruf
iner
; "Pa
thol
ogic
al V
oice
Ana
lysi
s an
d C
lass
ific
atio
n B
ased
on
Em
piri
cal M
ode
Dec
ompo
sitio
n"D
evel
opm
ent o
f M
ultim
odal
Int
erfa
ces:
Act
ive
Lis
teni
ng a
nd S
ynch
rony
, Vol
. 596
7, p
p. 3
64–-
381,
201
0.
0 0.5 1 1.5 2 2.5 3270
280
290
300
310
Time (s)
F0 (
Hz)
AC basedRAPTEEMD based
0 0.5 1 1.5 2 2.5 3210
215
220
225
F0 (
Hz)
AC based
EEMD basedRAPT
b)
a)
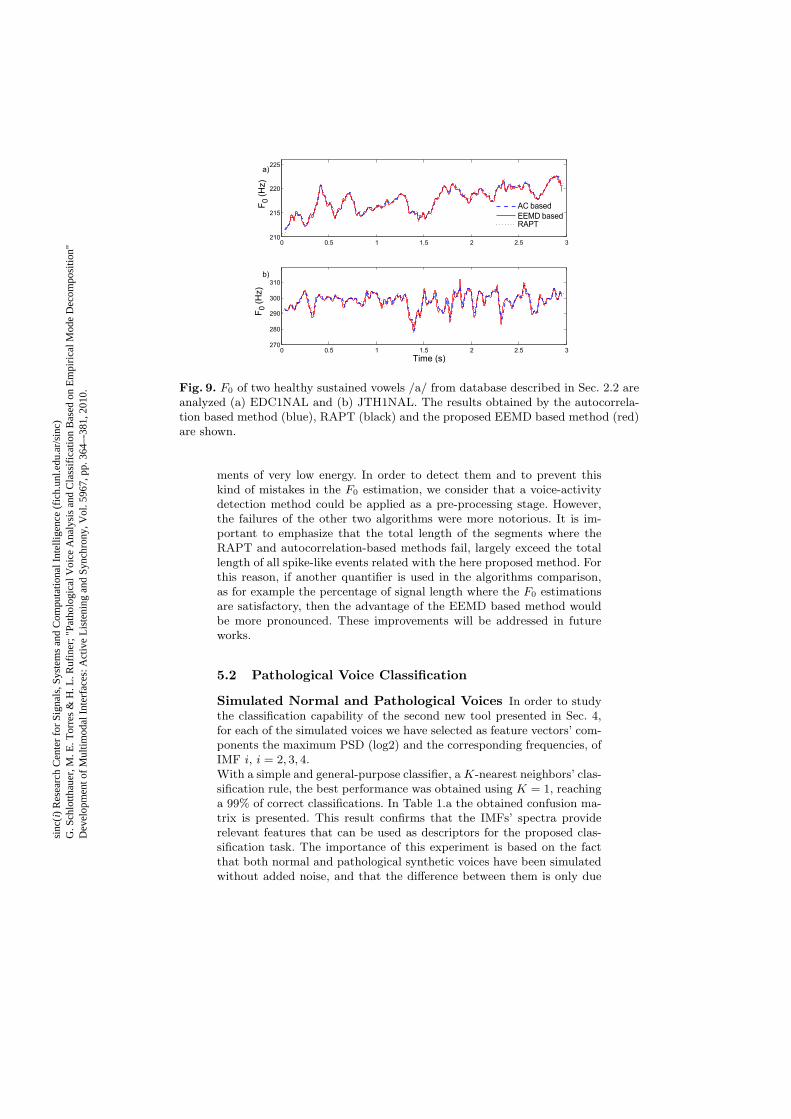
Fig. 9. 𝐹0 of two healthy sustained vowels /a/ from database described in Sec. 2.2 areanalyzed (a) EDC1NAL and (b) JTH1NAL. The results obtained by the autocorrela-tion based method (blue), RAPT (black) and the proposed EEMD based method (red)are shown.
ments of very low energy. In order to detect them and to prevent thiskind of mistakes in the 𝐹0 estimation, we consider that a voice-activitydetection method could be applied as a pre-processing stage. However,the failures of the other two algorithms were more notorious. It is im-portant to emphasize that the total length of the segments where theRAPT and autocorrelation-based methods fail, largely exceed the totallength of all spike-like events related with the here proposed method. Forthis reason, if another quantifier is used in the algorithms comparison,as for example the percentage of signal length where the 𝐹0 estimationsare satisfactory, then the advantage of the EEMD based method wouldbe more pronounced. These improvements will be addressed in futureworks.
5.2 Pathological Voice Classification
Simulated Normal and Pathological Voices In order to studythe classification capability of the second new tool presented in Sec. 4,for each of the simulated voices we have selected as feature vectors’ com-ponents the maximum PSD (log2) and the corresponding frequencies, ofIMF 𝑖, 𝑖 = 2, 3, 4.With a simple and general-purpose classifier, a𝐾-nearest neighbors’ clas-sification rule, the best performance was obtained using 𝐾 = 1, reachinga 99% of correct classifications. In Table 1.a the obtained confusion ma-trix is presented. This result confirms that the IMFs’ spectra providerelevant features that can be used as descriptors for the proposed clas-sification task. The importance of this experiment is based on the factthat both normal and pathological synthetic voices have been simulatedwithout added noise, and that the difference between them is only due
sinc
(i)
Res
earc
h C
ente
r fo
r Si
gnal
s, S
yste
ms
and
Com
puta
tiona
l Int
ellig
ence
(fi
ch.u
nl.e
du.a
r/si
nc)
G. S
chlo
tthau
er, M
. E. T
orre
s &
H. L
. Ruf
iner
; "Pa
thol
ogic
al V
oice
Ana
lysi
s an
d C
lass
ific
atio
n B
ased
on
Em
piri
cal M
ode
Dec
ompo
sitio
n"D
evel
opm
ent o
f M
ultim
odal
Int
erfa
ces:
Act
ive
Lis
teni
ng a
nd S
ynch
rony
, Vol
. 596
7, p
p. 3
64–-
381,
201
0.
0 0.5 1 1.5 2 2.5 3270
280
290
300
310
Time (s)
F0 (
Hz)
AC basedRAPTEEMD based
0 0.5 1 1.5 2 2.5 3210
215
220
225
F0 (
Hz)
AC based
EEMD basedRAPT
b)
a)
Fig. 10. 𝐹0 of two pathological sustained vowels /a/ with: a) muscular tension dyspho-nia and b) spasmodic dysphonia. The results obtained by the autocorrelation basedmethod (blue), RAPT (black) and the instantaneous 𝐹0 estimated with the proposedEEMD based method (red) are shown.
0 0.5 1 1.5 2 2.5 3 3.5 450
100
150
200
250
Time (s)
F0 (
Hz)
EEMD basedAC basedRAPT
Failure
Fig. 11. 𝐹0 of a pathological sustained vowel /a/. Autocorrelation method (blue),RAPT (black) and EEMD based method (red). Although the proposed method failsaround 𝑡 = 2.1 s, the other ones fails are more evident (period-doubling and period-halving errors).
to short-term perturbations of their fundamental frequency and inten-sity, as imposed in the model. Therefore, the proposed method is able todistinguish between normal and altered voices with very similar Fourierspectra. This a desirable property in the kind of pathologies we are deal-ing with.
Real Normal and Pathological Voices Following the same pro-cedure as in the previous section, but with the real voices DB1, we ob-tained, with 𝐾 = 3 a 93.40% of true positive classifications. In Table1.b we present the corresponding confusion matrix, were we can appre-ciate that we obtained a 94.34% of correct classifications of the normalvoices and a 92.45% in the pathological case. Taking into account thatin Medicine, a pathological case is considered the positive one, these re-
sinc
(i)
Res
earc
h C
ente
r fo
r Si
gnal
s, S
yste
ms
and
Com
puta
tiona
l Int
ellig
ence
(fi
ch.u
nl.e
du.a
r/si
nc)
G. S
chlo
tthau
er, M
. E. T
orre
s &
H. L
. Ruf
iner
; "Pa
thol
ogic
al V
oice
Ana
lysi
s an
d C
lass
ific
atio
n B
ased
on
Em
piri
cal M
ode
Dec
ompo
sitio
n"D
evel
opm
ent o
f M
ultim
odal
Int
erfa
ces:
Act
ive
Lis
teni
ng a
nd S
ynch
rony
, Vol
. 596
7, p
p. 3
64–-
381,
201
0.
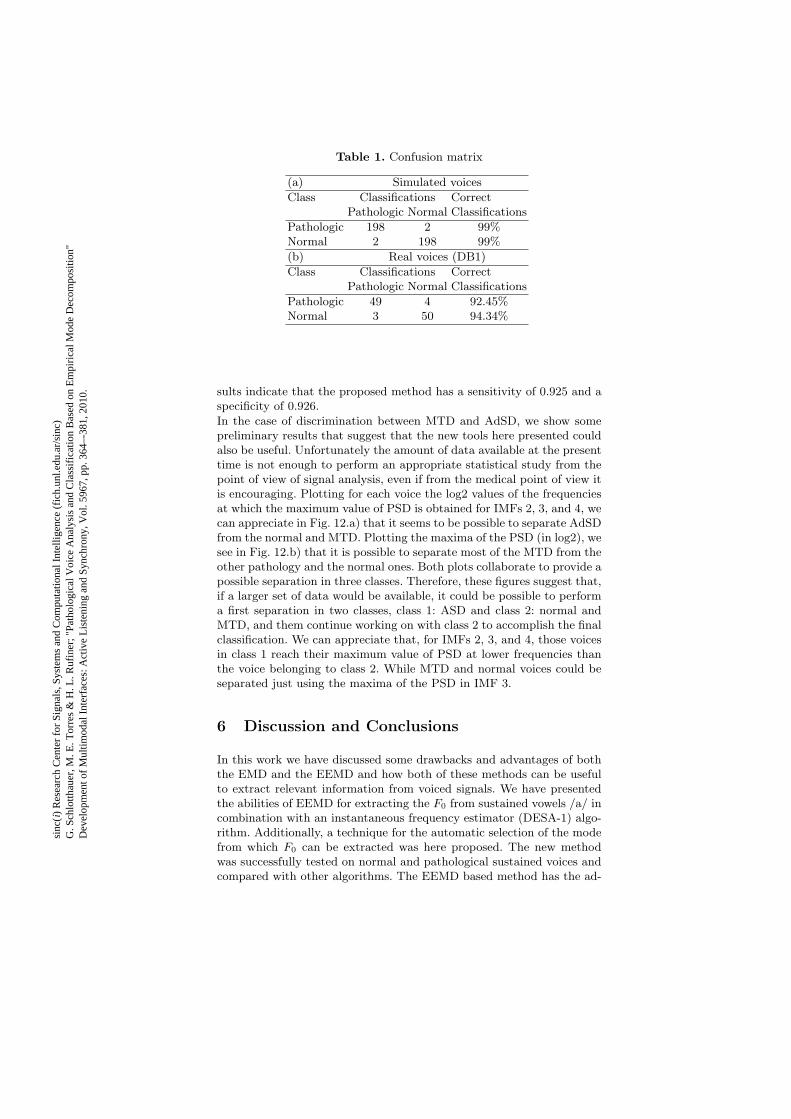
Table 1. Confusion matrix
(a) Simulated voices
Class Classifications CorrectPathologic Normal Classifications
Pathologic 198 2 99%Normal 2 198 99%
(b) Real voices (DB1)
Class Classifications CorrectPathologic Normal Classifications
Pathologic 49 4 92.45%Normal 3 50 94.34%
sults indicate that the proposed method has a sensitivity of 0.925 and aspecificity of 0.926.
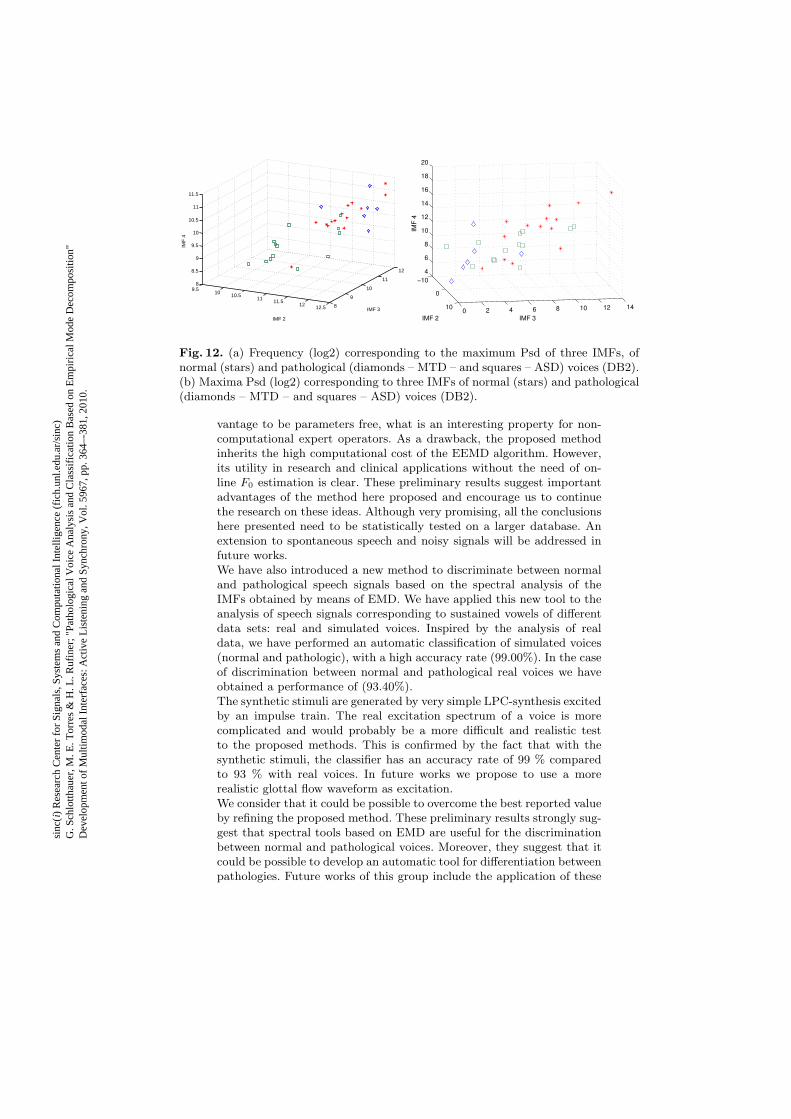
In the case of discrimination between MTD and AdSD, we show somepreliminary results that suggest that the new tools here presented couldalso be useful. Unfortunately the amount of data available at the presenttime is not enough to perform an appropriate statistical study from thepoint of view of signal analysis, even if from the medical point of view itis encouraging. Plotting for each voice the log2 values of the frequenciesat which the maximum value of PSD is obtained for IMFs 2, 3, and 4, wecan appreciate in Fig. 12.a) that it seems to be possible to separate AdSDfrom the normal and MTD. Plotting the maxima of the PSD (in log2), wesee in Fig. 12.b) that it is possible to separate most of the MTD from theother pathology and the normal ones. Both plots collaborate to provide apossible separation in three classes. Therefore, these figures suggest that,if a larger set of data would be available, it could be possible to performa first separation in two classes, class 1: ASD and class 2: normal andMTD, and them continue working on with class 2 to accomplish the finalclassification. We can appreciate that, for IMFs 2, 3, and 4, those voicesin class 1 reach their maximum value of PSD at lower frequencies thanthe voice belonging to class 2. While MTD and normal voices could beseparated just using the maxima of the PSD in IMF 3.
6 Discussion and Conclusions
In this work we have discussed some drawbacks and advantages of boththe EMD and the EEMD and how both of these methods can be usefulto extract relevant information from voiced signals. We have presentedthe abilities of EEMD for extracting the 𝐹0 from sustained vowels /a/ incombination with an instantaneous frequency estimator (DESA-1) algo-rithm. Additionally, a technique for the automatic selection of the modefrom which 𝐹0 can be extracted was here proposed. The new methodwas successfully tested on normal and pathological sustained voices andcompared with other algorithms. The EEMD based method has the ad-
sinc
(i)
Res
earc
h C
ente
r fo
r Si
gnal
s, S
yste
ms
and
Com
puta
tiona
l Int
ellig
ence
(fi
ch.u
nl.e
du.a
r/si
nc)
G. S
chlo
tthau
er, M
. E. T
orre
s &
H. L
. Ruf
iner
; "Pa
thol
ogic
al V
oice
Ana
lysi
s an
d C
lass
ific
atio
n B
ased
on
Em
piri
cal M
ode
Dec
ompo
sitio
n"D
evel
opm
ent o
f M
ultim
odal
Int
erfa
ces:
Act
ive
Lis
teni
ng a
nd S
ynch
rony
, Vol
. 596
7, p
p. 3
64–-
381,
201
0.
9.510 10.5
11 11.512 12.5 8
9
10
11
12
8
8.5
9
9.5
10
10.5
11
11.5
IMF
4
IMF 2
IMF 3
−10
0
100 2 4 6 8 10 12 14
4
6
8
10
12
14
16
18
20
IMF4
IMF 2 IMF 3
Fig. 12. (a) Frequency (log2) corresponding to the maximum Psd of three IMFs, ofnormal (stars) and pathological (diamonds – MTD – and squares – ASD) voices (DB2).(b) Maxima Psd (log2) corresponding to three IMFs of normal (stars) and pathological(diamonds – MTD – and squares – ASD) voices (DB2).
vantage to be parameters free, what is an interesting property for non-computational expert operators. As a drawback, the proposed methodinherits the high computational cost of the EEMD algorithm. However,its utility in research and clinical applications without the need of on-line 𝐹0 estimation is clear. These preliminary results suggest importantadvantages of the method here proposed and encourage us to continuethe research on these ideas. Although very promising, all the conclusionshere presented need to be statistically tested on a larger database. Anextension to spontaneous speech and noisy signals will be addressed infuture works.We have also introduced a new method to discriminate between normaland pathological speech signals based on the spectral analysis of theIMFs obtained by means of EMD. We have applied this new tool to theanalysis of speech signals corresponding to sustained vowels of differentdata sets: real and simulated voices. Inspired by the analysis of realdata, we have performed an automatic classification of simulated voices(normal and pathologic), with a high accuracy rate (99.00%). In the caseof discrimination between normal and pathological real voices we haveobtained a performance of (93.40%).The synthetic stimuli are generated by very simple LPC-synthesis excitedby an impulse train. The real excitation spectrum of a voice is morecomplicated and would probably be a more difficult and realistic testto the proposed methods. This is confirmed by the fact that with thesynthetic stimuli, the classifier has an accuracy rate of 99 % comparedto 93 % with real voices. In future works we propose to use a morerealistic glottal flow waveform as excitation.We consider that it could be possible to overcome the best reported valueby refining the proposed method. These preliminary results strongly sug-gest that spectral tools based on EMD are useful for the discriminationbetween normal and pathological voices. Moreover, they suggest that itcould be possible to develop an automatic tool for differentiation betweenpathologies. Future works of this group include the application of these
sinc
(i)
Res
earc
h C
ente
r fo
r Si
gnal
s, S
yste
ms
and
Com
puta
tiona
l Int
ellig
ence
(fi
ch.u
nl.e
du.a
r/si
nc)
G. S
chlo
tthau
er, M
. E. T
orre
s &
H. L
. Ruf
iner
; "Pa
thol
ogic
al V
oice
Ana
lysi
s an
d C
lass
ific
atio
n B
ased
on
Em
piri
cal M
ode
Dec
ompo
sitio
n"D
evel
opm
ent o
f M
ultim
odal
Int
erfa
ces:
Act
ive
Lis
teni
ng a
nd S
ynch
rony
, Vol
. 596
7, p
p. 3
64–-
381,
201
0.
results to a wider data base of real signals, in continue collaboration withvoice pathologists, and the analysis and discussion of other classificationtechniques.
Acknowledgments
This works was supported by UNER (Argentina), ANPCyT (Argentina)and CONICET (Argentina). The authors would like to thank Dr. M. C.Jackson-Menaldi of Lakeshore Prof. Voice Center, Lakeshore Ear, Noseand Throat Center, St. Clair Shores (USA) and Depart. of Otolaryng.,School of Med., Wayne U., Detroit (USA), for her valuable suggestions.The authors also thank Kay Elemetrics Corp.
References
1. Huang, N., Shen, Z., Long, S., Wu, M., Shih, H., Zheng, Q., Yen,N., Tung, C., Liu, H.: The empirical mode decomposition and theHilbert spectrum for nonlinear and non-stationary time series anal-ysis. Proc.: Math., Phys. and Eng. Sciences 454 (1998) 903–995
2. Huang, N.E., Shen, S.S.P., eds.: Hilbert-Huang transform and itsapplications. Volume 5 of Interdisciplin. Math. Sc. World Sci.(2005)
3. Schlotthauer, G., Torres, M.E.: Descomposicion modal empırica:analisis y disminucion de ruido en senales biologicas. In: Proc. XVCongreso Argentino de Bioingenierıa SABI 2005, Parana, E.R. Ar-gentina (2005) File:101PS.pdf ISBN 950-698-155-8.
4. Rilling, G., Flandrin, P., Goncalves, P.: On empirical mode decom-position and its algorithms. In: Proc IEEE-EURASIP WorkshopNSIP-03, Grado, Italia (2003)
5. Rilling, G., Flandrin, P.: On the influence of sampling on the empir-ical mode decomposition. In: IEEE Int. Conf. On Acoust., Speechand Signal Proc. ICASSP-06. Volume III., Toulouse (2006) 444–447
6. Dimitriadis, D., Maragos, P.: Continuous energy demodulationmethods and application to speech analysis. Speech Commun. 48(7)(2006) 819–837
7. Schlotthauer, G., Torres, M.E., Rufiner, H.: A new algorithm for in-stantaneous 𝐹0 speech extraction based on ensemble empirical modedecomposition. In: Proc. of 17th Eur. Sign. Proces. Conf. 2009, Glas-gow, UK (2009) 2347–2351
8. Schlotthauer, G., Torres, M.E., Rufiner, H.: Voice fundamental fre-quency extraction algorithm based on ensemble empirical mode de-composition and entropies. In: Proc. of 11th Int. Congr. of theIFMBE 2009, Munich (2009) 984–987
9. Torres, M.E., Schlotthauer, G., Rufiner, H.L., Jackson-Menaldi,M.C.: Empirical mode decomposition. spectral properties in nor-mal and pathological voices. In: Proc. of the 4th Eur. Conf. of theInter. Fed. for Med. and Biol. Eng. (2009) 252–255
10. Hess, W.: Pitch and Voicing Determination of Speech with an Ex-tension Toward Music Signals. In: Springer Handbook of SpeechProc. Springer (2008) 181–208
sinc
(i)
Res
earc
h C
ente
r fo
r Si
gnal
s, S
yste
ms
and
Com
puta
tiona
l Int
ellig
ence
(fi
ch.u
nl.e
du.a
r/si
nc)
G. S
chlo
tthau
er, M
. E. T
orre
s &
H. L
. Ruf
iner
; "Pa
thol
ogic
al V
oice
Ana
lysi
s an
d C
lass
ific
atio
n B
ased
on
Em
piri
cal M
ode
Dec
ompo
sitio
n"D
evel
opm
ent o
f M
ultim
odal
Int
erfa
ces:
Act
ive
Lis
teni
ng a
nd S
ynch
rony
, Vol
. 596
7, p
p. 3
64–-
381,
201
0.
11. Schlotthauer, G., Torres, M.E., Jackson-Menaldi, M.C.: A patternrecognition approach to spasmodic dysphonia and muscle tensiondysphonia automatic classification. J. of Voice (2009) In press.
12. Huang, H., Pan, J.: Speech pitch determination based on Hilbert-Huang transform. Signal Process. 86(4) (2006) 792–803
13. Weiping, H., Xiuxin, W., Yaling, L., Minghui, D.: A Novel Pitch Pe-riod Detection Algorithm Bases on HHT with Application to Normaland Pathological Voice. In: IEEE-EMBS 2005. 27th Annual Intern.Conf. of the. (2005) 4541–4544
14. Wu, Z., Huang, N.E.: Ensemble empirical mode decomposition: Anoise-assisted data analysis method. Adv. in Adapt. Data Anal. 1(1)(2009) 1–41
15. Verdolini, K., Rosen, C.A., Branski, R.C., Andrews, M.L.: Classi-fication Manual for Voice Disorders-I. 1 Edn. Lawrence ErlbaumAssoc. (2006)
16. Schlotthauer, G., Torres, M.E., Jackson-Menaldi, C.: Automatic di-agnosis of pathological voices. WSEAS Trans. on Signal Proc. 2(2006) 1260–1267 (And references therein).
17. Corp., K.E.: Disordered voice database 1.03. Mass. Eye and EarInfirmary, Voice and Speech Lab, Boston. (1994)
18. Jackson-Menaldi, M.C.: La voz patologica. Ed. Medica Panameri-cana, Buenos Aires (2002)
19. Flandrin, P., Rilling, G., Goncalves, P.: Empirical mode decompo-sition as a filter bank. Signal Proc. Lett., IEEE 11(2) (Feb. 2004)112–114
20. Shannon, C.E.: A mathematical theory of communication. Bell Syst.Tech. J. 27 (1948) 379–423, 623–656
21. Papoulis, A.: Probability, Random Variables and Stochastic Pro-cesses. 3rd edn. McGraw-Hill Companies (1991)
22. Maragos, P., Kaiser, J., Quatieri, T.: Energy separation in signalmodulations with application to speech analysis. Signal Proc., IEEETrans. on 41(10) (Oct 1993) 3024–3051
23. Diaz, M., Esteller, R.: Comparison of the non linear energy operatorand the hilbert transform in the estimation of the instantaneousamplitude and frequency. Latin Am. Trans., IEEE (Revista IEEEAmerica Latina) 5(1) (2007) 1–8
24. Talkin, D.: A robust algorithm for pitch tracking (RAPT). In: SpeechCoding and Synth. Elsevier Science (1995) 121–173
25. Boersma, P.: Accurate short-term analysis of the fundamental fre-quency and the harmonics-to-noise ratio of a sampled sound. In:Proc. of the Inst. of Phonetic Sci. Volume 17. (1993) 97–110
26. Jang, S., Choi, S., Kim, H., Choi, H., Yoon, Y.: Evaluation of per-formance of several established pitch detection algorithms in patho-logical voices. Proc. 29th Annual Intern. Conf. of the IEEE Eng. inMed. and Biol. Soc. 2007 (2007) 620–623 PMID: 18002032.
27. Goddard, J., Schlotthauer, G., Torres, M.E., Rufiner, H.L.: Di-mensionality reduction for visualization of normal and pathologicalspeech data. Biomed. Sig. Proc. and Control 4 (2009) 194–201.
sinc
(i)
Res
earc
h C
ente
r fo
r Si
gnal
s, S
yste
ms
and
Com
puta
tiona
l Int
ellig
ence
(fi
ch.u
nl.e
du.a
r/si
nc)
G. S
chlo
tthau
er, M
. E. T
orre
s &
H. L
. Ruf
iner
; "Pa
thol
ogic
al V
oice
Ana
lysi
s an
d C
lass
ific
atio
n B
ased
on
Em
piri
cal M
ode
Dec
ompo
sitio
n"D
evel
opm
ent o
f M
ultim
odal
Int
erfa
ces:
Act
ive
Lis
teni
ng a
nd S
ynch
rony
, Vol
. 596
7, p
p. 3
64–-
381,
201
0.