
Part D—ICt - Guru Ghasidas University
122
PART D—ICT
-
Upload
khangminh22 -
Category
Documents
-
view
3 -
download
0
Transcript of Part D—ICt - Guru Ghasidas University

Part D—ICt


Digital Audio Watermarking for Promoting Global Cy-ber Security: A Survey
Tanuja Kashyap*1, Kapil Kumar Nagwanshi#2, Susanta Kumar Satpathy#3
*Department of ETE, CSV Technical University, Bhilai Institute of Technolog, Durg,India #Department of CSE, CSV Technical University, RCET, Bhilai, India
e-mail : [email protected], [email protected], [email protected]
AbstrAct
Digital audio watermarking is a technique for embedding additional data along with audio signal. Embedded data is used for copyright owner identification. Audio watermarking schemes rely on the imperfection of the Human Auditory system. However, human ear is much more sensitive than other sensory motors, hence watermarking of audio signals is more challenging compared to the watermarking of images or video sequences. this paper surveys the general audio watermarking schemes which are classified according to the domain where the watermark is embedded. Detail descriptions of some of the popular audio watermarking schemes and the steps involved in implementing them are discussed. these schemes exploit different ways in order to embed a robust watermark and to maintain the original audio signal fidelity, which are the essential features required in an audio watermarking system. review of previous papers published has been done to understand the proposed techniques, advantages and disadvantages associated with the techniques involved in audio watermarking.
Keywords— Keywords- Digital watermarking, audio, copyright protection.
I. INTroDuCTIoN
Traditional data protection techniques are not so sufficient for audio copyright as we have to play it back after decryption. Audio watermarking initially started as a sub-discipline of digital signal processing, focusing mainly on convenient signal processing techniques to embed additional information to audio sequences. Watermarking of audio signals is more challenging compared to the watermarking of images or video sequences, due to wider dynamic range of the human auditory system(HAS) in comparison with human visual system (HVS).Audio watermarks are special signals embedded into digital audio. These signals are extracted by detection mechanisms and decoded. Thus, good audio watermarking schemes are difficult to design [1]. These schemes are sophisticated very much in terms of robustness and imperceptibility [2,3]. Blind watermarking schemes are not so useful in practical use, since it requires double storage capacity and double communication bandwidth for watermark detection. Non-blind schemes may be useful as copyright verification mechanism in a copyright dispute [4]. Blind watermarking scheme can detect
and extract watermarks without use of the un-watermarked audio. Therefore, it requires only a half storage capacity and half bandwidth compared with the non-blind watermarking scheme. The blind watermarking methods need self detection mechanisms for detecting watermarks.
Figure 1 : The watermarking process
II. WATermArK
A watermark is a design embossed into a piece of paper during its production and used for identification of the paper and papermaker. Then the word watermark in introduced to digital field. It is an identification code carrying information about the copyright owner, the creator of the work, authorized consumers and so on [1]. The watermark is invisible and permanently embedded into digital data for copyright protection and for checking if the data has been corrupted. The electronic documents which is watermarked can be digital image, audio or video.
A. System ModelAll watermarking system consists of two blocks, watermark embedding system and a watermark detector system. In the watermark embedding block, a copyright owner uses a private key to create an inaudible watermark on the audio file. So the private key is used to encode the digital watermark into the music. Afterward, the owner can examine whether a given audio file, which is supposed to be illegally copied, contains his or her own watermark and use it as legal prove. Basic block diagram of the audio watermarking system is as shown in Fig. 1[37].
142 • Part D—ICT
III. LITerATure SurVey
A number of schemes have been developed in order to create robust and imperceptible audio watermarks. Lie et al. [29] propose a method of embedding watermarks into audio signals in the time domain. Here differential average-of-absolute-amplitude relations within each group of audio samples are used to represent one-bit information. Bassia et al, [14], propose a blind audio watermarking system which embeds watermarks into audio signal in time domain. The embedded watermark is robust to MPEG audio coding. Ling et al. [30] introduce a watermarking scheme based on nonuniform discrete. Zeng et al. [31] describe a blind watermarking system which embeds watermarks into DCT coefficients by utilizing quantization index modulation technique. Pooyan et al. [32] introduce an audio watermarking system which embeds watermarks in wavelet domain. The magnitude of quantization step and embedding strength is adaptively determined according to the characteristics of human auditory system. Wang et al. [33] proposes a blind audio watermarking scheme using adaptive quantization against synchronization attack. In addition, the multiresolution characteristics of discrete wavelet transform (DWT) and the energy compression characteristics of discrete cosine transform (DCT) are combined in this scheme to improve the transparency of digital watermark. Cox et al. [34], propose a watermarking system they used a Fourier domain method based on the DCT. Dhar et al.[35] ,suggests that, the absolute values of DCT coefficients are divided into an arbitrary number of segments and the energy of each segment is calculated. Thanuja et al.[7],have given an overview of different properties of watermarking and several watermarking schemes are done, authors have found that LSB Coding works very well for a Fragile Watermarking scheme. LSB Coding is also the least computationally intensive of all the schemes. Liu et al.[36]proposed a method based on Vector Quantization (VQ) in Discrete Cosine Transform (DCT) domain using the codeword labeling and index-bit constrained method.
III. AuDIo WATermArKING ALGorITHm
Several algorithms have been developed for the purpose of watermarking. each algorithm achieves a certain tradeoff between robustness and watermark data rate for a given perceptual transparency. The choice of the algorithm depends on several factors such as(i)The type of cover audio(ii)the computational complexity of the algorithm (iii)The application, which defines the degree of robustness required etc[4]. One of the earliest techniques studied in the information hiding and watermarking area of digital audio, as well as other media types is LSB coding .A natural approach in the case of the audio sequences is to embed watermark data by alternation of the individual samples of the digital audio stream having the amplitude resolution of 16 bits per sample. It usually does not use any psychoacoustics model to perceptually weight the noise introduced by LSB replacement. [6,7, 37].
A. LSB Substitution Technique
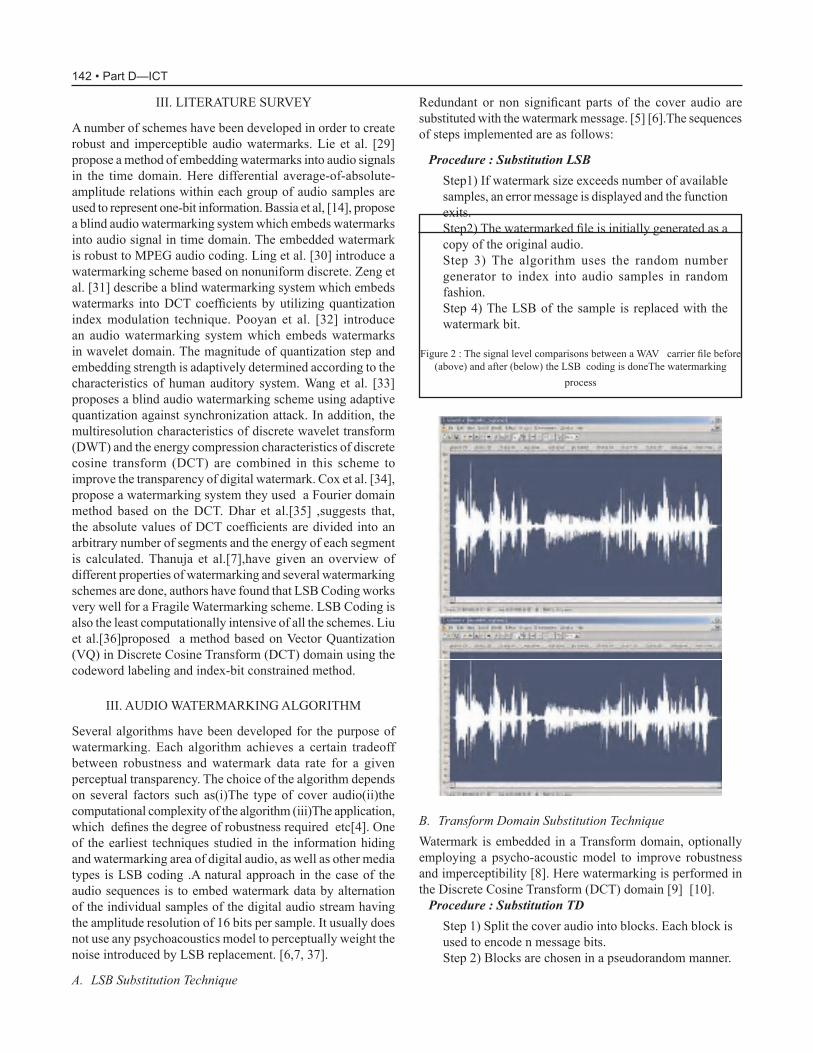
Redundant or non significant parts of the cover audio are substituted with the watermark message. [5] [6].The sequences of steps implemented are as follows:
Procedure : Substitution LSB Step1) If watermark size exceeds number of available samples, an error message is displayed and the function exits.Step2) The watermarked file is initially generated as a copy of the original audio.Step 3) The algorithm uses the random number generator to index into audio samples in random fashion.Step 4) The LSB of the sample is replaced with the watermark bit.
Figure 2 : The signal level comparisons between a WAV carrier file before (above) and after (below) the LSB coding is doneThe watermarking
process
B. Transform Domain Substitution TechniqueWatermark is embedded in a Transform domain, optionally employing a psycho-acoustic model to improve robustness and imperceptibility [8]. Here watermarking is performed in the Discrete Cosine Transform (DCT) domain [9] [10].
Procedure : Substitution TD Step 1) Split the cover audio into blocks. each block is used to encode n message bits.Step 2) Blocks are chosen in a pseudorandom manner.

• 143
Step 3) A DCT of the frame is obtained. Let v (i) represent the DCT coefficients.Step 4) The largest(in terms of absolute value) n DCT samples are modified using the formula
v1 (i) = v (i) (1 + αw (i)) [Where, α is a scaling
factor. Here a value of 0.3 is used for‘α’.w(i) is the watermark bit(0 or 1).]Step 5) The inverse DCT is computed and samples are written back to the file.
During decoding, v1 (i) is read in from the watermarked sample while v1 (i) is read in from the original sample. By comparing their absolute values decoding is done.
C. Echo HidingA number of developed audio watermarking algorithms [11].are based on echo hiding method, described for the first time in [10]. Echo hiding schemes embed watermarks into a host signal by adding echoes to produce watermarked signal. The data are hidden by varying three parameters of the echo: initial amplitude, decay rate and offset (delay). The coder uses two delay times, one to represent a binary one (offset) and another to represent a binary zero (offset + delta) .The nature of the echo is to add resonance to the host audio. The parameters of echo embedding watermarking method are shown in Fig. 3.
D. Phase CodingThe Phase Coding method works by substituting the phase of an initial audio segment with a reference phase that represents the data. The phase of subsequent segments is adjusted in order to preserve the relative phase between segments [10]. According to the algorithm presented in [9], the watermark data is phase encoded as π/2 or- π/2 depending on the watermark bit 0 or 1, respectively. There are two main approaches used in the watermarking of the host signal’s phase, first, phase coding [10,12] .Imperceptible phase modifications are exploited in this approach by the controlled phase alternation of the host audio. To ensure perceptual transparency by introducing only small changes in the envelope, the performed phase modulation has to satisfy the following constraint |ΔØ(z)/Δz|<30° where Ø(z) denotes the signal phase and z is the Bark scale. Each Bark constitutes one critical bandwidth; the conversion of frequency between Bark and Hz is given in [12]. Phase coding addresses the disadvantages of the noise inducing methods of audio steganography.
E. Spread Spectrum WatermarkingIn a number of the developed algorithms [13,14,1516,17,18], the watermark embedding and extraction are carried out using spread-spectrum (SS) technique. SS sequence can be added to the host audio samples in time domain, to FFT coefficients [18, 19, 20], in sub-band domain [14,21,22,23], to cepstral coefficients [24,25] and in a compressed domain . A general model for SS-based watermarking is shown in Figure 4.
Coefficient a(n) and b(n) weight the watermark samples in order to boost the power of the watermark. Watermark extraction is achieved via segmenting the watermarked signal into blocks and measuring the cross-correlation with the m sequence [26]. Advantages of SS watermarking include: (i) testing for watermarks does not require the original (ii) watermark detection is exceptionally resilient to attacks that can be modeled as additive or multiplicative noise. Disadvantages include: (i) the watermarked signal and the watermark have to be perfectly synchronized while computing (ii) for a sufficiently small error probability, the vector length N may need to be quite large, the final signal occupies a bandwidth in excess of what is actually required for transmission [27].
F. Patchwork Technique All The data to be watermarked is separated into two distinct subsets. One feature of the data is chosen and modified in opposite directions in both subsets [28]. For an example let the original signal is divided into two parts A and B, then the part A is increased by a fraction Δ and the part B is decreased by some amount Δ. The samples separation is the secret key which is termed as watermarking key. Detection of watermark is done by following the statistical properties of the audio signal. Let NA and NB denote the size(s) of the individual A and B parts and Δ be the amount of the change made to the host signal. Suppose thaand b[i] represent the sample values at ith position in blocks A and B. The difference of the sample values can be written as eq.(1), and eq. (2): The expectation of the difference is used to extract the watermark which is expressed as follows in eq. (3).
Figure 4. General model for SS-based watermarking
Figure 3. Parameters of echo embedding watermarking method.
V. CoNCLuSIoNS
main aim of all watermarking systems is robustness. These
(1)
(2)
Digital Audio Watermarking for Promoting Global Cyber Security: A Survey

144 • Part D—ICT
systems have to satisfy two requirements. i) watermark must be immune against intentional and unintentional removal. ii)watermarked signal should maintain a good fidelity, i.e. watermark must be perceptually undetectable. Various techniques have been developed, and different domains are involved to enhance a certain application of watermarking to improve fidelity and robustness of watermarked signal. It has been found that, watermarking systems have a number of differences. echo hiding is another very successful and popular method of watermarking. even though easily detectable, it is very robust to many attacks, including mPeG compression. Sequence generation is parameterized by a key called watermarking key. This key is required in both embedding and detection. In some watermarking systems, watermarking key is used to generate the watermark itself. Watermarking key could be provided by the copyright owner during embedding process, original audio signal is divided into frames. Then after, each frame is watermarked separately. Some watermarking systems embed the same watermark into a number of frames to enhance watermark robustness. But, in other systems each frame is watermarked with different watermark. HAS shows high sensitivity so, watermark signal must be modified to make it inaudible.
reFereNCeS
[1] Kim, H.J., and Choi, Y.H. (2003), A novel echo hiding algorithm, Ieee Transactions on Circuits and Systems for Video Technology, (to appear).
[2] Cox, I.J., Miller, M.I., and Bloom, J.A. (2002), Digital Watermarking, morgan Kaufman Publishers.
[3] Bender, W., Gruhl, D., Morimoto, N., and Lu, A. (1996), Techniques for data hiding, IBM Systems Journal, vol. 35, pp. 313-336.
[4] Craver, S. A., Memon, N., Yeo, B.-L., and Yeung, M. M. (1998), Resolving Rightful Ownerships with Invisible Watermarking Techniques: Limitations, Attacks, and Implication, IEEE Journal on Selected Areas in Communications, vol. 16, no. 4, pp. 573-586, 1998.
[5] Cvejic .N, Seppanen. T, Increasing robustness of LSB
(3) audio steganography using a novel embedding method, International Conference on Information Technology: Coding and Computing, 2004. Proceedings. ITCC 2004. Volume 2, 2004 Page(s):533 - 537 Vol.2
[6] Yin Xiong, Zhang Xiao ming, Covert Communication Audio Watermarking Algorithm Based on LSB, International Conference on Communication Technology, 2006. ICCT ’06. Nov. 2006 Page(s):1 – 4.
[7] T.C Thanuja , Dr. R.Nagaraj ,Schemes for Evaluating Signal Processing Properties of Audio Watermarking, IJCSNS International Journal of Computer Science and Network Security, VOL.8 No.7, July 2008,242
[8] A. Tefas, A.Giannoula, N.Nikolaidis, I.Pitas, Enhanced transform-domain correlation-based audio watermarking , Ieee International Conference on Acoustics, Speech, and Signal Processing, 2005. Proceedings. (ICASSP ’05). Volume 2, 18-23 March 2005 Page(s):ii/1049 - ii/1052 Vol. 2
[9] Xing-Yang Wang and Hong Zhao, A Novel Synchronization Invariant Audio WatermarkingScheme Based on DWT and DCT, IEEE Transactions on Transactions on Signal Processing, Vol. 54, No. 12, December 2006.
[10] W. Bender, D. Gruhl and N. Morimoto, Techniques for data hiding. IBM Systems Journal, 35(3&4):313–336, 1996.
[11] Foo S, Yeo T & Huang D (2001) An adaptive audio watermarking system. In: Proc. IEEE Region 10 International Conference on electrical and electronic Technology, Phuket Island-Langkawi Island, Singapore, p 509–513.
[12] Ruiz F & Deller J (2000) Digital watermarking of speech signals for the national gallery of the spoken word. In: Proc. Ieee International Conference on Acoustics, Speech, and Signal Processing, Istanbul, Turkey, p 1499–1502and, second, phase modulation .
[13] Arnold M, Wolthusen S & Schmucker M (2003) Techniques and Applications of Digital Watermarking and Content Protection. Artech House, Norwood, mA.
[14] Bassia P, Pitas I & Nikolaidis N (2001) Robust audio watermarking in the time domain. Ieee Transactions on Multimedia 3(2): p 232–241.
[15] Neubauer C, Herre J & Brandenburg K (1998) Continuous steganographic data transmission using uncompressed audio. In: Proc. Information HidingWorkshop, Portland, p 208–217.
[16] Cox I, Kilian J, Leighton F & Shamoon T (1997) Secure spread spectrum watermarking for multimedia. IEEE Transactions on Image Processing 6(12): p 1673–1687.
[17] Kirovski D & Malvar H (2003) Spread-spectrum watermarking of audio signals. Ieee Transactions on

• 145
Signal Processing 51(4): p 1020–1033.[18] Swanson M, Zhu B, Tewfik A & Boney L (1998) Robust
audio watermarking using perceptual masking. Signal Processing 66(3): p 337–355.
[19] Seok J & Hong J (2001) Audio watermarking for copyright protection of digital audio data.electronics Letters 37(1): p 60–61.
[20] Kalker T & Janssen A (1999) Analysis of watermark detection using spomf. In: Proc. Ieee International Conference on Image Processing, Kobe, Japan, p 889–892.
[21] Saito S, Furukawa T & Konishi K (2002) A digital watermarking for audio data using band division based on qmf bank. In: Proc. Ieee International Conference on Acoustics, Speech and Signal Processing, orlando, FL, p 3473–3476.
[22] Tachibana R, Shimizu S, Kobayashi S & Nakamura T (2002) An audio watermarking method using a two-dimensional pseudo-random array. Signal Processing 82(10): p 1455–1469.
[23] Li X & Yu H (2000) Transparent and robust audio data hiding in subband domain. In: Proc.International Conference on Information Technology: Coding and Computing, Las Vegas,NV, p 74–79.
[24] S. K. Lee and Y. S. Ho, Digital audio watermarking in the cepstrum domain, Ieee Transactions on Consumer Electronics, vol. 46, no. 3, pp. 744–750, 2000.
[25] S. C. Liu and S. D. Lin, “BCH code based robust audio watermarking in the cepstrum domain, ” Journal of Information Science and engineering, vol. 22, pp. 535–543, 2006.
[26] N. Cvejic et al.,Audio Watermarking Using m-Sequences and Temporal masking,Ieee Workshop on the Applications of Signal Processing to Audio and Acoustics, pp. 227-230, 2001.
[27] Darko Kirovski and Henrique Malvar Robust Spread-Spectrum Audio Watermarkingmicrosoft research, one Microsoft Way, WA 98052
[28] M. Arnold, M. Schmucker, and S. D. Wolthusen, Techniques and Applications of Digital Watermarking and Content Protection. Boston, London: Artech House, INC, 2003.
[29] W. N. Lie and L. C. Chang,Robust and High-Quality Time-Domain Audio Watermarking Based on Low-
Frequency Amplitude Modification, IEEE Transaction on Multimedia, vol. 8, no. 1, pp. 46-59, February, 2006.
[30] L. Xie, J. Zhang and H. He, Robust Audio Watermarking Scheme Based on Nonuniform Discrete Fourier Transform, in Proceedings of Ieee International Conference on engineering of Intelligent System, pp. 1-5, 2006.
[31] G. Zeng and Z. Qiu,Audio Watermarking in DCT: embedding Strategy and Algorithm,in Proceedings of 9th International Conference on Signal Processing (ICSP’09), pp. 2193-2196, 2008.
[32] M. Pooyan and A. Delforouzi, Adaptive and Robust Audio watermarking in Wavelet Domain,in Proceedings of International Conference on International Information Hiding and multimedia Signal Processing (IIH-mSP 2007), vol. 2, pp. 287-290, 2007.
[33] X. Y. Wang, H. Zhao, A novel Synchronization Invariant Audio Watermarking Scheme Based on DWT and DCT,IEEE Transaction on Signal Processing, vol. 54, no. 12, pp 4835-4840, December 2006.
[34] I. Cox, J. Killian, F. Leighton, and T. Shamoon, Secure Spread Spectrum Watermarking for multimedia, Ieee Transactions on Image Processing, vol. 6, no. 12, pp. 1673-1687, 1997
[35] Pranab Kumar Dhar, Mohammad Ibrahim Khan and Saif Ahmad, New DCT-based watermarking method for copyright protection of digital audio,International journal of computer science & information Technology (IJCSIT) Vol.2, No.5, October 2010
[36] Jixin Liu, and Zheming Lu, A multipurpose audio watermarking algorithm based on vector quantization in DCT domain, World Academy of Science, engineering and Technology , pp.55, 2009
[37] Nagwanshi, K K, Sinha, T S, Satpathy S K, “A practical approach to formation of a robust model for promoting global cyber security”, in Proc. Of 4th Int. Conf. on Computer Applications in electrical engineering recent Advances , IIT-Roorkee, India, Feb 19-21, 2010.
Digital Audio Watermarking for Promoting Global Cyber Security: A Survey
Fast Frequent Itemset mining on Compressed Transac-tions Database
manmohan Singh1, Hemraj Singh Thakur2, Jay Prakash Maurya3, ratna Nayak4, Anil Bhawarkar5
1,3, 4, 5 Department of CSE, BIST, Bhopal (M.P) India2K.V Jaipur,(Rajasthan), India
e-mail : 1 [email protected] [email protected]@gmail.com [email protected] [email protected]
AbstrAct
In an era of knowledge explosion, the growth of data in-creases rapidly day by day. since data storage is a limited resource, how to reduce the data space in the process becomes a challenge issue. Data compression provides a good solution which can lower the required space. Data mining has many useful applications in recent years be-cause it can help users discover interesting knowledge in large databases. However, existing compression algorithms are not appropriate for data mining. In two different ap-proaches were proposed to compress databases and then perform the data mining process. However, they all lack the ability to decompress the data to their original state and improve the data mining performance. A new approach called Mining Merged Transactions with the Quantification table (MMtQt) was proposed to solve these problems. MMtQt uses the relationship of transactions to merge related transactions and builds a quantification table to prune the candidate itemsets which are impossible to become frequent in order to improve the performance of mining association rules.
Keywords— Association rule, data mining, merged transaction, quantification table.
I INTroDuCTIoN
Great amount of data is being accumulated very rapidly in the Internet era. Consequently, it takes a lot of time and effort to process these data for knowledge discovery and decision making. Data compression is one of good solutions to reduce data size that can save the time of discovering useful knowl-edge by using appropriate methods. In this paper, the main focus is on association rule mining and data pre-process with data compression. m.C. Hung et al. proposed a knowledge discovery process from compressed databases in which can be decomposed into the following two steps: (1) Data pre-process step: Data pre-process transforms the original database into a new data representation where several transactions are merged to become a new transaction. (2) Data mining step: It uses an Apriori-like algorithm of as-sociation rule mining to find useful information.
There are some problems in this approach. First, the com-pressed database is not reversible after the original database is transformed by the data pre-process step. It is very difficult
to maintain this database in the future. Second, although some rules can be mined from the new transactions, it still needs to scan the database again to verify the result. This is because the data mining step produces potentially ambiguous results. It is a serious problem to scan the database multiple times because of the high cost of re-checking the frequent item sets.
Another solution was developed by Mafruz Zaman Ashrafi et al. In addition, it spends too much time to check candidate itemsets in the data mining step. In this research, a more ef-ficient approach, called Mining Merged Transactions with the Quantification Table (MMTQT) is proposed, which can compress the original database into a smaller one and perform the data mining process without the above problems. our ap-proaches have the following characteristics:(a) The compressed database can be decompressed to the
original form.(b) reduce the process time of association rule mining by
using a quantification table.(c) Reduce I/O time by using only the compressed database
to do data mining.(d) Allow incremental data mining.
II PreVIouS WorK
Association rule can be expressed as “if A, then B” after sat-isfying the measures of support and confidence. For example, assume that a customer buys milk and bread whereas another buys milk and meat. One would like to discuss “if a new cus-tomer buys milk, then he/she will buy bread too” or “if a new customer buys milk, then he/she will also buy meat”.(1) Support (X) = |T(X) | / |D|(2) Confidence(X →Y)= Support (X Y)/Support (X)In support-confidence framework, if it is an interesting rela-tion for X→Y, then X and Y must be frequent. How to define a frequent relation? There are two conditions. one condition is support(X) ≥ minsupport and support(y) ≥ minsupport(y). Another is Confidence (X→Y) = minconfidence. Minsupport and minconfidence are user-defined thresholds.
III ProPoSeD meTHoD
This section focuses on compressing related transactions and building a quantification table for pruning candidate itemsets that are impossible to become frequent itemsets. Algorithms like compress transactions to reduce the size of a transaction

• 147
database. The compression approach using the aprori algorithm suffers two problem . (1) In the data compression phase, the original database can not be recovered to support transaction updates.(2) In the data mining phase, a lot of candidate itemsets could be generated in a large transaction database.
Since both need to scan the database more than once, they have a much higher process cost. The first problem is due to the lack of rule or constraint in the process of merging transac-tions in the data compression phase. Therefore, the compressed database can not be decompressed to its original form In addi-tion, they don’t use user-defined threshold to filter infrequent 1-itemsets from the original database.
one of the another problem with Apriori-like algorithms generate a lot of candidate itemsets and need to check the candidate itemsets by scanning the database. It is very time-consuming. So we limit the number of database scan to be one in the data compression phase and build a quantification table. In the data mining phase, we use the same approach of Apriori algorithm to generate candidate itemsets and reduce the number of candidate itemsets by using the quantification table. We also reduce the time of scanning the database.
We called our approach the mining merged Transactions with the Quantification Table (MMTQT) which has three phases:(1) merge related transactions to generate a compressed
database(2) Build a quantification table(3) Discover frequent itemsets
MMTQT APPROACH
First, MMTQT uses the transaction relation distance to merge the relevant transactions. The definition of the transaction relation distance is defined D introduce how to build a quan-tification table. Then, it illustrates the process of compressing a database. How to compute support of itemsets from mini-mum-frequency function. Finally, it explains how to recover data from the compressed database.
Transaction Relation DistanceBased on the relation distance between transactions one can merge transactions with closer relationship to generate a bet-ter compressed database. Here the transaction relation and transaction relation distance are defined as follows:
Definition:(1) Transaction relation: The relation between two differ-ent transactions T1 and T2 is that T1 is either a subset or a superset of T2.(2) Transaction relation Distance: Distance is the number of different items between two transactions.
Example 1:T1= ABCE and T2= ABC ,DT1-T2= 1Example 2: T3= A and T4=C, DT3-T4= 2
A Quantification Table:
To reduce the number of candidate itemsets to be generated, additional information is required to help prune non-frequent itemsets.
TABLE IAn example Database
For instance, after reading the transaction ABCDE of TID 100, it knows the transaction length n is 5. For the prefix-
item A, the counters under L5 to L1 are all increased by one from the initial value of zero. That is, A1 appears in each Li, where i = 5 to 1. For the prefix-item B, the counters under L4 to L1 are all increased by one as well. That is, B1 appears in each Li, where I = 4 to 1. The same process is performed for items C, D, and E. Similarly, after reading TID 200 CDE, the table has C2 in L3, L2, and L1; D2 in L2 and L1; E2 in L1. Finally, with the last transaction ACD, it will increase the counters by one from A1 to A2 in L3, L2, and L1; C2 to C3 in L2 and L1; D2 to D3 in L1. Table II shows the result of building the quantification table. With this table, we can easily prune the candidate itemsets whose counters are smaller than the minimum support.
TABLE IIA Quantification Table for TABLE I
The Process of Database Compression:Let d be a relation distance and it is initialized to 1 at the be-
TID Transaction 100 ABCDE 200 CDE 300 ACD
L5 L4 L3 L2 L1A1 A1 A2 A2 A2 B1 B1 B1 B1 C2 C3 C D2 D3 e2
ginning. Transactions will be merged into their relevant trans-action groups in the merged blocks based on the transaction relation distance. M2TQT consists of the following steps:
Step 1: read a transaction at a time from the original data-base.Step 2: record the information of the input transaction to build a quantification table.Step 3: Compute the length n of the transaction.Step 4: If the merged block is not empty, read the relevant transaction groups from the merged block.Step 5: Compute relation distance between the transaction and relevant transaction groups. If the transaction is a superset of the longest transaction of a relevant transaction group, a subset of the smallest transaction of a relevant transaction group, or equal to one transaction of a relevant transaction group, it can be merged into the relevant transaction group.
Fast Frequent Itemset Mining on Compressed Transactions Database

148 • Part D—ICT
For example, we assume d=1. Two transactions BCG and BG are merged into a relation transaction group BCG=2.1.2. A “=” symbol is used to separate items and their respective support counts. We read another transaction BC and compute the relation distance between BCG=2.1.2 and BC. Since the relation distance is 1, BC is merged into the relation transaction group. Finally, the relevant transaction group becomes BCG=3.2.2.Step 6: Compute the relation distance between the transaction and those transactions coming from (n+d) block, n block, and (n-d) block where n > d. If it finds the satisfied relevant transac-tions, merge the transactions to become a relevant transaction group and then classify it as (n+d) merged block, n merged block or (n–d) merged block. If no relevant transaction can be found, the transaction is classified as n merged block.Step 7: repeat the above six steps until the last transaction is read.Step 8: read a transaction from the merged blocks. Step 9: Compute the relation distance between the transaction and all other transactions in the relevant transaction groups. If the transaction is a sub-transaction of the maximum length transaction of a relation transaction group and its distance is satisfied, it can merge the transaction into the relation trans-action group to generate a new count. The process continued until the last transaction is read.Step10: Set d to d+1.Step11: Repeat the above steps 8 - 10 until no more relation distance is found between transactions.
Minimum-frequency Function:The minimum-frequency function takes original transactions and merged transactions as input. It returns the minimum num-ber of itemsets in the transactions. For example, let a candidate 2-itemset C2 be BC, AE and merged transactions of T* be AE=2.1, BCG=2.1.2, CDEG=2.3.3.1, ABCE, C. After calling minimum-frequency function with T* being the input, it returns 0+1+0+1+0=2 for BC and 1+0+0+1+0=2 for AE. This is an efficient function to count the number of itemsets in the transactions.
With the proposed approach it can recover data from the compressed database. Assume the relation distance is equal to 1. A merged transaction is expressed as <s1, s2…, sk .., sn-1, sn>= c1, c2…ck.. cn-1, cn, where s1, s2… , sk , sn-1, sn are items and c1, c2…, ck, cn-1, cn are their corresponding support counts separated by “.”. The smallest count in ci for i = 1 to n is the support of the longest transaction, i.e., s1, s2… , sk , sn-1, sn . If ck is the smallest count in c1, c2…, ck, cn-1, cn , then the count of the longest transaction s1, s2… , sk , sn-1, sn is ck. Therefore, the transaction s1, s2…, sk , sn-1, sn is recovered and the merged transaction becomes <s1, s2… , sn-1, sn>= c1-ck.c2-ck… cn-1-ck. cn-ck. The items with a zero count are removed from the merged transaction. repeat the above process to find the next longest transaction in the merged transaction until no count left. For example, the merged transaction <ABCD>=3.1.4.2 has the smallest count of 1 such
that the count of transaction <ABCD> is 1. Next, decrease the count of each item in <ABCD> by 1 to get <ACD>=3-1.4-1.2-1 = 2.3.1. Note that item B in the merged transaction is removed since it has a zero count. Next, the smallest count among A, C, and D is also 1 such that the count of transaction <ACD> is 1. Then, the merged transaction becomes <AC>==2-1.3-1=1.2 and the smallest count of 1 is the count of transaction <AC>. Finally, <C>=2-1=1 and we have decompressed the merged transaction <ABCD>=3.1.4.2 to get back the original transac-tions ABCD, ACD, AC, C. Here, ABCD, ACD, AC, C also satisfy the specified relation distance.
A Simple example:To illustrate the process of the proposed approach, a simple example is shown below. There are 9 transactions with a total number of 6 distinguished items in the original database as shown in the left-hand side of Fig. 4. Assume the minimum support is 2 meaning that an itemset is frequent if its count is greater than or equal to 2.
Phase 1: The first step is to compress the original database after scanning their transactions. Assuming the transaction relation distance =1, read the first transaction ABCE to compute its length n = 4 and put it into Length-4 block. Next, read transac-tion CDE to get the length n = 3 and then compute transac-tion relation distance between ABCE and CDE to get the distance of 3. They can not be compressed because the relation distance is not equal to 1. Therefore, transaction CDE is put into Length-3 block. After reading the third transaction DE with a length of 2, it examines if the transaction appears in any merged transactions. If it exists, they are merged to generate a new merged transaction with increased counts. on the other hand, it examines whether the computed transaction relation distances with all merged transactions agree to the assumed distance. If it exists, transaction DE is merged with the exist-ing merged transaction which satisfies the transaction relation distance. If transaction DE has no relation in the merged transactions, it will check with the items in L=1, L=2 and L=3 blocks. Since the relation distance between DE and CDE is 1, they are merged into a new transaction CDE=1.2.2. This new transaction is put into Length-3 merged block. Subsequent transactions are processed in the same way. The compressed database is shown in the right-hand side of Fig.4 where the number of transactions becomes 5.
Fig 4: The Original Database and its compressed database
Phase 2: When the compressed database is generated, it also builds a quantification table at the same time as shown in Fig. 5

• 149
Fig 5: A Quantification Table for database
Phase 3: The compressed database is used to generate frequent itemsets with any Apriori-like algorithm for association rule mining. The minimum support is set to 2. From the quanti-
fication table, it can generate frequent 1-itemsets A, B, C, D, E, G. Frequent 1-itemsets are used to generate candidate 2-itemsets. At the same time, it checks the counts of item-sets in L2 of the quantification table to prune the candidate itemsets which are impossible to become frequent itemsets. The generated candidate 2-itemsets are AB, AC, AD, AE, AG, BC, BD, BE, BG, CD, CE, CG, DE, DG, EG. Because the item’s frequency is recorded in the merged transactions, one can use the minimum-frequency function to determine the count of a candidate itemset. The minimum-frequency function returns. The minimal number of item occurrences in a merged transaction and it also returns a value of 1 for an original transaction. For instance, let C2 be A E, CG and compressed transaction T* = AE=2.1, BCG=2.1.2, CDEG=2.3.3.1, ABCE, C. After calling the minimum-frequency function for A E, it returns 1, 0, 0, 1,0. The total frequency of A E is 1+0+0+1+0=2. For CG, it returns 0, 1, 1, 0, 0. The total frequency of CG is 0+1+1+0+0=2. Using the quantification table, one can prune the candidate 2-itemset EG and then scan the compressed database to check if the rest of candidate 2-itemsets are frequent. Candidate 3-itemsets are generated from frequent 2-itemsets which are AE」コ2, BG」コ2, CD」コ2, Ce」コ3, CG」コ2, De」コ2. Finally, it outputs the frequent 3-itemset CDE」コ2 after scanning the compressed database.
IV - EXPERIMENTAL RESULTM2TQT and Merged Transactions Approach were imple-mented in java programming language and all experiments run on a PC of Intel Pentium 4 3.0GHz processor with DDR 400MHz 4GB main memory. Synthetic datasets are gener-
ated by using the IBM dataset generator for our experiments.The dataset T4I5D10k is used to run, our algorithm, merged transactions approach and Apriori algorithm.
Fig 6: The experiment result of T4I5D10K
Let the average size of the potentially large itemset be 5 for the minimum supports 5%, 10%, 15%, and 20%, and compare our algorithm with Apriori algorithm and merged transactions approach. The performance of our algorithm is much better
than the other two approaches as shown in Fig. 6.
V CoNCLuSIoNSIn this paper, a approach ming merged Transactions with the Quantification Table is Analyzed to compress related transactions into a new transaction by scanning the transac-tion database only once. The MMTQT approach utilizes the compressed transactions to mining association rule efficiently with a quantification table. There are several advantages of MMTQT over the other approaches: (1) No multiple data-base scans, because MMTQT reads the database only once if the compressed database fits into main memory. (2) Reduce the process time of association rule mining because MMTQT prunes candidate itemsets which are impossible to become frequent. (3) A compressed database can be decompressed to the original database to support transaction updates.
reFereNCeS[1] M. C. Hung, S. Q. Weng, J. Wu, and D. L. Yang, “Efficient
mining of Association rules using merged Transactions,” in WSEAS Transactions on Computers, Issue 5, Vol.5, pp. 916-923, 2006.
[2] M. Z. Ashrafi, D. Taniar, and K. Smith, “A Compress-Based Association Mining Algorithm for Large Dataset,” in Proceedings of International Conference on Computa-tional Science, pp. 978-987, 2003.
[3] R. Agrawal and R. Srikant, “Fast Algorithms for Mining Association Rules,” in Proceedings of the 20th Interna-tional Conference on Very Large Data Bases, pp. 487-499, 1994.
[4] D. Xin, J. Han, X. Yan, and H. Cheng, “Mining Com-pressed Frequent-Pattern Sets,” in Proceedings of the 31st international conference on Very Large Data Bases, pp. 709-720, 2005.
Fast Frequent Itemset Mining on Compressed Transactions Database

Application of Steganography for Image Hiding to Pro-cesss Secret messages
ms.Varsha A. KhandekarDepartment Of Information Technology
Nuva College of Engineering & Technology, Nagpur,Indiae-mail : [email protected]
AbstrAct
This work is provides an approach to hiding an image inside another image using steganography. While cryptography is preoccupied with the protection of the contents of a message or information, steganography concentrates on concealing the very existence of such messages from detection. A digi-tal watermark is used to insert an imperceptible signal into data which may be in the form of image or video. This has applications in a variety of purposes like copyright control, authenticity, captioning etc. It therefore can be a tool in as-suring the secrecy and privacy of communication.
This work aims at reviewing the reversible data hiding methods used in both audio and image files and their po-tential uses. The original content (image) is mixed with the encoded version of the image to produce a encrypted content at the sender’s end. At the receiving end, an user is unable to appreciate the presence of two images, as only one image is perceived by the user. A detector at the receiving end extracts the encoded image from the content and decodes it to obtain the original image.
The approach proposed and implemented in JAVA uses LSB substitution as the primary method to encoding infor-mation with the original media content. The results for this preliminary work are encouraging and provide an effective direction to using this approach as solution to provide for better information security.
Keywords – Steganography, Morphology, DCT, LSB Substitu-tion and Image Processing.
I. INTroDuCTIoN
Steganography is an umbrella term that involves the use of methods of transmitting secret messages through carriers such as images, audio, video, text, or any other digitally represented code. The hidden message may be plaintext, cipher text, or any-thing that can be represented as a bit stream. Steganography is the art and science of “invisible” communication, which is to conceal the very existence of hidden messages. Images have many attributes, which make it suitable for steganography. Images can convey a large size of message. For instance, some steganographic method can accomplish a steganographic pro-portion that exceeds 13% of the image file size [1].
Because of the non-stationarity of images, the image steg-anography is hard to attack. especially, as the interchange of digital images is frequently used nowadays, image steganogra-
phy becomes promising. In current years, research in the field of JPEG (Joint Photographic Experts Group) steganography has become active as JPEG images are used and transmitted popularly. many steganographic techniques operating on JPEG images have been published and become publicly avail-able. Most of the techniques in this category modify the LSB (least significant bit) of the block discrete cosine transform (BDCT) coefficients, which are the outcomes of block-wise two-dimensional (2-D) DCT followed by quantization using JPEG quantization table.
The steganographic approaches to hiding images is faced with the challenges of ensuring the secrecy of the cover me-dium and of establishing a robust algorithm. To protect secrecy of information it is required to discover new and better cover mediums. It also demands for design and development of robust algorithms. The major hindrances in this are the hid-ing capacity of the medium and the robustness of algorithms against detection [2]. Existing research reveals that the better way to address these issues is to oversee the level of modifica-tion that is made to the cover media. For a substantially high level of modification, the statistical changes are evident and indicate the use of steganography. Also when the medium cannot be intelligently modified in a secret way, it results in a lowered embedding capacity.
existing steganographic mediums and techniques suffer from a myriad of attacks on images, video and audio. These attacks can be defended by improving the cover medium or the communication protocols. In this work an approach to defending attacks by improving the cover medium is focused. The techniques addressing this domain include replacing least significant bit, replacing moderate significant bit, and the pixel modification techniques. The proposed approach implements and evaluates the LSB substitution technique in minimizing attacks on covering medium, thereby making user transpar-ent to the fact that steganography is used in transmission of information.
Section I emphasize the significance of image steganography and details out the challenges and motivation for this work. Section II reviews the contemporary and historical work of research in the area of steganography in general and image steganography in particular. Section III suggests our proposed approach to hiding image within another image by LSB sub-stitution technique. Section IV describes the implementation aspects of the proposed approach through a prototype applica-tion implemented in JAVA. Section V discusses the outcomes of the implemented prototype application and summarized

• 151
its relevance whereas Section VI draws conclusion from the work.
II. reLATeD WorK
A new steganalysis scheme is presented to effectively detect the advanced JPEG steganography by Yun Q. Shi, et al [1]. This system primarily processes JPEG 2-D arrays formed from the magnitudes of JPEG quantized block DCT coefficients. Difference JPEG 2-D arrays along horizontal, vertical and diagonal directions are then used to enhance changes caused by JPEG steganography. Markov process is applied to modeling these difference JPEG 2-D arrays so as to utilize the second order statistics for steganalysis. In addition to the utilization of difference JPEG 2-D arrays, a thresholding technique is developed to greatly reduce the dimensionality of transition probability matrices, i.e., the dimensionality of feature vectors, thus making the computational complexity of the proposed scheme manageable. The proposed scheme has been abserved to have outperformed the existing steganalyzers in attacking like OutGuess, F5, and MB1.
The work of research on gray level modification steg-anography for secret communication by V. Potdar, et al [2] provides insight into the need for better covering medium for steganographic applications. It elaborates on the challenges and attacks on cover medium, and also discusses the alternatives to counter such attacks through improving the cover medium or through improving the communication protocols.
Bet Dunbar describes the various steganographic techniques and also summarizes their use in an open systems environment [3]. This document reviews few of the historical techniques and also suggests their use in an open systems environment where use of the Internet has brought in voluminous data transfer. This as a consequence has paved way for threat to information secrecy. Steganography can be used in a large amount of data formats in the digital world. The most popular data formats used are .bmp, .doc, .gif, .jpeg, .mp3, .txt and .wav. mainly because of their popularity on the Internet and the ease of use of the steganographic tools that use these data formats. These formats are also popular because of the relative ease by which redundant or noisy data can be removed from them and replaced with a hidden message [4].
Bloisi and Iocchi describe a method for integrating together cryptography and steganography through image processing [5]. This system is able to perform steganography and cryptography at the same time using images as cover objects for steganog-raphy and as keys for cryptography. The system proves to an effective steganographic and also a theoretically unbreakable cryptographic. Cryptography and steganography are cousins in the spy craft family: the former scrambles a message so it cannot be understood; the latter hides the message so it cannot be seen. A cipher message, for instance, might arouse suspicion on the part of the recipient while an invisible message created with steganographic methods will not. The majority of today’s steganographic systems use images as cover media because people often transmit digital pictures over email and other
Internet communication (e.g., eBay). Moreover, after digitali-zation, images contain the so-called quantization noise which provides space to embed data. They propose an augmented approach combining cryptography to facilitate more secure information transfer.
mehadi Kharrazi, all have analysed the general concepts and ideas that apply to steganography and steganalysis out of various new and powerful steganography and steganalysis techniques reported in the literature [6]. They have reviewed and discussed the notions of steganographic security and ca-pacity. They have introduced the phenomenon of digital water-marking and information hiding, thereby giving relationships between them , which is depicted through Figure 1. unlike information hiding and digital watermarking, the main goal of steganography is to communicate securely in a completely undetectable manner [06][07][08].
Fig. 1 Relationship between Steganography and related fields (adopted from [6])
T. morkel, et al. provides a general overview of image steganography, its uses and techniques [7]. It also attempts to identify the requirements of good steganographic algorithms. It details out different categories of steganography along with the basic model for image steganography.
III. ProPoSeD APProACH
The modern formulation of steganography is often given in terms of the prisoners’ problem where Alice and Bob are two inmates who wish to communicate in order to hatch an escape plan [8]. However, all communication between them is examined by the warden, Wendy, who will put them in solitary confinement at the slightest suspicion of covert communica-tion. Specifically, in the general model for steganography as depicted in Figure 2, Alice (the sender) wishing to send a secret message M to Bob (the receiver), chooses a cover im-age C. The steganographic algorithm identifies C’s redundant bits (i.e., those that can be modified without arising Wendy’s suspicion), then the embedding process creates a stego image S by replacing these redundant bits with data from M.
The stego image S is transmitted over a public channel (monitored by Wendy) and is received by Bob only if Wendy has no suspicion on it. Once Bob recovers S, he can get M through the extracting process. The embedding process repre-sents the critical task for a steganographic system since S must be similar to C for avoiding Wendy’s intervention (Wendy acts for the eavesdropper).
Least significant bit (LSB) insertion is a common and simple
Application of Steganography for Image Hiding to Processs Secret Messages

152 • Part D—ICT
approach to embed information in a cover file.
Fig.2 The Stganography Model (Adopted from [5])
Where k is the amount of least significant bits used per pixel. Fixed bit insertion is both easy to implement and high performance in terms of the efficiency of the insertion algo-rithm. The amount of data that can be embedded using the fixed bit LSB method, in a fairly standard cover image, is surprisingly large.
Consider a 24-bit image at a resolution of 1024 x 768. Let the two least significant bits (k = 2) of the three eight bit values representing the RGB color channels for each pixel in the cover image be used for substitution. Then the size of data that can be inserted into the cover image (msize) is estimated as
Msize = RGB * k * Resolution = 3 * 2 * (1024 * 768) = 47,18,592 bits = 5,89,824 bytesUsing smarter LSB techniques, that take into account the
visual nature of the cover image, can further increase the embedding capacity.
V. reSuLTS
The prototype implementation using NetBeans 6.0 IDE using JAVA has an interface to choose among the set of BMP im-ages a parent image as cover medium and a secret image as a child image as shown in Figure 3. This interface provides the easy to browse alternative for selecting the cover and secret image suitably.
It overwrites the LSB of a pixel with an M’s bit. For a 24-bit image as cover, we can store 3 bits in each pixel. To the hu-man eye, the resulting stego image will look identical to the cover image.
IV. ImPLemeNTATIoN
The system implementing the above mentioned approach is developed in JAVA under NetBeans 6.0 IDE, an Open Source Environment. As mentioned earlier the LSB substitution method is used.
For embedding a child image into a parent image using LSB substitution method, the 24-bit BMP images are preferred. This is due to the fact that it the largest type of file and usually offers highest quality. When an image is of high quality and resolution it is a lot easier to hide and mask information inside of. Although 24 Bit images are best for hiding information inside of due to their larger size, often 8-bit BMP images or GIF images are used alternatively. It is observed that for the image which embeds another image in it, if its file format is changed, the chances are most likely that the hidden image content (the secret message) will be lost.
The major steps in embedding an image (child image) into another image (parent image) can be summarized as
1. Acquisition of images (child and parent image)2. Extracting RGB channels for these images.3. Encoding the RGB content of images using LSB sub-
stitution.4. Transmitting the resulting stego image.5. Decoding the stego image to get to parent image.
The fixed bit insertion technique is used, in which a fixed amount of least significant bits are replaced in each of the pixel RGB bit values and is often denoted as k LSB. For Io(x,y) are the original pixel bit values, B(x,y) are the inserted data bit values to be inserted and Is(x,y) are the output bit values of the image or stego- image, then fixed bit insertion LSB is represented by the formula Is(x,y) = Io(x,y) – mod(Io(x,y), 2k) + B(x,y) ... (1)
Fig. 3 Interface for choosing parent and child images
once the cover medium (the parent image) has been chosen, using LSB substitution the secret information (the child im-age) is embedded into it. This activity is of encoding the secret message to achieve hiding of information. It can be observed that the resulting stego-image is visibly similar to the original parent image. This can be seen from the Figure 4. The next stage is to decode the stego-image to retrieve back the parent image and the secret image (which has slightly got modified when zoomed to greater detail). This is clear from Figure 5 and Figure 6.
• 153
Fig. 4 The encoded image
Fig. 5 The decoded images
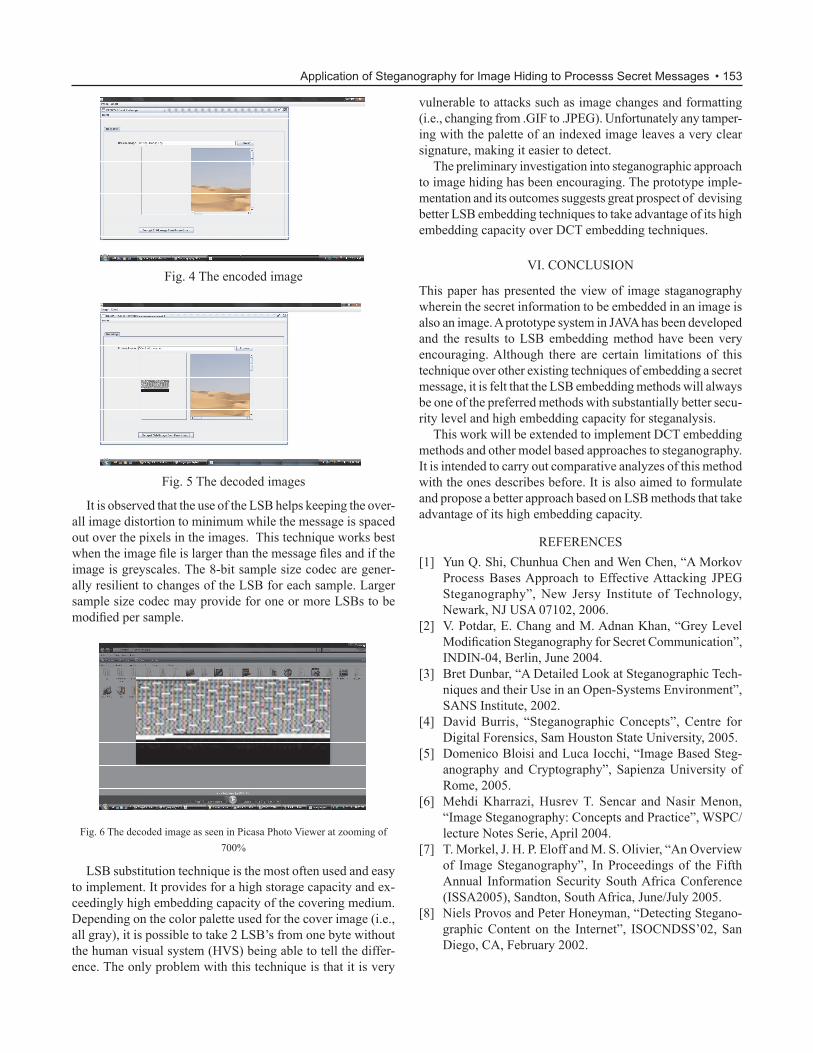
It is observed that the use of the LSB helps keeping the over-all image distortion to minimum while the message is spaced out over the pixels in the images. This technique works best when the image file is larger than the message files and if the image is greyscales. The 8-bit sample size codec are gener-ally resilient to changes of the LSB for each sample. Larger sample size codec may provide for one or more LSBs to be modified per sample.
Fig. 6 The decoded image as seen in Picasa Photo Viewer at zooming of 700%
LSB substitution technique is the most often used and easy to implement. It provides for a high storage capacity and ex-ceedingly high embedding capacity of the covering medium. Depending on the color palette used for the cover image (i.e., all gray), it is possible to take 2 LSB’s from one byte without the human visual system (HVS) being able to tell the differ-ence. The only problem with this technique is that it is very
vulnerable to attacks such as image changes and formatting (i.e., changing from .GIF to .JPEG). Unfortunately any tamper-ing with the palette of an indexed image leaves a very clear signature, making it easier to detect.
The preliminary investigation into steganographic approach to image hiding has been encouraging. The prototype imple-mentation and its outcomes suggests great prospect of devising better LSB embedding techniques to take advantage of its high embedding capacity over DCT embedding techniques.
VI. CoNCLuSIoN
This paper has presented the view of image staganography wherein the secret information to be embedded in an image is also an image. A prototype system in JAVA has been developed and the results to LSB embedding method have been very encouraging. Although there are certain limitations of this technique over other existing techniques of embedding a secret message, it is felt that the LSB embedding methods will always be one of the preferred methods with substantially better secu-rity level and high embedding capacity for steganalysis.
This work will be extended to implement DCT embedding methods and other model based approaches to steganography. It is intended to carry out comparative analyzes of this method with the ones describes before. It is also aimed to formulate and propose a better approach based on LSB methods that take advantage of its high embedding capacity.
reFereNCeS[1] Yun Q. Shi, Chunhua Chen and Wen Chen, “A Morkov
Process Bases Approach to Effective Attacking JPEG Steganography”, New Jersy Institute of Technology, Newark, NJ USA 07102, 2006.
[2] V. Potdar, E. Chang and M. Adnan Khan, “Grey Level Modification Steganography for Secret Communication”, INDIN-04, Berlin, June 2004.
[3] Bret Dunbar, “A Detailed Look at Steganographic Tech-niques and their use in an open-Systems environment”, SANS Institute, 2002.
[4] David Burris, “Steganographic Concepts”, Centre for Digital Forensics, Sam Houston State University, 2005.
[5] Domenico Bloisi and Luca Iocchi, “Image Based Steg-anography and Cryptography”, Sapienza university of Rome, 2005.
[6] Mehdi Kharrazi, Husrev T. Sencar and Nasir Menon, “Image Steganography: Concepts and Practice”, WSPC/lecture Notes Serie, April 2004.
[7] T. Morkel, J. H. P. Eloff and M. S. Olivier, “An Overview of Image Steganography”, In Proceedings of the Fifth Annual Information Security South Africa Conference (ISSA2005), Sandton, South Africa, June/July 2005.
[8] Niels Provos and Peter Honeyman, “Detecting Stegano-graphic Content on the Internet”, ISOCNDSS’02, San Diego, CA, February 2002.
Application of Steganography for Image Hiding to Processs Secret Messages

Efficient Retrieval of an Image by Image Content Kunwar Singh Vaisla1, Prashant rajput2
1. Associate Professor, Department of Computer Science & Engineering, BCT Kumaon Engineering College, Dwarahat, District – Almora, Uttarakhand, [email protected]
2.Associate Professor, Department of Computer Science, Amramali Institute of Management and Computer Appli-cations, Shiksha Nagar, Lamachaur, Haldwani, Uttarakhand, [email protected]
AbstrAct In this paper we present a hypothesis for image retrieval system by image contents that take an image as the input query and retrieves images based on image features i.e. Color, Shape, and Texture. Image retrieval is an approach for retrieving semantically-relevant images from an image database based on automatically-derived image features. The unique aspect of the system is the utilization of function which gives single value for all the feature matrices of an image. The proposed procedure consists of two stages. First, here we are going to extract the image features and storing into the image server and then the user retrieval of that image.. Keywords: Extraction and Matrix Conversion function (EMC Function), Query Server, Image Server, Matrices, Vector.
1. INTroDuCTIoN
Data mining is an AI powered tool that can discover useful information within a database that can then be used to improve actions. To appreciate why businesses are so excited about data mining, you need only imagine that a major department store chain is looking for ways to boost sales. They have a large database containing information about customers and the nature of their purchases (with particulars such as identity of items, price, date, and time of sale). Suppose a data mining utility unearthed a pattern in the data which indicated that customers who shopped on Saturday afternoons and who made their initial purchase of the day in the shoe department tended to make , on average, 4 additional purchases from other departments and that the average member of this group spent more per visit than the typical shopper. Can you now envision the sort advertising campaign that the department store chain might want to embark upon?
A golden vein- Computing Analysis of customer informa-tion, better known as data mining, is finally delivering on its promises – and expanding into some promising new areas. The Economist Technology Quarterly (June 10, 2004). “In the old days, knowing your customers was part and parcel of running a business, a natural consequence of living and working in a community. But for today’s big firms, it is much more difficult a big retailer such as Wal-mart has no chance of knowing ev-ery single one of its customers .So the idea of gathering huge amounts of information and analyzing it to pick out trends indicative of customers wants and needs data mining has long been trumpeted as a way to return to the intimacy of a small town general store. But for many years, data mining claims were greatly exaggerated. In recent years however improve-
ments in both hardware and software and rise of the world wide web, have enabled data mining to start delivering on its promises” from the Data mining to Knowledge Discovery in Databases by usama Fayyad, Gregory Piatetsky Shapiro and Pandhraic Smyth. AI magazine 17(3): Fall 1966, 37-54.”Data mining and knowledge discovery in databases have been at-tracting a significant amount of research , industry and media attention of late .What is all the excitement about ? This article provides an overview of this emerging field, clarify-ing how data mining and knowledge discovery in databases are related both to each other and to related fields , such as machine learning , statistics and databases. The article men-tions particular real world applications, specific data mining techniques, challenges involved in real world applications of knowledge discovery and current and future research direc-tions in the field.
By John Boyd, IBM thinks Research (1990). “Ordinary data mining simply looks for keywords, but the text mining system dubbed TAKmI (an abbreviation for text analysis and knowledge mining but also a Japanese word meaning ‘skilled craftsman’) spots grammatical relationships as well. Knowing which word is the subject, which is the web and which the object, TAKmI can categorize calls according to whether they are, say, complaints or questions and according to the product that is causing difficulty.”
Knowledge discovery and data mining research at IBM. “The challenge of extracting knowledge from data draws upon research in statistics databases, pattern recognition, machine learning, data visualization, optimization, and high-perfor-mance computing, to deliver advanced business intelligence and web discovery solutions.”
Data mining and complex objectsFor many standard applications, like market analysis, con-structing a usable KDD process is a rather well determined task. However, the data to be processed in real world applica-tions is getting more and more complex and is yielding more potential knowledge. With advancing processors, memory and disc space, the detail level of objects is increasing as well as their plain numbers. For example, companies acquire more detailed information about their costumers, sky telescopes offer pictures with higher resolutions and html documents use structural tags, embedded multimedia content and hyper-links which make them more complicated than ordinary text documents.
All these additional information yields new challenges to KDD. Though it is basically desirable to have more informa-

• 155
tion about given data objects, the selection of characteristics that are used in data mining gets more difficult. Additionally, many complex objects provide structural information as well as plain features. For example, a gene sequence is characterized by the order of nucleotides instead of their plain appearance in the gene.
To analyze complex objects, the most established way is to map any complex object to a feature vector. The idea is to span a vector space in which each relevant object characteristic or feature provides a dimension. Thus, an object is represented by the vector of its feature values. Since this is the most common feature representation, there is a wide variety of data mining algorithms that can process vectors as input representation. Though this method offers good results in many application areas, the data transformation becomes more and more difficult with increasing object complexity. Since data transformation usually is not informed about the purpose of the KDD task, it is difficult to decide which characteristic of an object should be preserved and which can be neglected. Furthermore, structural information is very difficult to express using a single feature vector. For example, it is not possible to model an arbitrary sized set within a feature vector without losing information. Thus, transforming complex objects into a feature vector and employing vector based data mining often spends large efforts for data transformation and provides suboptimal results.
For several applications, it is more beneficial to employ spe-cialized data mining algorithms that can process more complex input representations than plain feature vectors. employing structured object representations like graphs, sequences or re-lational data, often provides a more natural view on real world complex objects. The type of data representation discussed in this work is called compound object representation and is also capable to model structural information.
complex and compound Data ObjectsCompound data objects are built of concatenations and sets of other compound data objects. Basic compound objects can consist of any object representation that can be processed by a data mining algorithm.
2. reVIeW oF LITerATure or PreVIouS reLATeD STuDy
Data mining - Traditionally, algorithms for data analysis assume that the input data contains relatively few records. Currents databases, Current databases, however, are much too large to be held in main memory. retrieving data from disk is markedly slower than accessing data in rAm. Thus to be efficient, the data-mining techniques applied to very large databases must be highly scalable. An algorithm is said to be scalable if-given a fixed amount of main memory –its runtime increases linearly is said to be scalar if –given a fixed amount of main memory –its runtimes increases linearly with the number of records in the input database.“Data mining, the ability to find unexpected patterns in ac-cumulated data, was born during a lunch break. At a customer
conference in the early 1990s, an executive at British depart-ment store chain Marks & Spencer was explaining his database woes to rakesh Agrawal, an information retrieval specialist at IBM. The store was collecting all sorts of data but didn’t know what to do with it. So Agrawal and his team began devising algorithms for asking open-ended queries, eventually authoring a 1993 paper that would become required reading in data-min-ing science. The report has been cited in more than 650 other studies, making it one of the most widely cited papers of its kind. Agrawal, the data-mining pioneer, is today working on a system that will scramble customer data in a way that will allow companies to study buying trends or other patterns while preserving strict privacy.’
retrieving complex Object (Like Images by Image con-tent) - The application scenario is that the user inputs a rough sketch depicting the prominent edges or contours of objects and wishes to retrieve database images that have similar shapes. We can only expect to get a rough query sketch from the users, which is likely a distorted version of the intended database image, hence it is imperative that tolerance be pro-vided towards sketch distortion ; by yin Chan and S.Y. Kung, Princeton university.
Because automated image retrieval is only meaningful in its service to people, performances characterization must be grounded in human evaluation of retrieval result, both for query by images example and query by image example and query by text. The data is independent of any particular image retrieval algorithm and can be used to evaluate and compare many such algorithms without further data collection; by Nikhil V Shirahatti, Kobus Barnard, University of Arizona.
major headings are to be column centered in a bold font without underline. They need be numbered. “2. Headings and Footnotes” at the top of this paragraph is a major heading.
3. reLeVANCe oF ProPoSeD STuDy
In tradition ‘search –and - retrieval’ systems, users through specific queries to collections of text and get back more or less useful answers to those queries in text from again ,today in WWW era, we are dealing with images and video data at a large extent. So the goal of data-mining should include large and complex object s like images or videos as well as text mining to produce new knowledge by exposing unanticipated similarities or differences ,clustering or dispersal, co-occur-rence and trends on large object also. With its roots in statistics, artificial intelligence and machine learning, data-mining has been around since the 1990s.
The study would be very relevant towards identifying im-ages on the basic of image content. Because now a days the image data base increasing tremendously day by day.
4. OBJECTIVES OF THE PROPOSED STUDY
This study will discuss the concepts related to the data min-ing technique used to solve the query for large and complex
Efficient Retrieval of an Image by Image Content

156 • Part D—ICT
objects. Data miners will often try different algorithms and settings, and inspect the resulting models and test results to select the best algorithm and settings. This study will provide a high-level overview of the algorithms supported by many standards like classification problems: decision tree, naïve bayes (NB), support vector machine (SVM), and feed forward neural networks.
In traditional ‘search-and-retrieval’ projects, scholars bring specific queries to collections of text and get back more or less useful answers to those queries, ‘By contrast, the goal of data-mining, including text-mining, is to produce new knowledge by exposing unanticipated similarities or differences, cluster-ing or dispersal, co-occurrence and trends.’ With its roots in statistics, artificial intelligence and machine learning, data-mining has been around since 1990s. With data-mining tools, you first select a body of material that you think is important in some way, next select features of those materials that you similarly think are important, and then ‘map the occurrence of those features in the selected materials to see whether pat-terns emerge. If patterns do emerge, you analyze them and from that analysis emerges if you are lucky-new insights into the materials.’
5. METHODOLOGY FOR THE PROPOSED STUDY
This hypothesis will discuss the concepts related to the data mining technique used to solve the query for large and complex objects like images and videos. Data miners will often try dif-ferent algorithms and settings, and inspect the resulting models and test results to select the best algorithms and settings. This study will provide a high-level overview of the algorithms sup-ported by many standards like classification problems, decision tree, naïve bayes (NB), support vector machine (SVM), and feed forward neural networks.
5.1 Proposed ArchitectureProposed function: I suggested a mathematical function named as extraction and matrix conversion function which takes the resized image as input and extract all the features (Shape, color and texture) in term of their respective matrices and convert these matrices of the image in to the single and unique value correspondingly.
the steps involved in the function are as follows:Step 1: extract Features of resized image (Color, Texture,
and Shape).Step 2: extraction of Data Structure and 2D matrices for each
feature are generated.Step 3: A Function is applied to convert the 2D matrices to
a single value for all different matrices.Step 4: All single values of a particular feature (like shape,
texture and color) are combined to form 1D vector.Step 5: All 1D vectors (of shape, color and texture) are com-bined to form a 2D matrix.
Figure 1 - extraction and matrix conversion function
Properties of the Function
The function will give the single unique value for the combina-tion of the different feature matrices.
The proposed architecture consists of two subsystems- 1. Image’s Feature Extraction and storage, and 2. retrieval of image.
The mathematical function is applied for the extraction process, and has the constraint that all the images stored of the same size (e.g.3x4cm). The process is shown in figure 1 and 2.
steps for Image’s Feature Extraction and storageStep 1: Original image is resized to size 3x4 cm.Step2: extraction and matrix conversion function is ap-
plied.Step 3: The function generates the single and unique value
vector.Step 4: This single and unique value is stored in the query server with reference to the image.
Figure2. extraction of the Image Features and Storage of the Image with mapped value generated by function
retrieval of Image by the UserStep1: user queries for the Image.

• 157
Step2: Image is resized to the fixed size (e.g. 3x4cm).Step3: extraction and matrix conversion function is applied to
image and get a single unique value for the image Step4: This single value is compared with the image values
stored in the query server and the corresponding image is displayed.
Figure3. retrieval of the Image from Image Server with help of generated function value
6. CONCLUSIONS
The proposed system is a hypothesis; it provides a single unique value for the combination of the different features matrices. It makes the searching for the image retrieval faster and more efficient because we compared the single value for the different features (color, shape, and texture) matrices. Due to this mathematical function the proposed system increases the searching efficiency up to 60-70%.
7. SCOPE AND LIMITATIONS
As this is hypothesis and most of the part of the proposed system shall be carried out theoretically, practical of research work shall not be covered in this work.
8. REFERENCES
1. Performance mining of large-scale data-intensive ap-plications, Carothers, C. Szymanski, B.K.; M. Parallel and Distributed Processing Symposium, Proceedings International, IPDPS 2002, Abstracts and CD-ROM volume, Issue, 2002 Page(s):177-178.
2. Advanced Scout: Data mining Knowledge Discovery in NBA Data, a Brief Application Description. By Inderpal Bhandari, et al. Data Mining and knowledge Discovery 1,121-125(1997).
3. Mining very Large Databases, Venkatesh Ganti, Jo-hannes Gehrke, Raghu Ramakrishnan; university of Wisconsin-Madison, IEEE Computer , PP 38-45, 0018-9162/99-@ August 1999.
4. “Distance Measures for point Sets and Their Compu-tation”. T. eiter and H.mannila. Acta Information , 34(2):103-133,1997.
5. Google Press Center. Google Archives search Milestone with Immediate Access To More Than 6 Billion Items.
6. Knowledge Discovery and Data Mining: Towards a uni-fying framework. u.m. Fayyad, G. Piatetsky-Shapiro, and P. Smyth. In Knowledge Discovery and Data mining, Pages 82-88, 1996.
7. “A polynomial time computation metric between points sets”. J. Romon and M. Bruynooghe. Acta Information , 37:765-780,2001.
8. HIERARCHICAL ALGORITHM FOR IMAGE RE-TRIEVAL BY SKETCH, Yin Chan and S.Y. Kung , Princeton University pp-564-569, 0-7803-3780-8/97/$10.00 01 997 IEEE.
9. Evaluating Image Retrieval , Nikhil V Shirahatti, Ko-bus Barnard , Proceedings of the 2005 IEEE computer Society Conference on computer vision and Pattern Recognition (CVPR’05) 1063-6919/05@ 2005 IEEE.
10. The Rebirth of Artificial Intelligence. Lisa DiCarlo. Forbes (May 16, 2000). “Oracle is promoting its Intel-ligence WebHouse tools”.
Efficient Retrieval of an Image by Image Content
Planning Generic e-learning modelAnamika Shukla, Gargee Shukla2, manju Shukla3
2,3(Guru Ghasidas Vishwavidyalaya Bilaspur)
AbstrAct
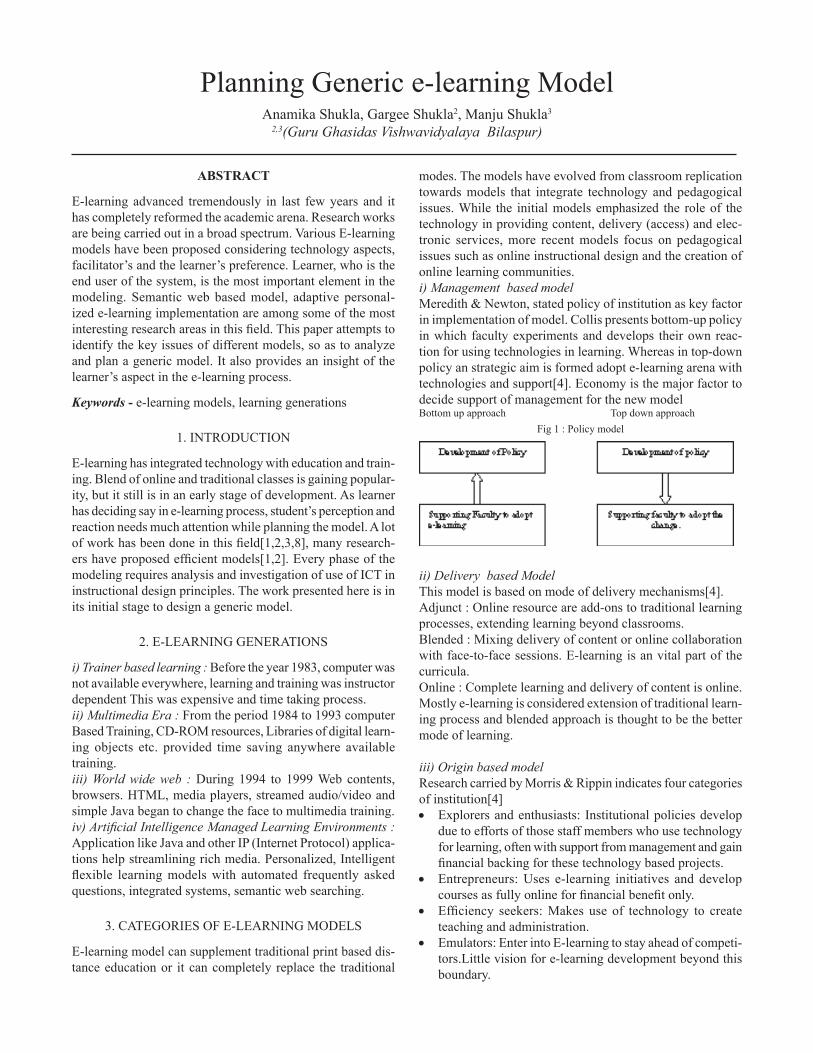
e-learning advanced tremendously in last few years and it has completely reformed the academic arena. research works are being carried out in a broad spectrum. Various e-learning models have been proposed considering technology aspects, facilitator’s and the learner’s preference. Learner, who is the end user of the system, is the most important element in the modeling. Semantic web based model, adaptive personal-ized e-learning implementation are among some of the most interesting research areas in this field. This paper attempts to identify the key issues of different models, so as to analyze and plan a generic model. It also provides an insight of the learner’s aspect in the e-learning process.
Keywords - e-learning models, learning generations
1. INTroDuCTIoN
e-learning has integrated technology with education and train-ing. Blend of online and traditional classes is gaining popular-ity, but it still is in an early stage of development. As learner has deciding say in e-learning process, student’s perception and reaction needs much attention while planning the model. A lot of work has been done in this field[1,2,3,8], many research-ers have proposed efficient models[1,2]. Every phase of the modeling requires analysis and investigation of use of ICT in instructional design principles. The work presented here is in its initial stage to design a generic model.
2. e-LeArNING GeNerATIoNS
i) Trainer based learning : Before the year 1983, computer was not available everywhere, learning and training was instructor dependent This was expensive and time taking process.ii) Multimedia Era : From the period 1984 to 1993 computer Based Training, CD-ROM resources, Libraries of digital learn-ing objects etc. provided time saving anywhere available training.iii) World wide web : During 1994 to 1999 Web contents, browsers. HTML, media players, streamed audio/video and simple Java began to change the face to multimedia training. iv) Artificial Intelligence Managed Learning Environments : Application like Java and other IP (Internet Protocol) applica-tions help streamlining rich media. Personalized, Intelligent flexible learning models with automated frequently asked questions, integrated systems, semantic web searching.
3. CATeGorIeS oF e-LeArNING moDeLS
e-learning model can supplement traditional print based dis-tance education or it can completely replace the traditional
modes. The models have evolved from classroom replication towards models that integrate technology and pedagogical issues. While the initial models emphasized the role of the technology in providing content, delivery (access) and elec-tronic services, more recent models focus on pedagogical issues such as online instructional design and the creation of online learning communities. i) Management based model Meredith & Newton, stated policy of institution as key factor in implementation of model. Collis presents bottom-up policy in which faculty experiments and develops their own reac-tion for using technologies in learning. Whereas in top-down policy an strategic aim is formed adopt e-learning arena with technologies and support[4]. Economy is the major factor to decide support of management for the new modelBottom up approach Top down approach
Fig 1 : Policy model
ii) Delivery based Model This model is based on mode of delivery mechanisms[4]. Adjunct : online resource are add-ons to traditional learning processes, extending learning beyond classrooms. Blended : Mixing delivery of content or online collaboration with face-to-face sessions. e-learning is an vital part of the curricula. online : Complete learning and delivery of content is online.mostly e-learning is considered extension of traditional learn-ing process and blended approach is thought to be the better mode of learning.
iii) Origin based model Research carried by Morris & Rippin indicates four categories of institution[4]• explorers and enthusiasts: Institutional policies develop
due to efforts of those staff members who use technology for learning, often with support from management and gain financial backing for these technology based projects.
• entrepreneurs: uses e-learning initiatives and develop courses as fully online for financial benefit only.
• Efficiency seekers: Makes use of technology to create teaching and administration.
• emulators: enter into e-learning to stay ahead of competi-tors.Little vision for e-learning development beyond this boundary.

• 159
Their research concluded e-learning to originate from the ex-plorer and enthusiast category.The enthusiast’s developments will lead to the formation of institutional policy, following a Collis style implementation model. In some cases, institutional policy and enthusiasts developments do not align, forcing backtrack and loss of enthusiasm for these early innovators.
iv) The Concentric Support Model It identifies the 46 critical support elements necessary to support a quality distance learning program through the introduction of the concentric support model and illustrates their relationship into seven functional areas(student, faculty, content, course management system, technology, program, community). This list of elements can act as a checklist for the practitioner in the planning and evaluation of distance learning programs[4]. Ehlers (2004) suggests that subjective quality requirements be structured in 7 fields of quality: Tutor Support, Cooperation and Communication in course, Technology, Costs-Expectations-Benefits, Information Trans-parency of Provider/Course, Course structure, Didactics
v) The demand-driven learning model It highlights the three consumer demands: high quality con-tent, delivery and service. Content should be comprehensive, authentic and researched[4]. Web based, user friendly, inter-active delivery with interactivity supporting communication tools and service should include resources needed for learning, administrative and technical support. This model provides a valuable framework for understanding the importance of technology to support content, delivery and service. It also explains the pedagogical changes to be made to content and services to meet the changing needs of learners.
Fig 2 : Demand driven learning model[4]
vi) Semantic web based model:
plication provides facilities like allowing e-learning content to be created, annotated, shared and discussed, together with supplying resources such as lecture notes, course description, documents, announcements, student papers, useful urL links, exercises and quizzes for evaluation of the student knowledge. every web application has three parts :Web(network, server, browser and communication protocol) ; Pedagogical background(educational model along with in-structors intention) ;Personalized management of the learning material( the set of rules and mechanisms that are used to select learning materials based on the student’s characteristics, the educational objectives, the teaching model, and the available media).
These three basics are included in e-learning systems, leading to several standardization projects. Some projects have focused on determining the standard architecture and format for learning environments, such as Ieee Learning Technol-ogy Systems Architecture (LTSC), Instructional management Systems (ImS), and Sharable Content object reference model (SCorm). Semantic web has four categories: • Semantic web languages: mainly based on XML (eXten-
sible Markup Language), XML Schemas, RDF (Resource Definition Framework), and RDF Schemas, these are used to represent information on the semantic web to make that information both syntactically and semantically interoper-able across applications.
• ontology : Set of knowledge terms, including the vocabu-lary, semantic interconnections, simple rules of inference and logic for particular topic. ontologies provide the neces-sary framework around which knowledge bases should be built, and set grounds for developing reusable web-contents, webservices, and applications. It is a text-based piece of ref-erence-knowledge, put somewhere on the web to consult and represented using the syntax of an ontology representation language, most of them are XML and RDF based. popular higher-level ontology representation languages were oIL (ontology Inference Layer) and DAmL+oIL. An ontology developed in any such language is usually converted into an RDF/XML-like form and can be partially parsed even by common RDF/XML parsers. W3C has officially released oWL (Web ontology Language) as W3C recommendation for representing ontologies. OWL is a set of XML elements and attributes, with well-defined meaning, that are used to define terms and their relationships.
• Semantic Web Services: Information brokers, search agents, information filters, intelligent information integration, and knowledge management are possible only if a number of ontologies populate the Web, enabling semantic interopera-tion between the agents and the applications on the semantic web, i.e. semantic mappings between terms within the data, which requires content analysis.
In adaptive learning ontology can be used to retrieve the context of a course and to structure the contents. metadata describes each learning object of a subject, i.e., the modularized
Semantic web creates a web of machine-understand-able and interoperable services that intelligent agents can discover, execute, and compose automatically[1]. The explicit representation of the semantics of data, accompanied with domain theories (ontologies), will enable a web that provides a qualitatively new level of service, such as intelligent search engines, information brokers, and information filters. The ap-
Planning Generic e-learning Model

160 • Part D—ICT
content, which is linked to the concept of the ontology. Proper agents helps users to parse the metadata and modify the user interface to satisfy the user’s needs, whether student or instruc-tor. Semantic web based model contains a hierarchical contents structure and semantic relationships between concept and can provide related useful information for searching and sequenc-ing learning resources in web-based e-learning systems.
4.DESIGNING E-LEARNING MODEL
As the learning style learner varies, learning model should fit the different needs of learners. The work presented here is in primary stage and tries to generate a generic model of e-learning satisfying needs of different type of users. It needs much research and refinement. Till then the framework and initiatives for modeling provides a common core of quality elements, which can be flexibly applied to a diverse range of applications of e-learning. It is not capable to model live flow and interaction of, but of course presents the basic phases of modeling.
While designing e-learning systems various critical is-sues like cross-cultural communication and ethical issues etc. are considered. Framework[3,4] is first of all formed for further planning, design, development, evaluation, and implementation of e-learning environments. Following issues are considered.• The infrastructure provision examines built environment,
network requirements, equipment requirements, accessibil-ity specifications, interoperability.
• The technical standards, examines issues of technology infrastructure in e-learning environments. This includes infrastructure planning, hardware, and software, interop-erability, functionality, design principles and quality of assets.
• The content development issue considers quality of assets, fit to curriculum requirement, content design and planning.
• The pedagogical dimension addresses issues concerning content, audiences, goal and media analysis; design ap-proach; organization and methods and strategies of learning environments. Various e - learning methods and strategies include presentation, demonstration, drill and practice, tutorials, games, story telling, simulations, role-playing, discussion, interaction, modeling, facilitation, collaboration, debate, field trips, apprenticeship, case studies, generative development, and motivation.
• management, maintenance of learning environment and distribution of information.
• resource Support dimension examines the online support (e.g., instructional/counseling support, technical support, career counseling services, other online support services) and resources (i.e., both online and offline) required to foster meaningful learning environments.
• The interface design dimension encompasses page and site design, content design, navigation, and usability testing.
• evaluation includes both assessment of learners, and evalu-ation of the instruction and learning environment.
• Ethical issue relates to social and political influence, cultural diversity, bias, geographical diversity, learner diversity, information accessibility, etiquette, and the legal issues.
• Institutional issue is concerned with administrative affairs (e.g., organization and change, accreditation, budgeting, and return on investment, information technology services, instructional development and media services, marketing, admissions, graduation, and alumni affairs); academic affairs (e.g., admissions, graduation, and alumni affairs); academic affairs (e.g., faculty and staff support, instructional affairs, workload, class size, compensation, and intellectual property rights); and student services (e.g., pre-enrollment services, course and program information, orientation, ad-vising, counseling, financial aid, registration and payment, library support, bookstore, social support network, tutorial services, internship and employment services, and other services) related to e-learning.
After summarizing a common framework for e-learn-ing model, it is implemented in such a way so as to enable all participants, facilitators to check the model on technical, institutional, content, pedagogic ground. The model designing process goes through phases of :
i)Requirement Analysis: To identify requirement of the user community(the learner and facilitator). Here, emphasis is given on teaching contents and learners need. In this phase objective of management, target users, learners requirement(learning style), learning environment, available resources, curriculum objective, information content are identified. Study of data, documents, manuals, existing courseware and related litera-ture is carried out. The educational contents to be taught are analysed. This phase produces documents like, Information contents which identifies the knowledge to be gained and the tasks to be developed to acquire this knowledge ;Documents to define the primary and secondary learning objectives etc[8].
ii)Design : This phase is mainly concerned with mode of in-formation delivery. Preliminary design of user interface to be used, learning approach, structure information, data structure, language, course, modularization along with data identification so as to produce most effective visual presentation etc. are decided besides identifying the form of deliverables such as computer based training or web based training, synchronous or asynchronous mode of communication. It identifies the structure of the information to be delivered as well as the pre-sentation of information which depends on the type of contents to be delivered and varies according to teaching aim.
iii)Development : It covers identification of practical learn-ing process, event sequence, resources to be used, policy to be used, learning tree, lesson structure and content. It also include the tools that are to be used to teach. Here materi-als, strategies, event sequences, and necessary resources are prepared. It forms process applicable to the real structure of teaching units, which includes a tree containing the structure and contents of each e-lesson.
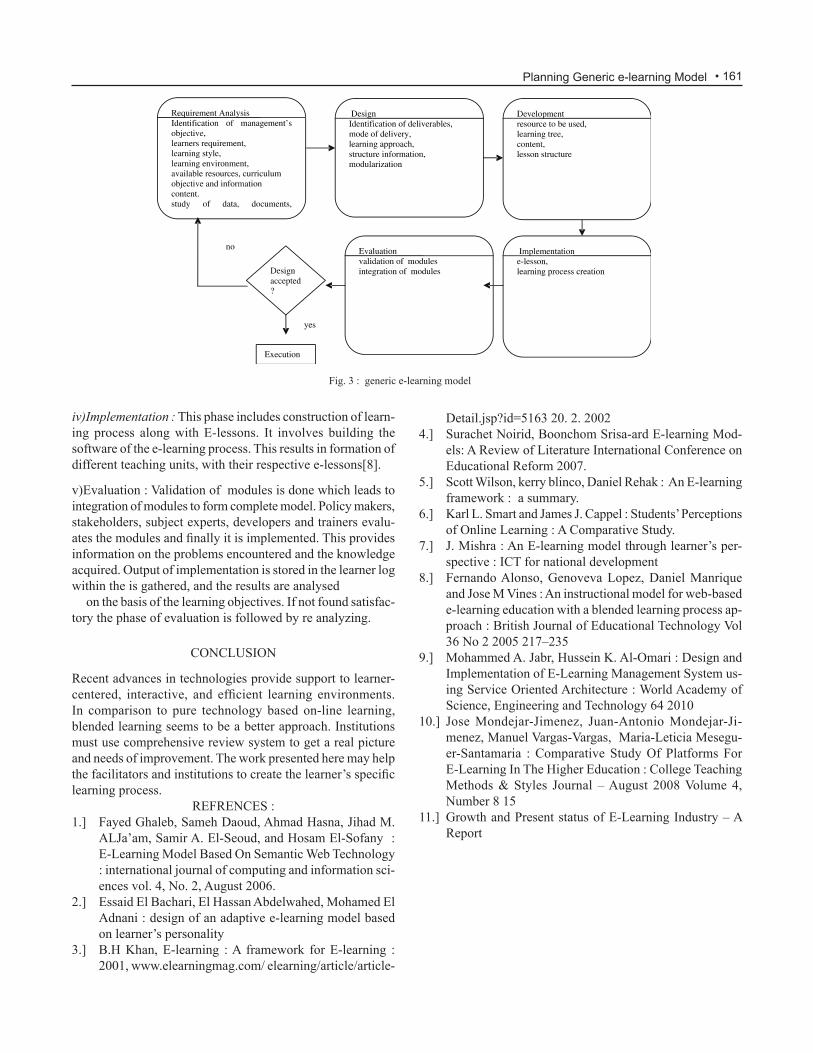
• 161
iv)Implementation : This phase includes construction of learn-ing process along with e-lessons. It involves building the software of the e-learning process. This results in formation of different teaching units, with their respective e-lessons[8].
v)evaluation : Validation of modules is done which leads to integration of modules to form complete model. Policy makers, stakeholders, subject experts, developers and trainers evalu-ates the modules and finally it is implemented. This provides information on the problems encountered and the knowledge acquired. output of implementation is stored in the learner log within the is gathered, and the results are analysed
on the basis of the learning objectives. If not found satisfac-tory the phase of evaluation is followed by re analyzing.
CoNCLuSIoN
recent advances in technologies provide support to learner-centered, interactive, and efficient learning environments. In comparison to pure technology based on-line learning, blended learning seems to be a better approach. Institutions must use comprehensive review system to get a real picture and needs of improvement. The work presented here may help the facilitators and institutions to create the learner’s specific learning process.
reFreNCeS :1.] Fayed Ghaleb, Sameh Daoud, Ahmad Hasna, Jihad M.
ALJa’am, Samir A. El-Seoud, and Hosam El-Sofany : E-Learning Model Based On Semantic Web Technology : international journal of computing and information sci-ences vol. 4, No. 2, August 2006.
2.] Essaid El Bachari, El Hassan Abdelwahed, Mohamed El Adnani : design of an adaptive e-learning model based on learner’s personality
3.] B.H Khan, E-learning : A framework for E-learning : 2001, www.elearningmag.com/ elearning/article/article-
Fig. 3 : generic e-learning model
Detail.jsp?id=5163 20. 2. 20024.] Surachet Noirid, Boonchom Srisa-ard E-learning Mod-
els: A review of Literature International Conference on Educational Reform 2007.
5.] Scott Wilson, kerry blinco, Daniel Rehak : An E-learning framework : a summary.
6.] Karl L. Smart and James J. Cappel : Students’ Perceptions of online Learning : A Comparative Study.
7.] J. Mishra : An E-learning model through learner’s per-spective : ICT for national development
8.] Fernando Alonso, Genoveva Lopez, Daniel Manrique and Jose M Vines : An instructional model for web-based e-learning education with a blended learning process ap-proach : British Journal of Educational Technology Vol 36 No 2 2005 217–235
9.] Mohammed A. Jabr, Hussein K. Al-Omari : Design and Implementation of e-Learning management System us-ing Service oriented Architecture : World Academy of Science, Engineering and Technology 64 2010
10.] Jose Mondejar-Jimenez, Juan-Antonio Mondejar-Ji-menez, manuel Vargas-Vargas, maria-Leticia mesegu-er-Santamaria : Comparative Study of Platforms For e-Learning In The Higher education : College Teaching Methods & Styles Journal – August 2008 Volume 4, Number 8 15
11.] Growth and Present status of E-Learning Industry – A report
Planning Generic e-learning Model

A Comparative Analysis of Various exact String-match-ing Algorithms forVirus Signature-Detection
Amit Kumar1, Vishrut Sharma2, Shishir Kumar3
Department of CSE,Jaypee University of Engineering & Technology, Guna (MP) [email protected]@[email protected]
AbstrAct
Since the evolution of computer network, virus has been a constant threat to one’s privacy and system well being. This threat is growing day-by-day and has acquired interest of some major research works in the field of Information Technology. Computer viruses today pose a great security threat, thanks to the advancement in virus programming technology. Due to the Internets’ feature of unrestricted connectivity and widespread software homogeneity these pathogens exploit tremendous parallelism in their propagation too. modern viruses are built to propagate like worms, so swiftly that no human-mediated action can even hope of containing an outbreak.
An anti-virus is needed to detect and contain such threats. modern day anti-virus software implements two main ap-proaches in order to detect viruses viz. signature-based de-tection and anomaly-based detection (heuristic analysis). The signature-based detection method is the oldest one and focuses on finding a match to a pattern known as virus signature or signature in the machine-code of an infected file. This task is made possible by using string-matching algorithms. Some of these algorithms are made especially for the purpose of sig-nature detection while others were in use in word-processing software for ‘search’ functions.
This paper analyzes different string-matching algorithms in use today for the purpose of signature-detection on the basis of their complexities, scans rates, etc. and makes an at-tempt to evolve a more effective algorithm for containment of computer viruses.
I. INTroDuCTIoN
The term “virus” was first coined by Fred Cohen in the year 1984. Cohen described “virus” as a program that can ‘infect’ other programs by modifying them to include a possibly evolved copy of itself. As per the Symantec Corporation, a “virus” can be defined as “A parasitic program written inten-tionally to enter a computer without the users’ permission or knowledge. The word parasite is used because a virus attaches to files or boot sectors and replicates itself, thus continuing to spread. Though, some viruses do little but replicate others can cause serious damage or effect program and system perfor-mance. A virus should never be assumed harmless and left on a system.” The term “virus” is also commonly but erroneously used to refer to other types of malware programs that do not have the reproductive ability. A true virus can only spread from
one computer to another (in some form of executable code) when its host is taken to the target computer; for instance a user sends an infected file over a network or the Internet, or carries it on a removable medium such as a floppy disk, CD, DVD, or USB drive. Viruses can increase their chances of spreading to other computers by infecting files on a network file system or a file system that is accessed by another computer. However, a new class of virus is in wild known as a hybrid virus which shows behaviour characteristic to both a virus and a worm. A hybrid virus can infect both like a virus and a worm by self-propagating on a network.
Traditionally, a virus can be detected using signature-detec-tion method. However, one more method viz. anomaly-detec-tion method is used by several antivirus software alongwith signature-detection method, but that method is out of scope of this paper. The next section will describe the signature-de-tection method and will also list the algorithms that are later compared in this paper.
In order to understand the signature-detection method and the algorithms that are used to match a signature, we should know what a virus signature is. A virus signature is a unique sequence of bits (in the virus code) that can be used to identify the presence of a virus in a file or a range of memory. Usually, this sequence is in hexadecimal form and is kept so large to avoid false-positive and so concise to avoid memory wastage. A typical virus signature can be of the following form:
A0 D2 1B F4 96 E6 A7 F5 8D FF C2 7F
To match such type of strings with the byte-code of a file we make use of different string-matching algorithms. The string-matching algorithms can be broadly classified into two main categories viz. Exact String-Matching algorithms and Appro-ximate String-Matching algorithms. This paper compares six different exact string matching algorithms based on their com-plexities, scan rates, etc. The algorithms that are covered by this paper are: Boyer-Moore Algorithm, Turbo Boyer-Moore Algorithm, Boyer-Moore-Horspool Algorithm, Aho-Corasick Algorithm, and Knuth-morris-Pratt Algorithm.
Boyer-Moore algorithm[1][2] uses two pre-processing phases for scanning viz. Good Suffix Shift and Bad Character Shift and has a best-case complexity of O(n/m); turbo Boyer-Moore[1], a variant of Boyer-Moore, does not implement an extra pre-processing phase but just a turbo shift in case of a mismatch and improves the worst case complexity of original
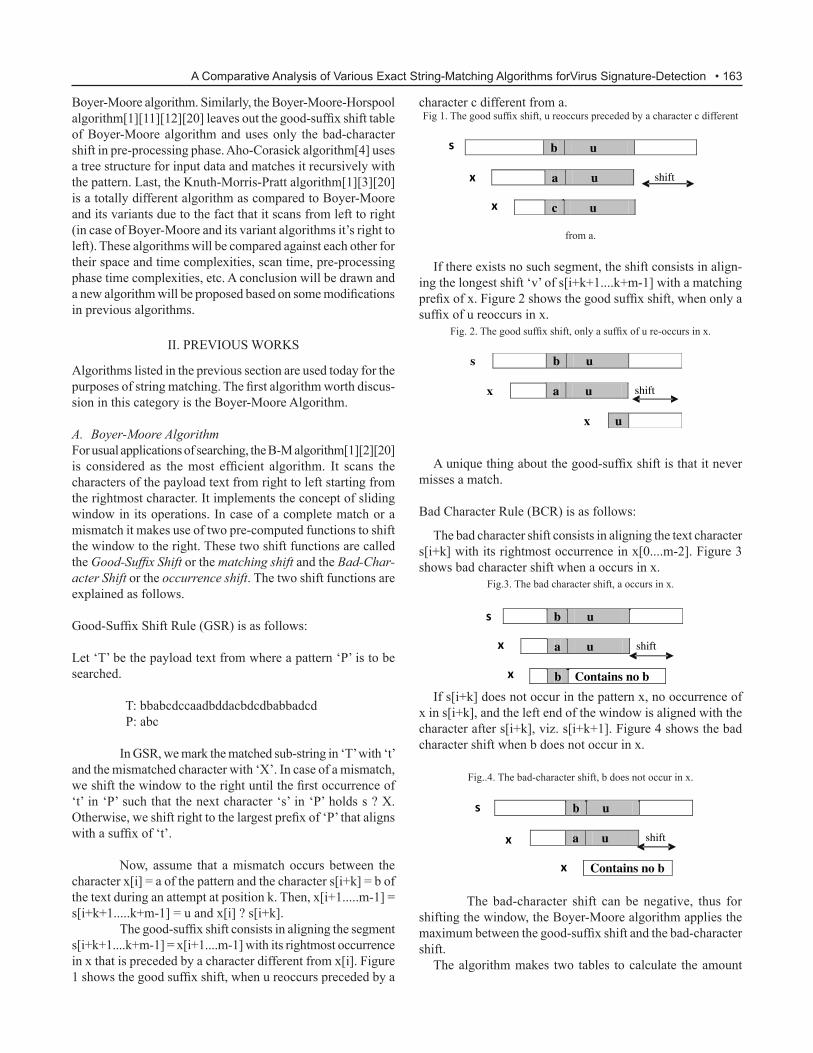
• 163
Boyer-Moore algorithm. Similarly, the Boyer-Moore-Horspool algorithm[1][11][12][20] leaves out the good-suffix shift table of Boyer-Moore algorithm and uses only the bad-character shift in pre-processing phase. Aho-Corasick algorithm[4] uses a tree structure for input data and matches it recursively with the pattern. Last, the Knuth-Morris-Pratt algorithm[1][3][20] is a totally different algorithm as compared to Boyer-Moore and its variants due to the fact that it scans from left to right (in case of Boyer-Moore and its variant algorithms it’s right to left). These algorithms will be compared against each other for their space and time complexities, scan time, pre-processing phase time complexities, etc. A conclusion will be drawn and a new algorithm will be proposed based on some modifications in previous algorithms.
II. PreVIouS WorKS
Algorithms listed in the previous section are used today for the purposes of string matching. The first algorithm worth discus-sion in this category is the Boyer-Moore Algorithm.
A. Boyer-Moore AlgorithmFor usual applications of searching, the B-M algorithm[1][2][20] is considered as the most efficient algorithm. It scans the characters of the payload text from right to left starting from the rightmost character. It implements the concept of sliding window in its operations. In case of a complete match or a mismatch it makes use of two pre-computed functions to shift the window to the right. These two shift functions are called the Good-Suffix Shift or the matching shift and the Bad-Char-acter Shift or the occurrence shift. The two shift functions are explained as follows.
Good-Suffix Shift Rule (GSR) is as follows:
Let ‘T’ be the payload text from where a pattern ‘P’ is to be searched.
T: bbabcdccaadbddacbdcdbabbadcd P: abc
In GSR, we mark the matched sub-string in ‘T’ with ‘t’ and the mismatched character with ‘X’. In case of a mismatch, we shift the window to the right until the first occurrence of ‘t’ in ‘P’ such that the next character ‘s’ in ‘P’ holds s ? X. Otherwise, we shift right to the largest prefix of ‘P’ that aligns with a suffix of ‘t’.
Now, assume that a mismatch occurs between the character x[i] = a of the pattern and the character s[i+k] = b of the text during an attempt at position k. Then, x[i+1.....m-1] = s[i+k+1.....k+m-1] = u and x[i] ? s[i+k]. The good-suffix shift consists in aligning the segment s[i+k+1....k+m-1] = x[i+1....m-1] with its rightmost occurrence in x that is preceded by a character different from x[i]. Figure 1 shows the good suffix shift, when u reoccurs preceded by a
character c different from a.Fig 1. The good suffix shift, u reoccurs preceded by a character c different
from a.
If there exists no such segment, the shift consists in align-ing the longest shift ‘v’ of s[i+k+1....k+m-1] with a matching prefix of x. Figure 2 shows the good suffix shift, when only a suffix of u reoccurs in x.
Fig. 2. The good suffix shift, only a suffix of u re-occurs in x.
A unique thing about the good-suffix shift is that it never misses a match.
Bad Character Rule (BCR) is as follows:
The bad character shift consists in aligning the text character s[i+k] with its rightmost occurrence in x[0....m-2]. Figure 3 shows bad character shift when a occurs in x.
Fig.3. The bad character shift, a occurs in x.
If s[i+k] does not occur in the pattern x, no occurrence of x in s[i+k], and the left end of the window is aligned with the character after s[i+k], viz. s[i+k+1]. Figure 4 shows the bad character shift when b does not occur in x.
Fig..4. The bad-character shift, b does not occur in x.
The bad-character shift can be negative, thus for shifting the window, the Boyer-Moore algorithm applies the maximum between the good-suffix shift and the bad-character shift.
The algorithm makes two tables to calculate the amount
A Comparative Analysis of Various Exact String-Matching Algorithms forVirus Signature-Detection

164 • Part D—ICT
of shifts. The first table is made as follows. The algorithm starts at the last character of the payload text and then moves towards the leftmost character (right to left scanning). each time the window moves left, if the character is not in the table already, add it; its shift value is its distance from the rightmost character. All other characters receive the count equal to the search string. The amount of shift calculated by this table is called the “bad character shift”.
The second table is calculated as follows. For each value of i < strlen(T), we must calculate the pattern consisting the last i characters of the search string, preceded by a mismatch for the character before it; then we initially line it up with the search pattern and determine the least number of characters the partial pattern must be shifted left before the two patterns i.e the payload text and the search string match. The amount of shift calculated by this table is called the “good suffix shift”.
The values in these two tables are used to calculate the maximum between the bad character shift and the good suffix shift in order to shift the window in the bad character pre-processing phase.
The B-M algorithm completes its pre-processing phase in o(m+n) time and space complexity where m is the length of the payload text and n is the length of the pattern; and the search phase in o(mn) time complexity. The algorithm com-pares ‘3n’ text characters in the worst case when searching for a non-periodic pattern. The best-case complexity (no match found) of the algorithm is O(n/m).
A. Turbo Boyer-Moore Algorithm
It is a variant of the Boyer-Moore algorithm. As against the B-M algorithm, it does not require any extra pre-processing but needs only a constant extra space. It remembers the factor of the text that matched a suffix of the pattern last scanned. It is possible for the algorithm to jump over this factor and also this factor can enable the so called “turbo-shift”. A turbo-shift[1] occurs if during the current attempt the suffix of the pattern that matches the text is shorter than the one remembered from the preceding attempt. In this case let us call ‘r’ the remembered factor and ‘s’ the suffix matched during the current attempt such that rzs is a suffix of x. Let ‘a’ and ‘b’ be the characters that cause the mismatch during the current attempt in the pattern and the payload respectively. Then, ‘as’ is a suffix of x, and thus of r since |s| < |r|. The distance between the characters ‘a’ and ‘b’ is ‘p’ in the payload text and the suffix of x of length |rzs| has a period of length p = |zs| since r is a border of rzs it cannot overlap both occurrences of two distinct characters a and b, at distance p, in the payload text. The smallest shift possible has length |r| - |s|, which is called the turbo-shift. The turbo-shift when |s|<|r| can be shown diagrammatically as shown in figure 5.
Fig. 5. Turbo-shift when |s|<|r|.
The salient features of this algorithm are as follows. As in B-M algorithm, it scans the text starting from the rightmost character and ending at the leftmost character. The pre-process-ing phase completes in o(m+n) time and space complexity while the searching phase ends in o(n) time complexity. In the worst case, it performs 2n text character comparisons and the best-case performance of this algorithm is O(n/m), both m and n has the same meaning as in B-M algorithm.
A. Boyer-Moore-Horspool AlgorithmThis algorithm is also an amelioration of the Boyer-Moore algorithm. In fact, it is a simplification of the Boyer-Moore algorithm as it uses only the bad-character shift and not the good-suffix shift thus making it easier to implement. This algorithm was proposed by r. Nigel Horspool. He proposed using only the bad-character shift of the rightmost character of the window to compute the shifts in the Boyer-Moore algo-rithm. The algorithm[1][11][12][20] performs best with long strings as in the case of B-M algorithm. The best case for the algorithm is same as in the B-M algorithm while the worst-case happens when the bad-character skip is consistently low and a large portion of the pattern matches the payload text. Some salient features of the algorithm are as follows. The pre-processing phase completes in o(m+n) time and o(n) space complexity. The best-case complexity of the algorithm is o(n). The searching phase has a time complexity of o(mn). The average number of comparisons for one text character is between 1/n and 2/(n+1).
B. Knuth-Morris-Pratt AlgorithmSince the Knuth-Morris-Pratt (KMP) algorithm[1][3][20] is related with both B-M and B-M-Horspool algorithm, we’ll be discussing this before Aho-Corasick.
The KmP algorithm compares text starting from left and moving towards right. The pre-processing phase has a space and time complexity of o(m) while the searching phase has a time complexity of o(m+n) which is independent of the char-acter size. It performs 2n-1 text character comparisons during the searching phase. An explanation of the shift operations performed by the KmP algorithm can be given as follows.
Let us consider an attempt at some position k when the window is placed on the text factor y[k..k+m-1]. We assume that the first mismatch is found between the characters x[i] and y[i+k] with 0,i,m. Then, x[0...i-1] = y[k...i+k-1] = u and a = x[i] ? y[i+k] = b. When shifting, we assume that some prefix v of the pattern matches with some suffix u of the payload text. In order to avoid a consecutive mismatch, the condition v ? a should satisfy.
We call the longest such prefix v the tagged border of u. Now, let KMPNxt[i] be the length of the longest border of

• 165
x[0...i-1] followed by a character c different from x[i] i.e. c ? x[i] and also c = -1 if no such border exists, for 0 < i = m. Then after a shift, the comparisons can resume between characters x[KMPnxt[i]] and y[i+k] without missing any occurrence of x in y. The shift can be represented as shown in figure 6.
Fig 6. v is a border of u and c ≠ a.
E. Aho-Corasick AlgorithmUnlike the algorithms discussed above, Boyer-Moore and its variants, the Aho-Corasick algorithm[4] can search for mul-
the best algorithm for long patterns and long payload text is Knuth-morris-Pratt algorithm.
Based on comparisons, a new algorithm can be made by implementing the good-suffix shift of BM algorithm and scan-ning the payload text from left to right. The Good-Suffix shift will never miss a match while scanning the text from left to right will enable it to scan very large payload texts. Such an algorithm will have best-case and worst-case complexities equal to that of Boyer-Moore but the average-case complex-ity of such an algorithm will be linear as in the case of KmP algorithm. A simple pseudo-code for such an algorithm could be given as follows.
place pattern at left; while pattern not fully matched and text not exhausted dobegin while pattern character differs from current text characterdo shift pattern appropriately; advance to next character of text;end;
A string-matching algorithm based on above param-eters will have a linear average-case complexity and thus it will be more suitable for use in scenarios where the pattern size as well as the payload size is large.
reFereNCeS
[1] Christian Charras, Thierry Lecroq Handbook of Exact String-Matching Algorithms June 2004.
[2] Robert S. Boyer, J. Strother Moore A Fast String Searching Algorithm In Communications of the ACM Volume 20 / Number 10 / October, 1977
[3] Knuth D.E., Morris (Jr) J.H., and Pratt V.R., Fast pat-tern matching in strings, SIAM Journal on Computing 6(1):323-350, 1977.
[4] Aho A.V. and Corasick M.J. Efficient String Matching: An Aid To Bibliographic Search Comm. ACM, 18:333-340, 1975
[5] String Matching Algorithm by Cyclone, NSlab, RIIT, Powerpoint Presentation
[6] Fred Cohen Computer Viruses: Theory and Experiments In Computer and Security (6), 1987
[7] F. Cohen. On the Implications of Computer Viruses and Methods of Defense. Computers and Security, vol. 7, 1988.
[8] S. Singh, C. Estan, G. Varghese, and S. Savage. Automated Worm Fingerprinting. In Proceedings of USENIX/ACM Symposium on operating Systems Design and Implemen-tation (OSDI), 2004.
[9] David M. Chess, Steve R. White An Undetectable Com-puter Virus IBM Thomas J. Watson Research Center
tiple patterns in a payload text. The Aho-Corasick algorithm pre-processes the patterns and builds a finite state automaton which can match multiple patterns simultaneously. The FSA is made by keywords and the searching is done by traversing that FSA and searching for a pattern. The AC algorithm offers a searching time complexity of o(n) which is independent from the pattern size and a pre-processing phase space and time complexity of o(m+z), where z is the number of key-words found.
III. ANALySISFrom the above discussion we come to know the complexi-ties of various string-matching algorithms. Based on those complexities we can infer that for a long pattern and payload text the Boyer-Moore string matching algorithm and its variants (Turbo Boyer-Moore, BMH) are the most efficient algorithms.
For a multi-pattern search the best algorithm is the Aho-Corasick string matching algorithm. For a search of short single-pattern in a short length of payload text, the best algo-rithm that can be used is the Knuth-morris-Pratt string match-ing algorithm. A brief comparison based on these measures is shown in table 1.
IV. CoNCLuSIoN
Based on the above discussions, we conclude that the best algorithm for usual searching purposes is Boyer-Moore while Algorithm best-case Average-case Worst-case Multi- complexity complexity complexity PatternBoyer- O(n/m) Sublinear O(mn) Nomoore Turbo O(n/m) Sublinear O(n) No Boyer-moore Boyer- O(n) Sublinear O(mn) No moore-Horspool Knuth- O(n/m) O(n) O(n+m) Nomorris-Pratt Aho- o(n) o(n) o(m+z) yes
Table 1. Analysis of Algorithms
A Comparative Analysis of Various Exact String-Matching Algorithms forVirus Signature-Detection

166 • Part D—ICT
Hawthorne, New york, uSA[10] Jeffrey O. Kephart, William C. Arnold Automatic Extrac-
tion of computer virus signatures In 4th Virus Bulletin International Conference, 1994, pp. 178-184
[11] Timo Raita, Tuning the Boyer-Moore-Horspool String Searching Algorithm; Software—Practice And Experi-ence, Vol 22(10). 879–884 (October 1992)
[12] Horspool R N. Practical fast searching in strings. Software practice and Experience, 1980, 10(6): 501-506
[13] LECROQ T., 1992, A variation on the Boyer-Moore algo-rithm, Theoretical Computer Science 92(1):119—144.
[14] SUNDAY D.M., 1990, A very fast substring search algo-rithm, Communications of the ACM. 33(8):132-142
[15] Loek Cleophas and Bruce W. Watson, A Boyer-Moore-Horspool algorithm derivation. South African Computer Journal, 41:13-20, South African Institute of Computer Scientists and Information Technologists, December 2008.
[16] B. W. Watson and G. Zwaan. A taxonomy of sublinear multiple keyword pattern matching algorithms. Science of Computer Programming, 27(2):85–118, 1996.
[17] A Semantics-Based Approach to Malware Detection,Mila Dalla Preda;ACM Transactions on Programming Lan-guages and Systems, Vol. 30, No. 5, Article 25, Pub. date: August 2008.
[18] Cohen, F. 1989. Computational aspects of computer vi-ruses. Comput. Secur. 8, 4, 325.
[19] Dalla Preda, M., Christodorescu, M., Jha, S., And De-bray, S. 2007. A semantics-based approach to malware detection. In Proceedings of the 32nd ACm Symp. on Principles of Programming Languages (POPL’07). ACM Press, 377–388.
[20] Jianming Yu and Yibo Xue, Robust Quick String Matching Algorithm for Network Security, International Journal of Computer Science & Network Security, pp180~184, Vol.6 No.7B, July 2006.

AbstrAct
In situations where an orthodox networking system tends to fail, an infrastructure less network which is also capable of self-organizing itself is a possible solution. These character-istics are conceived by mobile ad-hoc networks, which can also adapt itself to situations in terms of traffic, connectivity etc. One of the prime factors affecting the work-efficiency of these networks is the node-energy. In mANet, each node communicates directly with other nodes within a specified transmission range and they do it via a high-energy node called, the leader. each leader caters to a certain number of non-head nodes thus forming a stable cluster, itself being called the ClusterHead. The formation of clusters can greatly be influenced by natural self-organizing phenomenon like insect-societies. Here, in this paper, we propose an algorithm for selection of the leader node and formation of the clusters thereafter. While selection of leader node is according to the deciding parameters like energy, speed etc, cluster formation phase takes inspiration from binary particle swarm optimization theory.
Keywords: MANet, BPSO, Fitness value, Load Balance.
1.INTroDuCTIoN
Nowadays, network are becoming so much more complex that it is desirable that they can self-organize and self configure, adapting to new situations in terms of traffic, services, network connectivity etc. This kind of situation may arise in case of emergencies where the present day wireless networks fail to deliver, as they solely rely on the wired backbone by which the base stations are connected, implying that network are fixed and constrained to a geographical area with a predefined boundary. Deployment of such networks takes time and is usually almost impossible to set up in time of utmost emergency. Therefore, mobile multi-hop radio networks, also called ad-hoc network plays a critical role in places where a wired (central) backbone is either not available or not economical to built, such as law enforce-ment operations, battle field communication or disaster recovery procedure. Such situations demand a network where all the nodes including the base stations are potentially mobile, and communication must be supported between any two nodes. This characteristic can be conceived as applications of mobile Ad-Hoc Networks. A mANet is an autonomous collection of mobile users that communicate over relatively b a n d -width constrained wireless links. Since the nodes are mobile,
A BPSO based algorithm for leader selection and clus-tering in mANets
Nairanjana Chowdhury, rajesh misra, Kashi Nath Dey
the network topology may change rapidly and unpredictably over time. The set of applications for mANets is diverse, ranging from small, static networks that are constrained by power sources, to large-scale, mobile, highly dynamic net-works. Nodes can join or leave at any time. Factors such as variable wireless link quality, propagation path loss, fading, multi user interference, power expended, and topological changes, become relevant issues. Another paradigm, other than being infrastructure less that this network configuration is required to support, is autonomic computing, or to be able to dynamically adapt itself to the changing network configuration. Nature’s self-organizing systems like insect societies show precisely these desirable properties. making use of a number of relatively simple biological agents a va-riety of different organized behaviors is generated at the system-level from the local interactions among the agents and with the environment. The robustness and effectiveness of such collective behaviors with respect to variations of environment conditions are key-aspects of their biological success.
In this paper, we propose a particle swarm optimization influenced algorithm that works on providing efficient cluster-ing of nodes while countering all the existing challenges of mANet. rest of this paper is arranged in following order. Next section describes Leader selection in mANet.
rest of this paper is arranged in following order. Next section describes Leader selection in mANet. Ashort discus-sion on BPSO is presented in section 3. the algorithms and theirs explanation is provided in section 4 while section 5 highlights the future scopes.
2. LeADer SeLeCTIoN IN mANet
As mentioned earlier in an infrastructure less environment Factors such as variable wireless link quality, propagation path loss, fading, multi user interference, power expended, and topological changes, become relevant issues. The network should be able to adaptively alter the formation to alleviate any of these effects. Some networks are designed to maintain a low probabilityof intercept and/or a low probability of detection. Hence, nodes prefer to radiate as little power as necessary and transmit as infrequently as possible, thus decreasing the probability of detection or interception..
In mANet, each node communicates directly with other nodes within a specified transmission range. The nodes com-municate via other nodes if they are not within a speci-

168 • Part D—ICT
fied transmission range. Ad-hoc networks have several salient characteristics suchas distributed operation, dynamic topolo-gies, bandwidth constrained, variable capacity links, energy constrained operation, multi hop communication etc.
In these kind of a scenario, certain nodes, commonly known as ClusterHeads, are responsible for the formation of Clusters, each of which consist of a number of nodes and maintenance of the topology of the network. Due to the dynamic nature of the nodes, their association and dissociation to and from the clusters may perturb the balance, and thus the stability of the clusters. And so, change in the selected cluster head is unavoidable, which can in turn adversely affect t h e work-efficiency in terms of scheduling, routing and resource allocation of the wholenetwork.Choosing the ClusterHead is thus, we can see, is an NP- hard problem. Hence, existing solutions to this problem are based on heuristic (mostly greedy) approaches and more attempts to retain the stability of the network topology. It’s evident, that a good organizational scheme should preserve its structure as much as possible throughout the changing topology.
Therefore, there is a need to form a leader so that the network could be maintained, such as maintaining the clock synchronization within the network or choosing a new co-ordinator when the group membership changes inthe group communication protocols. If the network merges, there should be only one leader.
We broadly define this problem as that of selecting some subset of the peers in a large scale peer to peer network to take a special role, with the designated leader nodes providing service to the non-leaders.. Leader Selection Criteria: The leaders should be distributed throughout the network in a topologically sensitive way to meet one or more of the following, e.g. access, dispersal, proportion, load balance. It can be noted that all these criteria are inter-linked as one can have an impact on the other.
3. BPSO AND WHY BPSO?
In recent past, Kennedy and eberhart suggested a particle swarm optimization (PSo), which is based on a metaphor of social interaction, searches a space by adjusting the trajectories of individual vectors,called “particles” as they are conceptualized as moving points in multidimensional space.
each particle represents a candidate solution to the prob-lem.Assume that our search space is d-dimensional, and the ith particle of the swarm can be representedby a d-dimension-alposition vectorXi=(xi1,xi2,….xid) . The velocity of the particle is denoted by Vi= (vi1,vi2,….vid). Also consider best visited position for the particle is Pi, best= (pi1,pi2,.......pid) and also the best position explored so far is Pg,best= (pg1,pg2,….pgd).So the position of the particle and its velocity is being updated using fol-lowing equationsVi (t+1) = w. Vi(t)+c1Ø1 (Pi, best –xi)+c2Ø2(P
g,best – x
i)-—- (1).
Xi (t+1) = xi (t)+vi(t+1)—-—-(2). Where c1 and c2 is positive constant, and Xi(t+1) = xi (t) + vi(t+1) are two random variables with uniform distribution between 0 and 1. In this equation, W is the inertia weight which shows the effect of previous velocity vector on the new vector. An upper bound is placed on the velocity in all dimensions Vmax.
The main advantages of the PSo algorithmare summ-arized as: simple concept, easy implementation, robustness to control parameters, and computational efficiency. Kennedy and eberhart proposed a discrete binaryversion of PSo for bi-nary problems. In their model a particle will decide on “yes” or “ no”, “true” or “false”, “include” or “not to include” etc. also this binary values can be a represe-ntation of a real value in binary search space. In the binary PSO, the particle’s personal best and global best is updated as in real- valued version. The major difference between binary PSo with real-valued version is that velocities of the particles are rather defined in terms of probabilities that a bit will change to one. using this definition a velocity must be restricted within the range [0, 1]. So a map is introduced to map all real valued numbers ofvelocity to the range [0,1] The normalization function used here is a sigmoid function as:V
ij’ =sig ( V
ij(t))=1/(1+e-v
ij(t))—--—---—--(3).
Also the equation (1) is used to update the velocity vector of the particle. And the new position of the particle is obtained using the equation below:
1 if rij < sig ( Vij(t+1))Xij(t+1) =
0 otherwise. --—-—----- (4)
Where rij is a uniform random number in the range [0, 1].The futuristic movement makes the clusters build naturally and make them stable.
4. BPSO BASED ALGORITHMS
Before we describe the algorithm itself, firstlet us present the basic assumptions followed while designing the algorithm.1. Velocty Vmax : It is the maximum velocity which is glob-
ally defined.2. Battery power bpmin : It is assumed to be the minimum
battery power,3. Cardinality xb: Thisindicates maximum number of nodes
that any single cluster should cater to.4. Transmission range tr : Indicates the distance to which
each node can transmit data to.
The algorithm can logically be split into four parts1. Cluster head qualification2. Cluster head selection3. Cluster formation using BPSO

• 169
4. Cluster merging using BPSOCluster head qualification: According to this algorithm, this is performed on the basis their battery power and/or velocity. Battery power (bp) will be high enough.1. Degree (d) will be high.2. Velocity (v) should be within the threshold limit.3. Battery drainage should be as low as possible.If all these are considered with respect to theperformance function, F, thenF α bp, F αd, F α 1/v and F αbn.
Considering all these, function F can be defined as fol-lows.F= bp + (k.d/v) + bn .............................………………… (1)
[k= Integer Constant]bn = (bp/d)………………….(2)
While F values are computed for all the nodes, a copy of all these values along with the node co-ordinates will be captured by a dummy node.Cluster head selection: After F value is computed for all the flocking nodes in the incumbent MANet after an arbi-trary time size, as period t, and the nodes will be arranged in the descending order of their F values. The node with the maximum F value will be selected as the current cluster head. Immediate neighbors of the head will be eliminated from the consideration.
This newly generated information shall then be passed to the dummy in form of the advertisement message what’ll contain the head information as well as the neighbor infor-mation. The dummy shall then broadcast this advertisement throughout the rest of the network as and when required. This procedure will continue until all the nodes of the mANet are part of some cluster.The output of this procedure is a set of node called head set or dominant set.Cluster formation using BPSO: We consider that each clus-ter head node as an individual swarm. The objective of this procedure is each individual node will include them-selves into different swarm based on the binary particle swarm theory. This procedure is performed time to time to maintain updated cluster information.Cluster merging procedure using BPSO: It is a periodic pro-cess. Whenever two or more clusters are near and moving towards the same direction, they will be merged to logi-cally form a single cluster.
5. CONCLUSION AND FUTURE SCOPE
The algorithm proposed in the previous section though works nicely, some provisions for enhancement still exists. Balanced load distribution among the clusters being one
of the criteria which may demand an attention, which can heavily be jeopardized because of frequent attachment and detachments of the nodes.To quantitatively measure how well balanced the cluster heads are, we introduce a pa-rameter called load balancingfactor (LBF). As the load of a cluster head can be represented by the cardinality of its cluster size, as
Where nc is the number of cluster heads, xi is the cardinality of cluster i, and µ = (N - nc)/nc, (N being the total number of nodes in the system) is the average number of neighbors of a cluster head. Clearly, a higher value of LBF signifiesa betterload distribution and it tends to infinity for a perfectly balanced system. So, a trade-off has to be designed between the number of clusters and the load. In another dimension, while calculating the F value, inclusion of direction parameter may be another approach that will not involve any delay while forming the cluster.
regarding the performance level of the whole network is to consider the nodes which wander in after all the clusters are full. One way to nullify this conflict is to freeze inclusion into any cluster once it is 2/3rd filled up. This way, if any new node comes in, it can accommodate itself in oneof those left spaces in different clusters.
reFereNCeS:
1. swarm intelligence: by James Kennedy, Mor-gan Kauffman, yuhui shi, prudence school of Engineering and Technology. Published by MK publisher.,2001
2. WcA: A Weighted clustering Algorithm for Mobile Ad Hoc Network: mainak Chatterjee, Sajal K.Das and Damla Trugut.
3. Particle swarm Optimization edited by Aleksandar Lazinica. Published by In- Tech, In-Tech, Kirchengasse 43/3, A-1070 Vienna, Austria, 2009.
4. Novel binary Particle swarm Optimization: m A Khanesar, H Tavakoli, md Teshnehlab and m A Shoorehdeli, K N. Toosi University of Technology, Iran. 2007
nc
LBF = ∑i
(xi - µ) 2
A BPSO based algorithm for leader selection and clustering in MANets

Grid Computing : Issues and ChallengesV.K. SAXENA
System Engineer, Institute of Computer Science, Vikram University, Ujjain (M.P.) Indiae-mail : [email protected]
ABSTRACT
It is a great challenge for the scientific community to provide information online with low prices in this era of competition. In today’s world computer users are globally located.
The grid is essentially a heterogeneous collection of com-putational and storage resources, thereby leading to many related challenges. These challenges require dealing with diversity in the terms of local resources, dynamic nature of the local resources, creation and management of services and maintaining the Quality of Service (QoS). Since grid is inherently a parallel and distributed system, the key issues regarding design of the grid, data locality and availability, implementation, scalability, anatomy, privacy, maintenance, fault tolerance, security, etc come into picture and need to be addressed. These issues demand new technical approaches for the grid environment.
Keywords: Computational Grid, Virtual organization (Vo), Scheduling, Fault Tolerance Security, economics.
1. INTroDuCTIoN
Grids are finding applications in various fields in the form of Data grids, Computational grids, Science grids, Bio grids etc. To define what is a grid and who do not qualify as a grid, it can be established that a grid is a system that (a) has coordinated resource sharing that are not subjected to
centralized control (b) uses standard, open, general purpose protocols and inter-
faces and (c) delivers non-trivial qualities of service.
Going by this definition cluster computing, web services etc do not fall into the category of grids. This is because clusters are owned by a single organization whereas web only provides a standard infrastructure for data exchange between two dis-tributed applications and does not account for the aggregation of resources unlike the grid. As well web is a client - server computing system that is not intended to solve large scale problems in a distributed manner. [1] One more question of paramount importance is what are the problems best suited to be solved over the grid? For the purpose, nature of the appli-cation, its domain and its suitability over the grid needs to be explored i.e., whether the application demands high throughput or distributed supercomputing or data intensive or collabora-tive engineering etc. Since a grid is a distributed system, the programming models and tools also need rethinking so as to develop suitable algorithms and software architecture for mapping over the complex grid architecture. [2] As the grid involves heterogeneous resources, a method regarding the
resource management should also be in place with efficient security measures taken to safeguard the applications due to the interaction not only between two entities but many entities, involved in collective operations. [3]
2. ISSueS IN ComPuTATIoNAL GrID SCHeDuLING
This section covers and analyzes the available computational grid models, their features and what more is expected of them.
2.1 Computational grid modelsSince scheduling on a grid is a NP hard problem, a number of models addressing one or the other issues related to scheduling have been proposed in literature. There are many approaches that concentrate only on the scheduling aspects while the oth-ers may focus on aspects like reliability, security and/or fault tolerance. Thus there are a number of models each addressing one issue or the other. [4]
In the centralized super scheduler architecture, a job super scheduler is designed to schedule the jobs for the individual nodes. In that model a few issues remain unaddressed. Since the super scheduler does not have the control over the resources of the distributed computing centers it depends on the indi-vidual local batch-queuing systems to initiate and manage job execution. But this structure proves to be a bottleneck due to centralized queuing and dispatch. What should be the super scheduling algorithm is not specified. How the interaction between super scheduler and local scheduler will take place is an important issue but has not been addressed. even a policy of job selection and migration and the destination choice for the transferred jobs is not there.
Further it must be noted that the grid scheduling algorithms schedules the job over the grid resources but what is the scenario for the local scheduling at the node level remains unaddressed. Whether the scheduler has any control over the scheduling policies of the local nodes are equally important and should also be considered. One factor that influences the local scheduling policies is the priority assigned to the job since then the preemptive or non preemptive nature of the scheduling policies locally will effect the turnaround time of the job.
Some of the current grid schedulers Nimrod-G, GraDS, Condor-G, Legion etc assume one entry point into the grid as the new job which has entered will make itself known to the resource selector which will schedule it on a processor. This single entry point serves as a bottleneck. They have a limita-tion in the fact that even the information gathering system is centralized here. Due to this, scalability of the system also gets

• 171
restricted. The description of resources is also coarse grained in many available schedulers and they mostly check for the availability of the system or the workstation and does not provide any information about the attributes of the workstation like the number of processors and their speed, oS type, slot available for each process, available memory for execution etc. While distributing the job over the nodes they even do not consider the nature of the job, which is a critical attribute for any job to be executed on a heterogeneous environment like the grid. Further, they all assume to have control over the scheduling policy of the individual nodes, which is in fact not always possible. [5]
2.2 role of the end systemEnd system plays a major part in the grid system as today’s end systems are relatively small and they are connected to networks by interfaces and with operating system mechanisms that are originally designed for reading and writing slow disks. Thus these end systems needs to be developed supporting high performance networking grid architecture.
2.3 Job pre processing requirements once the grid comes into existence there may be a number of virtual organizations (Vo) forming the grid. Whenever a query enters the grid it enters through the corresponding vir-tual organization only. Therefore resource management also needs to be addressed as it is difficult to have common grid architecture since they are created to cater to different needs but at least a basic set of services need to be identified for ex. Querying, Submitting and Monitoring. Any process to succeed on a grid might proceed by • Obtaining the necessary authentication credentials (con-
nectivity layer protocols)• Querying information (collective services)• Submitting requests (resource protocols)• Monitoring resources and computations (resource proto-
cols)
2.4 Allocation requirementsSince the grid is a distributed environment certain points need to be noted regarding the allocation aspects. Some of these could beServices, Scalability, Topology, Nature of the job, Effect of existing load, Number of modules allocate, Load balancing, Parallelism, Interactive task handling, Job migration policy, Channel load,Checkpoints location Redundant resource selec-tion, Restricted access
2.5 Real time systems
For real time jobs the condition becomes much more complex since now the job has to be seen from the point of view that whether it is possible to schedule it or not. Thus for these type of jobs, the requirements are that the jobs should have predict-able end time. For the case of composite jobs, a complex set of sub jobs must be orchestrated in such a way as to respect any
dependence between sub jobs. The real time processing also demands co scheduling i.e. scheduling of multiple resources for the same precise time. Proper brokering to select best resource is equally important. What are the Service Level Agreement (SLA) requirements needs to be taken care of and renegoti-ated as compute and other resources may fail unpredictably or the sub jobs may fail due to user error or high priority jobs may be submitted. Thus SLA should also be constantly added, altered or withdrawn and hence scheduling would need to be continual dynamic and uncertain process. Finally, strategies should be decided for the jobs that do not meet the deadline i.e., whether they should be deferred or accepted with whatever best the grid could offer to it.
3. RELIABILITY AND FAULT TOLERANCE IN COM-PuTATIoNAL GrID
Apart from all the issues relating to maintaining the QoS and secured communication we always wish to have a system in place that is reliable and able to digest system failures. Sig-nificantly incorrect performance of the computers may lead to several devastating effects. A fault tolerant system is one, which continues to perform even in the presence of hardware and software faults. A fault is a physical defect, imperfection, or flaw that occurs within some hardware or software component whereas an error is the manifestation of a fault and is any devia-tion from accuracy or incorrectness. Specifically, faults are the cause of errors and errors are the cause of failures. [6]
Whenever a task enters the grid for execution the failure chances may spread from the application failure at the point of submission to the resource failure to the node failure. Faults can be the result of many things viz. specification mistake (incor-rect algorithms, architectures etc.) hardware failures (hot crash, network partition etc.), software failure (numerical exception, failed application etc.), implementation mistakes (inefficient algorithm), component defects, external disturbances (radia-tion, electromagnetic waves, interference etc.), performance failures ( application not completing within a specified time etc.) or some other failures (machine rebooted by the owner, excessive CPu load, decreased priority by the local resource for the current task etc.) [7] At the level of grids depending on the type of grid it may be prone to either or all of the faults.
Proactive approach, Proactive approach using agents, Reactive approach, Redundancy, Recovery from failure, Grid reliability modeling
4. DYNAMIC NATURE OF THE GRID AND SECURITY
Since the Virtual organizations comprises of a group of indi-viduals and associated resources and services but not located within a single administrative domain for security reasons, a variety of issues relating to certification, group membership, and authorization also need to be addressed. These may range from security of the application to the safety of the data in-volved with it. As well, since the constituents of grid itself are changing, the grid should be able enough to live up by adapting
Grid Computing : Issues and Challenges
172 • Part D—ICT
to the security requirements of this dynamic environment.• Dynamic nature of the VO• Security specification• Protection of applications and resources: • Compliance with the existing security standards:
The Globus Toolkit for example uses a common credential format based on X.509 identity certificates, which in conjunc-tion with an associated private key forms a unique credential set that a grid entity may use to authenticate itself to the other grid entities. [8] The Transport Layer Security (TLS) based protocol is used to perform authentication and then provide message protection. The Kerberos Certificate Authority (KCA) and PKINIT provide translation from Kerberos to GSI and vice versa for the purpose of credential conversions. [9]
5. GRID ECONOMICS
Since grid enables its users to share resources within and between organizations it offers attractive value proposition in terms of efficiency and flexibility. But this sharing comes with a price thus bringing all the financial issues related with the grid business into the picture. From the business point of view the grid manager would try to extract the maximum value out of the available resources. Some of the core issues related to grid economics could be
• Avoid the tragedy of the commons• Discover& communicate dynamic value• Use real money• Guarantee property rights• Use futures market• Establish trust:
6. CONCLUSION
Since the field of grid computing is quite young, much work is still to be done to establish that the same protocols applies equally well to all types of grids as the requirements for the grid are also dependent on the nature of the services it is designed to provide. We have tried to throw light on various issues and challenges keeping in mind the heterogeneity and dynamic nature of the grid. The requirements were modularized to give a proper insight into the requirements.
The issues rose started from the expectations from the end system in a grid environment, which are quite different from that of the other situations. Since the end system plays a major role, these requirements were addressed first. Other issues start bothering ever since the job submission is taken into account, ranging from the credential obtaining to resource discovery to submission of the job to monitoring the progress of the task over the grid. These issues were also considered. Since the job needs to be allocated, allocation issues were taken care of for the ordinary and time specific jobs. Taking into account the complex nature of the grid every discussion is incomplete if the system reliability is not concerned. So the fault tolerance and reliability issues were addressed. Light was thrown on the factors deciding the fault tolerance of the grid by discussing various possible faults and appropriate recovery
methods. Various problems that may arise in allocation due to dynamic nature of the grid were considered. Since the grid is heterogeneous and dynamic in nature its security requirements are also different. These security threats and the attitude of the grid towards these requirements were discussed. Since the grid involves sharing of resources by various participants financial issues gains importance. Key issues related to grid economics were raised and discussed. Thus we can say that the next big challenge for the grid is going to be dominated by business related issues along with the technical aspects.For a computational grid to be fully functional, these issues are to be taken care of by the research community. These are open issues and provide a good piece of work for the develop-ers and researchers.
reFereNCeS
[1] Anderson, A.H., An Introduction to Web Services Policy Language. Proceedings of Fifth Ieee International Work-shop on Policies for Distributed Systems and Networks, 2004, pp. 189-192.
[2] Casanova H.: Distributed Computing Research Issues in Grid Computing, ACm SIGACT News, Volume 33, Issue 3 (September 2002), pp. 50-70.
[3] Foster, What is the Grid? A Three Point Checklist. Grid Today, Vol. 1, No. 6, 22 July 2002.
[4] Foster, Ian., Kesselman, C. Computational Grids, The Grid: Blueprint for a Future Computing Infrastructure. Morgan Kauffman, 1998, pp. 1-29.
[5] Huda Mohammad Tanvir, Schmidt W. Heinz, Peake Ian D.: An Agent oriented Proactive Fault-tolerant Frame-work for Grid Computing, Proceedings of the First In-ternational Conference on e-Science and Grid Computing (e-Science’05), IEEE, 2005.
[6] Johnson Barry, Reliability and Fault Tolerance Issues in Intelligent Computing Systems. 5th IEEE International Symposium on Intelligent Control, Vol. 1, 1990, pp. 267-272.
[7] Shan, Oliker, Biswas, Job Superscaler Architecture and Performance in Computational Grid environments, ACM/IEEE Conference on Supercomputing, 2003, 15-21 Nov. 2003, pp. 44 – 44.
[8] Welch Von, Siebenlist Frank, Foster Ian, Bresnahan John, Czajkowski Karl, Gawor Jarek, Kesselman Carl, Meder Sam, Pearlman Laura, Tuecke Steven, Security for Grid Services. Proceedings of the 12th Ieee International Symposium on High Performance Distributed Computing (HPDC’03), 2003, 1082-8907/03.
[9] Wiriyaprasit, Sirappa., Muangsin, Veera, The Impact of Local Priorities Policies on Grid Scheduling Performance and an Adaptive Policy-based Grid Scheduling Algorithm. Proceedings of the Seventh International Conference on High Performance Computing and Grid in Asia Pacific Region (HPCAsia ’04), pp. 343-346.

Seven Layer risk And Security : A Survey For Secure Network
Dr. Samar upadhyay(HOD, MCA, JEC, Jabalpur)
ms. Varsha Singh(Asst. prof., MCA, RSSGI, Jabalpur)
mr. Saurabh Singh(Asst. Prof., CS, JEC, Jabalpur
AbstrAct:
This paper is about the weak (risk) points of network where attackers can attack over the data packets, and security con-cepts and mechanisms to prevent them. Network security is generally taken as providing protection at the boundaries of an organization by keeping out intruders. Security is an assessment of risk. In computer networking, security is the mitigation of undesirable information flow. This includes both reactive and preventative measures. Risk management refers to the process for mitigating security issues. Network security includes three critical elements: prevention, detec-tion and response. The combination of these element deter-mines the overall effectiveness of a system’s security.
challenges have to face:• Security vulnerabilities are rampant:• Attackers launch complex multi-step cyber attacks:• Current attacks detection methods cannot deal with the complexity of attacks:
IsO OsI reference Model:In 1983, the International Standard Organization (ISO) released specification for the Open System Interconnection (OSI) net-work model (Fig. 1.01). The OSI model defines a seven-layer stack, with each layer providing a specific network function.
PHySICAL LAyer SeCurITy:
common risk:
Attacks:The main threats [1] to physical networks consists of disrup-tion, interference, sniffing , replay and insertion attacks.
DIsrUPtION:Any break to the physical network connectivity prevents the network from functioning. Common disruption within a network segment include power outages and disconnected net-work cabling. mitigation option usually include backup power supplies and restricted access to core networking devices.
INtErFErENcE:If an unauthorized signal (interference) enters the network medium then network devices may be unable to distinguish data from noise. Data-encoding techniques can also mitigate the impact from interference.
INtENtIONAL AttAcKs:Threats from sniffing, replay, and insertion attacks are usu-ally intentional. Fortunately they can all be mitigated through network configuration. Common options include firewalls and network configuration that employ a DMZ, onion, or garlic orientation (Fig. 1.04).
DAtA LINK LAYEr sEcUrItY:

174 • Part D—ICT
common risk:A physical layer attacker has direct access to the data link
message frames. A physical layer attackers can eavesdrop on all data link
traffic. A physical layer attackers can record and replay data link
traffic. A physical layer attackers can use an insertion attack
to generate a load attack with valid data link message frames.
Mitigation Option:There are few options for combating the risks from the data link layer.
Hard-coding:Attackers can hijack, intercept, and redirect hardware ad-dresses. To mitigate this issue, address tables can be statically populated.
Data Link Authentication:Few data link layer protocol implement cryptography. The two main cryptographic solutions are CHAP and PAP.
Higher-Layer Authentication:The most popular solution for protecting the data link layer depends on higher layer protocols.
Analyzers and tools:Network application, such as IDs and IPS, rely on the capability to monitor the network in promiscuous mode..
NeTWorK LAyer SeCurITy:
common risk:
routing risks:Network router [15] are the only option for communicating with distant network. router based attacks appear in many forms: direct attacks, table poisoning, table flooding, metric attacks and router looping attacks.
Mitigation Options:The network layer offers many services for ensuring success-ful inter-network data transfers, There are few cryptographic solutions. Network incompatibility can prevent some secure solutions from being viable options[15]. Secure Protocol Network Incompatibility IP Filtering Server Filtering Firewalls and egress Filtering Network Address Translation (NAT) reverse NAT (rNAT) disable ICmP
TrANSPorT LAyer SeCurITy:
common risk:The main risks for all transport protocols centre around se-quence numbers and ports. To hijack the transport [14] con-nection, the attackers must compromise the packet sequencing. Transport layer ports directly lead to network services.
transport Layer Hijacking:A transport layer hijacking requires two elements:1) The attackers must perform some type of network layer
compromise. The attackers may intercept the network traffic by using a node in promiscuous mode, simple ad-dress impersonation, or a mITm attack.
2) The attackers must identify the transport sequencing.
Port scans:To attacks a service, the service’s port must be identified. Port Scan work by attempting to connect to each port on a host.
Information Leakage:
Mitigation Options:Mitigation options revolve around alternating system profiles and detecting attacks.
Alter system Profile:block Attacks Vectors:Identify Network Devices:stateful Packet Inspection (sPI):Intrusion Detection system (IDs):Intrusion Prevention system (IPs):Higher-layer Protocols:
SeSSIoN LAyer SeCurITy:
common risk:The most common risk that face session layer protocol include authentication and authorization, hijacking, mitm attacks, and information leakage.
Authentication and Authorization:Session layer protocols maintain state through a session iden-tifier. Ideally, the identifier should be provided after authen-ticating the [9] user. Unfortunately, few protocols use strong authentication methods: DNs, NFs, sMb.
session Hijacking:An attackers may acquire the session identifier and hijack the session..
blind session Attacks:If the session uses a connection-less transport service, then it is vulnerable to a blind session attacks
Man-In-the-Middle (MitM):The attackers must intercept the network request prior authen-ticating with server. The mitm then independently .Information Leakage and Privacy:session layer do not specify authentication or privacy sup-port.

• 175
Mitigation Options:The main approaches for securing DNS rely on server-spe-cific configurations, defined trust, and alternate resolution methods.
Direct threat Mitigation:Basic maintenance and network segmentation can limit the impact from direct threats: Patch, separate Internal and External Domains, restricted Zone transfer:, Authenti-cated Zone transfer
technical threat Mitigation:
Harden server: restricting the number of remotely acces-sible processes limits the Number of potential attacks vec-tors.
Firewall: Placing a hardware firewall in the front of DNS server limits the number of remote attacks vectors.
Defining Trusted Replies:
common risk:many SSL-based solutions do not fully implement secured environments, however most common risk come from follow-ing four areas: certificate distribution, authentication, failure handling, and risks from lower layer protocols.
Mitigation Options:
HttPs:Secure Web pages usually use HTTPS- HTTPS over SSL.
MitM:A MitM attacks against SSH is very difficult.
Encryption:encryption is the most important technique for data security. Plain text changer into cipher text and cipher text sends to on the network, when it receive at receiver side the data re-change into original form, this process is called decryption.Along with sharing similar communication methods, most application layer protocols share similar risks and attacks vec-tors. The most common types of application layer risks are due to inherited risks from lower-layer protocols, authentication issues and direct system access.
Inherited Vulnerabilities:With few exceptions, the most common protocols do not offer security options. As a result, risk from lower oSI layers impact higher-layer protocols. The plaintext attacks vector is common for most application layer protocols.
Authenticated Issues:
PrEsENtAtION LAYEr sEcUrItY:
compression: Data compression transforms data from a low entropy states, where information may be redundant or unnecessary, to a high entropy state, where every bit has a
unique purpose.
Encryption: Data encryption [12] is one of the most promising uses of the presentation layer by apply cryptography (Fig.-1.05) at the presentation layer information transformation can be authenticated and encoded for privacy without modification to lower layer protocols. SSL (Secure Socket Layer) and SSH (Secure Shell) are presentation layer protocols that provides cryptography functionality.
Direct System Access:
APPLICATIoN LAyer SeCurITy:
The OSI application layer provides application-specific net-work support and interfaces with the user-level software. The application layer is the most flexible of the OSI layers and allows a variety of application-specific protocols.Network Diagnostics: SNmP, rSTAT, rWHoFile Access and Data Transfer: NFS, SMB, FTP, TETP, HTTP, LPDSystem Configuration: NTP, DHCP, BOOTPRemote Command Execution: RLOGIN, REXEC, RSH, TeLNeT, SSH
common risk
sMtP risks: Forged Header & Spam: occur when false sender and
undesirable emails (Spam) is an example of abuse due to forged emails.
relaying and interception risks. The most significant risk to SMTP comes from a depen-
dency on DNS ( DNS is extremely vulnerable to many forms of attacks).
SmTP can also be impacted by lower network layer protocols.
HttP risk:This leads to risks based on unauthenticated HTTP systems. In addition, HTTP server configuration and CGI application can expose the system to remote exploitation.
CoNCLuSIoN:
A strong firewall and proxy are used to keep unwanted people out. user must use a strong antivirus software package and Internet Security Software package. For authentication, use strong passwords and change it on a weekly/bi-weekly basis. When using a wireless connection, use a robust password.
Seven Layer Risk And Security : A Survey For Secure Network

176 • Part D—ICT
exercise physical security precautions to employees. Prepare a network analyzer or network monitor and use it when needed. Implement physical security management like closed circuit television for entry areas and restricted zones. Apply Security fencing to mark the company’s parameter. Fire extinguishers for fire-sensitive areas like server rooms and security rooms. Security guards can help to maximize security. enable mAC Address filtering to keep track of all home network MAC de-vices connecting to your router. Assign STATIC IP addresses to network devices. Disable ICmP ping on router. review router or firewall logs to help identify abnormal network connections or traffic to the Internet. Use passwords for all accounts.
reFereNCeS:
1. V. Garg, m. S. meitie, S. raman, A. Kumar, r K Ghosh and N. Tewari, Dense cluster gateway based routing protocol for multi-hop mobile, Ad hoc Networks, volume 4, no. 2, 2006, pp.168-185
2. KV Arya, r K Ghosh, Designing a new class of fault tolerant multistage interconnection network, Journal of Inter connection Networks, volume 6, no. 4, 2005, pp.361-382.
3. A Bertossi, M.C Pinotti, R.Rizzi and Phalguni Gupta, “Allocating Servers in Infestations for Bounded Simul-taneous Requests” Journal of Parallel & Distributed Computing, Vol. 64, 1113-1126, 2004.
4. Dheeraj Sanghi and Pankaj Jalote, “A testbed for perfor-mance evaluation of load balancing strategies for web server systems”, Software Practice and experience, pp 34:339-353, 2004.
5. Amitabha Bagchi, Adit Madan and Achal Premi, ”Brief Announcement: Hierarchical neighbor graphs: An en-ergy-efficient bounded degree connected structure for wireless networks”, 6th International Workshop on Al-gorithms for Sensor Systems, Wireless Ad Hoc Networks and Autonomous mobile entities (ALGoSeNSorS 2010). pp. 31-33, July, 2010.
6. Rohan Choudhary, Sameep Mehta, Amitabha Bagchi and Rahul Balakrishnan, Towards characterization of actor evolution and interactions in news corpora, Advances in Information Retrieval , 30th European Conference on IR Research, ECIR 2008. pp. 422-429, March, 2008.
7. Jeffrey Erman, Anirban Mahanti, Martin Arlitt , Ira Co-hen, Carey Williamson, “Offline/realtime traffic classi-fication using semi-supervised learning”, Perform. Eval. (Elsevier) Vol. 9-12, pp. 1194—1213, October, 2007.
8. Jeffrey Erman, Anirban Mahanti, Martin Arlitt, and Carey Williamson, “Identifying and discriminating between web and peer-to-peer traffic in the network core”, WWW ’07: Proceedings of the 16th international conference on World Wide Web. pp. 883—892, May, 2007.
9. Amitabha Bagchi, Ankur Bhargava, Amitabh Chaudhary, Christian Scheideler and David Eppstein, “The effect of
faults on network expansion”, Theor. Comput. Syst., Vol. 39, No. 6, pp. 903-928, November, 2006.
10. Ajay Agarwal, B. N. Jain, “Routing reliability analysis of segmented backup paths in mobile ad hoc networks”, Proc. of International Conf. on Personal Wireless Comm. (ICPWC 2005), Delhi, pp. 52-56, January, 2005.
10.1. M. Abbas, B. N. Jain, “Analysis of disjoint multipath routing for mobile ad hoc networks”, Proc. of Inter-national Conf. on Personal Wireless Comm. (ICPWC 2005), Delhi, pp. 42-46, January, 2005.
11. R. M . Amadio and Sanjiva Prasad, “The Game of the Name in Cryptographic Tables”, INrIA report. Tr: rr 3733, July, 1999.
12. A New Non Linear Model Based Encryption Mechanism with Time Stamp and Acknowledgement Support , Ad-depalli V
13. A New Type of ID-based encryption System and Its Application to Pay-TV Systems, Xingwen Zhao and Fangguo Zhang, Vol. 13, No. 3, 2011, pp. 161-166.
14. Bhattacharjee, Raktim and S, Sanand and S. V., Raghavan (2010) Path Attestation Scheme to Avert DDoS Flood At-tacks. In: IFIP International Conference on Networking (IFIP Networking 2010).
15. International journal of Network Security & Its Applica-tions (IJNSA), ISSN: 0974 – 9330 Academy & Industry Research Collaboration Center (AIRCC), April 2009.
16. Authentication vs. Privacy within Vehicular Ad Hoc Networks, Mohamed Salah Bouassida, Vol. 13, No. 3, 2011, pp. 121-134.
17. A New Type of ID-based Encryption System and Its Application to Pay-TV Systems, Xingwen Zhao and Fangguo Zhang, Vol. 13, No. 3, 2011, pp. 161-166.
18. Improving Identity-based Random Key Establishment Scheme for Large-Scale Hierarchical Wireless Sensor Networks , Ashok Kumar Das, Vol. 13, No. 3, 2011, pp. 181-201.
19. Kumar, Arun K and Sivalingam, Krishna Moorthy, (2010) “Energy-Efficient Mobile Data Collection in Wireless Sensor Networks with Delay reduction using Wireless Communication”, In: CommunicationSystems and Networks (COMSNETS), 2010 Second International Conference, 5-9 Jan. 2010, Bangalore.
20. Patra, Arpita and Choudhury, Ashish and Chandrasek-aran, Pandu Rangan (2010) On Communication Com-plexity of Secure message Transmission in Directed Networks. In: Distributed Computing and Networking, 11th International Conference, ICDCN 2010, January 3-6, Kolkata,India.

Video Transferring Services using Key Nodesover mobile Ad Hoc Networks
Akanksha Gupta (m.e. Scholar)Department of Computer Science Engineering
Shri Shankaracharya College of Engineering & Technology, Junwani, Bhilai (Chhattisgarh), Indiae-mail : [email protected]
Sonu AgrawalDepartment of Computer Science Engineering
Shri Shankaracharya College of Engineering & Technology, Junwani, Bhilai (Chhattisgarh), India e-mail : [email protected]
Ankur Shukla (m.e. Scholar)Department of Computer Science Engineering
RKDF Institute of Science & Technology, Misrod, Bhopal (Madhaypradesh), India e-mail : [email protected]
AbstrAct
Mobile Ad-hoc NEtworks (MANEt) are infrastructure-less networks where self-configuring mobile nodes are connected by wireless links. because of its decentralized operation, these nodes rely on each other to store and for-ward packets. Video transmission over MANEts is more challenging than over conventional wireless networks due to rapid topology changes and lack of central administra-tion. Enabling video transmission over ad-hoc networks is more challenging than over conventional mobile networks because a connection path in an ad-hoc network is highly error-prone and the path can go down frequently. thus, real-time multimedia transport has stringent bandwidth, delay, and loss requirements. Using multiple paths in par-allel for a real-time multimedia session (called multipath transport) provides a new degree of freedom in designing robust multimedia transport systems. the main idea of this work is based on transferring video through two disjoint paths using AOMDV. In each of these paths we use video proxy nodes as video caches. the duty of these nodes is to receiving and recognizing video streams, buffering of favorite streams and if possible managing errors locally.
Keywords- MANET, Ad hoc Network, Disjoint Paths, Mis-behaving nodes Multimedia Transferring, Multipath video Transferring, Video Proxy, Key Nodes.
I. INTroDuCTIoN
An ad-hoc network is a collection of mobile nodes that will create the network “on demand”. The main differences between ad-hoc networks and conventional cellular technology are the lack of a centralized entity within ad-hoc networks and the independence from pre-existing infrastructure. Consequently, adhoc networks are an appealing option in applications where the desired infrastructure does not exist whether due to sparse
population, economic condition, or after a disaster such as an earthquake.
With the recent advances in wireless technologies, wireless networks are becoming a significant part of today’s access net-works. Ad hoc networks are wireless mobile networks without an infrastructure, within which mobile nodes cooperate with each other to find routes and relay packets. Such networks can be deployed instantly in situations where infrastructure is unavailable or difficult to install, and are maturing as a means to provide ubiquitous undeterred communication. There is a demonstrable need for providing video service for users of ad hoc networks, such as first responders, search and rescue teams, and military units. Such content-rich service is more substantial than simple data communications: it will add value to and catalyze the widespread deployment of ad hoc networks. In video communications for the successful reconstruction of received video, the path used for the video session should be stable for most of the video session period.
Furthermore, packet losses due to transmission errors and overdue delivery caused by congestion should be kept low, such that they can be handled by error control and error con-cealment techniques. However, this situation does not hold true in ad hoc networks, where wireless links are frequently broken and new ones reestablished due to mobility.
Furthermore, a wireless link has a high transmission error rate because of shadowing, fading, path loss, and interference from other transmitting users. Consequently, for efficient video transport, traditional error control techniques, including forward error correction [3] [4] and automatic repeat request [5], should be adapted to take into consideration frequent link failures and high transmission errors.
They are different mechanisms offered for improving video quality in Ad hoc networks. Among various mechanisms, mul-tipath transport, by which multiple paths are used to transfer data for an end-to-end session, is highly suitable for ad hoc networks, where a mesh topology implies the existence of

178 • Part D—ICT
multiple paths for any pair of source and destination nodes. It has been shown that, when combined with appropriate source and/or channel coding and error control schemes, multipath transport can significantly improve the media quality over traditional shortest path routing-based schemes. This also inspired previous and ongoing standardization efforts for multipath transport protocols in the Internet engineering Task Force (IETF) [6][7].
In this article we offer An Efficient Multipath Video Trans-ferring using Proxy Nodes over Ad Hoc Networks as well as Related works, challenges and finally presenting different scenarios for video, communications. We then conclude this article.Figure 1. The general architecture for the multipath transport of real-time
multimedia application
In [8] reference picture selection (RPS) technique has been presented. However, a more network-aware coding method is used, which selects the reference picture based on feedback and estimated path status. In this method the decoder will send a negative acknowledgment (NACK) for a frame if it is dam-aged or lost, and a positive one (ACK) otherwise The encoder can then estimate the status of the paths and infer which of the previous frames are damaged. Based on the estimation, for a picture to be coded, the closest picture for which itself as well as its reference pictures have been transmitted on the better path is selected as the reference picture. The rPS scheme offers a good trade-off between coding efficiency and error resilience. The rPS scheme is only applicable for online coding, because it adapts the encoding operation based on channel feedback. In layered coding technique, a video frame is coded into a base layer and one or more enhancement layers. reception of the base layer can provide low but acceptable quality, while reception of the enhancement layer(s) can further improve the quality over the base layer alone, but the enhancement layers cannot be decoded without the base layer. When the layered video is transmitted over multiple paths (e.g., two paths), the traffic allocator sends the base layer packets on one path and the enhancement layer packets on the other one. The path with a lower packet loss rate is used for the base layer if the two paths have different qualities. The receiver returns selective ARQ requests to the sender to report base layer packet losses. When the sender receives such a request, it retransmits the requested base layer packet on the enhancement layer path. The transmission bit rate for the enhancement layer will be reduced correspondingly according to the bandwidth reallo-cated for base layer retransmissions. This schema denoted as LC with ARQ [8-10]. If there is a base layer packet loss, the base layer path is likely to be experiencing a packet loss burst. Therefore, base layer retransmission using the same path is likely to be unsuccessful. moreover, if the loss was caused by congestion at an intermediate node, using the base layer path for retransmission may intensify the congestion condition. When disjoint paths are used, the loss processes of the paths may not be totally correlated. Therefore, base layer packet retransmission using the enhancement layer path could have higher success probability and lower delay.
The third technique is to use multiple descriptions coding (mDC). mDC is a technique that generates multiple equally important descriptions. The decoder reconstructs the video from any subset of received descriptions, yielding a quality commensurate with the number of received descriptions. In [8] a multiple description (mD) coder known as multiple descrip-tion motion compensation (mDmC) is employed. Compared to layered coding, mDmC does not require the network or channel coder to provide different levels of protection. Nor does it require any receiver feedback. Acceptable quality can be achieved even when both descriptions are subject to relatively frequent packet losses, as long as the losses on the two paths do not occur simultaneously and sufficient amount of redundancy is added by appropriately choosing the predic-
II. muLTIPATH muLTImeDIA TrANSPorT ArCHI-TeCTure oVerVIeW
The general architecture for multipath transport of video streams is depicted in Fig. 1a. At the sender, raw video is first compressed by a video encoder into m streams. Whenm > 1, we call the coder a multistream coder. Then
the streams are partitioned and assigned to K paths by a traffic allocator. These paths are maintained by a multipath routing protocol. When the flows arrive at the receiver, they are first put into a resequencing buffer to restore the original order. Finally, the video data is extracted from the resequenc-ing buffer to be decoded and displayed. The video decoder is expected to perform appropriate error concealment if any part of a substream is lost.
In general, the quality of the paths may change over time. We assume that the system receives feedback about network QOS parameters. Although not necessary, such feedback can be used to adapt the coder and transport mechanisms to net-work conditions (e.g., the encoder could perform rate control based on feedback information, in order to avoid congestion in the network). The number of available paths, as well as their bandwidths, may vary over time due to network topol-ogy changes and congestion. The point-to-point architecture in Figure 1, can be used for two-way conversational services as well as one-way streaming services. For the latter case, it can be extended to more general cases.
III. reLATeD WorKS

• 179
tor coefficient and mismatch signal quantizer [11][13]. There are different other work that evaluate video transferring over multipath Ad hoc networks. many of these works are based on merging previous works and new ideas. Some of them like [14] are trying to improve route selection algorithms. Some others works like [15] are looking for supporting video on demand services over wireless mesh networks. In [16] an algorithm for calculating the loss compensation is presented. The other work in this field is enveloping a model which captures the impact of quantization and packet loss on the overall video quality [17].
IV. ProPoSeD SCHemA
Our proposed schema will improve QOS parameters supposing available parameters in application layer (video encoder/de-coder). This structure uses cross layer techniques for increasing QOS. In fact this structure will not warranty quality of service but presenting a new structure that is consistent to available structure, QOS in application layer will be increased.The main assumption of the plan is based on the fact that in a network with a long chain of nodes always some parts of network are in a good communication conditions and other parts are in bad conditions thus using some nodes called video proxy nodes in suitable situations of network due to their duty for realizing video stream status and detecting importance of frames/packets in order to undertaking some encoder/decoder needed operations like sending ARQ will result in lower end to end delay for key video frames.
In our plan safely delivering feedback messages is done using rTP protocol. Since in an Ad Hoc network there are a lot of routes and streams may passes from a node, video proxy node should able to realize favorite stream and recognize it from other streams. Beside these nodes should have capability for realizing stream structure and different parts of them to have favorite work on important frames/packets. Also these nodes must use cross layer technique for achieving various informations in different layers for example video informations that relates to application layer, recognizing stream structure in transport layer and etc.
In our plan first of all two disjoint paths will be found us-ing AOMDV [18] protocol then using some nodes in each of two paths as video proxy nodes transmitting packets between sender and receiver begins. Since here we have two disjoint paths, important frames/packets like I frames will be sent through path1 and other packet/frames like B and P frames will be transferred using path 2. Selecting video proxy nodes can be based on sender and receiver agreement or other factors like network traffic load. The proposed schema is especially suitable for scenarios that there are many hops between sender and receiver that result in longer round-Trip delay. We will call video proxy nodes as key
nodes in this article. The duty of these nodes is detecting video streams and buffering frames that upon packet loss in network and receiving ARQ messages from receiver, instead of sending ARQ to sender, start to send lost frames itself. Also
if possible these nodes can detect lost frames before receiver and start to send ARQ messages to the sender and after this step receive lost frames and forward themes. The key idea of this schema is that there is unequal probability of fault in all parts of network and therefore after having congestion between sender and receiver, these nodes can manage connec-tion locally regarding adjacency to sender. The same process is about having congestion on receiver side of proxy node. For achieving this goal, these nodes should realize video streams at beginning of session. If there are more than one proxy nodes in each of transmission paths only one of them will select as proxy node.
Figure 2. Proposed schema
A. Architecture
The structure of schema is shown at Figure 2. This plan includes two Disjoint paths, basic sender, and receiver as source and destination and selective Video proxy nodes per each of routing paths. We use AomDV routing algorithm for finding disjoint paths. Video packets will be send to receiver through two disjoint paths simultaneously. In our plan the paths composed of intermediate nodes between sender and key nodes are known as sender side network and also the paths between key nodes and receiver are receiver side network. At sender encoded video packets are sent through uDP packets to each of two paths. This network is supposed to black one and can have a lot of nodes that may create high or low latency. After receiving and processing video packets by key nodes, having failure or packet loss in frames/packets, key node will send feedback number 1 to sender. Key nodes will send received packets to receiver side network. In other hand receiver starts to receive and decoding video packets. If it was failure in pack-ets or connection, feedback number 2 will be sent to sender. upon receiving feedback number 2 and having process on it by key node, it will refer to its video frames cache, if possible will answer to feedback by sending needed frames/packets otherwise it will send feedback number 3 to sender. Likewise sender after receiving feedbacks numbers 1 and 3 if possible will use needed mechanism to correct the fault. Here feedback messages are same as ARQ ones. Decoder not only can send
Video Transferring Services Using Key Nodes Over Mobile Ad Hoc Networks

180 • Part D—ICT
ARQ, feedback number 2, but it can try to correct fault and tracking consequences of errors up to receiving needed frames/packets. Schema of nodes connections along with feedbacks and their sides are shown at Figure 3.
In this schema key node is waiting for a packet, after receiv-ing a packet, key node will analyze kind of packet. If packet was not belong to video frames/packet, key node will In this schema key node is waiting for a packet, after receiving a packet, key node will analyze kind of packet. If
packet was not belong to video frames/packet, key node will switch back to waiting mode, otherwise it will scrutiny whether previous frames/packets that this frame/packet depends on them are received correctly or not. If yes, key
node will switch back to waiting mode and otherwise it will wait a period of time for receiving packets then after this step the status of key node will set to waiting mode. If the packet didn’t receive by key node, it will send feedback 1 to sender but if packet is kind of feedback, referring to its frames caches if possible key node will send requested frame/packet and otherwise will send feedback 3.
Figure 3. Video Stream Schema and feedback
V. SImuLATIoN SCeNArIo
VI. CoNCLuSIoNS AND FuTure WorK
unstable nature of ad hoc networks and video features make some challenges in transferring video over ad hoc networks. In this paper we offered an efficient schema for multipath video transferring over ad hoc networks. Increasing capabilities of key nodes in analyzing and reencoding video streams, we can achieve more advantages. Selecting key nodes and manag-ing nodes buffering capacity due to dynamic mapped traffic of network (Traffic Rate Adaptation) and other features like node power consumption can be good works for future. Also it’s possible to expand this plan for future video standards like mPeG-21. using this schema and having some changes in sender, receiver and video proxies and adding more opera-tions to presented schema we can implement some aspects of pointed standard like Digital Item Adaptation.
reFerNCeS
[1] Implementing Messaging Servicing in Ad hoc Com-munity Networks using Pxoxy Nodes,Testsuro uedo, Somprakash Bandhopadhyay, Kazuo Hasuike. ATR Adaptive communication reaseach Laboratory 2-2-2 Hikaridai,Seka-cho 619-0288 Japan.
[2] On the Forwarding Capability of Mobile Handhelds for Video Streaming over mANeTs, Stein Kristiansen, morten Lindeberg. Departmet of Informatics. university of oslo, Norway.
[3] Cai J., Qian Zhang, Wenwu Zhu, Chen C.W., “An FEC-based error control scheme for wireless MPEG-4 video transmission”, Wireless Communications and Net-working Conference, 2000. WCNC. 2000 IEEE, 2000, pp.1243 -1247 vol.3
[4] Z.He, J.Cai, C.W.Chen, “Joint source channel rate distortion analysis for adaptive mode selection and rate Control in wireless video coding”, Ieee Trans. Circuits SystemsVideoTech no 1.12(6) (June2002)
[5] S.Aramvith, I.-M.Pao, M.-T.Sun, “A rate-control scheme for video transport over wireless channels.”, Ieee Trans. Circuits Systems Video Tech no l.11(3) (May2001), 569-580
[6] S. Narayanan, “MRTP: A Multi-Flow Real- Time Trans-port Protocol,” Aug. 2004, IETF Internet draft draft-na-rayanan-mrtp-00.txt, work in progress.
[7] R. Stewart et al., “Stream Control Transmission Proto-col,” Oct. 2000, IETF RFC 2960.
[8] S. Mao, “Video Transport over Ad Hoc Networks: Mul-tistream Coding with Multipath Transport,” IEEE JSAC, vol. 21, no. 10, Dec. 2003, pp. 1721-37.
[9] J. Chakareski, S. Han, and B. Girod, “Layered Coding vs. multiple Descriptions for Video Streaming over multiple Paths,” Proc. ACM Multimedia 2003, Berkeley, CA, Nov. 2003, pp. 422-31.
In this schema we will use H.264[19], for encoding video stream. There will be three scenarios to simulate our work; first one will show the difference between transferring video in a single path against proposed multipath. other two scenarios will illustrate effects of using proposed schema in transferring multipath video without using key nodes.
Simulation will be done using NS-2.32. From memory point of view if we suppose video pattern as QCIF(176*144) and there are 10 frames at buffer, mandatory memory for each video node include sender, receiver and key node will equal to 10× (176×144 + 2×88× 72) = 982790 bytes, that is a reasonable memory for today’s advanced devices. System calculation cost can be teeny because in this plan there is no need to online encoding therefore video encoding can be in any form. receiver calculation cost will not change because there is no change in receiver operation.

• 181
[10] S. Mao, “Multi-path Routing for Multiple Description Video over Wireless Ad Hoc Networks,” Proc. Ieee INFOCOM 2005, Miami, FL, Mar. 2005.
[11] S. Mao, “Multiple Description Video Multicast in Wire-less Ad Hoc Networks,” ACM/Kluwer MONET Journal, to appear.
[12] S. Mao, “Multi-path Routing for Multiple Description Video over Wireless Ad Hoc Networks,” Proc. Ieee INFOCOM 2005, Miami, FL, Mar. 2005.
[13] E. Setton, Y. Liang, and B. Girod, “Adaptive Multiple Description Video Streaming over multiple Channels with Active Probing,” Proc. IEEE ICME, Baltimore, MD, July 2003, pp. I-509-12.
[14] Sudheendra Murthy, Prasad Hegde, Viswesh Parameswaran, Baoxin Li and Arunabha Sen, “Improved Path Selection Algorithms for multipath Video Video Streaming in Wireless Ad-Hoc Networks”, IEEE 2007.
[15] Li Danjue, Qian Zhang, Chen-Nee Chuah, S. J. Ben Yoo, “Multi-source Multi-path Video Streaming Over Wireless Mesh Networks “, IEEE 2006.
[16] Gene Cheung, Wai-tianTan, “LOSS COMPENSATED reFereNCe FrAme oPTImIZATIoN For muLTI-PATH VIDEO STREAMING”, IEEE 2005.
[17] Eric Settori, Xiaoqiiig Zhzi and Bewid Glrod, “MINI-mIZING DISTorTIoN For muLTI-PATH VIDeo STREAMING OVER AD HOC NETWORKS”, 2004 International Conference on Image Processing (ICIP).
[18] M. Marina and S. Das, “On-Demand Multipath Distance Vector Routing in Ad Hoc Networks,” Proc. IEEE Int’l Conf. Network Protocols (ICNP), pp. 14-23, 2001.
[19] T. Stockhammer, M. M. Hannuksela, and T. Wiegand, “H.264/AVC in wireless environments”, IEEE transac-tions on circuits and systems for video technology, vol. 13, no. 7, 2003
Video Transferring Services Using Key Nodes Over Mobile Ad Hoc Networks

Network Security In Large Computer Networkmanish Hadap#1 asha Ambhaikar*2
#Reasearch Scolar,Department of Computer Science and Technology,RCET, Chattisgadh swami Vivekanand Tech-nical University,Bhilai,India
*Department of Computer Science and Technology,RCET, Chattisgadh swami Vivekanand Technical University,Bhilai,India
[email protected] [email protected]
AbstrAct
Implementation of computer network security is a new and fast moving technology in the field of computer science. As such, the teaching of security is still a moving target. security courses originally focused on mathematical and algorithmic aspects such as encryption and hashing tech-niques. However, as crackers hacked away at networks and systems, courses arose that emphasized the latest at-tacks. these attacks soon became out-of-date with security software responses. As security technology continues to mature, there is an emerging set of security techniques and skills. Network security skills emphasize business practices, legal foundations, attack recognition, security architecture, and network optimization. these skills tend to stabilize network security course(s). this paper summarizes skills relating to network security, use of optimized AcL rules to secure inbound and outbound traffic
Keyword - Security, Audit, Service Learning. Access Control List, ACL
INTroDuCTIoN
Computer and network security is a new and fast moving tech-nology and as such, is still being defined. When considering the desired learning outcomes of such a course, one could argue that a network security analyst must be capable of analyzing security from the business perspective in order to adhere to recent security legislation, and from the technical perspective in order to understand and select the most appropriate security solution. The analyst must be able to use security tools – but also apply the results to his or her organization. The analyst must be able to configure routers, firewalls, ACL(Access con-trol list )and an intrusion detection system (IDS) – but in an efficient and effective way. This partial list of skills improves security course stability and effectiveness. This paper investi-gates an outcome-based network security course emphasizing skill-development.
Network security originally focused on algorithmic aspects such as encryption and hashing techniques. While these con-cepts rarely change, these skills alone are insufficient to protect computer networks. As crackers hacked away at networks and systems, courses arose that emphasized the latest attacks. Cur-rently, many educators believe that to train people to secure networks, they must also learn to think like a cracker. However, Logan and Clarkson argue that teaching attack techniques is dangerous because it may lead to criminal behavior, takes
course time away from important security techniques, and may fail debates during the Security course approval process . However, additional reasons (learned from experience) is that 1) countering hacks results in lectures can become facts-based (e.g. identifying microsoft vulnerable ports) instead of skills-based, leading to boring lectures; and 2) hacks become nearly irrelevant as soon as security software is enhanced to counteract the hack. Thus, an emphasis on hacking techniques can result in continual changes in the course material that often becomes out-of-date with the next minor/major OS or other software release.
A FoCuS oN SeCurITy
The Network Security program emphasizes training students to secure a network. The following background information in security helps in making correct decisions. Some areas are concept-oriented, but can benefit from demonstrations and exercises:
Attack recognition: recognize common attacks, such as spoofing, man-in-the-middle, (distributed) denial of service, buffer overflow, etc.
encryption techniques: understand techniques to ensure confidentiality, authenticity, integrity, and non-repudiation of data transfer. These must be understood at a protocol and at least partially at a mathematics or algorithmic level, in order to select and implement the algorithm matching the organization’s needs.
Network Security Architecture: Configure a network with security appliances and software, such as placement of fire-walls, Intrusion Detection Systems, and log management.
To secure a network, certain skills must also be practiced: Protocol analysis: recognize normal from abnormal pro-
tocol sequences, using sniffers. Protocols minimally include: IP, ArP, ICmP, TCP, uDP, HTTP, and encryption protocols: SSH, SSL, IPsec.
Access Control Lists (ACLs): Configure and audit routers and firewalls to filter packets accurately and efficiently, by dropping, passing, or protecting (via VPN) packets based upon their IP and/or port addresses, and state.
Intrusion Detection/Prevention Systems (IDS/IPS): Set and test rules to recognize and report attacks in a timely manner.
Vulnerability Testing: Test all nodes (routers, servers, cli-ents) to determine active applications, via scanning or other vulnerability test tools – and interpret results.
The last three skills incorporate computer systems security, since they are required to counteract internet hacking. Addi-

• 183
tional skills that relate to computer system security are beyond the scope of this paper.
Network security applies business decisions in a technical manner. Business requirements drive security implementa-tions. Business-related skills include:
Security evaluation: use risk analysis to determine what should be protected and at what cost.
Security Planning: Prepare a security plan, including secu-rity policies and procedures.
Audit: Prepare an Audit Plan and report. Legal response: understanding and interpreting the law
regarding responding to computer/network attacks, corporate responsibility (e.g., Sarbanes-oxley), and computer foren-sics.
Security skills require extensive technical knowledge of in-ternal operation, in order to recognize normal versus abnormal sequences. Additional general skill requirements include:
Continuous Learning: research in-depth information by oneself. (A limitation on course time and the evolving nature of computer science, networking, and security limits course expectations.) Writing and Communication.
NeTWorK SeCurITy
Network labs may be expensive to work with since they rely on equipment being available. our lab has one router per four students and this has proven adequate. Figure 1 shows security applications based on CISCo router. many important software tools are free, including sniffers, nmap, and Snort. The active-learning labs require that each group of students have simultaneous access to the relevant set of tools.
Sniffing Tools. Security analysts must be able to recognize attacks and write ACLs and rules for routers, firewalls, IDSs, and proxies – which means analysts must be able to understand and recognize protocol sequences. In the first networking lab, students are introduced to windump (tcpdump on UNIX) and ethereal sniffers (at www.tcpdump.org, http:\\windump.polito.it www.ethereal.com) Sniffers enable a network analyst to view packets being transmitted over the network.
Specific applications can be started in order to observe TCP, uDP, ICmP and ArP in action, using telnet, web pages, ping, ssh, and arp –a, hacking tools, etc. These sniffing tools are used in scanning and other labs to observe audit or hacking tools’ behavior. Since IP fragmentation is a source of attacks through firewalls and routers, the lab includes recognizing IP fragments created using ping.
scanning tools. Any open application on any machine can introduce vulnerabilities in security. Nmap (at www.insecure.org) is a tool that can scan a network and look for open applica-tions . Therefore, it is useful to open one or more applications (like telnet) as part of the lab, so that students learn how to close unnecessary applications, when necessary. It is inter-esting to do this command with both the PC’s firewall on and off to see how the firewall responds. Since any single tool can provide false positives or false negatives, it is recommended to run a couple of tools and compare results. other useful tools
include Superscan (www.foundstone.com) and Nessus/NeWT (www.nessus.org)
While running a scanning tool is relatively simple, inter-preting results is a challenge. open port numbers listed by the tool need to be interpreted as to their necessity and vulner-ability. Students should look up information about each open port or refer to lecture notes. While lab time is often short to complete such an analysis, it is emphasized as part of the audit homework project.
Router Configurations. Writing ACLs is a skill, because it is error prone and can result in faulty filtering . ACLs writ-ten inefficiently reduce router/firewall throughput. A lecture on routers reviews ACL formation, syntax, efficiency, and conflicts. Cisco is the most commonly implemented router, and thus is the focus in the uWP security labs.
In the first year’s router lab, students configured lab routers. In subsequent labs, students use nmap and ethereal to audit the configuration of the routers, by learning which TCP/UDP ports and ICmP messages the router passes or blocks in either direction. Students are given a set of policy objectives. They review the router configuration to determine what changes must be made to achieve the policy objectives and improve ACL efficiency. Alternative planned labs require students to program and test a router configuration that is both complete and efficient. Labs can also be enhanced to implement and test VPN options. Figure 2 shows packet flow and ACL
Fig. 2 ACL and packet flowsnort NIDs. Network Security Analysts must be able to
write rules for a network IDS (NIDS). Working with Snort al-lows students to observe a NIDS architecture, its configuration, and its programming. Snort (www.snort.org) is an example
Fig. 1 Security on router
of a free NIDS that can be loaded onto each lab workstation
Network Security In Large Computer Network

184 • Part D—ICT
. A useful lab is for students to interpret, write, and trip IDS rules. Snort can be run in sniffer or IDS mode. It is possible to create rules by simply adding a rule to a rule file. Alerts can be logged both to \Snort\log and the Windows event log. The format and an example rule put into the (e.g.) \Snort\rules\telnet.rules file is:
<cmd> <protocol> <sourceIP> <sourcePort> -> <destIP> <destPort> (msg:”Alarm message text”; content:”String you want to monitor”; nocase;) alert tcp any any -> any any (msg:”Accessed the password file!”; content:”/etc/shadow”; nocase;)
If any session accesses the UNIX password file, this rule will trip and a log will be generated.
Encryption. Selecting an encryption technique and recog-nizing its advantages and risks can only be accomplished by understanding basic encryption techniques.
encryption can be taught in a fun way that avoids complex mathematics while teaching basic concepts. (In the first year, this exercise was listed as the most interesting from multiple students.) Pfleeger’s text is an excellent and understandable reference to develop exercises from. Three example exercises follow.
A cryptogram is an example Substitution Cipher, where each letter in a short paragraph is replaced with another letter in a consistent way. Students can easily translate these when pro-vided with the encrypted version of “Login” and “Password”. foundation for DeS, AeS, and other secret key ciphers.
Uses a block size of 8 bits and two substitution (S-Box) and one transposition stage. Bits are exclusive ORed to provide the indicated ciphertext. In Chaining mode, the output of one block becomes the key in the top S-box of the Block Cipher for the next block of input.
Countering web hacking requires audit and programming skills to secure web services. Testing for SQL injection, and programming to defend against it is only one of many web and application-based attacks. These skills are emphasized in our Web Security course.
Audit. Preparing an audit plan and audit report is an im-portant skill since it is necessary to comply with legislation such as Sarbanes-oxley. Security auditing is used by over 80% of organizations as reported by the 2006 CSI/FBI Com-puter Crime and Security Survey [5]. Following a lecture on auditing, students follow an audit plan in a lab. They perform tests to validate that logs are created for specific actions and complete an audit report worksheet. The worksheet requires that they look up best-in-class standards, reinforcing concepts from the previous active-learning lab.
A course on information systems security could extend these labs to work with security planning, risk, and computer forensics.
CoNCLuSIoN
The security field is a new, fast-moving career. A focus on security stabilizes course material, reduces worry about student hacking, and helps to provide students the skills necessary to
become security analysts. This paper defines a set of skills required by network security analysts, and describes a set of useful labs that help students become adept at securing a network. The active-learning exercises help to reinforce the lecture material, emphasize the application of security tools, and move students from ‘exposure’ to ‘competency’ in per-forming security tasks required in industry.
ACKNoWLeDGmeNT
This work is partially supported by NSF Grant 0313712, Aug 2003 to the University of Wisconsin consortium. The authors wish to thank NSF and Tim Fossum, a key player in obtaining the grant.
reFereNCeS
[1] P. Mateti, “A Laboratory-Based Course on Internet Security”, Proc. Of 34th SIGCSE Technical Symp. on Computer Science Education, ACM, 2003, 252-256.
[2] Computer Network Defense Course (CNDC), Army reserve readiness Training Center, Fort mcCoy WI, http://arrtc.mccoy.army.mil, Jan. 2004.
[3] P. Y. Logan and A. Clarkson, “Teaching Students to Hack: Curriculum Issues in Information Security”, Proc. Of 36th SIGCSE Technical Symp. on Computer Science Education, ACM, 2005, 157-161.
[4] S. McClure, J. Scambray, and G. Kurtz, Hacking Exposed 5th Ed., McGraw Hill, 2005.
[5] L. A. Gordon, M. P. Loeb, W. Lucyshyn, and R. Rich-ardson, 2006 CSI/FBI Computer Crime and Security Survey, Computer Security Institute, GoCSI.com.
[6] U. A. Pabrai, The Art of Information Security, www.ecfirst.com, 2005.
[7] H. Hamed and E. Al-Shaer, “Taxonomy of Conflicts in Network Security Policies”, IEEE Communications Magazine, 44, 3, (March 2006) pp. 134-141.
[8] Auditing Networks, Perimeters, and Systems Hands-On Workbook, Audit 507 – Auditing Networks, Perimeters & Systems Course, SANS Institute, www.sans.org, 2005.
[9] M. Shema and B. C. Johnson, Anti-Hacker Toolkit, 2nd Ed., McGraw Hill, 2004.
[10] Advanced Systems Audit: Windows NT/2000, Audit 507 – Auditing Networks, Perimeters & Systems Course, SANS Institute, www.sans.org, 2005.
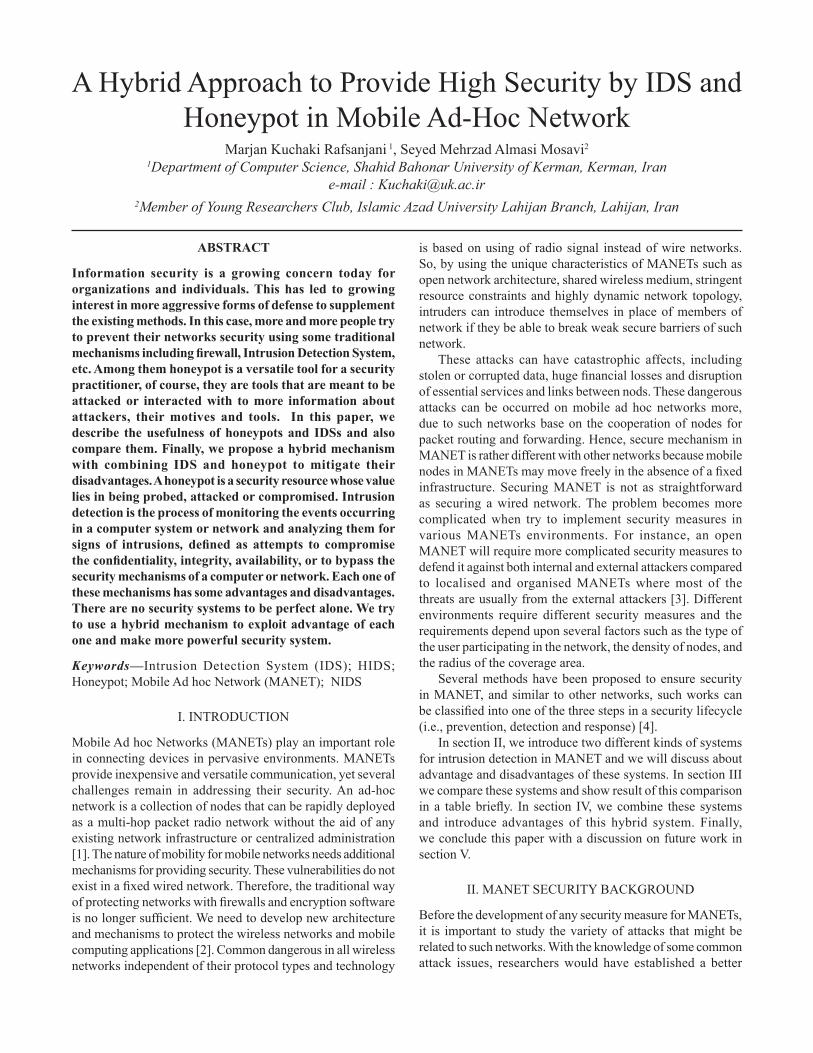
A Hybrid Approach to Provide High Security by IDS and Honeypot in mobile Ad-Hoc Network
marjan Kuchaki rafsanjani 1, Seyed mehrzad Almasi mosavi2
1Department of Computer Science, Shahid Bahonar University of Kerman, Kerman, Irane-mail : [email protected]
2Member of Young Researchers Club, Islamic Azad University Lahijan Branch, Lahijan, Iran
AbstrAct
Information security is a growing concern today for organizations and individuals. this has led to growing interest in more aggressive forms of defense to supplement the existing methods. In this case, more and more people try to prevent their networks security using some traditional mechanisms including firewall, Intrusion Detection System, etc. Among them honeypot is a versatile tool for a security practitioner, of course, they are tools that are meant to be attacked or interacted with to more information about attackers, their motives and tools. In this paper, we describe the usefulness of honeypots and IDss and also compare them. Finally, we propose a hybrid mechanism with combining IDs and honeypot to mitigate their disadvantages. A honeypot is a security resource whose value lies in being probed, attacked or compromised. Intrusion detection is the process of monitoring the events occurring in a computer system or network and analyzing them for signs of intrusions, defined as attempts to compromise the confidentiality, integrity, availability, or to bypass the security mechanisms of a computer or network. Each one of these mechanisms has some advantages and disadvantages. there are no security systems to be perfect alone. We try to use a hybrid mechanism to exploit advantage of each one and make more powerful security system.
Keywords—Intrusion Detection System (IDS); HIDS; Honeypot; Mobile Ad hoc Network (MANET); NIDS
I. INTroDuCTIoN
mobile Ad hoc Networks (mANeTs) play an important role in connecting devices in pervasive environments. mANeTs provide inexpensive and versatile communication, yet several challenges remain in addressing their security. An ad-hoc network is a collection of nodes that can be rapidly deployed as a multi-hop packet radio network without the aid of any existing network infrastructure or centralized administration [1]. The nature of mobility for mobile networks needs additional mechanisms for providing security. These vulnerabilities do not exist in a fixed wired network. Therefore, the traditional way of protecting networks with firewalls and encryption software is no longer sufficient. We need to develop new architecture and mechanisms to protect the wireless networks and mobile computing applications [2]. Common dangerous in all wireless networks independent of their protocol types and technology
is based on using of radio signal instead of wire networks. So, by using the unique characteristics of mANeTs such as open network architecture, shared wireless medium, stringent resource constraints and highly dynamic network topology, intruders can introduce themselves in place of members of network if they be able to break weak secure barriers of such network.
These attacks can have catastrophic affects, including stolen or corrupted data, huge financial losses and disruption of essential services and links between nods. These dangerous attacks can be occurred on mobile ad hoc networks more, due to such networks base on the cooperation of nodes for packet routing and forwarding. Hence, secure mechanism in mANeT is rather different with other networks because mobile nodes in MANETs may move freely in the absence of a fixed infrastructure. Securing mANeT is not as straightforward as securing a wired network. The problem becomes more complicated when try to implement security measures in various mANeTs environments. For instance, an open mANeT will require more complicated security measures to defend it against both internal and external attackers compared to localised and organised mANeTs where most of the threats are usually from the external attackers [3]. Different environments require different security measures and the requirements depend upon several factors such as the type of the user participating in the network, the density of nodes, and the radius of the coverage area.
Several methods have been proposed to ensure security in mANeT, and similar to other networks, such works can be classified into one of the three steps in a security lifecycle (i.e., prevention, detection and response) [4].
In section II, we introduce two different kinds of systems for intrusion detection in mANeT and we will discuss about advantage and disadvantages of these systems. In section III we compare these systems and show result of this comparison in a table briefly. In section IV, we combine these systems and introduce advantages of this hybrid system. Finally, we conclude this paper with a discussion on future work in section V.
II. MANET SECURITY BACKGROUND
Before the development of any security measure for MANETs, it is important to study the variety of attacks that might be related to such networks. With the knowledge of some common attack issues, researchers would have established a better
186 • Part D—ICT
understanding of how mANeT nodes can be threatened by attackers, and thus might lead to the development of more reliable security measures in protecting them. Attacks against mANeT could be launched in many forms and may include all the attacks characteristics described earlier. examples of such attacks (Modification, Interception, Fabrication and Interruption) are given in [3].
Now we will introduce Intrusion Detection Systems and honypots technology and discuss about their advantages and disadvantages when works alone and then combine them to have a more powerful and more efficient system.
A. Intrusion Detection System (IDS) In general, an IDS monitors and records events in a
computer system, performs analysis to determine if the events are security incidents, alerts security practitioners of potential threats, and produces event reports [5]. Intrusion detection systems are a valuable addition to an organization’s security infrastructure. As you plan the security strategy for your organization’s systems, it is important for you to understand what IDSs should be trusted to do and what goals might be better served by other types of security mechanisms.- strengths of Intrusion Detection systems [6], Intrusion
detection systems perform the following functions well:
• monitoring and analysis of system events and user behaviors.
• Testing the security states of system configurations.• Base lining the security state of a system, then tracking
any changes to that baseline.• recognizing patterns of system events that correspond
to known attacks.• recognizing patterns of activity that statistically vary
from normal activity.• managing operating system audit and logging
mechanisms and the data they generate.• Alerting appropriate staff by appropriate means when
attacks are detected.• measuring enforcement of security policies encoded
in the analysis engine.• Providing default information security policies.• Allowing non-security experts to perform important
security monitoring functions.- Limitations of Intrusion Detection systems [6],
Intrusion detection systems cannot perform the following functions:
• Compensating for weak or missing security mechanisms in the protection infrastructure. Such mechanisms include firewalls, identification and authentication, link encryption, access control mechanisms, and virus detection and eradication.
• Instantaneously detecting, reporting, and responding to an attack, when there is a heavy network or processing load.
• Detecting newly published attacks or variants of
existing attacks.• effectively responding to attacks launched by
sophisticated attackers.• Automatically investigating attacks without human
intervention.• resisting attacks that are intended to defeat or
circumvent them.• Compensating for problems with the fidelity of
information sources.• Dealing effectively with switched networks.Depending on their source of input, IDSs can be classified
in to network-based systems and host-based systems. Network-based Intrusion Detection Systems (NIDSs) collect input data by monitoring network traffic (e.g., packets captured by network interfaces in promiscuous mode). Host-based Intrusion Detection Systems (HIDSs), on the other hand, rely on events collected by the hosts they monitor [7].
1) Host based IDS (HIDS): Host based IDSs usually based on systems that need to protect. Host-based technology examines events like what files were accessed and what applications were executed. File integrity is most common way to consider and ensure to system file rectitude.
a) Advantage of HIDSs:• Monitors specific system • Detects attacks that network-based systems miss.• Well-sui ted for encrypted and switched
environments. • Near-real-time detection and response. • requires no additional hardware • Lower cost of entry [7].• They usually have fewer false positive since their
information directly relate to known peoples and applications.
• There is fewer network traffic then network based IDSs.
• Good efficiency against internal invalid access.b) Disadvantage of HIDSs:• Lacking suitable moved capability on different
operating systems.• In huge network with large number host, gather a
lot of separated and specific information for each one of computers is impractical.
• IDS is useless while information gather on one of the computers become inactive by intruder.
2) Network based IDS (NIDS): Such IDSs usually are appropriated systems that monitor entire of network or part of it from outside and somewhen from inside of firewall. Network-based IDS have much strength that cannot easily be offered by host-based intrusion detection alone. many customers, in fact, deploy network-based intrusion detection when using an IDS for the first time due to its low cost of ownership and rapid response times. Below are major reasons the use of NIDS and also there are some disadvantages of NIDSs.
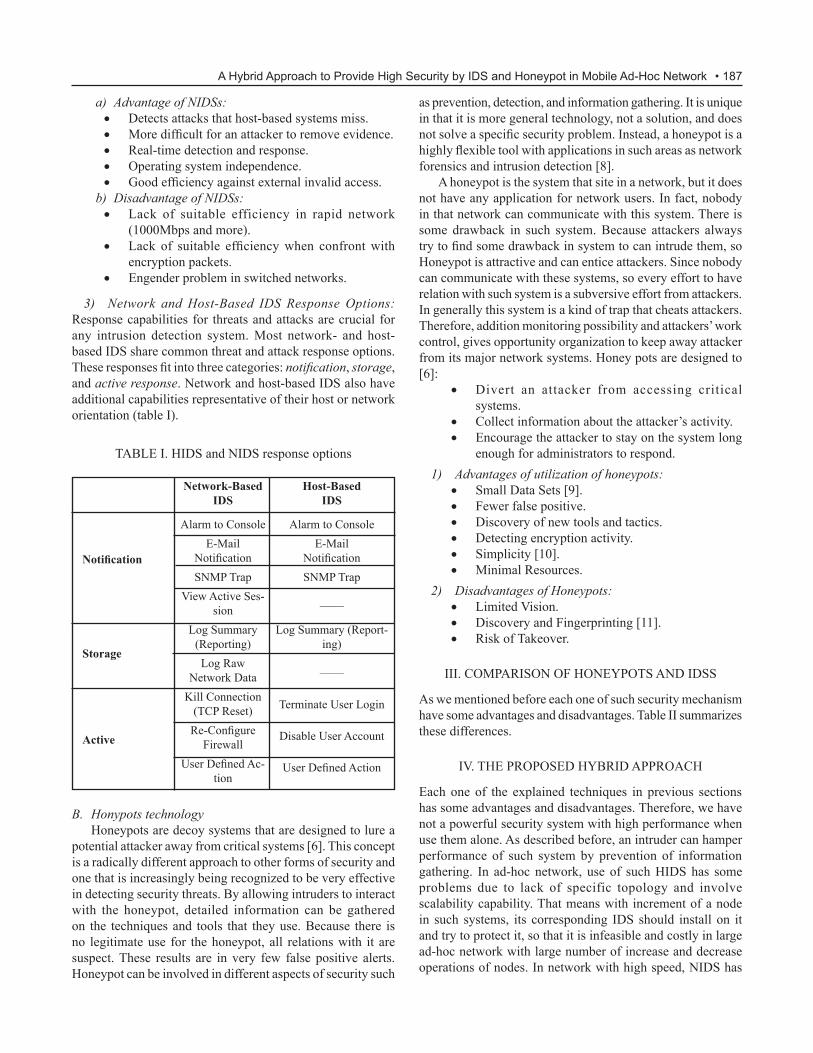
• 187
a) Advantage of NIDSs:• Detects attacks that host-based systems miss.• More difficult for an attacker to remove evidence.• real-time detection and response.• operating system independence.• Good efficiency against external invalid access.
b) Disadvantage of NIDSs:• Lack of suitable efficiency in rapid network
(1000Mbps and more).• Lack of suitable efficiency when confront with
encryption packets.• engender problem in switched networks.
3) Network and Host-Based IDS Response Options: response capabilities for threats and attacks are crucial for any intrusion detection system. most network- and host-based IDS share common threat and attack response options. These responses fit into three categories: notification, storage, and active response. Network and host-based IDS also have additional capabilities representative of their host or network orientation (table I).
as prevention, detection, and information gathering. It is unique in that it is more general technology, not a solution, and does not solve a specific security problem. Instead, a honeypot is a highly flexible tool with applications in such areas as network forensics and intrusion detection [8].
A honeypot is the system that site in a network, but it does not have any application for network users. In fact, nobody in that network can communicate with this system. There is some drawback in such system. Because attackers always try to find some drawback in system to can intrude them, so Honeypot is attractive and can entice attackers. Since nobody can communicate with these systems, so every effort to have relation with such system is a subversive effort from attackers. In generally this system is a kind of trap that cheats attackers. Therefore, addition monitoring possibility and attackers’ work control, gives opportunity organization to keep away attacker from its major network systems. Honey pots are designed to [6]:
• Divert an attacker from accessing critical systems.
• Collect information about the attacker’s activity.• encourage the attacker to stay on the system long
enough for administrators to respond.1) Advantages of utilization of honeypots:
• Small Data Sets [9]. • Fewer false positive. • Discovery of new tools and tactics.• Detecting encryption activity.• Simplicity [10]. • minimal resources.
2) Disadvantages of Honeypots: • Limited Vision.• Discovery and Fingerprinting [11]. • risk of Takeover.
III. ComPArISoN oF HoNeyPoTS AND IDSS
As we mentioned before each one of such security mechanism have some advantages and disadvantages. Table II summarizes these differences.
IV. THE PROPOSED HYBRID APPROACH
each one of the explained techniques in previous sections has some advantages and disadvantages. Therefore, we have not a powerful security system with high performance when use them alone. As described before, an intruder can hamper performance of such system by prevention of information gathering. In ad-hoc network, use of such HIDS has some problems due to lack of specific topology and involve scalability capability. That means with increment of a node in such systems, its corresponding IDS should install on it and try to protect it, so that it is infeasible and costly in large ad-hoc network with large number of increase and decrease operations of nodes. In network with high speed, NIDS has
Network-based IDs
Alarm to Consolee-mail
NotificationSNmP Trap
View Active Ses-sion
Log Summary (reporting)Log raw
Network DataKill Connection
(TCP reset)Re-Configure
FirewallUser Defined Ac-
tion
Host-based IDs
Alarm to Consolee-mail
NotificationSNmP Trap
——
Log Summary (report-ing)
——
Terminate user Login
Disable user Account
User Defined Action
TABLE I. HIDS and NIDS response options
Notification
storage
Active
B. Honypots technology Honeypots are decoy systems that are designed to lure a
potential attacker away from critical systems [6]. This concept is a radically different approach to other forms of security and one that is increasingly being recognized to be very effective in detecting security threats. By allowing intruders to interact with the honeypot, detailed information can be gathered on the techniques and tools that they use. Because there is no legitimate use for the honeypot, all relations with it are suspect. These results are in very few false positive alerts. Honeypot can be involved in different aspects of security such
A Hybrid Approach to Provide High Security by IDS and Honeypot in Mobile Ad-Hoc Network

188 • Part D—ICT
some problems too. That means, if IDS lose some packets and information due to high speed then cannot analyses packets. All of such problems can solve by honeypots, because we do need to install honeypot on none of the nodes and it does not have any problems in rapid networks and encounter with encryption packets. Since finally intruder tries to interact with honeypot, therefore, it is enough to a honeypot wait to an intruder try to access it. As described before, honeypot has also some disadvantages such as their limited view domain. They only can detect those attackers that try to interact with them, that it is a great drawback. This disadvantage can cover by IDSs easily. In this paper, we introduce consideration of combination of host based IDS and Honeypot to protect an enterprise-wide network. We furthermore recommend a staged deployment, starting with honeypots as they are usually the simplest to install and maintain. Next, protect critical servers with host-based IDSs. utilize vulnerability analysis products on a regular schedule to test IDSs and other security mechanisms for proper function and configuration. Once honeypots are in place and operational, the addition of host-based IDSs can offer enhanced levels of protection for your systems. However, installing host-based IDSs on every host in the enterprise can be extremely time-consuming, as each IDS
has to be installed and configured for each specific host. In our proposed approach, before installation IDS on each system, consider which system was interacted with honeypot. If there is any interact with honeypot, then we do not need to install IDS on corresponding host. otherwise, IDS should install on that host if it is a critical host. Here, basis of detection based on honeypots and utilize of IDS is just for drawbacks obviation of honeypots and ensure from its detection accuracy. Cooperation between these mechanisms increases detection speed; reduce network traffic and increase cost effects.
V. CoNCLuSIoN AND FuTure WorK
In this paper, we have provided a brief overview on Honeypots and IDSs, and have discussed about their advantages and disadvantages, and then we compared them. Finally, we have proposed a hybrid mechanism that can exploit both of mechanisms together to provide more powerful and efficient security systems. most of secure systems are not perfect alone, so we can use two security mechanisms together for using advantages of each one of them to cover disadvantages of others. In future work we will simulate our hybrid mechanism and compare with other work and evaluate results.
Deterrence Strong deterrence for insiders Strong deterrence for outsiders Strong deterrence for both insiders and outsiders
Detection Strong insider detection Strong outsider detection Strong outsider and insider Weak outsider detection Weak insider detection detection
response Weak real-time response Strong response against Strong response against Good for long-term attacks outsider attacks. outsider and insider attacks
Data gathering Gathering all data on host modest data gathering only data that related to honeypot
False positive High High Low
Discovery of new attacks No No yes
Discovery of Encryption attacks No No yes
Flexibility Low Low Very High
resource requirement require maximum resource require modest resource require minimum resource
View Domain unlimited view domain unlimited view domain Limited view domain
risk modest modest Almost High
Network Traffic modest High Lowest
Moved capability No Yes ——
TABLE II. Comparison of Honeypots and IDSs
subject IDs
Host NetworkHoneypot
• 189
reFereNCeS
[1] N. Komninos, and C. Douligeris, “LIDF: Layered intrusion detection framework for ad-hoc networks,” Ad Hoc Networks, Elsevier, vol. 7, pp. 171-182, 2009.
[2] S. Madhavi, and T. H. Kim, “An intrusion detection system in mobile adhoc networks,” International Journal of Security and Its Applications, vol. 2, no.3, July 2008.
[3] S. A. Razak, S. M. Furnell, N. L. Clarke, and P. J. Brooke, “Friend-assisted intrusion detection and response mechanisms for mobile ad hoc networks,” Ad Hoc Network, Elsevier, vol. 6, pp. 1151-1167, 2008.
[4] M. King, “Security lifecycle – managing the threat, GSEC Practical 1,” 2002.
[5] K. Scarfone, and P. Mell, “Guide To Intrusion Detection and Prevention Systems (IDPS),” Sp-800-94. In recommendations of the NIST National Institute of Standards and Technology (NIST), 2007.
[6] R. Bace, P. Mell, “Intrusion detection systems,” NIST Special Publication on Intrusion Detection Systems, SP 800-31, 2001.
[7] G. Vigna, and C. Kruegel, “Host-based intrusion detection systems,” in The Handbook of Information Security, vol. 3, John Wiley & Sons, Dec. 2005.
[8] L. Spitzner,. “Open source honeypots: learning with honeyd, security focus,” 2003.
[9] L. Mokube, and M. Adams, “Honeypots: concepts, approaches, and challenges,” ACmSe 2007, March 23-24, 2007, pp. 321-326.
[10] L. Spitzner, “The honeynet project: trapping the hackers,” IEEE Security & Privacy, vol.1, no. 2, pp. 15-23, 2003.
[11] L. Spitzner, “Honeypots: tracking hackers,” Addison-Wesley Pearson Education, Boston, MA., 2002, pp. 242-261.
A Hybrid Approach to Provide High Security by IDS and Honeypot in Mobile Ad-Hoc Network

Modulation Classification of Communication Signal Us-ing Wavelet Transforms.
Ankita DixitM.E.4th Sem(communication), SSCET,Bhilai(C.G).
e-mail : [email protected]
Mrs.Jaspal BaggaAsst.Professer(ET&T). SSCET,Bhilai(C.G)
e-mail : [email protected]
AbstrAct:
Modulation classifier a device that automatically recognizes the modulation type of received radio signals, plays an important role in several communications applications, determination of received signal modulation type is very important task of electronic surveillance systems. Classifier is intended for the implementation in radio surveillance, supervision and monitor-ing systems. Modulation identification method for the adaptive receiver based on software defined radio.
1. INTroDuCTIoN
An automatic modulation classifier is a system that automati-cally identifies the modulation type of the received radio signal given that the signal exists and its parameters lie in a known range. That is, modulation classification is an intermediate step between signal detection (interception) and data demodulation (information extraction).Automatic modulation Classification of the digital modulation type of a signal has been taking much interest in the communication areas. This is due to advances in reconfigurable signal processing system, especially for the application of software defined radio system. One example is receiver interception in military applications. Another ex-ample is a software radio system.Different modulation schemes have the characteristics of different transients in amplitude, frequency or phase. The wavelet transform (WT) is powerful tool for analyzing non-stationary signals, which include digital communication signals, and the WT has capability to extract transient information which can be exploited for modulation classification.
In this project we have to develop an algorithm for modula-tion recognition of received signal in the presence of additive white Gaussian noise with the use of wavelet transform. The decision is made based on the extraction of some special fea-tures of the continuous wavelet transform of received radio signals. In particular, ADmr (automatic digital modulation recognition) has gained a great attention in military applica-tions, such as communication intelligence (ComINT), Also recent and rapid developments in software-defined radio (SDR) have given ADmr more importance in civil applications, since the flexibility of SDR is based on perfect recognition of the modulation scheme of the desired signal.SDr is rapid growth in the field of mobile communication in general. As
the adaptive receiver in SDr can communicate with different communication standards like TDmA, CDmA, and GSm, the identification of digital modulation type of a signal is to be optimized.
2. MODULATION IDENTIFICATION BY WAVELET TrANSForm
2.1 Continuous wavelet Transform (CWT)Different modulation schemes have different transients, and the difference can be exploited by CWT for modulation clas-sification. The wavelet transform decomposes a signal from time-scale or wavelet domain. The continuous wavelet trans-form of a signal s(t) is defined asWhere is the scale, τ is the translation and the superscript
denotes complex conjugate. The function ψ(t) is the mother wavelet and ψaτ(t) comes from time scaling and the transla-tion of the mother wavelet. The window size of the wavelet transforms decreases as the analyzing frequency increases. As the result, a small scale baby wavelet has short duration and a rich high frequency content and thus can locate and represent the transients well. This makes the wavelet transform ideal for transient analysis and detection.
For digital implementation, the integral in eq.(1) is replaced by summation. By setting sampling time Ts =1, t=k Ts =k , τ = nTs=n and restricting the scale to be an even integer, we haveThe Haar CWT of PSK signal at n=iT, the instant where the
..............(1)
phase change occurs, CWT has different values whenever a phase changes occurs. If
..............(2)
..............(3)

• 191
a is chosen to be a small value ( a narrow baby wavelet), there will be peaks at the times where phase changes occurs. The CWT Haar magnitude of FSK signal isAnalogous to PSK, peaks occurs when the symbol changes in
factor of two. The scaling function coefficient at the jth level and kth point becomes Where h(n) is a wavelet low pass filter.Amplitude variation is one of the feature that can be used to distinguish amplitude
..............(4)
non-continuous phase FSK. on the other hand, there will be no peaks if it is a continuous phase FSK. As the frequency is a variable, the CWT magnitudes resembles a multi-step function with the number of level equal to the number of modulation frequencies. M-ary FSK can be identified by determining the number of DC levels [2].The CWT Haar magnitude of 16 QAM signal isThe CWT Haar magnitude of PSK signal is a constant. While the CWT Haar magnitude of FSK signal is a multistep function
since the frequency is a variable. The FSK can be distinguished by computing the variance of CWT magnitude after removing the peaks by median filtering.
2.2. Discrete Wavelet Transform (DWT)coefficients. The different resolution for each le In this paper we proposed the DWT–based approach to classify the BPSK, QPSK and 16 QAM signals. The DWT procedure is given as follows: from the scaling coefficient co(k), the wavelet coefficient d1(k) is computed by Eq. (6) and c1(k) by Eq. (7). Then, Eqs. (6) and (7) are applied recursively to compute d2(k) and c2(k) from c1(k), and so forth. This process is called the analysis or decomposition part of the DWT as shown in Fig.1. In this Figure, the results of theDWT are the scaling coefficients c2(k) and wavelet coefficients d1(k) and d2(k). Further, both the scaling and wavelet coef-ficients are referred to wavelet transform vel is related to the number of WTCs. For level j the number of WTCs equal 2j. As the number of WTCs decreases, the time resolution is reduced and each scaling space contains gradually less information. The differences in information between the scaling spaces at level j and level j-1 is contained in the wavelet space at level j. The bandwidth of the frequency band at level j is half that of the frequency band at level j-1.
The wavelet transform coefficients (WTCs) of a given function f(t) at the jth level and kth point are computed as followsThe wavelet coefficient is obtained by convolving the se-quence with high pass filter g(n), and then decimating by a
..............(5)
Fig. (1). Decomposition of signal using DWT . The h(n) and g(n) represent low-pass and high-pass filters, respectively
modulation with phase modulation and frequency modulation. Scaling coefficient of DWT is approximation of analyzed signal. Signal can be decomposed by using DWT until a certain level.
3. GeNerATIoN oF moDuLATeD SIGNAL
The received waveform described as:-r(t)= s(t)+n(t) where s(t) is modulated signal with unknown modulation type and n(t) is an adaptive white Gaussian noise r(t) is received signal.
Fig (2) Simulink model of FSKFig (3 )waveform of FSK
(7)
4. SIMULATION AND RESULT:
The modulation techniques can be simulated at any amplitude,
Modulation Classification of Communication Signal Using Wavelet Transforms.

192 • Part D—ICT
with any phase and frequency. Hence there is no restriction for modulation parameters. So we use two parameters like SNr (signal to noise ratio) and standard deviation for modulation classification. The classification module consists of 4 stages. First of all, the generation of modulated signal with additive white Gaussian noise of all types of modulation techniques like FSK, PSK, and QAM. In the second module is we observe from the data calculated that their relationship between stan-dard deviation varying and SNr ration. In the third module is establishing relationship between std. deviation of level 1, level 2, level 3, and wavelet transform and SNR and final mod-ule is the formation of generalized receiver to identify all the modulated signal. Digitally modulated signals are analyzed by finding wavelet transform and extracting wavelet co-efficient and we can observe the data calculated that their graph between standard deviation and SNR. By using wavelet transform we observe that there is a variation of standard deviation at dif-ferent SNr. We can simulated different modulation scheme for ASK, FSK, PSK,QAM.
Fig(4) 2FSK signal graph between std. deviation and SNR at level 1.
Similarly at different levels, standard deviation is calculated and merged the values in one graph as decision tree. With the
help of decision tree we try to classify the received signals in different modulations.
Fig(5) 2FSK signal at different level between standard deviation of coef-ficient and SNR.
In this figure we use HAAR WAVELET because this wavelet
is basic wavelet transform its known as mother wavelet .this wavelet use for classifier as it was found appropriate for de-
composition of the received signal pulse. And in this figure we calculate the coefficient at different SNR. Similarly 4FSK, 8 FSK, 2PSK, 4PSK, 8PSK, 2 QAM, 4QAM & 8QAM using HAAR wavelet. I will calculate the coefficient and use standard deviation to distinguish between different schemes.
5. CONCLUSION
We have proposed a wavelet transform method for the identi-fication of modulation techniques, in this paper. Successfully, this method has been tried different digital modulation tech-niques.The modulation identifier may be used at a number of places. Like military applications and many communication fields.
6. REFERENCES
1) Samir s.soliman shue-zen Hsue, student member Ieee” Automatic modulation recognition of digitally modu-lated signals”. Southern methodist university, october 1989.
2) P.A.J.Nagy.”Modulation Classification-An Unified View”.National Defence research establishment, Sweden, 1996.
3) V.Matic,B.Lestar,V.tadic.”TheUse of Digital Signal Processing For A Modulation Classification”. Institute IRITELYugoslavia2002.
4) J.DoJin,YoungJinKwak,K.W.Lee1,K.H.Lee2.” Modula-tion Type Classification Method using Wavelet Transform For Adaptive Demodulator”. Korea university, Seoul, korea, National security Research Institute ,Nov 2004.
5) I.Rashid1,H.Maqbool2,M.urRehaman,F.Nadir.”Digital modulation identification by basic modulation Param-eters”.military College of signals,National university of sciences and Technology,Pakistan,2005.
6) Effrian Yanti Hamid.”Automatic Modulation classification of Communication signals using Wavelet transform”. Bandung Institute of Technology,Jalan Ganesa ,Indonesia, June 2007.
7) K.Maliatsos,S.Vassaki,P.Constantinou.Modulation Rec-ognition of digital signal using thewavelet transform”.National Technical University Of Athens, Greece ,2007.
8) P.Prakasam and M.Madheswaran.” Digital modulation identification model using wavelet transform and stasti-cal parameters”.Center for advanced research,muthaya engineering college,Tamilnadu, India,2008.
Prim’s Algorithm for Color Image Segmentationutpal roy, Achintya K. mandal, Anandarup roy
Dr. Utpal Roy, is with the Department of Computer and System Sciences, Siksha-Bhavana, Visva-Bharati, Santiniketan 731235, India, Email: [email protected]
Mr. Achintya K. Mandal is with the Assam University, Silchar, INDIA, Email: [email protected]. Anandarup Roy, is the research scholar of. the Department of Computer and System Sciences, Siksha-Bhavana, Visva-Bharati, Santiniketan 731235,
India
AbstrActThe present study is devoted to propose a graph base-algorithm for segmenting color images. Here the color image has been represented by a undirected Weighted Graph. The present method based on selecting edges from a graph, where each pixel corresponds to a node in the graph, certain neighbor-ing pixels are connected by undirected edges. Weights on each edge measure the dissimilarity between pixels. We have used Prim’s algorithm for constructing the minimum spanning tree with the undirected edges. However, like the classical methods, present study equally adaptively adjusts the segmentation criterion based on the degree of variability in neighboring regions of the image. The implementation has been done with C language and has run in the Linux environ-ment. The algorithm has been tested with available benchmark database [18] and also with some synthetic and satellite images. The results obtained from the benchmark data sets have been compared with the results available in literature [19].
Index Terms— Color Image Segmentation, Graph based Segmentation, Prim’s Algorithm.
I.INTroDuCTIoN
Image segmentation is a critical and essential component of image analysis and/or pattern recognition system. Furthermore it is one of the most difficult tasks in image processing and determines the quality of the final result of analysis. Image segmentation is a process of dividing an image into different regions such that each region is, but the union of any two adjacent regions is not, homogeneous. There are many papers and surveys on monochrome and color image segmentation technique [1]. Recently color image attracts more and more attention as Color image can provide more information than gray level images. most gray level image segmentation tech-niques can be extended to color images Fuzzy Approaches and Neural Network based gray level segmentation methods can be directly applied to each component of color space, then the result can be combined to obtain a final segmentation result. However, one of the problems is how to employ the color infor-mation as a whole for each pixel. When the color is projected into three components, the color information is so scattered then the color image becomes simply a multi-spectral image and the other information that a human eye can perceive is lost. Another problem is how to choose the color representation for segmentation. As discussed in the previous section, each color representation has its advantages and disadvantages. There is no single color representation that can surpass others for
segmenting all kinds of color images. There are two critical is-sues on color image segmentation: What segmentation method should be utilized and what color space should be adopted. No general advantages in using one specific color space with regards to others has found. The selection of color space for image processing is highly depends on the image and as well as the application sought for.
The colors allow the object-of-interest regions to be more distinguishable from the background of many variants. The color segmentation process can be divided into feature-space based, image-domain based and physics based techniques [2]. Feature-based methods focus their attention only on the color features where color similarity is the only criterion to segment an image. Image-domain based methods take spatial factors into consideration. Physics based techniques are mainly used to process real scene images where the physical models of the reflection properties of materials are utilized. Text ex-traction from images and video sequences finds many useful applications in document processing [3] and content-based image/video retrieval from image/video databases [4]. There have been several studies on text segmentation in the last few years. Wu et al. [5] use a local threshold method to segment texts from gray image blocks containing texts. By considering that texts in images and videos are always colorful, Tsai et al. [6] develop a threshold method using intensity and saturation features to segment texts in color document images. Lienhart et al. [7] and Sobottka et al. [8] use color clustering algorithm for text segmentation. Roy et al. [9] has reported many successful attempts using various statistical models for the extraction of objects as well as text from various color back ground with the ground truth and laboratory made database.
There is a long saga on image segmentation and clustering dating back over say 2-3 decades with application in many ar-eas, other than computer vision [1]. In these section we briefly considered some of the related works those are most relevant to our present greedy approach: Graph based methods [10], region merging techniques, techniques based on mapping image pixels to some feature space [11] and spectral methods [12].
The present article attempts to present a simple graph algo-rithm for the color image segmentation. The objective of
the method is not to compete with other existing various color image segmentation algorithm [1] but novelty of the proposed method resides in its simplicity.
In comparison with some classical clustering algorithm [13] the present study method based on selecting edges from a graph, where each pixel corresponds to a node in the graph, certain neighboring pixels are connected by undirected edges. Weights on each edge measure the dissimilarity between

194 • Part D—ICT
pixels. However, unlike the classical methods, present study is not a superior one adaptively adjusts the segmentation criterion based on the degree of variability in neighboring regions of the image by forming the minimum spanning tree using well-known Prim’s algorithm. This results in a method that, while making greedy decisions during running the Prim’s algorithm can be shown to obey segmentation technique. Choosing the Prim’s algorithm has different advantages for some specific image-cases.
The implementation has done with C language and it runs in the Linux environment with reasonably short span of time. The present approach has been applied to some synthetic image data and equally for the ground truth Brakeley image data set [14]. It provides reasonably good results. The obtained results have been presented for few sets of image data.
II. meTHoDoLoGy
Graph-based methods provide an alternative to feature space clustering. A weighted undirected graph G = (V, E) is formed, with the set of vertices V corresponding to the pixels x in the image. edges E in the graph are taken between any two pix-els xi and xj within a small distance of each other. undirected weighted graphs are used to represent the color images. The edge weight w (xi, xj) ≥0 reflects the dissimilarity (alterna-tively, the similarity) between the two image neighborhoods centered on pixels xi and xj. A common form of the weight function is to use (xi, xj) gives a measure of similarity between two vertices (pixels). Finally, Ω is a set of all weights of the edge set in G. The present algorithm works on fixed ordering of the edges E=e1,e2,……,en such that w(ei) ≤ w(ej)where n=|E|.
A segmentation of a Graph G is defined as a subgraph S(c, Fc ) where C=Ci is the set of components forming a parti-tion of V and Fc = Fci is a canonical forest. A component Ci is a set of vertices that are connected one another by a path of edges of e minimizing the sum of their edge weights, Cp is the component to where the vertex p belongs. A canonical forest Fc is a set of trees where Fci ∈ Fc is a minimum span-ning tree(mST) of Ci∈ C. The ordering of e provides a way of selecting a unique mST from the possible minimum weight spanning trees of Ci. We can now define a set ∑ of all segmen-tations S of a graph G and an equivalence relation, ≤, of pairs of elements that is reflexive, anti-symmetrical and transitive T≤ S ↔ T ∈ R(S), R(S) is refinement of segmentation S ∈∑. In words refinement of a segmentation S is the set of all other segmentations, which have smaller components in a way that once these components get merged. This generates the same components as in S.
The Set (S, ≤) is partially ordered set because the fact that T.T′≤S does not imply that T≤T′ nor T′≤T.
The minimum element of (S, ≤ ) is G = (V,E) and the mini-mum is G min =(V,0), where all components have one vertex and trees have no edge.
It is useful to point out that an efficient way to do clustering
with a variable parameter Χ is to first build a minimal span-ning tree of the Graph. Prim’s algorithm can be used, which is greedy approach guaranteed to give an optimal MST. Begin-ning with the completely connected graph, edges are added one at a time in increasing order of their weights, so long as adding an edge does not introduce cycles in the current sub-graph. We have used here the RGB color space. Details discussion about the color space is beyond the scope of the article.
III. ANALySIS oF THe ALGorITHm
Now in this Section we translate the segmentation of an image I into the problem of finding a proper segmentation S from a graph G among the set of all possible segmentations in ∑.The present approach takes advantage of a greedy algorithm that obeys the previous definitions of what is considered to be an over-segmented and a under-segmented image. The process keeps merging region, until segmentations which are neither over-segmented or under-segmented are attained. Ideally, this should occur in an intermediate case corresponding to the notion of having neither too many nor too few components in a segmentationIntuitively, an image is over-segmented when there are still too many components that could be further merged into bigger regions. Consequently, the algorithm should grow components until the image failed to be over-segmented, that is whenever merging more components were a likely error. Hence, an im-age is no more over-segmented if the differences between any two adjacent components are greater than their differences within some specified limit. In a similar way an image is under-segmented whenever region growing has gone too far and there are too few components left. This implies that too different components have been erroneously joined. Therefore, an image will not be under-segmented if there exists a proper refinement, which is neither over segmented, meaning that a smaller segmentation can be still fulfill the criteria of over segmentation.
We now turn to the segmentation algorithm, which is closely related to Prim’s algorithm for constructing a mini-mum spanning tree of a graph. It can be implemented to run in o(mlogm) time, where m is the number of edges in the graph.
IV. PRIM’S ALGORITHM
Prim’s algorithm is another greedy algorithm that finds a minimal spanning tree in a connected weighted graph. un-less specified otherwise, all of the weights are assumed to be positive. The importance of the Prim’s algorithm mainly in this application is that unlike Kruskal’s algorithm, whose partial solutions are not necessarily connected but a tree and a minimum-spanning tree. Prim’s algorithm begins with a start vertex and no edge applies the greedy rule: Add an edge of minimum weight that has one vertex in the current tree and the other is not in the current tree. Following properties of Prim’s algorithm are very relevant in this study.

• 195
Lemma 1: There is no graph for which the Prim’s algorithm is slower than Kruskal’s algorithm.Lemma 2. Any implementation of Prim’s algorithm must examine each edge’s weight at least once, and thus has time Ω(m). Lemma 3. Any implementation of Prim’s algorithm that uses comparisons of weights can sort an array size of Θ(n) and has worst-case time complexity Ω(mlogm).
Algorithm:
If all above considerations are put together in a proper way. We accomplish an algorithm capable of segmenting color images based on a Prim’s algorithm a greedy approach, which com-putes the minimum spanning tree of an undirected weighted graph (representing a color image) encompassing the differ-ences between the colors of any pair of neighboring pixels as edge weights. The segmentation thus obtained is a sub graph Sn ⊂ G. The input is a graph G = (V, E), with n vertices and m edges. The output is a segmentation of V into components S =(C1.....Cr).
Performance of the Prim’s algorithmThe Performance of the Prim’s algorithm depends on how we implement the priority queue Q. If such queue in Prim’s algo-rithm is implemented in binary min-heap, the heap operation will take O(lg V) time. Thus the total time for Prim’s algorithm is O(V lg V + E lgV)=O(E lg V), which is asymptotically same as for implementation of Kruskal’s algorithm. But The asymptotic running time of Prim’s algorithm can be improved much in case of image which has been considered as graph, by using Fibonacci heaps. It can be proved that if |V| elements are organized into a Fibonacci heap, we can perform an the operation in o(lg V) amortized time and the key operation in o(1) amortized time. Therefore, if we use the Fibonacci heap to implement the min priority queue Q, the running times for Prims algorithm improves to o(e+VlgV). In the present we have implemented the Prim’s algorithm acordingly and con-sidering the vales of V and e the improvement is much higher in comparison to Kruskal’s algorithm.
Step 0: sort E into ψ (o1,o2,................on) by non-decreas-ing edge weight, using Heap sort algorithm.
Step 1: start with a segmentation s°, where each vertex vi, is in its own component and run the Prim’s algorithm to construct Minimum spanning tree(Mst).
Step. 2: repeat step 3 for q = 1.....m. where m is the number of edges, for some threshold value x.
Step 3: construct given Sq given S (q-1) as follows. Let vi and vj denote the vertices connected by the q-th edge in the ordering, i.e., oq = (vi, vj) If vi and vj are in disjoint components of S (q-1) and w(oq) is small compared to the internal difference of both those components, then merge
the two components otherwise do nothing.
Step 4: return s=sm
the parameter x is provided by the user for controlling spurious region identification.
V. reSuLTS AND DISCuSSIoN
The algorithm have been implemented with C programming language and executed in the LINUX environment of a Per-sonal Computer(PC). The above algorithm has tested with the laboratory made and a ground truth Berkeley dataset [18]. Im-portantly the present image is also capable enough to segment the satellite imagery data. The results obtained from the present experiment have been presented in Figure 2 and Figure 3. In Figure 1 depicts that the well-known synthetic image (Lena) produces 97 components when segmented with the present methods shown in Figure 2. Figure 3 shows the segmentation of a satellite imagery of a cyclone, with the present algorithm it has been segmented to 196 components. Table I shows the comparison of segmentation. In the first column of Table 1 three sample images from the Berkeley database[18] have been considered for the experiment. The obtained segmenta-tion results have been presented in the third column and the second column of the table it shows results obtained from the statistical approach[ ICVGIP 10] for the same set of date. From three images, respectively, 262, 11 and 14 segmented components have been observed. From visual perception it is obvious that the results are in agreement with the with the other method. moreover the present method have been applied to some satellite and synthetic data. It has been observed that the present approach is capable enough to produce reasonable segmentation of variety of images.
CoNCLuSIoNS
It has been observed that, the present algorithm sometimes suffers from over-segmentation for images having multi-color
Fig. 1 Lena Image Fig. 2 Segmented Lena Image
Prim’s Algorithm for Color Image Segmentation

196 • Part D—ICT
background with complex objects, though the precaution of over-segmentation have been considered within the algorithm designed, the unique feature of the algorithm is that in never suffers from under-segmentation more or less the algorithm is able to segment images of many variants. The reason for over-segmentation is to be studied more minutely.
Table 1: results of segmentationreFereNCeS
1. Jain A. K. and Dubes, R.C. 1988, algorithm for Cluster-ing Data. Prentice Hall.
2. Lucchese L. and Mitra S. 2001, Color image segmenta-tion : A State-of –the-art survey, in Proc. Of the Indian National Science Academy,(67-(A)2).
3. Fang K C, Wang L.S. and Wang Y K, 1995, signal pro-cessing 45, 329.
4. Lienhart L., 2001, Indexing and retrieval of digital video sequences based on automatic text recognition, in Proceeding of the ACm International multimedia Conference and exhibition.
5. V. Wu, R. Manmatha and E M Riseman, 1999, Textfinder: an automatic system to detect and recognize text in im-ages, Ieee Trans. on Pattern Analysis and machine Intelligence 21, 1224.
Sample image from Berkeley
Database[14]
Segmented by Statistical ap-
proach[15]
Segmented with pres-ent approach
6. Tasi C and Lee H, 2002, IEEE Trans on Image processing 11, 434.
7. Lienhart R nad F. Stuber, 1996, Automatic Text recogni-tion in digital videos in the Proc. of SPIe (Image and Video Processing IV 2666).
8. Sobottka H B K and Kornenberg, 1999, Identification of text on colored book and journal covers, in Proc. of the International Conference on document Analysis and recognition.
9. Roy A., Parui S K, Roy Utpal, 2008, A Color Based Im-age Segmentation and its Application to Text extraction, International Conference on Computer Vision, Graphics and Image Processing(ICVGIP-2008, IEEE Kharagpur Chapter) Proceeding Page 314-319.
10. Cooper, M.C. 1998. The tractability of segmentation and scene analysis. International Journal of Computer Vision, 30(1):27–42.
11. Hongzhi Wang, John Oliensis, 2010, Rigid Shape Match-ing by Segmentation Averaging, Ieee Transactions on Pattern Analysis and machine Intelligence, vol. 32, no. 4, pp. 619-635.
12. Weiss,Y. 1999. Segmentation using eigenvectors:Aunify-ing view. In Proceedings of the International Conference on Computer Vision, 2:975–982.
13. N.R. Pal, K. Pal, J. C. Bezdek, and T. A. Runkler, 1997: Some issues in system identification using clustering. Int. Joint Conf. Neural Networks: IJCNN 1997, Piscataway, NJ, IEEE, 2524–2529.
14. D. Martin and C. Fowlkes. The Berkeley Segmentation Dataset and Benchmark. http://www.cs.berkeley.edu/projects/vision/grouping/segbench/.
15. Anandarup Roy, Swapan Kumar Parui, Amitav Paul and Utpal Roy, A Color Based Image Segmentation and its Application to Text Segmentation, Proc. of Indian Conference on Computer Vision, Graphics and Image Processing (ICVGIP- 2008), pp. 313-319, December 2008, India

Feature Selection of Network Traffic Data to Develop Intrusion Detection System
Jaydeep Sen#1, Pritam Banerjee#2, Jaya Sil#3
#Department of Computer Science and Technology Bengal Engineering and Science University, Shibpur, Howrah-711103
[email protected], [email protected],[email protected]
AbstrAct
Intrusion detection is one of the core activities to maintain security in computer system that protects computer network from different types of attacks. Most of the existing intrusion detection systems (IDs) use large number of features to evaluate and search for intrusive patterns resulting lengthy detection process and degrading the performance of the IDs. the paper proposes a novel feature extraction procedure by representing the patterns in a feature space that attains highest discrimination between legitimate and attack patterns. the dataset have been preprocessed to span within a feasible range while retaining its original continuous characteristics. As a next step, the data is standardized, which particularly fits the application environment. In the proposed method, at the first step only potential features are extracted by removing less important and redundant features. In the second step, using proper correlative measures, similar features are simulated that further reducing feature space dimensions. the procedure is applied on KDD-99 dataset and the reduced feature set is classified using ten fold cross validation method. results show that the proposed method reduces data considerably with substantial improvement in classification process too.
Keywords— Feature Selection, Classification, Correlation, Intrusion detection
I. INTroDuCTIoN
In the era of information society, computer networks and their related applications are becoming more and more popular, so does the potential threat to the global information infrastructure to increase. To defend against various cyber attacks and computer viruses, lots of computer security techniques have been intensively studied in the last decade. Intrusion detection is the process of monitoring the events occurring in a computer system or network and analyzing them for signs of intrusion [1]. Intrusions are defined as attempts to compromise the confidentiality, integrity or availability of computer or network. They are caused by the attackers accessing a system from the internet by authorized user of the systems who attempt to gain additional privileges for which they are not authorized and by authorized user who misuse the privileges given to them [2]. Anomaly detection and misuse detection [3] are two general approaches to computer intrusion detection system. unlike
misuse detection, which generates an alarm when a known attack signature is matched, anomaly detection identifies activities that deviate from the normal behaviour of the monitored system and thus has the potential to detect novel attacks [4]. In this work our aim is to make anomaly-based intrusion feasible.
much like other fields such as data mining, machine learning, pattern recognition and signal processing, intrusion detection deals with datasets containing huge numbers of features. The time and space complexities of most classifiers are exponential function of their input vector size [5]. moreover, the demand for the number of samples for training to the classifier grows exponentially with the dimension of the feature space, is known as the ‘curse of dimensionality’[6]. To overcome the limitation, feature selection is necessary, the process of choosing a subset of features from the original set of features forming patterns in a given dataset. The main purpose is to improve the generalization ability, which usually generate a small set of features from the original input variables by feature extraction. Feature extraction has basically two aims: first to shrink the original dimension of the feature vector to a reasonable size and second to eventually improve the classification accuracy by retaining the most discriminatory information and deleting the irrelevant and redundant information.
Most of the existing IDS [7,8] tend to use all 41 features available in the KDD-99 network traffic datasets. Empirical studies [9,10] indicate that feature reduction technique is capable of reducing the size of the dataset. Although in recent past various attempts has been made to reduce feature set using rough set techniques [11], Principle component analysis [12] and various optimization techniques like particle swarm optimization [13], genetic algorithms [14] but no significant care is taken to preprocess the dataset to fit into the application procedure. So the methods in general suffer from the existing heterogeneity of the datasets, presence of outliers. In the proposed scheme we have preprocessed the dataset in various steps. First to fix the span of the feature dataset by limiting the range of values, thus removing existing outliers and secondly the dataset is standardized to maintain homogeneity among all the features. After preprocessing of dataset, feature reduction procedure in turn uses proper discriminating measure for each attribute and either retains it or discards if found redundant. A novel idea has been introduced in the paper to exploit high correlation among existing features to further reduce the feature space dimensionality by taking proper correlative measures.

198 • Part D—ICT
rest of the paper is organized as follows. All the preprocessing steps are elaborated in section II while in section III, the proposed feature reduction method is explained. results with different classifiers operated on both the original and reduced dataset is given in section IV and finally the paper is concluded in section V.
II. DATA PREPROCESSING
most of the attempts made so far to reduce the feature space dimension have not yet taken into account the heterogeneous nature of records. records consist of real valued attributes as well as nominal attributes and in case of real valued attributes there is no bound in the possible range. Presence of undetected outlier is a very likely consequence if the dataset is not properly preprocessed. moreover, nonuniform range for real valued attributes makes the classifier task tedious and is hence prone to misclassification.
A. Conversion of Data First we have converted the nominal valued attribute to real valued attributes. Algorithm of conversion is as depicted below.Algorithm: search_install variables: list L for each nominal attribute contains struct nodes with nominal value and its mapping real value. Begin for each attribute array nextval[] contains next possible real value to be assigned for a new nominal value. record the next nominal value from the input in string S. boolean=Search (L[attr], S) // search S in L. if (boolean=yes) then write real value in L for S.. else begin assign nextval[attr] as the mapping real value for S write and increment nextval[attr]. end end.
B. Outlier RemovalIn statistics outlier is an observation, which is far away from the rest of the observations [6]. In the proposed intrusion detection domain, outlier can be thought as the feature value, substantially large or small as compared to the other values taken by the same feature. Because of its unusual high or low value it introduces error component in statistical measures like mean, variance etc. [7] and thus will have an impact to the overall classifier performance, which inherently depends on overall dataset statistics. Here we detect an outlier based on the data value of each attribute by considering its distance from an expected value of that attribute. As is seen
statistically most of the distributions consume all the legitimate statistical data within the span of the (mean -4× variance) to mean+4×variance). So if the data value for that attribute is out of that span we consider it as an outlier and replace it with the expected value taken by the feature in that class. once the outlier is removed we can restrict the data values for a feature within a certain range and thus imposing some bound to the possible values taken in the dataset itself.
C. StandardizationNow we have all the features as real valued features and
within a statistically restricted span for each feature. However, there is no specific range of the data values taken by the features, which creates problem due to heterogeneous data distribution among different feature values. Processing on the feature values to maintain some homogeneity is achieved through scaling. every feature value is maintained between -1 to +1 range by dividing each data (feature values) with the maximum of modulus values that the feature has taken for all the sample points.Algorithm: standardizationVariable: attr_val contains value of current attribute.Begin for each attruibute array max[] contains highest value taken by the attribute for each sample point in the input file Begin for each attribute attr Begin attr_val=attr_val/max[attr]; write attr_val to output file end_for end_forend.
III. FEATURE SELECTION
In this work, we have used KDD dataset considering as benchmark data for intrusion detection evaluation. The training dataset for anomaly detection consists of single connection vectors each of which contains 41 features and is labeled as either normal or anomalous. Both the time and space complexities of most classifiers used being exponential function of their input vector size grows rapidly with the increase in feature value. moreover, with more no of features included in the classification process that may include irrelevant features, degrading classifier performance by introducing ambiguity in deciding for a class. The demand for the number of samples for training to the classifier grows exponentially with the dimension of the feature space. Therefore, for a fixed number of training patterns consisting of more number of features may suffer from lack of enough available training data to classify test patterns correctly.
Feature selection is a process where a feature subset is selected to represent the data. The significance of feature

• 199
selection can be viewed in two facets. The frontier facet is to filter out noise and remove redundant and irrelevant features. Second, feature selection can be implemented as an optimization procedure of search for an optimal subset of features that better satisfy a desired measure. Generally, the capability of an anomaly intrusion detection is often hinders by inability to accurately classify variation of normal behaviour as an intrusion. Additionally, network traffic data is huge and it causes a prohibitively high overhead and often becomes a major problem in IDS. usually, an intrusive behaviour has some patterns or structures or relationship properties that are unique and recognizable. These common properties are often hidden within the irrelevant features and some features contain false correlation. Some of these features may be redundant and may have different discriminative power. The aim is to disclose these hidden significant features from the irrelevant features. Thus, an accurate and fast classification can be achieved. According to the existence of these irrelevant and redundant features generally affect the performance of machine learning or pattern classification algorithms.
A Feature Space ReductionA two step scheme has been proposed for feature space
reduction. At first step redundant features are removed. In the second step, correlation coefficients between the retained features are calculated. Then by proper correlative measures, a feature value is simulated with the help of another feature value if both are strongly correlated. From classification point of view an attribute say, R can be considered redundant if on an average it is taking the same value for all the classes. In other words, different classes cannot be distinguished using the feature R. moreover, the classification process may not yield satisfactory result if the feature set is burdened with features like r. So we evaluate the average value of R in different classes and if their difference falls below a threshold we discard that feature. Since the threshold is basically acting like a cut off, selection of threshold has a key role in deciding the usefulness of the reduction algorithm. Ideally threshold value must be so chosen which itself can incorporate data orientation characteristics of the relevant dataset. In the proposed scheme we have chosen various fractions of standard deviation as threshold and obtained the reduced set of features.Agorithm: reduce
variable:
array avg[][] for each attribute and each class contain mean value of an attribute in a class.aray diff[] for each attribute containing interclass difference in average value of an attribute.BeginFor each attribute attr For each class cls avg[attr][cls] has average of attribute in that class For each attribute attr begin
diff=avg[attr][cls1]-avg[attr][cls2] If(diff>threshold) Put attribute in the reduced attribute set else Discard that attribute end_ifend_for End. For different threshold value number of selected features are listed in Table-I.
threshold value Number of selected features0.2 31 0.25 26 0.5 7 0.75 6 0.8 4 0.85 3
Table I : result of Algorithm: reduceB Correlative MeasuresAs the very notion of correlation states in statistics it is a measure of how close two features are correlated. Statistically
it is defined as Algorithm: correlation_computaion While (more sample point in input file) for each pair of attributes attr1 and attr2 update cov[attr1][attr2] for each pair of attributes attr1 and attr2 Caculate cor[attr1][attr2] ( using the above formula)end. result of the above algorithm is listed in Table II.
TABLE II : Result: Correlation_Computation thresholding Applied Number of pairs selected
0.25 64 0.50 27 0.75 17
Theoretically, high correlation coefficient means that the two features are significantly correlated. In such a situation if we know any one of the feature values then statistically we can come up with a reasonable estimate of other feature value. Thus the idea is to simulate the effect of a feature using another feature, which is significantly correlated with the one being simulated. We are not discarding any of the correlated features like we did in case of redundant features rather we
Feature Selection of Network Traffic Data to Develop Intrusion Detection System
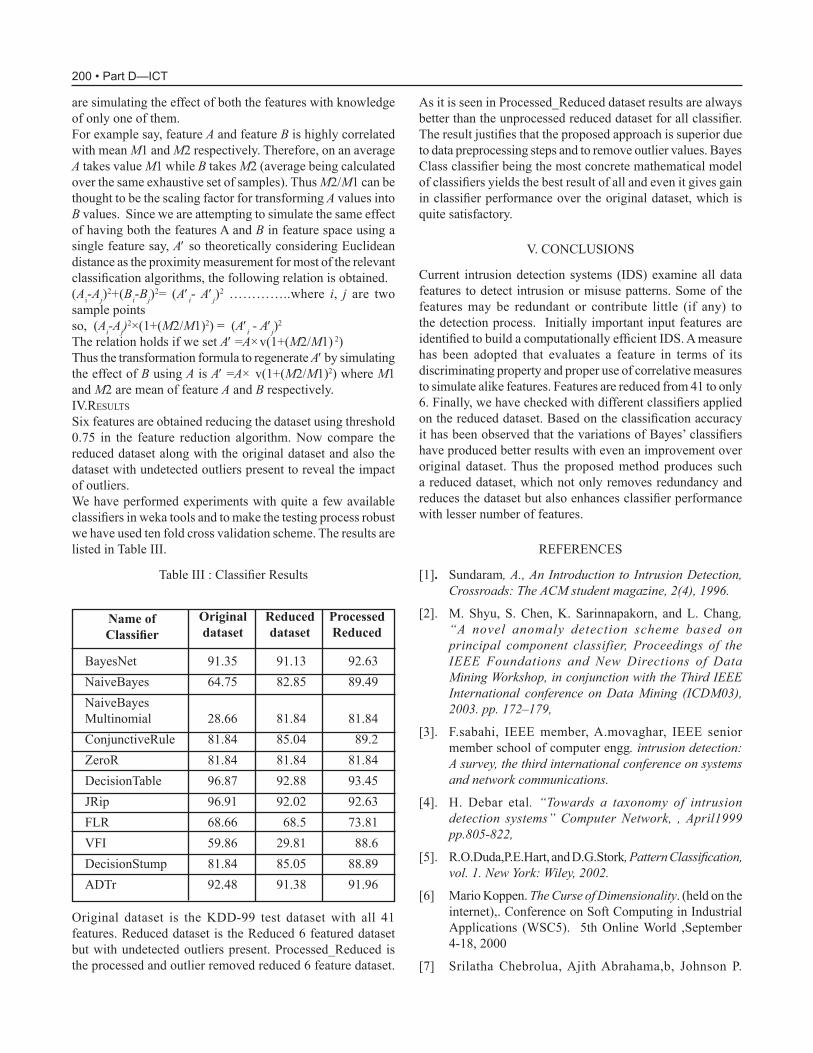
200 • Part D—ICT
are simulating the effect of both the features with knowledge of only one of them.For example say, feature A and feature B is highly correlated with mean M1 and M2 respectively. Therefore, on an average A takes value M1 while B takes M2 (average being calculated over the same exhaustive set of samples). Thus M2/M1 can be thought to be the scaling factor for transforming A values into B values. Since we are attempting to simulate the same effect of having both the features A and B in feature space using a single feature say, A′ so theoretically considering euclidean distance as the proximity measurement for most of the relevant classification algorithms, the following relation is obtained.(Ai-Aj)
2+(Bi-Bj)2= (A′i- A′j)
2 …………..where i, j are two sample pointsso, (Ai-Aj)
2×(1+(M2/M1)2) = (A′i - A′j)2
The relation holds if we set A′ =A×v(1+(M2/M1) 2)Thus the transformation formula to regenerate A′ by simulating the effect of B using A is A′ =A× v(1+(M2/M1)2) where M1 and M2 are mean of feature A and B respectively.IV.RESULTS
Six features are obtained reducing the dataset using threshold 0.75 in the feature reduction algorithm. Now compare the reduced dataset along with the original dataset and also the dataset with undetected outliers present to reveal the impact of outliers. We have performed experiments with quite a few available classifiers in weka tools and to make the testing process robust we have used ten fold cross validation scheme. The results are listed in Table III.
Table III : Classifier Results
As it is seen in Processed_reduced dataset results are always better than the unprocessed reduced dataset for all classifier. The result justifies that the proposed approach is superior due to data preprocessing steps and to remove outlier values. Bayes Class classifier being the most concrete mathematical model of classifiers yields the best result of all and even it gives gain in classifier performance over the original dataset, which is quite satisfactory.
V. CONCLUSIONS
Current intrusion detection systems (IDS) examine all data features to detect intrusion or misuse patterns. Some of the features may be redundant or contribute little (if any) to the detection process. Initially important input features are identified to build a computationally efficient IDS. A measure has been adopted that evaluates a feature in terms of its discriminating property and proper use of correlative measures to simulate alike features. Features are reduced from 41 to only 6. Finally, we have checked with different classifiers applied on the reduced dataset. Based on the classification accuracy it has been observed that the variations of Bayes’ classifiers have produced better results with even an improvement over original dataset. Thus the proposed method produces such a reduced dataset, which not only removes redundancy and reduces the dataset but also enhances classifier performance with lesser number of features.
reFereNCeS
[1]. Sundaram, A., An Introduction to Intrusion Detection, Crossroads: The ACM student magazine, 2(4), 1996.
[2]. m. Shyu, S. Chen, K. Sarinnapakorn, and L. Chang, “A novel anomaly detection scheme based on principal component classifier, Proceedings of the IEEE Foundations and New Directions of Data Mining Workshop, in conjunction with the Third IEEE International conference on Data Mining (ICDM03), 2003. pp. 172–179,
[3]. F.sabahi, IEEE member, A.movaghar, IEEE senior member school of computer engg. intrusion detection: A survey, the third international conference on systems and network communications.
[4]. H. Debar etal. “Towards a taxonomy of intrusion detection systems” Computer Network, , April1999 pp.805-822,
[5]. r.o.Duda,P.e.Hart, and D.G.Stork, Pattern Classification, vol. 1. New York: Wiley, 2002.
[6] Mario Koppen. The Curse of Dimensionality. (held on the internet),. Conference on Soft Computing in Industrial Applications (WSC5). 5th Online World ,September 4-18, 2000
[7] Srilatha Chebrolua, Ajith Abrahama,b, Johnson P.
BayesNet 91.35 91.13 92.63NaiveBayes 64.75 82.85 89.49NaiveBayesMultinomial 28.66 81.84 81.84ConjunctiveRule 81.84 85.04 89.2ZeroR 81.84 81.84 81.84DecisionTable 96.87 92.88 93.45JRip 96.91 92.02 92.63FLR 68.66 68.5 73.81VFI 59.86 29.81 88.6DecisionStump 81.84 85.05 88.89ADTr 92.48 91.38 91.96
Name of Classifier
Originaldataset
reduceddataset
Processedreduced
Original dataset is the KDD-99 test dataset with all 41 features. Reduced dataset is the Reduced 6 featured dataset but with undetected outliers present. Processed_reduced is the processed and outlier removed reduced 6 feature dataset.

• 201
Thomas “Feature deduction and ensemble design of intrusion detection systems”, Computers & Security 24, 2005, pg-295-307
[8] Dewan Md. Farid, Jerome Darmont, Nouria Harbi, Nguyen Huu Hoa, and mohammad Zahidur rahman “Adaptive Network Intrusion Detection Learning: Attribute Selection and Classification” , World Academy of Science, Engineering and Technology 60, 2009
[9] Yudel Gómez, Rafael Bello, Amilkar Puris, María M. García, Ann Nowe “Two Step Swarm Intelligence to Solve the Feature Selection Problem”, Journal of Universal Computer Science, ,2008, vol. 14, no. 15 , 2582-2596
[10] Rupali Datti, Bhupendra verma “Feature Reduction for Intrusion Detection Using Linear Discriminant Analysis” International Journal on Computer Science and Engineering , 2010,Vol. 02, No. 04,pg-1072-1078
[11] Roman W.WINIARSKI “ROUGH SETS METHODS IN FEATURE REDUCTION AND CLASSIFICATION ” Int. J. Appl. Math. Comput. Sci., , 2001Vol.11, No.3, 565-582
[12] Shilpa lakhina, Sini Joseph and Bhupendra verma “12 Feature Reduction using Principal Component Analysis for Effective Anomaly–Based Intrusion Detection on NSL-KDD” International Journal of Engineering Science and Technology , 2010,Vol. 2(6), 1790-1799
[13] Shelly Xiaonan Wu, Wolfgang Banzhaf, ” The use of computational intelligence in intrusion detection systems: A review” Applied Soft Computing 10 , 2010,pg 22-24
[14] Zorana Bankovic, José M. Moya, Álvaro Araujo, Slobodan Bojanic and Octavio Nieto-Taladriz “A Genetic Algorithm-Based Solution For Intrusion Detection” Journal of Information Assurance and Security 4,2009, pg 192-199
[15]. Barnett, V, & Lewis, T.). Outliers in statistical data (3rd ed.). New York: Wiley. (1994)
[16]. Jason W. Osborne and Amy Overbay North Carolina State university The power of outliers (and why researchers should ALWAYS check for them)
http://pareonline.net/getvn.asp?v=9&n=6
Feature Selection of Network Traffic Data to Develop Intrusion Detection System

Secured Geocast routing in VANeT (Vehicular Ad-Hoc Network) with two stage Efficient
Communication ProtocolBhaskar Das1 and utpal roy1
1Department of Compute and System Sciences,Siksha-Bhavana, Visva-Bharati, Santiniketan-731235E-mail: [email protected]
AbstrAct:
In the present study we have proposed a secured geocaste routing in VANET with two stage efficient communication protocol. the communication protocol has two stages. In the first stage vehicles transmit messages within its trans-mission range of its radar and to the VANEt server. In the second stage VANEt server receives messages from vehicles and sends those messages to all other vehicles belonging to the same geographical region as of sender. Geographical regions are predetermined by VANEt server. One of the interesting features of this protocol is that we use the MANEt infrastructure instead of road-side equipments to communicate with VANEt server. Added feature of the protocol is that unlike other geocast routing protocol[8] it incorporates security issues too. so the messages are secured and trustworthy messages are broadcasted among the vehicles. the protocol has been simulated with the Ns2 simulator. For this two stage com-munication protocol it has been found from the simulation results that the bandwidth usage is less and thus enhance the throughput and decreases the packet loss.
INTroDuCTIoN
A Vehicular Ad-Hoc Network, or VANeT, is a form of, rather a subset of, mobile ad-hoc network, to provide communica-tions among nearby vehicles and between vehicles and nearby fixed equipment, usually described as roadside equipment. The main goal of VANeT is providing safety and comfort for passengers. To this end some special electronic devices will be placed inside each vehicle which will provide Ad-Hoc Network connectivity for the passengers. This network tends to operate without any infra-structure. each vehicle equipped with VANeT devices will be a node in the Ad-Hoc network and can receive and relay others messages through the wireless network. Collision warning, road sign alarms and in-place traf-fic view will give the driver essential tools to decide the best path along the way. Detail discussion about the VANeT and its routing protocols is available in the references [1-8].
IMPROVED DISTRIBUTED ROBUST GEOCASTING TECHNIQUE APPLY IN VANET WITH TWo STAGe eF-
FICIeNT CommuNICATIoN ProToCoL
The present geocast protocol of have two main functions:
1. Forwarding the message through zone of forwarding towards zone of relevance, and through zone of relevance such that the message travels towards the edges of zone of relevance, i.e., spreading the message in right directions.2. Delivering the message reliably to all the nodes within the zone of relevance.
These functions must be performed with the least amount of redundancy, by restricting flooding. The information contained in geocast packet header regarding the sender location and the zone of relevance or zone of forwarding is used in conjunction with the node’s current position to restrict flooding and reduce redundancy. A forwarding algorithm to restrict flooding with backoff based on a node’s distance from the last transmitter. All of these algorithms are developed so that a node does not need to know its one-hop neighbors or to build multi-hop routes. each vehicle sends messages to other vehicles those are behind of it but within its transmission range and to the VANeT server. messages are sent with the information provided by a vehicle or when the other vehicles asked for it to authenticate the information provided by a vehicle.
messages will also be sent to the main server. This mes-sage will use mANeT infrastructure to travel from vehicle to the server.
The VANeT server segregates the area based on geo-graphical location. It generates a table based on geographical locations and vehicles belong to a particular geographical loca-tion. The VANeT server will make an analysis based on those information received by vehicles traveling a particular area and feed them into table. This table will contain geographical location id, identification numbers of vehicles in that location, speed, the information provided by that vehicle, analysis made by the server, and vehicles trustworthiness. other vehicles can access this information from the table and can also check trustworthiness of a particular vehicle. The server also creates another table which contains geographical location id, loca-tion description, average speed, time. From this report server can analyses about the average condition of a particular area. From these report vehicles can map their journey beforehand. This will help the smooth traffic flow. Depending upon the geographical location a vehicle id to each vehicle will be is-sued from the VANET server. The vehicle id is the identifica-tion of vehicle within a certain geographical location as soon as it changes the geographical location the vehicle id will be changed automatically from the VANeT server.
Message categorization
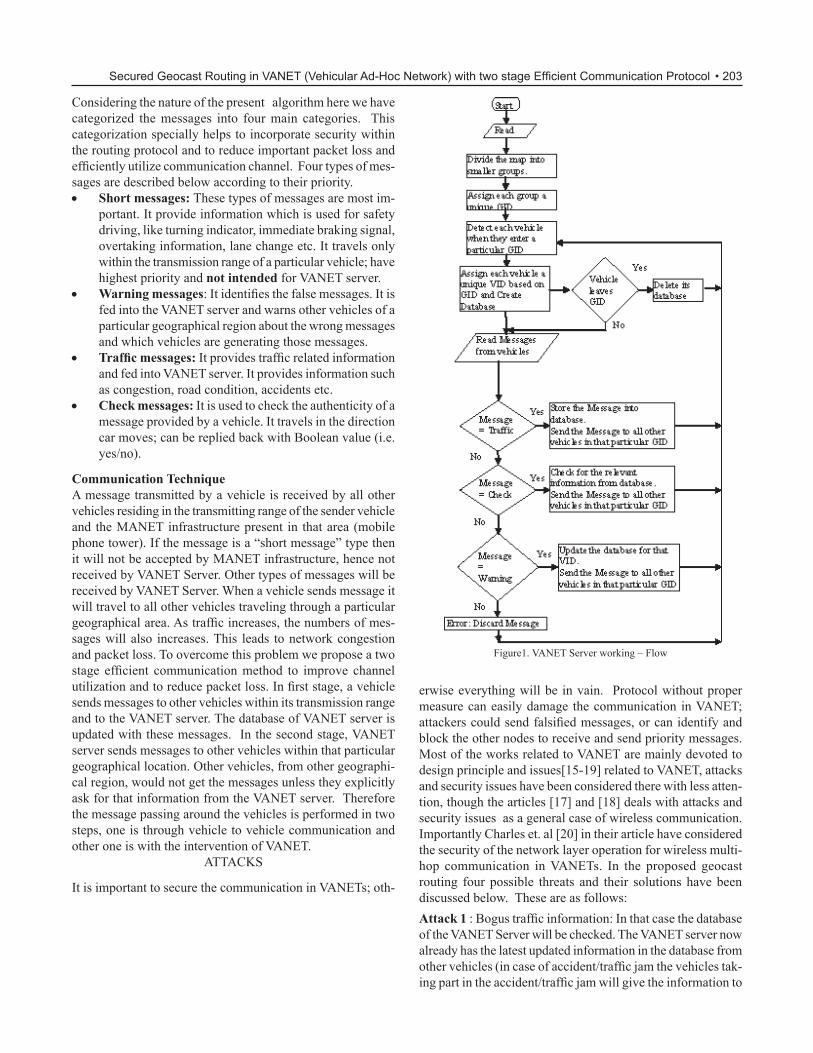
• 203
Considering the nature of the present algorithm here we have categorized the messages into four main categories. This categorization specially helps to incorporate security within the routing protocol and to reduce important packet loss and efficiently utilize communication channel. Four types of mes-sages are described below according to their priority. • short messages: These types of messages are most im-
portant. It provide information which is used for safety driving, like turning indicator, immediate braking signal, overtaking information, lane change etc. It travels only within the transmission range of a particular vehicle; have highest priority and not intended for VANeT server.
• Warning messages: It identifies the false messages. It is fed into the VANeT server and warns other vehicles of a particular geographical region about the wrong messages and which vehicles are generating those messages.
• Traffic messages: It provides traffic related information and fed into VANeT server. It provides information such as congestion, road condition, accidents etc.
• check messages: It is used to check the authenticity of a message provided by a vehicle. It travels in the direction car moves; can be replied back with Boolean value (i.e. yes/no).
communication techniqueA message transmitted by a vehicle is received by all other vehicles residing in the transmitting range of the sender vehicle and the mANeT infrastructure present in that area (mobile phone tower). If the message is a “short message” type then it will not be accepted by mANeT infrastructure, hence not received by VANeT Server. other types of messages will be received by VANeT Server. When a vehicle sends message it will travel to all other vehicles traveling through a particular geographical area. As traffic increases, the numbers of mes-sages will also increases. This leads to network congestion and packet loss. To overcome this problem we propose a two stage efficient communication method to improve channel utilization and to reduce packet loss. In first stage, a vehicle sends messages to other vehicles within its transmission range and to the VANeT server. The database of VANeT server is updated with these messages. In the second stage, VANeT server sends messages to other vehicles within that particular geographical location. other vehicles, from other geographi-cal region, would not get the messages unless they explicitly ask for that information from the VANeT server. Therefore the message passing around the vehicles is performed in two steps, one is through vehicle to vehicle communication and other one is with the intervention of VANeT.
ATTACKS
It is important to secure the communication in VANETs; oth-
erwise everything will be in vain. Protocol without proper measure can easily damage the communication in VANET; attackers could send falsified messages, or can identify and block the other nodes to receive and send priority messages. most of the works related to VANeT are mainly devoted to design principle and issues[15-19] related to VANET, attacks and security issues have been considered there with less atten-tion, though the articles [17] and [18] deals with attacks and security issues as a general case of wireless communication. Importantly Charles et. al [20] in their article have considered the security of the network layer operation for wireless multi-hop communication in VANeTs. In the proposed geocast routing four possible threats and their solutions have been discussed below. These are as follows: Attack 1 : Bogus traffic information: In that case the database of the VANeT Server will be checked. The VANeT server now already has the latest updated information in the database from other vehicles (in case of accident/traffic jam the vehicles tak-ing part in the accident/traffic jam will give the information to
Figure1. VANET Server working – Flow
Secured Geocast Routing in VANET (Vehicular Ad-Hoc Network) with two stage Efficient Communication Protocol
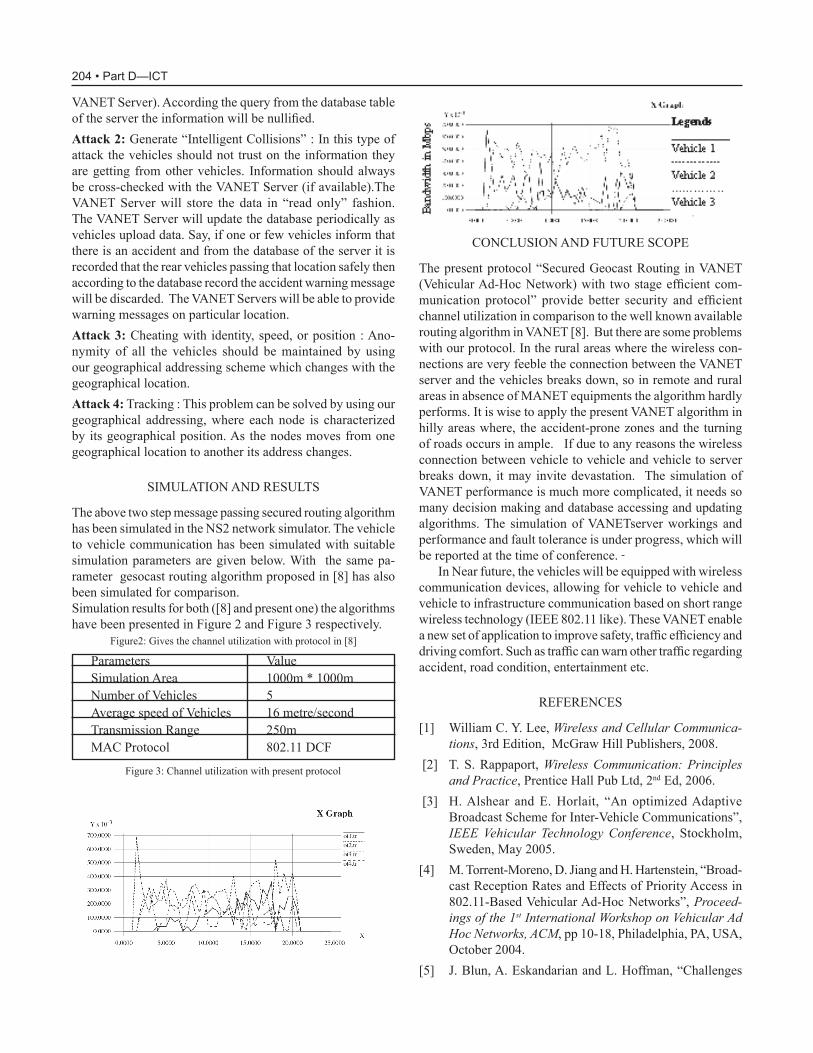
204 • Part D—ICT
VANeT Server). According the query from the database table of the server the information will be nullified. Attack 2: Generate “Intelligent Collisions” : In this type of attack the vehicles should not trust on the information they are getting from other vehicles. Information should always be cross-checked with the VANeT Server (if available).The VANET Server will store the data in “read only” fashion. The VANeT Server will update the database periodically as vehicles upload data. Say, if one or few vehicles inform that there is an accident and from the database of the server it is recorded that the rear vehicles passing that location safely then according to the database record the accident warning message will be discarded. The VANeT Servers will be able to provide warning messages on particular location. Attack 3: Cheating with identity, speed, or position : Ano-nymity of all the vehicles should be maintained by using our geographical addressing scheme which changes with the geographical location. Attack 4: Tracking : This problem can be solved by using our geographical addressing, where each node is characterized by its geographical position. As the nodes moves from one geographical location to another its address changes.
SImuLATIoN AND reSuLTS
The above two step message passing secured routing algorithm has been simulated in the NS2 network simulator. The vehicle to vehicle communication has been simulated with suitable simulation parameters are given below. With the same pa-rameter gesocast routing algorithm proposed in [8] has also been simulated for comparison. Simulation results for both ([8] and present one) the algorithms have been presented in Figure 2 and Figure 3 respectively.
Figure2: Gives the channel utilization with protocol in [8]
CoNCLuSIoN AND FuTure SCoPe
The present protocol “Secured Geocast Routing in VANET (Vehicular Ad-Hoc Network) with two stage efficient com-munication protocol” provide better security and efficient channel utilization in comparison to the well known available routing algorithm in VANET [8]. But there are some problems with our protocol. In the rural areas where the wireless con-nections are very feeble the connection between the VANeT server and the vehicles breaks down, so in remote and rural areas in absence of mANeT equipments the algorithm hardly performs. It is wise to apply the present VANeT algorithm in hilly areas where, the accident-prone zones and the turning of roads occurs in ample. If due to any reasons the wireless connection between vehicle to vehicle and vehicle to server breaks down, it may invite devastation. The simulation of VANeT performance is much more complicated, it needs so many decision making and database accessing and updating algorithms. The simulation of VANeTserver workings and performance and fault tolerance is under progress, which will be reported at the time of conference.
In Near future, the vehicles will be equipped with wireless communication devices, allowing for vehicle to vehicle and vehicle to infrastructure communication based on short range wireless technology (IEEE 802.11 like). These VANET enable a new set of application to improve safety, traffic efficiency and driving comfort. Such as traffic can warn other traffic regarding accident, road condition, entertainment etc.
reFereNCeS
[1] William C. Y. Lee, Wireless and Cellular Communica-tions, 3rd Edition, McGraw Hill Publishers, 2008.
[2] T. S. Rappaport, Wireless Communication: Principles and Practice, Prentice Hall Pub Ltd, 2nd Ed, 2006.
[3] H. Alshear and E. Horlait, “An optimized Adaptive Broadcast Scheme for Inter-Vehicle Communications”, IEEE Vehicular Technology Conference, Stockholm, Sweden, May 2005.
[4] M. Torrent-Moreno, D. Jiang and H. Hartenstein, “Broad-cast reception rates and effects of Priority Access in 802.11-Based Vehicular Ad-Hoc Networks”, Proceed-ings of the 1st International Workshop on Vehicular Ad Hoc Networks, ACM, pp 10-18, Philadelphia, PA, USA, October 2004.
[5] J. Blun, A. Eskandarian and L. Hoffman, “Challenges
Figure 3: Channel utilization with present protocol
Parameters ValueSimulation Area 1000m * 1000mNumber of Vehicles 5Average speed of Vehicles 16 metre/secondTransmission Range 250mMAC Protocol 802.11 DCF

• 205
of Intervehicle Ad Hoc Networks”, IEEE Transactions of Intelligent Transportation Systems, Vol. 5, No. 4, December 2004.
[6] Q. Xu, T. Mak and R. Sengupta, “Vehicle-to-Vehicle Safety messaging in DSrC”, in Proc ACM VANET, Philadelphia, October 2004.
[7] C. Koner, P. K. Bhattacharjee, C. T. Bhunia, U Maulik, “A Novel Approach for Authentication Technique in mobile Communications”, International Journal of Computer Theory and Engineering, Singapore, vol. 1, no. 3, pp. 225-229, August, 2009.
[8] Harshvardhan P. Joshi, Mihail L. Sichitiu, and Maria Kihl, “Distributed Robust Geocast Multicast Routing for Inter-Vehicle Communication”, in Proc. of the First Workshop on WiMAX, Wireless and Mobility, (Coimbra, Portugal), May 2007.
[9] H.Alshearand, E.Horlait, An Optimized Adaptive Broad-cast Scheme for Inter. Vehicle Communication, in Proc. Ieee Vehicular Technology Conference (Ieee VTC 2005. Spring), Stockholm,Sweden,May2005.
[10] J.Blum, A.Eskandarian ,and L.Hoffman: Challenges of Intervehicle AdHocNetworks, Ieee Transactions of Intelligent Transportation Systems, Vol.5, No 4, Decem-ber2004.
[11] S. Y.Ni, Y. C.Tseng,Y.S.Chen,and J.P.Sheu. TheBroadcast Storm Problem in a mobileAdHoc Network, in Proc. ACM/IEEEMobiComm,1999.
[12] Young-Bae Ko, Nitin H. Vaidya, “Location-Aided Rout-ing (LAR) in Mobile Ad Hoc Networks,” Volume 6, Issue 4 (July 2000) Pages: 307 - 321 Year of Publication: 2000 ISSN: 1022-0038 in Proc. of MobiCom, 1998;
[13] Abdelmalik Bachir and Ahderrahim Benslimane, “A multicast protocol in ad hoc networks: Inter-vehicles
geocast,” in Proc. of the 57th IEEE Vehicular Technol-ogy Conference, vol.4, (Korea), pp. 2456-2460, April 2003.
[14] Utpal Roy, Bhaskar Das, Pijush Kanti Bhattacharjee and Achintya K. Mandal, “Secured Geocast Routing Protocol in VANeT (Vehicular Ad-Hoc Network),” Proceedings of the International Conference on Computing and Sys-tems-2010, pp 64-68, November 2010.
[15] Papadimitratos, P., Gligor, V. and J-P. Hubaux. Securing Vehicular Communications –Assumptions, Require-ments and Principles. In Proc. ESCAR, 2006.
[16] Fonseca E. and Festag A., A Survey on Existing Ap-proaches for Secure Ad-hoc routing and Their Applica-bility to VANETs. Technical Report NLE-PR-2006-19, NEC Network Laboratory 2006.
[17] Raya. M. and Hubaux, The security of Vehicular Ad Hoc Networks, In Proc. SASN, 2005.
[18] Aijaz. A. , Bochow, B. Dotzer F.,Festag. A. Gerlach, M. Kroh. r. and Leinmuller. T. , Attacks on Inter Vehicle Communication Systems – An Analysis , In Proc. WIT 2006.
[19] Raya. M Papadimitratos, P, J-P. Hubaux. Securing Vehicular Communications. In Ieee Wireless commu-nicaton Magazine, 2006.
[20] Harsch, C., Festag, A. and Papadimitratos, P.,“Secure Position-Based Routing for VANETs”. In Proceedings of the 66th IEEE Vehicular Technology Conference, 2007.PP-26-30
Secured Geocast Routing in VANET (Vehicular Ad-Hoc Network) with two stage Efficient Communication Protocol

Fault Tolerance in Chain Formation between Swarm robots
Shanu K rakesh and uzma ArshiM.Tech Computer Science and Engineering, IV SEM
Raipur Institute of Technology, Raipur (C.G.)E-mail: [email protected]
AbstrAct
swarm robotics is a new approach to coordinate the behaviors of large number of relatively simple robots in decentralized manner. this approach emerged on the field of artificial swarm intelligence, as well as the biological studies of insects, ants and other fields in nature, where swarm behavior occurs. As the robots in the swarm have only local perception and very limited local communication abilities, one of the challenges in designing swarm robotic systems with desired collective behavior is to understand the effect of individual behavior on the group performance. Fault-tolerance is an important characteristic for robots to increase their reliability levels. this paper dedicates the research on design and optimization of interaction rules for a group of foraging robots when there is some faults occurs in one or more robots. In this paper, first I have proposed an efficient spiral move for gathering of robots and then I have utilized PsO to tolerate the fault.
Keywords: swarm robotics, path formation, swarm intelligence, particle swarm intelligence, fault tolerance
I. INTroDuCTIoN
When creating artificial system, like robots, designers face problem of solving tasks which are beyond the capabilities of a single individuals. one possibility is to create multi-purpose, complex and monolithic robots that are able to tackle the desired tasks alone. Although this solution seems to be the simplest way, it is limited when it comes to robustness, flexibility and scalability. An alternative approach is the so called swarm intelligence: drawing inspiration from natural systems like social insects, it tries to overcome the problems outlined above by creating a flexible swarm of simple individuals. using methods such as decentralization of control, limited communication abilities among individuals and the use of local information only, complex behavior emerges at colony level. Swarm intelligence systems exhibit the desired characteristics like flexibility and robustness, while remaining manageable on a local level [1],[2],[12]. Swarm robotics is the application of Swarm intelligence to robotics, using a swarm of relatively simple robots to tackle complex problems. Swarm robotics is a novel approach to the coordination of large numbers of robots. It is inspired from the observation of social insects- ants, termites and bees-which stand as fascinating examples of how a large number of simple
individuals can interact to create collectively intelligent systems that are beyond the capabilities of a single [3]. Particle swarm optimization (PsO) is a population -based stochastic optimization technique that can be used to find an optimal, or near optimal, solution to a numerical and qualitative problems that was developed by Kennedy and eberhart in 1995 [5], inspired by social behavior of bird flocking or fish schooling. By analyzing the previous work, in Chain Based Path Formation of Swarm Robots [5], which mentions that multiple robots are randomly move to search the Nest, after perceived the Nest robots can self organizing in a chain and again move randomly to search the Prey. This task is used for exploration and navigation works by swarm robots. one of the challenging tasks in the task of chain formation is fault tolerance. Since the communication range of the robots are very weak, when a robot gets faulty it could affect all the other robots. I will propose an approach to tolerate the fault for one or more faulty robots. using that approach the remaining non-faulty robots can communicate and rebuild the chain. Consequently, the models adopted in the studies [6],[7],[8],[9],[10] assume the robots to be relatively weak and simple. Specifically, these robots are generally assumed to be dimensionless, oblivious, anonymous and with no common coordinate system, orientation or scale, and no explicit communication. Each robot operates in simple “look-compute-move” cycles [10]. The basic model studied in e.g., [7],[8],[10],[11] vary in two attributes . The first is Timing Models which have three types: 1) Fully-synchronous model,2) Semi-synchronous model, 3) Asynchronous model. The second attribute is orientation models, referring to the local views of the robots in terms of their x-y coordinates. Elaborating on [3], the following five sub-models of common orientation levels are: 1) Full-compass, 2) Half-compass, 3) Direction-only, 4) Axes-only, 5) No-compass.
II. ProPoSeD WorK
This section introduces the issues of fault tolerance in swarm robotics. robots in swarms make use of local communication for collectively navigating across an arena. If there are one or two faulty robots, there is a little impact on the rest of the swarm. However, if many of the robots fail, then it will has a serious impact on the rest of the swarm. To help in addressing those issues, I would like to use the idea of Particle Swarm optimization to tolerate the fault, which occurs during the

• 207
chain formation of swarm robots. As highlighted in [4] swarm robots chain formation,
robots behavior can be detailed as Search, explore, Chain, and Finished. The author summarized that a robot swarm can form a chain in following manner:-1) Initial position: In this position all the robots are
positioned at different places, and start moving randomly to search the nest,
(2) Gathering at the Nest: After perceive the Nest robots can start self organizing chain,
(3) Formed chain: After perceives the Prey chain (path) is formed.
Fig.1: (a) Initial Position. (b) Gathering at the Nest (c) Formed chain
2) Initially robots can measure an angle “x0” with their X coordinates and move some steps towards the finding of best position (optimum solution) from their initial position.
3) If nest can perceive then robot gather at the Nest, else robot can add an angle “y0” with its previous angle x0 = (x0+ y0) and move steps towards the finding of best position.
4) Continue step 2 and step 3 until all the robots gathered at the Nest.
1) Searching the Nest: - In the first step all the robots are in active position, for reducing the time consuming (in previous work robots may take infinite time to search the Nest) all the robots can move spirally from their initial position. In this move robot may take few time but at least they can find the Nest.
2) Gathering at the Nest: - After spirally move towards the nest, all the robots gathered at nest. We assume that the nest have a prior knowledge about the direction of Prey. Because in previous paper not mention about position and direction of Prey, so robots could make chain but move like blind on the field and there is no time limit to find the Prey, so it may be time consuming also.
3) Chain Formation: - After gathered at the Nest robots can
In the previous work of chain formation by swarm robots [5] there are many loop holes. In case a robot becomes faulty in a chain, then all robots moves back to the Nest, from where they can then start to follow a different chain. At the start the robots are moving randomly in the arena which seems to be time consuming and it may happens that robots may take huge amount of time in searching the nest if it goes on searching around the sides of the arena and may required to be direction the robot manually in the desired direction which is the NeST. This paper will introduce an approach which will overcome the previous paper’s loop hole. If robots get faulty in the chain then the chain will be broken. Instead of going back to the Nest to follow a different chain, I will try to restore the chain of robots.So I have proposed that robot can move spirally from their origin point (initial position) towards the searching of the NeST.For this spiral approach some steps are mentioned: -1) All the robots have their fixed ‘X’ and ‘Y’ coordinates.
Fig.2: robots moving spirally towards the nest
Fig 3: (a) spiral move first step (b) spiral move second step
Fault Tolerance in Chain Formation between Swarm Robots
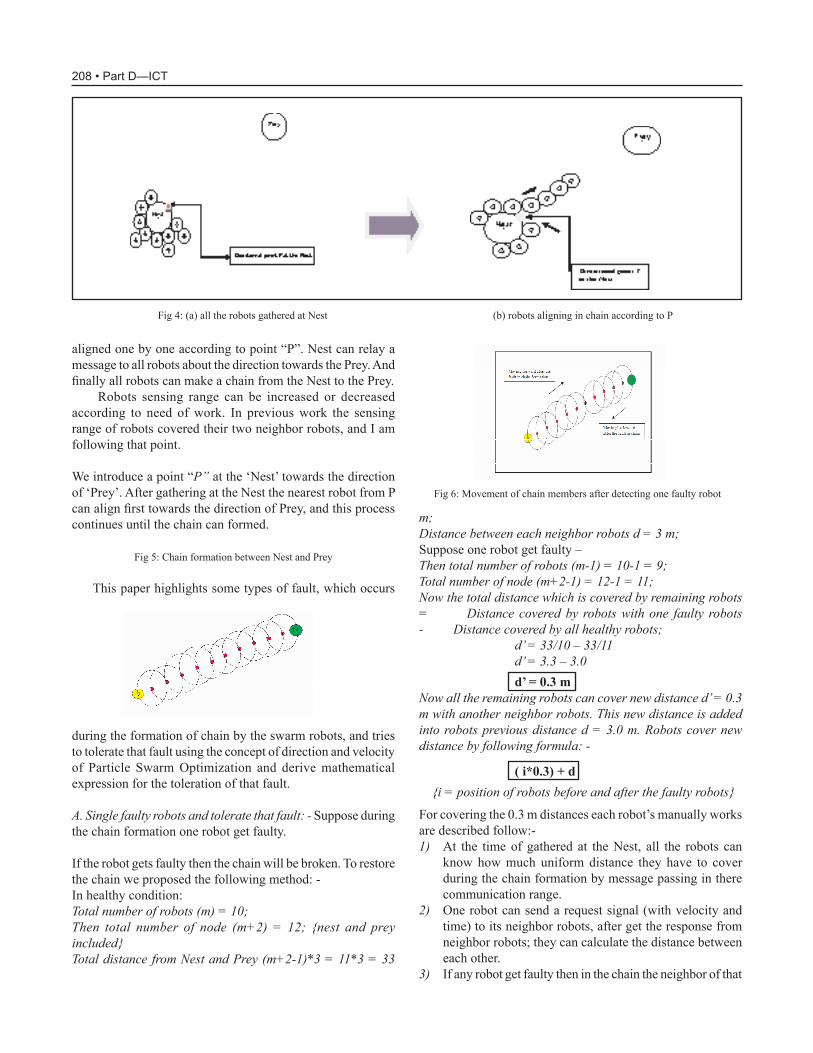
208 • Part D—ICT
aligned one by one according to point “P”. Nest can relay a message to all robots about the direction towards the Prey. And finally all robots can make a chain from the Nest to the Prey. robots sensing range can be increased or decreased according to need of work. In previous work the sensing range of robots covered their two neighbor robots, and I am following that point.
We introduce a point “P” at the ‘Nest’ towards the direction of ‘Prey’. After gathering at the Nest the nearest robot from P can align first towards the direction of Prey, and this process continues until the chain can formed.
Fig 5: Chain formation between Nest and Prey
This paper highlights some types of fault, which occurs
m;Distance between each neighbor robots d = 3 m;Suppose one robot get faulty – Then total number of robots (m-1) = 10-1 = 9;Total number of node (m+2-1) = 12-1 = 11;Now the total distance which is covered by remaining robots = Distance covered by robots with one faulty robots - Distance covered by all healthy robots;
d’ = 33/10 – 33/11d’ = 3.3 – 3.0 d’ = 0.3 m
Now all the remaining robots can cover new distance d’ = 0.3 m with another neighbor robots. This new distance is added into robots previous distance d = 3.0 m. Robots cover new distance by following formula: -
( i*0.3) + d i = position of robots before and after the faulty robots
For covering the 0.3 m distances each robot’s manually works are described follow:-1) At the time of gathered at the Nest, all the robots can
know how much uniform distance they have to cover during the chain formation by message passing in there communication range.
2) one robot can send a request signal (with velocity and time) to its neighbor robots, after get the response from neighbor robots; they can calculate the distance between each other.
3) If any robot get faulty then in the chain the neighbor of that
Fig 4: (a) all the robots gathered at Nest (b) robots aligning in chain according to P
during the formation of chain by the swarm robots, and tries to tolerate that fault using the concept of direction and velocity of Particle Swarm optimization and derive mathematical expression for the toleration of that fault.
A. Single faulty robots and tolerate that fault: - Suppose during the chain formation one robot get faulty.
If the robot gets faulty then the chain will be broken. To restore the chain we proposed the following method: - In healthy condition: Total number of robots (m) = 10;Then total number of node (m+2) = 12; nest and prey includedTotal distance from Nest and Prey (m+2-1)*3 = 11*3 = 33
Fig 6: Movement of chain members after detecting one faulty robot

• 209
faulty robot can send to message to his healthy neighbor robots “ one robot is get faulty , move forward in same direction with some extended velocity”. This message will pass to every healthy in the chain.
4) Then robots can calculate their new extended covering distance.
5) The robot which is the neighbor of the nest will positioned number 1 after get the message about faulty robot, and move forward to cover the 0.3 m distance, then new distance between this robot and next neighbor robot(number 2) will be 3 – 0.3 = 2.27 m.
6) So the next robot (number 2) can move two step of 0.3 m distance for cover the total 3.3 m distance.
7) Number 3 robot from the nest can move 3 step forward to cover 0.3 m distance, and this process will continue with each robots.
8) In Prey side same algorithm can work but difference is robot can move back words direction from the Prey to cover the 0.3 distance with each robots.
Fig 8: Robot maintains the 3.667m distance from each neighbor robot to restore the chain.
III. CoNCLuSIoNS
In this paper, first I have proposed an efficient spiral move
[2] Bonabeau, E., Dorigo, M., and Theraulaz, G. (1999). Swarm Intelligence: From Natural to Artificial Systems. oxford university Press, New york.
[3] Dorigo, M. and Sahin, E. (2004). Guest editorial. special issue: Swarm robotics. Autonomous robots, 17:111–113.
[4] Nouyan, S., Campo, A., and Dorigo, M. (2008). Path formation in a robot swarm. Selforganized strategies to find your way home. Swarm Intelligence, 2(1):1–23.
[5] J. Kennedy and R. C. Eberhart, “A new optimizer using particle swarm theory”, In Proc. 6th Int. Symp. OnMicroMachine and Human Science, pp. 39-43, 1995.
[6] Sugihara, K. and Suzuki, I.: Distributed Algorithms for Formation of Geometric Patterns with many mobile robots. robotic Systems 13 (1996) 127–139
[7] Suzuki, I. and Yamashita, M.: Distributed Anonymous mobile robots: Formation of Geometric Patterns. SIAm J. on Computing 28 4 (1999) 1347–1363
[8] Prencipe, G.: Corda: Distributed Coordination of a Set of Atonomous Mobile Robots. In Proc. 4th European research Seminar on Advances in Distributed Systems, May 2001, 185–190
[9] Prencipe, G.: Instantaneous Actions vs. Full Asynchronicity: Controlling and Coordinating a Set of Autonomous Mobile Robots. In Proc. 7th Italian Conf. on Theoretical Computer Science, October 2001, 185–190.
[10] Suzuki, I. and Yamashita, M.: Distributed Anonymous Mobile Robots – Formation and Agreement Problems. In Proc. 3rd Colloq. on Structural Information and Communication Complexity (1996) 313–330
[11] Cohen, R. and Peleg, D.: Robot Convergence via Center-of-Gravity Algorithms. In Proc. 11th Colloq. on Structural Information and Communication Complexity (2004) 79–88.
[12] Beni, G. and Wang, J. (1989). Swarm intelligence in cellular robotic systems. In Proceedings of the NATo Advanced Workshop on Robots and Biological Systems, Tuscany, Italy. NATO Scientific Affairs Division.
[13] B. Werger and M. Mataric. Robotic Food Chains: externalization of State and Program for minimal-Agent Foraging. In P. Maes, M. Mataric, J.-C. Meyer, J. Pollack, and S.-W. Wilson, editors, From Animals to Animats, Proceedings of the 4th International Conference on Simulation of Adaptive Behavior, pages 625634. MIT Press, Cambridge, MA, 1996.
[14] Alan F.T. Winfield and Julien Nembrini : Safety in numbers: fault-tolerance in robot swarms.
for gathering of robots and then utilized Particle Swarm optimization to tolerate the fault, which occurs during the chain formation of swarm robots.
The region is obstacle less, we have used concept of Swarm robots where the robots are very simple, weak, identical, autonomous, memoryless and performs similar algorithm. each robot operates in simple “look-compute-move” cycles. I have assumed that each robot follows Asynchronous Timing model and No Compass orientation model. The robots can have two states: active and sleep.
In this work I have use limited number of robots which tolerate two to three numbers of faults. In future this can be extended for large number of robots and which can handle more number of faults.
reFereNCeS[1] Bonabeau, E., Dorigo, M., and Theraulaz, G. (2000).
Inspiration for optimization from social insect behaviour. Nature, 406(6791):39–42.
Fault Tolerance in Chain Formation between Swarm Robots

Comparing Different methodologies for Protecting In-trusion Detection Systems
marjan Kuchaki rafsanjaniDepartment of Computer Science
Shahid Bahonar University of Kerman. Kerman, Iran e-mail: [email protected]
Noushin rakhshanDepartment of Computer Engineering
Islamic Azad University, Science and Research Branch, Kerman, Iran
AbstrAct
One of the important aspects of Intrusion Detection sys-tems (IDs) is the security of these systems. because of an intrusion detection system has some vulnerabilities that maybe many intruders and attackers use from these points to design their maliciousness behaviours and attacks, so, many different approaches have proposed to discover these vulnerabilities and improve them. In this paper, we examine the proposed methodologies in order to protecting IDss. We classify them and also identify some important metrics to compare them. We consider the most important approaches and methodologies that have proposed as yet and select metrics with attention to weakness and strength aspects of each method.
Keywords-intruder; Intrusion Detection System (IDS); protec-tion method; security
I. INTroDuCTIoN
Today computer networks have important role in communica-tion and information transfer. In this situation, some profiteer people attempt to access to specific centers or confidential information of other persons to receive their malicious goals. Hacker, cracker and intruder are some of these persons that intend to intrude systems and break security of them. So protect confidentiality in computer networks that communicate with external world, is essential [1]. Because of it is impossible to make computer systems and networks without vulnerabilities and break security points, intrusion detection is an important goal that pursue in computer networks.
Intrusion detection is the process of monitoring the events occurring in a computer system or network and analyzing them for signs of intrusions, defined as attempts to compromise the confidentiality, integrity, availability, or to bypass the security mechanisms of a computer or network [2]. Intrusion Detec-tion Systems are increasingly a key part of defense systems. They originated as a mechanism for meaning the detection of system misuse through the analysis of activity [3]. An IDS is responsible for identify and detect all of un-permission use of systems through both internal and external users [4].These secure systems are generally use beside of firewall to increase security.
Because of their important role in defense system, sophis-ticated system attackers may attempt to disable an intrusion detection systems or take over its capabilities, so that the IDS becomes part of the attackers own arsenal, thus it is important to ensure survivability of malicious attacks [3] .
This paper identifies three major classes of approaches and some of their methods to improve the intrusion detec-tion systems vulnerabilities and compare them in different aspects.
II. EXISTING APPROACHES TO PROTECT INTRU-SIoN DeTeCTIoN SySTemS (IDS)
We can divide existing approaches for improving IDS’s vul-nerabilities to three categories: access control strengthening, detection and identification obstructing, and fault tolerance through redundancy.
A. Access control strengthening methods As the name of this classification indicates, these methods
seek to improve IDS survivability through use of stronger access control methods. right operation of an IDS involves interactions between several components, usage of sensor data collected from different locations, and interaction between the IDS and the oS. Controlling which components or processes are allowed to communicate with other components in the IDS, as well as which data can be trusted by the IDS, is very important to mitigate several vulnerabilities [3]. Some major methods of this class are:
1) Low water-mark mandatory access control: This method proposed by Onabuta et.al.[4], it is an IDSs kernel-level protection mechanism that protects not only log files but also the IDS’s own processes and it based on limited access mode definition for hosts, users and any other that utilize the network. main purpose is to restrict the access to the IDS, so that it will help prevent attackers from gaining direct access. In this mandatory access control, all subjects (e.g., users and programs) and objects (e.g., files and directories) have respective sensitivity labels, and whether a subject can ac-cess an object or not is decided based on its sensitivity label. Any subject cannot modify the sensitivity label. For example, LomAC, is one of the mandatory access control methods that is based on the Low Water-mark model, for maintaining a secure area in an operating system and uses a simple model

• 211
which has two security classes such as the LoW_LeVeL and the HIGH_LeVeL and maintain data integrity.
2) Trust mechanisms for hummingbird: A bitmap-based access control list: This method proposed by evans and Frinke [5] to control which sites (host/network) are trustable at what level. Hummingbird’s main objective is to gather data about possible security problems and organize it in an easy-to-comprehend format. However, unlike most security tools, Hummingbird can compile data about multiple workstations, even when on different networks by running a local “hummer” on each workstation. This enables system administrators to react more quickly to security threats. Hummingbird’s core has three parts:
• message Distribution unit (mDu): Communicates with other hummers.
• Data Distribution unit (DDu): Decides what other hummers should be sent which data.
• Data Collection unit (DCu): uses data collection modules to collect data.
Hummingbird’s trust system boils down to a bitmaps of attributes. one one-bit column exists for each attribute, and one host’s attributes are stored in each row. A value of one in an attribute column indicates that the host possesses that particular attribute. Hummingbird uses two bitmaps, one for incoming messages and another for outgoing messages.
B. Obstructing methods obstructing and obscuring methods as applied from the
perspective of the IDS are intended to make it more difficult for an attacker to notice the presence of an IDS. obscurity can be provided by many means – for instance, either by hid-ing as many aspects of an IDS as possible, or by creating the “false” appearance of one form of IDS in order to prevent an attacker from discovering the actual IDS in place [3]. Some major methods of this class are described below:
1) Write-once media: This method is one of the first methodologies that proposed for protecting Log Files. The strategy of this method is to write log-info that provide by logger component of IDSs into an external media .Since the information recorded in the media is impossible to alter, then log-info cannot be altered. So these are insist on protecting log files but not processes of an IDS. However, these methods require to put additional hardware and system administrators have to change the media manually [6].
2) Trust-host: In this method the log-info is to transfer to another reliable host computer, so if an attacker recognize the IDS position and attempt to attack to IDS host ,we can be assured that log-info are in secure. However, these require another computer to keep the log-info; and also we must ensure that the log-info is transferred correctly without any loosing [6].
3) Encryption methods: These methods are to use encryp-tion [7][8]. It makes it harder for the intruder to alter the log-info and it enables to detect alteration. Although encryption
mechanisms provide some functions to detect modification of log files, encryption is not efficient since the system itself fre-quently updates and modifies the files. However these methods are useless when the intruder deletes the log-info files. The lost log-info cannot be restored. A cryptographic system can only be as strong as the encryp-tion algorithms, digital signature algorithms, one-way hash functions, and message authentication codes, it relies on. With breaking any of them, you’ve broken the system. Just as it’s possible to build a weak structure using strong materials, it’s possible to build a weak cryptographic system using strong algorithms and protocols.
4) NIST1 : Use encrypted tunnels for silent, reliable moni-toring of attackers: This method proposed by Bace and Mell [3][2] indicates the need for silent and reliable monitoring of attackers; If an IDS broadcasts alarms and alerts in plaintext over the monitored network, careful attackers or well-written automated attack code can easily detect the presence of the IDS, So the suggestion in this method is to hide and authenti-cate IDS communications to secure and ensure the reliability of the IDS.
5) NIGELOG2 : This method proposed by Takada and Koike [6], the strategy is to increase the difficulty for an attacker who seeks to corrupt log-files by making multiple copies and placing those copies in arbitrary locations and then periodically moving them around. NIGeLoG keeps watching not only the original log-file but also the backups in a short period; this make possible to detect alteration of the log-files quickly and when alteration of the original or the backups is detected, the log-info is automatically restored from other correct backups. Because of this, it is impossible to always provide correct log-info for IDS or administrators. NIGeLoG protect the logging information more securely and therefore the intrusion detection systems become more reliable.
6) Random hopping techniques: A mobile agent based method: This method proposed by Bhattacharya and ye [3][9], the strategy is remotely installed and launched dynamically an IDS agent at a specific site for a given duration. This IDS agent randomly hops over a set of sites so that no single site is vulnerable for a prolonged period. These methods increase scalability and fault tolerance against DoS attacks. Attackers might compromise such a system by attacking all sites or a selected set of sites at the same time.
C. Fault tolerance through redundancyThis classification is the use of fault tolerance through
means such as redundant agents or reconfiguration. These methods primarily seek to mitigate results of a successful at-tack rather than preventing the attack from occurring. Some major methods of this class are:
1) Intrusion detection using autonomous agents: This method proposed by Spafford and Zamboni [10]; AAFID (Autonomous Agent For Intrusion Detection) is a distributed
1 National Institute of Standards and Technology 2 “NIGE” in Japanese means “run away”.
Comparing Different Methodologies for Protecting Intrusion Detection Systems

212 • Part D—ICT
intrusion detection system developed in CerIAS at Pardue university which makes good use of the fault tolerance through redundancy. Because agents are independently-running enti-ties, they can be added, removed and reconfigured without altering other components and without having to restart the intrusion detection system. Agents both collect and analyze information independently and this prevents the single point of failure. These agents are organized into layers further enhanc-ing the scalability of service attacks. Four components of this architecture are: agents, filters, transceivers and monitors. An AAFID system can be distributed over any number of hosts in a network. each host can contain any number of agents that monitor for interesting events occurring in the host. Agents may use filters to obtain data in a system-independent man-ner. All the agents in a host report their findings to a single transceiver. Transceivers are per-host entities that oversee the operation of all the agents running in their host. They have the ability to start, stop and send configuration.
2) An intrusion tolerance approach for protecting network infrastructures: This method proposed by Cheung [11], the strategy is to reconfigure the system to avoid using components that are diagnosed as misbehaving and presents an intrusion tolerance approach for protecting network infrastructures. This approach includes the following functions:
• Cooperating network components to detect attacks that are beyond the capability of any single compo-nent.
• System diagnosis to identify misbehaving network components.
• Automated response to prevent misbehaving compo-nents from affecting other components or to restore the operational status of a system by system recon-figuration.
III. DISCuSSIoN
We have presented table I that shows how different method-ologies fit under different categories also compare different approaches according to many metrics. These metrics gathered through the most important weakness and strength points of the methods that discuss in previous sections, thus they can compare the discussed methods in some different aspects properly.
IV. CoNCLuSIoNS
The security of an intrusion detection system because of its important role in systems defense is very important and many different methodologies have proposed to satisfy the security. each of these methods has some weakness and strength points, but it is important that we can select an appropriate approach to survive IDS against attackers with due attention to metrics that we select based on different features of the network and system.
reFereNCeS
[1] D. J. Brown, B. Suckow, and T. Wang, “A Survey of Intrusion Detection Systems”, Department of Computer Science, university of California, San Diego San Diego, CA 92093, USA, 2002.
[2] R. Bace, P. Mell, “Intrusion detection systems,” NIST Special Publication on Intrusion Detection Systems, SP 800-31, 2001.
[3] D. Yu and D. Frincke, “Towards Survivable Intrusion Detection System,” Proc. of the 37th Annual Hawaii International Conference on System Sciences, 2004, pp. 10.
[4] T. Onabuta, T. Inoue, and M. Asaka, “A Protection Mechanism for an Intrusion Detection System Based on Mandatory Access Control”, Society of Japan Journal, 2001.
[5] J. Evans and D. Frincke, “Trust Mechanisms for Hum-mingbird”, magazine Crossroads, Special Issue on Com-puter Security, vol. 2, no. 4, March 1996.
[6] T. Takada and H. Koike, “NIGELOG: Protecting Logging Information by Hiding Multiple Backups in Directories”, Proc. of the International Workshop on electronic Com-merce and Security (in conjunction with DEXA’99), IEEE CS Press, Sep. 1999, pp.874 -878.
[7] B. schneier and j. Kelsey, “Cryptographic Support for Secure Logs on untrusted mechines,” Proc. of The Seventh USENIX Security Symposium, USENIX press, 1998, pp.53-62.
[8] Core SDI : Secure Syslog, http:// www.core-sdi.com/eng-lish/slogging/ssyslog-dl.html.
[9] S. Bhattacharya and N. Ye , “Design of Robust, Survivable Intrusion Detection Agent”, Proc. of the 1st Asia-Pacific Intelligent Agent Technology Conference (IAT’99),1999, pp.274 – 278.
[10] E. H. Spafford and D. Zamboni, “Intrusion detection using autonomous agents”, Computer Networks, vol. 34, no. 4, Oct. 2000, pp. 547–570.
[11] S. Cheung, “An Intrusion Tolerance Approach for Pro-tecting Network Infrastructures.” Ph.D. Dissertation, University of California, Davis, Sept. 1999.

• 213
TABLE I. Comparison of methodologies for protecting IDSs
Comparing Different Methodologies for Protecting Intrusion Detection Systems

A Profound Survey on Data-centric routing Protocols for Wireless Sensor Networks Samir Agarwal#1, Susant K. Satpathy#2, Lokesh K. Sharma*3
#Computer Science Engineering, 3Information Technology and MCA,#,* Rungta College of Engineering & Technology, Bhilai, India,
[email protected] 2 [email protected]@yahoo.com
AbstrAct
recent advances in wireless sensor networks have led to many new protocols specifically designed for sensor networks where energy awareness is an essential consider-ation. Most of the attention, however, has been given to the routing protocols since they might differ depending on the application and network architecture. this paper surveys recent data centric routing protocols for sensor networks , we have summarized recent research results on data rout-ing in sensor networks which comes under data-centric category We also included whether the protocol is utilizing data aggregation or not.
Index Terms— routing Protocols, Data-centric, Data Ag-gregation.
I. INTroDuCTIoN
rECENT advances in micro-electro-mechanical Systems (memS) and low power and highly integrated digital electronics have led to the development of micro sensors [1][2][3][4][5]. Such sensors are generally equipped with data processing and communication capabilities. The sensing cir-cuitry measures ambient condition related to the environment surrounding the sensor and transforms them into an electric signal. Processing such a signal reveals some properties about objects located and/or events happening in the vicinity of the sensor. The sensor sends such collected data, usually via ra-dio transmitter, to a command center (sink) either directly or through a data concentration center (a gateway). The decrease in the size and cost of sensors, resulting from such techno-logical advances, has fueled interest in the possible use of large set of disposable unattended sensors. Such interest has motivated intensive research in the past few years addressing the potential of collaboration among sensors in data gathering and processing and the coordination and management of the sensing activity and data flow to the sink.
However, sensor nodes are constrained in energy supply and bandwidth. Such constraints combined with a typical de-ployment of large number of sensor nodes have posed many challenges to the design and management of sensor networks. These challenges necessitate energy-awareness at all layers of networking protocol stack. The issues related to physical and link layers are generally common for all kind of sensor
applications, therefore the research on these areas has been focused on system-level power awareness such as dynamic voltage scaling, radio communication hardware, low duty cycle issues, system partitioning, energy aware mAC protocols [6][7][8][9][10]. At the network layer, the main aim is to find ways for energy efficient route setup and reliable relaying of data from the sensor nodes to the sink so that the lifetime of the network is maximized.
In this paper, we will explore the routing mechanisms for data centric sensor networks developed in recent years. each routing protocol is discussed which comes under data-centric category. our aim is to help better understanding of the current data-centric routing protocols for wireless sensor networks and point out issues that can be subject to further research.
II. DATA-CeNTrIC ProToCoLS
In many applications of sensor networks, it is not feasible to assign global identifiers to each node due to the sheer number of nodes deployed. Such lacks of global identification along with random deployment of sensor nodes make it hard to select a specific set of sensor nodes to be queried. Therefore, data is usually transmitted from every sensor node within the deployment region with significant redundancy. Since this is very inefficient in terms of energy consumption, routing protocols that will be able to select a set of sensor nodes and utilize data aggregation during the relaying of data have been considered. This consideration has led to data-centric routing, which is different from traditional address-based routing where routes are created between addressable nodes managed in the network layer of the communication stack.
In data-centric routing, the sink sends queries to certain re-gions and waits for data from the sensors located in the selected regions. Since data is being requested through queries, attribute based naming is necessary to specify the properties of data. SPIN [25] is the first data-centric protocol, which considers data negotiation between nodes in order to eliminate redundant data and save energy. Later, Directed Diffusion [18] has been developed and has become a breakthrough in data-centric routing. Then, many other protocols have been proposed either based on Directed Diffusion [26][27][28] or following a similar concept [16][24][29][30]. In this section, we will describe these protocols in details and highlight the key ideas.

• 215
A. Flooding and GossipingFlooding and gossiping [31] [33] [34] are two classical
mechanisms to relay data in sensor networks without the need for any routing algorithms and topology maintenance. In flood-ing, each sensor receiving a data packet broadcasts it to all of its neighbors and this process continues until the packet arrives at the destination or the maximum number of hops for the packet is reached. on the other hand, gossiping is a slightly enhanced version of flooding where the receiving node sends the packet to a randomly selected neighbor, which picks another random neighbor to forward the packet to and so on. Although flooding is very easy to implement, it has sev-eral drawbacks, see figures 1 and 2 redrawn from [25]. Such drawbacks include implosion caused by duplicated messages sent to same node, overlap when two nodes sensing the same region send similar packets to the same neighbor and resource blindness by consuming large amount of energy without con-sideration for the energy constraints [25]. Gossiping avoids the problem of implosion by just selecting a random node to send the packet rather than broadcasting. However, this cause delays in propagation of data through the nodes.
Fig. 1. The implosion problem Node A starts by flooding its data to all of
exchange data between nodes. These are: ADV message to al-low a sensor to advertise a particular meta-data, REQ message to request the specific data and DATA message that carry the actual data. Fig. 3, redrawn from [25], summarizes the steps of the SPIN protocol.
Fig. 3. SPIN Protocol. Node A starts by advertising its data to node B (a). Node B responds by sending to node A (b). After receiving the requested
data (c), node B then sends out advertisements to its neighbours (d), who in turn send requests back to B (e-f).
its neighbours. D gets two same copies of data eventually, which is not necessary.
Fig. 2. The overlap problem. Two sensors cover an overlapping geographic region and C gets same copy of data from these sensors.
A. Sensor Protocols for Information via NegotiationSPIN [25] is among the early work to pursue a data-centric routing mechanism. The idea behind SPIN is to name the data using high level descriptors or meta-data. Before transmission, meta-data are exchanged among sensors via a data advertise-ment mechanism, which is the key feature of SPIN. each node upon receiving new data, advertises it to its neighbors and interested neighbors, i.e. those who do not have the data, retrieve the data by sending a request message. SPIN’s meta-data negotiation solves the classic problems of flooding such as redundant information passing, overlapping of sensing areas and resource blindness thus, achieving a lot of energy efficiency. There is no standard meta-data format and it is assumed to be application specific, e.g. using an application level framing. There are three messages defined in SPIN to
A. Directed DiffusionDirected Diffusion [18][19][33][34] is an important milestone in the data-centric routing research of sensor networks. The idea aims at diffusing data through sensor nodes by using a naming scheme for the data. The main reason behind using such a scheme is to get rid of unnecessary operations of net-work layer routing in order to save energy. Direct Diffusion suggests the use of attribute-value pairs for the data and que-ries the sensors in an on demand basis by using those pairs. In order to create a query, an interest is defined using a list of attribute-value pairs such as name of objects, interval, dura-tion, geographical area, etc. The interest is broadcast by a sink through its neighbors. each node receiving the interest can do caching for later use. The nodes also have the ability to do in-network data aggregation, which is modeled as a minimum Steiner tree problem [23]. The interests in the caches are then used to compare the received data with the values in the inter-ests. The interest entry also contains several gradient fields. A gradient is a reply link to a neighbor from which the interest was received. It is characterized by the data rate, duration and expiration time derived from the received interest’s fields. Hence, by utilizing interest and gradients, paths are established between sink and sources. Several paths can be established so that one of them is selected by reinforcement. The sink resends the original interest message through the selected path with a smaller interval hence reinforces the source node on that path to send data more frequently. Fig. 4, redrawn from [18], sum-marizes the Directed Diffusion protocol.
A Profound Survey on Data-centric Routing Protocols for Wireless Sensor Networks

216 • Part D—ICT
(a) Interest propagation (b) Initial gradients setup (c) Data delivery along reinforced
Fig. 4. Directed diffusion protocol phases.
Path repairs are also possible in Directed Diffusion. When a path between a source and the sink fails, a new or alterna-tive path should be identified. For this, Directed Diffusion basically reinitiates reinforcement by searching among other paths, which are sending data in lower rates. Ganesan et al. [32] suggest employing multiple paths in advance so that in case of a failure of a path, one of the alternative paths is chosen without any cost for searching for another one. There is of course extra overhead of keeping these alternative paths alive by using low data rate, which will definitely use extra energy but more energy can be saved when a path fails and a new path should be chosen.
A. Energy-aware RoutingShah et al. [29][32] proposed to use a set of sub-optimal
paths occasionally to increase the lifetime of the network. These paths are chosen by means of a probability function, which depends on the energy consumption of each path. Network survivability is the main metric that the approach is concerned with. The approach argues that using the minimum energy path all the time will deplete the energy of nodes on that path. Instead, one of the multiple paths is used with a certain probability so that the whole network lifetime increases. The protocol assumes that each node is addressable through a class-based addressing which includes the location and types of the nodes.
The described approach is similar to Directed Diffusion in the way potential paths from data sources to the sink are dis-covered. In Directed Diffusion, data is sent through multiple paths, one of them being reinforced to send at higher rates. on the other hand, Shah et al. select a single path randomly from the multiple alternatives in order to save energy. Therefore, when compared to Directed Diffusion, it provides an overall improvement of 21.5% energy saving and a 44% increase in network lifetime. However, such single path usage hinders the ability of recovering from a node or path failure as opposed to Directed Diffusion.
B. Rumor RoutingRumor routing [26] is another variation of Directed Diffu-
sion and is mainly intended for contexts in which geographic routing criteria are not applicable. Generally Directed Diffu-sion floods the query to the entire network when there is no geographic criterion to diffuse tasks. However, in some cases there is only a little amount of data requested from the nodes and thus the use of flooding is unnecessary. An alternative ap-
proach is to flood the events if number of events is small and number of queries is large. rumor routing is between event flooding and query flooding. The idea is to route the queries to the nodes that have observed a particular event rather than flooding the entire network to retrieve information about the occurring events.
In order to flood events through the network, the rumor routing algorithm employs long lived packets, called agents. When a node detects an event, it adds such event to its local table and generates an agent. Agents travel the network in order to propagate information about local events to distant nodes. When a node generates a query for an event, the nodes that know the route, can respond to the query by referring its event table. Hence, the cost of flooding the whole network is avoided. rumor routing maintains only one path between source and destination as opposed to Directed Diffusion where data can be sent through multiple paths at low rates.
C. Gradient-Based RoutingSchurgers et al. [27] have proposed a slightly changed
version of Directed Diffusion, called Gradient-based routing (GBR). The idea is to keep the number of hops when the inter-est is diffused through the network. Hence, each node can dis-cover the minimum number of hops to the sink, which is called height of the node. The difference between a node’s height and that of its neighbor is considered the gradient on that link. A packet is forwarded on a link with the largest gradient.
The authors aim at using some auxiliary techniques such as data aggregation and traffic spreading along with GBR in order to balance the traffic uniformly over the network. Nodes acting as a relay for multiple paths can create a data combining entity in order to aggregate data. on the other hand, three different data spreading techniques have been presented: • Stochastic Scheme: When there are two or more next hops
with the same gradient, the node chooses one of them at random.
• Energy-based scheme: When a node’s energy drops below a certain threshold, it increases its height so that other sen-sors are discouraged from sending data to that node.
• Stream-based scheme: The idea is to divert new streams away from nodes that are currently part of the path of other streams.
D. CADRConstrained anisotropic diffusion routing (CADR) [28]
is a protocol, which strives to be a general form of Directed Diffusion. Two techniques namely information-driven sensor querying (IDSQ) and constrained anisotropic diffusion routing (CADr) are proposed. The idea is to query sensors and route data in a network in order to maximize the information gain, while minimizing the latency and bandwidth. This is achieved by activating only the sensors that are close to a particular event and dynamically adjusting data routes.
IDSQ is based on a protocol in which the querying node can determine which node can provide the most useful informa-tion while balancing the energy cost. While IDSQ provides a
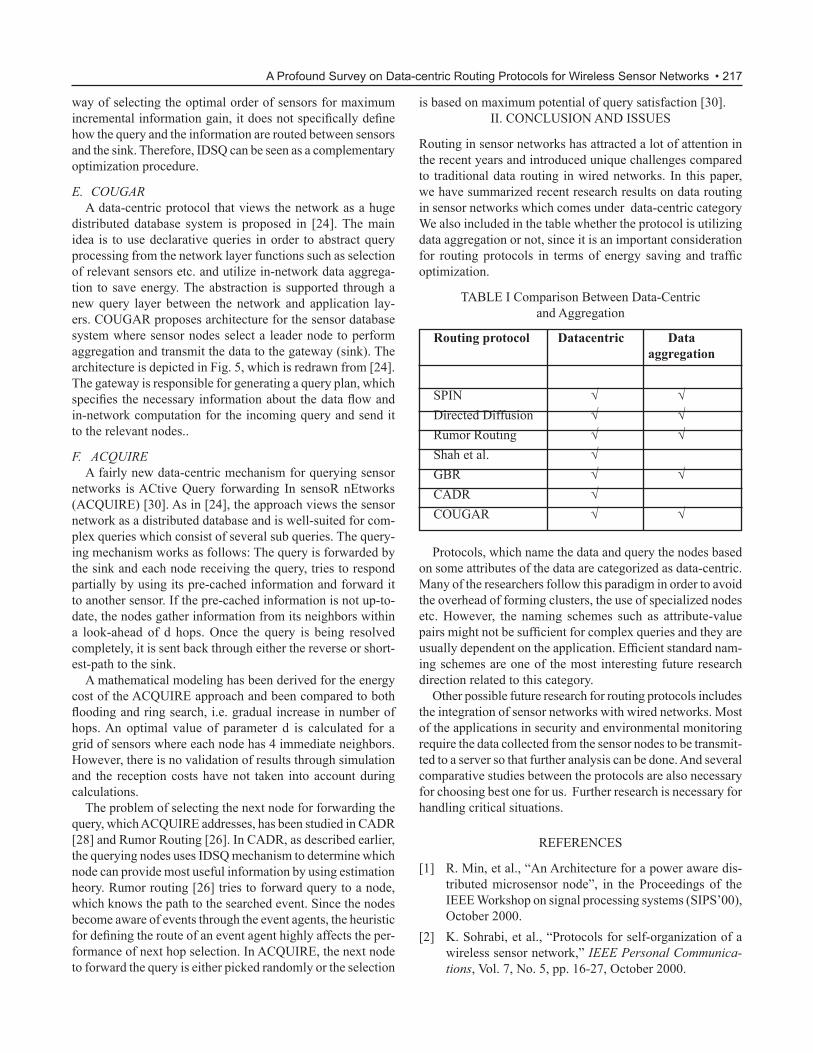
• 217
way of selecting the optimal order of sensors for maximum incremental information gain, it does not specifically define how the query and the information are routed between sensors and the sink. Therefore, IDSQ can be seen as a complementary optimization procedure.
E. COUGARA data-centric protocol that views the network as a huge
distributed database system is proposed in [24]. The main idea is to use declarative queries in order to abstract query processing from the network layer functions such as selection of relevant sensors etc. and utilize in-network data aggrega-tion to save energy. The abstraction is supported through a new query layer between the network and application lay-ers. CouGAr proposes architecture for the sensor database system where sensor nodes select a leader node to perform aggregation and transmit the data to the gateway (sink). The architecture is depicted in Fig. 5, which is redrawn from [24]. The gateway is responsible for generating a query plan, which specifies the necessary information about the data flow and in-network computation for the incoming query and send it to the relevant nodes..
F. ACQUIREA fairly new data-centric mechanism for querying sensor
networks is ACtive Query forwarding In sensoR nEtworks (ACQUIRE) [30]. As in [24], the approach views the sensor network as a distributed database and is well-suited for com-plex queries which consist of several sub queries. The query-ing mechanism works as follows: The query is forwarded by the sink and each node receiving the query, tries to respond partially by using its pre-cached information and forward it to another sensor. If the pre-cached information is not up-to-date, the nodes gather information from its neighbors within a look-ahead of d hops. once the query is being resolved completely, it is sent back through either the reverse or short-est-path to the sink.
A mathematical modeling has been derived for the energy cost of the ACQUIRE approach and been compared to both flooding and ring search, i.e. gradual increase in number of hops. An optimal value of parameter d is calculated for a grid of sensors where each node has 4 immediate neighbors. However, there is no validation of results through simulation and the reception costs have not taken into account during calculations.
The problem of selecting the next node for forwarding the query, which ACQUIRE addresses, has been studied in CADR [28] and Rumor Routing [26]. In CADR, as described earlier, the querying nodes uses IDSQ mechanism to determine which node can provide most useful information by using estimation heory. Rumor routing [26] tries to forward query to a node, which knows the path to the searched event. Since the nodes become aware of events through the event agents, the heuristic for defining the route of an event agent highly affects the per-formance of next hop selection. In ACQUIRE, the next node to forward the query is either picked randomly or the selection
is based on maximum potential of query satisfaction [30].II. CoNCLuSIoN AND ISSueS
routing in sensor networks has attracted a lot of attention in the recent years and introduced unique challenges compared to traditional data routing in wired networks. In this paper, we have summarized recent research results on data routing in sensor networks which comes under data-centric category We also included in the table whether the protocol is utilizing data aggregation or not, since it is an important consideration for routing protocols in terms of energy saving and traffic optimization.
TABLE I Comparison Between Data-Centric and Aggregation
routing protocol Datacentric Data aggregation
SPIN √ √ Directed Diffusion √ √ rumor routing √ √ Shah et al. √ GBR √ √ CADr √ CouGAr √ √
Protocols, which name the data and query the nodes based on some attributes of the data are categorized as data-centric. many of the researchers follow this paradigm in order to avoid the overhead of forming clusters, the use of specialized nodes etc. However, the naming schemes such as attribute-value pairs might not be sufficient for complex queries and they are usually dependent on the application. Efficient standard nam-ing schemes are one of the most interesting future research direction related to this category.
other possible future research for routing protocols includes the integration of sensor networks with wired networks. most of the applications in security and environmental monitoring require the data collected from the sensor nodes to be transmit-ted to a server so that further analysis can be done. And several comparative studies between the protocols are also necessary for choosing best one for us. Further research is necessary for handling critical situations.
reFereNCeS
[1] R. Min, et al., “An Architecture for a power aware dis-tributed microsensor node”, in the Proceedings of the IEEE Workshop on signal processing systems (SIPS’00), October 2000.
[2] K. Sohrabi, et al., “Protocols for self-organization of a wireless sensor network,” IEEE Personal Communica-tions, Vol. 7, No. 5, pp. 16-27, October 2000.
A Profound Survey on Data-centric Routing Protocols for Wireless Sensor Networks

Implementation of AES as a Reconfigurable Crypto-graphic system using MicroBlaze & Xilinx ISE
Mr. M. P. Jaiswal1, Dr. G.G. Sarate2.Electronics and Telecommunication Engineering Department,Government College of Engineering Amravati. (M. S.), India. e-mail : [email protected], [email protected].
AbstrAct
In this paper implementation of AES as a recon-figurable cryptographic system is described. With some proposed techniques, an optimized structure of AEs is discussed. the implementations of AES are described as a reconfigurable hardware approach of embedded system using Microblaze scP. A Microblaze is a soft-core processor especially de-signed for Xilinx field programmable gate arrays.
Keywords: Advanced encryption Standard (AeS), Soft-core Processor (SCP), System-on-Chip (SoC), VLSI, Chiper.
I. INTroDuCTIoN
Cryptographic applications are becoming increasingly more important in today’s world of data exchange. Big volume data needs to be transferred from one location to another through communication path but exposes to attackers. Cryptography means hidden writing, the practice of using encryption to con-ceal text. The security of conventional encryptions depends on several factors. First, the encryption algorithm must be power-ful enough that is impractical to decrypt a message on the basis of cipher text alone. Beyond that, the security depends on the secrecy of the key, not the secrecy of the algorithm. That is, it is assumed that is also impractical to decrypt a message on the basis of the cipher text plus knowledge of the encryption or decryption algorithm. Cryptography services are essential in order to provide the authentication, privacy, non-denial and integrity of private data being transmitted.
Since privacy issues and network security are emerging due to the wide internet penetration, the research in cryptography and application of crypto graphical algorithms is increas-ing. Not only the algorithm reliability, but also the speed of performance and implementation ?exibility are considered as major factors for improvement. recon?gurable hardware with general purpose processors are considered as a good candidate for speeding up the performance and are capable of recon?guration without execution interrupting.
A FPGA based embedded systems are well suited for use with recon?gurable hardware and coprocessors because the FPGA supplies the logic resources required to build them. These accelerators provide the computational power needed to improve the competitiveness of the modest microprocessors usually found in programmable logic designs. The advances in reconfigurable hardware create the possibility of developing a microchip with application-specific soft core processors.
In this paper we try to discuss AeS as one of the cryp-tographic techniques and its transformation [1], various implementation techniques of AES [2] and Microblaze SCP for reconfigurable hardware which operates under system-on-chip environment [5]. For implementation of AES a MicroBlaze SCP and Xilinx IES techniques are proposed. The Xilinx ISE provides facility of pure hardware approach, while Xilinx EDK provides software plus hardware approach. For design purpose VHDL hardware description language is used for pure hardware approach and embedded C is used for configure MicroBlaze SCP. The implementation of proposed techniques in this paper will provide a step to design a com-plete cryptographic system processor for security application in embedded system.
II. AeS
The AeS a round-based, symmetric block cipher was stan-dardized by NIST as Advanced encryption Standard (AeS) in November 2001[1]. The AES is the preferred algorithm for implementations of cryptographic protocols that are based on a symmetric cipher. It is not only used to secure data transfers between small, mobile consumer products, but it is also used in high end servers.
AES has a block size of 128 bits and key lengths of 128, 192, and 256 bits. According to the key length, these variants of the AES are called AES-128, AES-192, and AES-256. As key size increases the number of sequence of the execution of AeS transformation is also increases. This article mainly focuses on implementing the AES-128, which is the most commonly used AeS variant shown in Fig. 1. However, the shown block diagram can also be used for the other standard-
ized key sizes.Fig 1 Block diagram of AES
The following section and subsections describes the AeS transformations, which are the building blocks of AeS encryp-tions and decryptions.

• 219
AEs transformationsThe AES takes a 128-bit data block as input and performs several different transformations on this block. In case of an encryption, the input block of the AeS is called plaintext and the returned block is called ciphertext. All intermediate results of this block, as well as the input and the output block, are called states. For a discussion of the different transforma-tions, executed on the 128-bit states in an AES encryption or decryption, it is best to picture a state as a 4-by-4 matrix of bytes. A 128-bit input/output block of the AES is mapped to an AES state by putting the first byte of the block in the upper left corner of the matrix and by filling in the remaining bytes column by column as shown in Fig. 2.
the state by a simple bitwise XOR operation. The AddRound Key transformation is self-inverting.
• subbytes transformationThe SubBytes transformation is a non-linear byte substi-tution that operates independently on each byte of the state using a substitution table (S-box). This S-box, which is inve-rtible, is constructed by composing two transformations:
i) Take the multiplicative inverse in the Galois Field GF(28) with the irreducible polynomial m(x)= x8+x4+x3+x+1. The element 00 is mapped to itself.
ii) Apply the affine transformation (over GF(2)): The inverse of SubBytes transformation, which is needed for decryption, is the inverse of the affine transforma-tion followed by the same inversion as the SubBytes transformation.
• shiftrows transformationThe Shiftrows transformation rotates each row of the in-put state to the left, the offset of the rotation corre-sponds to the row number. The inverse of this trans-formation is computed by performing the corresponding rotations to the right.
• Mixcolumns transformationThe mixColumns transformation operates on the State column-by-column, treating each column as a four term polynomial. The columns are considered as polynomials over GF (28) and multiplied modulo x4 + 1 with a fixed polynomial a(x), given by
a(x) = 03x3 + 01x2 + 01x + 02The coefficients of a(x) are also elements of GF(28) and are represented by the hexadecimal values in this equation. The inverse mixColumn Transformation is the multiplica-tion of each column with a-1(x) = 0Bx3 + 0Dx2 +09x +0E modulo x4 +1
III. ImPLemeNTATIoN oF AeS
AeS can be implemented either by Pure Software, Pure Hard-ware or both. A pure software approach suffers from low speed and throughput; it is also exposed to viruses and hackers attack which hampers the performance of Crypto System. Hence software implementation cannot offer the physical security for the key of Crypto System.
As an encryption algorithm running on a generalized com-puter has no physical protection, hardware cryptographic de-vices can be securely encapsulated to prevent any modification of the implemented algorithm and also can be embedded the hardware as co-processor in any devices that require data secu-rity processing. In a pure hardware approach an AeS Crypto-Processor design is implemented on hardware (FPGA) with key rAm, which can make not only a forward key scheduling for encryption but also a reversed key scheduling for decryption. This technique can be implemented by using Xilinx ISE s/w
Fig 2 Array of data
AeS encryptions and decryptions are based on four different transformations that are performed repeatedly in a certain se-quence shown in Fig. 3. each of these transfor-mations, which are described in the following map, a 128-bit input state to a 128-bit output state.
Fig 3 Flowchart of AeS transformation
• AddroundKey transformationIn the Addround Key transformation, a round Key is added to
Implementation of AES as a Reconfigurable Cryptographic system using MicroBlaze & Xilinx ISE

220 • Part D—ICT
and Spartan3E xc3s500e-4fg320 h/w. As compared to software implementation, the hardware implementation enhances the physical security as well as speed and outside attackers cannot easily attack, interrupt or modify its operation.
But for different applications of the data encryption algo-rithm may require different key size and speed/area trade-offs. As key size changes the number of execution of sequence also differs. This type of adaptability i.e. ?exibility is not supported by pure hardware approach. Hence designer has to look to-wards new option i.e. hybrid of above two system which gives speed as well as flexibility i.e. reconfiguration which is given by FPGAs based system [5]. A FPGA is idle for the runtime hardware con?guration. But this fact is unacceptable for some of the systems, due to high cost.
Runtime reconfiguration solves the lack of flexibility of systems using hardware acceleration. The advantage of pure software plus hardware approach is that any new application can be loaded at runtime. It can also modify the hardware at runtime. Runtime reconfiguration will still help to reduce the required FPGA area. The main advantage is that recon?guration from one key size to another is done faster than on pure FPGA implementations.
recently the research work is going on for implementing the algorithm with minimum area, linearity, high speed and design flexibility option in VLSI hardware [6]. Hence new ar-chitecture has come which is based on a cooperation between a general purpose core processor and recon?gurable hardware.
This technique can be implemented by using Xilinx EDK s/w in MicroBlaze SCP and Spartan3E xc3s500e-4fg320 h/w. With runtime reconfiguration, only the coprocessor for the currently running process must be loaded in the FPGA. When the process finishes, the area occupied by its coproces-sor could be used to load a new one. This approach is known as system-on-chip which comes under embedded System. This type of embedded system speeds up the performance and provides facility of recon?guration without interrupting present execution.
IV. XILINX MICROBLAZE SCP
MicroBlaze is a 32-bit RISC Harvard-style SCP [5].It is offered with the embedded Development Kit (eDK), the tool provided by Xilinx Inc. to design FPGA-based systems-on-a-chip. The processor architecture includes 32-bit general-purpose registers and an orthogonal instruction set. It features a three-stage instruction pipeline, with delayed branch capability for improved instruction throughput. As it is a SCP, the functional units incorporated into the processor architecture can be cus-tomised in order to ?t as much as possible the target applica-tion. Thus, the barrel shifter unit, hardware divider unit, data cache and instruction cache are optionally instantiated along with the processor. Also, in FPGAs with embedded multipli-ers, a multiplication unit is available. A typical system based on MicroBlaze is shown in Fig. 4.
Fig. 4. MicroBlaze system
The eDK toolkit allows the designer to easily create plat-forms based on either MicroBlaze or PowerPC-405. EDK
provides many peripherals (uArTs (universal asynchronous receiver transmitters), timers, ethernet, memory controllers, general purpose I/O (input/output) and so on) and an intercon-nection solution based on IBM’s Core Connect bus fabrics [5]. The GNU compiler tools for MicroBlaze and PowerPC-405 is used in the software ?ow. The source code for the application can be written in high-level languages, such as C and CPP, as well as in assembly language.
Three types of systems can be implemented by an em-bedded cipher system based on MicroBlaze. The ?rst type of embedded system consists of the SCP without any customised core, that is, a complete software solution. The other two types of embedded systems integrate a customised user core, which implements the complete ciphering algorithm in order to increase the application performance. The former uses the OPB bus to connect the cipher module as external peripheral, whereas the latter uses the same hardware implementation but using the FSL interface to connect it as coprocessor.
Fig. 5 describes the architecture core of AES. This core can implement fully unrolled and pipelined approach which gives very high clock frequency. A key generator unit is designed to generate the different sub-keys employed in each round. In the proposed MicroBlaze based cryptographic systems, the design
Fig. 5 Architecture of AES core.

• 221
efforts have been minimized and the performance obtained is suitable to execute secure applications with high throughput.
Designers can use FPGAs to create efficient hardware de-signs, as many systems, require a combination of both software and hardware. SCPs give designers the ?exibility to con?gure the processors and facilitate those designers to quickly build FPGA systems incorporating one or more processors and coprocessors.
V. CoNCLuSIoN
FPGA-based systems are able to combine general purpose microprocessors and dedicated hardware cores as a system-on-a-chip solution. Some factors limit the impro-vement of the performance in FPGA-based embedded system. This technol-ogy provides high data transfer rate of the interface between the embedded processor and the con?-gurable logic. It’s also provides speed of the embedded processor and the memory bandwidth. one of the most important bottlenecks of this technology is the bandwidth and the latency of the interface connecting the embedded processor to the recon?gurable logic. Thus, in a MicroBlaze-based system, the ?exibility offered by FPGAs can be used to notably increase the throughput of secure applications.
reFereNCeS
[1] National Institute of Standards and Technology (NIST), Federal Information Processing Standard 197, “The Advanced Encryption Standard (AES)”, Nov. 2001.
http://csrc.nist.gov/publications/fips/fips197/fips-197
[2] Liang Deng and Hongyi Chen, “A New VLSI Imple-menta-tion of the AES Algorithm”,vol 2 pp 7803-7547, IEEE.
[3] S. Mangard; M.Aigner; S. Dominikue, “A Highly Regu-lar and Scalable AeS Hardware Architecture,” Ieee Transactions on Computers, volume 52 pp.483- 491, April 2003.
[4] X. Zhang and K. K. Parhi, “Implementation approaches for the advanced encryption standard algorithm,” Ieee Circuits Syst. Mag., vol. 2, no. 4, pp. 24–46, 2002.
[5] I. Gonzalez and F.J. Gomez-Arribas, “Ciphering algo-rithms in Micro-Blaze-based embedded systems,” Iee Proc.-Comput. Digit. Tech., Vol. 153, No. 2, March 2006.
[6] Raoel Ashruf, Georgi Gaydadjiev, Stamatis Vassiliadis, “Recon?gurable Implementation for the AES Algo-rithm”, IEEE 2004.
[7] Ivan Gonzalez, Estanislao Aguayo Sergio Lopez-Buedo, “Self-Reconfigurable Embedded Systems On Low-Cost FPGAS,” IEEE 2007
[8] J. Viejo, M. J. Bellido, A. Millan, E. Ostua J. Juan, P. Ruiz-de-Clavijo and D. Guerrero, “Efficient Design and Implementation on FPGA of a MicroBlaze Peripheral for Processing Direct electrical Networks measurements,” IEEE 2006.
Implementation of AES as a Reconfigurable Cryptographic system using MicroBlaze & Xilinx ISE

Current Status and Future Scope of ICT in Chhattisgarhmr. Devendra Kumar Singh
Asst. Prof. (Computer Sci. & Engg.)I.T., G. G. V., Bilaspur (C.G.)
E-mail: [email protected]
Mr. Nishant BeharAsst. Prof. (Computer Sci. & Engg.)
I.T., G. G. V., Bilaspur (C.G.)E-mail: [email protected]
AbstrAct :
In this paper we are discussing the current status and future scope of Information and Communication Technology (ICT) in Chhattisgarh, and how it is beneficial for local peoples. our C.G. government is trying to convey the facilities and information by this important technology to each and every person of the state. So, Information and Commu-nication Technology (ICT) is one of the prime important medium. Across 44% forest area where the people resides are yet untouched by modern technologies. Chhattisgarh State with wide-ranging socio-economic Disparities is now witnessing the ongoing Information Technology (IT) revolu-tion. The Government of Chhattisgarh visions ‘ Vikas mool mantra,Aadhar loktantra’ (‘Driving Development through Demo-cratic Governance’) and believes Information and Communica-tion Technology is one of the particular important medium for the state.
1) INTroDuCTIoN oF e-GoVerNANCe?
E-Governance refers to government’s use of information technology to exchange information and services with citizens, businesses, and other arms of government. e-Governance has been used by the legislature, judiciary, or administration, in order to improve internal efficiency, the delivery of public services, or processes of democratic governance and the citizen to government interaction including the feed back of policies. The primary delivery models given by government are Government-to-Citizen or Government-to-Customer (G2C), Government-to-Business (G2B) and Government-to-Government (G2G) & Government-to-Employees (G2E). The most important anticipated benefits of e-government include improved efficiency, convenience, and better accessibility of public services. By e-Government to improve the effective-ness, efficiency, service delivery and to promote democracy. By use of e-Governance can access transform citizen service, provide access to information to empower citizens, enable their participation in government and enhance citizen economic and social opportunities, so that they can make better lives, for themselves and for the next generation.
2) WHAT IS ICT? :
ICT means Information of Communication Technology. It is working by the e-governance and use as a powerful source of information transmitter to the end user. An overwhelming proportion of the population of the state is depending upon agri-culture and forest for their basic livelihood. Despite significant bottlenecks of limited access to market related information, monsoon forecasts, government schemes, information on modern farming practices, etc agriculture and forest contribute significantly to the State’s income. The State of Chhattisgarh recognizes the importance of Information and Communication Technology (ICT) as a key enabler in its economic develop-ment and improving the quality of life.
3) ComPoNeNTS oF ICT
a) LOcAL ArEA NEtWOrKs (LAN): LAN is a local area network. A network of computers that are in the same general physical locations, within a building or a campus. LAN works on the small area for the fast data sharing. b) MEtrOPOLItAN ArEA NEtWOrKs (MAN): metropolitan Area Networks (mAN) works on the particular of one city. mAN covered on large area compared of LAN. We can data transmit from the long distance so that we can use this network. We can communicate of our one city. metropolitan network is part of regional sub network.c) WIDE ArEA NEtWOrKs (WAN): WANs were de-veloped to communicate over a large geographical area (e.g. lab-to-lab; city-to-city; east coast-to-west coast etc). WANs require the crossing of public right of ways (under control and regulations of the interstate commerce and institute of telephone and data communications established by the govern-ment and international treaties).d) INtErNEt : Internet is use for access information from company website. All organisations can provide data by the internet, so that this information we can access by the internet. Internet can connect World Wide Web. e) INtrANEt: By use this technology we can access information from on a small area or one building. Intranet is a personal internet service for particular organisation em-ployee.f) WIrELEss LAN: By use this technology we can access

• 223
information by wireless device. This transmission is possible by satellite. By this technology we can get information only by receiver device and send data by sender device.
4) APPLICATIONS OF ICT IN DIFFERENT AREA oF CHHATTISGArH
A) E-Gram suraj : In e-Gram Suraj project, a specific application for Panchayat & Rural Development Department using indigenous handheld device called Simputer has been developed. The Sarpanchs, with the help of Simputers, are being given decision making support with the help of robust application and data base. This data base helps in reflecting villagers’ assessment on sectors like knowledge, health care, livelihood, social justice and entitled cultural natural resource. The relevant information is made available to the Sarpanchs in local language (Hindi) through a Simputer based on an open source platform which has the capability of easy data entry, storage and retrieval. By use of e-Gram Suraj supports automation of various schemes like Swarna Jayanti Rozgaar Yojana (SJRY), Sampoorna Gram Swarozgaar Yojana (SGSY), and rural Housing Scheme.b) bHUINYAN (Online Land Records):The non-vector part of the land record viz Khasra and B1 etc. are already automated in most of the States. However, the digitisation of Naksha or the vector part of land record has been the biggest challenge and not yet accomplished by any State Government. As a part of GIS, all the land records have been digitized in the State of Chhattisgarh. The digitisation process included utili-sation of remote sensing satellite maps, scanning of existing cadastral maps, vectorisation of cadastral maps, geo-referenc-ing of cadastral maps & adding attribute information to it. c) bIO-tEcHNOLOGY: Chhattisgarh has prominent position in the information technology sector, and is on the way to create a knowledge society where access to information and knowledge would be symmetric amongst all seekers and users. The rich forests, livestock, large number of varieties of medicinal and aromatic plant, animals and fish resources etc are the key components, which can fulfill the need of these industries. By efforts to adopt scientific methods in agriculture, animal husbandry and Fisheries to improve quality and socio economic growth of farmers. D) GEOGrAPHIcAL INFOrMAtION sYs-tEM (GIs) : A Geographical Information System (GIS) having 70 layers was developed with technical help from Indian Space research organization (ISro) through regional remote Sensing Centre (rrSSC), Nagpur. The objective of GIS included inter-alia road Information System, Georefer-encing of villages (cadastral maps), integration of thematic information and socio-economic data for the generation of action plans, generation of comprehensive plan for water and land resources development and generation of watershed wise site-specific and area-specific action plans for easy implemen-tation by local bodies. Some of the important layers included geomorphology, litho logy, transport, soil slope, drainage,
watershed, forest etc. E) cOMMON sErVIcE cENtErs(csc): The CSC is one of three pillars of strategic foundation of the National e-Gov-ernance Plan (NeGP), approved by the Central Government as one of its mission mode Plans (mmPs). The CSCs would provide high quality and cost-effective voice and data content and services, in the areas of e-governance, education, health, telemedicine, entertainment as well as other private services. We can see the diagram Fig. (1) For clear understand the steps for Gramin CHoiCe centre.
Fig.(1): CHoiCe, Chhattisgarh F) GYAN VINIMAY (E-cLAssrOOM) : The e-Class-room (“Gyan Vinimay”) project adopts an integrated view of the e-learning system where online lectures and onsite training programmes are synergized. under this project very high bandwidth video conferencing connectivity (2 mbps broadband) between IIT Kanpur and engineering Colleges at Raipur and Bilaspur & Government Science Colleges at Rai-pur, rajnandgaon, Kurud and Kawarda have been established. By use of e-classroom is being instrumental in overcoming the faculty shortage and expertise gap. e-classroom upgrading the capacities of faculty for better teaching capabilities. G) cHOIcE (ONLINE G2c sErVIcEs): The Chhat-tisgarh online information system for Citizen empowerment (CHoiCe) is a revolutionary approach to citizen services and provides one stop solution for anywhere-anytime based government. Presently more than 30 G2C and numerous G2B secured services for all the requirements of citizen are being provided. CHoiCe project works on Public Private Partnership model with the help of private persons appointed as CHoiCe agents. By use of CHOiCE centre we can use the Availability of 24x7 online Government Services, Created employment opportunities for the citizens of Chhattisgarh State, Improved the efficiency and efficacy of Government Officers, Capturing of data at CHoiCe centers has enabled departments to allocate more time for efficient Service Delivery, Drastically reduced the application processing time from days to minutes, Curtailed the waiting time for certain documents from 15-20 days to just 1-2 days.
Current Status and Future Scope of ICT in Chhattisgarh

224 • Part D—ICT
LIst OF sErVIcEs IN E-cHOIcE:1) Birth Registration 2) Death Registra-tion3) SC/ST Certificate 4) OBC Certificate4) Income Certificate 6) Domicile Certificate7) Public Grievance 8) Ration Card9) No Dues Certificates 10) Water Tap Connections11) Nakal Document 12) mutation of Property13) Property Tax 14) Gomasta/Trade License 15) Rashtriya Vriddhavastha Pension Yojana16) Akasmita Yojana 17) Rahat Yojana18) Girls Child Benefit Scheme19) No Objection Certificate For Dangerous & Offensive Trade20) No Objection Certificate For Dangerous & Offen-sive Trade
H) E-PrOcUrEMENt: To increase the efficiency and transparency, Government of Chhattisgarh has implemented a comprehensive and end-to-end e-Procurement solution across all Government departments/ agencies/ boards across the State in a phased manner. The e-Procurement project has been imple-mented in five Departments of the State viz; Public Works De-partment (PWD), Water resource Department (WrD), Public Health engineering Department (PHeD), Health Department and Chhattisgarh State Infrastructure Development Corpora-tion (CSIDC). Chhattisgarh infotech and biotech Promotion Society (CHiPS) is the implementing agency for e-Procure-ment project in the State. The major stakeholders involved in the project are:i. Government of Chhattisgarh Departments & Corpora-
tions ii. The political and administrative set-up in the Govern-
ment of Chhattisgarh iii. Supplier & Contractor community across India, who
participate in the procurement activities of GoC iv. Residents of the State of Chhattisgarh & Citizens of
India
the various modules are as given below(i) Indent management (ii) eTendering (iii) eAuctions (iv) Contract management(v) Catalogue management(vi) Centralised Supplier registration (vii) ePayments (viii) Accounting
I) E-cHALAN: e-Challan is a standard form prescribed for government payments as per rules of 7(a) and 8(b) of Chhattisgarh Treasury Code known as CGTC. This format is designed for collection of government payments viz. sales tax, excise duty, professional tax, land revenue etc. from various private institutions, individuals from time to time and is imple-
mented by government departments as per the requirements. J ) E-WOrKs : By use of e-Works we can find out of 137.00 lakh hectares geographical area of Chhattisgarh, 43 % area comes under cultivation. On the basis of climate & topography the state is divided into 3 agro climatic zones. The Bastar Plateau comprises of Bastar, Dantewada, Bee-japur & Narayanpur districts and a part of Kanker (excluding Charama, Narharpur & Kanker Blocks). Northern parts of the state comes under “Northern Hilly Region” which comprises of Sarguja, Koriya & Jashpur Districts. Bilaspur, Raipur, Janjgeer-Champa, Raigarh, Rajnandgaon, Kawardha, Durg, mahasamund, Dhamtari, Korba and parts of Kanker come under “Plains of Chhattisgarh”. K) E-KOsH ONLINE: This is a Comprehensive online System Of Treasury Accounts & Pensions. Every think of budget information are available on a mouse click in computer. Chhattisgarh Govt. wants to open every think for C.G. people. Citizens can get all information by the ICT.l) GENErAL ADMINIstrAtION (G A D): GAD is a system for provide official notsite on in a website. Public can see what is the originality of the work by the notsite. every think is opened and clear for the citizens. What is mention in record of notsite?M) E-OFFIcE: e-office means human workload has re-duce, and work service is fast by the use of computer, because all works has done by the computer. By the use of computer we can search our related information by on a mouse click. All information of office is loaded on computer and sees any time. N) E-GOVErNMENt rOAD MAP: Chhattisgarh is the first State in India which is systematically developing an IT road map. The task of framing an e-Government road map has been initiated in order to identify the various IT needs and priorities of the departments. In phase 1 of the e-Government road map, the e-Government Vision, e-Government Strategy and e-Government Blueprint are being prepared. O) sMArt - cArD bAsED trANsPOrt MANAGE-MENt sYstEM: The Smart-Card based Transport management System is an initiative to automate the issuance of registrations, licenses and permits issued by the Department of Transport, Government of Chhattisgarh. The objectives of the project include automation of the existing manual system, improvement in the quality and level of citizen centric services and ensure a secured and transparent government working system. P) stAtE DAtA cENtEr: The State Data Centre is being planned to provide centralized delivery of services to reach the people in the urban & rural segments. The proposed State Data Centre would provide the infrastructure required for consolidating the databases from the blocks and also for providing online services to citizens at villages / urban areas. The State Data Centre will also provide web services through which information can be shared securely with other key organizations like financial institutions, legal bodies etc.

• 225
Q) cG – sWAN: The Chhattisgarh State Wide Area Net-work (CG-SWAN) is a very ambitious project to provide the State with a basic information technology backbone which will be utilized for carrying voice, data and voice traffic facilitating interdepartmental communication and data sharing within the State. CG-SWAN will be a safe, fast, reliable and cost effective network connecting all the 146 blocks of the State through a hybrid network consisting of Wimax, leased line and other network technologies on a Public-Private Partnership mode and operating on a Build-Operate-Transfer (BOT) model. r) rIGHt tO INFOrMAtION (rtI): rTI is very powerful tool of Indian citizens. By use of RTI we can ask any information which is related to you from any government department. This service is available on each government de-partment. This service is use for clarity of information on office level. Government servant can give the related information of any work at the organization its compulsory.t) E-PAYMENts sEVA : e-Payments Seva is the pay-ment system of bill by online. By can use of this facility because time consuming is very low. We can paid by online: i) ElectricityBill ii) Telephone Bill
5) PROPOSED MODEL OF E-DISTRIBUTIONSySTem For FerTILIZerS:
The Proposed model is for the distribution of fertilizer to the farmers by the Govt. It is well cleared from the proposed model that the supply of fertilizers should be on the basis of Land records. However, currently the Govt. is supplying fertilizer to the farmer are not getting proper amount of fertilizer for their crops. The proposed model will be very suitable to decide the total amount of fertilizer to be supplied to the farmers in a particular session. So that the farmers can achieve the sufficient amount of fertilizer for their crops and can enhance yield capacity. After the proper information of amount of fertil-izer, the farmers can procure through e-Distribution system and this system will avoid deficiency & blackmarketing of fertilizer. We can see this model by
CoNCLuSIoN:
The present research papers deal with the current Status and future scope of ICT in Chhattisgarh state. It clearly indicates how the system will be beneficial for the state citizens. The objective of C. G. government is to reach is up to each and every common people and to provide them climate information and necessary item like seed, fertilizersand other crop related equipment through this system. Since, about 44% of the citizen living in forest based dense remote areas therefore these techniques is very useful to improve the socio economic condition of C.G. citizens. In this paper we have given the detail of e-Governance and its role the development of state Govt. policies and projects.
reFereNCe:
[1] Vittal. N, Dr. Mahalingam S. , Information Technology , Indias Tomorrow, manas Publications, New Delhi – 110002 (India), ISBN: 81-7049-119-3
[2] Johri Amit, Jauhari B. S., Computer Today –Vol- 1, Hi-malaya Publising House, B ombay, Delhi, Nagpur
[3] Web Site of Chhattisgarh Government http://www.chhat-tisgarh.gov.in [Last Accessed on 12/01/2011]
[4] Web Site of CHOiCE of Chhattisgarh Government http://www.choice.gov.in/ [Last Accessed on 12/01/2011]
[5] Miria Pigato ,Senior Economist, AFTM2, Africa Region, The World Bank, August 2001 Information and Com-munication Technology, Poverty, and Development in sub-Saharan Africa and South Asia
[6] Marwah, R. ,The Impact of Information Technology on the Poor in India, August (2000), Mimeo.
[7] Van Crowder, L., ‘Marketing information systems for small-scale farmers’ Information
Fig.(2).Fig(2): Proposed model of e-Distribution System
Current Status and Future Scope of ICT in Chhattisgarh

enhancing Security of Data Transfer over Insecure Channel Through The use of Steganography
1 Ishwar lal Deshmukh 2 Prof. Akhilesh Tiwari1 .M.E (C.T.A), SSCET, Bhilai,, India
2 Project Guide M.E (C.T.A), SSCET, Bhilai,, IndiaE-mail: [email protected], [email protected]
AbstrAct
In today’s world there is a rapid growth in data transmis-sion over the internet but still security is on fly. The security of information has become a core issue. this proposed system encrypts the data with a crypto algorithm and then embeds the encrypted text in an image file. The implant process is done with help of stego-key, and the detection or reading of implanted information is possible only hav-ing this key. The stego-key is used may be user-defined or default not only to facilitate random selection of bytes for hiding message file bits but also is used to encrypt the user data. the encryption method is based on XOring the message bytes with random numbers generated by a pseudo-random number generator whose source is derived from the stego key.
I. INTroDuCTIoN
The network security is becoming more important as the amount of data being exchanged on the Internet is increasing. Security requirements are necessary both at the final end-user and at the middleware, especially since the huge utilization of personal computers, networks, and the Internet with its global availability. Throughout time, computational security needs have been focused on different features: secrecy or confiden-tiality, identification, verification, non repudiation, integrity control and availability.To overcome this problem, some invis-ible information can be embedded in the digital media in such a way that it could not be easily extracted without a specialized technique [2]. Two ways for securing Data independently used. First way is cryptography, where an encryption key is used to jumble the message, this jumbled message is transmitted through the insecure public channel, and the reconstruction of the original, unencrypted message is possible only if the receiver has the appropriate decryption key.
II. CryPToGrAPHy
Cryptography is an important element of any strategy to address message transmission security requirements. In Cryptography basically two techniques are used first one is Substitution cipher & Transposition cipher Cryptology is the science underlying cryptography. Cryptanalysis is the science of ‘breaking’ or ‘cracking’ encryption schemes, i.e. discover-ing the decryption key. Cryptographic systems are generically classified along three independent dimensions [1].
A. Methodology for transforming plain text to cipher text. In substitution method, each element in the plaintext is repre-sented into another element e.g. B. Suggestive approach for number of keys used. There are two approaches, Symmetric &asymmetric cryptog-
raphy. In symmetric key, Cryptography a single key is shared by sender and receiver. In asymmetric cryptography, public and private keys are used by sender and receiver. In this method sender can encrypt the data using public key of receiver and receiver can decrypt using his private key.
C. Methodology for processing plain text. A block cipher processes the input one Block of elements at a time, producing an output block for each input block. A Stream cipher processes the input elements continuously, producing output one element at a time, as it goes along. The proposed algorithm uses a substitution cipher method. It is a symmetric key algorithm using the technique of stream cipher
III. STAGeNoGrAPHy
Steganography derived from Greek word literally means covered writing. It includes vast array of secret communica-tion method that conceals message very existence. Computer based steganography allows us to implant message in different available what are known as digital carriers such as images or sounds. Digital images, videos, sound files, and other computer files that contain perceptually irrelevant or redundant informa-tion can be used as “covers” or carriers to hide secret messages. After implanting a secret message into the cover-image, a so called stego-image is obtained [3]. The basic model of steganography consists of Carrier, mes-sage, and embedding algorithm and Stego key. message is the data that the sender wishes to remain it confidential. The cover-object with the secretly implanted message is then called the Stego-object. This stego object is then transferred to other end, there we have detector algorithm which extract the mes-sage from cover object [3].
Plain text A B C D Cipher text Z Y X W
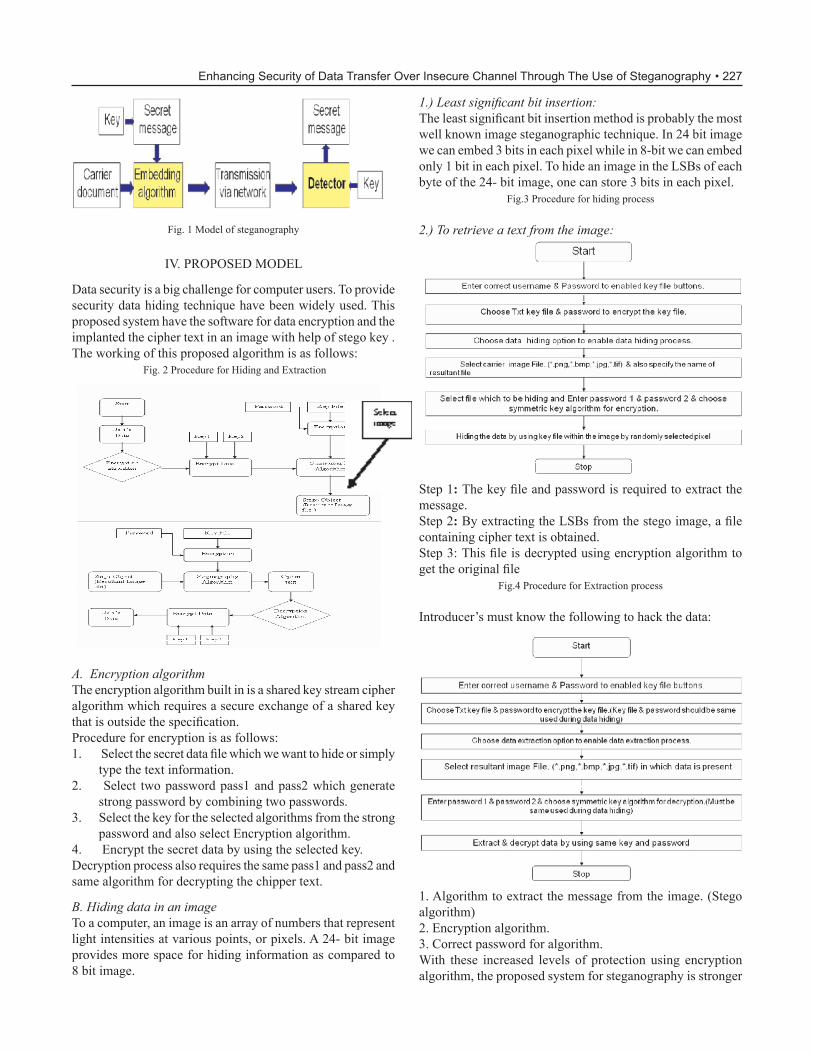
• 227
Fig. 1 model of steganography
IV. ProPoSeD moDeL
Data security is a big challenge for computer users. To provide security data hiding technique have been widely used. This proposed system have the software for data encryption and the implanted the cipher text in an image with help of stego key . The working of this proposed algorithm is as follows:
Fig. 2 Procedure for Hiding and extraction
1.) Least significant bit insertion: The least significant bit insertion method is probably the most well known image steganographic technique. In 24 bit image we can embed 3 bits in each pixel while in 8-bit we can embed only 1 bit in each pixel. To hide an image in the LSBs of each byte of the 24- bit image, one can store 3 bits in each pixel.
Fig.3 Procedure for hiding process
2.) To retrieve a text from the image:
A. Encryption algorithmThe encryption algorithm built in is a shared key stream cipher algorithm which requires a secure exchange of a shared key that is outside the specification. Procedure for encryption is as follows:1. Select the secret data file which we want to hide or simply
type the text information.2. Select two password pass1 and pass2 which generate
strong password by combining two passwords.3. Select the key for the selected algorithms from the strong
password and also select encryption algorithm.4. Encrypt the secret data by using the selected key.Decryption process also requires the same pass1 and pass2 and same algorithm for decrypting the chipper text.
B. Hiding data in an imageTo a computer, an image is an array of numbers that represent light intensities at various points, or pixels. A 24- bit image provides more space for hiding information as compared to 8 bit image.
Step 1: The key file and password is required to extract the message. Step 2: By extracting the LSBs from the stego image, a file containing cipher text is obtained. Step 3: This file is decrypted using encryption algorithm to get the original file
Fig.4 Procedure for Extraction process
Introducer’s must know the following to hack the data:
1. Algorithm to extract the message from the image. (Stego algorithm) 2. encryption algorithm. 3. Correct password for algorithm. With these increased levels of protection using encryption algorithm, the proposed system for steganography is stronger
Enhancing Security of Data Transfer Over Insecure Channel Through The Use of Steganography

228 • Part D—ICT
from attacks than any other existing system
V. SImuLATIoN AND reSuLT
Following images were taken and processed by the application of Digital Steganography and the results are as following:1. Pixel Information before and after stenography process (table 1)2. Histograms of original and resultant image
VI. CoNCLuSIoN
Fig. 5 Carrier Image before hiding
Fig. 6 Secret information which has to be hiding
Fig. 7 Resultant Image after hiding data
Steganography provides many different mechanisms to hide the data. This paper presents an image steganography algo-rithm which uses LSB insertion technique, random number
generation algorithm, region of interest selection. These techniques are used for providing better security for efficient data transmission randomization adds more security to the algorithm. Higher Security is achieved through the use of strong keys during encryption. Higher capacity than any other data hiding method. Simple to use as well as simple way to hide data.
Fig. 8 Original Image Histograms
Fig. 9 Resultant Image histograms
Fig.10 RGB component of the resultant Image

• 229
VII. reFereNCeS
[1] Stinsown, D. “Cryptography: Theory and practice”
[2] Z. Hrytskiv, S. Voloshynovskiy & Y. Rytsar “Cryptog-raphy of Video InformationIn modem communication”, Electronics And Energefics,vol. 11, pp. 115-125, 1998
[3] Neil F. Johnson, Zoran uric, Sushil. Steganography and Watermarking –Attacks and Countermeasures”, Kluwer Academic Press, Norwrll, MA, New York, 2000
[4] C. Cachin, “An Information -theoretic Model for steg-anography”, in proceeding 2nd Information Hiding Workshop, vol.1525, pp.306-318, 1998
[5] J. Zollner, H. Federrath, H. Klimant, et al.,“Modeling the Security of Systems”, Steganographic in 2nd Workshop on Information Hiding, Portland, April 1998, pp. 345-355.proceeding of IEEE, pp. 1062-1078,July1999.
[6] R A Isbell, “Steganography: Hidden Menace or Hidden Saviour”, steganography White Paper, IO May 2002
[7] M. M Amin, M. Salleh, S. Ibrahim, M .R. Katmin, and M. Z. I. Shamsuddin,“ Information Hiding using Steg-
anography”, IEEE 0-7803-7773-March 7,2003
[8] Comprehensive Analysis and Enhancement of Stegano-graphic Strategies for multimedia Data Hiding and Au-thentication Ali Javed, Asim Shahzad, Romana shahzadi, Fahad Khan (IJCNS) International Journal of Computer and Network Security, Vol. 2, No. 3, March 2010.
[9] A New Image Steganography Based On First Component alteration Technique Amanpreet Kaur1, renu Dhir2, and Geeta Sikka3 (IJCSIS) International Journal of Computer Science and Information Security Vol. 6, No. 3, 2009
[10] A Novel Technique for Embedding Data in Spatial Domain , V.madhuViswanatham, Jeswanth Manikonda, (IJCSE) International Journal on Computer Science and Engineering ,,Vol. 02, No. 02, 2010, 233-236
Enhancing Security of Data Transfer Over Insecure Channel Through The Use of Steganography

Webometrics: An emerging Application Area of Web mining
r. K. PandeyUniversity Institute of Computer Science and Applications (UICSA)
R. D. University. Jabalpuremail : [email protected]
AbstrAct
Webometrics is an emerging discipline out of the growth of WWW and publication of the scientific research using the WWW as a vehicle for disseminating, propagating and pub-lishing by the individuals and organizations. Webometrics data has been used to rank the world universities on the web serving as indicators of their academic performance. This paper makes an attempt to compare the webometrics based rankings of World universities with the rankings done using the conventional parameters (non-webometrics) like quality of education, quality of faculty, research output etc. which have been used over the years for the purpose before the web came into existence. The purpose of this study is to understand the correlation between the two rankings done using the different approaches. This paper also discusses the vulnerability and manipulability aspects of webometrics based rankings of the entities like universities or hospitals or something else.Keywords- backlinks, bibliometrics, search engine, Search Engine Optimization (SEO),
I. INTroDuCTIoN
The advent and popularity of the World Wide Web (WWW) has given birth to a new discipline webometrics. Webometrics, is the quantitative study of Web-related phenomena, emerged from the realization that methods originally designed for bib-liometrics analysis of scientific journal article citation patterns could be applied to the web, with commercial search engines providing the raw data [3]. At the heart of webometrics studies is the information provided by the large-scale search engines, such as Yahoo ! (more suitable) or Google, about the structure of the web like total number of pages in a web site and the total number of back-links to the web site etc. This information and other attributes of this information which have been termed as webometrics can serve as indicators to predict the status and performance attributes of these entities which are responsible for generating this information on the web. This webometrics data has been used to rank the World universities to assess their Web based performance which in turn can be interpreted as an indicator of their academic performance as well.
II. DeFINITIoNS
“the study of the quantitative aspects of the construction and use of information resources, structures and technologies on the Web drawing on bibiliometric and informetric approaches.” The term webometrics was first coined by [1]. Another defini-
tion of webometrics has also been introduced by [2], which is “the study of web-based content with primarily quantitative methods for social science research goals using techniques that are not specific to one field of study”, which emphasises a small subset of relatively applied methods for use in the wider social sciences
III. WEBOMETRICS VS BIBLIOMETRICS
Historically the development of quantitative analysis of academic publishing (bibliometrics) was the creation of the Institute for Scientific Information (ISI, now Thomson Reuter) citation database, which started operating since 1962 [4,5] was a major step.
A bibliometricsBibliometrics refers to the measurement of “properties of docu-ments, and document-related processes” [7]. Bibliometric tech-niques include word frequency analysis [8], citation analysis [9], co-word analysis [10] and simple document counting, such as the number of publication by an author or research-group. In practice however, bibliometrics has been primarily applied to science documents and hence has considerable overlap with scientometrics, the science measurement field [6]. The emergence of bibliometrics as a scientific field was triggered by the development of Institute for Scientific Information (ISI) Science Citation Index (SCI) by Eugene Garfield [5]. The SCI was created as a database of the references made by the authors in their articles to the articles published earlier in the top scientific journals [6]. Since then ISI’s SCI served as the main instrument to assess the impact of scholarly work to evaluate or compare the relative scientific contributions of two or more individuals or groups.
b WebometricsWebometrics is the quantitative analysis of web phenom-ena, drawing upon informetric methods [11] and typically addressing problems related to bibliometrics. Webometrics was triggered by the realization that the web is an enormous document repository with many of these documents being academic-related [12]. Moreover, the web has its own citation index in the form of commercial search engines. Some of the search engines are automated thereby enabling the researchers to carry out large-scale investigations [13]. Ranking of world universities [14] which is also the focus of this paper, based upon their web sites and online impact is an excellent example of webometrics application.

• 231
Webometrics includes link analysis, web citation analysis, search engine evaluation and purely descriptive studies of the web [6].
•Link AnalysisLink analysis is the quantitative study of hyperlinks between web pages [6]. The use of links in bibliometrics was triggered by Web Impact Factor (WIF) [15] analogous to Journal Impact Factor (JIF), on the assumption that hyperlinks might be us-able by bibliometrician in a similar way as citations [16]. The standard WIF measures the average number of links per page to a web space from external pages [15]. The idea underlying link analysis was that the number of links targeting an academic web site might be proportional to the research productivity of the organization at the level of university [17], departments [18], research groups [19], or individual scientist [20].
•Web citation AnalysisAs scientific publication moves to the web, and novel ap-proaches to scholarly communication and peer review establish themselves, new methods of citation and link analysis have emerged to capture often liminal expressions of peer esteem, influence and approbation. The web thus affords bibliometri-cians rich opportunities to apply and adapt their techniques to new contexts and content [28].The hypertextual character of the web means that the principles of citation indexing can be applied much more widely than at present. on the web, scholars do more than publish, or post, their working papers and finished articles: they ‘seed ideas, discuss issues and debate positions, in ways which, occasion-ally deviate from, and challenge, established norms’ [21].
search EnginesSearch engines have been the main portal to the web for most users since their inception. Search engines are at the heart of webometrics studies. Two main topics of webometrics research have been the extent of coverage of the web and accuracy of the reported results. Studies of the main search engines have revealed that none covered more than 17.5 % of the indexable web and that the overlap between search engines was surpris-ingly low [26].
IV. meTHoDoLoGy
Comparisons made in this paper between the ranking orders of universities may be just a representative as it is not possible to make an exhaustive comparison between the universities because of number of reasons and difficulties. The list of the ranked universities done by different organizations Table-1, does not include the same set of universities, which causes a difficulty in the comparison process. For the purpose of com-parison we selected four organizations two of which have used webometrics based parameters to rank the universities and two have used traditional parameters, details are given in Table-5. As the number of universities ranked is also not same in the case of all these four organizations, we picked up a sample of first fifty universities from the list of each organisation and is
shown in Table-1 and Table-2. table-1
Webometrics [30] ranking is based upon the following four
metrics. [33]• size (s). Number of pages recovered from four en-
gines: Google, yahoo, Live Search and exalead. For each engine, results are log-normalised to 1 for the highest value.
• Visibility (V). The total number of unique external links received (inlinks) by a site can be only con-fidently obtained from Yahoo Search. Results are log-normalised to 1 for the highest value and then combined to generate the rank.
• rich Files (r). After evaluation of their relevance to academic and publication activities and considering the volume of the different file formats, the fol-lowing were selected: Adobe Acrobat (.pdf), Adobe PostScript (.ps), microsoft Word (.doc) and microsoft Powerpoint (.ppt).
• scholar (sc). Google Scholar provides the number of papers and citations for each academic domain.
These results from the Scholar database represent papers, reports and other academic items.
The four ranks were combined according to a formula where each one has a different weight Table-7.
Indicators and Weights for ArWU
Webometrics: An Emerging Application Area of Web Mining

232 • Part D—ICT
VI. AcADEMIc rANKING OF WOrLD UNIVErsI-tIEs (ArWU) [31]
The ARWU, first published in June 2003 by the Center for World-Class universities and the Institute of Higher education of Shanghai Jiao Tong University, China, and then updated on an annual basis. ArWu uses six objective indicators to rank world universities, including the number of alumni and staff winning Nobel Prizes and Fields medals, number of highly cited researchers selected by Thomson Scientific, number of articles published in journals of Nature and Science, number of articles indexed in Science Citation Index - expanded and Social Sciences Citation Index, and per capita performance with respect to the size of an institution. More than 1000 universities are actually ranked by ArWu every year and the best 500 are published on the web.
VII. times Higher Education (tIMEs) [32] VIII. 4international colleges and Universities (4IcU)
ThE 4ICU ranking is based upon an algorithm including three unbiased and independent web metrics extracted from three different search engines: [29]
1. Google Page rank2. yahoo Inbound Links3. Alexa Traffic Rank
table 4IX. RESULTS
spearman rank correlation 6∑idi
2
rank Correlation the value of rank correlation coefficient rs lies between -1 and 1
X. DISCUSSIONS OF THE RESULTS
Refer to Table-5 the value of rank correlation coefficient for the rank comparison between Webometrics ranking and ArWu ranking is .5277 which is quite significant indicating some
rs= 1 - n(n2-1)
s.No. comparison of ranks rs 1 Webometrics VS ARWU .52772 Webometrics VS TIMES .0333343 Webometrics VS 4ICU .3333334
n=10 total= 110
table-6WEbO =http://www.webometrics.info/ArWU =http://www.arwu.org/ tIMEs =http://www.timeshighereducation.co.uk/
table 5

• 233
agreement between the two rankings. Webometrics ranking is based purely on web based metrics whereas ArWu makes use of non-web based (conventional) parameters to rank the universities. The value of rank correlation coefficient for the comparison between Webometrics and Times is .033334 indi-cating lesser agreement between the two rankings as compared to between Webometrics and ArWu. Times also makes use of non-web based (conventional) parameters to rank the uni-versities. The interesting result is for the ranking comparison between Webometrics and 4icu. The value of rank correlation coefficient in this case is .3333, indicating comparatively lesser agreement between the two ranking despite the fact that 4icu also makes use of web based metrics as Webometrics to rank the universities.
A. Immunity of the Web based rankingsWeb and webometrics is an emerging field. Owners of the commercial web sites understand the significance and value of the ranking of web pages of their web sites. This is how the terms like Search Engine Marketing (SEM) [35] and Search engine optimization (Seo) became the buzzword of the IT industry. At the same time there is a need of caution particu-larly for the organisations which make use of webometrics to rank universities or hospitals or something else, to carefully devise the mechanism so that unethical attempts to influence the ranks are prevented. For example in case of webometrics refer to table-7, 50% weightage is assigned to visibility and 15% to scholar, similarly rest 35% is assigned to Size and Rich files, this 35% is absolutely within the control of the website owners, and thus can be easily manipulated to influence the ranking order. What if all the graduate or undergraduate students are required to submit their assignments through the university web site ? Whereas other 65% assigned to visibility and scholar is out of control of the web site owners therefore more difficult to influence. Out of 65%, 50% is for the visibility that is to be assessed through the search engine indexed pages and count of the backlinks and 15% for the Google scholar which is still in beta stage and produces much faulty results. For example a query run on google scholar for knowing the count of publications of “Vikram University Ujjain” since 2009 reports 3267 publications yet a slightest twist in the query like “Ujjain Vikram University” returns the correct result as 117. There are numerous examples of Google scholar [34] returning quite inflated results. Remaining 50% is liable to be manipulated by unethical search engine optimiza-tion tricks, though search engine company keeps monitoring such attempts, but successes cannot be completely ruled out, thereby influencing the ranking orders.
XI. CONCLUSIONS
A Comparison was made between the rankings of world universities carried out by various profit/non-profit/research organisations on the web. ranking of the universities has been done using the conventional parameters like the research out
put, quality of faculty, patents registered etc. or webometrics parameters. Webometrics is a newly emerging discipline which provides web based parameters like backlinks of a web site, indexed pages in a search engine etc. which may serve as indicators to quantify various quality attributes of the entities like universities. The main purpose was to make a comparison between rankings using the conventional parameters and web based parameters. We also made comparison between two web based rankings (Webometrics vs 4icu) results of which are found to be in little agreement with each other as compared to the results of rankings done using the conventional parameters. We also made caution against the manipulability aspects of web based ranking parameters. In case of Webometrics parameters used for ranking 35% weightage is assigned to the parameters which are in direct control of the web site owners and hence subject to unethical manipulation to influence the rankings. Rest 65% is assigned to visibility (50%) and scholar (15%), the information which is provided by the search engines. It is this 50% weightage assigned for visibility (backlinks) which is a billion dollar business in the search engine marketing, against which the academic institutions will be required to remain alert.
reFereNCeS
1. Tomas C. Almind and Peter Ingwersen (1997). “Infor-metric analyses on the World Wide Web: methodological approaches to ‘webometrics’”. Journal of Documenta-tion 53 (4): 404–426.
2. Mike Thelwall (2009). Introduction to Webometrics: Quantitative Web Research for the Social Sciences. Morgan & Claypool. ISBN 978-1-59829-993-9.
3. M Thelwall, L Vaughan, L Björneborn , Annual Review of Information Science and Technology.
4. B. Thackray and H. B. Brock, Eugene Garfield: history, scientific information and chemical endeavor, In B. Cronin and H. B. Atkins (eds.) The Web of Knowledge: A festschrift in honour of Eugene Garfield (Information Today, inc. ASIS Monograph Series: Medford, NJ, 2000) 11-23.
5. E. Garfield, Citation Indexing: Its theory and applica-tions in science, technology and the humanities (Wiley Interscience, New York, 1979)
6. M. Thelwall, Bibliometrics to Webometrics, Journal of Information Science, 34 (4) 2007 pp.1-18.
7. C. L. Borgman and J. Furner, Scholarly communications and bibiliomet6rics, Annual Review of Information Sci-ence and Technology 36 (2002) 3-72.
8. G. K. Zipf, Human behavior and the principle of least effort: An introduction to human ecology. (Addison Wesley, Cambridge, MA, 1949)
Webometrics: An Emerging Application Area of Web Mining

234 • Part D—ICT
9. H. F. Moed, Citation analysis in research evaluation, Information Science and Knowledge management. (Springer, New York, 2005)
10. L. Leydesdorff, Why words and co-words cannot map the development of the sciences. Journal of the Ameri-can Society for Information Science 48(5) (1997) 418-427.
11. L. Bjorneborn and P. Ingwersen, Toward a basic frame-work for webometrics, Journal of the American Society for Information Science and Technology 55(14) (2004) 1216-1227.
12. T. C. Almind and P. Ingwersen, Informetric analysis on the World Wide Web: methodological approaches to ‘Webometrics’, Journal of Documentation 53(4) (1997) 404-426.
13. P. mayr and F. Tosques, Google Web APIs: An instru-ment for webometric analysis? (2005)
14. I. F. Aguillo et al., Scientific research activity and com-munication measured with cybermetrics indicators, Journal of the American Society for Information Science and Technology 57(10) (2006) 1296-1302.
15. P. Ingwersen, The calculation of Web Impact Factors, Journal of Documentation 54(2) (1998) 236-243.
16. B. Cronin, Bibiliometrics and beyond: some thoughts on web–based citation analysis, Journal of Information Science 27(1) (2001) 1-7.
17. M. Thelwall, Extracting macroscopic information from web links, Journal of American Society for Information Science and Technology 52(13) (2001) 1157-1168.
18. O. Thomas and P. Willet, webometric analysis of depart-ments of librarianship and information science. Journal of Information Science 26(6) (2000) 421-428.
19. F. Barjak and M. Thelwall, A Statistical analysis of the web presences of european life sciences research teams, Journal of the American Society for Information Science and Technology (2008)
20. F. Barjak, X. Li, and M. Thelwall, which factors explain the web impact of scientists’ personal home pages? Journal of the American Society for Information Science and Technology 58 (2) 2007 200-211.

Congestion Control with Congestion Free routers1 Padmadhar mishra 2 Prof. Abha Choubey
1 .M.E (C.T.A), SSCET, Bhilai,, India2 Project Guide M.E (C.T.A), SSCET, Bhilai,, India
E-mail: [email protected] , [email protected]
AbstrAct:
congestion collapse from undelivered packets and unfair allocations of bandwidth between competing traffic flows. we introduce and investigate a novel Internet traffic control protocol called congestion Free router (cFr). the basic principle of cFr is to compare, at the borders of a network, the rates at which packets from each application flow are entering and leaving the network. cFr prevents this scenario by “patrolling” the network’s borders, ensuring that each flow’s packets do not enter the network at a rate greater than they are able to leave the network.
Keyword: CFR, TCP, ECSFQ,WFQ.
I. INTroDuCTIoN
The fundamental philosophy behind the Internet is expressed by the scalability argument no protocol, mechanism, or service should be introduced into the Internet if it does not scale well. A key corollary to the scalability argument is the end-to-end argument to maintain scalability, algorithmic complexity should be pushed to the edges of the network whenever possible. Perhaps the best example of the Internet philosophy is TCP congestion control, which is implemented primarily through algorithms operating at end systems. unfortunately, TCP congestion control also illustrates some of the shortcomings of the end-to-end argument.
Some have argued that congestion collapse and unfairness can be mitigated through the use of improved packet scheduling or queue management mechanisms in network routers. For instance, per-flow packet scheduling mechanisms such as WFQ attempt to offer fair allocations of bandwidth to flows contending for the same link.
(- and -) arbitrated by a fair queuing mechanism at routers and, at the first bottleneck link (-), fair queuing at router ensures that each flow receives half of the link’s available bandwidth (750 kb/s). On the second bottleneck link (-), much of the traffic from flow B is discarded due to the link’s limited capacity (128 kb/s). Hence, flow-A achieves a throughput of 750 kb/s, and flow B achieves a throughput of 128 kb/s.
II. EXISTING SYSTEM
As a result of its strict adherence to end-to-end congestion control, the current Internet suffers from two maladies:Congestion collapse from undelivered packets and unfair allocations of bandwidth between competing traffic flows.
(A). The first malady:- congestion collapse from undelivered packets arises when packets that are dropped before reaching their ultimate continually consume bandwidth destinations.
(B). The second malady:- unfair bandwidth allocation to competing network flows arises in the internet for a variety of reasons, one of which is the existence of applications that do not respond properly to congestion. Adaptive applications (e.g., TCP-based applications) that respond to congestion by rapidly reducing their transmission rates are likely to receive unfairly small bandwidth allocations when competing with unresponsive applications. The internet protocols themselves can also introduce unfairness. The TCP algorithm, for instance, inherently causes each TCP flow to receive a bandwidth that is inversely proportional to its round-trip time [6]. Hence, TCP connections with short round-trip times may receive unfairly large allocations of network bandwidth when compared to connections with longer round-trip times.
The impact of emerging streaming media traffic on traditional data traffic is of growing concern in the internet community. Streaming media traffic is unresponsive to the congestion in a network, and it can aggravate congestion collapse and unfair bandwidth allocation.
III. reLATeD WorK
The maladies of congestion collapse from undelivered packets and of unfair bandwidth allocations have not gone unrecognized. Some have argued that there are social incentives for multimedia applications to be friendly to the network, since an application would not want to be held responsible for throughput degradation in the internet. Nevertheless, unresponsive UDP flows are becoming disturbingly frequent in the internet, and they are an example that the internet cannot
Fig1: example of a network which experience congestion collapse For illustration, consider the example shown in Fig.1 in this example, two unresponsive flows (flow A and flow B) compete for bandwidth in a network containing two bottleneck links

236 • Part D—ICT
rely solely on social incentives to control congestion or to operate fairly.
IV. ProPoSeD SySTem
To address the maladies of congestion collapse we introduce and investigate a novel Internet traffic control protocol called Congestion Free Router (CFr). The basic principle of CFr is to compare, at the borders of a network, the rates at which packets from each application flow are entering and leaving the network. If a flow’s packets are entering the network faster than they are leaving it, then the network is likely buffering or, worse yet, discarding the flow’s packets. In other words, the network is receiving more packets than it is capable of handling. CFR prevents this scenario by “patrolling” the network’s borders, ensuring that each flow’s packets do not enter the network at a rate greater than they are able to leave the network. This patrolling prevents congestion collapse from undelivered packets, because unresponsive flow’s otherwise undeliverablePackets never enter the network in the first place.
Although CFr is capable of preventing congestion collapse and improving the fairness of bandwidth allocations, these improvements do not come for free. CFr solves these problems at the expense of some additional network complexity, since routers at the border of the network are expected to monitor and control the rates of individual flows in CFR. CFR also introduces added communication overhead, since in order for an edge outer to know the rate at which its packets are leaving the network, it must exchange feedback with other edge routers. unlike some existing approaches trying to solve congestion collapse, however, CFR’s added complexity is isolated to edge routers, routers within the core of the network do not participate in the prevention of congestion collapse. moreover, end systems operate in total ignorance of the fact that CFr is implemented in the network, so no changes to transport protocols are necessary at end systems.
V. DETAILS OF THE PROJECT
CFr is a network layer congestion-avoidance protocol that is aligned with the core-stateless approach. The core-stateless approach, which has recently received a great deal of research attention [8], [4], allows routers on the borders (or edges) of a network to perform flow classification and maintain per-flow state but does not allow routers at the core of the network to do so. Fig. 2 illustrates this architecture. As in other work on core-stateless approaches, we draw a further distinction between two types of edge routers. Depending on which flow it is operating on, an edge router may be viewed as an InRouter or an OutRouter router. An edge router operating on a flow passing into a network is called an Inrouter router, whereas an edge router operating on a flow passing out of a network is called an OutRouter router. Note that a flow may pass through more than one outrouter (or Inrouter) router if the end-to-end path crosses multiple networks.
Fig.2 Core Stateless internet architecture assumed by CFr
network is called an Inrouter router, whereas an edge router operating on a flow passing out of a network is called an OutRouter router. Note that a flow may pass through more than one outrouter (or Inrouter) router if the end-to-end path crosses multiple networks.
CFr prevents congestion collapse through a combination of per-flow rate monitoring at OutRouter routers and per-flow rate control at InRouter routers. Rate monitoring allows an OutRouter router to determine how rapidly each flow’s packets are leaving the network, whereas rate control allows an InRouter router to police the rate at which each flow’s packets enter the network. Linking these two functions together are the feedback packets exchanged between Inrouter and outrouter routers, Inrouter routers send outrouter routers forward feedback packets to inform them about the flows that are being rate controlled, and outrouter routers send Inrouter routers backward feedback packets to inform them about the rates at which each flow’s packets are leaving the network. By matching the InRouter rate and OutRouter rate of each flow, CFr prevents congestion collapse within the network.
VI. WorKING ASPeCTS oF THe CFr:(A). The architectural components, namely, the modified edge routers, which must be present in the network(B). The feedback control algorithm, which determines how and when information is exchanged between edge route(C). The rate control algorithm, which uses the information carried in feedback packets to regulate flow transmission rates and thereby prevent congestion collapse in the network.
A.ArCHITeCTurAL ComPoNeNTSThe only components of the network that require modification by CFR are edge routers; the input ports of OutRouter routers must be modified to perform per-flow monitoring of bit rates, and the output ports of InRouter routers must be modified to perform per-flow rate control. In addition, both the InRouter and the OutRouter routers must be modified to exchange and handle CFr feedback packets.
Fig. 3 Input port of an Inrouter
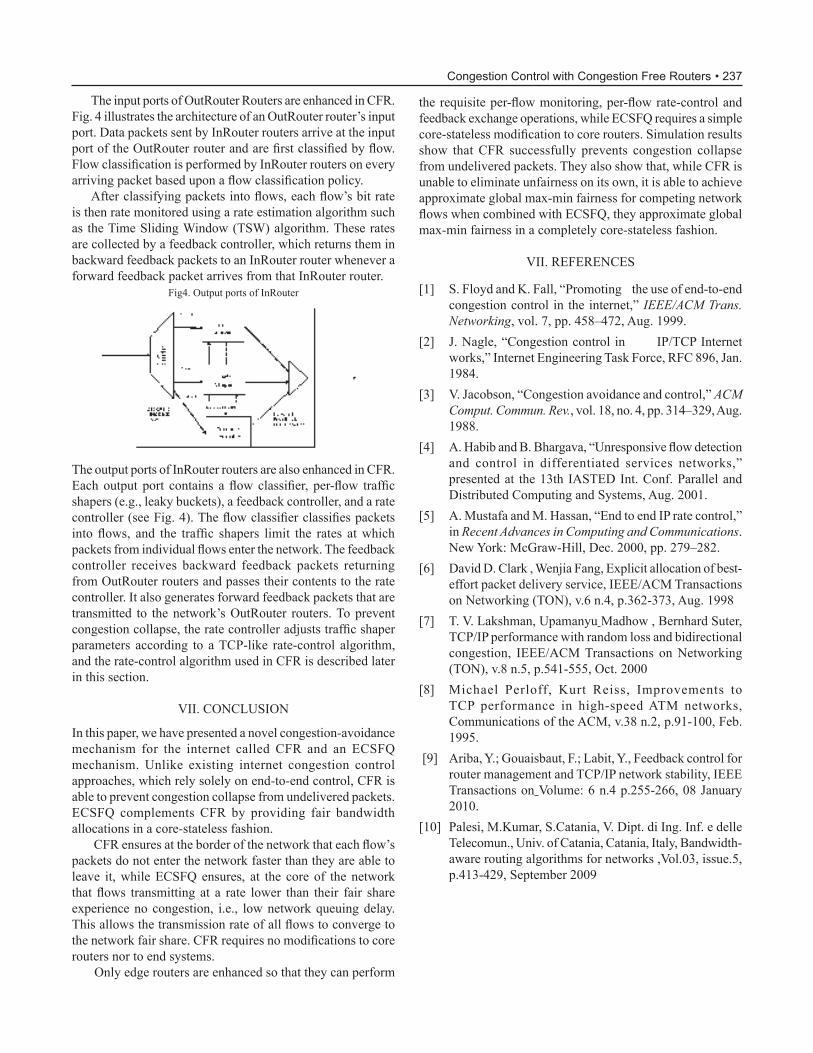
• 237
The input ports of outrouter routers are enhanced in CFr. Fig. 4 illustrates the architecture of an OutRouter router’s input port. Data packets sent by Inrouter routers arrive at the input port of the OutRouter router and are first classified by flow. Flow classification is performed by InRouter routers on every arriving packet based upon a flow classification policy.
After classifying packets into flows, each flow’s bit rate is then rate monitored using a rate estimation algorithm such as the Time Sliding Window (TSW) algorithm. These rates are collected by a feedback controller, which returns them in backward feedback packets to an Inrouter router whenever a forward feedback packet arrives from that Inrouter router.
Fig4. Output ports of InRouter
the requisite per-flow monitoring, per-flow rate-control and feedback exchange operations, while ECSFQ requires a simple core-stateless modification to core routers. Simulation results show that CFr successfully prevents congestion collapse from undelivered packets. They also show that, while CFr is unable to eliminate unfairness on its own, it is able to achieve approximate global max-min fairness for competing network flows when combined with ECSFQ, they approximate global max-min fairness in a completely core-stateless fashion.
VII. reFereNCeS
[1] S. Floyd and K. Fall, “Promoting the use of end-to-end congestion control in the internet,” IEEE/ACM Trans. Networking, vol. 7, pp. 458–472, Aug. 1999.
[2] J. Nagle, “Congestion control in IP/TCP Internet works,” Internet Engineering Task Force, RFC 896, Jan. 1984.
[3] V. Jacobson, “Congestion avoidance and control,” ACM Comput. Commun. Rev., vol. 18, no. 4, pp. 314–329, Aug. 1988.
[4] A. Habib and B. Bhargava, “Unresponsive flow detection and control in differentiated services networks,” presented at the 13th IASTeD Int. Conf. Parallel and Distributed Computing and Systems, Aug. 2001.
[5] A. Mustafa and M. Hassan, “End to end IP rate control,” in Recent Advances in Computing and Communications. New York: McGraw-Hill, Dec. 2000, pp. 279–282.
[6] David D. Clark , Wenjia Fang, Explicit allocation of best-effort packet delivery service, IEEE/ACM Transactions on Networking (TON), v.6 n.4, p.362-373, Aug. 1998
[7] T. V. Lakshman, Upamanyu Madhow , Bernhard Suter, TCP/IP performance with random loss and bidirectional congestion, IEEE/ACM Transactions on Networking (TON), v.8 n.5, p.541-555, Oct. 2000
[8] Michael Perloff, Kurt Reiss, Improvements to TCP performance in high-speed ATm networks, Communications of the ACM, v.38 n.2, p.91-100, Feb. 1995.
[9] Ariba, Y.; Gouaisbaut, F.; Labit, Y., Feedback control for router management and TCP/IP network stability, IEEE Transactions on Volume: 6 n.4 p.255-266, 08 January 2010.
[10] Palesi, M.Kumar, S.Catania, V. Dipt. di Ing. Inf. e delle Telecomun., Univ. of Catania, Catania, Italy, Bandwidth-aware routing algorithms for networks ,Vol.03, issue.5, p.413-429, September 2009
The output ports of Inrouter routers are also enhanced in CFr. Each output port contains a flow classifier, per-flow traffic shapers (e.g., leaky buckets), a feedback controller, and a rate controller (see Fig. 4). The flow classifier classifies packets into flows, and the traffic shapers limit the rates at which packets from individual flows enter the network. The feedback controller receives backward feedback packets returning from outrouter routers and passes their contents to the rate controller. It also generates forward feedback packets that are transmitted to the network’s OutRouter routers. To prevent congestion collapse, the rate controller adjusts traffic shaper parameters according to a TCP-like rate-control algorithm, and the rate-control algorithm used in CFr is described later in this section.
VII. CoNCLuSIoN
In this paper, we have presented a novel congestion-avoidance mechanism for the internet called CFR and an ECSFQ mechanism. unlike existing internet congestion control approaches, which rely solely on end-to-end control, CFr is able to prevent congestion collapse from undelivered packets. ECSFQ complements CFR by providing fair bandwidth allocations in a core-stateless fashion.
CFR ensures at the border of the network that each flow’s packets do not enter the network faster than they are able to leave it, while ECSFQ ensures, at the core of the network that flows transmitting at a rate lower than their fair share experience no congestion, i.e., low network queuing delay. This allows the transmission rate of all flows to converge to the network fair share. CFR requires no modifications to core routers nor to end systems.
only edge routers are enhanced so that they can perform
Congestion Control with Congestion Free Routers

The goal of Securing a Sing-hop Wireless LinkNajiya Sultana1 and S.S.Sarangdevat2.
1Research Scholar [[email protected]]2Director,Computer Science & IT Department,[[email protected]]
Rajasthan Vidhyapith University, Udaipur, India
AbstrAct
securing wireless networks poses unique research chal-lenge. In this paper, we survey the state-of-the-art approach to providing security for wireless networking paradigms, namely IEEE 802.11 based WLAN. We identify the secu-rity threats as well as examine the current solutions. We further summarize lessons learned, discuss open issues, and identify future directions.
INTroDuCTIoN
In recent years, wireless networking has been experiencing an explosive growth which resembles the rapid growth of the Internet itself in mid 1990’s. Wireless networks offer attractive flexibility and coverage to both network operators and users. ubiquitous network coverage, for both local and wide areas, can be provided without the excessive costs of deploying and maintaining the wires. mobility support is another salient feature of wireless networks, which grants the users not only “anytime, anywhere” network access but also the freedom of roaming while networking. recent advances in wireless com-munication technology have offered ever increasing data rates, in some cases comparable to their wired counterparts.There are multiple forms of wireless networks with different characteristics and application domains. In this article we focus on wireless networking paradigm, namely wireless Local Area Networks (WLANs). The IEEE 802.11 WLANs use one or more stationary Access Points (APs) to extend network con-nectivity by one-hop wireless links, and are widely deployed in campuses, corporations and homes. To protect the data delivery functionality of network, we focus on the following two security goals:• Information Security, i.e., to provide confidentiality, integrity, authentication, and non-repudiation for two entities that com-municate with each other.• Network Security, i.e., to protect the networking system as a whole and sustain its capability to provide connectivity between communicating entities.Although most, if not all, security threats against the TCP/IP stack in a wired network are equally applicable to an IP-based wireless network, the latter possesses a number of unique vul-nerabilities which make it more challenging to secure:• Open Wireless Access Medium: With off-the shelf hard ware’s and little efforts, an attacker can intercept and inject traffic through a wireless channel. There is no physical bar-rier to separate the attacker from the network, as is the case in wired networks.• Limited Bandwidth: Wireless networks are particularly vul-
nerable to Denial-of-Service (DoS) attacks due to their limited bandwidth and in-band signaling. • System Complexity: Generally speaking wireless networks are far more complex than their wired counterparts due to the special needs for mobility support and efficient channel utilization.
SeCurITy For WIreLeSS LAN
In this section we describe the security threats and solutions in an IEEE 802.11 WLAN. We start with a brief overview of the WLAN architecture, then discuss its security vulnerabilities, followed by the detailed description of the WLAN security standards, including WEP, WPA, and 802.11i.Security Threats: Due to the open wireless medium, the 802.11 standard family faces a common set of security vulnerabilities. We focus the discussion on the security threats related to the wireless link between the stations and the AP, which is, in many cases, the last hop in an end-to-end path. We do not consider the security compromise of an AP nor the attacks on the wired portion. The security threats in WLAN are- • Channel Jamming • Unauthorized Access • Traffic Analysis • Eavesdropping • Message Forgery • Message Replay • Cryptanalysis Attack• Man-in-the-Middle Attack : (ArP) replies that maps himself to the AP’s IP address.• Session Hijacking The implementation of these attacks is not sophisticated and requires only off-the-shelf hardwares and little system knowl-edge. In fact, several hacker toolsets (e.g., Aerosol [2], AirSnort [3], WEPCrack [4]) are publicly available which significantly lower the bar for the attackers.Solution Overview: The basic approach is to devise link layer security mechanisms that enhance the open wireless links with the following features:• Access Control, which prevents network access from unau-thorized users.• Data Confidentiality, which prevents revealing the content of the transmitted data.• Data Integrity, which prevents tampering with the content of the transmitted data.• Mutual Authentication, which allows two communicating parties to authenticate each other.These link-layer mechanisms can provide strong information security by encrypting and integrity-checking every message. They also reduce network security threats by preventing unauthorized access. However, they do not address the jam-ming and traffic analysis attacks which require physical-layer solutions.

• 239
WEP: The Wired Equivalent Privacy (WEP) protocol [1] was the first link-layer security mechanism introduced in 802.11 to provide a security level comparable to that with a physical wire. After its release, the hardware products supporting this standard rapidly dominated the market. unfortunately, several critical flaws in WEP were soon identified which can be ex-ploited to defeat its security goals [5], [6], [7], [8].Basic Primitives: WEP was designed to enforce data confiden-tiality, data integrity, and access control through the following primitives:• Encryption: WEP encrypts data using a RC4-based stream cipher to achieve data confidentiality.• Integrity Checksum: WeP uses Cyclic redundancy Check (CrC) to compute integrity checksums for the messages.• Authentication: WeP uses a challenge-response handshake based on pre-shared keys to authenticate the stations. The AP enforces access control by discarding all frames that are not properly encrypted.
WPA: In response to the security flaws in WEP, a new security standard for WLANs, called Wi-Fi Protected Access (WPA) [10], was released by Wi-Fi Alliance [11] in Oct. 2002. Today most, if not all, Wi-Fi products in the market are WPA compli-ant, or can be easily upgraded to support WPA.Basic primitives: The primary goal of WPA is to amend the known security flaws in WEP while retaining backward compatibility with legacy WEP devices. By keeping the cryptosystem unchanged, the new features in WPA can be incorporated into legacy WeP devices through software or firmware updates. WPA addressed the security flaws in WEP through the following primitives:• Temporal Key Integrity Protocol (TKIP), new data encryp-tion protocol that defeats the key stream reuse and weak key attacks.• Message Integrity Codes (MIC) that defeats the message forgery attacks.• 802.1x Authentication that achieves strong authentication, authorization, and key management.
802.11i : The IEEE 802.11 Task Group i (TGi) has recently proposed 802.11i [13], a new security standard for WLANs (ratified in June 2004). In fact, WPA was based on an earlier 802.11i draft, and all its essential features, such as TKIP/Mi-chael, are retained in 802.11i. Wi-Fi Alliance has also adopted 802.11i as the next-generation WPA, also called WPA2 [10]. one may view WPA as an interim step in the evolution from WEP to 802.11i. Products that are compliant with 802.11i are expected to be available by the end of 2004.Basic primitives: The new cryptosystem used in 802.11i is the Advanced encryption Standard (AeS) that is provenly secure against differential and linear cryptanalysis. The benefits of using AeS is increased security in the long run. However, AeS operations typically require a 64-bit co-processor to improve the performance. As a result, the legacy WEP/WPA devices,
especially the APs, can hardly be upgraded to 802.11i without hardware upgrade. The basic primitives in 802.11i include:• TKIP/Michael: TKIP and Michael are retained in 802.11i for data encryption and mIC computation, respectively.• AES-CCMP: AES in Counter mode with CBC-MAC Protocol, which refers to AeS in counter mode for data encryption and CBC-MAC for MIC computation.• 802.1x Authentication: 802.1x is used to authenticate the stations and distribute a hierarchy of keying materials.
SummAry
So far we have described several WLAN security solutions, namely WEP, WPA, and 802.11i. They share the same goal of securing a single-hop wireless link, and follow the com-mon theme of using cryptographic ciphers to achieve data privacy,data integrity, and access control. Their main difference is the specific ciphers and key management methods in use. By fixing the security flaws in WEP, WPA and 802.11i provide not only strong information security for individual stations, butalso authentication and access control in the entire network. As a result, they can address most of the attacks, except the jamming and traffic analysis attacks, which clearly require solutions at the physical layer.
CoNCLuSIoN
A. Lessons Learned: Security is a fundamental research challenge in wireless networking. To this end, we have as-sessed security threats and countermeasures in IEEE 802.11 WLAN. There are several general observations that can be drawn from this study. First, the cryptographic techniques are an essential ingredient in providing information security, and can serve as the first line of defense against network attacks (e.g., through authentication). However, cryptography alone does not suffice to secure a networking system. Furthermore, the flawed WEP design shows that, like all other human en-deavors, crypto designs are subject to human errors. Given a specific security requirement, there is neither a systematic process to develop a suitable design nor an automatic way to gauge its vulnerability at this time. Finally, the current security solutions are typically based on specific threat models, and operate explicitly or implicitly with a number of assumptions made on the networks.
b. Future research: Looking ahead into the future, we would like to identify two directions that need more research and development efforts to build a truly secure wireless network-ing system:• Critical evaluation: While many security solutions have been reported in the literature, most of them have not been thoroughly evaluated in terms of security strength and system performance. In fact, we lack systematic evaluation methods and efforts in the following aspects: (1) Vulnerability analysis of the current solutions/standards.
The goal of Securing a Sing-hop Wireless Link

240 • Part D—ICT
While the crypto strength of individual ciphering algorithms is relatively well understood, we have no formal analytical tools to assess a system security proposal. In particular, the analysis on the inter-dependency among various system components and security operations poses a major research challenge.
(2) Measurements and emulations.To date most solutions have been evaluated for their network and system performance via simulations.• resilient security: most current solutions make idealistic assumptions on the network and individual components. A truly resilient security solution needs to possess both robust-ness and resiliency. It must be robust against wireless channel errors, transient/permanent network connectivity and topology changes. It must also be resilient against unanticipated attacks, operational errors such as misconfigurations, and compro-mised/stolen devices.
The history of security has taught us that a perfectly secure system does not exist. Instead, security is an evolving process. New system vulnerabilities continue to be
identified, and new security threats continue to arise. Ac-cordingly new solutions must be developed and integrated into existing systems. We need continued development of newer and stronger ciphers, but more fundamentally we also need a better understanding of how to architect a secure system that can embrace the security evolution in a flexible, non-intrusive,
and efficient manner.
reFereNCeS
[1] IEEE Computer Society. Wireless LAN Medium Access Control (MAC) and Physical Layer (PHY) Specifica-tions. IEEE standard 802.11, 1999.
[2] Aerosol. http://www.stolenshoes.net/sniph/aerosol.html.
[3] AirSnort. http://airsnort.shmoo.com/.[4] WEPCrack. http://sourceforge.net/projects/wepcrack.[5] William Arbaugh, Narendar Shankar, Y Wan, and Kan
Zhang. Your 802.11 Wireless Network Has No Clothes. IEEE Wireless Communications, 9(6), Decemeber 2002.
[6] Nikita Borisov, Ian Goldberg, and David Wagner. In-tercepting mobile Communications: The Insecurity of 802.11. In Proc. MOBICOM, 2001.
[7] Scott Fluhrer, Itsik Mantin, and Adi Shamir. Weaknesses in the Key Scheduling Algorithm of FCC4. In Proc. Eighth Annual Workshop on Selected Areas in Cryptog-raphy, 2001.
[8] Adam Stubblefield, John Ioannidis, and Aviel Rubin. Using the Fluhrer, Mantin, and Shamir Attack to Break WeP. In Proc. Network and Distributed System Security Symposium (NDSS), 2002.
[9] Simon Singh. The Code Book: The Evolution Of Secrecy From Mary, To Queen Of Scots To Quantum Crytogra-phy. Doubleday, 1999.
[10] Wi-Fi Protected Access (WPA). http://www.wi-fi.org/wpa/

estimation of resource usage in Peer to Peer Networks: A Servey
Pravin u. malve e-mail : [email protected]
Vijay S. Gulhane e-mail ; [email protected]
Anish r. Khobragadee-mail : [email protected]
AbstrAct
Peer-to-Peer systems are characterized by their ability to function, scale, and self-organize in the presence of highly transient population of failure-prone nodes. P2P networks exploit available bandwidth across the entire network by using a variety of communication channels and by filling bandwidth up to the brim of the Internet. Unlike traditional client/server communications, in which specific routes to popular destinations can become overloaded (for example, the route to google.com) Peer-to-Peer systems provide open access making the resources available to any user. client/server solutions rely on the addition of costly bandwidth, equipment, and co-location facilities to maintain a robust solution. P2P can offer a similar level of robustness by spreading network and resource demands across the P2P network.
this paper gives the survey of systems for estimation of resource utilization in peer to peer network. It also states the future aspects of proper utilization of resources in peer to peer networks.
Keywords: P2P,JXTA, Job Manager ,Overlay manager
I. INTroDuCTIoN
Peer-to-Peer systems has advantage over other models of networks, they have no dependence on centralized servers, which suffer from problems such as bottlenecks, single points of failure, among other.
Peer-to-Peer (P2P) technology enables any network-con-nected device to provide services to another network-connected device. A device in a P2P network can provide access to any type of resource that it has at its disposal, whether documents, storage capacity, computing power, or even its own human op-erator. The device in a P2P network could be anything ranging from a super computer to simple PDA. P2P technology is a robust and impressive extension of the Internet’s philosophy of robustness through decentralization. The main advantage of P2P networks is that it distributes the responsibility of provid-ing services among all peers on the network; this eliminates service outages due to a single point of failure and provides a more scalable solution for offering services. In addition, P2P networks exploit available bandwidth across the entire network
by using a variety of communication channels and by filling bandwidth up to the brim of the Internet. unlike traditional cli-ent/server communications, in which specific routes to popular destinations can become overloaded (for example, the route to google.com), P2P enables communication via a variety of network routes, thereby reducing network overloading. P2P has the capability of serving resources with high availability at a much lower cost while maximizing the use of resources from every peer connected to the P2P network. Client/server solutions rely on the addition of costly bandwidth, equipment, and co-location facilities to maintain a robust solution. P2P can offer a similar level of robustness by spreading network and resource demands across the P2P network. Several different P2P architectures have been proposed so far, a comprehensive survey is provided in [1].
II. reSourCe mANAGemeNT moDeL
The job distribution and management in network is carried out by resource management model as shown in Figure 1 where a machine, acting as a resource consumer, distributes tasks among available machines, resource providers, in order to perform a CPu-intensive job demanded by a user. resource providers receive the tasks, compute them, and send the results back to the consumer node (the job holder). All machines are connected through an overlay network, which is built on top of another network (i.e. Internet) and provides services of routing and lookup. Figure 2 shows the system architecture for managing jobs among the network resources.
Fig. 1: resource management model
Fig. 2: System Architecture

242 • Part D—ICT
The function of each layer is given below:
Unmodified Applications :This level represents the applica-tions that run on top of our middleware. The application paral-lelism is exploited at the data-level, and thus applications do not need to be modified.
Application Adaptation Layer: This layer defines which applications are supported by the local machine. Therefore, specific mechanisms for handling each of these applications are provided. For example, launching applications with the correct parameters and input files.
Job Manager: This component is responsible for creating and scheduling tasks in accordance with available resources. The tasks, as divisions of input files (to feed an application) are distributed among available machines. After the computation of the tasks is completed, this module collects the (partial) results and builds the final output of the respective applica-tion. In the inverse flow, it is also responsible for receiving and computing tasks from remote machines in accordance to the Application Adaptation Layer.
Policy Engine: The Policy engine component is responsible for enforcing local policies that can recall on the history of past events. Some of these policies may be defined, by the main GuI, in a way that is understandable for any ordinary user (e.g. a user can only use 5 hours of my CPU time during the current week). Nonetheless, for more specific actions, policies need to be defined in XML files whose structure relies upon the xSPL language, thus requiring more expertise. Furthermore, the policy engine acts as a filter between the Overlay Manager and Job Manager layers, deciding which messages may pass.
Overlay Manager: This layer comprises four components. It is responsible for the operations of routing and addressing on the overlay network. In addition, mechanisms of management and discovery of resources are included. Also, local resource utilization is monitored by this component. Any changes in resource availability are announced to the neighbor nodes.
Furthermore, this component contemplates a distributed stor-age system used as a cache for storing computed tasks.
communication service: This layer is used by overlay man-ager to send messages to the overlay network. Also, it analyses messages coming from the network in the first instance and then delivers it to the adequate handler routine in the overlay manager.
Operating System/Virtual Machine: The whole platform is intended to work directly upon operating System or Virtual machine. For improved security a Virtual machine may be used as a sandbox mechanism. This way, we can guarantee controlled access to machine resources, as well as prevent some malicious code from damage one’s computer, in case input files consist of scripts, programming code, and so forth.
III. reLATeD WorK
Peer-to-Peer has been gaining a huge success across the Inter-net. Such architectures are designed for the direct sharing of computer resources (CPu cycles, storage, and content) rather than requiring the intermediation of a centralized server or authority [2]. Currently, not only scientists, but also typical non-expert computer users are willing to perform intensive tasks on their computers. However, these tasks could be quite different, like: compressing a movie file, generating a complex image from a specification, compacting large files, among other. more precisely, these tasks consume a relatively large amount of time and memory, delaying other processes that are running at the same time. Along the way, one becomes bored and impatient. From another point of view, there are many Internet connected computers around the world whose resources are not fully utilized. most of the time, non-expert users have just some low CPu-intensive processes running on their machines, therefore giving a sense of waste.
Given the current context, we intend to deploy a platform where any ordinary user may consume and provide resources, namely idle CPu cycles, over a dynamic network that could be local or wide (e.g. Internet), in order to speed up common, and widely used, applications which are CPu-intensive. There are two fundamental requirements: first is while we intend to exploit parallel execution in desktop applications, the system must ensure a fine-grained control over the shared resources, and second applications should be kept unmodified in order to take advantage of all the software already existing.
Deeds [3, 11] is a history-based access control system whose policies must be written in Java. It is useful to provide security in P2P network. For resource discovery Iamnitchi et al [4] have compared different searching methods. Cheema et al [2] proposed a solution for exploiting the single keyword lookup for CPU cycle sharing systems. Globus [5] is an en-abling technology for grid deployment. It provides mechanisms for communication, authentication, network information, data access, amongst other. Condor [7] allows the integration and use of remote workstations. It maximizes the utilization of workstations and expands the resources available to users, by
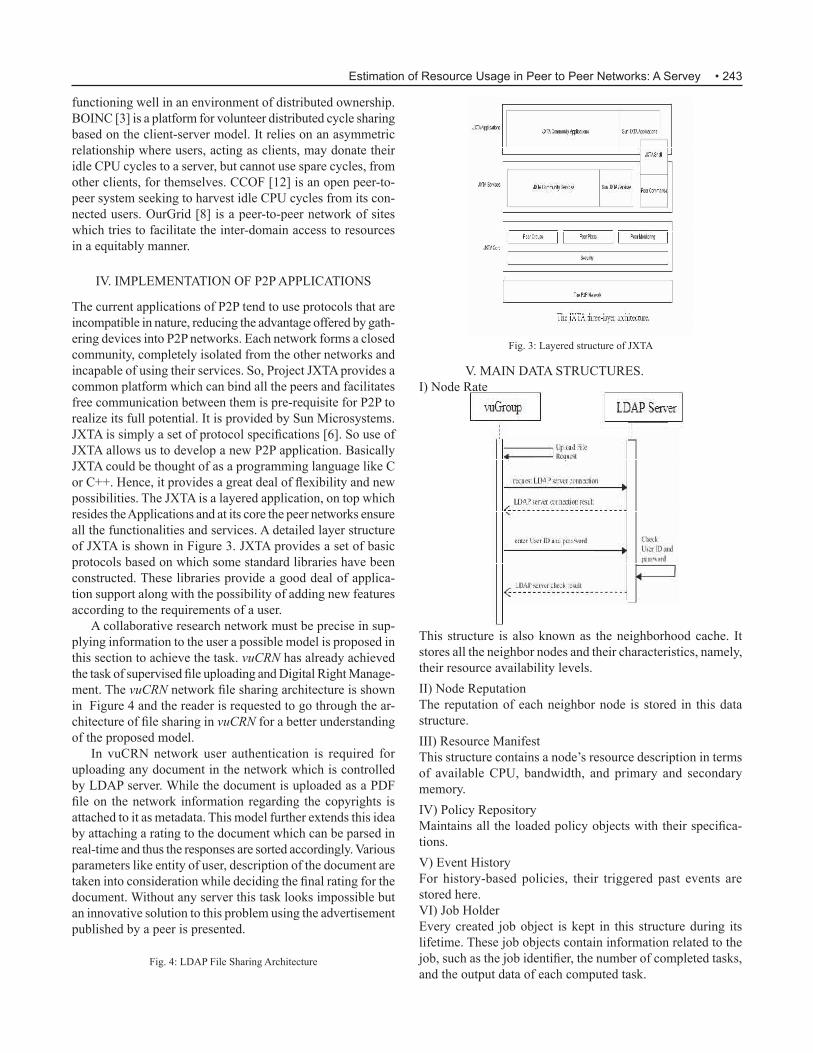
• 243
functioning well in an environment of distributed ownership. BOINC [3] is a platform for volunteer distributed cycle sharing based on the client-server model. It relies on an asymmetric relationship where users, acting as clients, may donate their idle CPu cycles to a server, but cannot use spare cycles, from other clients, for themselves. CCOF [12] is an open peer-to-peer system seeking to harvest idle CPu cycles from its con-nected users. OurGrid [8] is a peer-to-peer network of sites which tries to facilitate the inter-domain access to resources in a equitably manner.
IV. ImPLemeNTATIoN oF P2P APPLICATIoNS
The current applications of P2P tend to use protocols that are incompatible in nature, reducing the advantage offered by gath-ering devices into P2P networks. each network forms a closed community, completely isolated from the other networks and incapable of using their services. So, Project JXTA provides a common platform which can bind all the peers and facilitates free communication between them is pre-requisite for P2P to realize its full potential. It is provided by Sun microsystems. JXTA is simply a set of protocol specifications [6]. So use of JXTA allows us to develop a new P2P application. Basically JXTA could be thought of as a programming language like C or C++. Hence, it provides a great deal of flexibility and new possibilities. The JXTA is a layered application, on top which resides the Applications and at its core the peer networks ensure all the functionalities and services. A detailed layer structure of JXTA is shown in Figure 3. JXTA provides a set of basic protocols based on which some standard libraries have been constructed. These libraries provide a good deal of applica-tion support along with the possibility of adding new features according to the requirements of a user.
A collaborative research network must be precise in sup-plying information to the user a possible model is proposed in this section to achieve the task. vuCRN has already achieved the task of supervised file uploading and Digital Right Manage-ment. The vuCRN network file sharing architecture is shown in Figure 4 and the reader is requested to go through the ar-chitecture of file sharing in vuCRN for a better understanding of the proposed model.
In vuCrN network user authentication is required for uploading any document in the network which is controlled by LDAP server. While the document is uploaded as a PDF file on the network information regarding the copyrights is attached to it as metadata. This model further extends this idea by attaching a rating to the document which can be parsed in real-time and thus the responses are sorted accordingly. Various parameters like entity of user, description of the document are taken into consideration while deciding the final rating for the document. Without any server this task looks impossible but an innovative solution to this problem using the advertisement published by a peer is presented.
Fig. 4: LDAP File Sharing Architecture
V. mAIN DATA STruCTureS.I) Node rate
Fig. 3: Layered structure of JXTA
This structure is also known as the neighborhood cache. It stores all the neighbor nodes and their characteristics, namely, their resource availability levels.II) Node reputationThe reputation of each neighbor node is stored in this data structure.III) resource manifestThis structure contains a node’s resource description in terms of available CPu, bandwidth, and primary and secondary memory.IV) Policy repositoryMaintains all the loaded policy objects with their specifica-tions.V) event HistoryFor history-based policies, their triggered past events are stored here.VI) Job Holderevery created job object is kept in this structure during its lifetime. These job objects contain information related to the job, such as the job identifier, the number of completed tasks, and the output data of each computed task.
Estimation of Resource Usage in Peer to Peer Networks: A Servey
244 • Part D—ICT
VI. CoNCLuSIoN
This paper gives various aspects of implementing the system for estimation of resource utilization or usage in peer to peer network. The key points taken into consideration for imple-mentation of system1. Discovery of the available peer to peer network and avail-
able resources in the network.2. Implementation of the automatic resource discovery of
available resources in the network. 3. estimation of the each resource usage or utilization in
the network. 4. Implementation of overall system. 5. Comparison of the implemented system will be carried
out with available systems.6. Result analysis and performance evaluation of the imple-
mented system will be carried out in the last step.
reFereNCeS
[1] A. Iamnitchi and I. Foster. A peer-to-peer approach to resource location in grid environments. In Grid resource management: state of the art and future trends, pages 413–429, Norwell, MA, USA, 2004. Kluwer Academic Publishers.
[2] A. S. Cheema, M. Muhammad, and I. Gupta. Peer-to-peer discovery of computational resources for grid applica-tions. In GRID ’05: Proceedings of the 6th IEEE/ACM International Workshop on Grid Computing, pages 179–185, Washington, DC, USA, 2005. IEEE Computer Society.
[3] D. P. Anderson. Boinc: A system for public-resource computing and storage. In GRID ’04: Proceedings of the 5th IEEE/ACM International Workshop on Grid Computing, pages 4–10, Washington, DC, USA, 2004. IEEE Computer Society.
[5] G. Edjlali, A. Acharya, and V. Chaudhary. History-based access control for mobile code. In CCS ’98: Proceedings of the 5th ACM conference on Computer and communica-tions security, pages 38– 48, New York, NY, USA, 1998. ACM. I. Foster and C. Kesselman. Globus: A metacom-
puting infrastructure toolkit. International Journal of Supercomputer Applications, 11:115–128, 1997.
[6] “JXTA Java™ Standard Edition v2.5: Programmers Guide”, September 10th, 2007, Sun Microsystems, Inc.
[7] M. Litzkow, M. Livny, and M. Mutka. Condor - a hunter of idle workstations. In Proceedings of the 8th Interna-tional Conference of Distributed Computing Systems, June 1988.
[8] N. Andrade, W. Cirne, F. Brasileiro, and P. Roisenberg. ourgrid: An approach to easily assemble grids with equitable resource sharing. In Proceedings of the 9th Workshop on Job Scheduling Strategies for Parallel Processing, Seattle, WA, USA, June 2003.
[9] S´ergio Esteves, Lu´ýs Veiga and Paulo Ferreira GridP2P: resource usage in Grids and peer-to-Peer Systems. INESC-ID/IST, Distributed Systems Group, Rua Alves Redol, 9, 1000-029 Lisboa, Portugal 2010 IEEE.
[10] S. Androutsellis-Theotokis and D. Spinellis. A survey of peer-to-peer content distribution technologies. ACM Computing Surveys (CSUR), 36(4):335–371, December 2004.
[11] Pourebrahimi B., Bertels K., Vassiliadis S. A Survey of Peer-to-Peer Networks. Technical Report, Computer Engineering Laboratory, ITS, TU Delft, The Netherlands. 2004.
[12] V. Lo, D. Zhou, Y. Liu, and S. Zhao. Cluster computing on the fly: P2p scheduling of idle cycles in the internet. In the internet, 3rd International Workshop on Peer-to-Peer Systems (IPTPS 2004), pages 227–236, 2004.
on Split Document Image mosaicing TechniquesAkash.C.y 1 Chandan.P.raju 2 Kamlesh.V.N 2 Soumya.S.G 2 Chaitra.C 3 Shreya.S 3
1 AI SOFT House, AI SOFT Technologies (P) Ltd., Bangalore, India2Dept. of Computer Science & Engg., JSSATE, Bangalore , India.
3 Dept. of Electronics & Communication., BMSCE, Bangalore , India.Visvesvaraya Technological University, Belgaum ,India.
[email protected], [email protected], [email protected], [email protected], [email protected], [email protected]
AbstrAct
Image mosaicing is a technique for constructing a large seamless panoramic image from any source images. It also provides an easy way of understanding the scene as it shows all the objects in the scene in a single image. the ultimate aim of it is to enhance the resolution and field of view. Few methods have been proposed in literature for the document image mosaicing. However, the performance of different methods varies according to mosaicing procedures. Hence, a choice has to be made, as to which method is employed for the mosaicing images. this paper portrays the analysis of different methods, for document image mosaicing.
Keywords — Large Seamless Image, Panoramic Image, Ob-jects, Resolution, Field of View
INTroDuCTIoN
The general term “Image Processing” refers to a computer discipline where in digital images are the main data objects. This type of processing can be broken down into several sub-categories including: Compression, Image enhancement, Im-age Filtering, Image Distortion, Image Display and Coloring. The principal objective of Image Processing is to process a given image, so that it is more suitable for a specific applica-tion. The term is also used in a generic sense, to include Image Analysis and Image enhancement. Some of the applications are photography and printing, Satellite Image Processing, machine Vision, medical Image Processing, Face Detection, Feature Detection, Face Identification, Microscope Image Processing, and Car Barrier Detection[14].
Image mosaicing is a technique which enables to combine together many small images into a one large image, from which more information can be collected easily.
many a times, it may not be possible to capture the com-plete image of a large document in a single exposure as most of the image capturing media work with documents of definite size. In such cases document has to be scanned part by part producing split images. Thus, the document image analysis and processing require mosaicing of split images to obtain a complete image of the document.
Images are mosaiced using some of the features present in the image and the other based on the appearance of the image. And thus, the classification is brought as Feature based and Appearance based matching.
Feature based matching [1,2] is done, by considering ap-pearance of the image or object(like points, lines, pixels or transformation) with that of reference image. Here reference image is the original image of the object or any given image. Appearance based matching is done, by considering appear-ance of the image or object (like color, texture or type) with that of reference image. In our work we have made use of cross correlation technique [5] to compute the relationship between the corresponding co-ordinate points, and match the target image with that of the reference image. This technique is simple and does not require any human intervention for recognizing the patterns.
LITerATure
A literature survey shows some of the best works in the past in this area. Considerable amount of research has gone into image mosaicing and yet remains an open research problem.Several researchers have addressed different methods for obtaining the final image from its split parts:1) Schutte & Vossepoe [7] (1995) and Szeliski [8] (1996)
have described the usage of flat bed scanners to capture large utility maps. The method selects the CPs in different utility maps to find the displacement required for shift-ing from one map to the next, and the process requires human intervention to mask out the region not common to both the split images.
2) Zappala [10] et al (1997) and Peleg & Gee [6](1997) have worked based on feature-based approach where the estimation of the motion from point correspondence is proposed. This method is computationally expensive because of the rotation of an image employed during matching and it demands 50% overlapping in the split images to produce the mosaic image. However the ap-proach is limited to text documents.
3) Whichello & Yan [9] (1997) and Burt & Adelson (1983) have proposed a automatic mosaicing process based on correlation technique. Here, the technique is used to de-termine the position of the best match in the split images. However, accuracy is lost at the edges of the images. A template-matching procedure is used to search for the overlapping regions present in the split document images. usually, the template-matching procedure is a time-con-suming method. In addition, this approach assumes that the printed text lies on straight and horizontal baselines,

246 • Part D—ICT
which is not always possible in many pragmatic applica-tions.
4) Shivakumara et al, [11,12] (2001,2002) have worked on document image mosaicing, an approach based on zernike moments. Column matching method is used which compares the values of the pixels in the column of split image to identify the overlapping region in the split images, the extension of the method is also proposed Column-block matching, which is efficient compared to the column matching method. However this method is time consuming.
5) Akash.C.Y Chandan.P.Raju and Kamlesh.V.N [13] (2010),in their work “Split Document Image Mosaicing”, have circumvent the drawbacks of the existing works and also to work on all types of documents, a novel and simple approach is presented below.
There proposed method for mosaicing the split document
images is mainly split into four stages.They are – Image Acquisition, Image Registration, Image Blending and Image Transformation.
The first is the image acquisition phase where a set of split
In their article, they considered 25% of the image, since they found it ideal in our work, after experimenting with quite a few ranges of the portion of the image. From the 25% region that they consider in the image, they took 25*25 sized window as the template and move it over the target image for to find a match.When the match is found they proceeded in the similar way using the rest of the templates of the reference image and four best matched points are selected, known as control points for
images is obtained by scanning different parts of single large document image with 25% of overlapping region. The second phase is the image registration phase in which they tried find corresponding points and get their respective coordinates, so that they can compute the transformation from one image to another. They used of the template matching with correlation technique for extracting the control points, which shows the maximum match in the target image and the reference image. The third phase is the image transformation phase, where the corresponding points of the registered images are used, so that the overlapping regions between them are merged using linear translation process and rotation process. And the final phase is the image blending phase in which smoothing or rectifying the intensity difference between the two stitched split document images is performed to produce a single seamless document.Here they used cross co-relation technique. Cross co-relation technique is used because, it depicts the relationship of the cor-responding co-ordinate points in mathematical form which is computed directly for matching images and thus simple, than feature based matching technique (direct mapping) which is computationally expensive.
Input image output image
the next phase, where they determine the transformation/trans-lation, to align both the images as found in the original docu-ment. And finally both the images are blended using nearest neighbor interpolation technique to find the values of the pixels, so that the resulting image is seamlessly blended
reference image Target image
The translation is calculated making use of this equation.Trans x = avg c1-j1c2-j2c3-j3
Trans y = avg r1-i1r2-i2r3-i3 Where Trans x and Trans y gives the amount of translation to be made to the reference image along x-axis and y-axis so that reference image could be aligned with target image.
B: Algorithm :Algorithm for Split Document Image mosaicing.Input: Image1 and Image2 output: mosaiced ImageStep 1: read the two spilt document images.Step 2: Cropping the split document image.Step 3: Break the cropped reference image into non overlap-
ping templates.Step 4: Find the correlation coefficients of the reference
image.Step 5: Find the normalized correlation coefficients between
the cropped portion of the reference image and first 25% of the vertical/horizontal portion of the target image.

• 247
Step 6: If maximum of four control points is got and the value of the correlation coefficient is greater then, the specified threshold.
Step 7: Find the normalized correlation coefficients between the cropped portion of the reference image and first 25% of the vertical/horizontal portion of the target image.
Step 8: If maximum of four control points is got and the value of the correlation coefficient is greater than, the threshold 0.9.
Step 9: Finish.
ANALySIS
1) In the method due to Schutte ,Vossepoe & Szeliski involves human intervention to mask out the region not common to both the split images.
2) The method due to Zappala et al , Peleg & Gee is based on feature-based approach, which is computationally expensive.
3) The method due to Whichello, Yan , Burt and Adelson is automatic masaicing method is based of correlation technique. However, the method assumes that the printed text lines on horizontal baselines, which is not always possible in many pragmatic applications.
4) The method due to Shivakumara et al is based on zernike moments method. This method is efficient but for it is time consuming.
5) The method due to Akash.C.Y et.al works for all the split document images. The method demands 25% overlap-ping in the split images to produce the masaicing image. This method enhances the performance by increasing the computational speed. The method is also more ef-ficient. However, the method the texture component is not considered.
CoNCLuSIoN
mosaicing plays an important role in stitching of images, since it may not always be possible to capture a large documents in a single stretch due to the complexity present in grabbing (acquiring) a large document.
In this paper, we have presented an in depth analysis of various existing methods for split document image mosaicing. Further, we have also portraid the efficiency and the applica-bility of different methods. It is clear that coming out with a method for mosaicing split document and images, which is computationally efficient is still an open research problem.
BIBLIOGRAPHY
[1] H.Ogawa, Labeled point pattern matching by fuzzy relaxation, Pattern Recognition 17 (1984) 569–573.
[2] J. Canny, A computational approach to edge detec-tion, Ieee Transactions on Pattern Analysis and machine Intelligence 8 (1986)679–698.
[3] J. Flusser, B. Zitova´, Combined invariants to linear filtering and rotation, International Journal of Pattern Recognition and Artificial Intelligence 13 (1999) 1123–1136.
[4] L.M.G. Fonseca, B.S. Manjunath, registration techniques for multisensor remotely sensed imagery, Photogram-metric Engineering and Remote Sensing 62 (1996) 1049–1056.
[5] H. Hanaizumi, S. Fujimura, An automated method for registration of satellite remote sensing images, Pro-ceedings of the International Geoscience and remote Sensing Symposium IGARSS’93, Tokyo, Japan, 1993, pp. 1348–1350
[6] Peleg S, Gee A H 1997 Virtual cameras using image mo-saicing. Haifa research Laboratory, Hebrew university, Jerusalem
[7] Schutte K, Vossepoel A 1995 Accurate mosaicing of scanned maps of how to generate a virtual Ao scannar. Proc. First Annual Conf. of the Advanced School for Computing and Imaging, Heijen, the Netherlands, pp 353–359
[8] Szelski R 1996 Video mosaic for virtual environments, Ieee Comput. Graphics Appl. 22–30
[9] WhichelloAP, YanH1997 Document image mosaicing, Science and engineering Laboratory, Department of electrical engineering, university of Sydney, NSW 2006. www.bmva.ac.uk/bmvc/1997/ papers/046/paper-046.html
[10] Zappala A R, Gee A H, Taylor M J 1997 Document mosaicing. Int. Proc. British Machine Vision Conference, Colchester 2: 600–609
[11] Shivakumara et al. “Document Image Mosaicing”:An approach based on Zernike moments,Dept of Studies in Computer Science,university of mysore, Karnataka, India,
[12] Shivakumara et al. “Document Image Mosaicing”:A novel approach,Dept of Studies in Computer Science,university of mysore,Karnataka,India Sadhana Vol 29,Part 3,June 2004, pp.329-341.
[13] Akash C Y, Chandan P Raju and Kamalesh V N. “ Split Document Image mosaicing” Ieee International Conference on Intelligent Network and Computing (ICINC),Malaysia, Vol 1, Nov 2010, pp.104-109, IEEE Catalog Number: CFP1076K-PRT and ISBN: 978-1-4244-8270-2.
[13] Akash C Y and Chandan P Raju. Project thesis on “ Text Document Image Mosaicing”, Dept. of CSE, JSSATEB, Banglore. Affiliated to Visvesvaraya Tech-
On Split Document Image Mosaicing Techniques

248 • Part D—ICT
nological University, Belgaum, Karnataka, India.
BIOGRAPHY
Prof. Kamalesh V NReceived the Bachelor of Science degree from University of Mysore, India. Subsequently, he received master of Sci-ence in mathematics degree and master of Technology in Computer Science & Technology degree from University of Mysore, India. He secured 14th rank in Bachelor of Science and 4th rank in Master of Science from University of Mysore. Further, he was National Merit scholar and subject scholar in Mathematics. He is working as Head, Department of Com-puter Science & Engineering at Jss Academy of technical Education, Bangalore, affiliated to Visvesvaraya technologi-cal University, belgaum, Karnataka, India. He has taught around fifteen different courses at both undergraduate and post graduate level in mathematics and Computer science and engineering. His current research activities pertain to computer networks, Design and Analysis of algorithms, Graph theory and Combinatorics, Finite Automata and Formal Languages. His paper entitled “On the assignment of node number in a computer communication network” was awarded certificate of merit at World congress on Engineering and computer science 2008 organized by International Association of En-gineers at Uc berkeley, san Francisco, UsA. He is currently research candidate and Ph.D degree holder from sathyabama University, chennai, India
Akash C yReceived the Bachelor of Engineering degree in computer science from JssAtE Bangalore, affiliated to Visvesvaraya technological University, belgaum, Karnataka, India. Presently working as Program Developer at AI soft tech-nologies Pvt. Ltd. He is currently member of International Association of computer science and Information technol-ogy (IAcsIt). He is the author of article on “Split Document Image mosaicing”, which was selected and orally presented for IEEE held International conference on Intelligent Network and computing (IcINc 2010), Malaysia and hence the article is published in IEEE Xplore. He is assessed as a reviewer for 3rd IEEE International conference on Machine Learning and computing (IcMLc 2011), sin-gapore and for 2011 4th IEEE International conference on computer science and Information technology (IEEE IccsIt 2011), chengdu, china. His research interests are Computer Networks, Graphics Applications, Web Design, and Web Application Development.
Chandan P rajuReceived the Bachelor of Engineering degree in Computer Science from JssAtE Bangalore, affiliated to Visvesvaraya technological University, belgaum, Karnataka, India. He
is the author of article on “Split Document Image Mosaicing”, which was selected and orally presented for IEEE held Inter-national conference on Intelligent Network and comput-ing (IcINc 2010), Malaysia and hence the article is published in IEEE Xplore. His research interest are Computer Networks, Analysis & Design of Algorithms, Image Processing, Fuzzy Logic. Presently working as Business Development Associate in Web Intellectuals India Pvt. Ltd.
Soumya S GReceived the Bachelor of Engineering degree in Electronics and Communication from MVIt Bangalore, affiliated to Vis-vesvaraya technological University, belgaum, Karnataka, India. Presently working on CAe tools and Hypermesh, as Sales engineer at Altair Engineering India Pvt. Ltd., Ban-galore, India. Her research interest are Computer Networks, Image Processing, System Hardware Assembling.
Chaitra CShe is currently pursuing Bachelor of Engineering degree in electronics and Communication from bMscE Bangalore, affiliated to Visvesvaraya technological University, bel-gaum, Karnataka, India. Her research interest are Computer Networks, Image Processing, Hardware Programming and Fuzzy Logic.
Shreya S She is currently pursuing Bachelor of Engineering degree in electronics and Communication from bMscE Bangalore, af-filiated to Visvesvaraya technological University, belgaum, Karnataka, India. Her research interest are Image Processing and Hardware Programming.

existing Information Visualization techniques for Ab-stract Data on mobile Devices
Ms.U. S.Junghare *, Dr. V. M. Thakare**, Dr. R. V. Dharaskar****Brijlal Biyani Science College, Amravati,
email : [email protected]**SGB Amravati University, Amravati,
email : [email protected]***G. H. Raisoni College of Engineering (GHRCE), Nagpur.
email : [email protected]
AbstrAct
Visualization is a visual or graphical representation of data. Here data may be of different type. to perform visualization on mobile devices different types of data may use like text, picture, maps, physical objects, ab-stract data etc. Mainly visualization is categorized in two areas of visualization that is, scientific visualization and information visualization. Scientific visualization refers to some specific type of data like physical data and it is used for computer modeling and simulation. Information visualization refers to abstract data and used in business and finance, administration, digital media and other ab-stract concepts. the physical and abstract data is only one classification but there are others classification like static and dynamic data, structured and unstructured data, or hierarchical and non-hierarchical data classification. This paper is focus on information visualization of abstract data on mobile devices.
Keywords: Information visualization, data, mobile de-vices.
I INTroDuCTIoN
As per known information, mobile devices have so many limitations as compared to desktop computers like displays are very limited, the width/height ratio is very different from the usual, the on-board hardware is much less powerful; the input peripherals are often insufficient for complex tasks, the input techniques are different, connectivity is slower, affecting the interactivity of applications when a significant quantity of data is stored on remote databases, there is a lack of power-ful, high-level graphics libraries. But Recent mobile are more powerful having high resolution, more colors, large screen, fast connectivity, various tools than old one, but still visualization on mobile devices has remained a challenging task [1].
Information visualization is one of the visualization types that refer to abstract data. Abstract data is generally used in business and finance, administration, digital media and other abstract concepts. As the mobile devices have so many limita-tions but small screen is one of the problems. So visualizing large data on mobile is a challenging task [2].II INFORMATION VISUALIZATION AND ABSTRACT
DATA
I. Information visualization is defined as the use of computer-supported, interactive, visual representations of abstract data to increase cognition. Information visualization is thus a tool that helps the human in gaining insight into data. The purposes of this insight are discovery, decision-making or explanation. Information visualization may involve selecting, transform-ing and representing of abstract data in a form that facilitates human interaction for exploration and understanding. A related activity to information visualization is scientific visualization, which is typically used to gain insight into scientific, usually physical data [3]. Abstract data can be temporal data, spatial data, and other types of data.
Temporal data, such as the voltage range, a stock’s share price, and time series are examples of temporal data etc. Spatial data may be geographic data. Abstract data are generally used in business and finance, administration, digital media and other abstract concepts [1].
III APPLICATIoNS For INFormATIoN VISuALIZA-TION ON MOBILE DEVICES HAVING DIFFERENT
TYPES OF ABSTRACT DATA
Algorithms are generally divided into connection and enclo-sure. Connection approach is explicit and displays hierarchy with a clear structure but utilize display area. enclosure can maximally utilize the screen space but the layout is essentially implicit. Considering the limitations of mobile devices authors [4] presents new approach for hierarchical information visu-alization that is reLT (radial edgeless Tree).
The technological advances of mobile devices offer new opportunities to areas where geographic data has an important role. There are already several geo-referenced information visualization tools for desktop computers, such as metaCarta, Google Maps and Google Earth [5].
Two visualizations have been designed to represent stock values. The first one is devoted to visualization of different val-ues at a given time; the second one is devoted to visualization of the evolution of such values with time. If the values are too numerous, then a clustering can be used to summarize them like a K-Means clustering to merge 40 stocks in 7 clusters [6].
Temporal data is the time related data might use in in-

250 • Part D—ICT
field law enforcement operations. Some in-field operations are tracking (people, objects), patrolling, evidence and data collection, situation monitoring and investigative analysis performed by law enforcement officers that can benefit from using a mobile device for making rapid decisions [7].
Visualization of patient record is also possible on mobile devices like PDA. Information visualization technique have been used to present patient data in visual form with more intuitive navigate ways so that user can analyze and manage patient data easily [8].
To visualize data in 3D form, a well-known ghost view illustrative technique has been used. Ghost-views apply to 3D information a visualization technique, which ensures the visibility of selected items by view-dependently manipulating the transparency of unselected data [9].
Data access from Internet is huge amount of data or in-formation so it is difficult to visualized web data on mobile devices due to small screen size. Therefore various layout methods and visualization algorithm have been developed to effectively delivery various types of information [10].
There is a problem with magic eye view visualization for hierarchy because it displays lot of unused space on mobile screen and the node labels gives the parts of the presentation. Therefore magic eye technique has been improved which spec-ify half ellipsoid or half spheroid with different coordinates. [11]. Author [17] discus the different interface approaches for focus and contextual view i.e. overview-details, zooming, focus-context for desktop applications.
To perform vehicle navigation on mobile devices different techniques has been used that are spatial information filtering, modeling the context and also use one adaptive visualization method. It perform various task i.e. navigation, search etc. Adoptive visualization is one of the new approaches, which consider context and influence aspects [12].
Information visualization technique having insightful de-sign principles and effective visualization prototype can also be used to visualize semantic structure of classical music and get insight into musical structure [13].
Visualization of places and areas where the user’s data is tagged using placegram which is diagrammatic map rep-resentation on the basis of cognitive map theories is present in [14].
It also provides efficient browsing and visualization on mobile devices using 4D keys and compact layout.
Authors [15] present existing visualization techniques that hold multi resolution functionality and describe the visual hi-erarchical aggregation methods for massive data abstraction. Also presents interaction technique appropriate for multi scale visualization navigation.
For the visualization of multi dimensional data there is use of cross filter visualization technique and also represents design plan for corresponding multiple view interface using cross filter [16].
Interactive Weather Information System or IWIS is developed
using unique design-oriented visual images to represent a select group of weather information for the learners [18].
IV INFORMATION VISUALIZATION TECHNIQUES FOR ABSTRACT DATA ON MOBILE DEVICES:
A. Hierarchical information visualization i.e. RELT (Radial Edgeless Tree):Hierarchical information visualization that is reLT (radial edgeless Tree), combines the features of both connection, and enclosure approach. reLT is one of the methods, which overcomes the drawback of connection and enclosure ap-proaches. reLT uses adjacency and direction to represent relationships between nodes and visualized information in a radial layout [4].
Representation of music files in 2D form which Cascade menus across multiple screens. The 3D type is simply a simu-lated 3D view with realistic looking albums. reLT allows the user to define the number of levels to be viewed.
B. Filtering mechanisms based on semantic criteria:There are already several geo-referenced information visual-ization tools for desktop computers, such as metaCarta, Google Maps and Google Earth [5, 19].
A new application that was released recently is the mobile version of Google maps. This application also has some limi-tations because there is no way for the user to further purify his search when there are a lot of results and some of them overlap others.
So the authors [5] describe an ongoing research that aims to design solutions for the visualization of geographic data on mobile devices.
Another method is cross filter visualization for multidimen-sional data which uses interaction to show relation between different values like people, place, time etc. [16]. There are three main elements, views to display unique value, brushes to select subset of value, and switches toggles the filtering between pair of views.
To view the information and related maps on mobile de-vices there is use of tree map technique. It displays information in table and in the form of maps. The related information is point out on maps with the help of brushing and dispersion or scattering technique. Dynamic filter mechanism is also useful to focus on minor group of data from continues downloaded data [20].
C. K-Means clustering:Two forms of visualization have been designed to represent stock values. The first one is devoted to visualization of dif-ferent values at a given time; the second one is devoted to visualization of the evolution of such values with time. If the values are too numerous, then a clustering can be used to summarize them like a K-Means clustering to merge 40 stocks in 7 clusters.
Clustering may be used to represent the variations in stock

• 251
values in the form of bar chart. Pixel bar chart may used to visualize the advancement of
values during a period for different clusters (or stocks) [6].
D. Ghost technique with push based mechanism:real-time data is obtained from sensors such as GPS (Geo-graphical Positioning System) and cameras that reorganized in few seconds. recent updates of information correspond to their background information of past, so that in-field respond-ers can follow changes over time. To visualize such data, ghost technique is used. Push based mechanism is also effective for the visualization of temporal and spatial historical data [7]. It uses a focus plus context exploration lens that also doubles up as a spatial filter for geo-tagged data.
E. Information visualization technique with intuitive navi-gate:The visualization of patient data at temporal granularity shares some common interface features like time line, temporal scroll bar and zoom buttons. This techniques helps the visualization on mobile devices with intuitive navigation [8].
F. Ghost view illustrative technique:Ghost view can be used for volume visualization or 3D multi-media data. Firstly tree cube structure visualization technique is used for the management of 3D multimedia data. Tree cube holds the 3D multimedia data like 3D geometry model. one of the objects of this model may be one model. And the relationship between these objects is referees as hierarchical which allows fast navigation. Like ghost view spring model is another technique, which generally used to see the division of the whole information space according to its attributes or the expansion of information objects.
Author [9] used this technique for health data visualization in which ten different attributes recorded by a health insurance have been used.
G. Fisheye view with focus and context method:Fisheye visualization algorithm may apply to both sequential and hierarchical layout according to the types of information for the effective visualization [10].
Magic eye view is generally modified for hierarchies on hemisphere. every node in the hierarchy are mapped on the two dimensional Cartesian plane with two angles [11].
H. Adoptive visualization:Adoptive visualization is one of the new approaches, which consider context and influence aspects. Mapping tables has been created between context and Gr (Geographic relevance), which is a relation between a geographic information need and the spatio-temporal expression. Now on the basis of Gr rules spatial information has been filter to find useful user-related information. Appropriate adoptive visualization technique has been used to find visualization-based context [12].
I. Layer braid and theme fabric visualization prototype:
musical structure data contains different layers and themes those are getting back from descriptive essay. For the visualiza-tion of semantic structure of music data there are consistent, intuitive, effective and aesthetic design principles for visual representation. To represents layers in visualization there is use of different color plan. Prototype visualization those are layer braid and theme fabric provides micro level layer relationship and theme disparity and also provides interaction between layers and theme [13].
J. Diagrammatic map based visualization: Placegram is one of the diagrammatic map based visualization technique which includes preprocessing, place layout, connect-ing and weighting places or area clustering and label layout. Preprocessing is for input data (place) to merge them together for next steps. Here is use of place alignment algorithm to com-press layout horizontally and vertically and in grid alignment places are break to brows using 4D keys and to get easy visual layout on mobile devices than normal mode. These places are link together by constructing minimum spanning tree and the corners of tree are flattening diagonally [14].
K. Hierarchical Aggregation Visualization:In hierarchical aggregation it is needed to differ between overlapping and space filling visualization techniques that is overlapping never restrict on visual items layout while the space filling restrict on layout to avoid overlapping.
There are above, below, level and range rendering travers-als to travel visual hierarchical aggregation. For navigation and manipulation there are zoom and pan, drill-down and roll-up, local aggregation, flipping, coupled zooming and drilling interaction techniques [15].
V ANALySIS AND DISCuSSIoN:
As compare to the desktop, mobile devices have many limita-tions but two main limitations are small screen and less mem-ory. Due to the small screen size effective information display is difficult. So many information visualization algorithms and techniques of desktop can apply to mobile devices to solve mobile limitation. Information visualization allows effective visualization of large information on mobile devices.
There are different information visualizations techniques, which are used to improve visualization of large information on small screen mobile devices. As the mobile devices has less memory it may takes the use of remote server for infor-mation storage.
VI CoNCLuSIoNS:
This paper discusses the different information visual-ization techniques for different types of abstract data on mobile devices as compare to desktop. It also gives focus on the use of information visualization on mobile devices and desktop screen.
As the mobile devices have less memory so it’s not possible
Existing Information Visualization techniques for Abstract Data on Mobile Devices

252 • Part D—ICT
to store large information on mobile for visualization but that is not a problem with desktop. many of the desktop information visualization techniques can be used for the visualization on mobile by using remote visualization.
reFereNCeS
[1] Luca Chittaro, “Visualizing Information on Mobile Devices”, Volume 39, University of Udine, Italy, March 2006, pages: 40-45.
[2] Miran Mosmondor, Hrvoje Komericki, Igor S. Pandzic, “3D Visualization on mobile devices” Journal Telecom-munication Systems, Publisher Springer Netherlands, ISSN 1018-4864 (Print) 1572-9451 (Online), Issue Volume 32, Numbers 2-3 / July, 2006, Pages 181-191.
[3] Tomi Heimonen, “Information Visualization on Small Display Devices” university of Tampere, Department of Computer and Information Sciences, Master’s Thesis, 79 pages, September 2002
[4] Jie Hao, Kang Zhang, “A Mobile Interface for Hierar-chical Information Visualization and Navigation”, ISCe Ieee International Symposium on Consumer electron-ics, Publication : June 2007, pp: 1-7
[5] Paulo Pombinho de Matos ,Ana Paula Afonso, Maria Beatriz Carmo, “Geo-referenced Information Visualiza-tion on Mobile Devices”, year of publication-2008.
[6] Monique Noirhomme-Fraiture, Frederic Randolet, Luca Chittaro, and Gregory Custinne , “Data visualizations on small and very small screens”, Proc. of ASMDA, 2005, pp: 276-285.
[7] Avin Pattath ,David Ebert ,William Pike, “Temporal data representation on mobile devices for in-field law enforcement” Workshop on Interacting with Temporal Data at CHI Boston, MA, USA., April 2009,pp- 4-9, ACM 978-1-60558-246
[8] Luca Chittar ,“Visualization of Patient Data at Different Temporal Granularities on mobile Devices”, ITALy. Proc. of the working conference on Advanced visual interfaces, Year of Publication: 2006
[9] Martin Luboschik, Heidrun Schumann, “Discovering the Covered: Ghost-Views in Information Visualiza-tion”, Proceeding of the 16th International Conference in Central europ on Computer Graphics, Visualization and Computer Vision, 2008, pp-113-118.
[10] Hee Yong Yoo, Suh Hyun Cheon, “Visualization by information type on mobile device”, Proceeding of the Asia-Pacific Symposium on Information Visualization, Vol. 60, 2006.

A Study of Standard encryption Algorithm Saurav Suman#1, K.rajeshkumar*2, om Prakash Kumar*3
1,2,3ECE Department, Karunya University, Coimbatore, [email protected]
[email protected]@gmail.com
AbstrAct
Information Confidentiality has a prominent significance in the study of ethics, law and most recently in Information, with the increase of technology and human intelligent the art of cryptography has greatly leaded to a complex structure. there are arrays of encryption systems those are being deployed in the world of Information systems by various organizations. However, for the wider use, we need to adapt to a particular encryption method and standard .Here in this paper we have implementing the Advanced Encryption standard (AEs) using hardware descriptive language (HDL). through the knowledge of AEs we will proceed towards the security enhancement.
Keywords— I Encryption, AES.
I. INTroDuCTIoN
This AeS was announced by National Institute of Standards and Technology (NIST) as U.S. FIPS PUB 197 on November 26, 2001 after a 5-year standardization process in which fifteen competing designs were presented and evaluated before rijndael was selected as the most suitable. It became effective as a standard May 26, 2002. As of 2009, AES is one of the most popular algorithms used in symmetric key cryptography. It is available in many different encryption packages. AeS is the first publicly accessible and open cipher approved by the NSA for top secret information
The Rijndael cipher was developed by two Belgian cryptographers, Joan Daemen and Vincent Rijmen, and submitted by them to the AeS selection process. rijndael is a portmanteau of the names of the two inventors and is pronounced.
This standard specifies the rijndael algorithm, a symmetricblock cipher that can process data blocks of 128 bits using cipher keys with lengths of 128, 192 and 256 –bits or The AeS algorithm is capable of using cryptographic keys of 128, 192, and 256 bits to encrypt and decrypt data in blocks of 128 bits.
II. reCeNT reLATeD WorK
recent AeS implementation focussed on performance of the AES core, and its power pap[10] .The S-Box implemented in form of SOP logic consumes 75% of the power, reported by Sumio Morioka and Akashi Satoh, IBM Japan Ltd, Tokyo research Laboratory. The most obvious implementation
approach for the S-Box applies look-up tables in the form of ROM. Because this approach takes relatively high hardware overheads and power consumption, more advanced approaches turns to calculate the S-Box function in hardware using its arithmetic properties. The focus of such implementations is the efficient realization of the inversion in GF(28), which can be achieved by decomposing the finite field into the sub-fields GF(24) and GF(22)(2). In this paper [11] their Implementation of the AeS algorithm with a small area will select the basic reference architecture, which needs the implementation of one round only and re-use it to complete the ten encryption rounds, it was designed that the Encryptor/ Decryptor complete one encryption round in one clock cycle so the output of the Encryptor/ Decryptor will be valid after ten clock cycles from the data entrance.
The key schedule architecture is chosen to generate all the sub-keys on the fly in parallel with the encryption module. For the encryptor implementation the hardware required to generate one set of sub-key and re-use it in the calculation of the other sub-keys, and at the same time also use one clock cycle for one sub-key generation. For the decryptor the last subkey has to be generated first to use it in the first decipher round, so the same key expansion architecture cannot be used with cipher and select one of the other architectures either by generation of all sub-keys beforehand and storing them in a rAm. The merit of this is area reduced and speed increased with respect to each module but the overall delay increased.In this paper[4] ,they proposed a new approach to represent general S-box based on linear transform and a given non-linear function that increases the complexity of algebraic expression and size of 8,the proposed S-box can archive the maximum number of terms and therefore it can be used to replace the classical S-box component in the original S-box.in this security been increased but the overall delay also started raising .
III. METhODOLOGY
All For the AeS algorithms, the length of the input block, the output block and the state is 128 bits. This is represented by Nb = 4, which reflects the number of 32-bit words (number of columns) in the State. For the AeS algorithm, the length of the cipher Key, K, is 128, 192, or 256 bits. The key length is represented by Nk = 4, 6, or 8, which reflects the number of 32-bit words (number of columns) in the Cipher Key.
For the AeS algorithm, the number of rounds to be performed during the execution of the algorithm is dependent on the key size. The number of rounds is represented by Nr, where Nr = 10 when Nk = 4, Nr = 12 when Nk = 6, and Nr

254 • Part D—ICT
= 14 when Nk = 8.TABLE I
Key-Block-Round Combinations
The S-box used in the subbytes ( ) transformation is presented in hexadecimal form in Figure 8. For example, if s’1,1 = 53, then the substitution value would be determined by the intersection of the row with index ‘5’ and the column with index ‘3’ in Figure 8. This would result in s’1,1 having a value of ed.
2) ShiftRows ( ) Transformation In the shiftrows ( ) transformation, the bytes in the last
three rows of the State are cyclically shifted over different numbers of bytes. The first row, r = 0, is not shifted. Specifically, the shiftrows ( ) transformation proceeds as follows: s’r,c = sr,(c+shift (r,Nb)) mod N b for 0 < r < 4 and 0 <c< Nb, (3.2) where the shift value shift(r,Nb) depends on the row number, r, as follows (recall that Nb = 4):
shift (1,4) = 1 ; shift (2,4) = 2 ; shift (3,4) = 3 ; (3.3) This has the effect of moving bytes to “lower” positions in the row (i.e., lower values of c in a given row), while the “lowest” bytes wrap around into the “top” of the row (i.e., higher values of c in a given row).
3) MixColumns ( ) TransformationThe Mixcolumns ( ) transformation operates on the State
column-by-column, treating each column as a four-term polynomial. The columns are considered as polynomials over GF(28) and multiplied modulo x4 + 1 with a fixed polynomial a(x), given by
AEs Version Key Length block size Number of
(Nk words) (Nb words) rounds (Nr)AES-128 4 4 10 AES-192 6 4 12
For both its Cipher and Inverse Cipher, the AeS algorithm uses a round function that is composed of four different byte-oriented transformations: 1) byte substitution using a substitution table (S-box), 2) shifting rows of the State array by different offsets, 3) mixing the data within each column of the State array, and 4) adding a Round Key to the State. These transformations (and their inverses) are described below:
A. CipherTitle At the start of the Cipher, the input is copied to the
State array using the conventions described earlier. After an initial round Key addition, the State array is transformed by implementing a round function 10, 12, or 14 times (depending on the key length), with the final round differing slightly from the first Nr -1 rounds. The final State is then copied to the output.
The round function is parameterized using a key schedule that consists of a one-dimensional array of four-byte words derived using the Key expansion routine.
The Cipher is described in the pseudo code below. The individual transformations -
subbytes ( ), shiftrows ( ), Mixcolumns ( ), and AddroundKey ( ) – process the State and are described in the following subsections.
1) SubBytes ( )TransformationThe subbytes ( ) transformation is a non-linear byte
substitution that operates independently on each byte of the State using a substitution table (S-box). This S-box , which is invertible, is constructed by composing two transformations:
1. Take the multiplicative inverse in the finite field GF(28), the element 00 is mapped to itself.
2. Apply the fol lowing aff ine t ransformat ion (over GF(28) ):
bi = bi ⊕b(i+4) mod 8 ⊕ b(i+5) mod 8⊕b(i+6) mod 8 ⊕ b(i+7) mod 8 ⊕ci
(3.1)for 0 < i < 8 where bi is the ith bit of the byte, and ci is the
ith bit of a byte c with the value 63 or 01100011. Here and elsewhere, a prime on a variable indicates that the variable is to be updated with the value on the right.
Fig 1. SubBytes ( ) applies the S-box to each byte of the State
a(x)=03x3+01x2+01x+02 . (3.4)
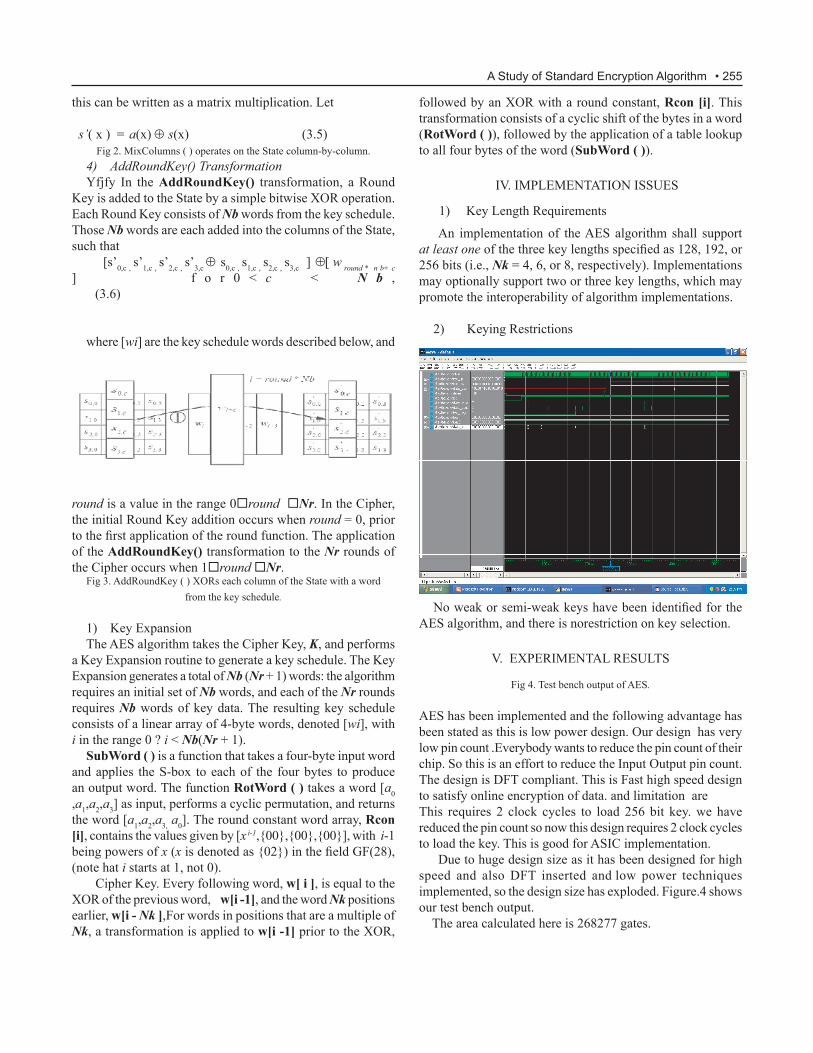
• 255
this can be written as a matrix multiplication. Let s’( x ) = a(x) ⊕ s(x) (3.5)
Fig 2. mixColumns ( ) operates on the State column-by-column.4) AddRoundKey() Transformationyfjfy In the AddroundKey() transformation, a round
Key is added to the State by a simple bitwise XOR operation. each round Key consists of Nb words from the key schedule. Those Nb words are each added into the columns of the State, such that
[s’0,c , s’1,c , s’2,c , s’3,c ⊕ s0,c , s1,c , s2,c , s3,c ] ⊕[ w round * n b+ c ] f o r 0 < c < N b , (3.6)
where [wi] are the key schedule words described below, and
followed by an XOR with a round constant, rcon [i]. This transformation consists of a cyclic shift of the bytes in a word (rotWord ( )), followed by the application of a table lookup to all four bytes of the word (subWord ( )).
IV. ImPLemeNTATIoN ISSueS
1) Key Length requirements
An implementation of the AeS algorithm shall support at least one of the three key lengths specified as 128, 192, or 256 bits (i.e., Nk = 4, 6, or 8, respectively). Implementations may optionally support two or three key lengths, which may promote the interoperability of algorithm implementations.
2) Keying restrictions
round is a value in the range 0round Nr. In the Cipher, the initial round Key addition occurs when round = 0, prior to the first application of the round function. The application of the AddroundKey() transformation to the Nr rounds of the Cipher occurs when 1round Nr.
Fig 3. AddRoundKey ( ) XORs each column of the State with a wordfrom the key schedule.
1) Key expansionThe AeS algorithm takes the Cipher Key, K, and performs
a Key expansion routine to generate a key schedule. The Key expansion generates a total of Nb (Nr + 1) words: the algorithm requires an initial set of Nb words, and each of the Nr rounds requires Nb words of key data. The resulting key schedule consists of a linear array of 4-byte words, denoted [wi], with i in the range 0 ? i < Nb(Nr + 1).
subWord ( ) is a function that takes a four-byte input word and applies the S-box to each of the four bytes to produce an output word. The function rotWord ( ) takes a word [a0 ,a1,a2,a3] as input, performs a cyclic permutation, and returns the word [a1,a2,a3, a0]. The round constant word array, rcon [i], contains the values given by [x
i-1,00,00,00], with i-1 being powers of x (x is denoted as 02) in the field GF(28), (note hat i starts at 1, not 0).
Cipher Key. every following word, w[ i ], is equal to the XOR of the previous word, w[i -1], and the word Nk positions earlier, w[i - Nk ],For words in positions that are a multiple of Nk, a transformation is applied to w[i -1] prior to the XOR,
No weak or semi-weak keys have been identified for the AeS algorithm, and there is norestriction on key selection.
V. EXPERIMENTAL RESULTS
Fig 4. Test bench output of AES.
AeS has been implemented and the following advantage has been stated as this is low power design. our design has very low pin count .everybody wants to reduce the pin count of their chip. So this is an effort to reduce the Input output pin count. The design is DFT compliant. This is Fast high speed design to satisfy online encryption of data. and limitation are This requires 2 clock cycles to load 256 bit key. we have reduced the pin count so now this design requires 2 clock cycles to load the key. This is good for ASIC implementation. Due to huge design size as it has been designed for high speed and also DFT inserted and low power techniques implemented, so the design size has exploded. Figure.4 shows our test bench output. The area calculated here is 268277 gates.
A Study of Standard Encryption Algorithm
256 • Part D—ICT
VI. CONCLUSIONS
This architecture is being developed and prototyped inan FPGA platform using the Verilog® Hardware Description Language (HDL) and the Spartan IIe . This is Fast high speed design to satisfy online encryption of data. The simulation shows that this design can run at 1.2GHz which is more than enough for online data encryption usage. In the convention it requires 2 clock cycles to load 256 bit key. we have reduced the pin count so now this design requires 2 clock cycles to load the key. The major problem accomplished by this is the area constraint, which has be focussed in coming research .
reFereNCeS
[1] AES page available via http://www.nist.gov/CryptoToolkit.4.
[2] A.Lee, NIST Special Publication 800-21, Guideline for Implementing Cryptography in the Federal Government, National Institute of Standards and Technology, November 1999.
[3] B. Gladman’s AES related home page http://fp.gladman.plus.com/cryptography_technology/.
[4] Bao Ngoc Tran ,Thuc Dinh Nguyen,Thu Dan Tran” A New S-Box Structure To Increase Complexity Of Algebraic Expression For Block Cipher Cryptosystems IEEE Transactions On Information Theory, Vol. 52, No. 5, Pp. 1241-1260, September 2009.
[5] Computer Security Objects Register (CSOR): http://csrc.nist.gov/csor/.
[6] D. Liu and C. Svensson, “Trading speed for low power by choise of supply and threshold voltages,” IEEE J. Solid-State Circuits, vol. 28,pp. 10–17, Jan. 1993.
[7] J. Daemen and V. Rijmen, AES Proposal: Rijndael, AeS Algorithm Submission, September 3, 1999, available at [1].
[8] J. Daemen and V. Rijmen, The block cipher Rijndael, Smart Card research and Applications, LNCS 1820, Springer-Verlag, pp. 288-296.
[9] William Stallings , cryptography and network security Pearson education,, 2004, p.143-171.
[10] J. Wolkerstorfer, E. Oswald, and M. Lamberger, “An ASIC implementation of the AES SBoxes,” in Proc. CT-RSA, vol. LNCS 2271, 2002,pp. 67–78.
[11] “Jinyi Zhang, Qinghua Zuo , Tianbao” Reducing The Power Consumption Of Aes S-Box By Ssc In Proc. 43th Ieee Midwest Symp. On Circuits And Systems, Lansign Mi, Aug 8-11,2000.
[12] T. Sundstr¨om and A. Alvandpour, “A comparative analysis of logic styles for secure IC’s against DPA attacks,” in Proc. IEEE Norchip, Nov. 2005,pp. 297–300.
[13] “M.R.M. Rizk And M.Morsy” Optimized Area And optimized Speed Hardware Implementations of Aes on Fpga In Proc. 7th Int. Workshop On Cryptographic Hardware And Embedded Systems (Ches 2007), Pages 441-445, Edinburgh, Uk, Aug. 29-Sept.

Application of mamdani-model based ANFIS for Pro-jecting Students’ Performance PAGE based on the Atten-
dancePratibha DeWANGAN
Government College of Education, Raipur (Chhattisgarh) India-492001e-mail : [email protected]
M. F. Qureshi / N. P. Dewangan Government Polytechnic, Janjgir-Champa (CG)Government Engineering College, Raipur (C.G.)
e-mail : [email protected]

258 • Part D—ICT

• 259Application of Mamdani-model based ANFIS for Projecting Students’ Performance PAGE based on the Attendance

260 • Part D—ICT