Part 651 Agricultural Waste Management Field Handbook - NET
126
Extracted from the NRCS “Agricultural Waste Management Field Handbook Part 651, Agricultural Wastes and Water, Air, and Animal Resources” To read the complete document go to http://directives.sc.egov.usda.gov/viewerFS.aspx?hid=21430
-
Upload
khangminh22 -
Category
Documents
-
view
0 -
download
0
Transcript of Part 651 Agricultural Waste Management Field Handbook - NET
Extracted from the NRCS “Agricultural Waste
Management Field Handbook Part 651, Agricultural Wastes and
Water, Air, and Animal Resources”
To read the complete document go to
http://directives.sc.egov.usda.gov/viewerFS.aspx?hid=21430
(210–VI–AWMFH, Amend. 52, February 2012)
United States Department of AgricultureNatural Resources Conservation Service
Part 651 Agricultural Waste Management Field Handbook
Chapter 3 Agricultural Wastes and Water, Air, and Animal Resources
Part 651Agricultural Waste Management Field Handbook
Agricultural Wastes and Water, Air, and Animal Resources
Chapter 3
(210–VI–AWMFH, Amend. 52, February 2012)
Issued February 2012
The U.S. Department of Agriculture (USDA) prohibits discrimination in all its programs and activities on the basis of race, color, national origin, age, disability, and where applicable, sex, marital status, familial status, parental status, religion, sexual orientation, genetic information, political beliefs, reprisal, or because all or a part of an individual’s income is derived from any public assistance program. (Not all prohibited bases apply to all pro-grams.) Persons with disabilities who require alternative means for commu-nication of program information (Braille, large print, audiotape, etc.) should contact USDA’s TARGET Center at (202) 720-2600 (voice and TDD). To file a complaint of discrimination, write to USDA, Director, Office of Civil Rights, 1400 Independence Avenue, SW., Washington, DC 20250–9410, or call (800) 795-3272 (voice) or (202) 720-6382 (TDD). USDA is an equal opportunity provider and employer.
(210–VI–NEH, Amend. 52, February 2012)
Acknowledgments
Chapter 3 was originally prepared and printed in 1992 under the direction of by James N. Krider (retired), national environmental engineer, Soil Conservation Service (SCS), now Natural Resources Conservation Service (NRCS). James D. Rickman (retired), environmental engineer, NRCS, Fort Worth, Texas, provided day-to-day coordination in the development of the handbook. Authors and those who made major contributions to chapter 3 included Michael F. Walter, Cornell University, Ithaca, New York; Victor W.E. Payne (retired), environmental engineer, NRCS, Auburn, Alabama; and Timothy Powers (retired), environmental engineer, NRCS, Nashville, Tennessee.
This version was prepared under the direction of Noller Herbert, direc-tor, Conservation Engineering Division (CED), Washington, DC. Revisions to the chapter were provided by Bill Reck, environmental engineer, East National Technical Support Center, Greensboro, North Carolina, and Greg Zwicke, air quality engineer, West National Technical Support Center, Portland, Oregon. It was finalized under the guidance of Darren Hickman, national environmental engineer, CED, Washington, DC.
Editorial and illustrative assistance was provided by Lynn Owens, editor; Wendy Pierce, illustrator; and Suzi Self, editorial assistant, National Geo-spatial Management Center, Fort Worth, Texas.

Part 651Agricultural Waste Management Field Handbook
Agricultural Wastes and Water, Air, and Animal Resources
Chapter 3
3–ii (210–VI–AWMFH, Amend. 52, February 2012)

(210–VI–AWMFH, Amend. 52, February 2012) 3–iii
Contents 651.0300 Introduction 3–1
651.0301 Pollution versus contamination 3–1
651.0302 Effects of animal waste on the water resource 3–2
(a) Constituents affecting surface water quality ..............................................3–2
(b) Constituents affecting groundwater quality .............................................3–15
651.0303 Factors affecting the water pollution process 3–16
(a) Pathways to pollution ..................................................................................3–16
(b) Transformations on the soil surface ..........................................................3–16
(c) Filtering in the upper soil layer ..................................................................3–17
(d) Transformations within the deep soil profile .............................................3–17
651.0304 Controlling the water pollution process 3–18
(a) Limiting availability .......................................................................................3–19
(b) Preventing detachment ................................................................................3–20
(c) Interrupting transport ..................................................................................3–20
651.0305 Effects of animal waste on the air resource 3–21
(a) Odors ...............................................................................................................3–21
(b) Particulate matter ..........................................................................................3–21
(c) Greenhouse gases .........................................................................................3–21
(d) Ozone precursors .........................................................................................3–22
(e) Animal health and asphyxiation .................................................................3–22
651.0306 Effects of animal waste on the animal resource 3–24
651.0307 Conservation practice physical effects 3–25
651.0308 Summary 3–25
651.0309 References 3–27
Chapter 3 Agricultural Wastes and Water, Air, and Animal Resources

Part 651Agricultural Waste Management Field Handbook
Agricultural Wastes and Water, Air, and Animal Resources
Chapter 3
3–iv (210–VI–AWMFH, Amend. 52, February 2012)
Tables Table 3–1 A sampling of influent BOD5 concentrations and range of 3–4
effluent concentration for various types of anaerobic la-goons
Table 3–2 Concentrations of total ammonia (NH3 + NH
4) in mg/L 3–6
that contain an un-ionized concentration of 0.020 mg/L NH3
Table 3–3 Estimated concentrations of total dissolved nitrogen in 3–7runoff from land with and without livestock and poultrymanure surface applied
Table 3–4 Estimated dissolved P concentrations in runoff 3–10 from land with and without animal wastes surface applied
Table 3–5 Diseases and organisms spread by animal manure 3–14
Table 3–6 Typical allowable limits for fecal coliform bacteria based 3–14on water use
Table 3–7 Typical fecal coliform to fecal streptococcus ratios 3–14(as excreted) for several animal species
Table 3–8 Soil factors affecting infiltration and movement (leaching) 3–17of bacteria in soil
Table 3–9 Properties and physiological effects of the most important 3–23gases produced from animal wastes in an anaerobic environ-ment
Figures Figure 3–1 Aerobic cycle of plant and animal growth and decomposi- 3–4tion as related to nitrogen and carbon
Figure 3–2 Site analysis diagram 3–5
Figure 3–3 Phosphorus inputs and losses at a waste application site 3–8and P transformation within the profile (abbreviated P cy-cle)
Figure 3–4 Phosphorus retention and solubility as related to soil pH 3–10
Figure 3–5 Lake trophic states based on model by Vollenweider 3–13
Figure 3–6 Transformations on or in the soil 3–18
Figure 3–7 Possible danger points in the environment from 3–26uncontrolled animal waste

(210–VI–AWMFH, Amend. 52, February 2012)
651.0300 Introduction
This chapter focuses on the effects that agricultural wastes can have on water, air, and animal resources. Special emphasis is placed on the reactions of particu-lar contaminants within the aquatic environment (how they change and how they affect aquatic life and hu-man health). The impact of contaminants on designat-ed uses of water is not covered in detail here because it is adequately covered in chapter 1 of this handbook. The pollutant delivery process—the movement of pol-lutants from the source to a stream or water body—is described in this chapter.
651.0301 Pollution versus contamination
In addressing the subject of pollution, we must be aware that none of the natural resources, especially water and air resources, is completely pure. Air often contains pollen, dust, volcanic ash, and other particu-lates. In that sense, the air we breathe would rarely be “pure,” even without the influence of humans.
Likewise, all natural water, including surface water, groundwater, and precipitation, contains foreign substances; it is not simply two parts hydrogen and one part oxygen (H
2O). Some foreign substances oc-
cur naturally, and some are there because of cultural contamination (human activity on the land).
Natural water might contain minerals, salts, algae, bacteria, gases, and chemicals and have an unpleas-ant taste, yet it still might not be considered polluted. Water generally is considered polluted only if foreign substances in the water result in impairment of a specific, designated use of the water. The determina-tion of use impairment is based on the quality of water not meeting established limits for specific constituents (e.g., 5 mg/L of dissolved oxygen) and not necessarily on an obvious problem, such as an alga bloom or bad taste and odor.
Water may be contaminated by substances, but not be considered polluted with regard to meeting estab-lished standards. A farmer, for example, may fertilize the farm pond at recommended rates in the spring to enhance fish production. This purposeful addition of nutrients to the water and the subsequent minor enrichment do not constitute an act of pollution be-cause the intended use of the water (fish production in this case) is not impaired; rather, fish production is enhanced.
On the other hand, if the water from that same farm pond was discharged to a stream having an inlet pipe for a municipal water supply immediately down-stream, the discharge could be considered polluted if it contained a concentration of any substance that did not meet State standards for a water supply. The alga that served as a source of feed for aquatic organisms in the pond could become unwanted suspended solids and a potential problem at the water treatment plant.
Chapter 3 Agricultural Wastes and Water, Air, and Animal Resources
Part 651Agricultural Waste Management Field Handbook
Agricultural Wastes and Water, Air, and Animal Resources
Chapter 3
3–2 (210–VI–AWMFH, Amend. 52, February 2012)
In this chapter, pollution refers to a resource that has been contaminated beyond legal limits. Such limits are specifically designated by State agencies, but may be limited to only the water and air resources. However, limits can also be applied to soils and plants to prevent unsafe levels of heavy metals where municipal sludge is being applied. Fish and cattle (animal resources) may also be contaminated to unsafe levels with pesti-cides or other substances, but specific pollution limits for this resource may not be a part of State standards.
Chapter 1 of this handbook provides detailed informa-tion on the designated use classifications that most States use to establish pollution limits for water. Infor-mation on the ways in which each use can be affected by agricultural pollutants and the characteristics of nonpoint source pollution are also included in that chapter.
651.0302 Effects of animal waste on the water resource
Animal waste contains a number of contaminants that can adversely affect surface and groundwater. In addition, certain of the constituents in animal waste can impact grazing animals, harm terrestrial plants, and impair air quality. However, where animal waste is applied to agricultural land at acceptable rates, crops can receive adequate nutrients without the addition of commercial fertilizer. In addition, soil erosion can be substantially reduced and the water-holding capac-ity of the soil can be improved if organic matter from animal waste is incorporated into the soil.
(a) Constituents affecting surface water quality
The principal constituents of animal waste that impact surface water are organic matter, nutrients, and fecal bacteria. Animal waste may also increase the amount of suspended material in the water and affect the color either directly by the waste itself or indirectly through the production of algae. Indirect effects on surface water can also occur when sediment enters streams from feedlots or overgrazed pastures and from eroded streambanks at unprotected cattle crossings. The impact that these contaminants have on the aquatic environment is related to the amount and type of each pollutant entering the system and the characteristics of the receiving water.
(1) Organic matterAll organic matter contains carbon in combination with one or more other elements. All substances of animal or vegetable origin contain carbon compounds and are, therefore, organic.
When plants and animals die, they begin to decay. The decay process is simply the various naturally occur-ring microorganisms converting the organic matter—the plant and body tissue—to simpler compounds. Some of these simpler compounds may be other forms of organic matter or they may be compounds, such as nitrate and ortho-phosphate, or gases, such as nitrogen gas (N
2), ammonia (NH
3), and hydrogen sulfide (H
2S).

3–3
Part 651Agricultural Waste Management Field Handbook
Agricultural Wastes and Water, Air, and Animal Resources
Chapter 3
(210–VI–AWMFH, Amend. 52, February 2012)
When manure or other organic matter is added to water, the decay process occurs just as it does on land. Microorganisms attack these organic materials and begin to consume and convert them. If the water contains dissolved oxygen, the organisms involved in the decay process are aerobic or facultative. Aerobic organisms require free (dissolved) oxygen to survive, while facultative organisms function in both aerobic (oxygen present) or anaerobic (oxygen absent) envi-ronments.
As the organisms consume the organic matter, they also consume free oxygen. The principal by-products of this aerobic digestion process are carbon dioxide (CO
2) and water (H
2O). Figure 3–1 is a schematic rep-
resentation of the aerobic digestion cycle as it relates to nitrogenous and carbonaceous matter.
In a natural environment, the breakdown of organic matter is a function of complex, interrelated, and mixed biological populations. However, the organisms principally responsible for the decomposition process are bacteria. The size of the bacterial community depends on its food supply and other environmental factors including temperature and pH.
If a large amount of organic matter, such as manure, is added to a water body, the bacterial population begins to grow, with the rate of growth expanding rapidly. Theoretically, the bacterial population doubles with each simultaneous division of the individual bacteria; thus, one divides to become two, two becomes four, four becomes eight, and so forth. The generation time, or the time required for each division, may vary from a few days to less than 30 minutes. One bacterium with a 30-minute generation time could yield 16,777,216 new bacteria in just 12 hours.
Because each bacterium extracts dissolved oxygen from the water to survive, the addition of waste and the subsequent rapid increase in the bacterial popula-tion could result in a drastic reduction in dissolved oxygen in a stream. The point in a stream where the maximum oxygen depletion occurs can be a consider-able distance downstream from the point where pol-lutants enter the stream. The level of oxygen depletion depends primarily on the amount of waste added; the size, velocity, and turbulence of the stream; the initial dissolved oxygen levels in the waste and in the stream; and the temperature of the water.
A turbulent stream can assimilate more waste than a slow, placid stream because the turbulence brings air into the water (re-aeration) and helps replenish the dissolved oxygen. In addition, cold water can hold more dissolved oxygen than warm water. For example, pure water at 10 degrees Celsius (50 °F) has 10.92 mil-ligrams per liter of dissolved oxygen when fully satu-rated, while water at 30 degrees Celsius (86 °F) has 7.5 milligrams per liter at the saturation level.
An adequate supply of dissolved oxygen is essential for good fish production. Adding wastes to a stream can lower oxygen levels to such an extent that fish and other aquatic life are forced to migrate from the pollut-ed area or die for lack of oxygen. The decomposition of wastes can also create undesirable color as well as taste and odor problems in lakes used for public water supplies.
The amount of organic matter in water can be de-termined with laboratory tests, including those for 5-day biochemical oxygen demand (BOD
5), chemical
oxygen demand (COD), and volatile solids (VS). Table 3–1 illustrates BOD
5 values for a sampling of lagoon
influents and effluents for various livestock facilities. The table is used for illustration only and shows how “strong” agricultural wastes can be, even after treat-ment. Concentrations will vary considerably from these values, depending on such factors as the age and size of the lagoon, characteristics of the waste, geo-graphical location, and the amount of dilution water added.
The BOD5 value for raw domestic sewage ranges from
200 to 300 milligrams per liter, while that for municipal wastewater treated to the secondary level is about 20 milligrams per liter. Because municipal waste is so much more dilute, the concentrations of BOD
5 are
much lower than those in treated animal waste. Nev-ertheless, animal wastewater released to a stream, though smaller in total volume relative to municipal discharges, can be more concentrated and cause se-vere damage to the aquatic environment.

Part 651Agricultural Waste Management Field Handbook
Agricultural Wastes and Water, Air, and Animal Resources
Chapter 3
3–4 (210–VI–AWMFH, Amend. 52, February 2012)
Figure 3–1 Aerobic cycle of plant and animal growth and decomposiyion as related to nitrogen and carbon
Table 3–1 A sampling of influent BOD5 concentrations and range of effluent concentration for various types of anaerobic
lagoons
Source Lagoon influent Lagoon effluent - - - - - - - - - - - - - - mg/L - - - - - - - - - - - - - -
Dairy 6,000 200–1,200
Beef 6,700 200–2,500
Swine 12,800 300–3,600
Poultry 9,800 600–3,800
Organic compoundscontaining
nitrogen, carbon
O2
CO2
CO2
CO2
O2
Intermediateproducts
NO2
CO2
Oxi
dati
on
Oxidation
Stable end productsNO
3
CO2
CO2
Dec
ompo
siti
on
Pla
nt f
ood
Initial productsof decomposition
NO3
CO2
AnimalsAnimal food
DeathPlants
NH3
Wastedeath
O2
N2
CO2

3–5
Part 651Agricultural Waste Management Field Handbook
Agricultural Wastes and Water, Air, and Animal Resources
Chapter 3
(210–VI–AWMFH, Amend. 52, February 2012)
(2) Nutrients The principal nutrients of concern in the aquatic environment are nitrogen (N) and phosphorus (P). An understanding of how these nutrients react in the environment is important to understanding the control processes described in later sections.
(i) Nitrogen—Nitrogen occurs throughout the envi-ronment—in the soil, water, and surrounding air. In fact, 78 percent of the air we breathe is N. It is also a
Figure 3–2 Site analysis diagram
1 1 11 1
2
3
4
5
6
Electrical fixation
Combustionfixation
Removed inharvested cropsand livestock
and small amounts of nitrogen oxides and ammonia70,000,000 pounds over each acre
Atmospheric nitrogen gas (N2)
Organicnitrogen (Org-N)
in soil organicmatter
Animaluptake
Plantuptake
Crop residues
Denitrification
Nitrate N
Nitrification
Ammonium N(NH
4)
Removed by leaching
Immobilizationtemporarilyused up by
bacteria
Manure
Mobilization
Legumes
AzotobacterClostridiumAlgae
NH3
N2
(NO3)
N2O
NO
Nitrogen fertilizer
Industrial fixationBiologicalfixation
Food
part of all living organisms. When plants and animals die or when waste products are excreted, N returns to the environment and is cycled back to the land, water, and air and eventually back to other plants and ani-mals.
Figure 3–2 depicts the N cycle. It shows the flow from one form of N to another. The various forms of N can have different effects on our natural resources—some good and some bad.

Part 651Agricultural Waste Management Field Handbook
Agricultural Wastes and Water, Air, and Animal Resources
Chapter 3
3–6 (210–VI–AWMFH, Amend. 52, February 2012)
The conversion from one form of N to another is usually the result of bacterial processes. Some con-versions require the presence of oxygen (aerobic systems), while others require no oxygen (anaerobic systems). Moisture content of the waste or soil, tem-perature, and pH speed or impede conversions.
In water quality analyses, total nitrogen (TN) includes the organic (Org-N), total ammonia (NH
3 + (NH
4 (the
ammonium ion)), nitrite (NO2), and nitrate (NO
3)
forms. Total Kjeldahl nitrogen (TKN) includes the total organic and total ammonia nitrogen. The NH
3, NO
2,
and NO3 forms of N may be expressed in terms of the
concentration of N (NO3–N or NH
4–N) or in terms of
the concentration of the particular ion or molecule (NO
3 or NH
4). Thus, 45 milligrams per liter of NO
3 is
equivalent to 10 milligrams per liter of NO3–N. (See
chapter 4 of this handbook for conversions and ex-pressions.)
Organic nitrogen—Nitrogen in fresh manure is mostly in the organic form (60–80% of TN). In an anaerobic lagoon, the organic fraction is typically 20 to 30 percent of TN. Org-N in the solid fraction (feces) of most animal waste is usually in the form of complex molecules associated with digested food, while that in the liquid fraction is in the form of urea.
From 40 to 90 percent of the Org-N is converted to NH
3 within 4 to 5 months after application to the land.
The conversion of Org-N to NH3 (called mineraliza-
tion) is more rapid in warmer climates. Under the right temperature and moisture conditions, mineralization can be essentially complete in 60 days. Conversion to NH
3 can occur either under aerobic or anaerobic
conditions.
Org-N is not used by crops; however, it is not mobile once applied to the land unless runoff carries away the organic matter or soil particles to which it might be attached.
Ammoniacal nitrogen—This term is often used in a generic sense to refer to two compounds: NH
4 (the
ammonium ion) and NH3 (un-ionized ammonia). These
forms of NH3 exist in equilibrium, with the concentra-
tions of each depending on pH and temperature.
Un-ionized NH3 is toxic to fish and other aquatic life
in very small concentrations. In one study, the con-centration required to kill 50 percent of a salmonid
(e.g., trout) population after 96 hours of exposure (the 96-hour LC
50) ranged from 0.083 to 1.09 milligrams
per liter; for nonsalmonids the range was 0.14 to 4.60 milligrams per liter. Invertebrates are more tolerant of un-ionized NH
3 than fish, and phytoplankton and
vascular aquatic plants are more tolerant than either the invertebrates or fish.
To protect aquatic life, the U.S. Environmental Protec-tion Agency (EPA) has established a recommended al-lowable limit of 0.02 milligrams per liter for un-ionized NH
3. Table 3–2 shows, in abbreviated form, the rela-
tionship between un-ionized NH3 and NH
4 as related
to pH and water temperature. As water temperatures and pH rise, the amount of total NH
3 required to pro-
vide a lethal concentration of un-ionized NH3 becomes
smaller.
The concentration of un-ionized NH3 from an over-
flowing lagoon or other storage structure with con-centrated animal waste can exceed the EPA criterion by as much as 3,000 times. Runoff from a feedlot or overfertilized pasture can also have high levels of total ammonia nitrogen (NH
3 + NH
4).
Ammonium nitrogen is relatively immobile in the soil. The positively charged ammonium ion tends to attach to the negatively charged clay particles and generally remains in place until converted to other forms.
Ammonia can be lost to the atmosphere in gaseous form (volatilization), a process that is not a function of bacterial activity. As much as 25 percent of the NH
3
irrigated from an animal waste lagoon can be lost between the sprinkler head and the ground surface. Temperature, wind, and humidity will affect losses.
Table 3–2 Concentrations of total NH3 (NH
3 + NH
4) in
mg/L that contain an un-ionized NH3 concen-
tration of 0.020 mg/L NH3
Temp (°C)
- - - - - - - - - - - - - - - - pH values - - - - - - - - - - - - - - - - -
6.0 6.5 7.0 7.5 8.0 8.5 9.0
5 160 51 16 5.1 1.6 0.53 0.18
10 110 34 11 3.4 1.1 0.36 0.13
15 73 23 7.3 2.3 0.75 0.25 0.09
20 50 16 5.1 1.6 0.52 0.18 0.07
25 35 11 3.5 1.1 0.37 0.13 0.06
3–7
Part 651Agricultural Waste Management Field Handbook
Agricultural Wastes and Water, Air, and Animal Resources
Chapter 3
(210–VI–AWMFH, Amend. 52, February 2012)
Ammonia can be converted to NO2 and then to NO
3
(nitrified) only under aerobic conditions. For this reason, Org-N and ammonia nitrogen generally are the only forms of N in anaerobic lagoons and waste stor-age ponds. The NH
3 begins to nitrify when the waste
from these structures is applied to the land where aerobic conditions exist.
Nitrite—This is normally a transitory phase in the nitrification and denitrification processes. Very little NO
2 is normally detected in the soil or in most natural
waters.
Nitrites occasionally occur in significant concentra-tions in farm ponds and commercial fish ponds during a fall “overturn” or when the mud on the bottom of the pond is disturbed during commercial harvesting. If the bottom material is enriched with nutrients (from excess commercial feed, fish waste, or other sources of animal waste), the concentrations of nitrites in the overlying water can be raised enough to cause NO
2
poisoning or brown blood disease in fish when this mud is disturbed. The dead or dying fish have “choco-late” colored blood, which indicates that the hemoglo-bin has been converted to methemoglobin.
NO2 concentrations at or below 5 milligrams per liter
should be protective of most warm-water fish, and concentrations at or below 0.06 milligrams per liter should suffice for cold-water fish. Concentrations as high as these are unlikely to occur as a result of natu-ral conditions in surface water.
The EPA has not recommended any special limits on nitrates in surface water; however, some States have criteria for NO
2 concentrations in finished or treated
water (see chapter 1 of this handbook).
Nitrate—The NO3 form of N is the end product of the
mineralization process (the conversion of N from the NH
3 form to NO
2 and then to NO
3 under aerobic condi-
tions). The NO3 form of N is soluble in water and is
readily used by plants.
Under anaerobic conditions, microbial activity can convert NO
3 to a gaseous form of N, a process called
denitrification. N in animal waste that has been con-verted to NO
3 after land application can leach into
the soil profile, encounter a saturated anaerobic zone, and then be denitrified through microbial activity. The gaseous forms of N created in this process can then
migrate upward through the soil profile and be lost to the atmosphere.
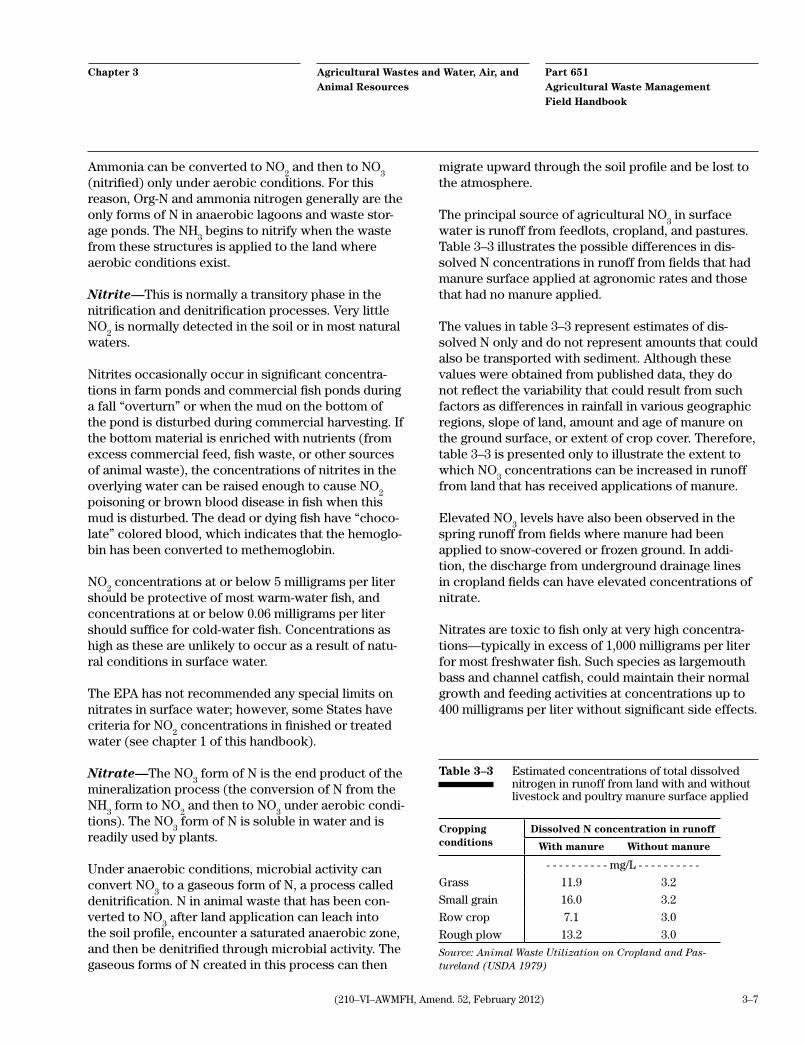
The principal source of agricultural NO3 in surface
water is runoff from feedlots, cropland, and pastures. Table 3–3 illustrates the possible differences in dis-solved N concentrations in runoff from fields that had manure surface applied at agronomic rates and those that had no manure applied.
The values in table 3–3 represent estimates of dis-solved N only and do not represent amounts that could also be transported with sediment. Although these values were obtained from published data, they do not reflect the variability that could result from such factors as differences in rainfall in various geographic regions, slope of land, amount and age of manure on the ground surface, or extent of crop cover. Therefore, table 3–3 is presented only to illustrate the extent to which NO
3 concentrations can be increased in runoff
from land that has received applications of manure.
Elevated NO3 levels have also been observed in the
spring runoff from fields where manure had been applied to snow-covered or frozen ground. In addi-tion, the discharge from underground drainage lines in cropland fields can have elevated concentrations of nitrate.
Nitrates are toxic to fish only at very high concentra-tions—typically in excess of 1,000 milligrams per liter for most freshwater fish. Such species as largemouth bass and channel catfish, could maintain their normal growth and feeding activities at concentrations up to 400 milligrams per liter without significant side effects.
Cropping conditions
Dissolved N concentration in runoff
With manure Without manure
- - - - - - - - - - mg/L - - - - - - - - - -
Grass 11.9 3.2
Small grain 16.0 3.2
Row crop 7.1 3.0
Rough plow 13.2 3.0
Table 3–3 Estimated concentrations of total dissolved nitrogen in runoff from land with and without livestock and poultry manure surface applied
Source: Animal Waste Utilization on Cropland and Pas-tureland (USDA 1979)

Part 651Agricultural Waste Management Field Handbook
Agricultural Wastes and Water, Air, and Animal Resources
Chapter 3
3–8 (210–VI–AWMFH, Amend. 52, February 2012)
These concentrations would not result from natural causes and are not likely to be associated with normal agricultural activities.
Although nitrates are not normally toxic to aquatic or-ganisms, nitrate is a source of enrichment for aquatic plants. If an adequate supply of other essential nutri-ents is available (especially P), nitrates can help pro-mote algae blooms and the production of other aquatic vegetation.
The EPA has not recommended any limiting criteria for nitrates as related to surface water. (See chapter 1, section 651.0107(b) for a description of limits related to drinking water as it comes from the tap.)
(ii) Phosphorus—Phosphorus is one of the major nutrients needed for plant growth, whether the plant is terrestrial or aquatic. Because P is used extensively in agriculture, the potential for pollution from this source is high.
Forms of Phosphorus—Water samples are often analyzed for only total P; however, total P can include organic, soluble, or “bound” forms. An understanding of the relationship among these forms is important to understanding the extent to which P can move within the environment and the methods for its control. Fig-ure 3–3 depicts the relationship between the P forms and illustrates ways that P can be lost from waste application sites.
P transformationsin soil profile
Pinputs
andlosses
Appliedwaste (organic anddissolved P)
Waste fromgrazing animals
P in nonincorporatedwaste lost in runoff
Removed bygrazing animals
Crop harvested
Plantuptake
Soluble Plost in runoff
P attachedto eroded
soil lost in runoffCropresidue
Temporarilybound in microbialtissue, dead roots, plant residue,and unmineralizedwaste; competeswith attached P foradsorption sites
Organic P
Inorganic PLost throughleaching
(soluble,available P)
Dissolved P
Tightlyboundwithin thesoil asAl and Fephosphatesand asCa
2 HPO
4,
Ca3 (PO
4)
2and othercompounds
H2PO
4, HPO
4less than 15%of total P
Attached P
Labile Fixed
ExchangeableP looselybound to Al,Fe, Ca.A smallfraction ofattached P
Figure 3–3 Phosphorus inputs and losses at a waste application site and P transformation within the profile (abbreviated P cycle)
3–9
Part 651Agricultural Waste Management Field Handbook
Agricultural Wastes and Water, Air, and Animal Resources
Chapter 3
(210–VI–AWMFH, Amend. 52, February 2012)
Organic P is a part of all living organisms, including microbial tissue and plant residue, and it is the princi-pal form of P in the metabolic by-products (wastes) of most animals. About 73 percent of the P in the fresh waste of various types of livestock is in the organic form
Soluble P (also called available or dissolved P) is the form used by all plants. It is also the form that is sub-ject to leaching. The soluble form generally accounts for less than 15 percent of the total P in most soils.
Attached P includes those compounds that are formed when the anionic (negatively charged) forms of dis-solved P become attached to cations, such as iron, alu-minum, and calcium. Alum has been successfully used as an additive to poultry litter to capture dissolved P in attempts to prevent it from leaving application fields with stormwater runoff. Attached P includes labile, or loosely bound, forms and those that are “fixed,” or tightly adsorbed, on or within individual soil particles.
It should be noted that the P that is loosely bound to the soil particles (labile P) remains in equilibrium with the soluble P. Thus, when the concentration of soluble P is reduced because of the removal by plants, some of the labile P is converted to the soluble form to main-tain the equilibrium.
Factors affecting the translocation of Phospho-rus—A number of factors determine the extent to which P moves to surface or groundwater. Nearly all of these factors relate to the form and chemical nature of the P compounds. Some of the principal factors af-fecting P movement to surface and groundwaters are noted.
Degree of contact with the soil—Manure that is surface applied in solid form generally has a higher potential for loss in surface runoff than wastewater ap-plied through irrigation, especially in areas that have frequent, high-intensity storms. This also assumes the irrigation water infiltrates the soil surface. Because P readily attaches to soil particles, it is important that fields used for manure applications have low erosion potential. For some soils, the potential for loss in surface runoff may be reduced by incorporating land applied solid wastes into the soil profile. Before incor-poration is used to reduce runoff potential, the poten-tial damage to soil structure should be considered. Grasslands and soils under no-till commonly devel-
oped improved soil structure that increase infiltration and reduces runoff. Destroying soil structure that has developed through the absence of tillage by incorpora-tion could inadvertently increase runoff potential.
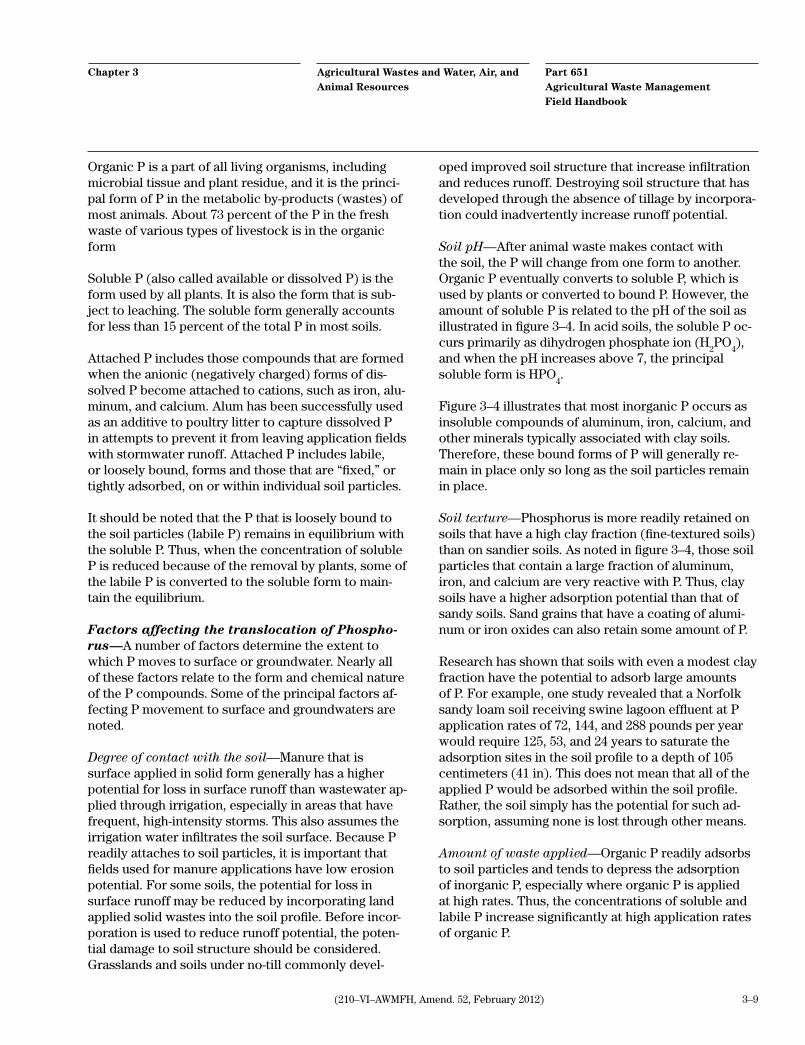
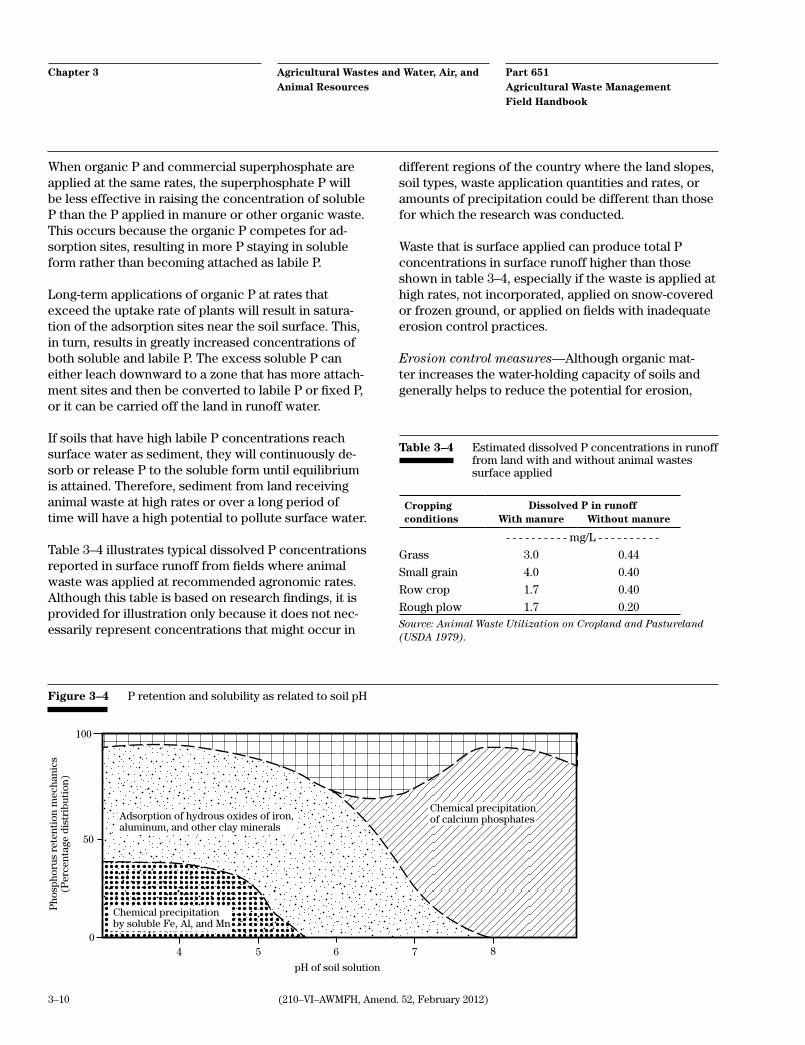
Soil pH—After animal waste makes contact with the soil, the P will change from one form to another. Organic P eventually converts to soluble P, which is used by plants or converted to bound P. However, the amount of soluble P is related to the pH of the soil as illustrated in figure 3–4. In acid soils, the soluble P oc-curs primarily as dihydrogen phosphate ion (H
2PO
4),
and when the pH increases above 7, the principal soluble form is HPO
4.
Figure 3–4 illustrates that most inorganic P occurs as insoluble compounds of aluminum, iron, calcium, and other minerals typically associated with clay soils. Therefore, these bound forms of P will generally re-main in place only so long as the soil particles remain in place.
Soil texture—Phosphorus is more readily retained on soils that have a high clay fraction (fine-textured soils) than on sandier soils. As noted in figure 3–4, those soil particles that contain a large fraction of aluminum, iron, and calcium are very reactive with P. Thus, clay soils have a higher adsorption potential than that of sandy soils. Sand grains that have a coating of alumi-num or iron oxides can also retain some amount of P.
Research has shown that soils with even a modest clay fraction have the potential to adsorb large amounts of P. For example, one study revealed that a Norfolk sandy loam soil receiving swine lagoon effluent at P application rates of 72, 144, and 288 pounds per year would require 125, 53, and 24 years to saturate the adsorption sites in the soil profile to a depth of 105 centimeters (41 in). This does not mean that all of the applied P would be adsorbed within the soil profile. Rather, the soil simply has the potential for such ad-sorption, assuming none is lost through other means.
Amount of waste applied—Organic P readily adsorbs to soil particles and tends to depress the adsorption of inorganic P, especially where organic P is applied at high rates. Thus, the concentrations of soluble and labile P increase significantly at high application rates of organic P.
Part 651Agricultural Waste Management Field Handbook
Agricultural Wastes and Water, Air, and Animal Resources
Chapter 3
3–10 (210–VI–AWMFH, Amend. 52, February 2012)
When organic P and commercial superphosphate are applied at the same rates, the superphosphate P will be less effective in raising the concentration of soluble P than the P applied in manure or other organic waste. This occurs because the organic P competes for ad-sorption sites, resulting in more P staying in soluble form rather than becoming attached as labile P.
Long-term applications of organic P at rates that exceed the uptake rate of plants will result in satura-tion of the adsorption sites near the soil surface. This, in turn, results in greatly increased concentrations of both soluble and labile P. The excess soluble P can either leach downward to a zone that has more attach-ment sites and then be converted to labile P or fixed P, or it can be carried off the land in runoff water.
If soils that have high labile P concentrations reach surface water as sediment, they will continuously de-sorb or release P to the soluble form until equilibrium is attained. Therefore, sediment from land receiving animal waste at high rates or over a long period of time will have a high potential to pollute surface water.
Table 3–4 illustrates typical dissolved P concentrations reported in surface runoff from fields where animal waste was applied at recommended agronomic rates. Although this table is based on research findings, it is provided for illustration only because it does not nec-essarily represent concentrations that might occur in
Relatively available phosphorus
4 5 6 7 8
100
50
0
Pho
spho
rus
rete
ntio
n m
echa
nics
(Per
cent
age
dist
ribu
tion
)
Chemical precipitationof calcium phosphatesAdsorption of hydrous oxides of iron,
aluminum, and other clay minerals
Chemical precipitationby soluble Fe, Al, and Mn
pH of soil solution
Figure 3–4 P retention and solubility as related to soil pH
different regions of the country where the land slopes, soil types, waste application quantities and rates, or amounts of precipitation could be different than those for which the research was conducted.
Waste that is surface applied can produce total P concentrations in surface runoff higher than those shown in table 3–4, especially if the waste is applied at high rates, not incorporated, applied on snow-covered or frozen ground, or applied on fields with inadequate erosion control practices.
Erosion control measures—Although organic mat-ter increases the water-holding capacity of soils and generally helps to reduce the potential for erosion,
Cropping conditions
Dissolved P in runoffWith manure Without manure
- - - - - - - - - - mg/L - - - - - - - - - -
Grass 3.0 0.44
Small grain 4.0 0.40
Row crop 1.7 0.40
Rough plow 1.7 0.20
Table 3–4 Estimated dissolved P concentrations in runoff from land with and without animal wastes surface applied
Source: Animal Waste Utilization on Cropland and Pastureland (USDA 1979).

3–11
Part 651Agricultural Waste Management Field Handbook
Agricultural Wastes and Water, Air, and Animal Resources
Chapter 3
(210–VI–AWMFH, Amend. 52, February 2012)
erosion can still occur on land receiving livestock and poultry wastes. If wastes are applied to satisfy the N requirements of the crops, the P concentrations in the soil may become extremely high. Because such soils generally have a high concentration of labile P, any loss of soil to surface water poses a serious threat to water quality in the receiving water, especially ponds and lakes. For this reason, good erosion control mea-sures are essential on land receiving animal waste.
Phosphorus entrapment—Providing an adequate buf-fer zone between the source of organic contaminants (land spreading areas, cattle feedlots) and stream or impoundment helps provide settling and entrapment of soil particles with attached P. Forested riparian zones adjacent to streams form an effective filter for sediment and sediment related P. In addition, water and sediment control basins serve as sinks for sedi-ment-attached P.
Animal waste lagoons are also very effective for P storage. Typically 70 to 90 percent of the P in waste that enters a waste treatment lagoon will settle and be retained in the sludge on the bottom of the lagoon. It should also be noted that this P accumulation will eventually need to be addressed.
Phosphorus retention—Sandy soils do not effectively retain P. If the groundwater table is close to the sur-face, the application of waste at excessive rates or at N-based rates will most likely contaminate the ground-water beneath those soils. However, groundwater that is below deep, clay soils is not likely to be contami-nated by P because of the adsorptive capacity of the clay minerals.
P will change forms rapidly once contact is made with the soil. Equilibria can be established between the bound forms and those in solution within just a few hours. However, as time goes on, more of the P is converted to the fixed or tightly bound forms. The conversion to these unavailable forms may take weeks, months, or even years. Therefore, the soil has the potential to retain large amounts of P (to serve as a P “sink”), especially if given ample time between applications. Caution should be taken in that high P concentrations can inhibit both plant nutrient uptake and soil biological activity. Soil and manure can be treated with substances containing calcium, iron, or aluminum cations, like alum, to improve their ability to retain soluble P.
Aerobic conditions—Compounds of P, iron, man-ganese, and other elements react differently where oxygen is present or absent in the surrounding envi-ronment. This is true in the soil environment as well as in impoundments. Under anaerobic conditions, iron changes from the ferric to the ferrous form, thus reducing P retention and increasing P solubility.
Soils receiving frequent applications of wastewater can become saturated and anaerobic. Such soils will not be as effective at removing and retaining P as well-aerated soils.
Harvesting—Soluble P will be removed from the soil by plants. The amount removed depends on the amount required by the plant and the reserve of P in the soil. If the plants are removed through mechani-cal harvesting, all of the P taken up by the plant will be removed except that associated with the roots and unharvestable residue. If the plants are removed be grazing animals, only a part of the plant P will be removed because a large fraction of the P consumed will be returned to the land in the feces. If plants are not harvested and removed, either mechanically or through animal consumption, they will eventually die, decay, and return the P to its source. It then becomes available again as a source of plant food or pollution.
Effects of phosphorus in the aquatic environ-ment—When P enters the freshwater environment, it can produce nuisance growths of algae and aquatic weeds and can accelerate the aging process in lakes. Direct toxicity to fish and other aquatic organisms is not a major concern. Some algae species are toxic to animals if ingested with drinking water.
In the marine or estuarine environment, however, P in the elemental form (versus phosphates or other forms of combined P) can be especially toxic and can bioaccumulate in much the same way as mercury. For this reason, the EPA has established a criterion of 0.01 micrograms per liter (µg/L) of yellow (elemental) P for marine and estuarine water. This concentration rep-resents a tenth of the level demonstrated to be lethal to important marine organisms. Other forms of P are virtually nontoxic to aquatic organisms.
Although no national criteria exist for other forms of P to enhance or protect fresh water, the EPA recom-mends that total phosphate concentrations not exceed 50 micrograms per liter (as P) in any stream at the
Part 651Agricultural Waste Management Field Handbook
Agricultural Wastes and Water, Air, and Animal Resources
Chapter 3
3–12 (210–VI–AWMFH, Amend. 52, February 2012)
point where it enters a lake or reservoir (EPA 1986). A desired goal for the prevention of plant nuisances in streams or other flowing water not discharging directly to lakes or impoundments is 100 micrograms per liter of total P.
Relatively uncontaminated lakes have from 10 to 30 micrograms per liter total P in the surface water. How-ever, a phosphate concentration of 25 micrograms per liter at the time of spring turnover in a lake or reser-voir may occasionally stimulate excessive or nuisance growths of algae and other aquatic plants.
The EPA reports these findings regarding P in natural water (EPA 1984):
• HighPconcentrationsareassociatedwithac-celerated eutrophication of water when other growth-promoting factors are present.
• Aquaticplantproblemsdevelopinreservoirsand other standing water at P values lower than those critical in flowing streams.
• Reservoirsandlakescollectphosphatesfrominfluent streams and store part of them within consolidated sediment, thus serving as a phos-phate sink.
• Pconcentrationscriticaltonoxiousplantgrowth vary, and nuisance growths may result from a particular concentration of phosphate in one geographic area, but not in another.
Whether or not P will be retained in a lake or become a problem is determined by nutrient loading to the lake, the volume of the photic (light-penetrating) zone, the extent of biological activity, the detention time of the lake, and level at which water is withdrawn from the lake. Thus, a shallow lake in a relatively small watershed and with only a surface water discharge is more likely to have eutrophication problems than a deep lake that has a large drainage area-to-lake volume ratio and bottom water withdrawal. This assumes that the same supply of nutrients enters each lake.
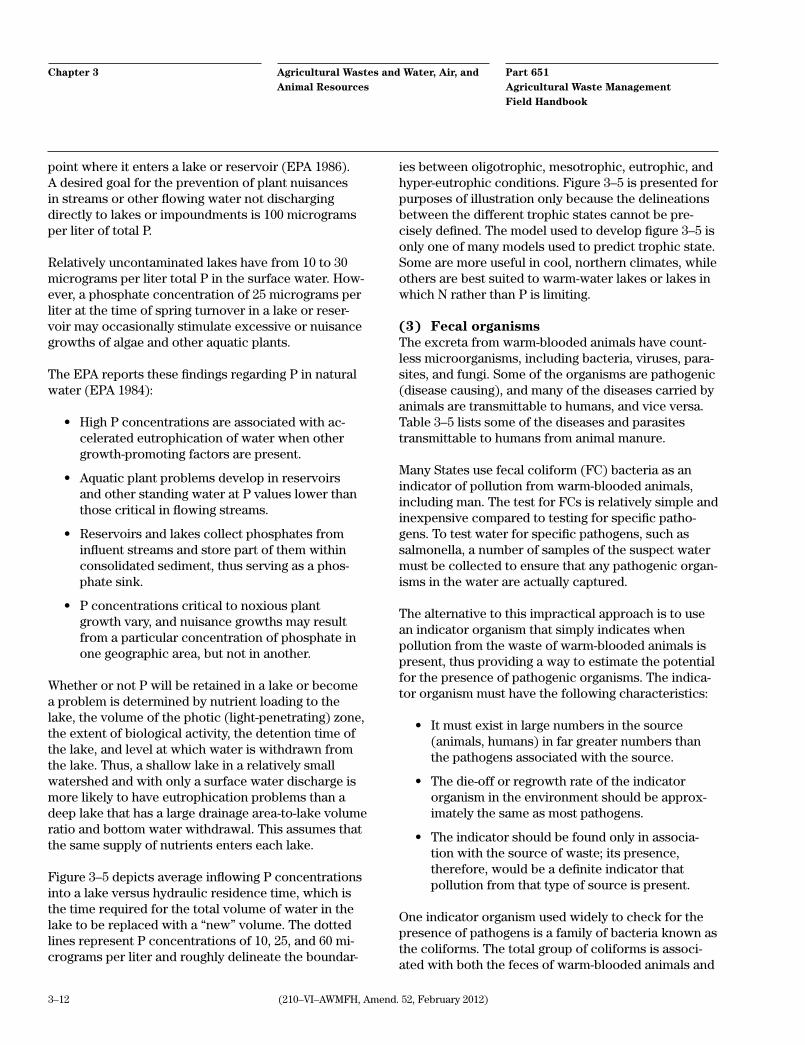
Figure 3–5 depicts average inflowing P concentrations into a lake versus hydraulic residence time, which is the time required for the total volume of water in the lake to be replaced with a “new” volume. The dotted lines represent P concentrations of 10, 25, and 60 mi-crograms per liter and roughly delineate the boundar-
ies between oligotrophic, mesotrophic, eutrophic, and hyper-eutrophic conditions. Figure 3–5 is presented for purposes of illustration only because the delineations between the different trophic states cannot be pre-cisely defined. The model used to develop figure 3–5 is only one of many models used to predict trophic state. Some are more useful in cool, northern climates, while others are best suited to warm-water lakes or lakes in which N rather than P is limiting.
(3) Fecal organismsThe excreta from warm-blooded animals have count-less microorganisms, including bacteria, viruses, para-sites, and fungi. Some of the organisms are pathogenic (disease causing), and many of the diseases carried by animals are transmittable to humans, and vice versa. Table 3–5 lists some of the diseases and parasites transmittable to humans from animal manure.
Many States use fecal coliform (FC) bacteria as an indicator of pollution from warm-blooded animals, including man. The test for FCs is relatively simple and inexpensive compared to testing for specific patho-gens. To test water for specific pathogens, such as salmonella, a number of samples of the suspect water must be collected to ensure that any pathogenic organ-isms in the water are actually captured.
The alternative to this impractical approach is to use an indicator organism that simply indicates when pollution from the waste of warm-blooded animals is present, thus providing a way to estimate the potential for the presence of pathogenic organisms. The indica-tor organism must have the following characteristics:
• Itmustexistinlargenumbersinthesource(animals, humans) in far greater numbers than the pathogens associated with the source.
• Thedie-offorregrowthrateoftheindicatororganism in the environment should be approx-imately the same as most pathogens.
• Theindicatorshouldbefoundonlyinassocia-tion with the source of waste; its presence, therefore, would be a definite indicator that pollution from that type of source is present.
One indicator organism used widely to check for the presence of pathogens is a family of bacteria known as the coliforms. The total group of coliforms is associ-ated with both the feces of warm-blooded animals and

3–13
Part 651Agricultural Waste Management Field Handbook
Agricultural Wastes and Water, Air, and Animal Resources
Chapter 3
(210–VI–AWMFH, Amend. 52, February 2012)
1000
100
10Infl
ow
to
tal
ph
osp
ho
rus
con
c. (
PP
B)
To
tal
P l
oad
ing/
ou
tflo
w
.01 .1 1 10 100
Hydraulic residence time (years)Lake volume/outflow
Oligotrophic
Predicted lake phosphorus (PPB)
Mesotrophic
Eutrophic
Hyper-eutrophic
P=60
P=25
P=10
Figure 3–5 Lake trophic states based on model by Vollenweider (adapted from EPA 1990)
with soils. However, the FC group represents a part of the total coliforms and is easily differentiated from the total coliforms during testing.
A positive test for FC bacteria is a clear indication that pollution from warm-blooded animals exists. A high count indicates a greater probability that pathogenic organisms will be present.
Some FCs generally are in all natural water even with-out the influence of humans or their domestic animals. Birds, beaver, deer, and other wild animals contrib-ute FCs to the water, either directly or in runoff. It is necessary, therefore, to have acceptable limits for FC bacteria, taking into account the beneficial use of the stream or water body. The EPA established water qual-ity criteria for FC bacteria in its Quality Criteria for Water (1976), which many States have adopted. Typi-cal limits are shown in table 3–6.
Some planners have used the ratio of FC to fecal streptococcus (FS) bacteria to help identify whether a suspected source of water pollution is from humans or other warm-blooded animals. Table 3–7 shows the typical FC/FS ratios (as excreted) for different animal species.
Some questions remain regarding the usefulness of this method of identifying sources because the die-off rates between the two types of bacteria can differ significantly. Consequently, it would only have mean-ing when the sampling point is close to the source. For this reason, the FC/FS ratio should be used with extreme caution as a tool for determining sources of pollution.
In more recent years, the EPA has established criteria for using Escherichia coli (E. coli) and enterococci as a measure of harmful levels of bacterial pollution in

Part 651Agricultural Waste Management Field Handbook
Agricultural Wastes and Water, Air, and Animal Resources
Chapter 3
3–14 (210–VI–AWMFH, Amend. 52, February 2012)
Table 3–5 Diseases and organisms spread by animal manure
Disease Responsible organism
Bacterial
Salmonella Salmonella sp.
Leptospirosis Leptospiral pomona
Anthrax Bacillus anthracis
Tuberculosis Mycobacterium tuberculosis
Mycobacterium avium
Johnes disease Mycobacterium aratuberculosis
Brucellosis Brucella abortus
Brucella melitensis
Brucella suis
Listerosis Listeria monocytogenes
Tetanus Clostridium tetani
Tularemia Pasturella tularensis
Erysipelas Erysipelothrix rhusiopathiae
Colibacilosis E. coli (some serotypes)
Coliform mastitis-metritis E. coli (some serotypes)
Rickettsial
Q fever Coxiella burneti
Viral
New castle Virus
Hog cholera Virus
Foot and mouth Virus
Psittacosis Virus
Fungal
Coccidioidomycosis Coccidoides immitus
Histoplasmosis Histoplasma capsulatum
Ringworm Various microsporum and trichophyton
Protozoal
Coccidiosis Eimeria sp.
Balantidiasis Balatidium coli.
Toxoplasmosis Toxoplasma sp.
Parasitic
Ascariasis Ascaris lumbricoides
Sarcocystiasis Sarcocystis sp.
Table 3–6 Typical allowable limits for FC bacteria based on water use
Water use Bacteria/100 ml sample
Public water supply 2,000 * (before treatment) 4,000 max
Swimming 100 coastal * 200 fresh water *
Fish and wildlife 2,000 max
* Based on a geometric mean of at least five samples collected over 30 days at intervals of no less than 24 hours.
Table 3–7 Typical FC to FS ratios (as excreted) for sev-eral animal species
Species FC/FS ratio
Human 4.4
Ducks 0.6
Sheep 0.4
Pig 0.4
Chicken 0.2
Turkey 0.1* Based on a geometric mean of at least five samples collected over 30 days at intervals of no less than 24 hours.

3–15
Part 651Agricultural Waste Management Field Handbook
Agricultural Wastes and Water, Air, and Animal Resources
Chapter 3
(210–VI–AWMFH, Amend. 52, February 2012)
ambient waters. E. coli (a FC type) and enterococci are natural inhabitants of warm-blooded animals, and their presence in water samples is an indication of fe-cal pollution and the possible presence of pathogens. Some strains of enterococci are found outside warm-blooded animals.
The EPA reports that a direct relationship between the density of enterococci and E. coli in water and the occurrence of swimming-associated gastroenteritis has been established through epidemiological studies of marine and freshwater bathing beaches. The result-ing criteria can be used to establish recreational water standards. The EPA criteria for freshwater bathing are based on a statistically significant number of samples (generally not less than five samples equally spaced over a 30-day period). The geometric mean of the indi-cated bacterial densities should not exceed one or the other of the following:
E. coli 126 per 100 ml Enterococci 33 per 100 ml
These criteria should not be used without also con-ducting a statistical analysis based on information provided by the EPA.
(b) Constituents affecting groundwater quality
Nitrates and bacteria are the primary constituents of animal waste that affect groundwater quality. Phos-phorus and potassium (K) do not constitute a threat to public health through water supplies. In their common forms, P and K are relatively insoluble and are not normally leached below the top several inches of most soils, especially those with a high clay fraction.
Phosphorus readily combines with aluminum and iron in acidic soils and with calcium in basic soils. Because these substances are relatively abundant in most soils, a large fraction of the total P applied to the land will be quickly immobilized. Only a small fraction of the soluble inorganic P will be available for plants (see previous description of the characteristics of P in this chapter).
In addition to animal waste, other agricultural-related wastes and their constituents can impact groundwater quality. Salinity has long been recognized as a con-
taminant of groundwater resulting from percolating irrigation application. Two mechanisms influence the amount of salt reaching the groundwater. The first is concentration of salt in the irrigation supplies. The process of evapotranspiration concentrates the salt in the root zone, making it available for solution and transport. The more salt in the irrigation supply, the more salt in the leachate. In addition, percolating wa-ter dissolves salts from marine shales, increasing the salinity of the aquifers in that manner.
Pesticides also have been identified as a contaminant of groundwater. The major source of contamination is associated with filling and washing application equipment in the proximity of the wellhead. However, concentrations of selected pesticides have been noted in the vicinity of application areas.
Oils and greases associated with the agriculture in-dustry are also capable of contaminating groundwater supplies. Of most concern are leaking underground storage tanks for fuel oil, but percolating water is also capable of moving spilled oils from the soil surface into the soil profile.
(1) NitrateAs noted in section 651.0302(a)(2), NO
3 is the soluble
form of N and is easily leached beyond the root zone of plants. The principal sources of nitrates in ground-water from agricultural activities are animal waste and commercial fertilizers.
The EPA established a criterion of 10 milligrams per liter of NO
3–N for drinking water because of the health
hazard that nitrates present for pregnant women and infants. Unborn babies and infants can contract methe-moglobinemia, or blue baby syndrome, from ingesting water contaminated with nitrates. In extreme cases, this can be fatal. Blue baby syndrome generally ef-fects only infants that are less than 6 months old. The disease develops when NO
3 is converted to NO
2 in the
alkaline environment of the baby’s stomach. The NO2
then enters the bloodstream and interacts with the hemoglobin, converting it to methemoglobin.
Hemoglobin carries oxygen in the bloodstream, but methemoglobin does not. Therefore, as the amount of vitally needed hemoglobin is reduced in the blood-stream, less oxygen is carried to the body’s organs, and symptoms of oxygen starvation begin to occur.

Part 651Agricultural Waste Management Field Handbook
Agricultural Wastes and Water, Air, and Animal Resources
Chapter 3
3–16 (210–VI–AWMFH, Amend. 52, February 2012)
The baby’s skin takes on a bluish tint. If the situation is not reversed, the baby could die of oxygen starvation.
Even after the baby discontinues consumption of the contaminated water, the buildup of normal hemoglo-bin can be slow. After the age of 6 months, the baby’s stomach pH reaches adult levels, and the disease is rarely a problem.
(2) Fecal bacteriaContamination of wells and springs by fecal bacteria or other waste-related microorganisms is a possible problem if wastes are spread on sandy soils. Studies in poultry growing areas of the Northeast and South in-dicate elevated FC and FS concentrations are possible where poultry litter has been applied at high rates.
A number of diseases can be transported between animals and man as noted in section 651.0302(a)(3); however, the potential for contamination of ground-water by fecal organisms is reduced considerably by the filtering action of the soil. The importance of soil filtering is described in the following section.
Well water should be tested regularly for contamina-tion by fecal bacteria. The acceptable limit is zero for potable water (chapter 1, section 651.0108(b), table 1–5).
651.0303 Factors affecting the water pollution process
Water pollution occurs only when a contaminant finds a pathway from the source to the groundwater or to a stream or water body in such quantities that the desig-nated use of the receiving water can no longer be met. However, the contaminant may not find such a path-way because of chemical or physical transformations affecting it in the environment or because the pathway is blocked by natural phenomena or by control pro-cesses imposed by humans.
(a) Pathways to pollution
The pathway that a contaminant follows to reach a stream or to enter groundwater depends on its physi-cal and chemical characteristics as well as the surface and subsurface characteristics of the land. Many constituents of manure move as small organic par-ticles (bacteria, viruses, suspended sediment), while others (i.e., ammonium or P) are adsorbed to organic particles or soil. The attached contaminants move in piggyback fashion only when the host material moves.
Sediment, organic particles, or substances adsorbed to particles can be physically detached at the soil surface by the impact of raindrops or by overland flow and then transported to surface water. Larger substances and attached substances are prevented from moving downward by the filtering action of the soil. However, soluble substances, such as nitrates, can move readily downward until impeded by a restricting layer. A fra-gipan or sandstone layer may cause soluble contami-nants to migrate laterally as subsurface flow until they emerge along a streambank as part of bank flow.
(b) Transformations on the soil surface
Manure that is surface applied and not incorporated is exposed to solar radiation and aerobic drying condi-tions leading to volatilization and the death of patho-gens. On warm and windy summer days, all of the initial ammonium in animal waste can be lost to the atmosphere within 24 to 48 hours. Mineralization and immobilization of N through adsorption can also occur rapidly under such conditions.

3–17
Part 651Agricultural Waste Management Field Handbook
Agricultural Wastes and Water, Air, and Animal Resources
Chapter 3
(210–VI–AWMFH, Amend. 52, February 2012)
(c) Filtering in the upper soil layer
Many factors, including the soil’s physical and chemi-cal characteristics and the environment in the soil (table 3–8) affect the removal of fecal bacteria in the soil and prevent their movement into groundwater. The primary factors are filtration, adsorption, and die-off in the soil.
Bacteria passing through the soil matrix can be filtered as a result of three processes acting independently or in combination. These processes are:
• physicalfiltrationorstrainingbythesoilmatrix
• sedimentationofbacteriainthesoilpores
• “bridging,”wherebypreviouslyfilteredbacte-ria block or reduce the size of pores through which other bacteria would normally pass
Soil texture, structure, and pore size vary consider-ably among soils and influence the effectiveness of the filtering process. Adsorption of microorganisms onto clay particles and organic material effectively removes bacteria from liquids. Filtration and adsorption can remove over 90 percent of the bacteria applied in ef-fluent in the first half inch of soil. Almost total removal can be accomplished in the first 2 inches of fine-tex-tured soils.
Some soils have a tremendous capacity to remove bac-teria and protect the groundwater resource. However, coarse-textured or disturbed soils do not provide the same level of treatment as undisturbed, fine-textured
Table 3–8 Soil factors affecting infiltration and movement (leaching) of bacteria in soil
Physical characteristics Environmental and chemical factors
Texture Cation-exchange capacity
Particle size distribution Chemical makeup of ions
Clay type and content and their concentrations
Organic matter type and content Bacterial density and dimensions
Pore size distribution Nature of organic matter
Temperature in waste effluent solution
Moisture content (concentration and size)
Fragipan (hardpan) pH
Surface compaction
soils. In addition, overloading or constant saturation of the soil can greatly reduce its ability to remove bacte-ria.
(d) Transformations within the deep soil profile
The soil can be divided into saturated and unsaturated zones (fig. 3–6). The boundary between these zones varies seasonally and from year to year. In some loca-tions, the saturated zone extends to the surface of the soil in early spring; at other times and locations, it may be hundreds of feet below the surface.
The unsaturated zone includes the root zone and an unsaturated area below the root zone. The root zone is characterized by an abundance of macropores, created in part by decaying roots and wormholes. The macro-pores allow rapid downward movement of substances carried by percolating water.
The root zone is also characterized by an abundance of carbon created by the decaying roots. Because micro-organisms require carbon, biological transformations occur rapidly within the root zone, especially when the soil temperature is warm and adequate moisture is available.
Microbial activity is drastically reduced below the root zone. As a result, NO
3, which is available for a variety
of other transformations within the root zone, can remain in the NO
3 form for years below this zone of
microbial activity.

Part 651Agricultural Waste Management Field Handbook
Agricultural Wastes and Water, Air, and Animal Resources
Chapter 3
3–18 (210–VI–AWMFH, Amend. 52, February 2012)
Within the saturated zone or in the groundwater, contaminants can remain unchanged for long periods because of the absence of microorganisms. However, in soils that have a seasonal high water table, the root zone can become saturated and anaerobic. In this environment, anaerobic bacteria can thrive, creating ideal conditions for denitrification (the conversion of nitrates to gaseous forms of N).
651.0304 Controlling the water pollution process
Manure is a valuable resource for crop production. It contains not only nutrients but also organic matter. A basic principle is that if manure is utilized to the maxi-mum extent possible, discharge of pollutants to receiv-ing waters will be minimized. The classic pollutant delivery process takes place in three stages: availabil-ity, detachment, and transport. Conservation practices that limit availability, prevent detachment, and inter-rupt transport should be used to prevent manure from contributing to water pollution.
Three elementary factors are required for a contami-nant to reach a watercourse or enter the groundwater:
Macropores
NH3
Volatilization
Solar radiation
Kills pathogens
Very rapidtransformation
Organicmatter
decomposition
Rapidbiologicaltransformation
Slowbiologicaltransformation
Fluctuates seasonally
Very slowbiologicaltransformation
Water table
Groundwater or saturated zone
Unsaturatedzone
Root zone Abundantcarbon forbacterialactivity
Soil surfaceNH
4
N2, N
2O,
NO
when saturated
NO3
NO3
leachingDentrification
Figure 3–6 Transformations on or in the soil

3–19
Part 651Agricultural Waste Management Field Handbook
Agricultural Wastes and Water, Air, and Animal Resources
Chapter 3
(210–VI–AWMFH, Amend. 52, February 2012)
• Acontaminantmustfirstbeavailable.Ifpesti-cides, fertilizers, or animal waste are not used in a watershed, these contaminants are not available.
• Ifthecontaminantisavailable,itmustbede-tached or removed from its resting place.
• Oncedetached,thesubstancemustbetrans-ported to the point where it is integrated into a stream or water body or leached into the groundwater.
These factors (availability, detachment, transport) must be addressed when attempting to prevent the movement of contaminants from land to water. A brief description of these factors and examples of controls for each factor follow. A variety of management, veg-etative, and structural practices can be used to control pollution beyond those illustrated here.
(a) Limiting availability
Several factors must be known about a contaminant at the time of surface runoff or infiltration through the soil, including:
Amount of the substance available—Is the waste applied to the land in one large application or in split applications throughout the growing season? How much manure has been applied to the soil in the appli-cation area in previous years?
Partitioning of the substance between soil and water—Is the substance in soluble form, such as nitrate, or is it adsorbed to soil particles?
Position of the substance on or in the soil pro-file—Is the manure incorporated immediately after application? Are the soils managed to maximize infil-tration?
Persistence of the substance on or in the soil— How long will it remain in place before being convert-ed to another form or being lost through volatilization or leaching?
Animal waste can be deposited on pasture or range-land, in streams where the animals congregate on hot days, or in confinement facilities where the waste must be removed and eventually returned to the land.
In general, the more manure deposited by animals on pasture or feedlots or spread on the land, the greater the concentration of contaminants in runoff or perco-lating water.
The following examples illustrate how animal waste or the particular constituents within the waste (nutri-ents, bacteria) can be limited in a watershed or at land spreading sites, assuming a water quality problem has been identified and the source is a livestock operation. Measures that could be used are:
• Removeallanimalsfromthewatershed.
• Reducethenumberofanimals.
• Usecroppingsystemsthatrequiremorenutri-ents throughout the year.
• Improvemanurestoragecapacitytoavoidspreading manure during critical runoff peri-ods; for example, when the ground is frozen or covered with snow and ice.
• Applywastesinsplitapplicationsthroughoutthe growing season, thereby making smaller amounts of manure available each time.
• Applywastesovermoreacresatrecommendedrates. (Nutrient application rates far exceeding agronomic recommendations can result if, for convenience sake, wastes are applied to only the fields nearest the confinement facility.)
• Usecovercropstopreventerosionandtocap-ture nutrients in the soil system between crops.
• Usereducedtillagesystemsandmanagecropresidues to build soil structure that will in-crease infiltration and decrease surface runoff.
• Incorporateorinjectthemanure,thuslimit-ing the availability of particular constituents. Phorphorus and NH
4 will become bound within
the soil profile and be less available for detach-ment.
• Collectandtransportwastestofieldsinotherwatersheds or bag the material for sale else-where.
• Compost the waste to reduce the availability of N.
• Treatthewasteinalagoonandlandapplythewaste only from the upper liquid zones of the

3–20 (210–VI–AWMFH, Amend. 52, February 2012)
Part 651 Agricultural Waste Management Field Handbook
Agricultural Wastes and Water, Air, and Animal Resources
Chapter 3
lagoon to reduce the amount of N. Some of the N will volatilize, and some will settle.
The Field Office Technical Guide (FOTG), Conserva-tion Practice Physical Effects, lists the most common soil and water control practices used to prevent de-tachment and interrupt transport of contaminants to surface water.
(b) Preventing detachment
When the contaminants are on the land (already avail-able), physical detachment generally results from the impact of raindrops or from shear forces in overland sheet flow or concentrated flow. Unprotected soil and surface-applied wastes, fertilizers, and pesticides may be detached in this way. Therefore, the primary con-trol measures to prevent detachment are those that reduce the impact of raindrops, such as vegetative cover or mulch, and those that control the velocity of water moving across the landscape, such as minimum or no tillage.
An understanding of the particular contaminants and how they react on the land or in the environment is helpful in establishing proper methods of control. Preventing detachment can involve control of par-ticular constituents within animal waste (see section 651.0302(a)). If P is an identified water quality prob-lem, then practices must be applied to prevent detach-ment of P. If the problem is low dissolved oxygen in a stream or lake (possibly from excessive organic mat-ter) or a fish kill from high concentrations of un-ion-ized NH
3, then controls for these constituents should
be applied.
Weakly bonded substances, nitrates, and bacteria can be detached and transported by water moving through the soil. Management practices to control detachment include:
• applyinglesssolublefertilizers
• applyingwastesinsplitapplicationstopreventtoo much N from being converted to nitrate at one time
• applyinglessirrigationwatertofieldswhenhigh levels of soluble substances are available
(c) Interrupting transport
If detachment of contaminants is inevitable, as with waste flushed from an open lot, then a method is need-ed to interrupt the transport process. For example, diversions can be designed to channel contaminated runoff into lagoons, waste storage ponds, and settling basins.
In the case of land-applied waste, a number of vegeta-tive and structural practices can be used to intercept contaminants. Sediment basins are useful, especially if sandy soils are involved. Because the trap efficiency for clays can be relatively low, contaminants that are attached to clay particles are best controlled by con-trolling detachment rather than interrupting transport.
Vegetative and structural practices that slow the movement of water and allow for settling of solids are useful tools for interrupting transport of contaminants. Vegetative conservation buffers that function as filter strips at the edge of fields and infield practices like terraces and contour buffer strips are examples of practices that interrupt the transport process. Vegeta-tive growth, especially a well-established winter cover crop, can take up nutrients that would otherwise be lost and can serve as a filter to trap sediment and ad-sorbed nutrients. For vegetative areas to be effective, they must slow runoff sufficiently to allow the sedi-ment and organic materials to settle out in the filter and allow increased soil infiltration of runoff water.
3–21
Part 651Agricultural Waste Management Field Handbook
Agricultural Wastes and Water, Air, and Animal Resources
Chapter 3
(210–VI–AWMFH, Amend. 52, February 2012)
651.0305 Effects of animal waste on the air resource
Livestock production facilities can be the source of gases, aerosols, vapors, and dust that, individually or in combination, can create such air quality problems as:
• nuisanceodors
• particulatematter
• greenhousegases
• ozoneprecursors
• animalhealthandasphyxiation
(a) Odors
Agricultural odors are a complex mixture of gases that can evoke a wide range of emotional and physi-ological responses when encountered via the sense of smell. While some odorous compounds can cause health problems, odors from livestock are mainly a community or individual perception issue. Many dif-ferent compounds can be the potential cause of odors from agricultural operations. These compounds can generally be classified as volatile organic compounds (VOCs), odorous sulfur compounds (including H
2S)
or NH3. Odors may arise from animal operations in a
number of ways, including:
• Alllivingorganisms(includinganimals)emitVOCs (including odorous compounds) natu-rally.
• Thebreakdownordecompositionofbiologicalmaterials such as manure or feed can produce odorous compounds, including VOCs, odorous sulfur compounds, and NH
3.
(b) Particulate matter
Particulate matter (PM) is currently a “criteria air pol-lutant,” which means that the EPA has identified PM as a pollutant that causes significant health (heart and lung) and environmental (deposition, visibility) ef-fects. Particulate matter can be either solid particles or liquid droplets and come in a variety of sizes, shapes, and chemical composition. The EPA has currently
established National Ambient Air Quality Standards (NAAQS) for the two forms of PM:
• FinePM—currentlyregulatedasPM2.5(aero-dynamic diameter less than or equal to 2.5 mi-crometers). Note: The diameter of the average human hair is 70 micrometers.
• CoarsePM—currentlyregulatedasPM10(aerodynamic diameter less than or equal to 10 micrometers), PM can be emitted directly (pri-mary PM—dust, pollen, soot, etc.) or formed in the atmosphere (secondary PM—formed from the reactions and condensation of sulfates, ni-trates, VOCs, and NH
3). Animal operations can
influence PM in a variety of ways:
– Animal activity can produce dust emissions that can be carried by wind or building venti-lation.
– Storage, handling, and the breakdown or de-composition of feed, bedding material, and manure can produce dust emissions as well as the emission of VOCs, NH
3, and oxides of
nitrogen (NOx), which includes nitric oxide (NO) and nitrogen dioxide (NO
2).
– Fuel combustion, or the burning of biologi-cal material, can produce fine PM as well as oxides of N and VOCs.
– Manure decomposition and its application on the land can produce emissions of VOCs, NH
3, and oxides of N.
(c) Greenhouse gases
Greenhouse gases (GHGs) are compounds in the atmosphere that capture and retain energy reflected from the Earth’s surface. They lead to a warming of the atmosphere that is popularly called the “green-house effect.” Carbon dioxide, methane (CH
4), and
nitrous oxide (N2O) are the primary compounds as-
sociated with GHGs in agricultural operations. Com-mon processes in animal operations that may produce GHGs are:
• Biologicalorganisms(includinganimals)emitCO
2 and CH
4 naturally. Ruminants, such as
cattle and sheep, produce more intestinal CH4
than non-ruminants.

Part 651Agricultural Waste Management Field Handbook
Agricultural Wastes and Water, Air, and Animal Resources
Chapter 3
3–22 (210–VI–AWMFH, Amend. 52, February 2012)
• Thebreakdownordecompositionofbiologicalmaterials, such as manure, feed, or mortalities, can produce CO
2 (as a natural by-product of
the breakdown/decomposition process), CH4
(under anaerobic conditions), and N2O (mainly
from the nitrification/denitrification processes).
• Combustioninon-farmequipmentortheburn-ing of biological material also produces CO
2 as
a natural by-product.
(d) Ozone precursors
Ozone is a gas composed of three oxygen atoms and is the primary component of smog. Although ozone in the upper atmosphere forms a layer that provides pro-tection from ultraviolet radiation, ozone in the lower atmosphere and at ground level can be harmful. While ozone is not typically emitted directly from agricul-tural operations, it is formed in the lower atmosphere through the chemical reactions of VOCs and NOx, which are regulated as ozone precursors. Oxides of N and VOCs are known as ozone precursors because they are identified as pollutants that form ozone.
Some ways that animal operations can impact VOC and NOx formation are:
VOCs• Alllivingorganisms(includinganimals)emit
VOCs naturally.
• Thebreakdownordecompositionofbiologicalmaterials such as manure or feed can produce VOCs.
• Incompletefuelcombustionortheburningofbiological material can produce VOCs.
NOx• Fuelcombustionortheburningofbiological
material can produce NOx.
• Thebreakdownordecomposition(mainlynitri-fication/denitrification) of biological materials such as manure or feed can lead to NOx forma-tion.
(e) Animal health and asphyxiation
A variety of gases can be generated in the operation of a livestock production facility that can cause asphyxi-ation, poisoning, and explosions. Some of these gases are toxic and can cause illness and even death at rela-tively low concentrations. Other gases are not toxic, but can displace oxygen and result in asphyxiation.
Different gases are produced as animal waste is de-graded by microorganisms. Under aerobic conditions, CO
2 is the principal gas produced. Under anaerobic
conditions, the primary gases are CH4 and CO
2. About
60 to 70 percent of the gas generated in an anaerobic lagoon is CH
4, and about 30 percent is CO
2. However,
trace amounts of more than 40 other compounds have been identified in the air exposed to degrading animal waste. Some of these include mercaptans (this family of compounds includes the odor generated by skunks), aromatics, sulfides, and various esters, carbonyls, and amines.
The gases of most interest and concern in manure management are CH
4, CO
2, NH
3, and H
2S. Table 3–9
provides a summary of the most significant character-istics of NH
3, CO
2, H
2S, and CH
4.
Methane is flammable, and in recent years, interest in using it as a source of energy on the farm has in-creased. Because CH
4 can be explosive, care is re-
quired when attempting to generate and capture this gas for on-farm use.
Carbon dioxide can be an asphyxiant when it displaces normal air in a confined facility. Because CO
2 is heavi-
er than air, it remains in a tank or other well-sealed structure, gradually displacing the lighter gases.
Ammonia is primarily an irritant and has been known to create health problems in animals in confinement buildings. Irritation of the eyes and respiratory tract are common problems from prolonged exposure to this gas. It is also associated with soil acidification pro-cesses (see section 651.0302).
Hydrogen sulfide is deadly. Humans and farm animals have been killed by this gas after falling into or enter-ing a manure tank or being in a building in which a manure tank was being agitated. Although only small amounts of H
2S are produced in a manure tank com-
pared to the other major gases, this gas is heavier than

3–23
Part 651Agricultural Waste Management Field Handbook
Agricultural Wastes and Water, Air, and Animal Resources
Chapter 3
(210–VI–AWMFH, Amend. 52, February 2012)
Gas Lighter than air Odor Class Comments
Ammonia (NH
3)
Yes Sharp, pungent
Irritant Irritation of eyes and throat at low concentrations. As-phyxiating, could be fatal at high concentrations with 30- to 40-minute exposure. PM precurser.
Carbon dioxide (CO
2)
No None Asphyxiant <20,000 ppm=safe level; increased breathing, drowsi-ness, and headaches as concentration increases; could be fatal at 300,000 ppm for 30 minutes. Greenhouse gas.
Hydrogen sulfide (H
2S)
No Rotten eggs Poison Headaches, dizziness at 200 ppm for 60 minutes. Nau-sea, excitement, insomnia at 500 ppm for 30 minutes; unconsciousness, death at 1,000 ppm.
Methane (CH
4)
Yes None Asphyxiant, flammable
Headaches at 500,000 ppm. Greenhouse gas.
air and becomes more concentrated in the tank over time.
When tanks are agitated in preparation for pump out, H
2S can be released to the area overhead. Where
a tank is located beneath the animals in a building, forced-air ventilation in the building is imperative before operating the agitation equipment. An exhaust system should also be provided within the tank during agitation and pump out.
Hydrogen sulfide has the distinct odor of rotten eggs. At the first hint of this odor, the area around the tank should be immediately evacuated of all humans. Hy-drogen sulfide deadens the olfactory nerves (the sense of smell); therefore, if the smell of rotten eggs appears to have disappeared, this does not indicate that the area is not still contaminated with this highly poison-ous gas.
Table 3–9 Properties and physiological effects of the most important gases produced from animal wastes in an anaerobic environment
A person should never enter a manure storage tank even to help rescue someone else who has succumbed to the H
2S. Several lives have been lost attempting
such rescues. If a tank must be entered, the air in the tank should first be evacuated using a forced-air ven-tilation system. Self-contained breathing apparatus, safety lines, and sufficient personnel to man the lines are needed in all cases. A mechanical hoisting device would be preferable (ASABE Standard S607, Ventilat-ing Manure Storage to Reduce Entry Risk).
For more information on how animal waste affects the air resource, see the NRCS National Engineering Handbook, Part 629, Air Quality.

Part 651Agricultural Waste Management Field Handbook
Agricultural Wastes and Water, Air, and Animal Resources
Chapter 3
3–24 (210–VI–AWMFH, Amend. 52, February 2012)
651.0306 Effects of animal waste on the animal resource
The detrimental effects of the oxygen demand of or-ganic matter and of the ammoniacal N that can come from manure on fish populations have been described previously in this chapter.
Animal mortality is part of all domestic animal feed-ing operations, and it is important to properly dispose of animal carcasses. Carcasses that are improperly disposed can become a feed source for undesirable predators like coyotes, and in their feeding on carcass-es that can contribute to the spread of disease.
Wild turkeys are susceptible to blackhead disease from domestic poultry. Broiler breeder farms are commonly heavily contaminated with the cecal worm (Heterakis gallinarum) and their eggs, which can be transported to the field when spreading broiler breeder litter. For this reason, it is advisable to avoid spreading broiler breeder litter in areas where wild turkeys frequent.
Grazing animals can be adversely affected when ani-mal waste is applied to forage crops at an excessive rate. Studies indicate that grass tetany, fescue toxicity, agalactia, and fat necrosis appear to be associated, in part, with high rates of fertilization from poultry litter on cool-season grasses (especially fescue). Highlights of these disease problems are provided. Additional details on the clinical signs of these diseases and methods to reverse or prevent their occurrence should be discussed with a veterinarian.
Grass tetany—Although this disease is associated mostly with low blood magnesium, conditions that increase the potential for its occurrence include low calcium, high uptake of N and P, and stress on the animal. Lactating cows grazing new growth of cool-season grasses or winter cereals are especially suscep-tible. Bulls and nonlactating cows are rarely affected.
Fescue toxicity—The precise cause of this disease is not well understood. Climatic conditions, molds and fungi, accumulation of ungrazed forage, and level of fertilization appear to be involved.
Agalactia—This term means absence of milk. Cows that have this condition are unable to lactate after giv-ing birth. Not much is known about this disease, but it has often been observed in horses and cattle grazing on heavily fertilized tall fescue.
Fat necrosis—This disease is associated with ma-ture cattle grazing tall fescue that has been heavily fertilized for a number of years with poultry litter. It appears to be a herd disease; although, it has occasion-ally been identified in individual animals. Cattle that have this disease generally have a restricted intestinal tract. In addition, the fat surrounding the birth canal can harden and prevent normal delivery.
Animal waste can be a repository for diseases and serves as a breeding ground for flies and other vectors. The transmission of diseases can be a problem.
Darkling beetles are a common problem in the litter of poultry houses. Left uncontrolled, they can spread dis-ease between flocks and even between houses. Com-posting the litter in the poultry house between flocks and treatment with an insecticide can be an effective treatment against darkling beetles.
Fly problems are most prevalent where the waste is relatively moist. House flies thrive where the moisture content of the waste is 75 to 80 percent. Female flies generally will not lay eggs in manure in which the moisture content is less than 70 percent, and larvae develop poorly with less than 65 percent moisture. Therefore, fly production is reduced considerably if the waste is kept dry or is flushed regularly from con-finement areas to a lagoon. Reducing fly populations will, in turn, reduce the chance for disease transmis-sion within herds and flocks. It will also reduce the potential for nuisance complaints from neighbors.

3–25
Part 651Agricultural Waste Management Field Handbook
Agricultural Wastes and Water, Air, and Animal Resources
Chapter 3
(210–VI–AWMFH, Amend. 52, February 2012)
651.0307 Conservation practice physical effects
Because of the amount of material available that addresses the role of soil and plant resources in agri-cultural waste management, these two resources are described in separate chapters in this handbook. The Conservation Practice Physical Effects in the FOTG should be consulted to evaluate the effects on water quality and quantity of conservation practices used in agricultural waste management systems on the soil, water, air, plant, and animal resources.
651.0308 Summary
Animal wastes can adversely affect water, air, and animal resources in a variety of ways. Nutrients can kill fish and create algae blooms in surface water. In groundwater, nitrates can make well water unfit for human consumption, particularly for infants. In addi-tion, organic matter can cause dissolved oxygen prob-lems in surface water, while bacteria and other micro-organisms can contaminate wells and create health problems in recreational waters.
Certain constituents in animal waste can create health problems in animals grazing cool-season grasses. In addition, the gases that are produced can have a number of adverse effects on the air resource and on animals in confinement.
Figure 3–7 provides an abbreviated graphic summary of the impacts that animal wastes can have on water, air, and animal resources. This graphical depiction does not show all of the possible impacts and does not convey the complexity of the pollution process. Likewise, this chapter as a whole only introduces the pollution process as related to water, air, and animal resources. A more complete understanding of the in-teraction of animal wastes with the various resources and the methods for pollution control would take intensive study of the volumes already written on this topic in addition to a lot of field experience. Even then, all the answers are not in; more is being learned about the pollution process all the time.
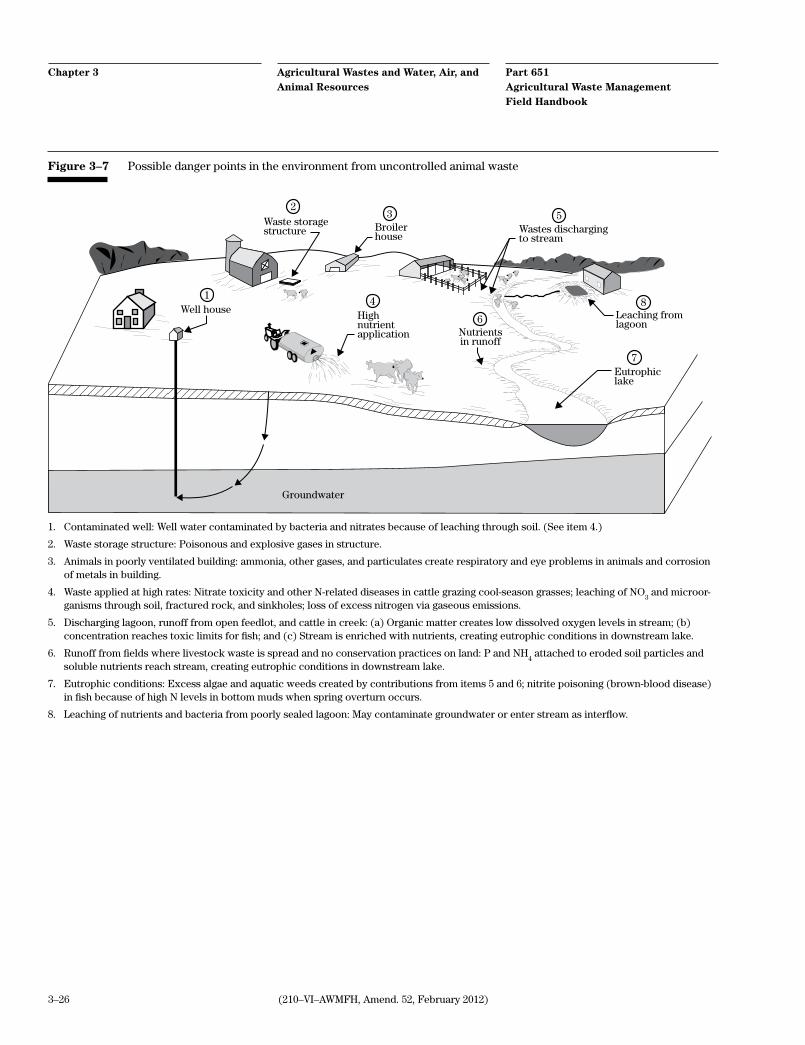
Part 651Agricultural Waste Management Field Handbook
Agricultural Wastes and Water, Air, and Animal Resources
Chapter 3
3–26 (210–VI–AWMFH, Amend. 52, February 2012)
1. Contaminated well: Well water contaminated by bacteria and nitrates because of leaching through soil. (See item 4.)
2. Waste storage structure: Poisonous and explosive gases in structure.
3. Animals in poorly ventilated building: ammonia, other gases, and particulates create respiratory and eye problems in animals and corrosion of metals in building.
4. Waste applied at high rates: Nitrate toxicity and other N-related diseases in cattle grazing cool-season grasses; leaching of NO3 and microor-
ganisms through soil, fractured rock, and sinkholes; loss of excess nitrogen via gaseous emissions.
5. Discharging lagoon, runoff from open feedlot, and cattle in creek: (a) Organic matter creates low dissolved oxygen levels in stream; (b) concentration reaches toxic limits for fish; and (c) Stream is enriched with nutrients, creating eutrophic conditions in downstream lake.
6. Runoff from fields where livestock waste is spread and no conservation practices on land: P and NH4 attached to eroded soil particles and
soluble nutrients reach stream, creating eutrophic conditions in downstream lake.
7. Eutrophic conditions: Excess algae and aquatic weeds created by contributions from items 5 and 6; nitrite poisoning (brown-blood disease) in fish because of high N levels in bottom muds when spring overturn occurs.
8. Leaching of nutrients and bacteria from poorly sealed lagoon: May contaminate groundwater or enter stream as interflow.
Figure 3–7 Possible danger points in the environment from uncontrolled animal waste
1
23
4
5
6
7Eutrophiclake
Nutrientsin runoff
Wastes dischargingto stream
Broilerhouse
Waste storagestructure
Well house Highnutrientapplication
Groundwater
8Leaching fromlagoon
3–27
Part 651Agricultural Waste Management Field Handbook
Agricultural Wastes and Water, Air, and Animal Resources
Chapter 3
(210–VI–AWMFH, Amend. 52, February 2012)
651.0309 References
American Society of Agricultural and Biological Engi-neers (ASABE). 2010. Standard S607, Ventilating manure storages to reduce entry risk.
Loehr, R.C., W.J. Jewell, J.D. Novak, W.W. Clarkson, and G.S. Friedman. 1979. Land application of wastes, vol. II. Van Norstrand Reinhold Co. New York, NY.
Olsen, S.R., and S.A. Barker. 1977. Effects of waste application on soil phosphorus and potassium. In Soils for management of organic wastes and wastewaters. Am. Soc. Agron., Crop Sci. Soc. Am., and Soil Sci Soc. Am. Madison, WI.
Reddy, K.R., R. Khaleel, M.R. Overcash, and P.W. Wes-terman. 1979. Phosphorus—a potential nonpoint source pollution problem in the land areas re-ceiving long-term applications of wastes. In Best management practices for agriculture and silvac-ulture. Ann Arbor Sci. Publ., Inc. Ann Arbor, MI.
U.S. Department of Agriculture. 2011. National Engi-neering Handbook, Part 629, Air Quality. Wash-ington, DC.
U.S. Environmental Protection Agency. 1983. Water quality standards handbook. Washington, DC.
U.S. Environmental Protection Agency. 1984. Technical support manual: Waterbody surveys and assess-ments for conducting use attainment. Washing-ton, DC.
U.S. Environmental Protection Agency. 1986. Quality criteria for water. EPA 440/5–86–001. Washing-ton, DC.
U.S. Environmental Protection Agency. 1990. The lake and reservoir restoration guidance manual. EPA–440/4–90–006. Washington, DC.

(210–VI–AWMFH, March 2008)
United StatesDepartment ofAgriculture
Natural ResourcesConservationService
Part 651 Agricultural Waste Management Field Handbook
Chapter 4 Agricultural Waste Characteristics

(210–VI–AWMFH, March 2008)
The U.S. Department of Agriculture (USDA) prohibits discrimination in all its programs and activities on the basis of race, color, national origin, age, disability, and where applicable, sex, marital status, familial status, parental status, religion, sexual orientation, genetic information, political beliefs, re-prisal, or because all or a part of an individual’s income is derived from any public assistance program. (Not all prohibited bases apply to all programs.) Persons with disabilities who require alternative means for communication of program information (Braille, large print, audiotape, etc.) should contact USDA’s TARGET Center at (202) 720-2600 (voice and TDD). To file a com-plaint of discrimination write to USDA, Director, Office of Civil Rights, 1400 Independence Avenue, S.W., Washington, D.C. 20250-9410 or call (800) 795-3272 (voice) or (202) 720-6382 (TDD). USDA is an equal opportunity provid-er and employer.
Chapter 4 Part 651Agricultural Waste Management Field Handbook
Agricultural Waste Characteristics
Issued March 2008

(210–VI–AWMFH, March 2008) 4–i
Acknowledgments
Chapter 4 was originally prepared and printed in 1992 under the direc-tion of James N. Krider (retired), national environmental engineer, Soil Conservation Service (SCS), now Natural Resources Conservation Service (NRCS), Washington, DC. James D. Rickman (retired), environmental en-gineer, NRCS, Fort Worth, Texas, provided day-to-day coordination in the development of the handbook. Authors for chapter 4 included Clyde Barth (retired), Clemson University, Clemson, South Carolina; Timothy Powers (retired), environmental engineer, NRCS, Nashville, Tennessee; and James Rickman.
This version was prepared under the direction of Noller Herbert, director, Conservation Engineering Division, NRCS, Washington, DC. Revisions to the chapter were provided by Donald Stettler (retired), environmental en-gineer, NRCS, Portland, Oregon; Charles Zuller, environmental engineer, West National Technology Support Center, Portland, Oregon; and Darren Hickman, environmental engineer, Central National Technology Support Center, Fort Worth, Texas. It was finalized under the guidance of Darren Hickman, national environmental engineer, Conservation Engineering Division, Washington, DC.

(210–VI–AWMFH, March 2008)4–ii
Chapter 4 Part 651Agricultural Waste Management Field Handbook
Agricultural Waste Characteristics
(210–VI–AWMFH, March 2008) 4–iii
Chapter 4 Agricultural Waste Characteristics
Contents: 651.0400 Introduction 4–1
(a) Purpose and scope ...........................................................................................4–1
(b) Variations and ranges of data values .............................................................4–2
651.0401 Definitions of waste characterization terms 4–2
651.0402 Units of measure 4–8
651.0403 Animal waste characteristics 4–9
(a) “As excreted” manure ....................................................................................4–9
(b) Common management modifications ........................................................4–11
(c) Dairy ...............................................................................................................4–12
(d) Beef ................................................................................................................4–15
(e) Swine ..............................................................................................................4–17
(f) Poultry ...........................................................................................................4–19
(g) Veal .................................................................................................................4–22
(h) Sheep ..............................................................................................................4–22
(i) Horse ..............................................................................................................4–22
(j) Rabbit .............................................................................................................4–23
651.0404 Manure as transferred for utilization 4–23
651.0405 Other wastes 4–26
(a) Residential waste .........................................................................................4–26
(b) Food wastes and wastewater .....................................................................4–26
(c) Silage leachate ..............................................................................................4–29
651.0406 References 4–32

(210–VI–AWMFH, March 2008)4–iv
Table 4–1 Definitions and descriptions of waste characterization 4–3 terms
Table 4–2 Factors for determining nutrient equivalency 4–9
Table 4–3 Unit weights of common bedding materials 4–11
Table 4–4 Daily bedding requirements for dairy cattle 4–11
Table 4–5 Dairy manure characterization—as excreted 4–13
Table 4–6 Dairy water use for various operations 4–14
Table 4–7 Dairy waste characterization—milking center 4–14
Table 4–8 Beef waste characterization—as excreted 4–15
Table 4–9 Nitrogen content of cattle feedlot runoff 4–16
Table 4–10 Swine waste characterization—as excreted 4–17
Table 4–11 Poultry waste characterization—as excreted 4–19
Table 4–12 Veal waste characterization—as excreted 4–22
Table 4–13 Lamb waste characterization—as excreted 4–22
Table 4–14 Horse waste characterization—as excreted 4–22
Table 4–15 Rabbit waste characterization—as excreted 4–23
Table 4–16 Manure as transferred for utilization 4–24
Table 4–17 Human waste characterization—as excreted 4–26
Table 4–18 Residential waste characterization—household 4–26wastewater
Table 4–19 Municipal waste characterization—residential 4–27
Table 4–20 Dairy food processing waste characterization 4–27
Table 4–21 Dairy food waste characterization—processing 4–28wastewater
Table 4–22 Meat processing waste characterization—wastewater 4–28
Chapter 4 Part 651Agricultural Waste Management Field Handbook
Agricultural Waste Characteristics

(210–VI–AWMFH, March 2008) 4–v
Table 4–23 Meat processing waste characterization—wastewater 4–29sludge
Table 4–24 Vegetable processing waste characterization—waste- 4–29water
Table 4–25 Fruit and vegetable waste characterization—solid 4–30waste
Table 4–26 Typical range of nutrient concentrations in silage 4–31leachate
Table 4–27 Leachate production based on percent dry matter 4–31of silage
Figures Figure 4–1 Mass balance approach used for developing table 4–1values for beef cattle, swine, and poultry
Chapter 4 Agricultural Waste Characteristics Part 651Agricultural Waste Management Field Handbook

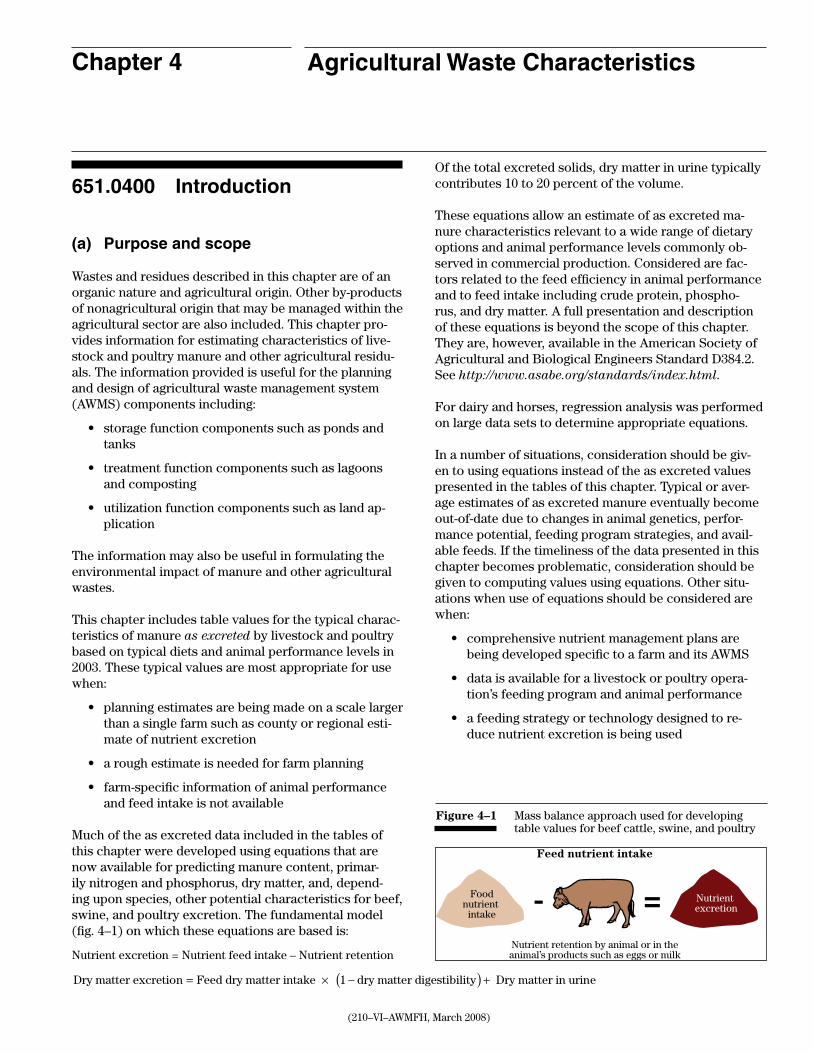
(210–VI–AWMFH, March 2008)
651.0400 Introduction
(a) Purpose and scope
Wastes and residues described in this chapter are of an organic nature and agricultural origin. Other by-products of nonagricultural origin that may be managed within the agricultural sector are also included. This chapter pro-vides information for estimating characteristics of live-stock and poultry manure and other agricultural residu-als. The information provided is useful for the planning and design of agricultural waste management system (AWMS) components including:
• storagefunctioncomponentssuchaspondsandtanks
• treatmentfunctioncomponentssuchaslagoonsand composting
• utilizationfunctioncomponentssuchaslandap-plication
The information may also be useful in formulating the environmental impact of manure and other agricultural wastes.
This chapter includes table values for the typical charac-teristics of manure as excreted by livestock and poultry based on typical diets and animal performance levels in 2003. These typical values are most appropriate for use when:
• planningestimatesarebeingmadeonascalelargerthan a single farm such as county or regional esti-mate of nutrient excretion
• aroughestimateisneededforfarmplanning
• farm-specificinformationofanimalperformanceand feed intake is not available
Much of the as excreted data included in the tables of this chapter were developed using equations that are now available for predicting manure content, primar-ily nitrogen and phosphorus, dry matter, and, depend-ing upon species, other potential characteristics for beef, swine, and poultry excretion. The fundamental model (fig. 4–1) on which these equations are based is:
Nutrient excretion = Nutrient feed intake – Nutrient retention
Of the total excreted solids, dry matter in urine typically contributes 10 to 20 percent of the volume.
These equations allow an estimate of as excreted ma-nure characteristics relevant to a wide range of dietary options and animal performance levels commonly ob-served in commercial production. Considered are fac-tors related to the feed efficiency in animal performance and to feed intake including crude protein, phospho-rus, and dry matter. A full presentation and description of these equations is beyond the scope of this chapter. They are, however, available in the American Society of Agricultural and Biological Engineers Standard D384.2. See http://www.asabe.org/standards/index.html.
For dairy and horses, regression analysis was performed on large data sets to determine appropriate equations.
In a number of situations, consideration should be giv-en to using equations instead of the as excreted values presented in the tables of this chapter. Typical or aver-age estimates of as excreted manure eventually become out-of-date due to changes in animal genetics, perfor-mance potential, feeding program strategies, and avail-able feeds. If the timeliness of the data presented in this chapter becomes problematic, consideration should be given to computing values using equations. Other situ-ations when use of equations should be considered are when:
• comprehensivenutrientmanagementplansare being developed specific to a farm and its AWMS
• dataisavailableforalivestockorpoultryopera-tion’s feeding program and animal performance
• afeedingstrategyortechnologydesignedtore-duce nutrient excretion is being used
Agricultural Waste CharacteristicsChapter 4
Dry matter excretion Feed dry matter intake dry matter= × −1 digestibility Dry matter in urine( ) +
Foodnutrient
intake
Nutrient excretion- =
Nutrient retention by animal or in theanimal’s products such as eggs or milk
Feed nutrient intake
Figure 4–1 Mass balance approach used for developing table values for beef cattle, swine, and poultry

Chapter 4 Agricultural Waste Characteristics Part 651Agricultural Waste Management Field Handbook
4–2 (210–VI–AWMFH, March 2008)
The chapter also provides table values for the typical characteristics of manure at transfer from housing or from storage and treatment facilities. These values are useful for long-term planning for utilization of manure and other wastes; but, they should not be used in deter-mining a field-specific application rate.
(b) Variations and ranges of data values
In most cases, a single value is presented for a specif-ic waste characteristic. This value is presented as a rea-sonable value for facility design and equipment selection for situations where site-specific data are not avail-able. Waste characteristics are subject to wide variation; both greater and lesser values than those presented can be expected. Therefore, much attention is given in this chapter to describing the reasons for data variation and to giving planners and designers a basis for seeking and establishing more appropriate values where justified by the situation.
Site-specific waste sampling, testing, and data collection are essential for the utilization function of an AWMS. Such sampling can result in greater certainty and con-fidence in amount of nutrients available. Care must be exercised to assure that samples are representative of the waste stream and arrive at the laboratory in a time-ly manner. Since manure and other waste products are in continual flux, it must also be kept in mind that the re-sults from such testing are only valid for the time when the samples were taken.
651.0401 Definitions of waste characterization terms
Table 4–1 contains definitions and descriptions of waste characterization terms. It includes abbreviations, defini-tions, units of measurement, methods of measurement, and other considerations for the physical and chemical properties of manure, waste, and residue. The physical properties—weight (Wt), volume (Vol), moisture content (MC), total solids (TS), volatile solids (VS), fixed solids (FS), dissolved solids (DS), and suspended solids (SS)—are important to agricultural producers and facility plan-ners and designers. They describe the amount and con-sistency of the material to be dealt with by equipment and in treatment and storage facilities. Of the chemical constituents, nitrogen (N), phosphorus (P), and potas-sium (K) are of great value to waste systems planners, producers, and designers. Land application of agricultur-al waste is the primary waste utilization procedure, and N, P, and K are the principal components considered in development of an agricultural waste management plan.
Volatile solids (VS) and 5-day Biochemical Oxygen Demand (BOD
5) are used in the planning and design of
certain biological treatment procedures.
Data on biological properties, such as numbers of spe-cific micro-organisms, are not presented in this chapter. Micro-organisms are of concern as possible pollutants of ground and surface water, but they are not commonly used as a design factor for no-discharge waste manage-ment systems that use wastes on agricultural land.
When expressed in units of pounds per day or as a con-centration, various solid fractions of manure, waste, or residue are often measured on a wet weight basis (% w.b.), a percentage of the “as is” or wet weight of the ma-terial. In some cases, however, data are recorded on a dry weight basis (% d.w.), a percentage of the dry weight of the material. The difference in these two values for a specific material is most likely very large. Nutrient and other chemical fractions of a waste material, ex-pressed as a concentration, may be on a wet weight or dry weight basis, or expressed as pounds per 1,000 gal-lons of waste.
The term “agricultural waste” was coined by those who pioneered the technology. For them, the term seemed appropriate because it was generic and could be used in the context of the wide variety of materials under con-
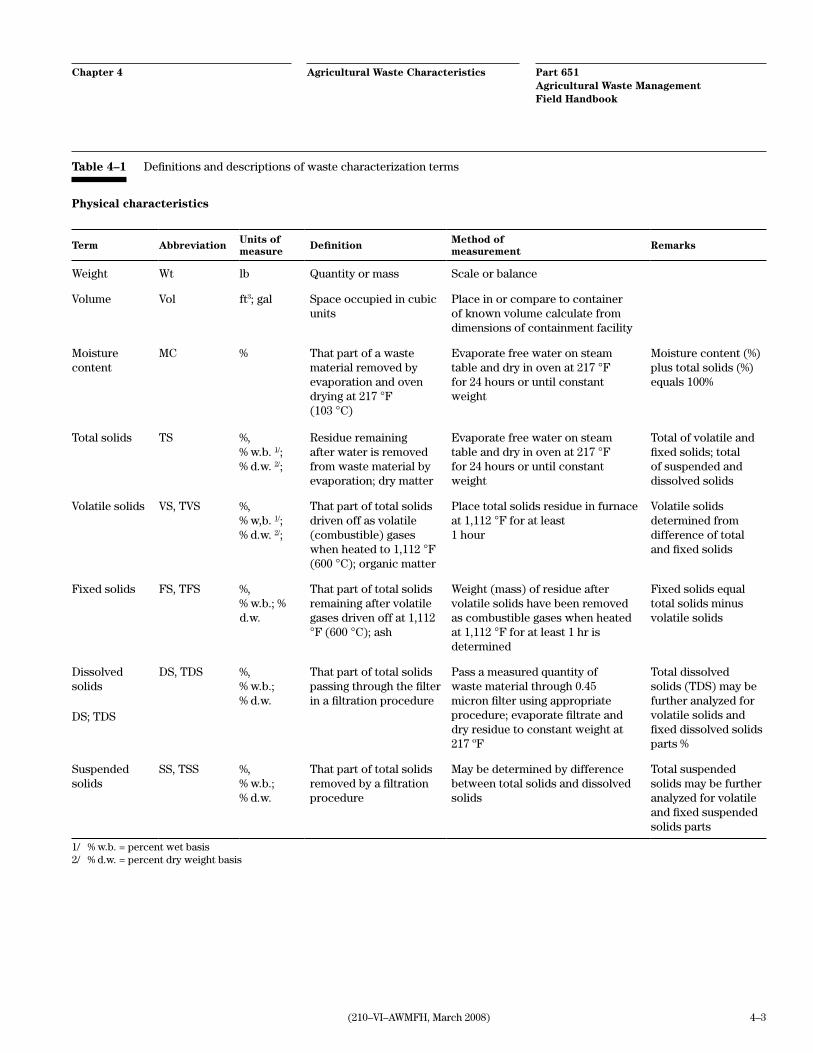
Agricultural Waste CharacteristicsChapter 4 Part 651Agricultural Waste Management Field Handbook
4–3(210–VI–AWMFH, March 2008)
Physical characteristics
Term Abbreviation Units of measure Definition Method of
measurement Remarks
Weight Wt lb Quantity or mass Scale or balance
Volume Vol ft3; gal Space occupied in cubic units
Place in or compare to container of known volume calculate from dimensions of containment facility
Moisture content
MC % That part of a waste material removed by evaporation and oven drying at 217 °F (103 °C)
Evaporate free water on steam table and dry in oven at 217 °F for 24 hours or until constant weight
Moisture content (%) plus total solids (%) equals 100%
Total solids TS %, % w.b. 1/; % d.w. 2/;
Residue remaining after water is removed from waste material by evaporation; dry matter
Evaporate free water on steam table and dry in oven at 217 °F for 24 hours or until constant weight
Total of volatile and fixed solids; total of suspended and dissolved solids
Volatile solids VS, TVS %, % w,b. 1/; % d.w. 2/;
That part of total solids driven off as volatile (combustible) gases when heated to 1,112 °F (600 °C); organic matter
Place total solids residue in furnace at 1,112 °F for at least 1 hour
Volatile solids determined from difference of total and fixed solids
Fixed solids FS, TFS %, % w.b.; % d.w.
That part of total solids remaining after volatile gases driven off at 1,112 °F (600 °C); ash
Weight (mass) of residue after volatile solids have been removed as combustible gases when heated at 1,112 °F for at least 1 hr is determined
Fixed solids equal total solids minus volatile solids
Dissolved solids
DS; TDS
DS, TDS %, % w.b.; % d.w.
That part of total solids passing through the filter in a filtration procedure
Pass a measured quantity of waste material through 0.45 micron filter using appropriate procedure; evaporate filtrate and dry residue to constant weight at 217 ºF
Total dissolved solids (TDS) may be further analyzed for volatile solids and fixed dissolved solids parts %
Suspended solids
SS, TSS %, % w.b.; % d.w.
That part of total solids removed by a filtration procedure
May be determined by difference between total solids and dissolved solids
Total suspended solids may be further analyzed for volatile and fixed suspended solids parts
1/ % w.b. = percent wet basis2/ % d.w. = percent dry weight basis
Table 4–1 Definitions and descriptions of waste characterization terms

Chapter 4 Agricultural Waste Characteristics Part 651Agricultural Waste Management Field Handbook
4–4 (210–VI–AWMFH, March 2008)
Term AbbreviationUnits of measure
DefinitionMethod of measurement
Remarks
Ammoniacal nitrogen (total ammonia)
Ammonia nitrogen
NH3-N
mg/L
µg/L
mg/L
µg/L
Both NH3 and NH
4
nitrogen compounds
A gaseous form of ammoniacal nitrogen
Common laboratory pro-cedure uses digestion, ox-idation, and reduction to convert all or selected ni-trogen forms to ammo-nium that is released and measured as ammonia
Volatile and mobile nutri-ents; may be a limiting nu-trient in land spreading of wastes and in eutrophica-tion. Recommended meth-ods of manure analysis measures ammonium nitro-gen (NH
4-N)
Ammonium nitrogen
NH4-N mg/L
µg/LThe positively ionized (cation) form of ammoniacal nitrogen
Can become attached to the soil or used by plants or microbes
Total Kjeldahl nitrogen
TKN mg/L µg/L
The sum of organic nitrogen and ammoniacal nitrogen
Digestion process which converts all organic nitro-gen to ammonia
Nitrate nitro-gen
NO3-N mg/L
µg/L The negatively ionized (anion) form of nitrogen that is highly mo-bile
Nitrogen in this form can be lost by denitrification, percolation, runoff, and plant microbial utilization
Total nitrogen TN; N %; lb The summation of nitrogen from all the vari-ous nitrogen compounds
Macro-nutrient for plants
Phosphorus TP, SRP P P
2O
5
mg mg/L lb lb
Total phosphorus (TP) is a measure of all the forms of phosphorus, dis-solved or particulate, that is found in a sample. Soluble reactive phospho-rus (SRP) is a measure of orthophosphate, the filter-able (soluble, inorganic) fraction of phosphorus, the form directly taken up by plant cells. P is elemen-tal phosphorus. P
2O
5 is the
fertilizer equivalent phos-phorus
Laboratory procedure uses digestion and/or re-duction to convert phos-phorus to a colored com-plex; result measured by spectrophotometer or in-ductive coupled plasma
Critical in water pollution control; may be a limiting nutrient in eutrophication and in spreading of wastes
5-day Biochemical oxygen demand
BOD5
lb of O2
Extensive laboratory procedure of incubating waste sample in oxygen-ated water for 5 days and measuring amount of dis-solved oxygen consumed
Standard test for measuring pollution potential of waste
Chemical oxygen demand
COD lb of O2
Measure of oxygen con-suming capacity of or-ganic and some inorganic components of waste ma-terials
Relatively rapid laborato-ry procedure using chemi-cal oxidants and heat to fully oxidize organic com-ponents of waste
Estimate of total oxygen that could be consumed in oxidation of waste material
Table 4–1 Definitions and descriptions of waste characterization terms—Continued
Chemical properties

Agricultural Waste CharacteristicsChapter 4 Part 651Agricultural Waste Management Field Handbook
4–5(210–VI–AWMFH, March 2008)
sideration. Now, the concern of many is that the word waste implies that the material is only suitable for dis-posal and as such, detracts from proper utilization. Even though another word or term might better convey the beneficial aspects, agricultural waste is so entrenched in the literature it would now be difficult to change. Further, a consensus replacement term that is appro-priate in every context has not come to the forefront. It must be understood that it was neither the intent of those who initially developed the technology nor the authors of this chapter (with its continued use) to im-ply the materials being discussed are worthless and are only suitable for disposal. Rather, the materials are to be viewed as having value both monetarily and environmen-tally if properly managed, regardless of what they are called.
Wastes are often given descriptive names that reflect their moisture content such as liquid, slurry, semisolid and solid. Wastes that have a moisture content of 95 per-cent or more exhibit qualities very much like water are called liquid waste or liquid manure. Wastes that have moisture content of about 75 percent or less exhibit the properties of a solid and can be stacked and hold a def-inite angle of repose. These are called solid manure or solid waste. Wastes that are between about 75 and 95 percent moisture content (25 and 5 percent solids) are semiliquid (slurry) or semisolid (chapter 9). Because wastes are heterogeneous and inconsistent in their phys-ical properties, the moisture content and range indicat-ed above must be considered generalizations subject to variation and interpretation.
The terms “manure,” “waste,” and “residue” are some-times used synonymously. In this chapter, manure re-fers to materials that have a high percentage of feces and urine. Other material that may or may not have signifi-cant feces, and urine is referred to as waste or a relat-ed term such as wastewater. The term as excreted refers to feces and urine prior to any changes due to dilution water addition, drying, volatilization, or other physi-cal, chemical, or biological processes. Litter is a specific form of poultry waste that results from floor production of birds after an initial layer of a bedding material, such as wood shavings, is placed on the floor at the beginning of and perhaps during the production cycle.
Because of the high moisture content of as excreted ma-nure and treated waste, their specific weight is very sim-ilar to that of water—62.4 pounds per cubic foot. Some manure and waste that have considerable solids content
can have a specific weight of as much as 105 percent that of water. Some dry wastes, such as litter, that have sig-nificant void space can have specific weight of much less than that of water. Assuming that wet and moist wastes weigh 60 to 65 pounds per cubic foot is a convenient and useful estimate for planning waste management systems.
Because moisture content of manure is transitory, most testing laboratories report results in terms of dry weight (d.w.). However, equipment is calibrated and storage structures sized based upon wet weight. As such, it is important to understand the relationship of wet basis (w.b.) and dry basis (d.w.).
When test data is reported in terms of its wet basis, the base is its hydrated weight.
Percent wet basis =
weight of constituent
wet weight of samplle
When test data is reported in terms of its dry weight, the base is its dry weight.
Percent dry basis =weight of constituent
dry weight of samplle
Residue after oven drying the sample is the total solids. Since the dry weight is equal to the total solids, they are always 100 percent d.w.
The fixed solids are the nonorganic portion of the total solids. The weight of fixed solids is determined by a test that involves heating a sample of the waste to 1,112 °F. The fixed solids are the ash that remains after the mate-rial driven off by the heating is the volatile solids.
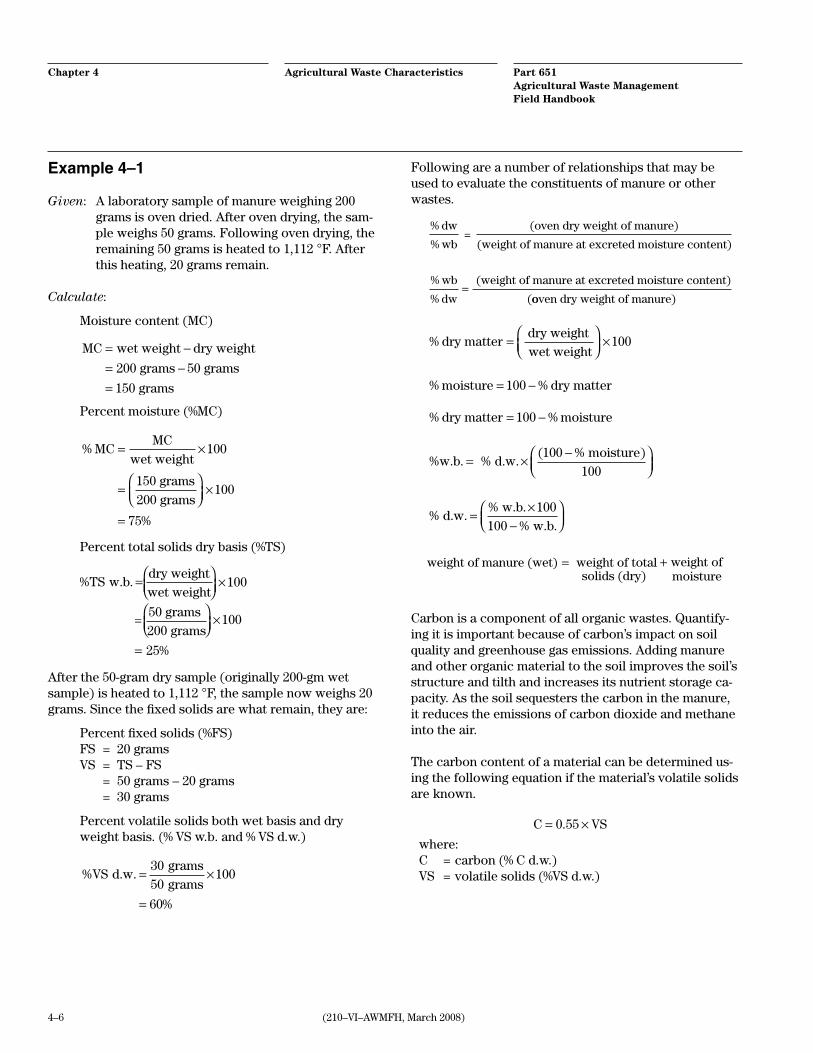
Chapter 4 Agricultural Waste Characteristics Part 651Agricultural Waste Management Field Handbook
4–6 (210–VI–AWMFH, March 2008)
Example 4–1
Given: A laboratory sample of manure weighing 200 grams is oven dried. After oven drying, the sam-ple weighs 50 grams. Following oven drying, the remaining 50 grams is heated to 1,112 °F. After this heating, 20 grams remain.
Calculate:
Moisture content (MC)
MC wet weight dry weight
200 grams 50 grams
150 grams
= −= −=
Percent moisture (%MC)
% MCMC
t w
0 g
0 g
= ×
=
×
=
we eight
rams
rams
100
15
20100
75%
Percent total solids dry basis (%TS)
After the 50-gram dry sample (originally 200-gm wet sample) is heated to 1,112 °F, the sample now weighs 20 grams. Since the fixed solids are what remain, they are:
Percent fixed solids (%FS) FS = 20 grams VS = TS – FS = 50 grams – 20 grams = 30 grams
Percent volatile solids both wet basis and dry weight basis. (% VS w.b. and % VS d.w.)
% . .
%
VS d wgramsgrams
= ×
=
3050
100
60
Following are a number of relationships that may be used to evaluate the constituents of manure or other wastes.
% dw
% wb =
(oven dry weight of manure)
(weight of manure at excreted moisture content)
% wb
% dw
(weight of manure at excreted moisture content)
(=
ooven dry weight of manure)
% dry matter
dry weight wet weight
100=
×
% moisture % dry matter= −100
% dry matter % moisture= −100
% . . % . .
( % )w b d w
moisture= × −
100
100
% . .
% . .% . .
w
d w
bw b
= ×−
100100
weight of manure (wet) weight of total weight= + of solids (dry) moisture
Carbon is a component of all organic wastes. Quantify-ing it is important because of carbon’s impact on soil quality and greenhouse gas emissions. Adding manure and other organic material to the soil improves the soil’s structure and tilth and increases its nutrient storage ca-pacity. As the soil sequesters the carbon in the manure, it reduces the emissions of carbon dioxide and methane into the air.
The carbon content of a material can be determined us-ing the following equation if the material’s volatile solids are known.
C VS= ×0 55.
where:C = carbon (% C d.w.)VS = volatile solids (%VS d.w.)
% . .
%
TS w b dry weightwet weight
50 grams 200 grams
=
= 25
= 100
×
100
×

Agricultural Waste CharacteristicsChapter 4 Part 651Agricultural Waste Management Field Handbook
4–7(210–VI–AWMFH, March 2008)
Example 4–2
The testing laboratory reports that the manure’s volatile solids on a dry weight basis are 60 percent. Compute the percentage d.w. carbon content of the sample.
% . . . % . .
.
. % . .
C d w VS d w
d w
= ×= ×=
0 55
0 55 60
33 0
The manure has a moisture content of 80 percent. Compute the percentage of carbon contained in the ma-nure on a wet basis.
% . . % . .( % )
.( )
C w b C d wmoisture= × −
= × ×
=
100100
33 00100 80
1006.. %6
Knowing the carbon to nitrogen ratio (C:N) can be im-portant. For example, the C:N is an important aspect of the compost recipe (ch. 10). If the C:N is high, such as it might be in a manure containing organic bedding such as sawdust, the carbon can tie up nitrogen from the soil when land applied. The C:N can be determined using the following equation.
C N
CTN
: =
where: C:N = carbon to nitrogen ratio C = carbon (%C d.w.)TN = total nitrogen (%TN d.w.)
Example 4–3
Determine the C:N ratio for a manure that contains 2.1 percent d.w. of total nitrogen and a carbon content of 33.0 percent d.w.
C NC
TN:
=
=
=
33 02 115 7 1
... :
The following are equations for converting nutrient lev-els reported on dry basis to a wet basis:
nutrient level, =
nutrient level, 100 % moisture dry
× −( )bbasis
100wet basis
nutrient level, =
nutrient level, % dry matter dry basi
×ss total solids
100wet basis
Example 4–4
A manure testing laboratory reports that the manure has a nitrogen content of 11.5 percent d.w. The manure sampled contained 85 percent moisture. Compute the pounds of nitrogen per ton of manure as it will be trans-ferred for utilization.
nutrient level, =
nutrient level, 100 % moisture dry
× −( )bbasis
100wet basis
=× −( )
=
= × ×
N/ton ton 2,000 lb/ton1.725
1
11 5 100 85
1001 725
1
.
. %
lb000
lb/ton= 34 5.

Chapter 4 Agricultural Waste Characteristics Part 651Agricultural Waste Management Field Handbook
4–8 (210–VI–AWMFH, March 2008)
651.0402 Units of measure
In this chapter, English units are used exclusively for weight, volume, and concentration data for manure, waste, and residue.
The table values for as excreted manure from livestock is expressed in three different formats. They are in terms of mass or volume per:
• dayper1,000poundsoflivestockliveweight (lb/d/1000 lb)
and
• finishedanimal(f.a.)formeatproducinganimals
or
• day-animal(d-a)forotheranimals
Excreted manure table values are given in the NRCS traditional format of mass or volume per day per 1,000 pounds live weight for all livestock and poultry types and production groupings. The 1,000 pounds live weight or animal unit (AU) is often convenient because there is a commonality of expression, regardless of the species or weight of the individual species.
A 1,000-pound AU is 1,000 pounds of live weight, not an individual animal. For example, a 1,400-pound Holstein cow is 1.4 AU (1400/1000 = 1.4). A 5-pound laying hen would be 0.005 AU (5/1000 = 0.005). The challenge in us-ing table values in this format is for young animals. Since these animals are gaining weight, an animal weight that is representative of the time period being considered must be determined.
As an alternative, table values for excreted manure from livestock and poultry being fed for an end result of meat production are given in terms of mass or volume per fin-ished animal. The table values given in this format are the mass or volume for one animal’s finishing period in the feeding facility. Manure production expressed in this manner eliminates the problems of determining a rep-resentative weight of the animal for its tenure at a facil-ity. Breeding stock weight for beef or swine is not given in this format because the animal’s weight is stable, and they are usually retained year-round.
Table values are also given in terms of mass or volume per day-animal for dairy animals, beef and swine breed-ing stock, and layer chickens. The young stock included
in the tables with this format, such as dairy calves and heifers, are expressed as mass or volume per day-animal that is representative for the span of time when they are in this age category.
Food processing waste is recorded in cubic feet per day (ft3/d), or the source is included such as cubic feet per 1,000 pounds of potatoes processed.
The concentration of various components in waste is commonly expressed on a milligram per liter (mg/L) ba-sis or parts per million (ppm). One mg/L is milligrams of solute per liter of solution. One ppm is one part by weight of solute in one million parts by weight of solu-tion. Therefore, mg/L equals ppm if a solution has a spe-cific gravity equal to that of water (1,000,000 mg/L or 1 kg/L). Generally, substances in solution up to concentra-tions of about 7,000 mg/L do not materially change the specific gravity of the liquid, and mg/L and ppm are nu-merically interchangeable. Concentrations are some-times expressed as mg/kg or mg/1,000g, which are the same as ppm.
Occasionally, the concentration is expressed in percent. A 1 percent concentration equals 10,000 ppm. Very low concentrations are sometimes expressed as micrograms per liter (µg/L). A microgram is one millionth of a gram.
Various solid fractions of a manure, waste, or residue, when expressed in units of pounds per day or as a con-centration, can be expressed either on a wet basis (% w.b.) or on a dry weight basis (% d.w.). The percent w.b. is the “as is” or wet weight of the material, and the d.w. is with the moisture removed. The difference in these two bases for a specific material is most likely very large. Nutrient and other chemical fractions of a waste material, expressed as a concentration, may be on a wet weight or dry weight basis, or expressed as pounds per 1,000 gallons of waste.
Amounts of the major nutrients, nitrogen (N), phospho-rus (P), and potassium (K), are occasionally expressed in terms of the elemental nutrient form. However, labo-ratory analysis reports are more commonly expressing the nutrients in manure as a common fertilizer equiva-lent, P
2O
5 for P and K
20 for K. When comparing the nutri-
ent content of a manure, waste, or residue with commer-cial fertilizer, the conversion factors listed in table 4–2 should be used, and comparisons on the basis of simi-lar elements, ions, and/or compounds should be made. Nitrogen is always expressed as the nitrogen form such as Total N, NO
3-N, and NH
4-N).
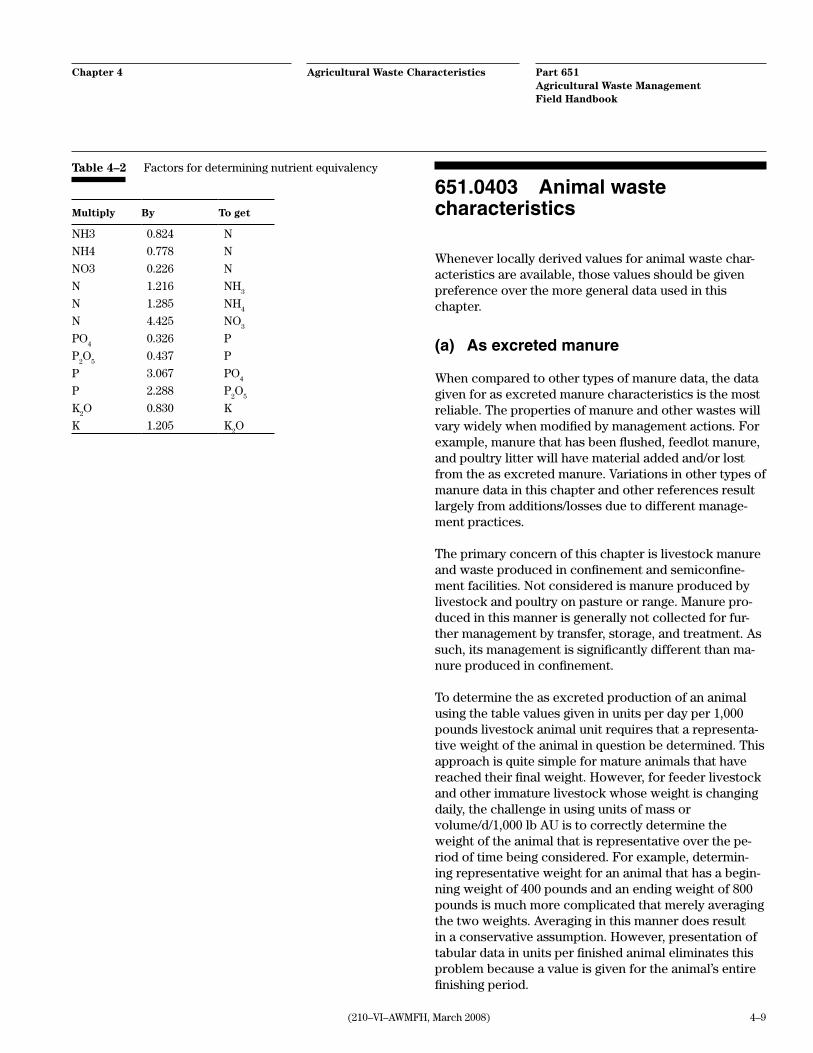
Agricultural Waste CharacteristicsChapter 4 Part 651Agricultural Waste Management Field Handbook
4–9(210–VI–AWMFH, March 2008)
Table 4–2 Factors for determining nutrient equivalency
Multiply By To get
NH3 0.824 N
NH4 0.778 N
NO3 0.226 N
N 1.216 NH3
N 1.285 NH4
N 4.425 NO3
PO4
0.326 P
P2O
50.437 P
P 3.067 PO4
P 2.288 P2O
5
K2O 0.830 K
K 1.205 K2O
651.0403 Animal waste characteristics
Whenever locally derived values for animal waste char-acteristics are available, those values should be given preference over the more general data used in this chapter.
(a) As excreted manure
When compared to other types of manure data, the data given for as excreted manure characteristics is the most reliable. The properties of manure and other wastes will vary widely when modified by management actions. For example, manure that has been flushed, feedlot manure, and poultry litter will have material added and/or lost from the as excreted manure. Variations in other types of manure data in this chapter and other references result largely from additions/losses due to different manage-ment practices.
The primary concern of this chapter is livestock manure and waste produced in confinement and semiconfine-ment facilities. Not considered is manure produced by livestock and poultry on pasture or range. Manure pro-duced in this manner is generally not collected for fur-ther management by transfer, storage, and treatment. As such, its management is significantly different than ma-nure produced in confinement.
To determine the as excreted production of an animal using the table values given in units per day per 1,000 pounds livestock animal unit requires that a representa-tive weight of the animal in question be determined. This approach is quite simple for mature animals that have reached their final weight. However, for feeder livestock and other immature livestock whose weight is changing daily, the challenge in using units of mass or volume/d/1,000 lb AU is to correctly determine the weight of the animal that is representative over the pe-riod of time being considered. For example, determin-ing representative weight for an animal that has a begin-ning weight of 400 pounds and an ending weight of 800 pounds is much more complicated that merely averaging the two weights. Averaging in this manner does result in a conservative assumption. However, presentation of tabular data in units per finished animal eliminates this problem because a value is given for the animal’s entire finishing period.
Chapter 4 Agricultural Waste Characteristics Part 651Agricultural Waste Management Field Handbook
4–10 (210–VI–AWMFH, March 2008)
Facilities for meat-producing animals are rarely in full production 365 days per year due to uneven growth rates of animals, time required for facility cleaning after a group, and availability of animals for restocking a facil-ity. Planning based on number of finished meat animals provides a more realistic planning estimate for annual manure volume and nutrient production.
The values given in the as excreted tables dairy, beef, swine, poultry, and equine were determined by one of the following two approaches.
• Useofanutrientbalanceestimateofexcretionthatassumes feed intake minus animal retention equals excretion. This approach is used for all beef, swine, and poultry animal groups.
• Useofexistingresearchdataandregressionanaly-sis for dairy and equine.
Table values are estimated for dietary intake and ani-mal performance levels common for livestock and poul-try management in 2003 using the equations. Beef, poul-try, and swine excretion characteristics are based on a calculation using equations that considers dietary nutri-ent intake minus animal nutrient retention using dietary and performance measurements typical for the indus-try at the time these data were published. Nutrient re-tention estimates followed common industry methodol-ogies used for estimating animal nutrient requirements. Total nitrogen, total phosphorus, and dry matter excre-tion were estimated by these methods for all species. Available research data or models allowed additional ex-cretion estimates for some species. Dry matter excretion is estimated to be a function of dry matter intake minus dry matter digestibility.
Dairy and equine manure characteristics were developed using existing research data and regression analysis to identify relationships between feeding programs, animal performance, and excretion. A regression analysis in-volves the study of relationships between variables.
For some values, particularly potassium, previously pub-lished excretion values were used instead of the equa-tion methods used exclusively for nitrogen and phos-phorus. As with most minerals, the amount of these nutrients (minerals) consumed can vary significantly due to regional differences. For example, some forages can be quite high in potassium because of high amounts of available potassium in the soil. In these situations, the amount of potassium consumed will be the major deter-minant in amount of potassium excreted. Development of modeling equations for estimating excretion of these
other minerals is warranted, but they are not available at this time. Until these models are available, consideration should be given to adjusting the table values to a greater value if nutrient consumptions are very high.
Where dietary intake and animal performance lev-el based excretion estimates could not be made, cur-rent references were reviewed, including the 1992 ver-sion of the NRCS Agricultural Waste Management Field Handbook (AWMFH); the American Society of Agricultural Engineers Standard D384.2; Manure Production and Characteristics, March 2005; and Manure Characteristics in Midwest Plan Service Publication MWPS–18, Section 1.
The as excreted table values for veal and sheep are from the 1992 version of the AWMFH.
As previously stated, table values given in this chap-ter are based on common dietary intake for livestock and poultry. If feed rations are atypical, excreted val-ues should be computed by use of equations or by other means to more closely reflect actual values of the opera-tion under consideration rather than using the table val-ues. For example, table values may not be appropriate when by-products from the ethanol industry are includ-ed in feed rations. The rapid growth of the ethanol indus-try primarily for production of oxygenated fuel and, to a much lesser extent, the alcohol beverage industry, has resulted in its by-products being available as a competi-tively priced feed ingredient for dairy, beef, and, to some extent, swine and poultry. Use of these ethanol products may increase both nitrogen and phosphorus in the ex-creted manure beyond the values given in the tables.
Another example of when the table values are not ap-propriate is when beef cattle are fed high forage diets. Since beef cattle are ruminants, they can utilize forag-es, which are generally lower in digestibility, as well as concentrates, which are generally higher in digestibility. Depending upon the stage of production, the roughage-to-concentrate ratio can vary tremendously. When poorly digestible forages (fiber) are fed as compared to concen-trates, volumes of manure produced are much greater than the values given in the tables.
(b) Common management modifications
How the manure is managed following excretion will of-ten result in changes to its basic physical and chemi-cal characteristics. These management actions include those related to wasted feed, wasted water, flush water,

Agricultural Waste CharacteristicsChapter 4 Part 651Agricultural Waste Management Field Handbook
4–11(210–VI–AWMFH, March 2008)
precipitation/evaporation, bedding (litter), soil, and bi-ological activity. Management following excretion can also result in drying. For example, manure excreted in feedlots in arid parts of the country can lose substantial moisture because of evaporation. Dust, hair, and feath-ers from the livestock and poultry can also add to ma-nure, but only in limited amounts.
(1) Wasted feedWasted feed can add nutrients and solids to the waste stream. Even though management can minimize the amount of feed wasted, a certain amount of feed that is presented to livestock and poultry will not be eat-en. Correcting the excreted values to account for what could be considered normal wasted feed would usually be small compared to the range of values in the excret-ed manure that result from variations in diet intake and animal performance levels. However, if wasted feed ap-pears to be excessive, the table values should be adjust-ed to account for it.
(2) Wasted waterWasted water must be expected and controlled. Excess moisture content and increased waste volume can ham-per equipment operation and limit the capacity of ma-nure handling and storage facilities. Faulty waterers and leaky distribution lines cause severe limitations. Excess water from foggers and misters used for cooling stock in hot weather may also need to be accounted for in system design.
(3) Flush waterFlush water added to the waste stream will affect the consistency of the manure to the extent fresh water is added to the system. Using recycled water for flushing minimizes the amount of water added and needing to be managed.
(4) Precipitation/evaporationPrecipitation and evaporation can impact the physical characteristics of manure significantly, depending on the region. In regions of high precipitation, the added water can impact the consistency of the manure unless man-agement excludes it. Evaporation, on the other hand can reduce the amount of water in the manure. But again, management of the manure will determine its impact. For example, allowing a crust to form on a waste storage pond will reduce evaporation.
(5) BeddingLivestock producers use a wide range of bedding mate-rials as influenced by availability, cost, and performance properties. Both organic and inorganic materials have been used successfully. Unit weights of materials com-monly used for bedding dairy cattle are given in table 4–3.
Quantities of bedding materials used for dairy cattle are shown in table 4–4. The total weight of dairy manure and bedding is the sum of the weights of both parts. The to-tal volume of dairy manure and bedding is the sum of the
Table 4–3 Unit weights of common bedding materials 1/
Material Loose Chopped
- - - - - -lb/ft3- - - - - -
Legume hay 4.3 6.5
Non legume hay 4.0 6.0
Straw 2.5 7.0
Wood shavings 9.0
Sawdust 12
Soil 75
Sand 105
Ground limestone 951/ Adapted from the 1992 version of the AWMFH
Table 4–4 Daily bedding requirements for dairy cattle 1/
Barn type
MaterialStanchion stall
Free-stall
Loose housing
- - - - - - - - - lb/d/1000 lb - - - - - - - - - -
Loose hay or straw 5.4 9.3
Chopped hay or straw
5.7 2.7 11
Shavings or sawdust
3.1
Sand, or limestone
35 2/
1/ Adapted from the 1992 version of the AWMFH2/ Table 13, Manure Characteristics, Midwest Planning Service Section
1.
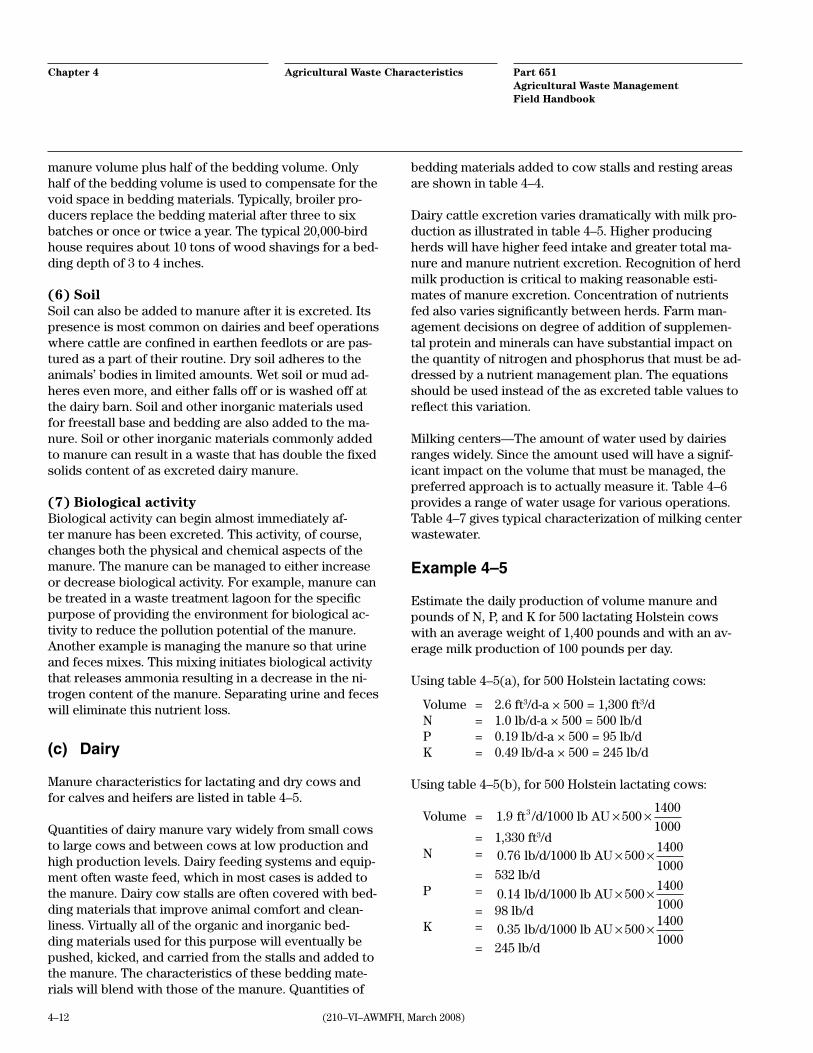
Chapter 4 Agricultural Waste Characteristics Part 651Agricultural Waste Management Field Handbook
4–12 (210–VI–AWMFH, March 2008)
manure volume plus half of the bedding volume. Only half of the bedding volume is used to compensate for the void space in bedding materials. Typically, broiler pro-ducers replace the bedding material after three to six batches or once or twice a year. The typical 20,000-bird house requires about 10 tons of wood shavings for a bed-ding depth of 3 to 4 inches.
(6) SoilSoil can also be added to manure after it is excreted. Its presence is most common on dairies and beef operations where cattle are confined in earthen feedlots or are pas-tured as a part of their routine. Dry soil adheres to the animals’ bodies in limited amounts. Wet soil or mud ad-heres even more, and either falls off or is washed off at the dairy barn. Soil and other inorganic materials used for freestall base and bedding are also added to the ma-nure. Soil or other inorganic materials commonly added to manure can result in a waste that has double the fixed solids content of as excreted dairy manure.
(7) Biological activityBiological activity can begin almost immediately af-ter manure has been excreted. This activity, of course, changes both the physical and chemical aspects of the manure. The manure can be managed to either increase or decrease biological activity. For example, manure can be treated in a waste treatment lagoon for the specific purpose of providing the environment for biological ac-tivity to reduce the pollution potential of the manure. Another example is managing the manure so that urine and feces mixes. This mixing initiates biological activity that releases ammonia resulting in a decrease in the ni-trogen content of the manure. Separating urine and feces will eliminate this nutrient loss.
(c) Dairy
Manure characteristics for lactating and dry cows and for calves and heifers are listed in table 4–5.
Quantities of dairy manure vary widely from small cows to large cows and between cows at low production and high production levels. Dairy feeding systems and equip-ment often waste feed, which in most cases is added to the manure. Dairy cow stalls are often covered with bed-ding materials that improve animal comfort and clean-liness. Virtually all of the organic and inorganic bed-ding materials used for this purpose will eventually be pushed, kicked, and carried from the stalls and added to the manure. The characteristics of these bedding mate-rials will blend with those of the manure. Quantities of
bedding materials added to cow stalls and resting areas are shown in table 4–4.
Dairy cattle excretion varies dramatically with milk pro-duction as illustrated in table 4–5. Higher producing herds will have higher feed intake and greater total ma-nure and manure nutrient excretion. Recognition of herd milk production is critical to making reasonable esti-mates of manure excretion. Concentration of nutrients fed also varies significantly between herds. Farm man-agement decisions on degree of addition of supplemen-tal protein and minerals can have substantial impact on the quantity of nitrogen and phosphorus that must be ad-dressed by a nutrient management plan. The equations should be used instead of the as excreted table values to reflect this variation.
Milking centers—The amount of water used by dairies ranges widely. Since the amount used will have a signif-icant impact on the volume that must be managed, the preferred approach is to actually measure it. Table 4–6 provides a range of water usage for various operations. Table 4–7 gives typical characterization of milking center wastewater.
Example 4–5
Estimate the daily production of volume manure and pounds of N, P, and K for 500 lactating Holstein cows with an average weight of 1,400 pounds and with an av-erage milk production of 100 pounds per day.
Using table 4–5(a), for 500 Holstein lactating cows:
Volume = 2.6 ft3/d-a × 500 = 1,300 ft3/dN = 1.0 lb/d-a × 500 = 500 lb/dP = 0.19 lb/d-a × 500 = 95 lb/dK = 0.49 lb/d-a × 500 = 245 lb/d
Using table 4–5(b), for 500 Holstein lactating cows:
Volume = 1 9. ft /d/1000 lb AU 5001400
10003 × ×
= 1,330 ft3/dN = 0 76. lb/d/1000 lb AU 500
14001000
× × = 532 lb/dP = 0 14. lb/d/1000 lb AU 500
14001000
× × = 98 lb/dK = 0 35. lb/d/1000 lb AU 500
14001000
× × = 245 lb/d

Agricultural Waste CharacteristicsChapter 4 Part 651Agricultural Waste Management Field Handbook
4–13(210–VI–AWMFH, March 2008)
(a) In units per day-animal 1/
Components Units
Lactating cow 2/
Milk production, lb/dMilk-fed calf
Calf Heifer Dry cow 2/
50 75 100 125 125 lb 330 lb 970 lb
Weight lb/d-a 133 148 164 179 27 54 85
Volume ft3/d-a 2.1 2.4 2.6 2.9 0.44 0.87 1.4
Moisture % wet basis 87 87 87 87 83 83 87
Total solids lb/d-a 17 19 21 23 3.0 8.3 11.0
VS 3/ lb/d-a 14 16 18 20 3.0 7.1 9.3
BOD lb/d-a 2.9 1.2 1.4
N lb/d-a 0.90 0.97 1.04 1.11 0.017 0.14 0.26 0.50
Pa lb/d-a 0.15 0.17 0.19 0.21 0.02 0.04 0.07
Ka lb/d-a 0.41 0.45 0.49 0.52 0.04 0.11 0.16
1/ ASAE D384.2, March 20052/ Assumes 1,375 lb lactating cow and 1,660 lb dry cow. Excretion values for P and K not in bold are based on the assumption that intake
is equal to excretion3/ VS based on 85% of TS
(b) In units per day per 1,000 lb animal unit
Components Units
Lactating cow milk production, lb/d
Milk-fed calf
Calf Heifer Dry cow
50 75 100 125 125 lb 330 lb 970 lb
Weight lb/d/1000 lb AU 97 108 119 130 83 56 51
Volume ft3/d/1000 lb AU 1.6 1.7 1.9 2.1 1.3 0.90 0.84
Moisture % wet basis 87 87 87 87 83 83 87
Total solids lb/d/1000 lb AU 12 14 15 17 9.2 8.5 6.6
VS lb/d/1000 lb AU 9.2 11 12 13 7.7 7.3 5.6
BOD lb/d/1000 lb AU 2.1 1.2 0.84
N lb/d/1000 lb AU 0.66 0.71 0.76 0.81 0.11 0.42 0.27 0.30
P lb/d/1000 lb AU 0.11 0.12 0.14 0.15 0.05 0.05 0.042
K lb/d/1000 lb AU 0.30 0.33 0.35 0.38 0.11 0.12 0.10
(c) Jersey cows in units per day per 1,000-lb animal unit 1/
Components UnitsLactating cow milk production, lb/d
45 60 75
Weight lb/d/1000 lb AU 116 130 144
Total solids lb/d/1000 lb AU 15 17 19
N lb/d/1000 lb AU 0.72 0.80 0.88
P lb/d/1000 lb AU 0.12 0.13 0.15
K lb/d/1000 lb AU 0.42 0.46 0.501/ Excretion values were determined using intake based equations. Although the intake-based equations were developed for Holsteins,
Blake et al. (1986) and Kauffman and St-Pierre (2001) found similar dry matter digestibility between breeds. Excretion estimates were determined using average dry matter intakes for Jersey cows (NRC 2001). Nutrient excretion estimates were based on cow consuming a diet containing 17 percent CP, 0.38 percent P, and 1.5 percent K.
Table 4–5 Dairy manure characterization—as excreted
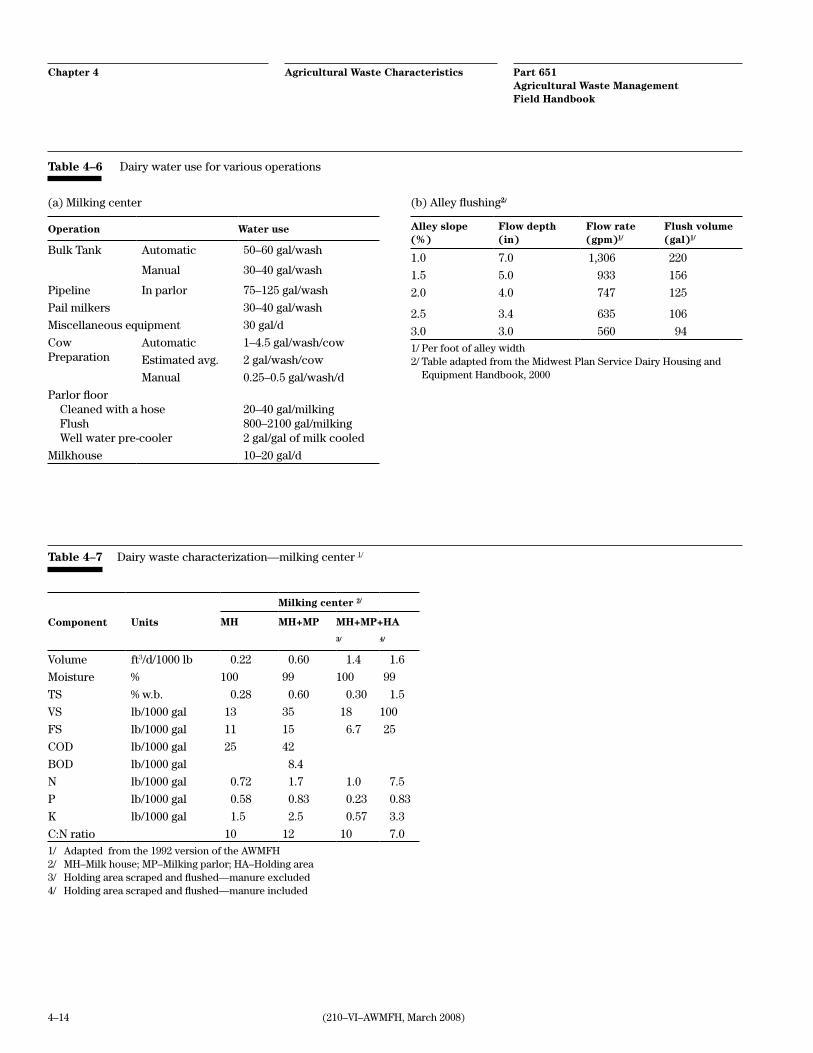
Chapter 4 Agricultural Waste Characteristics Part 651Agricultural Waste Management Field Handbook
4–14 (210–VI–AWMFH, March 2008)
(a) Milking center
Operation Water use
Bulk Tank Automatic 50–60 gal/wash
Manual 30–40 gal/wash
Pipeline In parlor 75–125 gal/wash
Pail milkers 30–40 gal/wash
Miscellaneous equipment 30 gal/d
Cow Preparation
Automatic 1–4.5 gal/wash/cow
Estimated avg. 2 gal/wash/cow
Manual 0.25–0.5 gal/wash/d
Parlor floor Cleaned with a hose Flush Well water pre-cooler
20–40 gal/milking 800–2100 gal/milking 2 gal/gal of milk cooled
Milkhouse 10–20 gal/d
(b) Alley flushing2/
Alley slope (%)
Flow depth (in)
Flow rate (gpm)1/
Flush volume (gal)1/
1.0 7.0 1,306 220
1.5 5.0 933 156
2.0 4.0 747 125
2.5 3.4 635 106
3.0 3.0 560 941/ Per foot of alley width2/ Table adapted from the Midwest Plan Service Dairy Housing and
Equipment Handbook, 2000
Table 4–6 Dairy water use for various operations
Component Units
Milking center 2/
MH MH+MP MH+MP+HA
3/ 4/
Volume ft3/d/1000 lb 0.22 0.60 1.4 1.6
Moisture % 100 99 100 99
TS % w.b. 0.28 0.60 0.30 1.5
VS lb/1000 gal 13 35 18 100
FS lb/1000 gal 11 15 6.7 25
COD lb/1000 gal 25 42
BOD lb/1000 gal 8.4
N lb/1000 gal 0.72 1.7 1.0 7.5
P lb/1000 gal 0.58 0.83 0.23 0.83
K lb/1000 gal 1.5 2.5 0.57 3.3
C:N ratio 10 12 10 7.01/ Adapted from the 1992 version of the AWMFH2/ MH–Milk house; MP–Milking parlor; HA–Holding area3/ Holding area scraped and flushed—manure excluded4/ Holding area scraped and flushed—manure included
Table 4–7 Dairy waste characterization—milking center 1/

Agricultural Waste CharacteristicsChapter 4 Part 651Agricultural Waste Management Field Handbook
4–15(210–VI–AWMFH, March 2008)
monia. The major source of ammonia is urea from urine, which can easily be converted to ammonia (NH
3), a gas.
Urea may account for 40 percent to more than 50 per-cent of nitrogen excreted in manure; therefore, it has a potential for rapid loss. The volatilization of nitrogen as ammonia depends on temperature, moisture content, pH, air movement, and other factors. Ammonia is solu-ble in water, which could be a potential threat if feedlot runoff comes in contact with surface or ground water.
Once excreted, phosphorus is fairly stable. The usual path of phosphorus loss is through runoff. As such, feed-lot runoff control measures will reduce the environmen-tal impact of phosphorus.
Feeding of by-products from the food and corn process-ing industries is becoming common in beef cattle pro-duction. Use of distillers grains from the production of ethanol is growing rapidly in regions with significant corn production. Cattle diets commonly contain 20 per-cent distillers grains on a dry matter basis and 40 per-cent inclusion is becoming increasingly common. The distillers by-product contains a concentrated source of both protein and phosphorus. Use of these by-prod-ucts can typically results in higher intakes of protein and phosphorus, resulting in higher excretion of nitrogen and phosphorus (table 4–8). Nutrient management plans will need to reflect the impact of by-product feeding.
(d) Beef
Table 4–8 lists characteristics of as excreted beef ma-nure. Feedlot manure varies widely because of climate, type of feedlot surface, and management. Typical values for feedlot manure are given later in table 4–16. Nutrient loss from feedlot manure is highly influenced by man-agement factors such as moisture control, animal densi-ty, and cleaning frequency. The type of feedlot surface, earthen or paved, has impacts, as well. The soil in unsur-faced beef feedlots is readily incorporated with the ma-nure due the animal movement and cleaning operations. Surfaced feedlots produce more runoff than unsurfaced lots. Runoff water from beef feedlots also exhibits wide variations in nutrient content character (table 4–9).
Moisture content of beef feedlot manure drops signifi-cantly over time from its as excreted 90 percent to about 30 percent. If the feedlot surface is too dry, dust will be-come a problem. If it remains too wet, odor may become a concern. Feedlot surface moisture of 25 to 35 percent will generally minimize odor, fly, and dust problems. For characteristics of manure solids from a beef feedlot, see table 4–16.
Nitrogen loss from feedlots can be by runoff, leaching, and ammonia volatilization. As much as 50 percent of the nitrogen deposited on feedlots may be lost as am-
Table 4–8 Beef waste characterization—as excreted
Components UnitsBeef cow in confinement
Growing calf confined 450–750 lb
Weight lb/d-a 125 50
Volume ft3/d-a 2.0 0.8
Moisture % w.b. 88 88
TS lb/d-a 15 6.0
VS lb/d-a 13 5.0
BOD lb/d-a 3.0 1.1
N lb/d-a 0.42 0.29
P lb/d-a 0.097 0.055
K lb/d-a 0.30 0.191/ Beef cow values are representative of animals during nonlactating
period and first 6 months of gestation
Components UnitsBeef cow in confinement 2/
Growing calf confined 450–750 lb 3/
Weight lb/d/1000 lb AU 104 77
Volume ft3/d/1000 lb AU 1.7 1.2
Moisture % w.b. 88 88
TS lb/d/1000 lb AU 13 9.2
VS lb/d/1000 lb AU 11 7.7
BOD lb/d/1000 lb AU 2.5 1.7
N lb/d/1000 lb AU 0.35 0.45
P lb/d/1000 lb AU 0.08 0.08
K lb/d/1000 lb AU 0.25 0.291/ Beef cow values are representative of animals during nonlactatin
period and first 6 months of gestation2/ Equals table 4–8a value x (1000 lb/1200 lb wt.)3/ Equals table 4–8a value x (1000 lb/650 lb avg. wt.)
(a) Cow and growing calf in units per day-animal 1/ (b) Cow and growing calf in units per day per 1,000 lb animal unit 1/
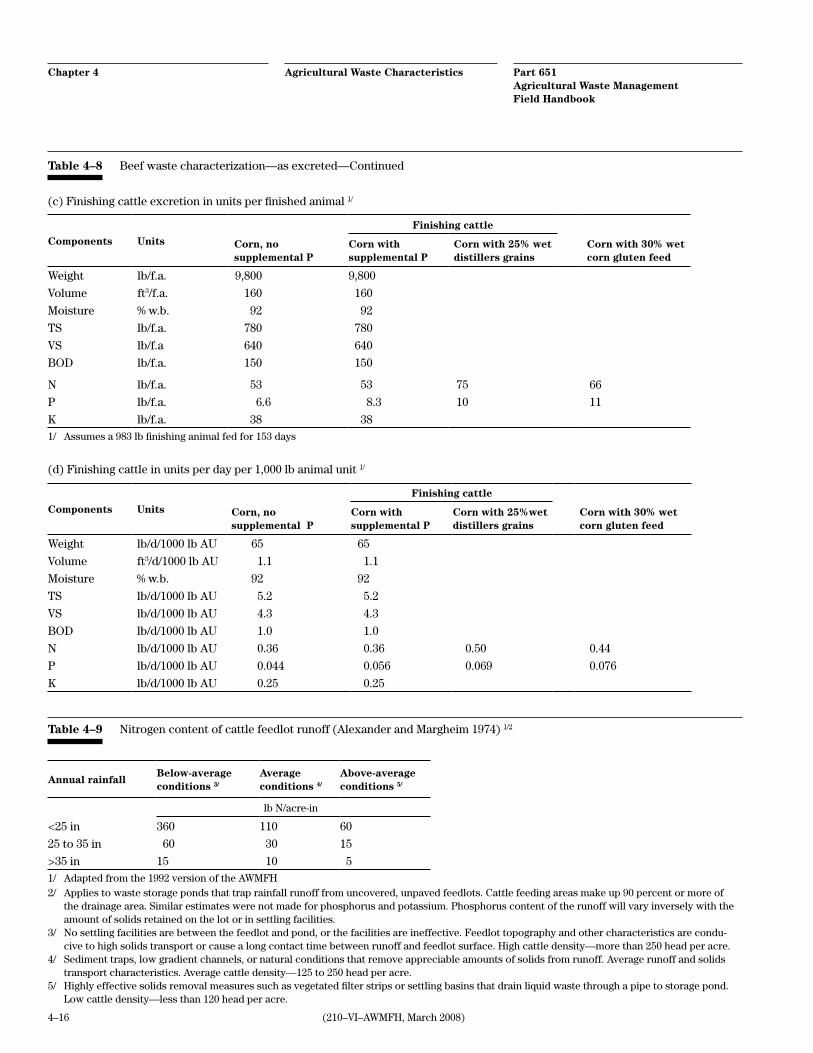
Chapter 4 Agricultural Waste Characteristics Part 651Agricultural Waste Management Field Handbook
4–16 (210–VI–AWMFH, March 2008)
(c) Finishing cattle excretion in units per finished animal 1/
Components Units
Finishing cattle
Corn, no supplemental P
Corn with supplemental P
Corn with 25% wet distillers grains
Corn with 30% wet corn gluten feed
Weight lb/f.a. 9,800 9,800
Volume ft3/f.a. 160 160
Moisture % w.b. 92 92
TS lb/f.a. 780 780
VS lb/f.a 640 640
BOD lb/f.a. 150 150
N lb/f.a. 53 53 75 66
P lb/f.a. 6.6 8.3 10 11
K lb/f.a. 38 381/ Assumes a 983 lb finishing animal fed for 153 days
(d) Finishing cattle in units per day per 1,000 lb animal unit 1/
Components Units
Finishing cattle
Corn, no supplemental P
Corn with supplemental P
Corn with 25%wet distillers grains
Corn with 30% wet corn gluten feed
Weight lb/d/1000 lb AU 65 65
Volume ft3/d/1000 lb AU 1.1 1.1
Moisture % w.b. 92 92
TS lb/d/1000 lb AU 5.2 5.2
VS lb/d/1000 lb AU 4.3 4.3
BOD lb/d/1000 lb AU 1.0 1.0
N lb/d/1000 lb AU 0.36 0.36 0.50 0.44
P lb/d/1000 lb AU 0.044 0.056 0.069 0.076
K lb/d/1000 lb AU 0.25 0.25
Table 4–8 Beef waste characterization—as excreted—Continued
Table 4–9 Nitrogen content of cattle feedlot runoff (Alexander and Margheim 1974) 1/2
Annual rainfallBelow-average conditions 3/
Average conditions 4/
Above-average conditions 5/
lb N/acre-in
<25 in 360 110 60
25 to 35 in 60 30 15
>35 in 15 10 51/ Adapted from the 1992 version of the AWMFH2/ Applies to waste storage ponds that trap rainfall runoff from uncovered, unpaved feedlots. Cattle feeding areas make up 90 percent or more of
the drainage area. Similar estimates were not made for phosphorus and potassium. Phosphorus content of the runoff will vary inversely with the amount of solids retained on the lot or in settling facilities.
3/ No settling facilities are between the feedlot and pond, or the facilities are ineffective. Feedlot topography and other characteristics are condu-cive to high solids transport or cause a long contact time between runoff and feedlot surface. High cattle density—more than 250 head per acre.
4/ Sediment traps, low gradient channels, or natural conditions that remove appreciable amounts of solids from runoff. Average runoff and solids transport characteristics. Average cattle density—125 to 250 head per acre.
5/ Highly effective solids removal measures such as vegetated filter strips or settling basins that drain liquid waste through a pipe to storage pond. Low cattle density—less than 120 head per acre.

Agricultural Waste CharacteristicsChapter 4 Part 651Agricultural Waste Management Field Handbook
4–17(210–VI–AWMFH, March 2008)
(e) Swine
Swine waste and waste management systems have been widely studied, and much has been reported on swine manure properties. Table 4–10 lists characteristics of as
Components Units
SowBoar 440 lb
Gestating 440 lb
Lactating 423 lb
Weight lb/d-a 11 25 8.4
Volume ft3/d-a 0.18 0.41 0.13
Moisture % w.b. 90 90 90
TS lb/d-a 1.1 2.5 0.84
VS lb/d-a 1.0 2.3 0.75
BOD lb/d-a 0.37 0.84 0.29
N lb/d-a 0.071 0.19 0.061
P lb/d-a 0.020 0.055 0.021
K lb/d-a 0.048 0.12 0.0391/ Table 1.b, ASAE D384.2, March 2005
Components UnitsNursery pig 27.5 lb
Grow to finish 154 lb
Weight lb/f.a 87 1200
Volume ft3/f.a. 1.4 20
Moisture % w.b. 90 90
TS lb/f.a. 10 120
VS lb/f.a. 8.7 99
BOD lb/f.a. 3.4 38
N lb/f.a. 0.91 10
P lb/f.a. 0.15 1.7
K lb/f.a. 0.35 4.4
Sow
Boar 3/Components UnitsGestating 1/ Lactating 2/
Weight lb/d-1000 AU 25 59 19
Volume lb/d-1000 AU 0.41 0.97 0.30
Moisture % w.b. 90 90 90
TS lb/d-1000 AU 2.5 5.9 1.9
VS lb/d-1000 AU 2.3 5.4 1.7
BOD lb/d-1000 AU 0.84 2.0 0.66
N lb/d-1000 AU 0.16 0.45 0.14
P lb/d-1000 AU 0.05 0.13 0.05
K lb/d-1000 AU 0.11 0.28 0.091/ Table 4–10(a) value × (1000 lb/440 lb avg. wt.)2/ Table 4–10(a) value × (1000 lb/423 lb avg. wt.)3/ Table 4–10(a) value × (1000 lb/440 lb avg. wt.)
Components Units Nursery 1/ Grow to finish 2/
Weight lb/d/1000 lb AU 88 65
Volume ft3/d/1000 lb AU 1.4 1.1
Moisture % w.b. 90 90
TS lb/d/1000 lb AU 10 6.5
VS lb/d/1000 lb AU 8.8 5.4
BOD lb/d/1000 lb AU 3.4 2.1
N lb/d/1000 lb AU 0.92 0.54
P lb/d/1000 lb AU 0.15 0.09
K lb/d/1000 lb AU 0.35 0.241/ Table 4–10(c) value × (1000 lb/27.5 lb avg. wt.)/36 days fed2/ Table 4–10(c) value × (1000 lb/154 lb avg. wt.)/120 days fed
(a) Mature swine in units per day-animal 1/ (c) Mature swine in units per day per 1,000 lb animal unit
Table 4–10 Swine waste characterization—as excreted
(b) Immature swine in units of per finished animal (d) Immature swine in units of per day per 1,000 lb animal unit
excreted swine manure from feeding and breeding stock. Breeding stock manure characteristics, also shown in table 4–10, are subject to less variation than those for growing animals.

Chapter 4 Agricultural Waste Characteristics Part 651Agricultural Waste Management Field Handbook
4–18 (210–VI–AWMFH, March 2008)
Example 4–6
Estimate the total volatile and fixed solids produced dai-ly in the manure of a grow-to-finish pig with an average weight of 154 pounds with a 120-day feeding period.
From table 4–10(b), in terms of mass per finished ani-mal, read TS = 120 lb per finished animal and VS = 99 lb per finished animal.
To calculate the daily total solid production per day, di-vide the per finished animal VS value by the tenure of the animal in the feeding period.
lb VS/d lb VS/d= =
99
1200 82.
To calculate FS daily production, the fixed solids per fin-ished animal must be first determined.
FS TS VS= −= −=
120 99
21 lb
The daily FS production is calculated by dividing the per finished animal FS production by the animal’s tenure in the feeding period.
lb FS/d lb FS/d= =21
1200 18.
Example 4–7
Estimate the average daily volatile solids production in the manure of 1,000 grow-to-finish pigs with an average weight of 154 pounds over the 120 days feeding period.
Using table 4–10(b), select
VS = 99.00 lb/f.a.
VS production for 1,000 animals = 99.00 lb/f.a. × 1000 f.a. = 99,000 lb VS daily production = 99,000 lb/120 d = 825 lb/d
Using table 4–10d, select
VS = 5.4 lb/d/1000 lb AU
VS lb/d lb/d/1000 AU 1000 animals lb/animal
lb
= × ×
=
5 36 154
832
.
//d

Agricultural Waste CharacteristicsChapter 4 Part 651Agricultural Waste Management Field Handbook
4–19(210–VI–AWMFH, March 2008)
(f) Poultry
Because of the high degree of industry integration, stan-dardized rations, and complete confinement, layer and broiler manure characteristics vary less than those of other species. Turkey production is approaching the same status. Table 4–11 presents waste characteristics for as excreted poultry manure.
Table 4–16 lists data for poultry flocks that use a litter (floor) system. Bedding materials, whether wood, crop, or other residue, are largely organic matter that has lit-tle nutrient component. Litter moisture in a well-man-aged house generally is in the range of 25 to 35 per-cent. Higher moisture levels in the litter result in greater weight and reduced mass concentration of nitrogen.
Most broiler houses are now cleaned out one or two times a year. Growers generally have five or six flocks
of broilers each year, and it is fairly common to take the “cake” out after each flock. The cake generally consists of the surface crust and wet spots that have clumped to-gether. About 1 or 2 inches of new bedding is placed on the floor before the next flock.
When a grower manages for a more frequent, complete cleanout, the data in table 4–16 will require adjustment. The birds still produce the same amount of N, P, and K per day. However, the density and moisture content of the litter is different with a more frequent cleanout. The nutrient concentrations may also be lower since there is less time for the nutrients to accumulate, and the ra-tio of bedding to manure may be higher. A further com-plication is that nitrogen is lost to the atmosphere during storage while fresh manure is being continually deposit-ed. This can create significant variations based on litter management.
(a) Layer waste characterization in units of per day animal 1/
Components Units Layers
Weight lb/d-a 0.19
Volume ft3/d-a 0.0031
Moisture % w.b. 75
TS lb/d-a 0.049
VS lb/d-a 0.036
BOD lb/d-a 0.011
N lb/d-a 0.0035
P lb/d-a 0.0011
K lb/d-a 0.0013
1/ Table 12(a) ASAE D384.2, March 2005
Table 4–11 Poultry waste characterization—as excreted
(b) Layer in units of per day per 1,000 lb animal unit
Components Units Layers 1/
Weight lb/d/1000 lb AU 57
Volume ft3/d/1000 lb AU 0.93
Moisture % w.b. 75
TS lb/d/1000 lb AU 15
VS lb/d/1000 lb AU 11
BOD lb/d/1000 lb AU 3.3
N lb/d/1000 lb AU 1.1
P lb/d/1000 lb AU 0.33
K lb/d/1000 lb AU 0.391/ Table 4–11(a) value × (1000 lb/3 lb avg. wt.) × (0.90)

Chapter 4 Agricultural Waste Characteristics Part 651Agricultural Waste Management Field Handbook
4–20 (210–VI–AWMFH, March 2008)
Components Units Broiler 1/ Turkey (toms) 2/
Turkey (hens) 3/ Duck 4/
Weight lb/d/1000 lb AU 88 34 48 102
Volume ft3/d/1000 lb AU 1.4 0.57 0.77 1.7
Moisture % w.b. 74 74 74 74
TS lb/d/1000 lb AU 22 8.8 12 27
VS lb/d/1000 lb AU 17 7.1 9.8 16
BOD lb/d/1000 lb AU 5.3 2.3 3.0 4.5
N lb/d/1000 lb AU 0.96 0.53 0.72 1
P lb/d/1000 lb AU 0.28 0.16 0.20 0.35
K lb/d/1000 lb AU 0.54 0.25 0.31 0.501/ Table 4–11(c) value × (1000 lb /2.6 lb avg. wt.) / 48 days on feed2/ Table 4–11(c) value × (1000 lb /17.03 lb avg. wt.) / 133 days on feed3/ Table 4–11(c) value × (1000 lb /7.57 lb avg. wt.) / 105 days on feed4/ Table 4–11(c) value × (1000 lb /3.51 lb avg. wt.) / 39 days on feed
(d) Meat production poultry in units per day per 1,000 lb animal unit
(c) Meat production poultry in units per finished animal 1/
Components Units BroilerTurkey (toms)
Turkey (hens)
Duck
Weight lb/f.a. 11 78 38 14
Volume ft3/f.a. 0.17 1.3 0.61 0.23
Moisture % w.b. 74 74 74 74
TS lb/f.a. 2.8 20 9.8 3.7
VS lb/f.a. 2.1 16 7.8 2.2
BOD lb/f.a. 0.66 5.2 2.4 0.61
N lb/f.a. 0.12 1.2 0.57 0.14
P lb/f.a. 0.035 0.36 0.16 0.048
K lb/f.a. 0.068 0.57 0.25 0.0681/ Table 12(a) ASAE D384.2, March 2005
Table 4–11 Poultry waste characterization—as excreted—Continued
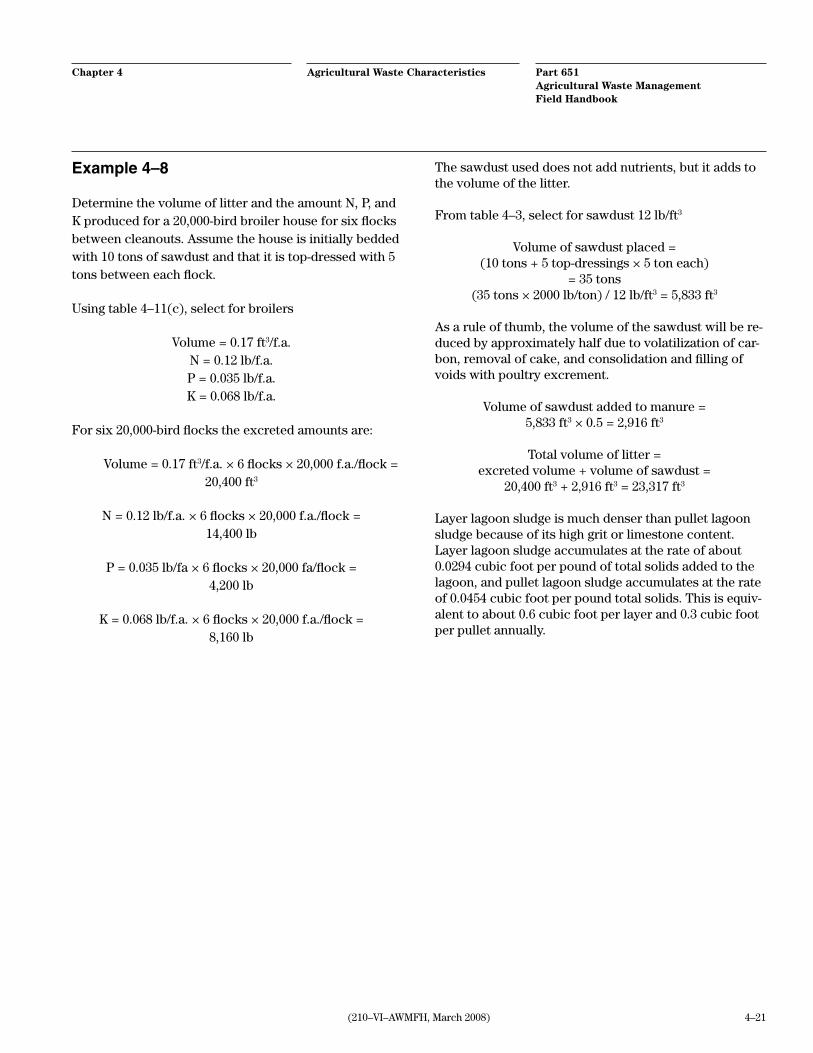
Agricultural Waste CharacteristicsChapter 4 Part 651Agricultural Waste Management Field Handbook
4–21(210–VI–AWMFH, March 2008)
Example 4–8
Determine the volume of litter and the amount N, P, and K produced for a 20,000-bird broiler house for six flocks between cleanouts. Assume the house is initially bedded with 10 tons of sawdust and that it is top-dressed with 5 tons between each flock.
Using table 4–11(c), select for broilers
Volume = 0.17 ft3/f.a. N = 0.12 lb/f.a. P = 0.035 lb/f.a. K = 0.068 lb/f.a.
For six 20,000-bird flocks the excreted amounts are:
Volume = 0.17 ft3/f.a. × 6 flocks × 20,000 f.a./flock = 20,400 ft3
N = 0.12 lb/f.a. × 6 flocks × 20,000 f.a./flock = 14,400 lb
P = 0.035 lb/fa × 6 flocks × 20,000 fa/flock = 4,200 lb
K = 0.068 lb/f.a. × 6 flocks × 20,000 f.a./flock = 8,160 lb
The sawdust used does not add nutrients, but it adds to the volume of the litter.
From table 4–3, select for sawdust 12 lb/ft3
Volume of sawdust placed = (10 tons + 5 top-dressings × 5 ton each) = 35 tons (35 tons × 2000 lb/ton) / 12 lb/ft3 = 5,833 ft3
As a rule of thumb, the volume of the sawdust will be re-duced by approximately half due to volatilization of car-bon, removal of cake, and consolidation and filling of voids with poultry excrement.
Volume of sawdust added to manure = 5,833 ft3 × 0.5 = 2,916 ft3
Total volume of litter = excreted volume + volume of sawdust = 20,400 ft3 + 2,916 ft3 = 23,317 ft3
Layer lagoon sludge is much denser than pullet lagoon sludge because of its high grit or limestone content. Layer lagoon sludge accumulates at the rate of about 0.0294 cubic foot per pound of total solids added to the lagoon, and pullet lagoon sludge accumulates at the rate of 0.0454 cubic foot per pound total solids. This is equiv-alent to about 0.6 cubic foot per layer and 0.3 cubic foot per pullet annually.
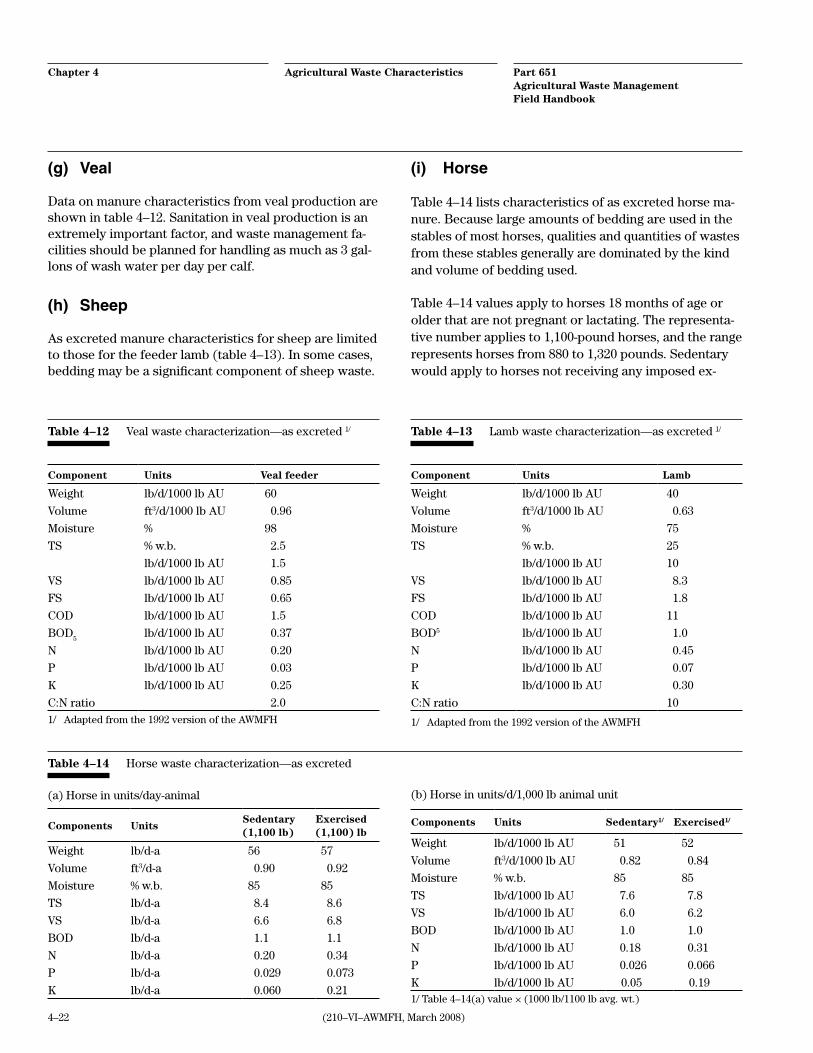
Chapter 4 Agricultural Waste Characteristics Part 651Agricultural Waste Management Field Handbook
4–22 (210–VI–AWMFH, March 2008)
Table 4–14 Horse waste characterization—as excreted
(a) Horse in units/day-animal
Components UnitsSedentary (1,100 lb)
Exercised (1,100) lb
Weight lb/d-a 56 57
Volume ft3/d-a 0.90 0.92
Moisture % w.b. 85 85
TS lb/d-a 8.4 8.6
VS lb/d-a 6.6 6.8
BOD lb/d-a 1.1 1.1
N lb/d-a 0.20 0.34
P lb/d-a 0.029 0.073
K lb/d-a 0.060 0.21
(b) Horse in units/d/1,000 lb animal unit
Components Units Sedentary1/ Exercised1/
Weight lb/d/1000 lb AU 51 52
Volume ft3/d/1000 lb AU 0.82 0.84
Moisture % w.b. 85 85
TS lb/d/1000 lb AU 7.6 7.8
VS lb/d/1000 lb AU 6.0 6.2
BOD lb/d/1000 lb AU 1.0 1.0
N lb/d/1000 lb AU 0.18 0.31
P lb/d/1000 lb AU 0.026 0.066
K lb/d/1000 lb AU 0.05 0.191/ Table 4–14(a) value × (1000 lb/1100 lb avg. wt.)
(g) Veal
Data on manure characteristics from veal production are shown in table 4–12. Sanitation in veal production is an extremely important factor, and waste management fa-cilities should be planned for handling as much as 3 gal-lons of wash water per day per calf.
(h) Sheep
As excreted manure characteristics for sheep are limited to those for the feeder lamb (table 4–13). In some cases, bedding may be a significant component of sheep waste.
Table 4–12 Veal waste characterization—as excreted 1/
Component Units Veal feeder
Weight lb/d/1000 lb AU 60
Volume ft3/d/1000 lb AU 0.96
Moisture % 98
TS % w.b. 2.5
lb/d/1000 lb AU 1.5
VS lb/d/1000 lb AU 0.85
FS lb/d/1000 lb AU 0.65
COD lb/d/1000 lb AU 1.5
BOD5lb/d/1000 lb AU 0.37
N lb/d/1000 lb AU 0.20
P lb/d/1000 lb AU 0.03
K lb/d/1000 lb AU 0.25
C:N ratio 2.01/ Adapted from the 1992 version of the AWMFH
Table 4–13 Lamb waste characterization—as excreted 1/
Component Units Lamb
Weight lb/d/1000 lb AU 40
Volume ft3/d/1000 lb AU 0.63
Moisture % 75
TS % w.b. 25
lb/d/1000 lb AU 10
VS lb/d/1000 lb AU 8.3
FS lb/d/1000 lb AU 1.8
COD lb/d/1000 lb AU 11
BOD5 lb/d/1000 lb AU 1.0
N lb/d/1000 lb AU 0.45
P lb/d/1000 lb AU 0.07
K lb/d/1000 lb AU 0.30
C:N ratio 10
1/ Adapted from the 1992 version of the AWMFH
(i) Horse
Table 4–14 lists characteristics of as excreted horse ma-nure. Because large amounts of bedding are used in the stables of most horses, qualities and quantities of wastes from these stables generally are dominated by the kind and volume of bedding used.
Table 4–14 values apply to horses 18 months of age or older that are not pregnant or lactating. The representa-tive number applies to 1,100-pound horses, and the range represents horses from 880 to 1,320 pounds. Sedentary would apply to horses not receiving any imposed ex-
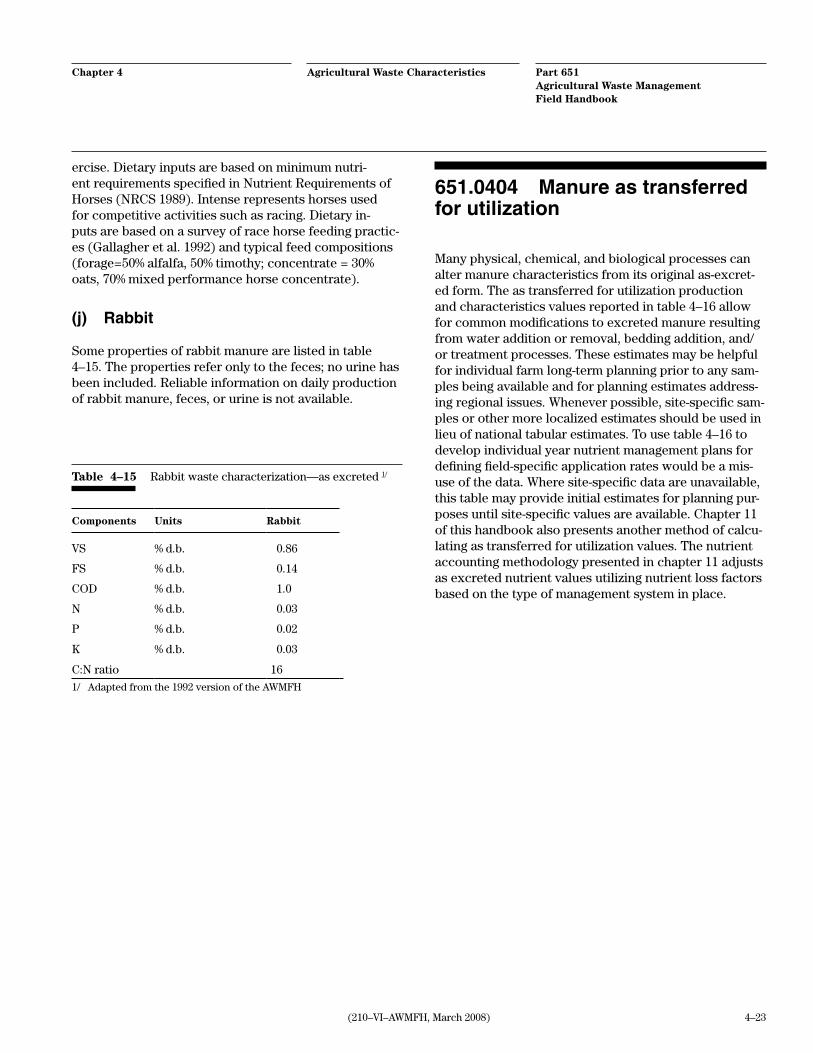
Agricultural Waste CharacteristicsChapter 4 Part 651Agricultural Waste Management Field Handbook
4–23(210–VI–AWMFH, March 2008)
Table 4–15 Rabbit waste characterization—as excreted 1/
Components Units Rabbit
VS % d.b. 0.86
FS % d.b. 0.14
COD % d.b. 1.0
N % d.b. 0.03
P % d.b. 0.02
K % d.b. 0.03
C:N ratio 16
1/ Adapted from the 1992 version of the AWMFH
ercise. Dietary inputs are based on minimum nutri-ent requirements specified in Nutrient Requirements of Horses (NRCS 1989). Intense represents horses used for competitive activities such as racing. Dietary in-puts are based on a survey of race horse feeding practic-es (Gallagher et al. 1992) and typical feed compositions (forage=50% alfalfa, 50% timothy; concentrate = 30% oats, 70% mixed performance horse concentrate).
(j) Rabbit
Some properties of rabbit manure are listed in table 4–15. The properties refer only to the feces; no urine has been included. Reliable information on daily production of rabbit manure, feces, or urine is not available.
651.0404 Manure as transferred for utilization
Many physical, chemical, and biological processes can alter manure characteristics from its original as-excret-ed form. The as transferred for utilization production and characteristics values reported in table 4–16 allow for common modifications to excreted manure resulting from water addition or removal, bedding addition, and/or treatment processes. These estimates may be helpful for individual farm long-term planning prior to any sam-ples being available and for planning estimates address-ing regional issues. Whenever possible, site-specific sam-ples or other more localized estimates should be used in lieu of national tabular estimates. To use table 4–16 to develop individual year nutrient management plans for defining field-specific application rates would be a mis-use of the data. Where site-specific data are unavailable, this table may provide initial estimates for planning pur-poses until site-specific values are available. Chapter 11 of this handbook also presents another method of calcu-lating as transferred for utilization values. The nutrient accounting methodology presented in chapter 11 adjusts as excreted nutrient values utilizing nutrient loss factors based on the type of management system in place.

Chapter 4 Agricultural Waste Characteristics Part 651Agricultural Waste Management Field Handbook
4–24 (210–VI–AWMFH, March 2008)
Table 4–16 Manure as transferred for utilization
(a) Values 1/
Mass (lb/hd/d)
Moisture (% wb)
TS (% wb)
VS (% TS)
TKN (% wb)
NH3-N (% wb)
P (% wb)
K (% wb)
Beef
Earthen lot 17 33 67 30 1.2 0.10 0.50 1.3
Poultry
Leghorn pullets No data 65 40 2.1 0.85 1.0 1.1
Leghorn hen 0.066 59 40 1.9 0.88 1.2 1.3
Broiler litter 0.044 31 70 70 3.7 0.75 0.60 1.4
Turkey litter 0.24 30 2.2 0.33 1.2
Dairy
Scraped earthen lots 77 54 46 0.70 0.25 0.67
Scraped concrete lots 88 72 25 0.53 0.13 0.40
Lagoon effluent 234 98 2 52 0.073 0.08 0.016 0.11
Slurry (liquid) 148 92 8 66 0.30 0.14 0.13 0.40
Equine
Solid manure Residential Commercial
71 101
43
65
26
0.76
0.24
0.99
Swine
Finisher-Slurry, wet-dry feeders
6.6–8.8 91 9.0 0.70 0.50 0.21 0.24
Slurry storage- dry feeders
9.9 94 6.1 0.47 0.34 0.18 0.24
Flush building 35 98 2.0 0.20 0.14 0.07 0.17
Agitated solids and water 98 2.2 0.10 0.05 0.06 0.06
Lagoon surface water 99.6 0.40 0.06 0.04 0.02 0.07
Lagoon sludge 90 10 0.26 0.07 0.25 0.07
1/ Adapted from ASAE D384.2, table 19
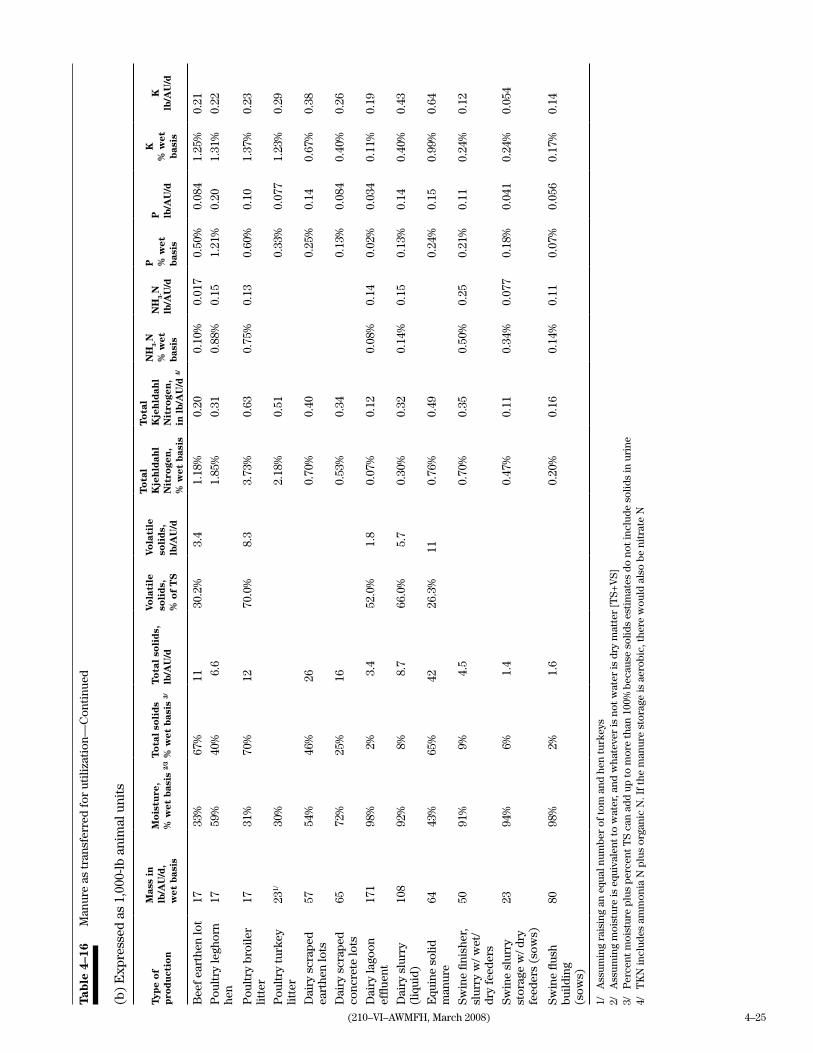
4–25(210–VI–AWMFH, March 2008)
Tab
le 4
–16
Man
ure
as t
rans
ferr
ed f
or u
tiliz
atio
n—C
onti
nued
(b)
Exp
ress
ed a
s 1,
000-
lb a
nim
al u
nits
Typ
e o
f
pro
du
ctio
n
Mas
s in
lb
/AU
/d,
wet
bas
is
Mo
istu
re,
% w
et b
asis
2/3
To
tal
soli
ds
%
wet
bas
is 3/
To
tal
soli
ds,
lb
/AU
/d
Vola
tile
so
lid
s,
% o
f T
S
Vola
tile
so
lid
s,
lb/A
U/d
To
tal
Kje
hld
ahl
Nit
roge
n,
% w
et b
asis
To
tal
Kje
hld
ahl
Nit
roge
n,
in l
b/A
U/d
4/
NH
3-N
%
wet
b
asis
NH
3-N
lb
/AU
/d
P
% w
et
bas
is
P
lb/A
U/d
K
% w
et
bas
is
K
lb/A
U/d
Bee
f ea
rthe
n lo
t17
33%
67%
1130
.2%
3.4
1.18
%0.
200.
10%
0.01
70.
50%
0.08
41.
25%
0.21
Pou
ltry
legh
orn
hen
1759
%40
%6.
61.
85%
0.31
0.88
%0.
151.
21%
0.20
1.31
%0.
22
Pou
ltry
bro
iler
litte
r17
31%
70%
1270
.0%
8.3
3.73
%0.
630.
75%
0.13
0.60
%0.
101.
37%
0.23
Pou
ltry
tur
key
litte
r23
1/30
%2.
18%
0.51
0.33
%0.
077
1.23
%0.
29
Dai
ry s
crap
ed
eart
hen
lots
5754
%46
%26
0.70
%0.
400.
25%
0.14
0.67
%0.
38
Dai
ry s
crap
ed
conc
rete
lots
6572
%25
%16
0.53
%0.
340.
13%
0.08
40.
40%
0.26
Dai
ry la
goon
ef
fluen
t17
198
%2%
3.4
52.0
%1.
80.
07%
0.12
0.08
%0.
140.
02%
0.03
40.
11%
0.19
Dai
ry s
lurr
y (l
iqui
d)10
892
%8%
8.7
66.0
%5.
70.
30%
0.32
0.14
%0.
150.
13%
0.14
0.40
%0.
43
Equ
ine
solid
m
anur
e64
43%
65%
4226
.3%
110.
76%
0.49
0.24
%0.
150.
99%
0.64
Swin
e fin
ishe
r,
slur
ry w
/ wet
/ dr
y fe
eder
s
5091
%9%
4.5
0.70
%0.
350.
50%
0.25
0.21
%0.
110.
24%
0.12
Swin
e sl
urry
st
orag
e w
/ dry
fe
eder
s (s
ows)
2394
%6%
1.4
0.47
%0.
110.
34%
0.07
70.
18%
0.04
10.
24%
0.05
4
Swin
e flu
sh
build
ing
(sow
s)
8098
%2%
1.6
0.20
%0.
160.
14%
0.11
0.07
%0.
056
0.17
%0.
14
1/
Ass
umin
g ra
isin
g an
equ
al n
umbe
r of
tom
and
hen
tur
keys
2/
Ass
umin
g m
oist
ure
is e
quiv
alen
t to
wat
er, a
nd w
hate
ver
is n
ot w
ater
is d
ry m
atte
r [T
S+V
S]3/
P
erce
nt m
oist
ure
plus
per
cent
TS
can
add
up t
o m
ore
than
100
% b
ecau
se s
olid
s es
tim
ates
do
not
incl
ude
solid
s in
uri
ne4/
T
KN
incl
udes
am
mon
ia N
plu
s or
gani
c N
. If
the
man
ure
stor
age
is a
erob
ic, t
here
wou
ld a
lso
be n
itra
te N
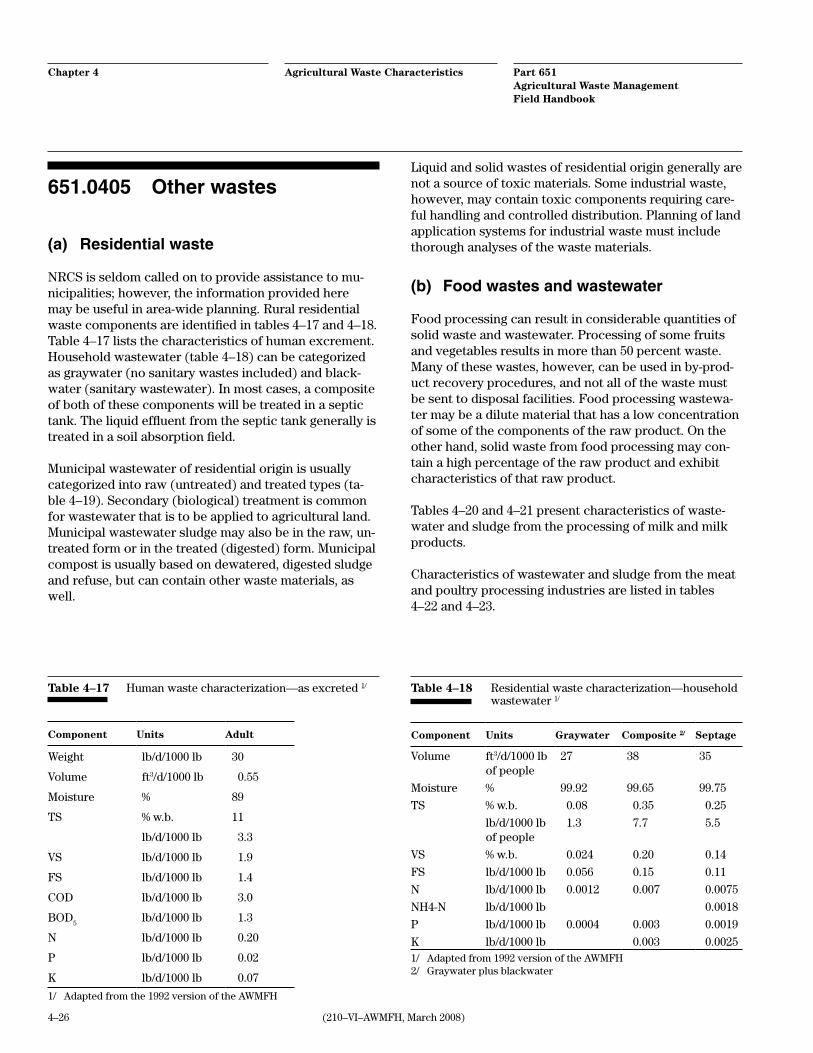
Chapter 4 Agricultural Waste Characteristics Part 651Agricultural Waste Management Field Handbook
4–26 (210–VI–AWMFH, March 2008)
651.0405 Other wastes
(a) Residential waste
NRCS is seldom called on to provide assistance to mu-nicipalities; however, the information provided here may be useful in area-wide planning. Rural residential waste components are identified in tables 4–17 and 4–18. Table 4–17 lists the characteristics of human excrement. Household wastewater (table 4–18) can be categorized as graywater (no sanitary wastes included) and black-water (sanitary wastewater). In most cases, a composite of both of these components will be treated in a septic tank. The liquid effluent from the septic tank generally is treated in a soil absorption field.
Municipal wastewater of residential origin is usually categorized into raw (untreated) and treated types (ta-ble 4–19). Secondary (biological) treatment is common for wastewater that is to be applied to agricultural land. Municipal wastewater sludge may also be in the raw, un-treated form or in the treated (digested) form. Municipal compost is usually based on dewatered, digested sludge and refuse, but can contain other waste materials, as well.
Liquid and solid wastes of residential origin generally are not a source of toxic materials. Some industrial waste, however, may contain toxic components requiring care-ful handling and controlled distribution. Planning of land application systems for industrial waste must include thorough analyses of the waste materials.
(b) Food wastes and wastewater
Food processing can result in considerable quantities of solid waste and wastewater. Processing of some fruits and vegetables results in more than 50 percent waste. Many of these wastes, however, can be used in by-prod-uct recovery procedures, and not all of the waste must be sent to disposal facilities. Food processing wastewa-ter may be a dilute material that has a low concentration of some of the components of the raw product. On the other hand, solid waste from food processing may con-tain a high percentage of the raw product and exhibit characteristics of that raw product.
Tables 4–20 and 4–21 present characteristics of waste-water and sludge from the processing of milk and milk products.
Characteristics of wastewater and sludge from the meat and poultry processing industries are listed in tables 4–22 and 4–23.
Table 4–17 Human waste characterization—as excreted 1/
Component Units Adult
Weight lb/d/1000 lb 30
Volume ft3/d/1000 lb 0.55
Moisture % 89
TS % w.b. 11
lb/d/1000 lb 3.3
VS lb/d/1000 lb 1.9
FS lb/d/1000 lb 1.4
COD lb/d/1000 lb 3.0
BOD5
lb/d/1000 lb 1.3
N lb/d/1000 lb 0.20
P lb/d/1000 lb 0.02
K lb/d/1000 lb 0.07
1/ Adapted from the 1992 version of the AWMFH
Table 4–18 Residential waste characterization—household wastewater 1/
Component Units Graywater Composite 2/ Septage
Volume ft3/d/1000 lb of people
27 38 35
Moisture % 99.92 99.65 99.75
TS % w.b. 0.08 0.35 0.25
lb/d/1000 lb of people
1.3 7.7 5.5
VS % w.b. 0.024 0.20 0.14
FS lb/d/1000 lb 0.056 0.15 0.11
N lb/d/1000 lb 0.0012 0.007 0.0075
NH4-N lb/d/1000 lb 0.0018
P lb/d/1000 lb 0.0004 0.003 0.0019
K lb/d/1000 lb 0.003 0.00251/ Adapted from 1992 version of the AWMFH2/ Graywater plus blackwater

Agricultural Waste CharacteristicsChapter 4 Part 651Agricultural Waste Management Field Handbook
4–27(210–VI–AWMFH, March 2008)
Table 4–19 Municipal waste characterization—residential1/
Wastewater Sludge
Component Units Raw Secondary Raw Digested Compost2/
Volume ft3/d/1000 lb of people
90 85
Moisture % 99.95 99.95 40
TS % w.b. 0.053/ 0.054/ 4.0 4.0 60
VS " 0.035 3.0 2.1
FS " 0.015 1.0 0.90
COD " 0.045
BOD5
" 0.020 0.0025
N " 0.003 0.002 0.32 0.15 0.78
NH4-N " 0.001 0.08
P " 0.001 0.001 0.036 0.067 0.20
K " 0.001 0.0012 0.010 0.17
Wastewater
Product/operationWeight lb/lb milk processed
BOD5 lb/1000 lb milk received
Bulk milk handling 6.1 1.0
Milk processing 4.9 5.2
Butter 4.9 1.5
Cheese 2.1 1.8
Condensed milk 1.9 4.5
Milk powder 2.8 3.9
Milk, ice cream, and cottage cheese
2.5 6.4
Cottage cheese 6.0 34
Ice cream 2.8 5.8
Milk and cottage cheese 1.8 3.5
Mixed products 1.8 2.5
1/ Adapted from 1992 version of the AWMFH
Table 4–20 Dairy food processing waste characterization1/

Chapter 4 Agricultural Waste Characteristics Part 651Agricultural Waste Management Field Handbook
4–28 (210–VI–AWMFH, March 2008)
Table 4–21 Dairy food waste characterization—processing wastewater1/
Component Units Industry wide - - - - - -- - - -Whey - - - - - - - - - -
Cheese wastewater sludge
Sweet cheese Acid cheese
Moisture % 98 93 93 98
TS % w.b. 2.4 6.9 6.6 2.5
VS % w.b. 1.5 6.4 6.0
FS % w.b. 0.91 0.55 0.60
COD % w.b. 1.3
BOD5 % w.b. 2.0
N % w.b. 0.077 7.5 0.18
P % w.b. 0.050 0.12
K % w.b. 0.067 0.051/ Adapted from 1992 version of the AWMFH
Table 4–22 Meat processing waste characterization—wastewater 1/
Red meat
Component Units Harvesting 2/ Packing 3/ Processing 4/ Poultry 5/ Broiler 6/
Volume gal/1000 lb7/ 700 1,000 1,300 2,500
Moisture % 95
TS % w.b. 5.0
lb/1000 lb 4.7 8.7 2.7 6.0
VS lb/1000 lb 4.3
FS lb/1000 lb 0.65
BOD5 lb/1000 lb 5.8 12 5.7 8.5
N lb/1000 lb 0.30
P lb/1000 lb 0.084
K lb/1000 lb 0.0121/ Adapted from 1992 version of the AWMFH2/ Harvesting—Euthanizing and preparing the carcass for processing3/ Packing—Euthanizing, preparing the carcass for processing, and processing4/ Processing—Sectioning carcass into retail cuts, grinding, packaging5/ Quantities per 1,000 lb product6/ All values % w.b.7/ Per 1,000 lb live weight harvested
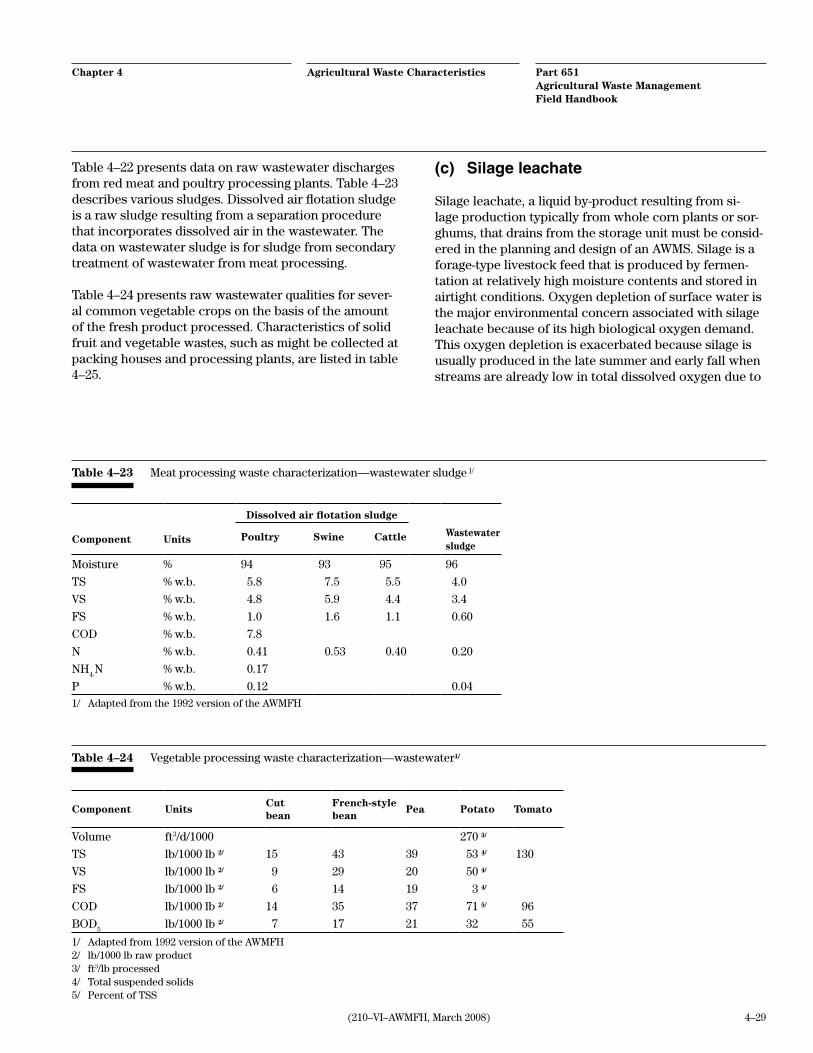
Agricultural Waste CharacteristicsChapter 4 Part 651Agricultural Waste Management Field Handbook
4–29(210–VI–AWMFH, March 2008)
Table 4–22 presents data on raw wastewater discharges from red meat and poultry processing plants. Table 4–23 describes various sludges. Dissolved air flotation sludge is a raw sludge resulting from a separation procedure that incorporates dissolved air in the wastewater. The data on wastewater sludge is for sludge from secondary treatment of wastewater from meat processing.
Table 4–24 presents raw wastewater qualities for sever-al common vegetable crops on the basis of the amount of the fresh product processed. Characteristics of solid fruit and vegetable wastes, such as might be collected at packing houses and processing plants, are listed in table 4–25.
Table 4–23 Meat processing waste characterization—wastewater sludge 1/
Dissolved air flotation sludge
Component Units Poultry Swine Cattle Wastewater sludge
Moisture % 94 93 95 96
TS % w.b. 5.8 7.5 5.5 4.0
VS % w.b. 4.8 5.9 4.4 3.4
FS % w.b. 1.0 1.6 1.1 0.60
COD % w.b. 7.8
N % w.b. 0.41 0.53 0.40 0.20
NH4-N % w.b. 0.17
P % w.b. 0.12 0.041/ Adapted from the 1992 version of the AWMFH
Table 4–24 Vegetable processing waste characterization—wastewater1/
Component UnitsCut bean
French-style bean
Pea Potato Tomato
Volume ft3/d/1000 270 3/
TS lb/1000 lb 2/ 15 43 39 53 4/ 130
VS lb/1000 lb 2/ 9 29 20 50 4/
FS lb/1000 lb 2/ 6 14 19 3 4/
COD lb/1000 lb 2/ 14 35 37 71 5/ 96
BOD5
lb/1000 lb 2/ 7 17 21 32 55
1/ Adapted from 1992 version of the AWMFH2/ lb/1000 lb raw product3/ ft3/lb processed4/ Total suspended solids5/ Percent of TSS
(c) Silage leachate
Silage leachate, a liquid by-product resulting from si-lage production typically from whole corn plants or sor-ghums, that drains from the storage unit must be consid-ered in the planning and design of an AWMS. Silage is a forage-type livestock feed that is produced by fermen-tation at relatively high moisture contents and stored in airtight conditions. Oxygen depletion of surface water is the major environmental concern associated with silage leachate because of its high biological oxygen demand. This oxygen depletion is exacerbated because silage is usually produced in the late summer and early fall when streams are already low in total dissolved oxygen due to

Chapter 4 Agricultural Waste Characteristics Part 651Agricultural Waste Management Field Handbook
4–30 (210–VI–AWMFH, March 2008)
Table 4–25 Fruit and vegetable waste characterization—solid waste 1/
Fruit/vegetableMoisture content
Total solids
Volatile solids
Fixed solids
N P K
Banana, fresh 84 16 14 2.1 0.53
Broccoli, leaf 87 14 0.30
Cabbage, leaf 90 9.6 8.6 1.0 0.14 0.034
Cabbage core 90 10 0.38
Carrot, top 84 16 14 2.4 0.42 0.03
Carrot root 87 13 11 1.3 0.25 0.04
Cassava, root 68 32 31 1.3 1.7 0.039
Corn, sweet, top 80 20 19 1.2 0.7
Kale, top 88 12 9.7 1.9 0.22 0.06
Lettuce, top 95 5.4 4.5 0.9 0.05 0.027
Onion top, mature 8.6 91 85 6.7 1.4 0.02
Orange, flesh 87 13 12 0.6 0.26
Orange pulp 84 16 15 1.0 0.24
Parsnip, root 76 24 0.47
Potato, top, mature 13 87 72 16 1.2
Potato tuber 1.6 0.25 1.9
Pumpkin, flesh 91 8.7 7.9 0.8 0.12 0.037
Rhubarb, leaf 89 11 0.20
Rutabaga, top 90 10 0.35
Rutabaga root 90 11 0.20
Spinach, stems 94 6.5 0.07
Tomato, fresh 94 5.8 5.2 0.6 0.15 0.03 0.30
Tomato, solid waste 89 11 10 0.9 0.22 0.044 0.089
Turnip, top 92 7.8 0.20
Turnip root 91 0.34
1/ Adapted from the 1992 version of the AWMFH

Agricultural Waste CharacteristicsChapter 4 Part 651Agricultural Waste Management Field Handbook
4–31(210–VI–AWMFH, March 2008)
seasonally high temperatures and low flow rates. Since 20 to 25 percent of the total nitrogen in silage leachate is in the form of nitrate, it is also has the potential of being a ground water contaminant.
Generally, the amount of leachate produced is direct-ly influenced by the moisture content of the forage en-siled and the degree of compaction to which the forage is subjected. Silage leachate is typically 95 percent wa-ter. It has a pH that can range from 5.5 to 3.6. Table 4–26 lists the range for typical nutrient concentrations in si-lage leachate.
The range of uncertainty in nutrient content reflects the differences that can occur from year to year and from site to site. Management decisions based on these nu-trient concentrations should also consider the associat-ed volumes of leachate that are usually relatively small. In most instances, a practical design and plan for envi-ronmental containment should be based on a reasonably high concentration assumption. Operation and manage-
Table 4–26 Typical range of nutrient concentrations in silage leachate1/
ConstituentConcentration lb/ft3
Total nitrogen 0.09–0.27
Phosphorus 0.02–0.04
Potassium 0.21–0.32
1/ Adapted from Stewart and McCullough
Table 4–27 Leachate production based on percent dry matter of silage1/
Dry matter content of silage %
Leachate produced of silage gal/ton
<15 100–50
15–20 50–30
20–25 30–5
>25 5–01/ Adapted from Stewart and McCullough
ment decisions should be based on the results of timely sampling and testing at a specific site.
The factors that influence leachate production from si-lage include the degree to which the silage crop has been chopped and the amount of pressure applied to the leachate in the silo, but the greatest single factor is the percent of dry matter in the silage. The peak rate of si-lage leachate production has been measured with silage at 18 percent moisture as 0.5 cubic feet per ton of silage per day. The peak time of leachate production will usu-ally be from 3 to 5 days following ensilage. Leachate pro-duction as a function of percent dry matter is given in ta-ble 4–27.
This variation in production can make a significant dif-ference in the planning and design of systems to man-age this effluent. The actual production rate used for a specific design should be a reasonable conservative esti-mate that is based on these numbers, local data, and the experience of the managers of the silos.
Chapter 4 Agricultural Waste Characteristics Part 651Agricultural Waste Management Field Handbook
4–32 (210–VI–AWMFH, March 2008)
651.0406 References
Alexander, E.L., and G.A. Margheim. 1974. Personal com-munications with C.E. Fogg.
American Society of Agricultural and Biological Engineers. 2005. Standard D384.2, Manure Production and Characteristics.
Arrington, R.M., and C.E. Pachek. 1980. Soil nutrient content of manures in an arid climate. Paper pre-sented at Amarillo, TX.
Barth, C.L. 1985. Livestock waste characterization a new approach. In Agricultural Waste Utilization and Management. Proceedings of the Fifth International Symposium on Agricultural Wastes, ASAE, St. Joseph, MI, p. 286.
Clarke, S.P., and R.P. Stone. 1995. How to handle seep-age from farm silos. Fact Sheet. Ontario Ministry of Agriculture, Food, and Rural Affairs.
Davis, J.G., T.L. Stanton, and T. Haren. 2002. Feedlot Manure Management. Colorado State University Extension.
Garcia A.D., and K.F. Kalscheur. 2004. Ensiling wet distillers grains with other feeds. College of Agriculture and Biological Sciences / South Dakota State University/USDA. Extension Extra 4029.
Koelsch, R.K., W. Powers, and A.L. Sutton. 2005. Integrating animal feeding strategies into CNMP processes: Role of Updated ASAE Standard D384.2. Paper Number: 054074 of 2005 ASAE Annual Meeting.
Shurson, G.C., M.H. Whitney, M.J. Spiehs, S.K. Baidoo, and A. Renteria. 2000. The value of distillers dried grain with solubles in pig diets. Department of Animal Science University of Minnesota, St. Paul, MN.
Stephenson, A.H., T.A. McCaskey, and B.G. Ruffin. 1989. Treatments to improve the feed nutrient value of deep stacked broiler litter. J. Dairy Sci. 67, Suppl. 1, p. 441.
Stewart, T.A., and I.I. McCullough. 1974. Silage effluent—quantities produced, composition and disposal. Greenmount Agricultural and Horticultural College. Antrim.
Westerman, P.W., L.M. Safley, Jr., J.C. Barker, and G.M. Chescheir III. 1985. Available nutrients in live-stock waste. In Agricultural Waste Utilization and Management. Proceedings of the Fifth International Symposium on Agricultural Wastes, ASAE, St. Joseph, MI, p. 295.
Zehnder, C.M., and A. DiCostanzo. 1997. Estimating feed-lot nutrient budgets and managing manure Output. Minnesota Cattle Feeder Report B–450.
6–9
Part 651Agricultural Waste Management Field Handbook
Role of Plants in Manure ManagementChapter 6
(210–VI–AWMFH, Amend. 61, August 2012)
651.0604 Balancing plant nutrient needs with manure application
Manure managers must balance the application of manure and residual elements in the soil with the need of the plants and the capacity of the microbes in the soil to transform the chemical elements into plant available forms. Lack of nutrients available in form for the plant to uptake can cause a deficiency in plants, and excess nutrients can cause toxicity. Both situa-tions decrease plant growth. An excess can also find its way through the food chain and be hazardous to the consumer. Elements that are not transformed or retained in the soil can leave the system and become a contaminant to surface and groundwater. In apply-ing manure to the land for plant nutrients, remember that the nutrient content of manure is highly variable, representative sampling is difficult, and laboratory procedures that indicate nutrient amounts are subject to errors. This is why it is difficult to apply manure nutrients with the precision of commercial fertilizer; however, with planned and measured applications of manure over several years, a landowner is able to achieve a reasonable balance between nutrients ap-plied to the field by the manure and nutrients removed from the field by the crop.
(a) Deficiencies of plant nutrients
The deficiency of nutrients to the plants from manure applications can occur by either the shortage of sup-plied elements contained in the manure or by the interference in the uptake of a nutrient caused by the excessive supply of another nutrient. In the first case, an analysis of the manure can be used to help deter-mine the amount of nutrients being supplied, and this amount is balanced with the crop’s requirements. Us-ing the NRCS National Conservation Practice Standard (CPS), Code 590, Nutrient Management with a nutrient budget worksheet will help assure that all essential nutrients are being supplied to the crop. For the sec-ond case, an example in the section 651.0604(b) shows the antagonism that excessive uptake of ammonium ion from manure has on the calcium ion. High levels of copper, iron, and manganese in the waste material can cause a plant deficiency of zinc caused by blockage of Zn uptake sites on the root by the other ions.
(b) Excesses of plant nutrients, total dissolved solids, and trace elements
The tolerance of plants to high levels of elements in plant tissue must also be considered when applying manure to cropland. Heavy applications of waste can cause elevated levels of nitrates in plant tissue that can lead to nitrate poisoning of livestock consuming that foliage. The ability to accumulate nitrates differs from plant to plant or even within cultivars of a spe-cies. Concentrations of nitrate nitrogen in plant dry matter less than 0.1 percent is considered safe to feed livestock. Large applications of manure on tall fescue, orchardgrass, and sudangrass can cause nitrate build-up. Cattle grazing these plants can, thus, be poisoned. When the concentration of nitrate nitrogen in the dry harvested material exceeds 0.4 percent, the forage is toxic.
Urea contained in manure is unstable. As manure dries, the urea breaks down into NH
4 and NH
3. The
release of gaseous NH3 from manure can result in
NH3 toxicity. Exposure of corn seeds to NH
3 during
the initial stages of germination can cause significant injury to the development of seedlings. High levels of ammonium and NH
3 in the soil interferes with the
uptake of the calcium ion, causing plants to exhibit calcium deficiency (Hensler, Olsen, and Attoe 1970). High levels of NH
4 and NH
3 also cause problems for
earthworms and other soil organisms. Part of the NH4
released is adsorbed on the cation exchange sites of the soil, releasing calcium, potassium, and magnesium ions into solution. High levels of these ions in the soil solution contribute to an increase in the soluble salt level and pH.
Up to 50 percent of manure nitrogen is in the NH4
form. To prevent toxicity from occurring on young plant seedlings, the manure can be incorporated into the soil to absorb the NH
4 on the cation exchange sites
or allowed to air dry on the soil surface. Surface drying greatly reduces the level of NH
4 by volatilization, but
because this results in a loss of the nitrogen, this typi-cally does not reflect efficiency in nutrient utilization. Applying manure at rates based on nitrogen require-ments of the crop helps to avoid excess NH
4 buildup in
the seed zone. A 0.25-inch rain or irrigation application should be sufficient to dissipate high concentrations of NH
3 in the seed zone. Side-dressing manure on corn
is an effective way to apply inorganic nitrogen that is quickly available for plant growth (Klausner and Guest

Part 651Agricultural Waste Management Field Handbook
Role of Plants in Manure ManagementChapter 6
6–10 (210–VI–AWMFH, Amend. 61, August 2012)
1981). Injecting manure into soil conserves more of the NH
4 nitrogen during periods of warm, dry weather
and prevents NH3 toxicity to the growth of plants (Sut-
ton, Nelson, Hoff, and Mayrose 1982).
The soluble salt content of manure and sludge is high and must be considered when these wastes are ap-plied to cropland. The percent salt in waste may be estimated by multiplying the combined percentages of potassium, calcium, sodium, and magnesium as determined by laboratory analysis by a factor of two (USEPA 1979).
% salts = (%K +%Ca +%Na +%Mg) × 2
Under conditions where only limited rainfall and irri-gation are applied, salts are not adequately leached out of the root zone and can build up high enough quanti-ties to cause plant injury. Plants that are salt sensitive or only moderately tolerant show progressive decline in growth and yields as levels of salinity increase (figs. 6–2, 6–3, and 6–4).
Some plant species are tolerant to salinity once estab-lished, but are sensitive during germination. If manure or sludge is applied to land in areas that receive mod-erate rainfall or irrigation water during the growing season, soluble salts in the waste will be dispersed through the profile or leached below the root zone. If manure or sludge is applied under a moisture deficit condition, salt concentrations can build up.
After prolonged application of manure, the soil elec-trical conductivity should be tested. A soil test of the electrical conductivity of saturated paste extract can be used to measure the total salt concentration in the soil. Conductivity values of 2 mmhos/cm or less are considered low in salts and suitable for all crops. Above values of 4 mmhos/cm, plant growth is affected except for all but the most tolerant crops (figs. 6–2, 6–3, and 6–4). At these high conductivity values, ir-rigation amounts need to be increased to leach salts. Added water percolating through the profile may then cause concern with leaching of nitrates, and manure application rates may have to be adjusted (Stewart 1974).
Figure 6–2 Effect of soil salinity on growth of field crops
2220181614121086420
EC in mmhos/cm at 25 °Ce
Salt Tolerance of Field Crops*
Barley
Sugarbeets
Cotton
Safflower
Wheat
Sorghum
Soybean
Sesbania
Rice
Corn
Broadbean
Flax
Beans
10%
25%
50% Yield reduction
The indicated salt tolerances apply to the period of rapid plant growth and maturation, from the late seeding stage onward. Crops in each category are ranked in order of decreasing salttolerance. Width of the bar next to each crop indicates the effect of increasing salinity on yield. Crosslinesare placed at 10-, 25-, and 50-percentyield reductions.
*
100%

6–11
Part 651Agricultural Waste Management Field Handbook
Role of Plants in Manure ManagementChapter 6
(210–VI–AWMFH, Amend. 61, August 2012)
Figure 6–3 Effect of soil salinity on growth of forage crops
2220181614121086420
EC in mmhos/cm at 25 °Ce
Salt Tolerance of Forage Crops*
Bermudagrass
Tall wheatgrass
Crested wheatgrass
Tall fescue
Barley hay
Perennial rye
Hardinggrass
Birdsfoot trefoil
Beardless wildrye
Alfalfa
Orchardgrass
Meadow foxtail
Clovers, alsike and red
10%25%
50% Yield reduction
The indicated salt tolerances apply to the period of rapid plant growth and maturation, from the late seeding stage onward. Crops in each category are ranked in order of decreasing salttolerance. Width of the bar next to each crop indicates the effect of increasing salinity on yield. Crosslinesare placed at 10-, 25-, and 50-percentyield reductions.
*
100%
Figure 6–4 Effect of soil salinity on growth of vegetable crops
Salt Tolerance of Vegetable Crops*
Spinach
Tomato
Broccoli
Cabbage
Potato
Sweet corn
Sweet potato
Lettuce
Bell pepper
Onion
Carrot
Green beans
EC in mmhos/cm at 25 °Ce
10%
25%
50% Yield reduction
The indicated salt tolerances apply to the period of rapid plant growth and maturation, from the late seeding stage onward. Crops in each category are ranked in order of decreasing salttolerance. Width of the bar next to each crop indicates the effect of increasing salinity on yield. Crosslinesare placed at 10-, 25-, and 50-percentyield reductions.
1614121086420
*
Beets
100%
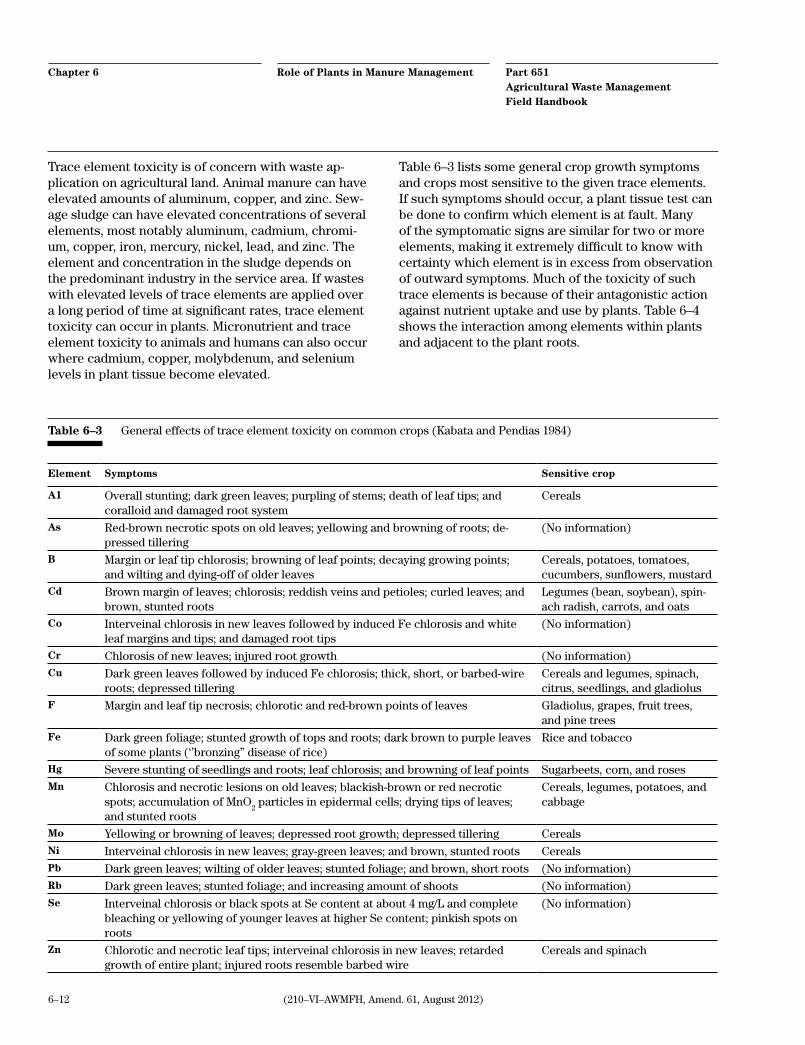
Part 651Agricultural Waste Management Field Handbook
Role of Plants in Manure ManagementChapter 6
6–12 (210–VI–AWMFH, Amend. 61, August 2012)
Trace element toxicity is of concern with waste ap-plication on agricultural land. Animal manure can have elevated amounts of aluminum, copper, and zinc. Sew-age sludge can have elevated concentrations of several elements, most notably aluminum, cadmium, chromi-um, copper, iron, mercury, nickel, lead, and zinc. The element and concentration in the sludge depends on the predominant industry in the service area. If wastes with elevated levels of trace elements are applied over a long period of time at significant rates, trace element toxicity can occur in plants. Micronutrient and trace element toxicity to animals and humans can also occur where cadmium, copper, molybdenum, and selenium levels in plant tissue become elevated.
Table 6–3 lists some general crop growth symptoms and crops most sensitive to the given trace elements. If such symptoms should occur, a plant tissue test can be done to confirm which element is at fault. Many of the symptomatic signs are similar for two or more elements, making it extremely difficult to know with certainty which element is in excess from observation of outward symptoms. Much of the toxicity of such trace elements is because of their antagonistic action against nutrient uptake and use by plants. Table 6–4 shows the interaction among elements within plants and adjacent to the plant roots.
Element Symptoms Sensitive crop
A1 Overall stunting; dark green leaves; purpling of stems; death of leaf tips; and coralloid and damaged root system
Cereals
As Red-brown necrotic spots on old leaves; yellowing and browning of roots; de-pressed tillering
(No information)
B Margin or leaf tip chlorosis; browning of leaf points; decaying growing points; and wilting and dying-off of older leaves
Cereals, potatoes, tomatoes, cucumbers, sunflowers, mustard
Cd Brown margin of leaves; chlorosis; reddish veins and petioles; curled leaves; and brown, stunted roots
Legumes (bean, soybean), spin-ach radish, carrots, and oats
Co Interveinal chlorosis in new leaves followed by induced Fe chlorosis and white leaf margins and tips; and damaged root tips
(No information)
Cr Chlorosis of new leaves; injured root growth (No information)Cu Dark green leaves followed by induced Fe chlorosis; thick, short, or barbed-wire
roots; depressed tilleringCereals and legumes, spinach, citrus, seedlings, and gladiolus
F Margin and leaf tip necrosis; chlorotic and red-brown points of leaves Gladiolus, grapes, fruit trees, and pine trees
Fe Dark green foliage; stunted growth of tops and roots; dark brown to purple leaves of some plants (‘’bronzing’’ disease of rice)
Rice and tobacco
Hg Severe stunting of seedlings and roots; leaf chlorosis; and browning of leaf points Sugarbeets, corn, and rosesMn Chlorosis and necrotic lesions on old leaves; blackish-brown or red necrotic
spots; accumulation of MnO2 particles in epidermal cells; drying tips of leaves;
and stunted roots
Cereals, legumes, potatoes, and cabbage
Mo Yellowing or browning of leaves; depressed root growth; depressed tillering CerealsNi Interveinal chlorosis in new leaves; gray-green leaves; and brown, stunted roots CerealsPb Dark green leaves; wilting of older leaves; stunted foliage; and brown, short roots (No information)Rb Dark green leaves; stunted foliage; and increasing amount of shoots (No information)Se Interveinal chlorosis or black spots at Se content at about 4 mg/L and complete
bleaching or yellowing of younger leaves at higher Se content; pinkish spots on roots
(No information)
Zn Chlorotic and necrotic leaf tips; interveinal chlorosis in new leaves; retarded growth of entire plant; injured roots resemble barbed wire
Cereals and spinach
Table 6–3 General effects of trace element toxicity on common crops (Kabata and Pendias 1984)

6–13
Part 651Agricultural Waste Management Field Handbook
Role of Plants in Manure ManagementChapter 6
(210–VI–AWMFH, Amend. 61, August 2012)
Table 6–4 Interaction among elements within plants and adjacent to plant roots
Major elements
Antagonistic elements
Synergistic elements
Trace elements
Antagonistic elements
Synergistic elements
Ca AI, B, Ba, Be, Cd, Co, Cr, Cs, Cu, F, Fe, Li, Mn, Ni, Pb, Sr, Zn
Cu, Mn, Zn Cu Cd, Al, Zn, Se, Mo, Fe, Ni, Mn
Ni, Mn, Cd
Mg Al, Be, Ba, Cr, Mn, F, Zn, Ni, Co, Cu, Fe
Al, Zn Zn Cd, Se, Mn, Fe, Ni, Cu Cu, Zn, Pb, Mn, Fe, N
P Al, As, B, Be, Cd, Cr, Cu, F, Fe, Hg, Mo, Mn, Ni, Pb, Rb, Se, Si, Sr, Zn
Al, B, Cu, F, Fe, Mn, Mo, Zn
Cd Zn, Cu, Al, Se, Mn, Fe, Ni
Cu, Zn, Pb, Mn, Fe, N
K Al, B, Hg, Cd, Cr, F, Mo, Mn, Rb
(No evidence) B Si, Mo, Fe Mo, Fe
S As, Ba, Fe, Mo, Pb, Se F, Fe Al Cu, Dc (No evidence)
N B, F, Cu B, Cu, Fe, Mo Pb — Cd
C1 Cr, I (No evidence) Mn Cu, Zn, Mo, Fe, Ar, Cr, Fe, Co, Cd, Al, Ni, Ar, Se
Mo
Fe Zn, Cr, Mo, Mn, Co, Cu, Cd, B, Si
Cd, B
Mo Cu, Mn, Fe, B Mn, B, Si
Co Mn, Fe (No evidence)
Ni Mn, Zn, Cu, Cd Cu, Zn, Cd
(210–VI–AWMFH, Amend. 31, August 2009) 10–1
651.1000 Introduction
Ideally, the by-products of agricultural operations would be immediately returned to the soil from where they were generated. Unfortunately, this is usually not possible or economically justifiable. By-products of animal operations such as manure are biologically and chemically active, often requiring intermediate steps before final utilization. In addition, land application of manure is labor intensive and may be difficult or pro-hibited while the ground is frozen, crops are at certain growth stages, or when the ground is saturated. Tem-porary storage may reduce the potential for water pol-lution by allowing final utilization to occur at optimal times and by preventing runoff from entering ground water or surface water. However, the nutrient content of manure degrades over time, requiring a balance between convenience and the economics of nutrient utilization. Design considerations must include loca-tion, installation, and operation and maintenance.
Possible alternatives for manure management are available for any given agricultural operation. A ma-nure management system may consist of any one or all of the following functions: production, collection, storage, treatment, transfer, and utilization. These functions are carried out by planning, applying, and operating individual components.
(a) Planning considerations
A successful manure management system must ad-dress production, operation, regulatory guidelines, and environmental considerations. The needs of the owner and/or decisionmaker are also vital considerations. The National Planning Procedures Handbook (NPPH) describes the nine-step process for planning.
(1) Landowner/decisionmaker desiresInput from the owner, operator, and/or decision-maker is critical for success of any planned operation. Managerial ability and long-range plans, in addition to current resources, must be considered. Also, financial considerations may determine the selected alternative.
(2) Regulatory requirementsLocal, State, and Federal regulations must be consid-ered at all stages. Environmental laws and specific
State and Federal program requirements may impact current or potential activities and alternatives.
(3) Existing structure assessment and evalua-tionInventorying existing equipment and structures is an important part of planning. Using available resources may reduce the cost of system installation, but con-strain the possible alternatives considered. An evalua-tion of the best alternative should consider both short- and long-term costs of operation and maintenance.
(4) Vulnerability and riskOperating a livestock facility creates an environmental risk for pollution. Climatic conditions and operating procedures can lead to an accidental discharge into surface waters. Foundation problems can result in seepage into subsurface waters. Location of a facility is an extremely important consideration during the planning process to minimize exposure to vulnerability and risk.
(b) Selected alternative
Alternatives may consist of components like a piece of equipment, such as a pump; a structure, such as a waste storage tank; or an operation, such as compost-ing. A system should consist of the best combination of the components that allows the flexibility needed to efficiently handle all forms of agricultural by-products generated for a given enterprise. In addition, the components must be compatible and integrated within the system. All components should be designed to be simple, manageable, and durable, and they should require low maintenance. In this chapter, components are discussed under section headings that describe the function that they are to accomplish.
(c) Design, installation, and operation
Any facility must be designed and installed according to locally acceptable engineering standards and regula-tory requirements. Proper operation and maintenance are required to achieve desired results. The design must address the methods of production, collection, storage, treatment, transfer, and utilization.
Chapter 10 Agricultural Waste Management System Component Design

Part 651Agricultural Waste Management Field Handbook
Agricultural Waste Management System Component Design
Chapter 10
10–2 (210–VI–AWMFH, Amend. 31, August 2009)
651.1001 Production
Components that affect the volume and consistency of agricultural waste produced are included in the production function. Roof gutters and downspouts and diversion to exclude clean water from areas of waste are examples of components that reduce the volume of waste material that needs management. Fences and walls that facilitate collection of waste confine the animals, thus increase the volume.
(a) Roof runoff management
Roof runoff should be diverted from feedlots and manure storage areas unless it is needed for some use, such as dilution water for waste storage ponds or treatment lagoons. This can be accomplished by roof gutters and downspouts with underground or open channel outlets (fig. 10–1). Roof runoff structures should be planned and designed according to NRCS Conservation Practice Standard 588, Roof Runoff Structure. Gutters and downspouts may not be needed if the roof drainage will not come into contact with areas accessible to livestock.
The area of a roof that can be served by a gutter and downspout system is controlled by either the flow capacity of the gutter (channel flow) or by the capacity of the downspout (orifice flow). The gutter’s capacity may be computed using Manning’s equation. Design of a gutter and downspout system is based on the runoff from a 10-year frequency, 5-minute rainfall except that a 25-year frequency, 5-minute rainfall is used for ex-clusion of roof runoff from waste treatment lagoons, waste storage ponds, or similar practices.
Rainfall intensity maps are in appendix 10B. Caution should be used in interpolating these maps. Rainfall probabilities are based on measured data at principal weather stations that are mostly in populated re-gions. The 10-year, 5-minute rainfall in the 11 Western States was based on NOAA Atlas 1, and that in the 37 Eastern States was based on the National Weather Service HYDRO 35. Both of these publications state their limitations in areas of orographic effect. In the Western States, the 10-year, 5-minute rainfall generally is larger in mountain ranges than in valleys. Rainfall in all mountain ranges could not be shown on these maps because of the map scale and readability consid-erations. Many of these differences were in the range of 0.05 inch and fall within the contour interval of 0.10 inch.
Figure 10–1 Roof gutter and downspout
Waterway
Downspout
Transport pipe
Gutter
Concrete channelto waste storage pond
Feedlot
runoff
Underground outlet
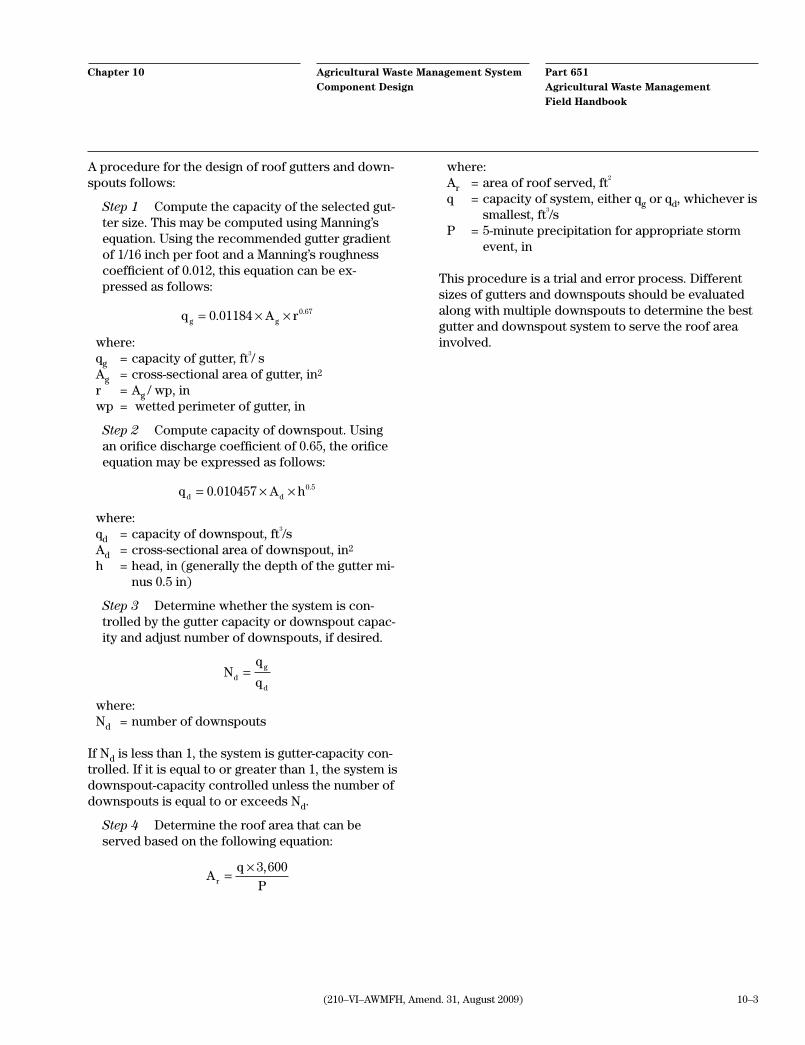
10–3(210–VI–AWMFH, Amend. 31, August 2009)
Part 651Agricultural Waste Management Field Handbook
Agricultural Waste Management System Component Design
Chapter 10
A procedure for the design of roof gutters and down-spouts follows:
Step 1 Compute the capacity of the selected gut-ter size. This may be computed using Manning’s equation. Using the recommended gutter gradient of 1/16 inch per foot and a Manning’s roughness coefficient of 0.012, this equation can be ex-pressed as follows:
q A rg g= × ×0 01184 0 67. .
where:qg = capacity of gutter, ft3/ sAg = cross-sectional area of gutter, in2
r = Ag / wp, inwp = wetted perimeter of gutter, in
Step 2 Compute capacity of downspout. Using an orifice discharge coefficient of 0.65, the orifice equation may be expressed as follows:
q A hd d= × ×0 010457 0 5. .
where:qd = capacity of downspout, ft3/sAd = cross-sectional area of downspout, in2
h = head, in (generally the depth of the gutter mi-nus 0.5 in)
Step 3 Determine whether the system is con-trolled by the gutter capacity or downspout capac-ity and adjust number of downspouts, if desired.
Nq
qdg
d
=
where:Nd = number of downspouts
If Nd is less than 1, the system is gutter-capacity con-trolled. If it is equal to or greater than 1, the system is downspout-capacity controlled unless the number of downspouts is equal to or exceeds Nd.
Step 4 Determine the roof area that can be served based on the following equation:
A
q
Pr =× 3 600,
where:Ar = area of roof served, ft2
q = capacity of system, either qg or qd, whichever is smallest, ft3/s
P = 5-minute precipitation for appropriate storm event, in
This procedure is a trial and error process. Different sizes of gutters and downspouts should be evaluated along with multiple downspouts to determine the best gutter and downspout system to serve the roof area involved.
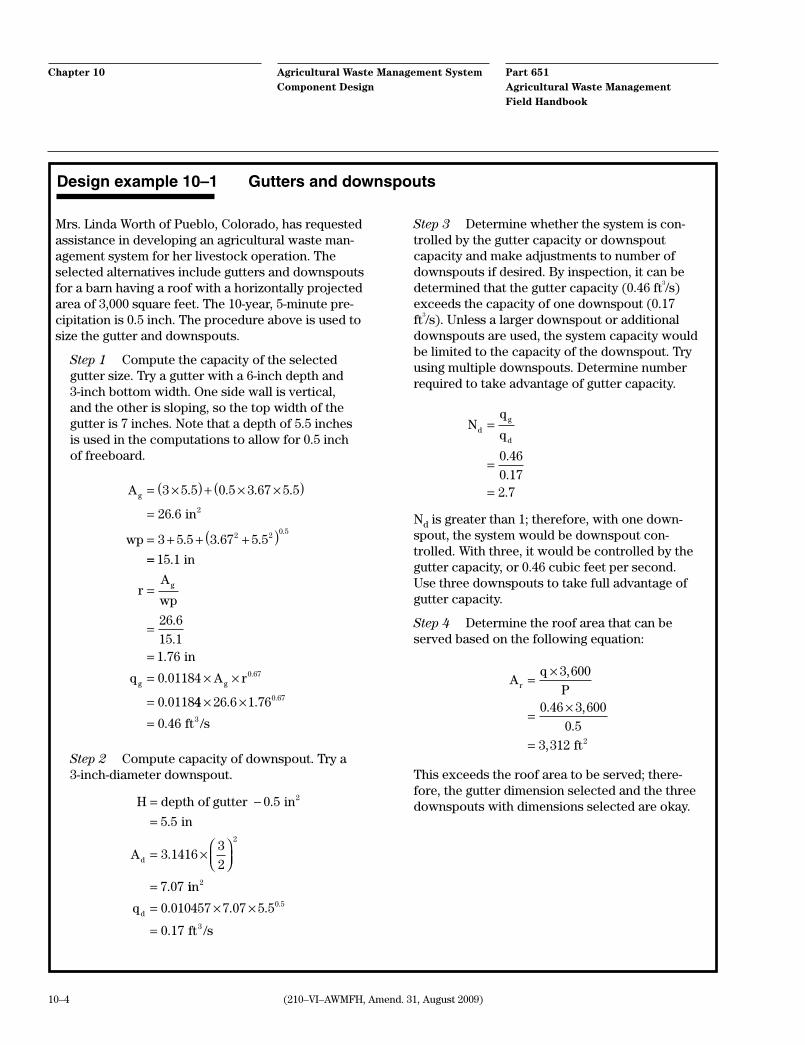
Part 651Agricultural Waste Management Field Handbook
Agricultural Waste Management System Component Design
Chapter 10
10–4 (210–VI–AWMFH, Amend. 31, August 2009)
Mrs. Linda Worth of Pueblo, Colorado, has requested assistance in developing an agricultural waste man-agement system for her livestock operation. The selected alternatives include gutters and downspouts for a barn having a roof with a horizontally projected area of 3,000 square feet. The 10-year, 5-minute pre-cipitation is 0.5 inch. The procedure above is used to size the gutter and downspouts.
Step 1 Compute the capacity of the selected gutter size. Try a gutter with a 6-inch depth and 3-inch bottom width. One side wall is vertical, and the other is sloping, so the top width of the gutter is 7 inches. Note that a depth of 5.5 inches is used in the computations to allow for 0.5 inch of freeboard.
A
wp
g = ×( ) + × ×( )=
= + + +( )
3 5 5 0 5 3 67 5 5
26 6
3 5 5 3 67 5 52 2 0 5
. . . .
.
. . ..
in2
==
=
=
== × ×
=
15 1
26 6
15 11 76
0 01184
0 0118
0 67
.
.
..
.
.
.
in
in
rA
wp
q A r
g
g g
44 26 6 1 76
0 46
0 67× ×=
. .
.
.
ft /s3
Step 2 Compute capacity of downspout. Try a 3-inch-diameter downspout.
H
Ad
= −=
= ×
=
depth of gutter in
in
20 5
5 5
3 14163
2
7 07
2
.
.
.
. iin
ft /s
2
3
qd = × ×
=
0 010457 7 07 5 5
0 17
0 5. . .
.
.
Step 3 Determine whether the system is con-trolled by the gutter capacity or downspout capacity and make adjustments to number of downspouts if desired. By inspection, it can be determined that the gutter capacity (0.46 ft3/s) exceeds the capacity of one downspout (0.17 ft3/s). Unless a larger downspout or additional downspouts are used, the system capacity would be limited to the capacity of the downspout. Try using multiple downspouts. Determine number required to take advantage of gutter capacity.
Nq
qdg
d
=
=
=
0 46
0 172 7
.
..
Nd is greater than 1; therefore, with one down-spout, the system would be downspout con-trolled. With three, it would be controlled by the gutter capacity, or 0.46 cubic feet per second. Use three downspouts to take full advantage of gutter capacity.
Step 4 Determine the roof area that can be served based on the following equation:
Aq
Pr =×
=×
=
3 600
0 46 3 600
0 5
3 312 2
,
. ,
.
, ft
This exceeds the roof area to be served; there-fore, the gutter dimension selected and the three downspouts with dimensions selected are okay.
Design example 10–1 Gutters and downspouts

10–5(210–VI–AWMFH, Amend. 31, August 2009)
Part 651Agricultural Waste Management Field Handbook
Agricultural Waste Management System Component Design
Chapter 10
(b) Runoff control
Essentially all livestock facilities in which the animals are housed in open lots or the manure is stored in the open must deal with runoff. Clean runoff from land surrounding livestock facilities should be diverted from barns, open animal concentration areas, and ma-nure storage or treatment facilities (fig. 10–2). Runoff from feedlots should be channeled into manure stor-age facilities.
Appendix 10C presents a series of maps indicating the amount of runoff that can be expected throughout the year for paved and unpaved feedlot conditions. Clean runoff should be estimated using information in chap-ter 2 of the NRCS NEH 650, Engineering Field Hand-book or by some other hydrologic method.
Diversions are to be designed according to NRCS Conservation Practice Standard 362, Diversion. Diver-sion channels must be maintained to remain effective. If vegetation is allowed to grow tall, the roughness increases and the channel velocity decreases, caus-ing possible channel overflow. Therefore, vegetation should be periodically mowed. Earth removed by ero-sion from earthen channels should be replaced. Unveg-etated, earthen channels should not be used in regions of high precipitation because of potential erosion.
(c) Air quality considerations
Emissions of several pollutants from agricultural waste management systems can also affect air quality, including particulate matter (dust), odors, and other gases. Proper planning, design, operation, and main-tenance of the agricultural waste management system can help to alleviate these air quality impacts. Siting of the system can significantly affect air quality. A ma-nure storage facility should be located as far as pos-sible from neighboring homes. Local and State regula-tory agencies usually require a minimum distance. In addition, the facility should utilize terrain, vegetation, and meteorology to direct emissions away from near-by housing. Livestock may be adversely affected by high concentrations of gases, especially during manure agitation and pumping. Proper sanitation, housekeep-ing, feed additives, and moisture control, as well as frequent removal and land application of manure from buildings and storage facilities, can reduce emissions of dust, odors, and other gases, in addition to minimiz-ing fly production.
Figure 10–2 Diversion of clean water around feedlot
Collectiongutter
Waste storage pond
SlopeDiversion
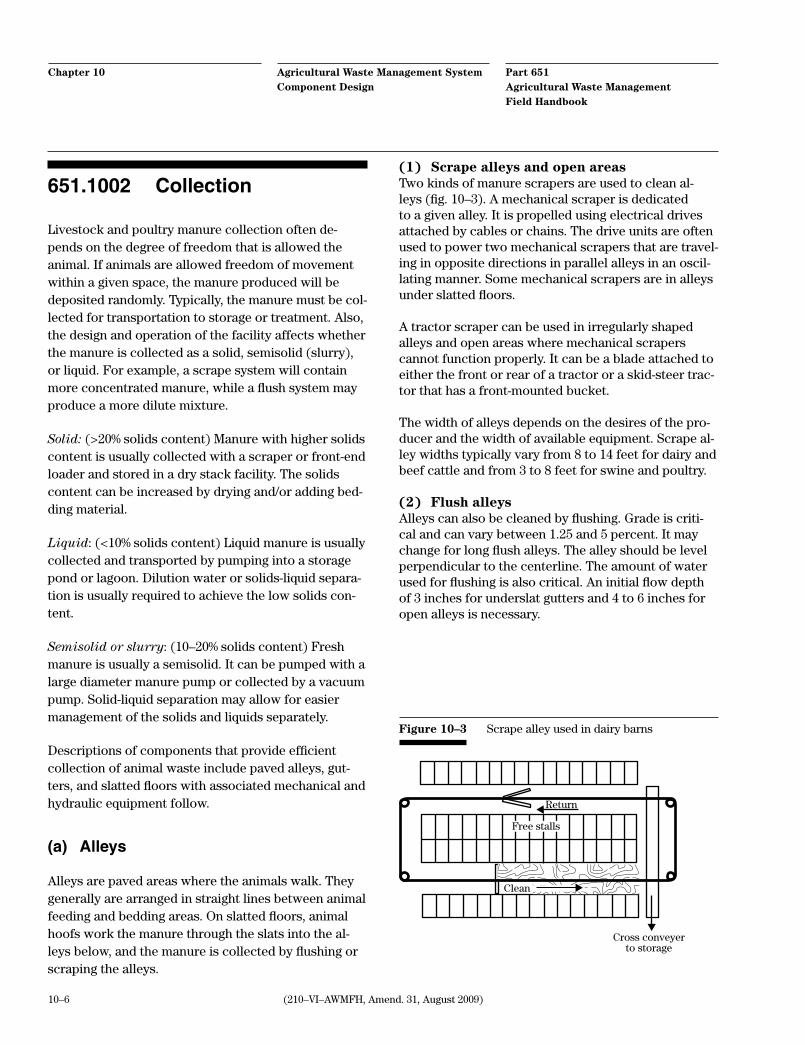
Part 651Agricultural Waste Management Field Handbook
Agricultural Waste Management System Component Design
Chapter 10
10–6 (210–VI–AWMFH, Amend. 31, August 2009)
651.1002 Collection
Livestock and poultry manure collection often de-pends on the degree of freedom that is allowed the animal. If animals are allowed freedom of movement within a given space, the manure produced will be deposited randomly. Typically, the manure must be col-lected for transportation to storage or treatment. Also, the design and operation of the facility affects whether the manure is collected as a solid, semisolid (slurry), or liquid. For example, a scrape system will contain more concentrated manure, while a flush system may produce a more dilute mixture.
Solid: (>20% solids content) Manure with higher solids content is usually collected with a scraper or front-end loader and stored in a dry stack facility. The solids content can be increased by drying and/or adding bed-ding material.
Liquid: (<10% solids content) Liquid manure is usually collected and transported by pumping into a storage pond or lagoon. Dilution water or solids-liquid separa-tion is usually required to achieve the low solids con-tent.
Semisolid or slurry: (10–20% solids content) Fresh manure is usually a semisolid. It can be pumped with a large diameter manure pump or collected by a vacuum pump. Solid-liquid separation may allow for easier management of the solids and liquids separately.
Descriptions of components that provide efficient collection of animal waste include paved alleys, gut-ters, and slatted floors with associated mechanical and hydraulic equipment follow.
(a) Alleys
Alleys are paved areas where the animals walk. They generally are arranged in straight lines between animal feeding and bedding areas. On slatted floors, animal hoofs work the manure through the slats into the al-leys below, and the manure is collected by flushing or scraping the alleys.
(1) Scrape alleys and open areasTwo kinds of manure scrapers are used to clean al-leys (fig. 10–3). A mechanical scraper is dedicated to a given alley. It is propelled using electrical drives attached by cables or chains. The drive units are often used to power two mechanical scrapers that are travel-ing in opposite directions in parallel alleys in an oscil-lating manner. Some mechanical scrapers are in alleys under slatted floors.
A tractor scraper can be used in irregularly shaped alleys and open areas where mechanical scrapers cannot function properly. It can be a blade attached to either the front or rear of a tractor or a skid-steer trac-tor that has a front-mounted bucket.
The width of alleys depends on the desires of the pro-ducer and the width of available equipment. Scrape al-ley widths typically vary from 8 to 14 feet for dairy and beef cattle and from 3 to 8 feet for swine and poultry.
(2) Flush alleysAlleys can also be cleaned by flushing. Grade is criti-cal and can vary between 1.25 and 5 percent. It may change for long flush alleys. The alley should be level perpendicular to the centerline. The amount of water used for flushing is also critical. An initial flow depth of 3 inches for underslat gutters and 4 to 6 inches for open alleys is necessary.
Return
Free stalls
Clean
Cross conveyerto storage
Figure 10–3 Scrape alley used in dairy barns
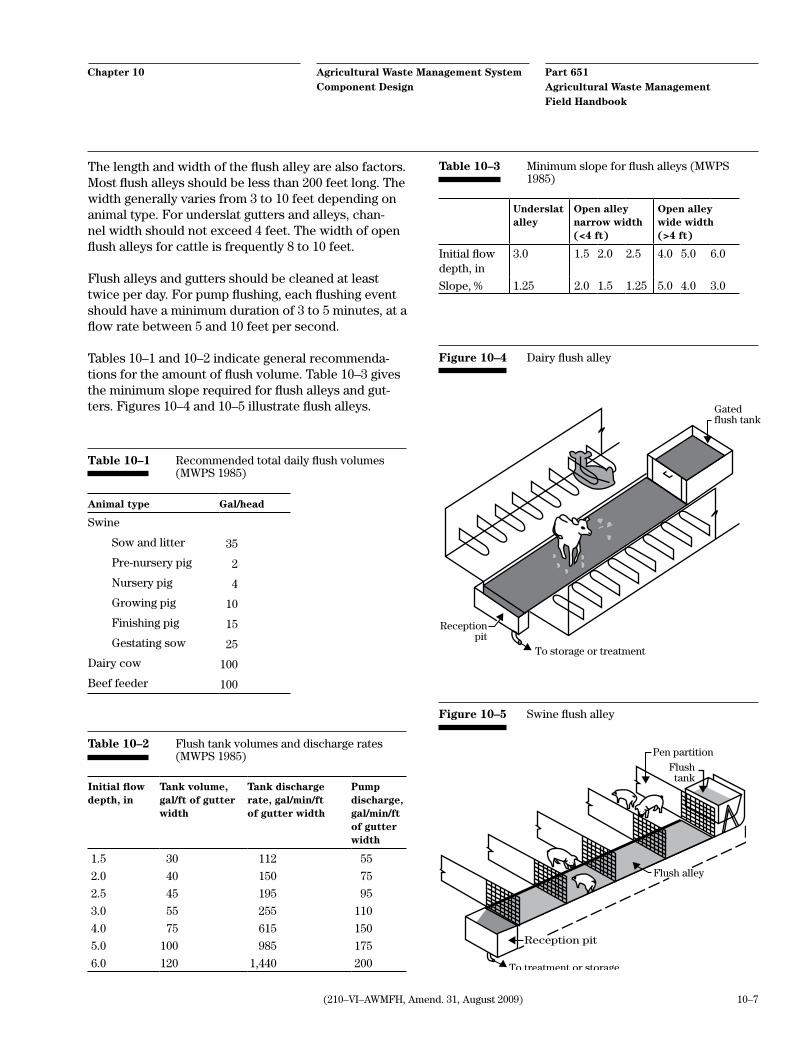
10–7(210–VI–AWMFH, Amend. 31, August 2009)
Part 651Agricultural Waste Management Field Handbook
Agricultural Waste Management System Component Design
Chapter 10
The length and width of the flush alley are also factors. Most flush alleys should be less than 200 feet long. The width generally varies from 3 to 10 feet depending on animal type. For underslat gutters and alleys, chan-nel width should not exceed 4 feet. The width of open flush alleys for cattle is frequently 8 to 10 feet.
Flush alleys and gutters should be cleaned at least twice per day. For pump flushing, each flushing event should have a minimum duration of 3 to 5 minutes, at a flow rate between 5 and 10 feet per second.
Tables 10–1 and 10–2 indicate general recommenda-tions for the amount of flush volume. Table 10–3 gives the minimum slope required for flush alleys and gut-ters. Figures 10–4 and 10–5 illustrate flush alleys.
Underslat alley
Open alley narrow width(<4 ft)
Open alley wide width (>4 ft)
Initial flow depth, in
3.0 1.5 2.0 2.5 4.0 5.0 6.0
Slope, % 1.25 2.0 1.5 1.25 5.0 4.0 3.0
Table 10–3 Minimum slope for flush alleys (MWPS 1985)
Initial flow depth, in
Tank volume, gal/ft of gutter width
Tank discharge rate, gal/min/ft of gutter width
Pump discharge, gal/min/ft of gutter width
1.5 30 112 55
2.0 40 150 75
2.5 45 195 95
3.0 55 255 110
4.0 75 615 150
5.0 100 985 175
6.0 120 1,440 200
Table 10–2 Flush tank volumes and discharge rates (MWPS 1985)
Animal type Gal/head
Swine
Sow and litter 35
Pre-nursery pig 2
Nursery pig 4
Growing pig 10
Finishing pig 15
Gestating sow 25
Dairy cow 100
Beef feeder 100
Table 10–1 Recommended total daily flush volumes (MWPS 1985)
Figure 10–4 Dairy flush alley
Gatedflush tank
To storage or treatment
Receptionpit
Pen partition
Flush alley
Reception pit
To treatment or storage
Flushtank
Figure 10–5 Swine flush alley

Part 651Agricultural Waste Management Field Handbook
Agricultural Waste Management System Component Design
Chapter 10
10–8 (210–VI–AWMFH, Amend. 31, August 2009)
Several mechanisms are used for flushing alleys. The most common rapidly empties large tanks of water or use high-volume pumps. Several kinds of flush tanks are used (fig. 10–6). One known as a tipping tank pivots on a shaft as the water level increases. At a cer-tain design volume, the tank tips, emptying the entire amount in a few seconds, which causes a wave that runs the length of the alley.
Some flush tanks have manually opened gates. These tanks are emptied by opening a valve, standpipe, pipe plug, or flush gate. Float switches can be used to con-trol flushing devices.
Another kind of flush tank uses the principle of a si-phon. In this tank, the water level increases to a given
point where the head pressure of the liquid overcomes the pressure of the air trapped in the siphon mecha-nism. At this point the tank rapidly empties, causing the desired flushing effect.
Most flush systems use pumps to recharge the flush tanks or to supply the necessary flow if the pump flush technique is used. Centrifugal pumps typically are used. The pumps should be designed for the work that they will be doing. Low volume pumps (10–150 gal/min) may be used for flush tanks, but high volume pumps (200 to 1,000 gal/min) are needed for alley flushing. Pumps should be the proper size to produce the desired flow rate. Flush systems may rely on re-cycled lagoon water for the flushing liquid.
Figure 10–6 Flush tanks
Manually activatedgate opening mechanism
Concrete orsteel tank
Gate is tiremounted onsolid rim
Hole
Tank
Bell Intrusion Trap
Tank
3 in downpipe
Tipping tank
Gal/ft of tank length
Tank dimensions inX181818
Y363330
L302420
C15 1/212 1/210 1/2
D14 1/2
1312
403024
L
Y
2 by 2 by 1/8-inangle
X
D C 1 3/4 in shaft
2 by 2 by 1/4-in anglebracing around top
Slatted floor8 inmin.
Flushed floor Sandfill
Tank with circular flush gate
Automatic siphon tank
16-gaugesteel metal

10–9(210–VI–AWMFH, Amend. 31, August 2009)
Part 651Agricultural Waste Management Field Handbook
Agricultural Waste Management System Component Design
Chapter 10
In some parts of the country where effluent is recycled from lagoons for flushwater, salt crystals (struvite) may form inside pipes and pumps and cause decreased flow. Use of plastic pipe, fittings, and pumps that have plastic impellers can reduce the frequency between cleaning or replacing pipes and pumps. If struvite formation is anticipated, recycle systems should be designed for periodic clean out of pumps and pipe. A mild acid, such as dilute hydrochloric acid (1 part 20 mole hydrochloric acid to 12 parts water), can be used. A separate pipe may be needed to accomplish acid recycling. The acid solution should be circulated throughout the pumping system until normal flow rates are restored. The acid solution should then be removed. Caution should be exercised when disposing of the spent acid solution to prevent ground or surface water pollution.
(b) Gutters
Gutters are narrow trenches used to collect manure and bedding. They are often employed in confined stall or stanchion dairy barns and in some swine facilities.
(1) Gravity drain guttersDeep, narrow gutters can be used in swine finishing buildings (fig. 10–7). These gutters are at the lowest el-evation of the pen. The animal traffic moves the waste to the gutter. The gutter fills and is periodically emp-tied. Gutters that have Y, U, V, or rectangular cross-sectional shapes are used in farrowing and nursery swine facilities. These gutters can be gravity drained periodically.
(2) Step-dam guttersStep-dam gutters, also known as gravity gutters or gravity flow channels provide a simple alternative for collecting dairy manure (fig. 10–8). A 6-inch-high dam holds back a lubricating layer of manure in a level, flat-bottomed channel. Manure drops through a floor grate or slats and flows down the gutter under its own weight. The gutter is about 30 inches wide and steps down to a deeper cross channel below the dam.
(3) Scrape guttersScrape gutters are frequently used in confined stall dairy barns. The gutters are 16 to 24 inches wide, 12 to 16 inches deep, and generally do not have any bottom
Figure 10–7 Flush and gravity flow gutters for swine manure
Slope gutter bottom
Bottom slopemax
.m
anur
e de
pth
Pen floor
Treated timber coverover pit, with hole forvalve handle
Optional emergency overflow(use only if outlet is gas trapped)
Step
Pen length
Step
Gutter
Gutter
Insulation(where needed)
To storage
Alley
Alley
Pen length
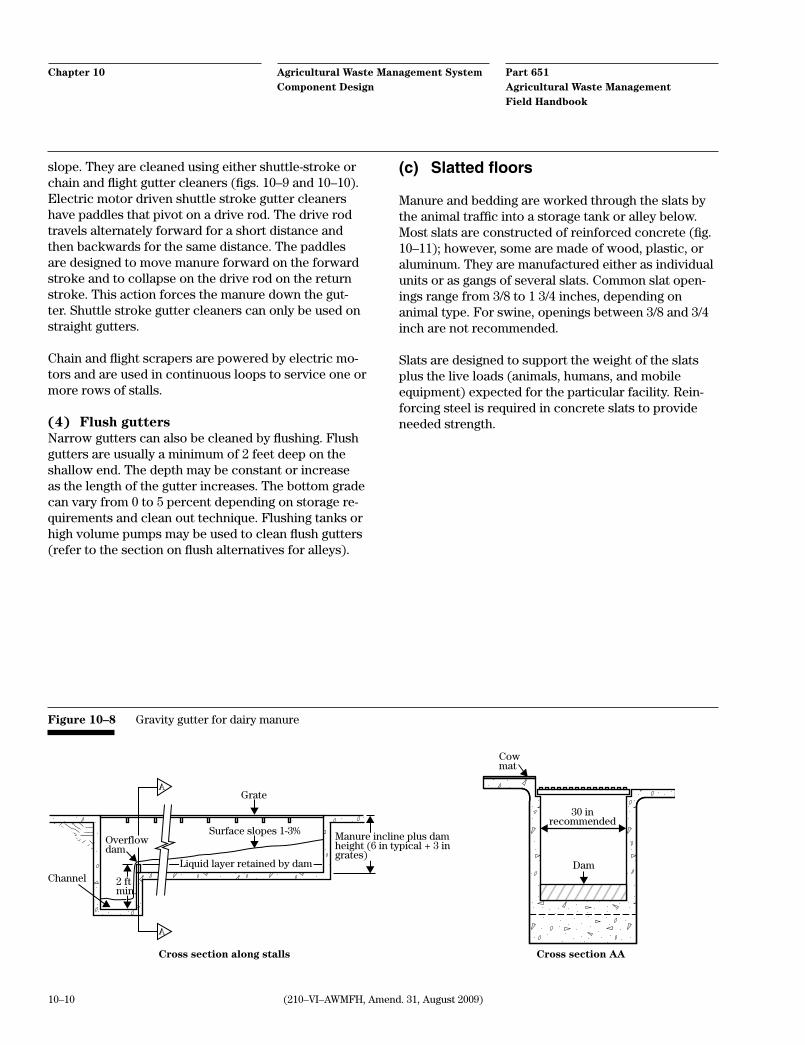
Part 651Agricultural Waste Management Field Handbook
Agricultural Waste Management System Component Design
Chapter 10
10–10 (210–VI–AWMFH, Amend. 31, August 2009)
slope. They are cleaned using either shuttle-stroke or chain and flight gutter cleaners (figs. 10–9 and 10–10). Electric motor driven shuttle stroke gutter cleaners have paddles that pivot on a drive rod. The drive rod travels alternately forward for a short distance and then backwards for the same distance. The paddles are designed to move manure forward on the forward stroke and to collapse on the drive rod on the return stroke. This action forces the manure down the gut-ter. Shuttle stroke gutter cleaners can only be used on straight gutters.
Chain and flight scrapers are powered by electric mo-tors and are used in continuous loops to service one or more rows of stalls.
(4) Flush guttersNarrow gutters can also be cleaned by flushing. Flush gutters are usually a minimum of 2 feet deep on the shallow end. The depth may be constant or increase as the length of the gutter increases. The bottom grade can vary from 0 to 5 percent depending on storage re-quirements and clean out technique. Flushing tanks or high volume pumps may be used to clean flush gutters (refer to the section on flush alternatives for alleys).
(c) Slatted floors
Manure and bedding are worked through the slats by the animal traffic into a storage tank or alley below. Most slats are constructed of reinforced concrete (fig. 10–11); however, some are made of wood, plastic, or aluminum. They are manufactured either as individual units or as gangs of several slats. Common slat open-ings range from 3/8 to 1 3/4 inches, depending on animal type. For swine, openings between 3/8 and 3/4 inch are not recommended.
Slats are designed to support the weight of the slats plus the live loads (animals, humans, and mobile equipment) expected for the particular facility. Rein-forcing steel is required in concrete slats to provide needed strength.
Figure 10–8 Gravity gutter for dairy manure
Grate
2 ftmin.
Overflow dam
Surface slopes 1-3% Manure incline plus damheight (6 in typical + 3 ingrates)
ChannelDam
Cow mat
Liquid layer retained by dam
Cross section AACross section along stalls
A
A
30 inrecommended

10–11(210–VI–AWMFH, Amend. 31, August 2009)
Part 651Agricultural Waste Management Field Handbook
Agricultural Waste Management System Component Design
Chapter 10
Figure 10–9 Shuttle-stroke gutter cleaner
ChainChain
Figure 10–10 Chain and flight gutter cleaner
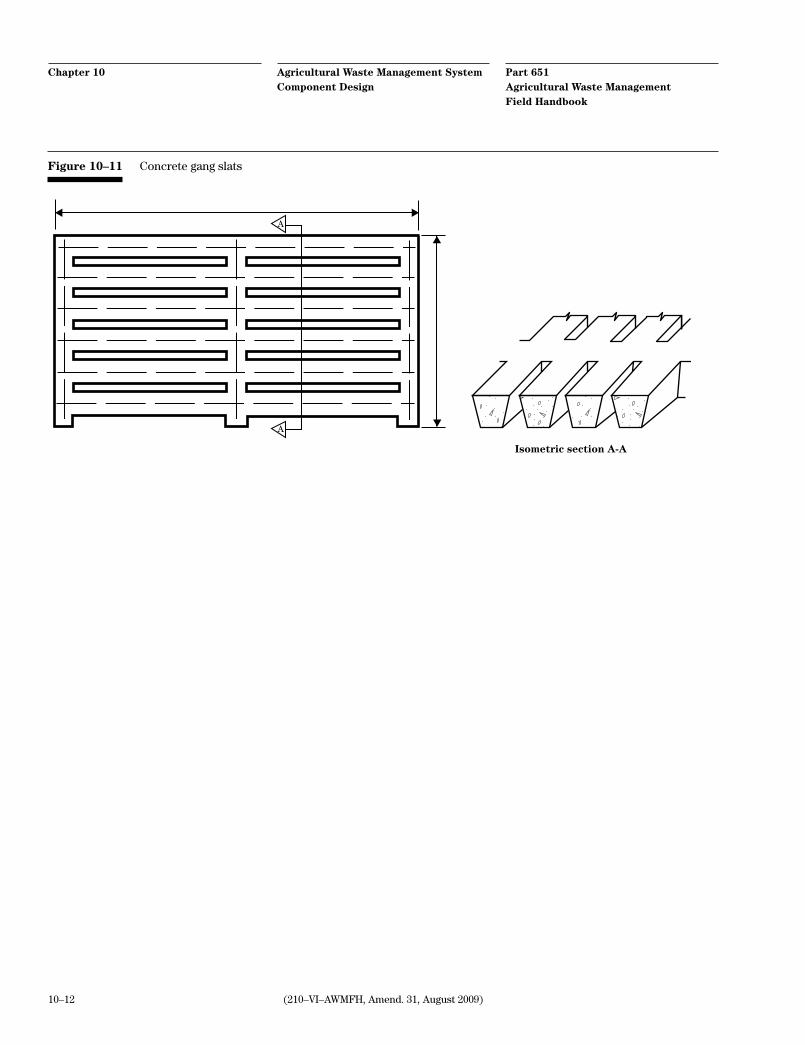
Part 651Agricultural Waste Management Field Handbook
Agricultural Waste Management System Component Design
Chapter 10
10–12 (210–VI–AWMFH, Amend. 31, August 2009)
Figure 10–11 Concrete gang slats
Isometric section A-A
A
A

10–13(210–VI–AWMFH, Amend. 31, August 2009)
Part 651Agricultural Waste Management Field Handbook
Agricultural Waste Management System Component Design
Chapter 10
651.1003 Transfer
Manure collected from within a barn or confinement area must be transferred to the storage or treatment facility. In the simplest system, the transfer component is an extension of the collection method. More typi-cally, transfer methods must be designed to overcome distance and elevation changes between the collection and storage facilities. In some cases, gravity can be used to move the manure. In many cases, however, mechanical equipment is needed to move the manure. Transfer also involves movement of the material from storage or treatment to the point of utilization. This may involve pumps, pipelines, and tank wagons. Trans-fer systems should be planned and designed in accor-dance with NRCS Conservation Practice Standard 634, Waste Transfer.
(a) Reception pits
Slurry and liquid manure collected by scraping, gravity flow, or flushing are often accumulated in a reception pit (fig. 10–12). Feedlot runoff can also be accumulated. These pits can be sized to hold all the manure produced for several days to improve pump efficiency or to add flexibility in management. Addi-tional capacity might be needed for extra liquids, such as milk parlor water or runoff from precipitation. For example, if the daily production of manure and parlor cleanup water for a dairy is estimated at 2,500 gallons and 7 days of storage is desired, then a reception pit that has a capacity of 17,500 gallons (2,500 gal/d × 7 d) is the minimum required. Additional volume should be allowed for freeboard emergency storage.
Reception pits are rectangular or circular and are of-ten constructed of cast-in-place reinforced concrete or reinforced concrete block. Reinforcing steel must be added so that the walls withstand internal and external loads.
Earth storage basinCheckvalve
Manualvalves
Centrifugalpump Agitation
nozzle Receptionpit
Figure 10–12 Reception pit for dairy freestall barn

Part 651Agricultural Waste Management Field Handbook
Agricultural Waste Management System Component Design
Chapter 10
10–14 (210–VI–AWMFH, Amend. 31, August 2009)
Manure can be removed with pumps or by gravity. Centrifugal pumps can be used for agitating and mix-ing before transferring the material. Both submersible pumps and vertical shaft pumps that have the motor located above the manure can be used. Diluted ma-nure can be pumped using submersible pumps, often operated with float switches. The entrance to recep-tion pits should be restricted by guard rails or covers.
Debris, such as pieces of metal and wood and rocks, must sometimes be removed from the bottom of a reception pit. Most debris must be removed manu-ally, but if possible, this should be done remotely from outside the pit. The pit should be well ventilated before entering. If manure is in the pit, a self-contained breathing apparatus must be used. Short baffles spaced around the pump intake can effectively guard against debris clogging the pump.
In cold climates, reception pits need to be protected from freezing. This can be accomplished by covering or enclosing it in a building. Adequate ventilation must be provided in all installations. In some installations, hoppers and either piston pumps or compressed air pumps are used instead of reception pits and centrifu-gal pumps. These systems are used with semisolid ma-nure that does not flow readily or cannot be handled using centrifugal pumps.
(b) Gravity flow pipes
Liquid and slurry manure can be moved by gravity if sufficient elevation differences are available or can be established. For slurry manure, a minimum of 2 feet of elevation head should exist between the top of the col-lection pit or hopper and the surface of the material in storage when storage is at maximum design depth.
Gravity flow slurry manure systems typically use 18- to 36-inch-diameter pipe. In some parts of the coun-try, 4- to 8-inch-diameter pipe is used for the gravity transport of low (<3%) total solid (TS) concentration waste. The planner/designer should exercise caution when specifying the 4- to 8-inch pipe. Smooth steel, plastic, concrete, and corrugated metal pipe are used. Metal pipes should be coated with asphalt or plastic to retard corrosion, depending upon the type of metal. All joints must be sealed so that the pipe is water tight.
Gravity flow pipes should be designed to minimize changes in grade or direction over the entire length. Pipe slopes that range from 4 to 15 percent will work satisfactorily, but 7 to 8 percent slope is preferable. Excessive slopes allow separation of liquids and solids and increase the chance of plugging. The type and quantity of bedding and the amount of milkhouse waste and wash water added have an effect on the flow characteristics and the slope needed in a particu-lar situation. Straw bedding should be discouraged, especially if it is not chopped. Smooth, rounded transi-tion from reception pit to pipe and the inclusion of an air vent in the pipeline aid the flow and prevent plug-ging.
Figure 10–13 illustrates the use of gravity flow for manure transfer. At least two valves should be located in an unloading pipe. Proper construction and opera-tion of gravity unloading waste storage structures are extremely important. Containment berms should be considered if the contamination risk is high downslope of the unloading facility.
(c) Push-off ramps
Manure that is scraped from open lots can be loaded into manure spreaders or storage and treatment fa-cilities using push-off ramps (fig. 10–14) or docks. A ramp is a paved structure leading to a manure storage facility. It can be level or inclined and usually includes a retaining wall. A dock is a level ramp that projects into the storage or treatment facility. Runoff should be directed away from ramps and docks unless it is needed for waste dilution. Ramp slopes should not ex-ceed 5 percent. Push-off ramps and docks should have restraints at each end to prevent the scraping tractors from accidentally going off the end.
(d) Pumps
Most liquid manure handling systems require one or more pumps to either transport or agitate manure. Pumps are in two broad classifications—displacement and centrifugal. The displacement group includes pis-ton, air pressure transfer, diaphragm, and progressive cavity pumps. The first two are used only for transfer-ring manure; however, diaphragm and progressive cavity pumps can be used for transferring, agitating, and irrigating manure.
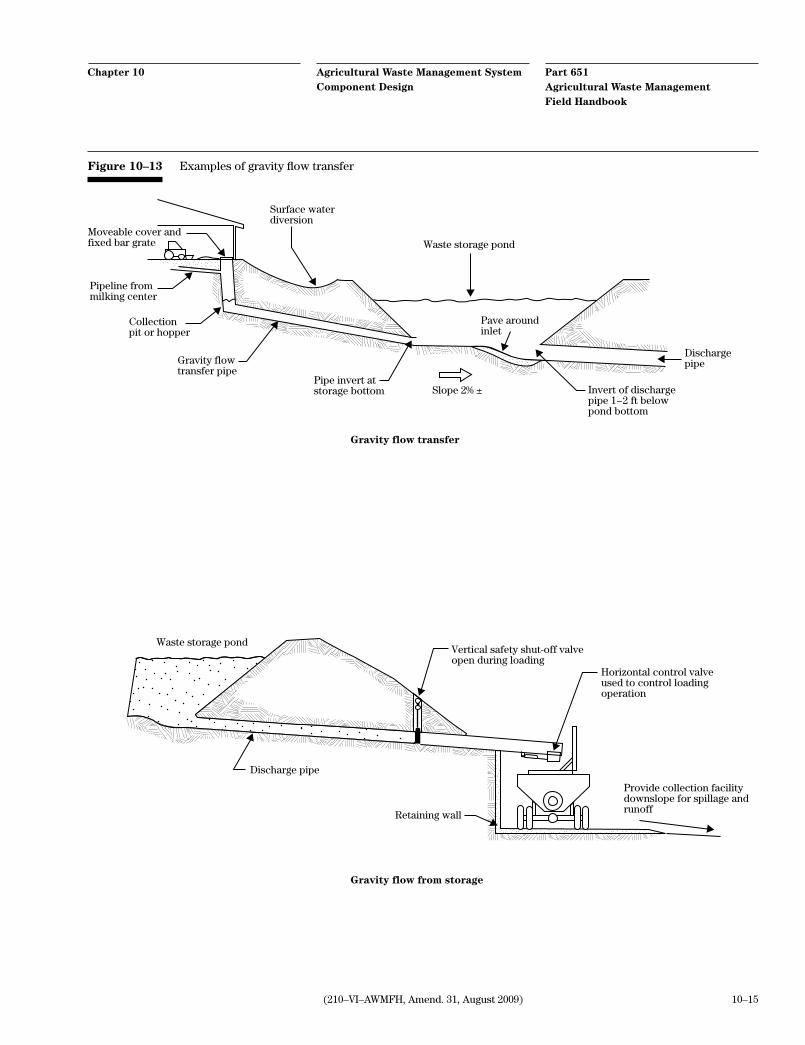
10–15(210–VI–AWMFH, Amend. 31, August 2009)
Part 651Agricultural Waste Management Field Handbook
Agricultural Waste Management System Component Design
Chapter 10
Figure 10–13 Examples of gravity flow transfer
Surface waterdiversion
Moveable cover andfixed bar grate
Pipeline frommilking center
Collection pit or hopper
Gravity flow transfer pipe
Pipe invert atstorage bottom Slope 2% ± Invert of discharge
pipe 1−2 ft belowpond bottom
Dischargepipe
Waste storage pond
Gravity flow transfer
Discharge pipe
Waste storage pondVertical safety shut-off valveopen during loading
Retaining wall
Horizontal control valveused to control loadingoperation
Provide collection facility downslope for spillage and runoff
Gravity flow from storage
Pave around inlet

Part 651Agricultural Waste Management Field Handbook
Agricultural Waste Management System Component Design
Chapter 10
10–16 (210–VI–AWMFH, Amend. 31, August 2009)
Figure 10–14 Push-off ramp
Slope 1/4 in/ft
Extend beyond backfill
Weep holes,10 in o.c.
Floor slab forconcrete storage facility
Course granularfill
Pipe fencingfor security
The centrifugal group includes vertical shaft, horizon-tal shaft, and submersible pumps. They can be used for agitation and transfer of liquid manure; however, only vertical and horizontal shaft pumps are used for irrigation because of the head that they can develop.
Pump selection is based on the consistency of the material to be handled, the total head to be overcome, and the desired capacity (pumping rate). Pump manu-facturers and suppliers can provide rating curves for a variety of pumps.
(e) Equipment
Other equipment used in the transfer of agricultural by-product includes a variety of pumps including chopper/agitator, centrifugal, ram, and screw types. Elevators, pipelines, and hauling equipment are also used. See Agricultural Waste Management Field Hand-book (AWMFH), 651.12 for information about specific equipment.
10–17(210–VI–AWMFH, Amend. 31, August 2009)
Part 651Agricultural Waste Management Field Handbook
Agricultural Waste Management System Component Design
Chapter 10
651.1004 Storage
Manure generally must be stored so that it can be used when conditions are appropriate. Storage facilities for manure of all consistencies must be designed to meet the requirements of a given enterprise.
Determining the storage period for a storage facility is crucial to the proper management of a manure man-agement system. If too short a period is selected, the facility may fill before the material can be used in an environmentally sound manner. Too long a period may result in an unjustified expenditure for the facility and loss of nutrient value.
Many factors are involved in determining the storage period. They include the weather, crop, growing sea-son, equipment availability, soil, soil condition, labor requirements, and management flexibility. Generally, when nutrient utilization is by land application, a stor-age facility must be sized so that it can store the ma-nure during the nongrowing season. A storage facility that has a longer storage period generally will allow more flexibility in managing the manure to accommo-date weather variability, equipment availability, equip-ment breakdown, and overall operation management. Storage facilities should be planned and designed in accordance with NRCS Conservation Practice Stan-dard 313, Waste Storage Facility.
(a) Manure storage facilities for solids
Storage facilities for solid manure include storage ponds and storage structures. Storage ponds are earth-en impoundments used to retain manure, bedding, and runoff liquid. Solid and semisolid manure placed into a storage pond will most likely have to be removed as a liquid unless precipitation is low or a means of drain-ing the liquid is available. The pond bottom and en-trance ramps should be paved if emptying equipment will enter the pond.
(1) Stacking facilitiesStorage structures can be used for manure that will stack and can be handled by solid manure handling equipment. These structures must be accessible for loading and hauling equipment. They can be open or covered. Roofed structures are used to prevent or
reduce excess moisture content. Open stacks can be used in either arid or humid climate. Seepage and run-off from dry stack facilities must be managed. Struc-tures for open and covered stacks often have wooden, reinforced concrete or concrete block sidewalls.
Some operations store the manure at the point of generation. Examples of dairy facilities include dry packs and hoop buildings. The amount of bedding material often dictates whether or not the manure can be handled as a solid. Poultry operations often store and compost the litter in-place between flocks. Only part of the cake may be removed before the next flock is introduced to the building.
In some instances, manure must be stored in open stacks in fields or within a feedlot. Runoff and seepage from these stacks must be managed to prevent move-ment into streams or other surface or ground water. Figures 10–15 and 10–16 show various solid manure storage facilities.
Design considerations—Storage facilities for solid manure must be designed correctly to ensure desired performance and safety. Considerations include mate-rials selection, control of runoff and seepage, neces-sary storage capacity, and proper design of structural components such as sidewalls, floors, and roofs.
The primary materials used in constructing timber structures for solids storage are pressure-treated or rot-resistant wood and reinforced concrete. These ma-terials are suitable for long-term exposure to manure without rapid deterioration. Structural grade steel is also used, but it corrodes and must be protected against corrosion or be periodically replaced. Simi-larly, high quality and protected metal fasteners must be used with timber structures to reduce corrosion problems.
Seepage and runoff, which frequently occur from manure stacks, must be controlled to prevent access into surface and ground water. One method of control is to channel any seepage into a storage pond. At the same time uncontaminated runoff, such as that from the roof and outside the animal housing and lot area, should be diverted around the site.
Concrete ramps are used to gain access to solid ma-nure storage areas. Ramps and floors of solid ma-nure storage structures need to be designed so that

Part 651Agricultural Waste Management Field Handbook
Agricultural Waste Management System Component Design
Chapter 10
10–18 (210–VI–AWMFH, Amend. 31, August 2009)
Figure 10–15 Solid manure stacking facilities
Slope Slope
Timber orconcretebucking wall
To storage and/or spreader from elevator stackerBarn cleaner to spreader or tractor stacking
Runoff tostorageRunoff to
storage
handling equipment can be safely operated. Ramp slopes of 8 to 1 (horizontal to vertical) or flatter are considered safe. Slopes steeper than this are difficult to negotiate. Concrete pavement for ramps and stor-age units should be rough finished to aid in traction. Ramps need to be wide enough that equipment can be safely backed and maneuvered.
Factors to consider in the design of storage facilities for solids include type, number and size of animals, number of days storage desired, and the amount of bedding that will be added to the manure. Equation 10–1 can be used to calculate the manure storage volume:
VMD AU DVM D= × × (eq. 10–1)
where:VMD = volume of manure production for animal type
for storage period, ft3
AU = number of 1,000-pound animal units (AU) by animal type
DVM = daily volume of manure production for ani-mal type, ft3/AU/d
D = number of days in storage period
The bedding volume to be stored can be computed using:
BV
FR WB AU D
BUW=
× × × (eq. 10–2)
where:FR = volumetric void ratio (ASAE 1982) (values
range from 0.3 to 0.5)WB = weight of bedding used for animal type,
lb/AU/dBUW = bedding unit weight, lb/ft3
Using the recommended volumetric void ratio of 0.5, the equation becomes:
BV
WB AU D
BUW=
× × ×0 5.
Characteristics of manure and bedding are described in AWMFH, chapter 4. Other values may be available locally or from the farmer or rancher.
Allowance must be made for the accumulation of pre-cipitation that may fall directly into the storage. Con-taminated runoff should be handled separately from a solid manure storage facility. Uncontaminated runoff should be diverted from the storage unit.
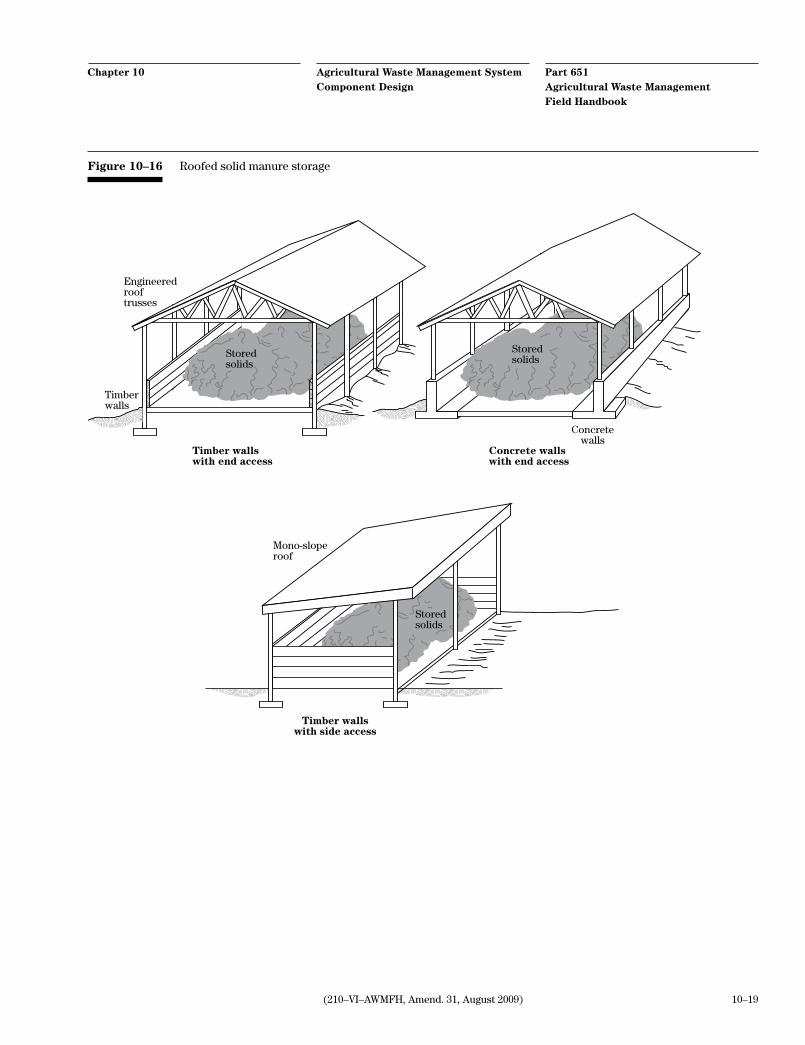
10–19(210–VI–AWMFH, Amend. 31, August 2009)
Part 651Agricultural Waste Management Field Handbook
Agricultural Waste Management System Component Design
Chapter 10
Figure 10–16 Roofed solid manure storage
Concrete wallswith end access
Timberwalls
Engineeredrooftrusses
Concretewalls
Timber wallswith end access
Storedsolids
Storedsolids
Timber wallswith side access
Mono-sloperoof
Storedsolids
10–20 (210–VI–AWMFH, Amend. 31, August 2009)
Part 651Agricultural Waste Management Field Handbook
Agricultural Waste Management System Component Design
Chapter 10
Mr. Ralph Kilpatrick of Hoot Ridge, Kentucky, has requested assistance in developing a manure manage-ment system. He selected an alternative that includes solid manure storage for his Holstein dairy herd of 52 heifers and 100 milking cows with an average milk production of 75 pounds per day. His nutrient man-agement plan indicates the need for 90 days storage. He uses sawdust bedding for both the milking cows and the heifers. Because of space limitations, the storage can be no wider than 50 feet. He would prefer that the facility be stacked no more than 7 feet high. The structure will not be roofed, so stacking above sidewalls will not be considered in design. Determine the necessary volume and facility dimensions using worksheet 10A–1.
Manure production—the animal descriptions, aver-age weight, and numbers are entered on lines 1 and 2. The number of equivalent animal unit (AU) for each animal type is calculated and entered on line 4. Daily manure production (line 4) is in table 4–5(b) of AWMFH, chapter 4. The number of days in storage is entered on line 6. The manure volume (line 7) is calculated using equation 10–1. Add the calculated manure volume for each animal type (VMD), and enter the sum (TVM) on line 8.
Wastewater volume—because this design example involves a waste stacking facility, it would not be ap-propriate to include wastewater in the storage facil-ity. Therefore, lines 9, 10, and 11 are not involved in estimating the waste volume for this example.
Bedding volume—the weight of bedding used daily per animal unit for each animal type found in table 4–4 is entered on line 12. The bedding unit weight, which may be taken from table 4–3 in AWMFH, chap-
ter 4, is entered on line 13. The bedding volume for each animal type for the storage period is calculated using equation 10–2 and entered on line 14. The total bedding volume (TBV) is the sum of the bedding vol-ume for all animal types. Sum the calculated bedding volume (BV) for each animal type and enter it on line 15.
Waste volume—the total waste volume (WV) (line 16) is the sum of the total manure production (TVM) and the total bedding volume (TBV). The storage width (WI) and height (H) can be adjusted for site conditions and common building procedures (usually dimensions divisible by 4 or 8), so the length (line 17) is calculated by trial and error using the equation:
L
WV
WI H=
×
A waste storage structure for solids should be de-signed to withstand all anticipated loads. Loadings include internal and external loads, hydrostatic uplift pressure, concentrated surface and impact loads, wa-ter pressure because of the seasonal high water table, and frost or ice pressure.
The lateral earth pressure should be calculated from soil strength values determined from results of ap-propriate soil tests. If soil strength tests are not available, the minimum lateral earth pressure values indicated in the NRCS Conservation Practice Stan-dard 313, Waste Storage Facility, are to be used.
Timber sidewalls for storage structures should be designed with the load on the post based on full wall height and spacing of posts.
Design example 10–2 Waste stacking facility

10–21(210–VI–AWMFH, Amend. 31, August 2009)
Part 651Agricultural Waste Management Field Handbook
Agricultural Waste Management System Component Design
Chapter 10
0
Notes for waste storage tank structure:1. Final dimensions may be rounded up to whole numbers or to use increments on standard drawings.2. Trial and error may be required to establish appropriate dimensions.
Worksheet 10A-1—Waste storage structure capacity designDecisionmaker: Date:
Site:
Animal units
1. Animal type
2. Animal weight, lbs (W)
3. Number of animals (N)
4. Animal units, AU = _____ =
8. Total manure production for storage period, ft3 (TVM)
Manure volume5. Daily volume of daily manure production per AU, ft3/AU/day (DVM)=
6. Storage period, days (D) =
7. Total volume of manure production for animal type for storage period, ft 3
VMD = AU x DVM x D =
Wastewater volume9. Daily wastewater volume per AU, ft 3/AU/day (DWW) =
10. Total wastewater volume for animal description for storage period, ft3
WWD = DWW x AU x D =
11. Total wastewater volume for storage period, ft3 (TWW)
12. Amount of bedding used daily for animal type, lbs/AU/day (WB) =
13. Bedding unit weight, lbs/ft 3 (BUW) =
Bedding volume
14. Bedding volume for animal type for storage period, ft3 (BV) =
Waste volume requirement
16. Waste volume, ft3 (WV) = TVM + TWW + TBV = _______________ + _________________ + _________________ =
Waste stacking structure sizing
17. Structure length, ft L = _______ =
Notes for waste stacking structure:
1. The volume determined (WV) does not include any volume forfreeboard. It is recommended that a minimum of 1 foot offreeboard be provided for a waste stacking structure.
18. Structure width, ft WI = ________ =
19. Structure height, ft H = _______ =
2. The equations for L, WI, and H assume manure is stacked to average height equalto the sidewall height. Available storage volume must be adjusted to account forthese types of variations.
W x N1000
0.5 x WB x AU x D BUW
BV=
15. Total bedding volume for storage period, ft3 (TBV) =
WVWI x H
WVL x H
WVL x WI
Tank sizing
20. E�ective depth, ft. (EH)Total height (or depth) of tank desired, ft (H)
Less precipitation for storage period, ft. – (uncovered tanks only)Less depth allowance for accumulated solids, ft – (0.5 ft. minimum)Less depth for freeboard (0.5 ft. recommended), ft –
E�ective depth, ft (EH) =
Total height, ft (H) = Selected width, ft (WI)=
Length, ft L = _____ =
Total height, ft H =
Diameter, ft DIA = (1.273 x SA)0.5 =
22. Rectangular tank dimensions
23. Circular tank dimensions
21. Surface area required, ft 2 SA = ________ =WVE H
SAWI
Ralph Kilpatrick 6/13/91Hoot Ridge, KY
Milkers Heifer
1,400 1,000
100 52
140 52
1.7 0.9 21,420 4,21225,632
0
3.1 3.1
12
1,628 604
2,232 27,864
79.6 (USE 84)
47.4 (USE 48)
7
2,232
90
25,632
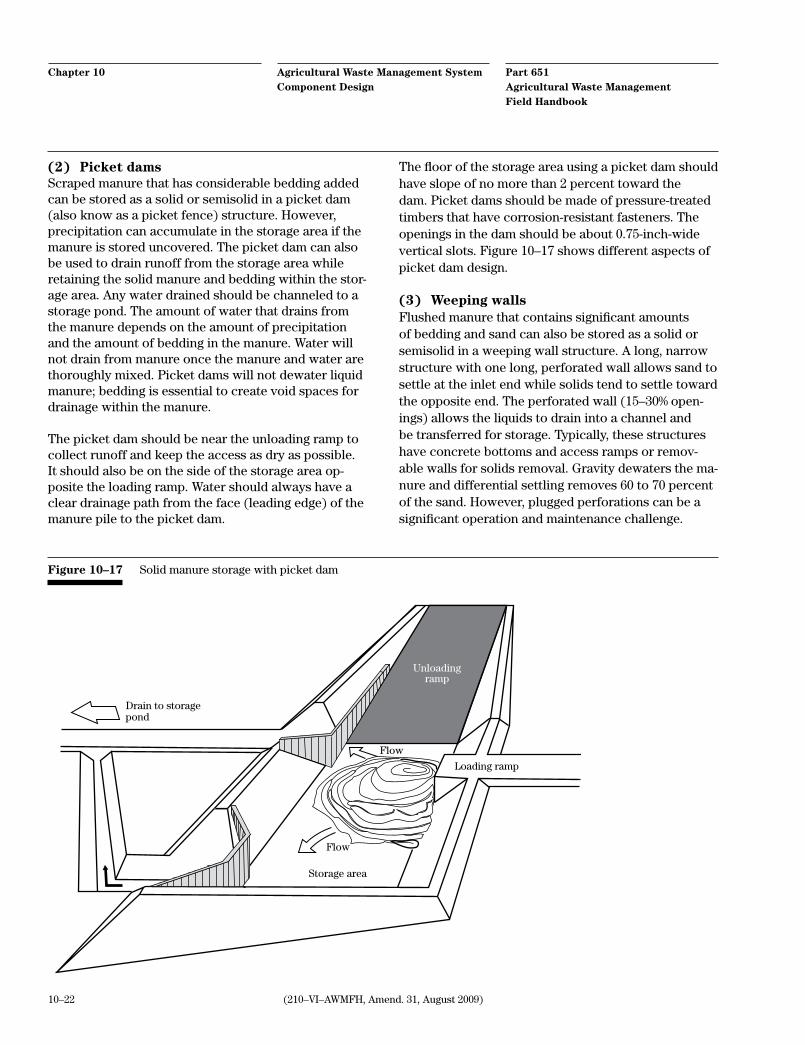
Part 651Agricultural Waste Management Field Handbook
Agricultural Waste Management System Component Design
Chapter 10
10–22 (210–VI–AWMFH, Amend. 31, August 2009)
(2) Picket damsScraped manure that has considerable bedding added can be stored as a solid or semisolid in a picket dam (also know as a picket fence) structure. However, precipitation can accumulate in the storage area if the manure is stored uncovered. The picket dam can also be used to drain runoff from the storage area while retaining the solid manure and bedding within the stor-age area. Any water drained should be channeled to a storage pond. The amount of water that drains from the manure depends on the amount of precipitation and the amount of bedding in the manure. Water will not drain from manure once the manure and water are thoroughly mixed. Picket dams will not dewater liquid manure; bedding is essential to create void spaces for drainage within the manure.
The picket dam should be near the unloading ramp to collect runoff and keep the access as dry as possible. It should also be on the side of the storage area op-posite the loading ramp. Water should always have a clear drainage path from the face (leading edge) of the manure pile to the picket dam.
Figure 10–17 Solid manure storage with picket dam
Drain to storagepond
Flow
Flow
Loading ramp
Storage area
Unloadingramp
The floor of the storage area using a picket dam should have slope of no more than 2 percent toward the dam. Picket dams should be made of pressure-treated timbers that have corrosion-resistant fasteners. The openings in the dam should be about 0.75-inch-wide vertical slots. Figure 10–17 shows different aspects of picket dam design.
(3) Weeping wallsFlushed manure that contains significant amounts of bedding and sand can also be stored as a solid or semisolid in a weeping wall structure. A long, narrow structure with one long, perforated wall allows sand to settle at the inlet end while solids tend to settle toward the opposite end. The perforated wall (15–30% open-ings) allows the liquids to drain into a channel and be transferred for storage. Typically, these structures have concrete bottoms and access ramps or remov-able walls for solids removal. Gravity dewaters the ma-nure and differential settling removes 60 to 70 percent of the sand. However, plugged perforations can be a significant operation and maintenance challenge.
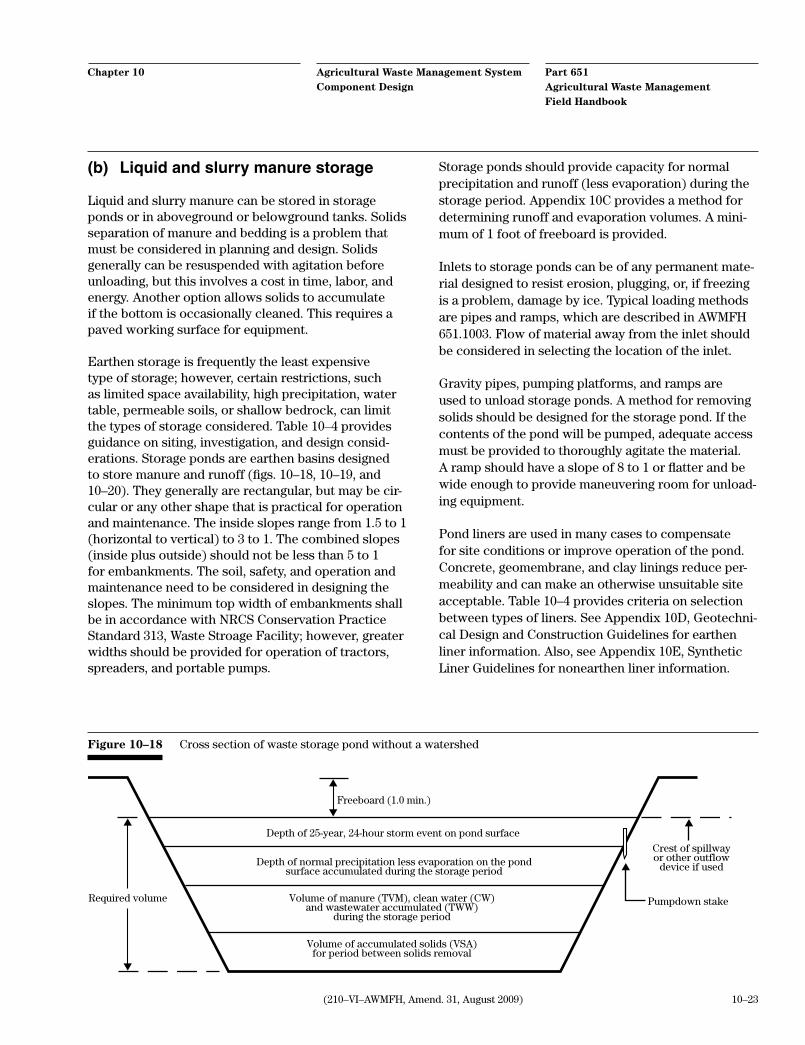
10–23(210–VI–AWMFH, Amend. 31, August 2009)
Part 651Agricultural Waste Management Field Handbook
Agricultural Waste Management System Component Design
Chapter 10
(b) Liquid and slurry manure storage
Liquid and slurry manure can be stored in storage ponds or in aboveground or belowground tanks. Solids separation of manure and bedding is a problem that must be considered in planning and design. Solids generally can be resuspended with agitation before unloading, but this involves a cost in time, labor, and energy. Another option allows solids to accumulate if the bottom is occasionally cleaned. This requires a paved working surface for equipment.
Earthen storage is frequently the least expensive type of storage; however, certain restrictions, such as limited space availability, high precipitation, water table, permeable soils, or shallow bedrock, can limit the types of storage considered. Table 10–4 provides guidance on siting, investigation, and design consid-erations. Storage ponds are earthen basins designed to store manure and runoff (figs. 10–18, 10–19, and 10–20). They generally are rectangular, but may be cir-cular or any other shape that is practical for operation and maintenance. The inside slopes range from 1.5 to 1 (horizontal to vertical) to 3 to 1. The combined slopes (inside plus outside) should not be less than 5 to 1 for embankments. The soil, safety, and operation and maintenance need to be considered in designing the slopes. The minimum top width of embankments shall be in accordance with NRCS Conservation Practice Standard 313, Waste Stroage Facility; however, greater widths should be provided for operation of tractors, spreaders, and portable pumps.
Volume of accumulated solids (VSA)for period between solids removal
Volume of manure (TVM), clean water (CW)and wastewater accumulated (TWW)
during the storage period
Depth of normal precipitation less evaporation on the pondsurface accumulated during the storage period
Depth of 25-year, 24-hour storm event on pond surface
Crest of spillwayor other outflow
device if used
Required volume
Freeboard (1.0 min.)
Pumpdown stake
Figure 10–18 Cross section of waste storage pond without a watershed
Storage ponds should provide capacity for normal precipitation and runoff (less evaporation) during the storage period. Appendix 10C provides a method for determining runoff and evaporation volumes. A mini-mum of 1 foot of freeboard is provided.
Inlets to storage ponds can be of any permanent mate-rial designed to resist erosion, plugging, or, if freezing is a problem, damage by ice. Typical loading methods are pipes and ramps, which are described in AWMFH 651.1003. Flow of material away from the inlet should be considered in selecting the location of the inlet.
Gravity pipes, pumping platforms, and ramps are used to unload storage ponds. A method for removing solids should be designed for the storage pond. If the contents of the pond will be pumped, adequate access must be provided to thoroughly agitate the material. A ramp should have a slope of 8 to 1 or flatter and be wide enough to provide maneuvering room for unload-ing equipment.
Pond liners are used in many cases to compensate for site conditions or improve operation of the pond. Concrete, geomembrane, and clay linings reduce per-meability and can make an otherwise unsuitable site acceptable. Table 10–4 provides criteria on selection between types of liners. See Appendix 10D, Geotechni-cal Design and Construction Guidelines for earthen liner information. Also, see Appendix 10E, Synthetic Liner Guidelines for nonearthen liner information.

Part 651Agricultural Waste Management Field Handbook
Agricultural Waste Management System Component Design
Chapter 10
10–24 (210–VI–AWMFH, Amend. 31, August 2009)
Volume of accumulated solids (VSA)for period between solids removal
Volume of manure (TVM), clean water (CW)and wastewater accumulated (TWW)
during the storage period
Depth of normal precipitation less evaporation on the pondsurface accumulated during the storage period
Depth of the 25-year, 24-hour storm on the pond surface
Freeboard (1.0 min.)
Crest of spillwayor other outflow
device if used
*or other outflow device
Required volume
Volume of runoff from the 25-year, 24-hour storm event
Pumpdown stake
Volume of normal runoff accumulated during the storage period(ROV)
Figure 10–19 Cross section of waste storage pond with watershed
Figure 10–20 Waste storage ponds
Inletpipe
Sump or anti-scour pad
1 ft min.freeboard
X + Y > 5
X
11
Y
Diversion
Fence
Cross-sectionearth embankment

10–25(210–V
I–AW
MF
H, A
mend. 31, A
ugust 2009)
Part 651
Agricu
ltural W
aste Man
agemen
t F
ield H
and
bo
ok
Agricu
ltural W
aste Man
agemen
t System
C
om
po
nen
t Design
Ch
apter 10Risk→
Vulnerability ↓
Very high<1,500 ft from
public drinking water supply wells;
OR <100 ft from any domestic well or Class 1 stream
HighDoes not meet Very High Risk criteria; AND Recharge areas for Sole Source aquifers; OR 100 to 600 ft from unconfined domestic
water supply well (or where degree of aquifer confinement is unknown) or Class 1 stream
ModerateDoes not meet High Risk criteria; AND 600 to 1,000 ft from unconfined
domestic well (or where degree of aquifer confinement is unknown) or Class 1 stream;
OR <600 ft from unconfined nondomestic water supply well (or where degree of aquifer confinement is unknown) or Class 2 stream
SlightDoes not meet Moderate Risk
criteria; AND >1,000 ft from
unconfined domestic well (or where degree of aquifer confinement is unknown) or Class 1 stream;
AND >600 ft from unconfined nondomestic water supply well (or where degree of aquifer confinement is unknown) or Class 2 stream
Very high Large voids (e.g., karst, lava tubes, mine
shafts); OR Highest anticipated ground water
elevation within 5 ft of invert; OR <600 ft from improperly abandoned well* Evaluate other
storage alternatives* (or properly seal well and reevaluate vulnerability)
Evaluate other storage alternatives* (or properly seal well and reevaluate vulnerability)
High Does not meet Very High Vulnerability
criteria: AND Bedrock (assumed fractured) within 2
ft of invert; OR Coarse soils/parent material (Permeability
Group I soils as defined in AWMFH, always including GP, GW, SP, SW);
OR Highest anticipated groundwater elevation is between 5 to 20 ft below invert;
OR 600 to 1,000 ft from improperly abandoned well*
Synthetic liner required* (or properly seal well and reevaluate
vulnerability)No additional site characterization required
Liner required* (or properly seal well and reevaluate vulnerability)Specific discharge <1×10⁻⁶ cm3/cm2/sNo manure sealing creditEarthen liner design includes sampling
and testing of liner material (Classification, Standard Proctor compaction, Permeability)
Liner required* (or properly seal well and reevaluate vulnerability).Specific Discharge <1×10⁻⁶ cm3/
cm2/sNo manure sealing creditEarthen liner design includes
sampling and classification testing of liner material
Published permeability data and construction method specifications may be used
Moderate Does not meet High Vulnerability criteria; AND Medium soils/parent material
(Permeability Group II soils as defined in AWMFH, usually including CL-ML, GM, SM, ML);
OR Flocculated or blocky clays (typically associated with high Ca);
OR Complex stratigraphy (discontinuous layering);
OR Highest anticipated ground water elevation is between 21 to 50 ft below invert;
OR 600–1,000 ft from improperly abondoned well*
Evaluate other alternatives or synthetic liner as allowed
Local regulations may apply
Consult with area engineer
Further evaluate need for linerSpecific discharge <1×10⁻⁶ cm3/m2/sNo manure sealing creditEarthen liner/no liner design includes
sampling and testing of liner/in-place material (Classification, Standard Proctor compaction/in-place density, Remolded/Undisturbed sample Permeability)
Further evaluate need for linerSpecific discharge
<1×10⁻⁶ cm3/cm2/sNo manure sealing credit Earthen liner/no liner design includes
sampling and testing of liner/in-place material (Classification, Standard Proctor compaction/ in-place density, Remolded/Undisturbed sample Permeability)
Further evaluate need for linerSpecific discharge
<1×10⁻⁶ cm3/cm2/sNo manure sealing credit Earthen liner/no liner design
includes sampling and classification testing of liner/in-place material + in-place density
Published permeability data and construction method specifications may be used
Low Does not meet Moderate Vulnerability
criteria; AND Fine soils/parent material (Permeability
Group III and IV soils as defined in AWMFH, usually including GC, SC, MH, CL, CH);
AND Highest anticipated ground water elevation is >50 ft below invert
Further evaluate need for linerSpecific discharge <1×10⁻⁶ cm3/cm2/sNo manure sealing creditEarthen liner/no liner design includes
sampling and testing of liner/ in-place material (Classification, Standard Proctor compaction/ in-place density, Remolded/ Undisturbed sample Permeability)
Scarify and recompact surface to seal cracks and break down soil structure as appropriate
Liner not requiredSpecific discharge <1 x 10⁻⁶ cm3/cm2/sField classification and published permeability data may be usedConstruction method specifications may be usedScarify and recompact surface to seal cracks and break down soil structure
as appropriate
Table 10–4 Criteria for siting, investigation, and design of liquid manure storage facilities
*See local regulations
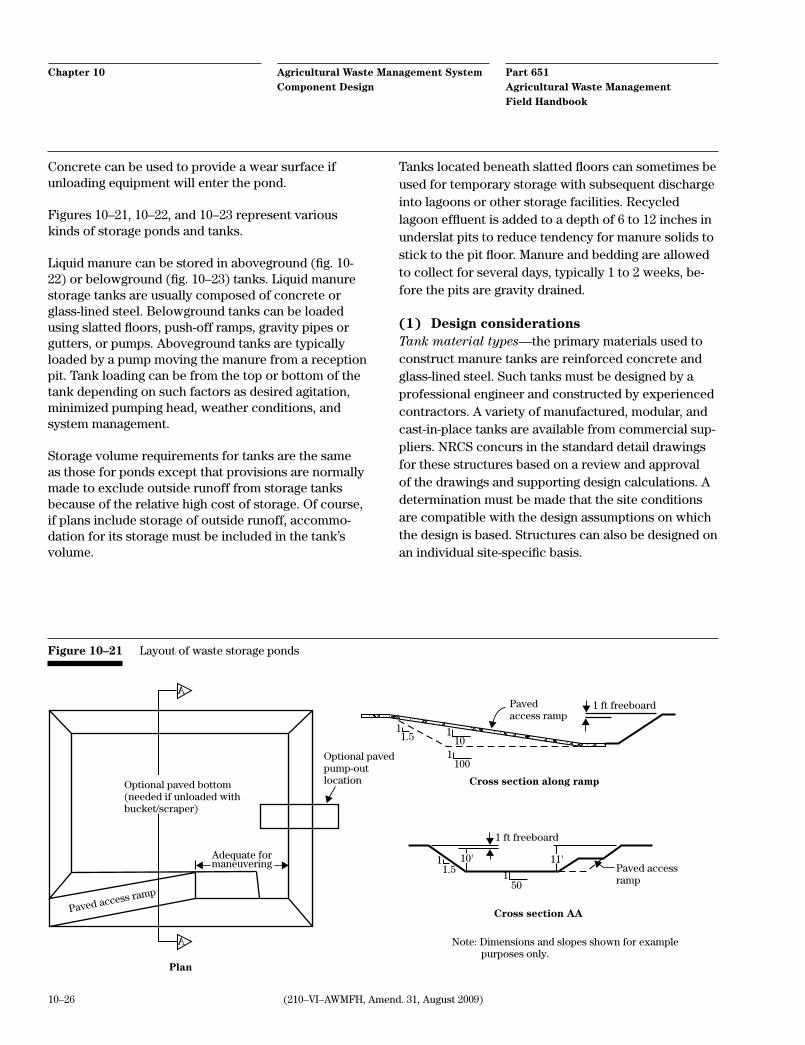
Part 651Agricultural Waste Management Field Handbook
Agricultural Waste Management System Component Design
Chapter 10
10–26 (210–VI–AWMFH, Amend. 31, August 2009)
Concrete can be used to provide a wear surface if unloading equipment will enter the pond.
Figures 10–21, 10–22, and 10–23 represent various kinds of storage ponds and tanks.
Liquid manure can be stored in aboveground (fig. 10-22) or belowground (fig. 10–23) tanks. Liquid manure storage tanks are usually composed of concrete or glass-lined steel. Belowground tanks can be loaded using slatted floors, push-off ramps, gravity pipes or gutters, or pumps. Aboveground tanks are typically loaded by a pump moving the manure from a reception pit. Tank loading can be from the top or bottom of the tank depending on such factors as desired agitation, minimized pumping head, weather conditions, and system management.
Storage volume requirements for tanks are the same as those for ponds except that provisions are normally made to exclude outside runoff from storage tanks because of the relative high cost of storage. Of course, if plans include storage of outside runoff, accommo-dation for its storage must be included in the tank’s volume.
Tanks located beneath slatted floors can sometimes be used for temporary storage with subsequent discharge into lagoons or other storage facilities. Recycled lagoon effluent is added to a depth of 6 to 12 inches in underslat pits to reduce tendency for manure solids to stick to the pit floor. Manure and bedding are allowed to collect for several days, typically 1 to 2 weeks, be-fore the pits are gravity drained.
(1) Design considerationsTank material types—the primary materials used to construct manure tanks are reinforced concrete and glass-lined steel. Such tanks must be designed by a professional engineer and constructed by experienced contractors. A variety of manufactured, modular, and cast-in-place tanks are available from commercial sup-pliers. NRCS concurs in the standard detail drawings for these structures based on a review and approval of the drawings and supporting design calculations. A determination must be made that the site conditions are compatible with the design assumptions on which the design is based. Structures can also be designed on an individual site-specific basis.
Paved access ramp
11.5
1100
110
Paved access ramp
11.5 1
50
1 ft freeboard
1 ft freeboard
Cross section AA
Paved accessramp
Plan
Cross section along ramp
10' 11'Adequate for maneuvering
Note: Dimensions and slopes shown for example purposes only.
Optional paved pump-out location
A
A
Optional paved bottom(needed if unloaded with bucket/scraper)
Figure 10–21 Layout of waste storage ponds
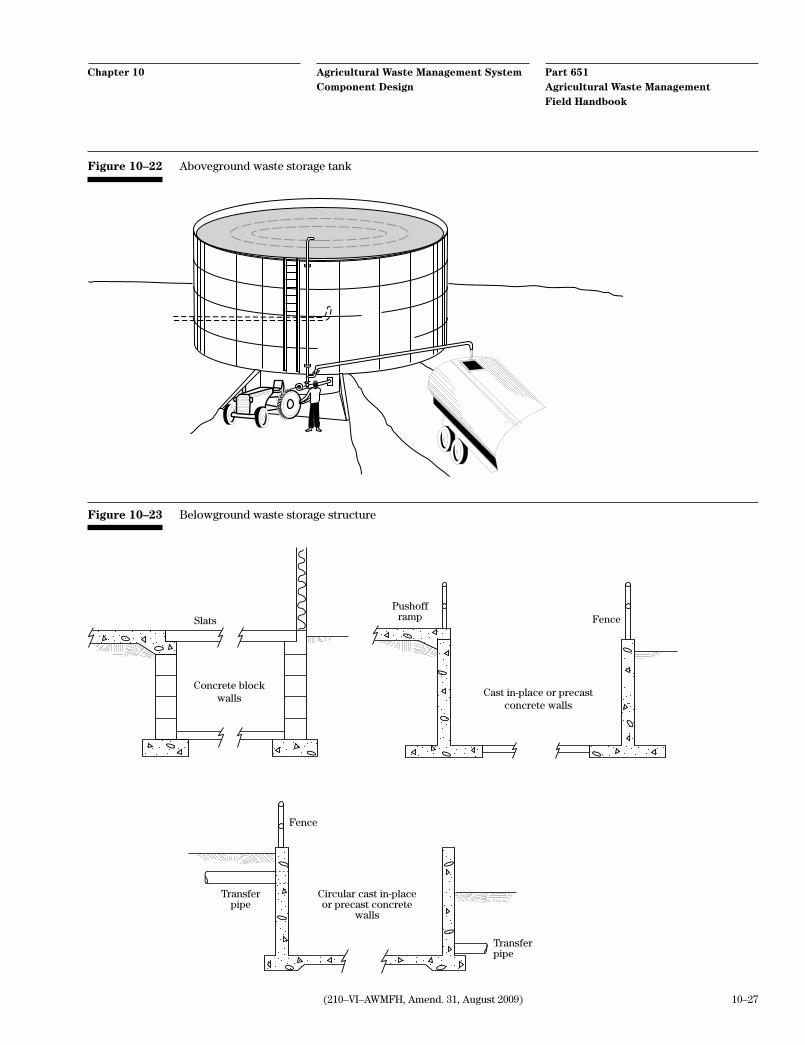
10–27(210–VI–AWMFH, Amend. 31, August 2009)
Part 651Agricultural Waste Management Field Handbook
Agricultural Waste Management System Component Design
Chapter 10
Figure 10–22 Aboveground waste storage tank
Figure 10–23 Belowground waste storage structure
Cast in-place or precastconcrete walls
Concrete blockwalls
Fence
Fence
Transferpipe
Transferpipe
Circular cast in-placeor precast concrete
walls
PushofframpSlats

Part 651Agricultural Waste Management Field Handbook
Agricultural Waste Management System Component Design
Chapter 10
10–28 (210–VI–AWMFH, Amend. 31, August 2009)
Cast-in-place, reinforced concrete, the principal mate-rial used in belowground tanks, can be used in above-ground tanks, as well. Tanks can also be constructed of precast concrete panels that are bolted together. Circular tank panels are held in place with metal hoops. The panels are positioned on a concrete foun-dation or have footings cast as an integral part of the panel. Tank floors are cast in-place slabs.
Other aboveground tanks are constructed of metal. Glass-fused steel panels are widely used. Such tanks are manufactured commercially and must be con-structed by trained crews. Other kinds of metal panels are also used.
Sizing—storage ponds and structures should be sized to hold all of the manure, bedding, washwater from the milkhouse; flushing; and contaminated runoff that can be expected during the storage period. Equation 10–3 can be used to compute the waste volume:
WV TVM TWM TBV= + + (eq. 10 –3)
where:WV = waste volume for storage period, ft3
TVM = total volume of manure for storage period, ft3 (see eq. 10–1)
TWW = total wastewater volume for storage period, ft3
TBV = total bedding volume for storage period, ft3 (see eq. 10–2)
Data on manure production are available in AWMFH, chapter 4 or from the farmer or rancher. Appendix 10C provides a method of estimating contaminated runoff volume.
In addition to the waste volume, storage tanks must, if uncovered, provide a depth to accommodate precipita-tion less evaporation on the storage surface during the most critical storage period. The most critical storage period is generally the consecutive months that repre-sent the storage period that gives the greatest depth of precipitation less evaporation. Appendix 10C gives a method for estimating precipitation less evaporation. Storage tanks must also provide a depth of 0.5 feet for material not removed during emptying. A depth for freeboard of 0.5 feet is also recommended.
Storage ponds must also provide a depth to accom-modate precipitation less evaporation during the most
critical storage period. If the pond does not have a watershed, the depth of the 25-year, 24-hour precipita-tion on the pond surface must be included. Appendix 10B includes a map giving the precipitation amount for the 25-year, 24-hour precipitation. Frequently, storage ponds are designed to include outside runoff from wa-tersheds. For these, the runoff volume of the 25-year, 24-hour storm must be included in the storage volume.
Appendix 10C gives a procedure for estimating the runoff volume from feedlots. The NRCS NEH 650, En-gineering Field Handbook, chapter 2, or by some other hydrologic method may be used to estimate runoff volumes for other watershed areas.
(2) Design of sidewalls and floorsThe information on the design of sidewalls and floors on solid manure storage material in AWMFH 651.1004(a) is applicable to these items used for liquid manure storage. All possible influences, such as inter-nal and external hydrostatic pressure, flotation and drainage, live loads from equipment and animals, and dead loads from covers and supports, must be consid-ered in the design.
Pond sealing—storage ponds must not allow excess seepage. The soil in which the pond is to be located must be evaluated and, if needed, tested during plan-ning and design to determine need for an appropri-ate liner. Refer to AWMFH 651.07 for more detailed information on determining the need for and design of liners.

10–29(210–VI–AWMFH, Amend. 31, August 2009)
Part 651Agricultural Waste Management Field Handbook
Agricultural Waste Management System Component Design
Chapter 10
Mr. Bill Walton of Middlesburg, Tennessee, has requested assistance on a manure management system. The selected alternative includes a below-ground, covered, slurry storage tank for his Holstein dairy herd. He has 75 heifers that are about 1,000 pounds each and 150 milkers (average milk produc-tion of 75 lb/d) that average 1,400 pounds. Bedding material is not used with these animals. Based on crop utilization of the nutrients, storage is needed for 75 days. The critical storage periods are January 1 to March 15 and July 1 to September 15. The wash-water from the milkhouse and parlor is also stored. No runoff will be directed to the storage. Worksheet 10A–1 shows how to determine the necessary vol-ume for the storage tank and several possible sets of tank dimensions. It also shows how to estimate the total solids content of the stored material.
Manure production—the animal type, average weight, and number are entered on lines 1, 2, and 3. The equivalent 1,000-pound animal unit (AU) for the animal type is calculated and entered on line 4. The daily volume of manure (DVM) production for each animal type is selected from table 4–5(b) and en-tered on line 5. The storage period (D) is entered on line 6. The total manure volume (VMD) is calculated for each animal type and entered on line 7. Add the VMD for each animal type and enter the sum (TVM) on line 8.
Wastewater volume—the daily milking center waste-water volume per animal unit description (DWW) is selected from table 4–7 of AWMFH, chapter 4, and entered on line 9. The wastewater volume for the animal type for the storage period (WWD) is
calculated and entered on line 10. Add the wastewa-ter volumes for each animal type and enter the sum (TWW) on line 11.
Bedding volume—bedding is not used in this ex-ample. If bedding were used, however, its volume for the storage period would be determined using lines 12 through 15.
Waste volume—WV is the total volume of waste material that will be stored including total manure (TVM), total wastewater (TWW), and total bedding volume (TBV). Provisions are to be made to assure that outside runoff does not enter the tank. In addi-tion, if the tank is not covered, the depth of precipita-tion less evaporation on the tank surface expected during the most critical storage period must be added to the depth requirements.
Total depth available—the desired depth is the total planned depth based on such considerations as foundation condition, tank wall design, and standard drawing depth available.
Surface area—the surface area (SA) (line 21) dimen-sions are calculated using the equation for SA.
Tank dimensions—because tanks are rectangular or circular, various combinations of length and width can be used to provide the SA required. If the depth is held constant, only one solution for the diameter of a circular tank is possible. The dimensions of either shape can be rounded upward to match a stan-dard detail drawing or for convenience.
Design example 10–3 Storage tank
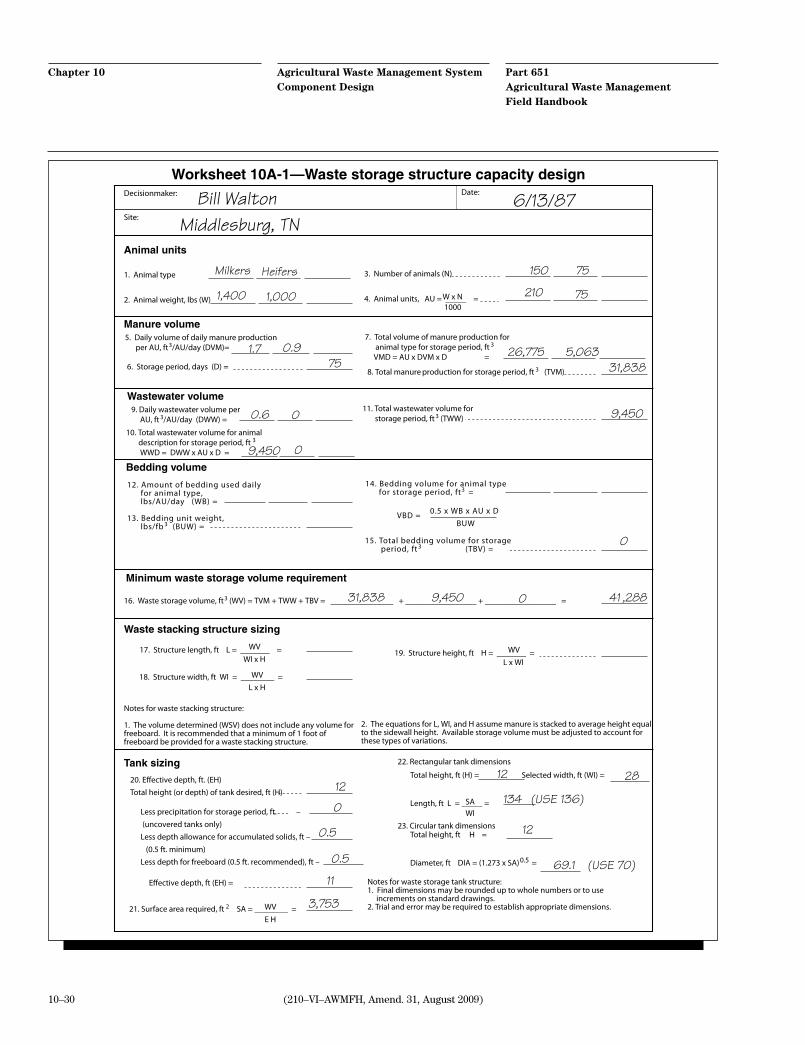
Part 651Agricultural Waste Management Field Handbook
Agricultural Waste Management System Component Design
Chapter 10
10–30 (210–VI–AWMFH, Amend. 31, August 2009)
Total height, ft (H) = Selected width, ft (WI) =
Length, ft L = _____ =
Total height, ft H =
Diameter, ft DIA = (1.273 x SA)0.5 =
Notes for waste storage tank structure:1. Final dimensions may be rounded up to whole numbers or to use increments on standard drawings.2. Trial and error may be required to establish appropriate dimensions.
Worksheet 10A-1—Waste storage structure capacity designDecisionmaker: Date:
Site:
Animal units
1. Animal type
2. Animal weight, lbs (W)
3. Number of animals (N)
4. Animal units, AU = _____ =
8. Total manure production for storage period, ft 3 (TVM)
Manure volume5. Daily volume of daily manure production per AU, ft3/AU/day (DVM)=
6. Storage period, days (D) =
7. Total volume of manure production for animal type for storage period, ft 3
VMD = AU x DVM x D =
Wastewater volume9. Daily wastewater volume per AU, ft 3/AU/day (DWW) =
10. Total wastewater volume for animal description for storage period, ft 3
WWD = DWW x AU x D =
11. Total wastewater volume for storage period, ft 3 (TWW)
12. Amount of bedding used daily for animal type, lbs/AU/day (WB) =
13. Bedding unit weight, lbs/fb 3 (BUW) =
Bedding volume
14. Bedding volume for animal type for storage period, ft3 =
Minimum waste storage volume requirement
16. Waste storage volume, ft3 (WV) = TVM + TWW + TBV = _______________ + _________________ + _________________ =
Waste stacking structure sizing
17. Structure length, ft L = _______ =
Notes for waste stacking structure:
1. The volume determined (WSV) does not include any volume forfreeboard. It is recommended that a minimum of 1 foot offreeboard be provided for a waste stacking structure.
18. Structure width, ft WI = ________ =
19. Structure height, ft H = _______ =
2. The equations for L, WI, and H assume manure is stacked to average height equalto the sidewall height. Available storage volume must be adjusted to account forthese types of variations.
W x N1000
0.5 x WB x AU x D BUW
VBD =
15. Total bedding volume for storage period, ft 3 (TBV) =
WVWI x H
WVL x H
WVL x WI
Tank sizing
20. E�ective depth, ft. (EH)Total height (or depth) of tank desired, ft (H)
Less precipitation for storage period, ft. – (uncovered tanks only)Less depth allowance for accumulated solids, ft – (0.5 ft. minimum)Less depth for freeboard (0.5 ft. recommended), ft –
E�ective depth, ft (EH) =
22. Rectangular tank dimensions
23. Circular tank dimensions
21. Surface area required, ft 2 SA = ________ =WVE H
SAWI
134 (USE 136)
Bill Walton 6/13/87Middlesburg, TN
Milkers Heifers
1,400 1,000
150 75
210 75
1.7 0.975
26,775 5,06331,838
0.6 0
9,450 0
9,450
0
31,838 0 882,14054,9
12
0
0.5
0.5
11
3,753
12 28
12
69.1 (USE 70)

10–31(210–VI–AWMFH, Amend. 31, August 2009)
Part 651Agricultural Waste Management Field Handbook
Agricultural Waste Management System Component Design
Chapter 10
Mr. Joe Green of Silverton, Oregon, has requested assistance in developing a manure management sys-tem for his dairy. He has selected an alternative that includes a storage pond component. He has a Hol-stein herd composed of 500 milkers weighing 1,400 pounds with an average milk production of 75 pounds per day, 150 dry cows averaging 1,400 pounds; and 150 heifers averaging 1,000 pounds. He has a frees-tall barn that has flush alleys. He uses foam pads for bedding. The alternative selected includes land application. A storage period of 180 days is required for storage through the winter months of high pre-cipitation. A solid separator will be used to minimize solid accumulation in the storage pond and to allow recycling of the flushwater. Water from the milkhouse and parlor will be stored in the pond. Use worksheet 10A-2 to determine the required capacity and size of the pond.
Manure production—the animal type, average weight, and numbers are entered on lines 1, 2, and 3. The number of 1,000-pound animal unit (AU) for each animal type is calculated and entered on line 4. The volume of daily manure production (DVM) from table 4–5(b) in AWMFH, chapter 4, is entered on line 5. The storage period (D) is entered on line 6. The manure volume for the storage period for each animal type (VMD) is then calculated and entered on line 7. The total volume (TVM) is added and then entered on line 8.
Wastewater volume—in this example, only the waste-water from the milkhouse and parlor is accounted for in the waste storage volume requirements because the alley flushwater is recycled. The daily wastewater volume per animal unit (DWW) from table 4-6 in AW-MFH, chapter 4, is entered on line 9. The wastewater volume for each animal type for the storage period (WWD) is calculated using the equation and entered on line 10. The wastewater volume from each animal
type (WWD) is added, and the sum (TWW) is entered on line 11.
Clean water volume—in this example, no clean water is added. However, if clean water (CW) is added for dilution, for example, the amount added during the storage period would be entered on line 12.
Runoff volume—for this example, the storage pond does not have a watershed and storage for runoff is not needed. However, storage ponds are frequently planned to include the runoff from a watershed, such as a feedlot. The ponds that have a watershed must include the normal runoff for the storage period and the runoff volume for the 25-year, 24-hour storm. The runoff volume from feedlots may be calculated us-ing the procedures in appendix 10C. For watersheds or parts of watersheds that have cover other than feedlots, the runoff volume may be determined using the procedure in chapter 2 of the NEH 651, Engineer-ing Field Handbook. The value for watershed runoff volume (ROV) is entered on line 13. Documentation showing the procedure and values used in determin-ing the volume of runoff should be attached to the worksheet.
Volume of accumulated solids—this volume is to accommodate the storage of accumulated solids for the period between solids removal. The solids referred to are those that remain after the liquid has been removed. An allowance for accumulated solids is required mainly for ponds used to store wastewa-ter and polluted runoff. Solids separation, agitation before emptying, and length of time between solids removal all affect the amount of storage that must be provided. Enter the value for accumulated solids (VSA) on line 14. In this example, the solids from the manure are separated and solids accumulation will be minimal. No storage is provided for accumulated solids. (Continued)
Design example 10–4 Storage pond

Part 651Agricultural Waste Management Field Handbook
Agricultural Waste Management System Component Design
Chapter 10
10–32 (210–VI–AWMFH, Amend. 31, August 2009)
Design example 10–4 Storage pond—Continued
Waste volume—the total waste storage volume (WV) is determined by adding the total volume of manure (TVM), total wastewater volume (TWW), clean water added (CW), and volume allowance for solids accu-mulation (VSA). Storage ponds that have a watershed must also include the normal runoff volume for the storage period and the volume of the 25-year, 24-hour storm runoff (ROV). WSV is calculated on line 15. The storage pond must be sized to store this volume plus additional depth as explained in “depth adjust-ment.”
Storage pond sizing—the storage pond is sized by trial and error for either a rectangular or circular shaped pond by using the procedure on line 16.
Depth adjustment—the depth required for the stor-age volume with the selected pond dimensions must be adjusted by adding depth for the precipitation less evaporation and the depth of the 25-year, 24-hour storm on the pond surface. The minimum freeboard is 1 foot. The adjustment for final depth is made us-ing line 17.

10–33(210–VI–AWMFH, Amend. 31, August 2009)
Part 651Agricultural Waste Management Field Handbook
Agricultural Waste Management System Component Design
Chapter 10
Completed worksheet for Design example 10–4
Worksheet 10A-2—Waste storage pond designDecisionmaker: Date:
Site:
Animal units
1. Animal type
2. Animal weight, lbs (W)
3. Number of animals (N)
4. Animal units, AU = _____ =
8. Total manure production for storage period, ft 3 (TVM)
Manure volume5. Daily volume of manure production per AU, ft3
6. Storage period, days (D) =
7. Total volume of manure production for animal type for storage period, ft3
VMD = AU x DVM x D =
Wastewater volume9. Daily wastewater volume per AU, ft 3/AU/day (DWW) =
10. Total wastewater volume for animal description for storage period, ft 3
WWD = DWW x AU x D =
11. Total wastewater volume for storage period, ft3 (TWW)
W x N1000
Clean water volume12. Clean water added during storage period, ft 3 (CW)
Runoff Volume13. Runo� volume, ft3 (ROV) (attach documentation)Includes the volume of runo� from the drainage areadue to normal runo� for the storage period and theruno� volume from the 25-year, 24-hour storm.
14. Volume of solids accumulation, ft3 (VSA)
Solids accumulation
Waste volume requirement
15. Waste volume, ft 3 (WV) = TVM + TWW + CW + ROV + VSA
= ___________ + ___________ + ___________ + ___________ + __________ = ________________
16. Sizing by trial and error
Side slope ratio, (Z) = _______________ V must be equal to or greater than WV = ______________ ft 3
Pond sizing
Rectangular pond,
V=(1.05 x Z 2 x d 3) + (1.57 x W x Z x d 2) + (0.79 x W 2 x d)
* Depth must be adjusted in Step 17.
Depth adjustment17. Depth adjustment
Depth, ft (d)
Add depth of precipitation less evaporation +(For the storage period)
Add depth of 25-year, 24-hour storm +
Add depth required to operate emergency out�ow* +
Add for freeboard (1.0 foot minimum) +
Final depth
Trialno.
Bottom widthft (BW)
Bottom lengthft (BL)
Depth*ft (d)
Volumeft3 (V)
Trialno.
Bottom diameter(DIA)
Depth*ft (d)
Volumeft 3 (V)
Joe Green 10/4/90Silverton, OR
Milkers Dry Heifers
1,400 1,400 1,000
500 150 150
700 210 150
1.7 0.84 0.9180
214,200 31,752 24,300
270,252
0.6 0 0
75,600
75,600
0 0
0
270,252 75,600 0 0 0
3
345,852
345,852
1234
100100100100
500450450455
666.26.2
6.22.3
0.3
1.09.8
367,392331,992345,286348,963 ≈ WSV OK
Circular pond,
V4 Z d
3Z BL d Z BW d BW BL d
2 32 2= × ×
+ × ×( ) + × ×( ) + × ×( )
/AU/day (DVM) =

Part 651Agricultural Waste Management Field Handbook
Agricultural Waste Management System Component Design
Chapter 10
10–34 (210–VI–AWMFH, Amend. 31, August 2009)
651.1005 Treatment
In many situations, manure treatment is necessary before final utilization. Adequate treatment reduces pollution potential of the manure through biological, physical, and chemical processes using such compo-nents as lagoons, oxidation ditches, composting, and constructed wetlands. These types of components reduce nutrients, reduce pathogen counts, and reduce total solids. Composting also reduces the volume of the material. Treatment may also include solids sepa-ration, drying, and dilution that prepare the material for facilitating another function. By their nature, treat-ment facilities require a higher level of management than that of storage facilities.
(a) Primary treatment
Primary treatment includes the physical processes such as solids-liquids separation, moisture adjustment, and dilution. Although not required, primary treatment is often followed by secondary treatment prior to stor-age or land application.
(1) Drying/dewateringIf the water is removed from freshly excreted manure, the volume to handle can be reduced. The process of removing water is referred to as dewatering. In the arid regions of the United States, most manure is dewatered (dried) by evaporation from sun and wind. Some nutrients may be lost in the drying process.
Dried or dewatered manure solids are often sold as a soil conditioner or garden fertilizer. These solids may also be used as fertilizer on agricultural land. They are high in organic matter and can be expected to produce odors if moisture is added and the mate-rial is not re-dried or composted. Because the water is removed, the concentrations of some nutrients and salts will change. Dried manure should be analyzed to determine the nutrient concentrations before land application.
In humid climates, dewatering is accomplished by add-ing energy to drive off the desired amount of moisture. Processes have been developed for drying manure in greenhouse-type facilities; however, the drying rate is dependent on the temperature and relative humidity.
The cost of energy often makes the drying process unattractive.
(2) Solid/liquid separationAnimal manure contains material that can often be reclaimed. Solids in dairy manure from animals fed a high roughage diet can be removed and processed for use as good quality bedding. Some form of separa-tion must be used to recover these solids. A mechani-cal separator or settling basin is typically employed. Separators are also used to reduce solids content and required storage volumes.
Separators also facilitate handling of manure. For example, solid separation can allow the use of conven-tional irrigation equipment for land application of the liquids. Separation eliminates many of the problems associated with the introduction of solids into stor-age ponds and treatment lagoons by reducing solids accumulation and minimizing agitation requirements. Separation facilities should be planned and designed in accordance with NRCS Conservation Practice Stan-dard 632, Solid/Liquid Waste Separation Facility.
Mechanical separation—Several kinds of mechani-cal separators can be used to remove by-products from manure (fig. 10–24). One kind commonly used is a screen. Screens are statically inclined or in continu-ous motion to aid in separation. The most common type of continuous motion screen is a vibrating screen. The TS concentration of manure to be processed by a screen should be reduced to less than 5 percent. Higher TS concentrations reduce the effectiveness of the separator.
A centrifuge separator uses centrifugal force to re-move the solids, which are eliminated from the ma-chine at a different point than the liquids. In addition, various types of presses can be used to force the liquid part of the manure from the solid part.
Several design factors should be considered when selecting a mechanical separator. One factor is the amount of liquid manure that the machine can pro-cess in a given amount of time. This is referred to as the “throughput” of the unit. Some units have a relatively low throughput and must be operated for a long time. Another very important factor is the TS content required by the given machine. Centrifuges and presses can operate at a higher TS level than can static screens.

10–35(210–VI–AWMFH, Amend. 31, August 2009)
Part 651Agricultural Waste Management Field Handbook
Agricultural Waste Management System Component Design
Chapter 10
Figure 10–24 Schematic of mechanical solid-liquid separators
4
3
6
2
5
5
Liquid
Solid Fiber
Slurry
Liquid
2
4
1
3
5
123456
Slurry inputPolyester mesh beltPress rollersRotary brushBelt guide rollersLiquid collection trough
12345
Screening stageRoller pressing stageScreensSpring loaded press rollerBrushes
Flat belt separator Roller-press separator
1
5
2
Manure slurry
Screen
Effluent
Solids
Motor
Influent
Effluent
Screen
Solids
Vibrating screen separator Stationary inclined screen separator
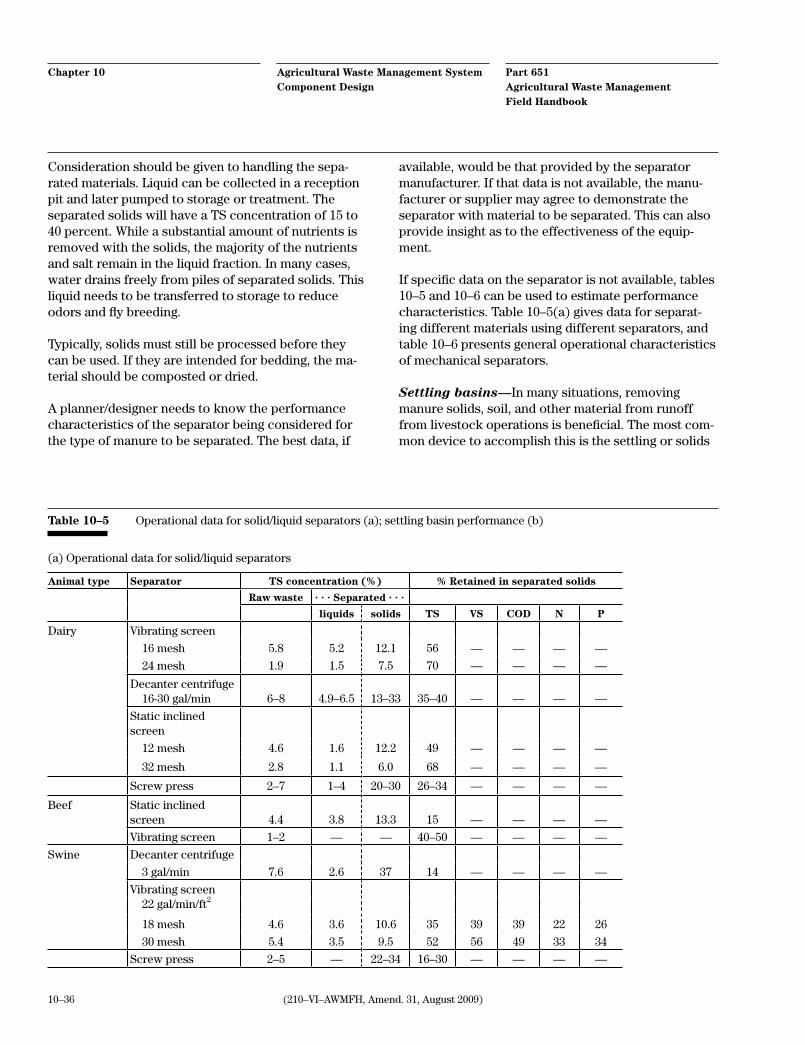
10–36 (210–VI–AWMFH, Amend. 31, August 2009)
Part 651Agricultural Waste Management Field Handbook
Agricultural Waste Management System Component Design
Chapter 10
Consideration should be given to handling the sepa-rated materials. Liquid can be collected in a reception pit and later pumped to storage or treatment. The separated solids will have a TS concentration of 15 to 40 percent. While a substantial amount of nutrients is removed with the solids, the majority of the nutrients and salt remain in the liquid fraction. In many cases, water drains freely from piles of separated solids. This liquid needs to be transferred to storage to reduce odors and fly breeding.
Typically, solids must still be processed before they can be used. If they are intended for bedding, the ma-terial should be composted or dried.
A planner/designer needs to know the performance characteristics of the separator being considered for the type of manure to be separated. The best data, if
available, would be that provided by the separator manufacturer. If that data is not available, the manu-facturer or supplier may agree to demonstrate the separator with material to be separated. This can also provide insight as to the effectiveness of the equip-ment.
If specific data on the separator is not available, tables 10–5 and 10–6 can be used to estimate performance characteristics. Table 10–5(a) gives data for separat-ing different materials using different separators, and table 10–6 presents general operational characteristics of mechanical separators.
Settling basins—In many situations, removing manure solids, soil, and other material from runoff from livestock operations is beneficial. The most com-mon device to accomplish this is the settling or solids
Animal type Separator TS concentration (%) % Retained in separated solids
Raw waste . . . Separated . . .
liquids solids TS VS COD N P
Dairy Vibrating screen
16 mesh 5.8 5.2 12.1 56 — — — —
24 mesh 1.9 1.5 7.5 70 — — — —
Decanter centrifuge 16-30 gal/min 6–8 4.9–6.5 13–33 35–40 — — — —
Static inclinedscreen
12 mesh 4.6 1.6 12.2 49 — — — —
32 mesh 2.8 1.1 6.0 68 — — — —
Screw press 2–7 1–4 20–30 26–34 — — — —
Beef Static inclined screen 4.4 3.8 13.3 15 — — — —
Vibrating screen 1–2 — — 40–50 — — — —
Swine Decanter centrifuge
3 gal/min 7.6 2.6 37 14 — — — —
Vibrating screen 22 gal/min/ft2
18 mesh 4.6 3.6 10.6 35 39 39 22 26
30 mesh 5.4 3.5 9.5 52 56 49 33 34
Screw press 2–5 — 22–34 16–30 — — — —
Table 10–5 Operational data for solid/liquid separators (a); settling basin performance (b)
(a) Operational data for solid/liquid separators
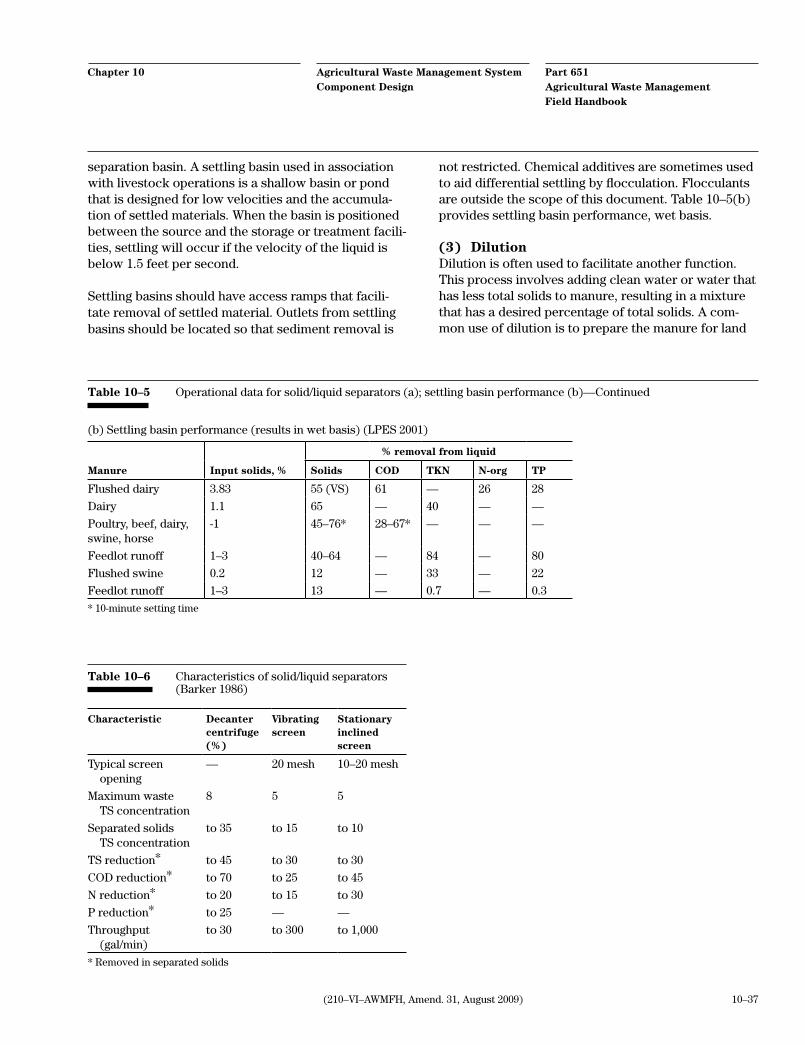
10–37(210–VI–AWMFH, Amend. 31, August 2009)
Part 651Agricultural Waste Management Field Handbook
Agricultural Waste Management System Component Design
Chapter 10
separation basin. A settling basin used in association with livestock operations is a shallow basin or pond that is designed for low velocities and the accumula-tion of settled materials. When the basin is positioned between the source and the storage or treatment facili-ties, settling will occur if the velocity of the liquid is below 1.5 feet per second.
Settling basins should have access ramps that facili-tate removal of settled material. Outlets from settling basins should be located so that sediment removal is
Characteristic Decanter centrifuge (%)
Vibrating screen
Stationary inclined screen
Typical screen opening
— 20 mesh 10–20 mesh
Maximum waste TS concentration
8 5 5
Separated solids TS concentration
to 35 to 15 to 10
TS reduction* to 45 to 30 to 30
COD reduction* to 70 to 25 to 45
N reduction* to 20 to 15 to 30
P reduction* to 25 — —
Throughput (gal/min)
to 30 to 300 to 1,000
* Removed in separated solids
Table 10–6 Characteristics of solid/liquid separators (Barker 1986)
Table 10–5 Operational data for solid/liquid separators (a); settling basin performance (b)—Continued
* 10-minute setting time
% removal from liquid
Manure Input solids, % Solids COD TKN N-org TP
Flushed dairy 3.83 55 (VS) 61 — 26 28
Dairy 1.1 65 — 40 — —
Poultry, beef, dairy, swine, horse
-1 45–76* 28–67* — — —
Feedlot runoff 1–3 40–64 — 84 — 80
Flushed swine 0.2 12 — 33 — 22
Feedlot runoff 1–3 13 — 0.7 — 0.3
(b) Settling basin performance (results in wet basis) (LPES 2001)
not restricted. Chemical additives are sometimes used to aid differential settling by flocculation. Flocculants are outside the scope of this document. Table 10–5(b) provides settling basin performance, wet basis.
(3) DilutionDilution is often used to facilitate another function. This process involves adding clean water or water that has less total solids to manure, resulting in a mixture that has a desired percentage of total solids. A com-mon use of dilution is to prepare the manure for land

Part 651Agricultural Waste Management Field Handbook
Agricultural Waste Management System Component Design
Chapter 10
10–38 (210–VI–AWMFH, Amend. 31, August 2009)
application using a sprinkler system. Figure 10–25 is a design aid for determining the amount of clean dilu-tion water required to lower the TS concentration.
(b) Secondary treatment
Secondary treatment includes biological and chemi-cal treatment such as composting, lagoons, oxidation ditches, and vegetative treatment areas. This addition-al treatment step reduces the pollution potential prior to land application by reducing the nutrient contents of the material. Secondary treatment facilities should be planned and designed in accordance with the ap-plicable Conservation Practice Standards.
(1) Amendments for treatmentBiological and chemical additives are sometimes used to alter the characteristics of manure and other by-products of agricultural operations to facilitate secondary treatment. Use of these additives should be in accordance with the NRCS Conservation Practice Standard 591, Amendments for Treatment of Agricul-tural Waste.
(2) Anaerobic lagoonsAnaerobic lagoons are widely accepted in the United States for the treatment of manure. Anaerobic treat-ment of manure helps to protect water quality by reducing much of the organic concentration (BOD, COD) of the material. Anaerobic lagoons also reduce the nitrogen content of the material through ammonia volatilization and effectively reduce manure odors if the lagoon is managed properly. Anaerobic lagoons should be planned and designed in accordance with NRCS Conservation Practice Standard 359, Waste Treatment Lagoon.
Design—The maximum operating level of an anaero-bic lagoon is a volume requirement plus a depth re-quirement. The volume requirement is the sum of the following volumes:
• minimumtreatmentvolume,ft3 (MTV)
• manurevolume,wastewatervolume,andcleanwater, ft3 (WV)
• sludgevolume,ft3 (SV)
Figure 10–25 Design aid to determine quantity of water to add to achieve a desired TS concentration (USDA 1975)
22
3
4
5
6
789
10
Per
cen
t so
lid
s re
sult
ing
20
30
40
3 4 5 6 7 8 9 10
Gallons of water to add per cubic foot of material
15 20 25 30 40 50 60 70 80
454030
2520
15
10
Percent solids in manure

10–39(210–VI–AWMFH, Amend. 31, August 2009)
Part 651Agricultural Waste Management Field Handbook
Agricultural Waste Management System Component Design
Chapter 10
Figure 10–26 Anaerobic lagoon cross section
Volume of accumulated sludgefor period between sludge removal events (SV)
Depth of normal precipitation less evaporation on the lagoonsurface accumulated during the treatment period
Depth of 25-year, 24-hour storm event on lagoon surface
Volume of manure, wastewater, and cleanwater accumulated
during the treatment period (WSV)
Note: The minimum treatment volume for an anaerobic waste treatment lagoon is based on volatile solids.
6 ft
min
. Minimum treatment volume (MTV)
Max
. dr
awdo
wn
Crest of spillwayor other outflowdevice (wherepermissible)Max. operating
level
Required volume
Freeboard (1.0 min.)
The depth requirement is the normal precipitation less evaporation on the lagoon surface.
Polluted runoff from a watershed must not be included in a lagoon unless a defensible estimate of the volatile solid loading can be made. Runoff from a watershed, such as a feedlot, is not included in a lagoon because loading would only result during storm events and be-cause the magnitude of the loading would be difficult, if not impossible, to estimate. As a result, the lagoon would be shocked with an overload of volatile solids.
If an automatic outflow device, pipe, or spillway is used, it must be placed at a height above the maximum operating level to accommodate the 25-year, 24-hour storm precipitation on the lagoon surface. This depth added to the maximum operating level of the lagoon establishes the level of the required volume or the outflow device, pipe, or spillway. A minimum of 1 foot of freeboard is provided above the outflow and estab-lishes the top of the embankment. Should State regu-lation preclude the use of an outflow device, pipe, or spillway or if for some other reason the lagoon will not have these, the minimum freeboard is 1 foot above the top of the required volume.
The combination of these volumes and depths is il-lustrated in figure 10–26. The terms and derivation are explained in the following paragraphs.
Anaerobic waste treatment lagoons are designed on the basis of volatile solids loading rate (VSLR) per 1,000 cubic feet. Volatile solids represent the amount of solid material in wastes that will decompose as op-posed to the mineral (inert) fraction. The rate of solids decomposition in anaerobic lagoons is a function of temperature; therefore, the acceptable VSLR varies from one location to another. Figure 10–27 indicates the maximum VSLRs for the United States. If odors need to be minimized, VSLR should be reduced by 25 to 50 percent.
The MTV represents the volume needed to maintain sustainable biological activity. The MTV for volatile solids (VS) can be determined using equation 10–4.
MTV
TVS
VSLR=
(eq. 10–4)
where:MTV = minimum treatment volume, ft3
TVS = total daily volatile solids loading (from all sources), lb/d
VSLR = volatile solids loading rate, lb/1,000 ft3/d (from fig. 10–27)
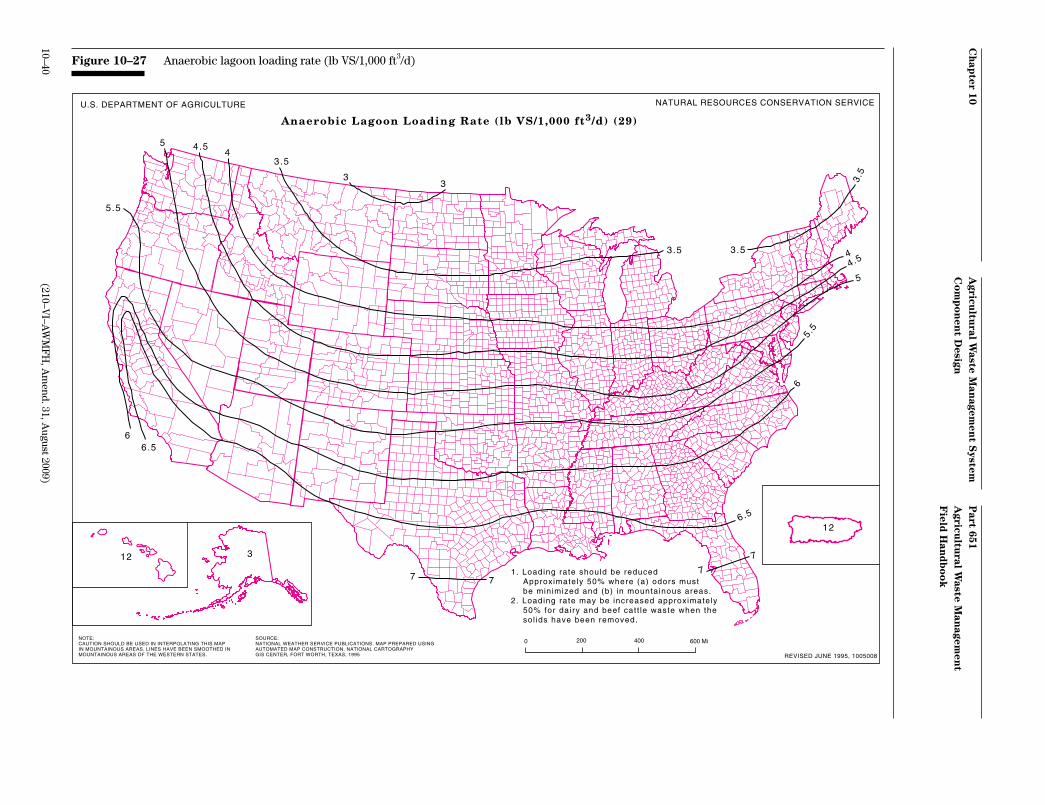
Part 651
Agricu
ltural W
aste Man
agemen
t F
ield H
and
bo
ok
Agricu
ltural W
aste Man
agemen
t System
C
om
po
nen
t Design
Ch
apter 10
10–40(210–V
I–AW
MF
H, A
mend. 31, A
ugust 2009)
Figure 10–27 Anaerobic lagoon loading rate (lb VS/1,000 ft3/d)
12033
12087
25001
26083
CT
DE
FL
U.S. DEPARTMENT OF AGRICULTURE NATURAL RESOURCES CONSERVATION SERVICE
NOTE:CAUTION SHOULD BE USED IN INTERPOLATING THIS MAPIN MOUNTAINOUS AREAS. LINES HAVE BEEN SMOOTHED INMOUNTAINOUS AREAS OF THE WESTERN STATES. REVISED JUNE 1995, 1005008
0 200 400 600 MiSOURCE:NATIONAL WEATHER SERVICE PUBLICATIONS. MAP PREPARED USINGAUTOMATED MAP CONSTRUCTION. NATIONAL CARTOGRAPHYGIS CENTER, FORT WORTH, TEXAS, 1995
7
6.5
6
77
5.5
5
4.54
3.5
3.53.5
33
3.54
4.55
5.5
6.56
12 3
12
1. Loading rate should be reduced Approximately 50% where (a) odors must be minimized and (b) in mountainous areas.2. Loading rate may be increased approximately 50% for dairy and beef cat t le waste when the sol ids have been removed.
Anaerobic Lagoon Loading Rate (lb VS/1,000 ft3/d) (29)
7

10D–5(210–VI–AWMFH, Amend. 31, August 2009)
Part 651Agricultural Waste Management Field Handbook
Appendix 10D Agricultural Waste Management System Component Design
Soil properties
Thepermeabilityofsoilsattheboundaryofawastestorage pond depends on several factors. The most importantfactorsarethoseusedinsoilclassificationsystemssuchastheUnifiedSoilClassificationSystem(USCS). The USCS groups soils into similar engineer-ingbehavioralgroups.Thetwomostimportantfactorsthatdetermineasoil’spermeabilityare:
• ThepercentageofthesamplewhichisfinerthantheNo.200sievesize,0.075millimeters.The USCS has the following important catego-riesofpercentagefines:
– Soilswithlessthan5percentfinesarethemostpermeablesoils.
– Soilswithbetween5and12percentfinesarenextinpermeability.
– Soilswithmorethan12percentfinesbutlessthan50percentfinesarenextinorderofpermeability.
– Soilswith50percentormorefinesaretheleastpermeable.
• Theplasticityindex(PI)ofsoilsisanotherparameter that strongly correlates with perme-ability.
Whenconsideredtogetherwithpercentfines,agroup-ingofsoilsintofourcategoriesofpermeabilityispossible.ThefollowinggroupingofsoilsisbasedontheexperienceofNRCSengineers.Itmaybeusedto classify soils at grade as an initial screening tool. Estimatingpermeabilityisdifficultbecausesomanyfactors determine the value for a soil. For in situ soils, thefollowingfactors,inadditiontopercentfinesandPI,affectthepermeabilityofthenaturalsoils:
• Thedrydensityofthenaturalsoilaffectsthepermeability.Soilswithlowerdrydensitieshave higher percentage of voids (porosity) than more dense soils.
• Structurestronglyaffectspermeability.Manyclay soils, particularly those with PI values above20,developablockystructurefromdesiccation.Theblockystructurecreatespref-erential flow paths that can cause soils to have anunexpectedlyhighpermeability.AlbrechtandBenson(2001)andDanielandWu(1993)
describetheeffectofdesiccationontheperme-abilityofcompactedclayliners.
• WhilenotconsideredintheUSCS,thechemicalcomposition of soils with clay content strongly affectspermeability.Soilswithapreponder-ance of calcium or magnesium ions on the clay particles often have a flocculated structure that causesthesoilstobemorepermeablethanexpectedbasedsimplyonpercentfinesandPI. Soils with a preponderance of sodium or potassium ions on the clay particles often have a dispersive structure that causes the soils to belesspermeablethansoilswithsimilarvaluesofpercentfinesandPI.TheNRCSpublicationTR–28,ClayMinerals,describesthisasfollows:
In clay materials, permeability is also in-fluenced to a large extent by the exchange-able ions present. If, for example, the Ca (calcium) ions in a montmorillonite are replaced by Na (sodium) ions, the per-meability becomes many times less than its original value. The replacement with sodium ions reduces the permeability in several ways. For one thing, the so-dium causes dispersion (disaggregation) reducing the effective particle size of the clay minerals. Another condition reduc-ing permeability is the greater thickness of water adsorbed on the sodium-saturat-ed montmorillonite surfaces which di-minishes the effective pore diameter and retards the movement of fluid water.
• Alluvialsoilsmayhavethinlaminationsofsiltor sand that cause them to have a much higher horizontalpermeabilitythanverticalperme-ability.Thispropertyistermedanisotropyandshouldbeconsideredinflownetanalysesofseepage.
• Othertypesofdepositsmayhavestructureresulting from their mode of deposition. Loess soilsoftenhaveahighverticalpermeabilityresultingfromtheirstructure.Glacialtillsmaycontainfissuresandcracksthatcausethemtohaveapermeabilityhigherthanmightbeexpectedbasedonlyontheirdensity,percentfinesandPIofthefines.
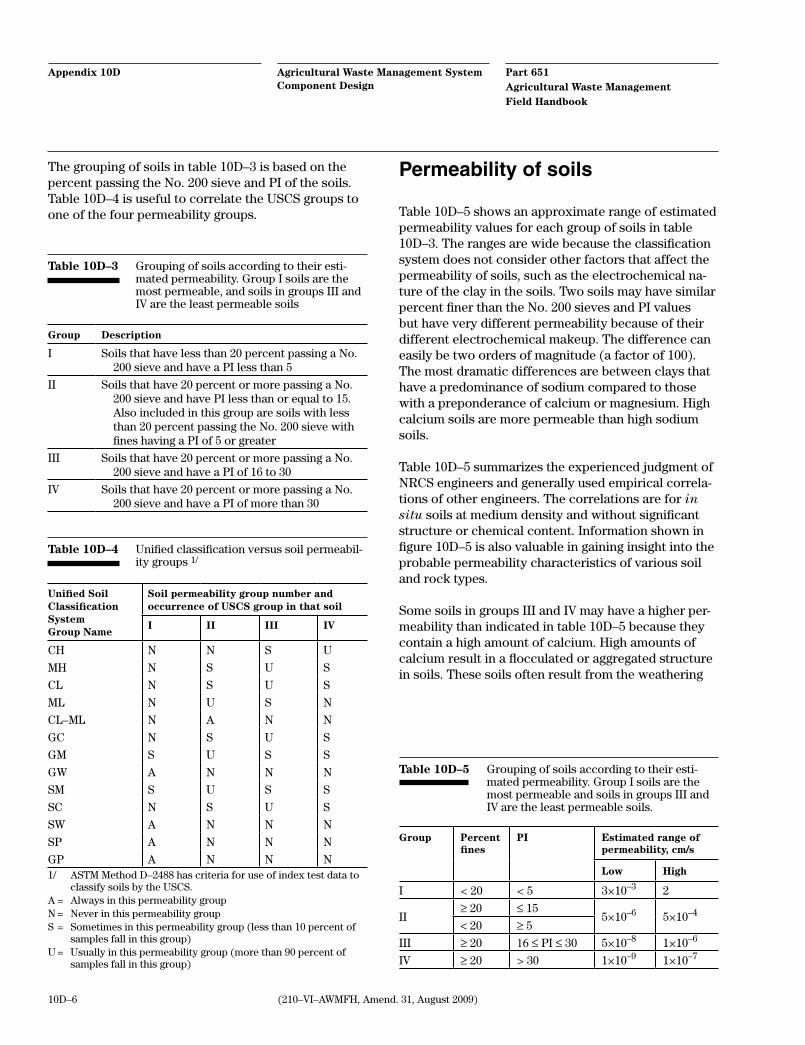
Part 651Agricultural Waste Management Field Handbook
Agricultural Waste Management System Component Design
Appendix 10D
10D–6 (210–VI–AWMFH, Amend. 31, August 2009)
Permeability of soils
Table10D–5showsanapproximaterangeofestimatedpermeabilityvaluesforeachgroupofsoilsintable10D–3.Therangesarewidebecausetheclassificationsystem does not consider other factors that affect the permeabilityofsoils,suchastheelectrochemicalna-ture of the clay in the soils. Two soils may have similar percentfinerthantheNo.200sievesandPIvaluesbuthaveverydifferentpermeabilitybecauseoftheirdifferentelectrochemicalmakeup.Thedifferencecaneasilybetwoordersofmagnitude(afactorof100).Themostdramaticdifferencesarebetweenclaysthathave a predominance of sodium compared to those with a preponderance of calcium or magnesium. High calciumsoilsaremorepermeablethanhighsodiumsoils.
Table10D–5summarizestheexperiencedjudgmentofNRCSengineersandgenerallyusedempiricalcorrela-tions of other engineers. The correlations are for in situsoilsatmediumdensityandwithoutsignificantstructure or chemical content. Information shown in figure10D–5isalsovaluableingaininginsightintotheprobablepermeabilitycharacteristicsofvarioussoilandrocktypes.
Some soils in groups III and IV may have a higher per-meabilitythanindicatedintable10D–5becausetheycontain a high amount of calcium. High amounts of calcium result in a flocculated or aggregated structure in soils. These soils often result from the weathering
Thegroupingofsoilsintable10D–3isbasedonthepercentpassingtheNo.200sieveandPIofthesoils.Table10D–4isusefultocorrelatetheUSCSgroupstooneofthefourpermeabilitygroups.
Table 10D–3 Groupingofsoilsaccordingtotheiresti-matedpermeability.GroupIsoilsarethemostpermeable,andsoilsingroupsIIIandIVaretheleastpermeablesoils
Group Description
I Soilsthathavelessthan20percentpassingaNo. 200 sieve and have a PI less than 5
II Soilsthathave20percentormorepassingaNo. 200 sieve and have PI less than or equal to 15. Also included in this group are soils with less than20percentpassingtheNo.200sievewith fineshavingaPIof5orgreater
III Soilsthathave20percentormorepassingaNo. 200sieveandhaveaPIof16to30
IV Soilsthathave20percentormorepassingaNo. 200 sieve and have a PI of more than 30
Unified SoilClassificationSystemGroup Name
Soil permeability group number and occurrence of USCS group in that soil
I II III IV
CH N N S U
MH N S U S
CL N S U S
ML N U S N
CL–ML N A N N
GC N S U S
GM S U S S
GW A N N N
SM S U S S
SC N S U S
SW A N N N
SP A N N N
GP A N N N1/ ASTMMethodD–2488hascriteriaforuseofindextestdatato
classifysoilsbytheUSCS.A= AlwaysinthispermeabilitygroupN= NeverinthispermeabilitygroupS= Sometimesinthispermeabilitygroup(lessthan10percentof
samples fall in this group)U= Usuallyinthispermeabilitygroup(morethan90percentof
samples fall in this group)
Table 10D–4 Unifiedclassificationversussoilpermeabil-ity groups 1/
Table 10D–5 Groupingofsoilsaccordingtotheiresti-matedpermeability.GroupIsoilsarethemostpermeableandsoilsingroupsIIIandIVaretheleastpermeablesoils.
Group Percent fines
PI Estimated range of permeability, cm/s
Low High
I < 20 < 5 3×10⁻³ 2
II≥ 20 ≤ 15
5×10⁻⁶ 5×10⁻⁴
< 20 ≥ 5III ≥ 20 16 ≤ PI ≤ 30 5×10⁻⁸ 1×10⁻⁶
IV ≥ 20 > 30 1×10⁻⁹ 1×10⁻⁷

10D–7(210–VI–AWMFH, Amend. 31, August 2009)
Part 651Agricultural Waste Management Field Handbook
Appendix 10D Agricultural Waste Management System Component Design
Figure 10D–5 Permeabilityofvariousgeologicmaterial(fromFreezeandCherry1979)
101 1 10-1 10-2 10-3 10-4 10-5 10-6 10-7 10-8
101 1 10-1 10-2 10-3 10-4 10-5 10-6 10-7 10-8
105 104 103 102 101 1 10-1 10-2 10-3 10-4
104 103 102 101 1 10-1 10-2 10-3 10-4 10-5
105 104 103 102 101 1 10-1 10-2 10-3 10-4 10-5ft3/ft2/d (ft/d)
cm3/cm2/s (cm/s)
ft3/ft2/min (ft/min)
m3/m2/day (m/d)
gal/ft2/d (gal/ft2/d)
relative permeability
Representative materials
Very high High Moderate Low Very low
Clean gravel(GP)
Soiltypes
Rocktypes
Clean sand, clean sandand gravel mixes (GW,GP, SW, SP, SM)
Cavernous and karst limestonesand dolomites, permeable basalts
Limestones, dolomites,clean sandstones
Interbedded sandstones,siltstones, and shales
Most massiverocks, unfracturedand unweathered
Fine sand, silty sandand gravel mixes (SP, SM,GM, GW–GM, GP–GM,SW–SM, SP–SM)
Any soil mass with joints, cracks or other macroporosity
Fractured igneous and metamorphic rocks
Silt, clay, and sand-silt-clay mixes, organic silts,organic clays (GM, GC,SM, SC, MH, ML, ML–CL,OL, OH, GW–GC, GC–GM,SW-SC, SP–SC, SC–SM)
Massive clay, nosoil joints orother macropores(CL, CH)
ofhighcalciumparentrock,suchaslimestone.Soilscientistsandpublishedsoilsurveysarehelpfulinidentifying these soil types.
Highcalciumclaysshouldusuallybemodifiedwithsoildispersantstoachievethetargetpermeabilitygoals.Dispersants,suchastetrasodiumpolyphos-phate, can alter the flocculated structure of these soils byreplacementofthecalciumwithsodium.Becausemanure contains salts, it can aid in dispersing the structureofthesesoils,butdesignshouldnotrelyonmanure as the only additive for these soil types.
SoilsingroupIVusuallyhaveaverylowpermeability.However,becauseoftheirsometimesblockystruc-ture,causedbydesiccation,highseepagelossescan
occurthroughcracksthatcandevelopwhenthesoilis allowed to dry. These soils possess good attenua-tion properties if the seepage does not move through cracksinthesoilmass.Soilswithextensivedesicca-tioncracksshouldbedisked,watered,andrecom-pacted to destroy the structure in the soils to provide anacceptablepermeability.Thedepthofthetreatmentrequiredshouldbebasedondesignguidancegiveninthe section Construction considerations for com-pacted clay liners.
HighplasticitysoilslikethoseingroupIVshouldbeprotectedfromdesiccationintheinterimperiodbetweenconstructionandfillingthepond.Pondswithintermittent storage should also consider protection for high PI liners in their design.
Part 651Agricultural Waste Management Field Handbook
Agricultural Waste Management System Component Design
Appendix 10D
10D–8 (210–VI–AWMFH, Amend. 31, August 2009)
In situ soils with acceptable permeability
Forscreeningpurposes,NRCSengineershavedeter-minedthatiftheboundariesofaplannedpondareunderlainonthesidesandbottombothbyaminimumthicknessofnaturalsoilinpermeabilitygroupsIIIor IV, the seepage from those ponds is generally low enough to cause no degradation of ground water. This assumes that soils do not have a flocculated structure. Unless State regulations or other requirements dictate a more conservative method of limiting seepage, it isthepositionofNRCSthatspecialdesignmeasuresgenerally are not necessary where agricultural waste storage ponds or treatment lagoons are constructed in these soils, provided that:
• atleast2feetofnaturalsoilingroupsIIIorIVoccurbelowthebottomandsidesofthelagoon
• thesoilsarenotflocculated(highcalcium)
• nohighlyunfavorablegeologicconditions,suchaskarstformations,occuratthesite
• theplanneddepthofstorageislessthan15feet
Pondswithmorethan15feetofliquidshouldbeevalu-atedbymoreprecisemethods.Ifthepermeabilityandthicknessofhorizonsbeneathastructureareknown,thepredictedseepagequantitiesmaybeestimatedmore precisely. In some cases, even though a site is underlainby2feetofnaturallylowpermeabilitysoil,anacceptablylowseepageratesatisfactoryforsomeStaterequirementscannotbedocumented.Inthosecases, more precise testing and analyses are suggest-ed. The accumulation of manure can provide a further decreaseintheseepagerateofpondsbyupto1orderof magnitude as noted previously. If regulations permit considering this reduction, a lower predicted seepage canbeassumedbydesigners.
Definition of pond liner
Compacted clay liner—Compacted clay liners are relatively impervious layers of compacted soil used toreduceseepagelossestoanacceptablelevel.Alinerforawasteimpoundmentcanbeconstructedinseveral ways. When soil alone is used as a liner, it is oftencalledaclayblanketorimperviousblanket.A
simple method of providing a liner for a waste storage structure is to improve a layer of the soils at the exca-vatedgradebydisking,watering,andcompactingthesoiltoathicknessindicatedbyguidelinesinfollowingsections. Compaction is often the most economical methodforconstructinglinersifsuitablesoilsareavailablenearbyorifsoilsexcavatedduringconstruc-tionofthepondcanbereusedtomakeacompactedliner.Soilswithsuitablepropertiescanmakeexcellentliners,butthelinersmustbedesignedandinstalledcorrectly.Soilhasanaddedbenefitinthatitprovidesan attenuation medium for many types of pollutants. NRCSConservationPracticeStandard(CPS)521D,Pond Sealing or Lining Compacted Clay Treatment, addresses general design guidance for compacted clay liners for ponds.
Iftheavailablesoilscannotbecompactedtoadensityandwatercontentthatwillproduceanacceptablylowpermeability,severaloptionsareavailable,anddescribedinthefollowingsection.Theoptionsinvolvesoiladditivestoimprovethepermeabilityofthesoilsand adding liners constructed of materials other than natural soils.
Treat the soil at grade with bentonite or a soil dispersant—Designersmustbeawareofwhichamendmentisappropriateforaddingtospecificsoilsatasite.Inthepast,bentonitehasbeeninappropri-ately used to treat clay soils and soil dispersants have inappropriatelybeenusedtotreatsandswithasmallclay content.
Thefollowingguidelinesarehelpfulandshouldbeclosely followed.
• Whentousebentonite—Soils in groups I and IIhaveunacceptablyhighpermeabilitybecausetheycontainaninsufficientquantityofclayorthe clay in the soils is less active than required. AusefulruleofthumbisthatsoilsamenablefortreatmentwithbentonitewillhavePIvaluesless than 7, or they will have less than 30 per-centfinerthantheNo.200sieve,orboth.
Bentonite is essentially a highly concentrated clayproductthatcanbeaddedinsmallquanti-tiestoasandorslightlyplasticsilttomakeitrelativelylowinpermeability.CPS521C,PondSealing or Lining Bentonite Treatment, covers thispractice.NRCSsoilmechanicslaboratorieshave found it important to use the same type

10D–9(210–VI–AWMFH, Amend. 31, August 2009)
Part 651Agricultural Waste Management Field Handbook
Appendix 10D Agricultural Waste Management System Component Design
andqualityofbentoniteplannedforconstruc-tioninthelaboratorypermeabilitytestsusedtodesignthesoil-bentonitemixture.Boththequalityofthebentoniteandhowfinelygroundtheproductisbeforemixingwiththesoilwillstronglyaffectthefinalpermeabilityrateofthemixture.Itisimportanttoworkcloselywithboththebentonitesupplierandthesoiltestingfacility when designing treated soil liners.
• When to use soil dispersants—Soils in groupsIIIandIVmayhaveunacceptablyhighpermeabilitybecausetheycontainaprepon-derance of calcium or magnesium on the clay particles.Unfortunately,fieldorlabteststodeterminewhensoilsarelikelytohavethisproblemarenotavailable.Highcalciumsoilsoften occur when parent materials have exces-sive calcium. Many soils developed from weath-ering of limestone and gypsum may have this problem.SeethesectionDesignandconstruc-tion of clay liners treated with soil dispersants, for more detail. Some States require the routine useofsoildispersantsinareasthatareknownto have high calcium clay soils.
Use of concrete or synthetic materials such as geomembranes and geosynthetic clay liners (GCLs)—Concrete has advantages and disadvantages for use as a liner. A disadvantage is that it will not flex to conform to settlement or shifting of the earth. In ad-dition,someconcreteaggregatesmaybesusceptibletoattackbycontinuedexposuretochemicalscon-tainedinorgeneratedbythewaste.Anadvantageis
that concrete serves as an excellent floor from which to scrape solids. It also provides a solid support for equipment such as tractors or loaders.
GeomembranesandGCLsarethemostimpervioustypes of liners if designed and installed correctly. Caremustbeexercisedbothduringconstructionand operation of the waste impoundment to prevent punctures and tears. The most common defects in theselinersarisefromproblemsduringconstruction.Formingseamsinthefieldforgeomembranescanrequirespecialexpertise.GCLshavetheadvantageofnotrequiringfieldseaming,butoverlapisrequiredtoprovideasealattheseams.Geomembranesmustcontainultravioletinhibitorsifexposedtosunlight.Designsshouldincludeprovisionforprotectionfromdamage during cleaning operations. Concrete pads, doubleliners,andsoilcoveringareexamplesofpro-tectivemeasures.Figure10D–6showsanagriculturalwastestoragefacilitywithageomembranelinerwithultravioletinhibitors.
When a liner should be considered
Aconstructedlinermayberequiredifanyofthecon-ditions listed are present at a planned impoundment.
Proposed impoundment is located where any underlying aquifer is at a shallow depth and not confined and/or the underlying aquifer is a do-mestic or ecologically vital water supply—State or local regulations may prevent locating a waste storage impoundmentwithinaspecifieddistancefromsuchfeatures.Evenifthepondbottomandsidesareunder-lainby2feetofnaturallylowpermeabilitysoil,ifthedepth of liquid in the pond is high enough, computed seepagelossesmaybegreaterthanacceptable.Thehighest level of investigation and design is required onsiteslikethosedescribed.Thiswillensurethatseepage will not degrade aquifers at shallow depth or aquifers that are of vital importance as domestic water sources.
Excavation boundary of an impoundment is un-derlain by less than 2 feet of suitably low perme-ability soil, or an equivalent thickness of soil with commensurate permeability, over bedrock—Bedrockthatisnearthesoilsurfaceisoftenfracturedorjointedbecauseofweatheringandstressrelief.
Figure 10D–6 Agricultural waste storage impoundment linedwithageomembrane(Photo credit NRCS)
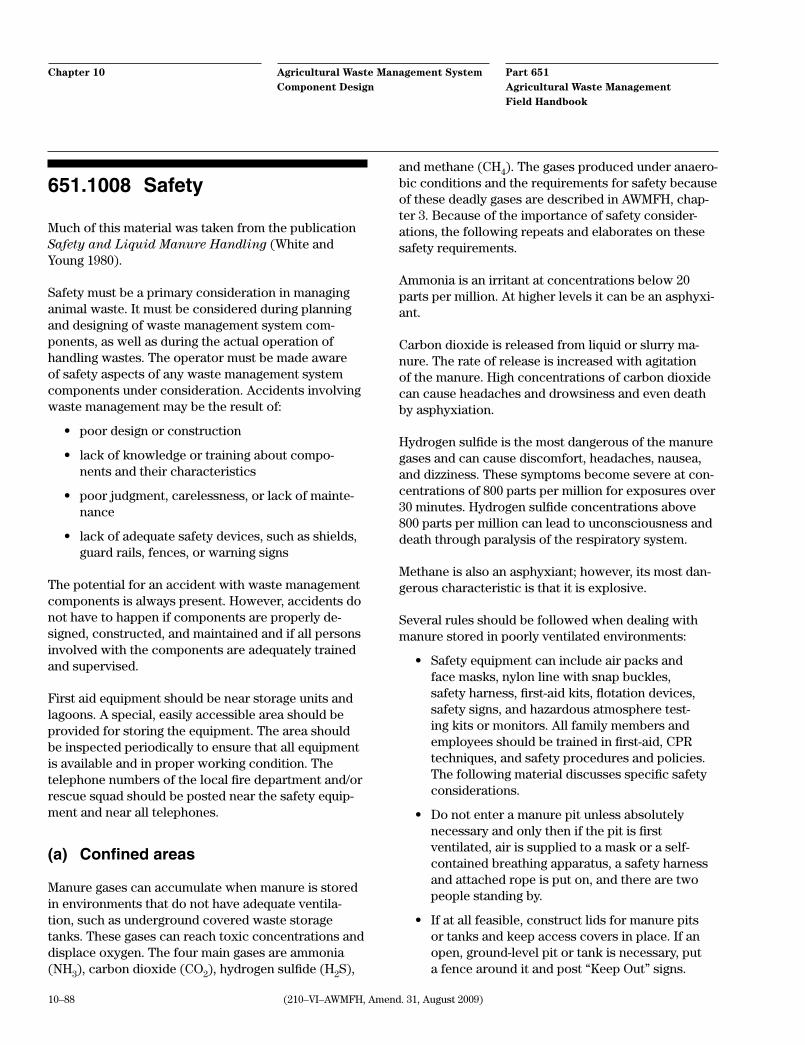
Part 651Agricultural Waste Management Field Handbook
Agricultural Waste Management System Component Design
Chapter 10
10–88 (210–VI–AWMFH, Amend. 31, August 2009)
651.1008 Safety
Much of this material was taken from the publication Safety and Liquid Manure Handling (White and Young 1980).
Safety must be a primary consideration in managing animal waste. It must be considered during planning and designing of waste management system com-ponents, as well as during the actual operation of handling wastes. The operator must be made aware of safety aspects of any waste management system components under consideration. Accidents involving waste management may be the result of:
• poordesignorconstruction
• lackofknowledgeortrainingaboutcompo-nents and their characteristics
• poorjudgment,carelessness,orlackofmainte-nance
• lackofadequatesafetydevices,suchasshields,guard rails, fences, or warning signs
The potential for an accident with waste management components is always present. However, accidents do not have to happen if components are properly de-signed, constructed, and maintained and if all persons involved with the components are adequately trained and supervised.
First aid equipment should be near storage units and lagoons. A special, easily accessible area should be provided for storing the equipment. The area should be inspected periodically to ensure that all equipment is available and in proper working condition. The telephone numbers of the local fire department and/or rescue squad should be posted near the safety equip-ment and near all telephones.
(a) Confined areas
Manure gases can accumulate when manure is stored in environments that do not have adequate ventila-tion, such as underground covered waste storage tanks. These gases can reach toxic concentrations and displace oxygen. The four main gases are ammonia (NH3), carbon dioxide (CO2), hydrogen sulfide (H2S),
and methane (CH4). The gases produced under anaero-bic conditions and the requirements for safety because of these deadly gases are described in AWMFH, chap-ter 3. Because of the importance of safety consider-ations, the following repeats and elaborates on these safety requirements.
Ammonia is an irritant at concentrations below 20 parts per million. At higher levels it can be an asphyxi-ant.
Carbon dioxide is released from liquid or slurry ma-nure. The rate of release is increased with agitation of the manure. High concentrations of carbon dioxide can cause headaches and drowsiness and even death by asphyxiation.
Hydrogen sulfide is the most dangerous of the manure gases and can cause discomfort, headaches, nausea, and dizziness. These symptoms become severe at con-centrations of 800 parts per million for exposures over 30 minutes. Hydrogen sulfide concentrations above 800 parts per million can lead to unconsciousness and death through paralysis of the respiratory system.
Methane is also an asphyxiant; however, its most dan-gerous characteristic is that it is explosive.
Several rules should be followed when dealing with manure stored in poorly ventilated environments:
• Safetyequipmentcanincludeairpacksandface masks, nylon line with snap buckles, safety harness, first-aid kits, flotation devices, safety signs, and hazardous atmosphere test-ing kits or monitors. All family members and employees should be trained in first-aid, CPR techniques, and safety procedures and policies. The following material discusses specific safety considerations.
• Donotenteramanurepitunlessabsolutelynecessary and only then if the pit is first ventilated, air is supplied to a mask or a self-contained breathing apparatus, a safety harness and attached rope is put on, and there are two people standing by.
• Ifatallfeasible,constructlidsformanurepitsor tanks and keep access covers in place. If an open, ground-level pit or tank is necessary, put a fence around it and post “Keep Out” signs.
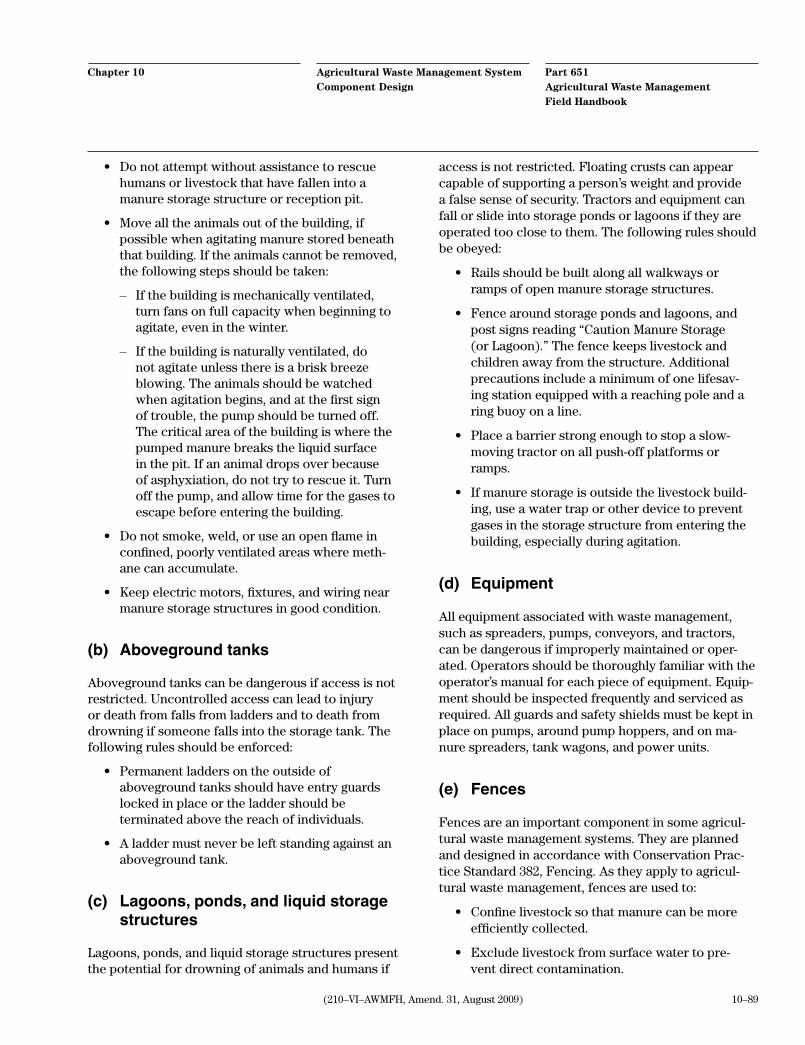
10–89(210–VI–AWMFH, Amend. 31, August 2009)
Part 651Agricultural Waste Management Field Handbook
Agricultural Waste Management System Component Design
Chapter 10
• Donotattemptwithoutassistancetorescuehumans or livestock that have fallen into a manure storage structure or reception pit.
• Movealltheanimalsoutofthebuilding,ifpossible when agitating manure stored beneath that building. If the animals cannot be removed, the following steps should be taken:
– If the building is mechanically ventilated, turn fans on full capacity when beginning to agitate, even in the winter.
– If the building is naturally ventilated, do not agitate unless there is a brisk breeze blowing. The animals should be watched when agitation begins, and at the first sign of trouble, the pump should be turned off. The critical area of the building is where the pumped manure breaks the liquid surface in the pit. If an animal drops over because of asphyxiation, do not try to rescue it. Turn off the pump, and allow time for the gases to escape before entering the building.
• Donotsmoke,weld,oruseanopenflameinconfined, poorly ventilated areas where meth-ane can accumulate.
• Keepelectricmotors,fixtures,andwiringnearmanure storage structures in good condition.
(b) Aboveground tanks
Aboveground tanks can be dangerous if access is not restricted. Uncontrolled access can lead to injury or death from falls from ladders and to death from drowning if someone falls into the storage tank. The following rules should be enforced:
• Permanentladdersontheoutsideofaboveground tanks should have entry guards locked in place or the ladder should be terminated above the reach of individuals.
• Aladdermustneverbeleftstandingagainstanaboveground tank.
(c) Lagoons, ponds, and liquid storage structures
Lagoons, ponds, and liquid storage structures present the potential for drowning of animals and humans if
access is not restricted. Floating crusts can appear capable of supporting a person’s weight and provide a false sense of security. Tractors and equipment can fall or slide into storage ponds or lagoons if they are operated too close to them. The following rules should be obeyed:
• Railsshouldbebuiltalongallwalkwaysorramps of open manure storage structures.
• Fencearoundstoragepondsandlagoons,andpost signs reading “Caution Manure Storage (or Lagoon).” The fence keeps livestock and children away from the structure. Additional precautions include a minimum of one lifesav-ing station equipped with a reaching pole and a ring buoy on a line.
• Placeabarrierstrongenoughtostopaslow-moving tractor on all push-off platforms or ramps.
• Ifmanurestorageisoutsidethelivestockbuild-ing, use a water trap or other device to prevent gases in the storage structure from entering the building, especially during agitation.
(d) Equipment
All equipment associated with waste management, such as spreaders, pumps, conveyors, and tractors, can be dangerous if improperly maintained or oper-ated. Operators should be thoroughly familiar with the operator’s manual for each piece of equipment. Equip-ment should be inspected frequently and serviced as required. All guards and safety shields must be kept in place on pumps, around pump hoppers, and on ma-nure spreaders, tank wagons, and power units.
(e) Fences
Fences are an important component in some agricul-tural waste management systems. They are planned and designed in accordance with Conservation Prac-tice Standard 382, Fencing. As they apply to agricul-tural waste management, fences are used to:
• Confinelivestocksothatmanurecanbemoreefficiently collected.
• Excludelivestockfromsurfacewatertopre-vent direct contamination.