Part 1 – Combustion Optimization - Lehigh University
20
COMPREHENSIVE APPROACH TO PERFORMANCE IMPROVEMENT AND EMISSIONS REDUCTION ON A 400 MW TANGENTIALLY-FIRED BOILER 1 : PART 1 – COMBUSTION OPTIMIZATION Carlos E. Romero, Nenad Sarunac, and Harun Bilirgen Energy Research Center Lehigh University, Bethlehem, Pennsylvania 18015 610-758-5780 John Bokowski and Michael Cilinski Bridgeport Generating Station Bridgeport, Connecticut ABSTRACT Combustion optimization of a pulverized coal-fired boiler is a complex process requiring in-depth knowledge of combustion, operation of boiler firing system and other factors affecting emissions and unit performance. For best results, combustion tuning needs to be performed before combustion optimization tests are conducted. Also any, site-specific, operating constraints, such as high CO or opacity, need to be mitigated or removed. Slagging and sootblowing are important parameters that also need to be considered while performing combustion optimization since they affect steam temperatures, boiler and unit operation, performance and emissions. A comprehensive approach to performance improvement and emissions reduction of a tangentially-fired unit is described in this paper. Technical approach to combustion tuning and combustion optimization and achieved results are described and discussed on Part 1 of the paper. Part 2 deals with Electrostatic Precipitator (ESP) performance improvement and sootblowing optimization. INTRODUCTION Comprehensive approach to performance improvement and emissions reduction of a utility boiler, involving combustion tuning and combustion optimization, sootblowing optimization and removal of operating constraints, is needed to achieve best results. Combustion optimization of a pulverized coal-fired boiler is a complex process, requiring in-depth knowledge of a combustion process in a utility boiler, operation of the firing system, and other factors affecting emissions and performance. Combustion tuning is performed by manipulating burner settings until a more uniform air and fuel distribution is achieved between the burners. A back- end multi-point gas extraction grid is typically used to provide information on spatial stratifications in CO, excess O 2 and NO x over the economizer gas exit duct. Slagging, fouling and sootblowing are important parameters that need to be considered while performing combustion optimization. This is because they affect steam temperatures and 1 Prepared for Presentation at the 30 th International Technical Conference on Coal Utilization and Fuel Systems, April 2005, Clearwater, Florida.
-
Upload
khangminh22 -
Category
Documents
-
view
1 -
download
0
Transcript of Part 1 – Combustion Optimization - Lehigh University

COMPREHENSIVE APPROACH TO PERFORMANCE IMPROVEMENT AND EMISSIONS REDUCTION ON A 400 MW TANGENTIALLY-FIRED
BOILER1: PART 1 – COMBUSTION OPTIMIZATION
Carlos E. Romero, Nenad Sarunac, and Harun Bilirgen Energy Research Center
Lehigh University, Bethlehem, Pennsylvania 18015
610-758-5780
John Bokowski and Michael Cilinski Bridgeport Generating Station
Bridgeport, Connecticut ABSTRACT Combustion optimization of a pulverized coal-fired boiler is a complex process requiring in-depth knowledge of combustion, operation of boiler firing system and other factors affecting emissions and unit performance. For best results, combustion tuning needs to be performed before combustion optimization tests are conducted. Also any, site-specific, operating constraints, such as high CO or opacity, need to be mitigated or removed. Slagging and sootblowing are important parameters that also need to be considered while performing combustion optimization since they affect steam temperatures, boiler and unit operation, performance and emissions. A comprehensive approach to performance improvement and emissions reduction of a tangentially-fired unit is described in this paper. Technical approach to combustion tuning and combustion optimization and achieved results are described and discussed on Part 1 of the paper. Part 2 deals with Electrostatic Precipitator (ESP) performance improvement and sootblowing optimization. INTRODUCTION Comprehensive approach to performance improvement and emissions reduction of a utility boiler, involving combustion tuning and combustion optimization, sootblowing optimization and removal of operating constraints, is needed to achieve best results. Combustion optimization of a pulverized coal-fired boiler is a complex process, requiring in-depth knowledge of a combustion process in a utility boiler, operation of the firing system, and other factors affecting emissions and performance. Combustion tuning is performed by manipulating burner settings until a more uniform air and fuel distribution is achieved between the burners. A back-end multi-point gas extraction grid is typically used to provide information on spatial stratifications in CO, excess O2 and NOx over the economizer gas exit duct. Slagging, fouling and sootblowing are important parameters that need to be considered while performing combustion optimization. This is because they affect steam temperatures and
1 Prepared for Presentation at the 30th International Technical Conference on Coal Utilization and Fuel Systems, April 2005, Clearwater, Florida.
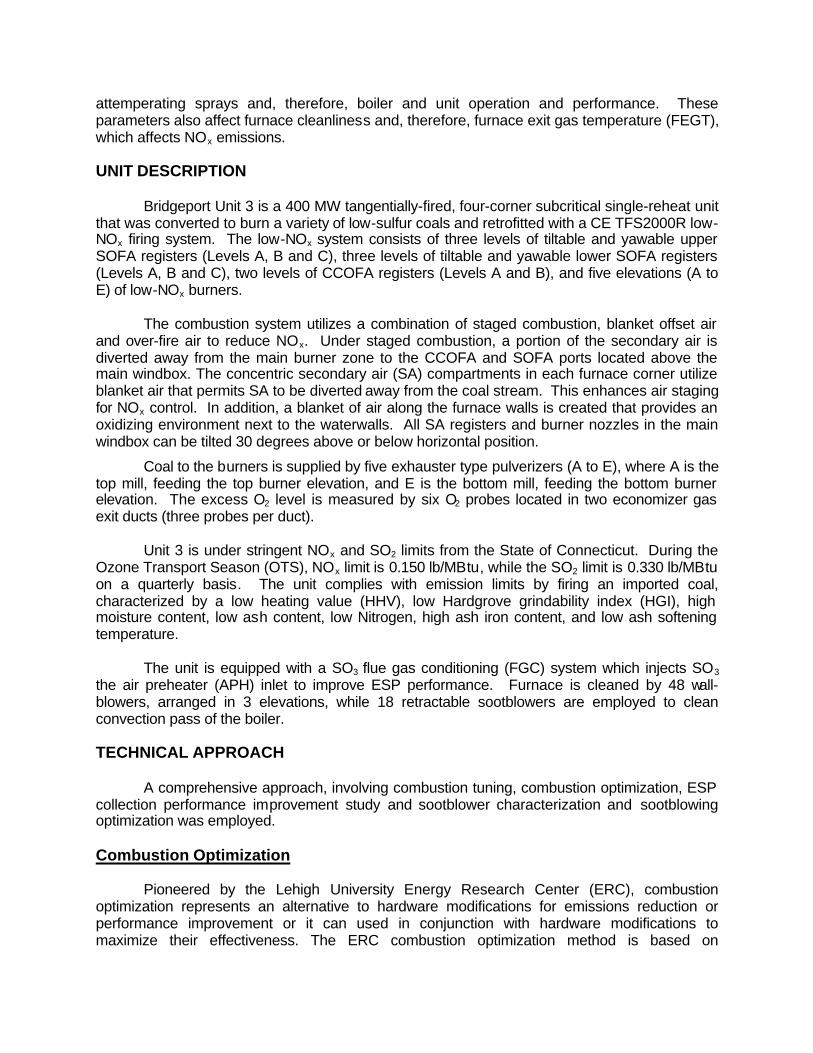
attemperating sprays and, therefore, boiler and unit operation and performance. These parameters also affect furnace cleanliness and, therefore, furnace exit gas temperature (FEGT), which affects NOx emissions. UNIT DESCRIPTION Bridgeport Unit 3 is a 400 MW tangentially-fired, four-corner subcritical single-reheat unit that was converted to burn a variety of low-sulfur coals and retrofitted with a CE TFS2000R low-NOx firing system. The low-NOx system consists of three levels of tiltable and yawable upper SOFA registers (Levels A, B and C), three levels of tiltable and yawable lower SOFA registers (Levels A, B and C), two levels of CCOFA registers (Levels A and B), and five elevations (A to E) of low-NOx burners. The combustion system utilizes a combination of staged combustion, blanket offset air and over-fire air to reduce NOx. Under staged combustion, a portion of the secondary air is diverted away from the main burner zone to the CCOFA and SOFA ports located above the main windbox. The concentric secondary air (SA) compartments in each furnace corner utilize blanket air that permits SA to be diverted away from the coal stream. This enhances air staging for NOx control. In addition, a blanket of air along the furnace walls is created that provides an oxidizing environment next to the waterwalls. All SA registers and burner nozzles in the main windbox can be tilted 30 degrees above or below horizontal position.
Coal to the burners is supplied by five exhauster type pulverizers (A to E), where A is the top mill, feeding the top burner elevation, and E is the bottom mill, feeding the bottom burner elevation. The excess O2 level is measured by six O2 probes located in two economizer gas exit ducts (three probes per duct). Unit 3 is under stringent NOx and SO2 limits from the State of Connecticut. During the Ozone Transport Season (OTS), NOx limit is 0.150 lb/MBtu, while the SO2 limit is 0.330 lb/MBtu on a quarterly basis. The unit complies with emission limits by firing an imported coal, characterized by a low heating value (HHV), low Hardgrove grindability index (HGI), high moisture content, low ash content, low Nitrogen, high ash iron content, and low ash softening temperature. The unit is equipped with a SO3 flue gas conditioning (FGC) system which injects SO3 the air preheater (APH) inlet to improve ESP performance. Furnace is cleaned by 48 wall-blowers, arranged in 3 elevations, while 18 retractable sootblowers are employed to clean convection pass of the boiler. TECHNICAL APPROACH A comprehensive approach, involving combustion tuning, combustion optimization, ESP collection performance improvement study and sootblower characterization and sootblowing optimization was employed. Combustion Optimization Pioneered by the Lehigh University Energy Research Center (ERC), combustion optimization represents an alternative to hardware modifications for emissions reduction or performance improvement or it can used in conjunction with hardware modifications to maximize their effectiveness. The ERC combustion optimization method is based on

modifications to the boiler control settings with the objective to achieve the desired optimization goal, such as: target NOx level, best performance, or lowest mercury emissions, while satisfying imposed operating, performance and environmental constraints. To date, combustion optimization has been applied at more than 150 power plants in the U.S. to minimize emissions and optimize unit performance. Due to a large number of boiler control parameters that are typically involved in a combustion optimization process, manual determination of optimal boiler control settings is typically not possible. A systematic approach, consisting of parametric field tests, correlation of test data using artificial neural networks (ANNs), and determination of optimal boiler settings by a mathematical optimization algorithm, is needed. Based on more than ten-year experience with combustion optimization of utility boilers, the ERC has developed a practical procedure for combustion optimization that is based on a deep understanding of the underlying physics (combustion process in a PC-fired boiler and factors affecting it). The ERC combustion optimization approach is divided into the seven steps as follows:
Step 1: Test Preparations Step 2: Combustion Tuning Step 3: Parametric Tests and Creation of Database Step 4: Correlation of Test Data Step 5: Determination of Optimal Boiler Control Settings Step 6: Implementation of Optimal Control Settings Step 7: Maintaining Optimal Control Settings
The steps in the ERC approach are described in detail in many technical papers, References [1 to 10]. Boiler OP An intelligent combustion optimization software Boiler OP was developed by the ERC and Potomac Electric Power Company (PEPCO) to automate creation of the database, correlation of test data, and determination of the optimal boiler control settings (Steps 3, 4 and 5). Boiler OP combines an expert system, neural networks and an optimization algorithm into a single program, running under Windows operating system. The code employs a graphical user interface which allows user to setup the code and model the specific boiler, select optimization goal and operating constraints, view optimization results, and perform trade-off studies. Details on Boiler OP can be found in References [11 to14]. Achieved Results The ERC combustion optimization approach and Boiler OP were used to optimize more than 30 utility boilers, tangentially- and wall-fired, ranging in size from 80 to 750 MW and firing eastern and western fuels, including PRB, fuel blends, including co-firing with fuel oil, natural gas and coke oven gas. Although NOx reduction represents traditional combustion optimization goal, ERC has also applied combustion optimization to improve unit performance, reduce slagging and minimize mercury emissions from fossil-fired utility boilers. The achieved results are the following:

1. NOx emissions reduction in the 5 to 35 percent range. 2. Performance improvement in the 50 to 120 Btu/kWh range. 3. Mercury emission reduction in the 30 to 80 percent range.
Steps in the ERC Combustion Optimization Approach Prior to beginning testing, it is important to conduct Step 1, i.e., inspect and calibrate instrumentation to ensure representative and accurate readings, inspect the boiler and combustion system to ensure burners, dampers and actuators are in a good mechanical condition, the coal pipe flows are balanced, and the mills are adjusted properly and are in a good state of maintenance. Combustion tuning (Step 2) is an important and necessary step, which maximizes benefits of the combustion optimization program. It involves balancing of air and fuel between individual burners, setting up the mills for best grind and, if necessary, balancing coal flow between the individual coal pipes. Parametric testing (Step 3) is performed after Steps 1 and 2 are completed. Parametric tests (Step 3) are conducted to build a database which relates the effect of boiler operating parameters on emissions and performance parameters such as NOx, CO, opacity, LOI, Hg, opacity, steam temperatures, desuperheating sprays and unit heat rate. Parametric tests are performed by varying one parameter at the time and keeping the remaining parameters fixed. This systematic approach provides information on the effect of each test parameter on emissions and performance. This is very helpful in understanding the complex relationships between boiler and burner control settings, emissions and unit heat rate and helpful when diagnosing combustion and emission-related problems. A reference or baseline test is conducted at the beginning of each test day. The purpose of the reference test is to establish a point of reference for comparisons, factor out any day-to-day variations caused by the fuel quality and slagging changes, and normalize test data. Combustion optimization relies on a data-based model describing the effect of boiler control settings on emissions, performance and other parameters of interest. In Step 4, the data-based model is created by using the data collected during parametric testing. Artificial neural networks (ANNs) are used to develop correlations between the boiler control settings, emissions, and performance parameters. Performance of the resulting ANN model is influenced significantly by the quality of the data used to create it. In developing ANN models using test data, it must be keep in mind that ANNs: (a) learn from the data, and (b) cannot distinguish the good data from the bad. Therefore, before creating an ANN model, it is important to remove outliers from the database since those could result in incorrect trends and decrease the overall ANN accuracy. After verifying the data, an ANN model is created by training it on a training data set. ANN predictions are verified for accuracy and trending using a verification data set. To create a good ANN model, it is crucial to perform a sufficient number of parametric tests over a range of boiler operating conditions that is considerably wider than the normal operating range. This is needed for two very important reasons: (a) to build good correlations between operating parameters, emissions and performance parameters, (b) to ensure the global optimum is included within the test range. A too narrow test range might not contain the global optimum. In such a case, the obtained “optimal settings” will represent the local, rather than the global optimum, and maximum combustion optimization benefit will not be achieved.
Once the ANN model is developed and tested, the optimal solution (a set of optimal boiler control parameters), satisfying optimization goal and imposed constraints, is obtained by employing a mathematical optimization algorithm (Step 5). The Nelder-Meade Downhill Simplex Method is used by the Boiler OP code. In the ERC approach options available for implementation of the optimal settings determined by the Boiler OP (Step 6) include:
! Open-Loop Operator Advisory, ! Program Optimal Settings into the Plant DCS, ! Closed-Loop Control for Key Operating Parameters.
In the open-loop advisory mode, Boiler OP is using real-time plant data to provide advice to the operator on the optimal settings and information on the emission and performance penalties for not operating at optimal settings. Alternatively, the optimal settings, obtained by Boiler OP, can be programmed into the plant DCS to provide automatic control. To deal with the daily variations in fuel quality and maintenance status of the combustion equipment, a closed-loop trim control for key operating parameters (such as, SOFA register opening or excess O2 level) can be implemented. In such arrangement, the value of a key parameter is modulated to maintain the desired NOx emission level. This provides a cost-effective alternative to a full closed-loop network control, where all boiler control parameters are incorporated in the closed-loop control strategy. As discussed above, determination of the optimal boiler control settings is a challenging task. Maintaining optimal settings on a long term (Step 7) can be equally challenging. For example, as the maintenance condition of a firing system degrades over time, CO emissions increase. This imposes a tighter operating constraint and forces the plant control system or a closed-loop neural network controller to select a higher optimal O2 level, degrading therefore, NOx reduction performance. Also, an increase in LOI, due to the degradation in mill performance, can result in increased opacity levels which, might result in higher NOx emissions. Although, the adaptive closed-loop neural network controllers can deal with the abovementioned changes, the result of such passive NOx control strategy is undesirable deterioration of NOx reduction performance. To deal with these changes, the ERC recommends a pro-active approach, which focuses on maintaining top performance of the boiler firing, milling and control systems. The ERC recommends periodic combustion tuning to maintain best performance of the firing system and minimize operating constraints, periodic coal fineness tests to track mill performance, and periodic fine-tuning of the control system. For best NOx reduction performance, the ERC also recommends inspection of the combustion hardware during the spring outage, followed by the combustion tuning before the start of the OTS. Combustion Tuning Combustion tuning was performed to reduce high CO levels, encountered during unit characterization and pre-outage tests. CO concentration was measured by traversing a gas sampling probe over a total of 24 points (8 x 3 grid) in each of the two economizer gas exit ducts (South and North). A portable gas analyzer was used to measure CO and excess O2 concentrations in the flue gas. Measured CO and O2 concentrations are presented in Figures 1a and 1b and 2a and 2b. The results indicate severe stratification in CO and O2 concentration in the upper North and upper South corners of both ducts.

0 3 6 9 12 15 18 21 24 27Distance [ft]
0
3
6
9
12
Dis
tanc
e[ft
]
82.6
27.3
27.3
46.3106.9111 .
9
106.9
106 .9
82.6 27.3
82.6
118 .9
North
Flue Gas AnalyzerAverage CO = 63 ppmAverage O2 = 3.17 %
CO DISTR IBUTIONAFTER COMBUSTION TUNINGNORTH SIDE
Plant InstrumentAverage CO = 21 ppmAverage O2 = 2.90 %
0 3 6 9 12 15 18 21 24 27Distance [ft]
0
3
6
9
12
Dis
tanc
e[ft
] 700.0 552.1
453.6404.3
207.1
10.010.0
108 .6
157.9
59.3
10.0
59.3
207.1
North
Flue Gas AnalyzerAverage CO = 210 ppmAverage O2 = 4.17 %
CO DISTR IBUTIONBEFORE COMBUSTION TUNINGNORH SIDE
Plant InstrumentAverage CO = 105 ppmAverage O2 = 3.10 %
0 3 6 9 12 15 18 21 24 27Distance [ft]
0
3
6
9
12
Dis
tanc
e[ft
]
24.124.1
24.124.6
24.6 2 4.1
15.1
14 .8
15.1
14.8
18.5
South
CO DISTRIBU TIONAFTER COMBUSTION TU NINGSOUTH SIDE
Flue Gas AnalyzerAverage CO = 20 ppmAverage O2 = 3.4 %
Plant InstrumentAverage CO = 21 ppmAverage O2 = 2.90 %
0 3 6 9 12 15 18 21 24 27Distance [ft]
0
3
6
9
12
Dis
tanc
e[ft
] 38.0 38.0
10.438.0
57.7
10.4
294.6
199.8
626.1
673.5
South
Flue Gas AnalyzerAverage CO = 187 ppmAverage O2 = 2.90 %
CO DISTRIBUTIONBEFORE COMBUSTION TUNINGSOUTH SIDE
Plant InstrumentAverage CO = 105 ppmAverage O2 = 3.10 %
0 3 6 9 12 15 18 21 24 27Distance [ft]
0
3
6
9
12
Dis
tanc
e[ft
]
3.6
2.9
2.02.93.33.3
3.3
2.8
3 .1 3 .6
3.1
3. 2
3.5
3.7
2.9
North
Flue Gas AnalyzerAverage CO = 63 ppmAverage O2 = 3.17 %
O2 DISTRIBUTIONAFTER COMBUSTION TUNINGNORTH SIDE
Plant InstrumentAverage CO= 21 ppmAverage O2 = 2.90 %
0 3 6 9 12 15 18 21 24 27Distance [ft]
0
3
6
9
12
Dis
tanc
e[ft
] 3.1 3.2
3.13.1
3.1 3.1
3.4
3.1
3.3
3.3
3 .3
3.3
3.73.1
South
O2 DISTRIBUTIONAFTER COMBUSTION TUNINGSOUTH SIDE
Flue Gas AnalyzerAverage CO = 20 ppmAverage O2 = 3.4 %
Plant InstrumentAverage CO = 21 ppmAverage O2 = 2.90 %
0 3 6 9 12 15 18 21 24 27Distance [ft]
0
3
6
9
12
Dis
tanc
e[ft
] 3.0
3.4
2.9
2. 9
3.0
2.6
2.9
3.0
2 .7
2.72.6
2.6
South
Flue Gas AnalyzerAverage CO = 187 ppmAverage O2 = 2.90 %
O2 DISTRIBUTIONBEFORE COMBUSTION TUNINGSOUTH SIDE
Plant InstrumentAverage CO= 105 ppmAverage O2 = 3.10 %
0 3 6 9 12 15 18 21 24 27Distance [ft]
0
3
6
9
12
Dis
tanc
e[ft
] 4.0 3.7
4.14.6
5.0
5.55.2
3.7
3.3
3.6
4.0
3.9
5.0
North
Flue Gas AnalyzerAverage CO = 210 ppmAverage O2 = 4.17 %
O2 DISTRIBUTIONBEFORE COMBUSTION TUNINGNORH SIDE
Plant InstrumentAverage CO = 105 ppmAverage O2 = 3.10 %
(a) (b) (c) (d)
Figure 1: Spatial Distribution in CO Before and After Combustion Tuning (a) (b) (c) (d)
Figure 2: Spatial Distribution in O2 Before and After Combustion Tuning

Based on these measurements and per ERC recommendation, the station personnel inspected rifflers in all coal pipes during the unit outage and replaced those that were severely damaged by erosion. Eroded rifflers resulted in uneven distribution of coal flow between the coal pipes. This imbalance in coal flow distribution is suspected to be the main reason for the severe spatial stratification in CO and O2 concentration, measured at the economizer gas outlet. A permanent flue gas sampling 8x4 grid was installed during the outage to allow for future combustion tuning. The permanent gas sampling grid was used after the unit outage to measure spatial variation in CO and O2 concentration over the economizer duct cross-section. Although, as a result of the improvement in the maintenance condition of the firing system during the unit outage, there was an overall improvement in measured CO and O2 stratification, a high CO pocket (400-1,000 ppm) still existed in the North-East corner of the North duct. In the South economizer duct, the CO was lower (70 –100 ppm). Combustion tuning was performed after unit outage. It involved modifications to the SA register settings at each of the four furnace corners, and manipulations of the SOFA register openings and SOFA yaws. Measured CO and O2 concentrations, after unit outage and boiler tuning are presented in Figures 1c and 1d and 2c and 2d. The results indicate very uniform CO and O2 concentrations in both the North and South economizer ducts. Also, the average CO levels, measured after boiler tuning, were significantly lower compared to the pre-outage values. This allowed lowering of the average excess O2 level without having adverse effect on CO emissions, which were maintained in the 40 ppm range. With lower O2, the full-load NOx emissions were reduced by 10 percent. This reduction in baseline NOx and CO emissions has maximized combustion optimization benefits. Also, with lower CO emissions, it was possible to remove biases and constraints implemented into combustion control system to compensate for high CO emissions. Bias for windbox-to-furnace differential pressure (∆Pwb) was removed, which allowed operation at lower ∆Pwb values, further lowering NOx emissions. Also, with lower CO, it was possible to raise SOFA tilts and achieve additional NOx reduction. Previously, due to the high CO, SOFA tilts were locked in horizontal position. Combustion Optimization Results The objectives of the Bridgeport combustion optimization study included the following:
• Determine baseline NOx levels at full-load, reduced load (4-mill operation) and minimum load conditions.
• Characterize the unit in terms of emissions and performance. • Determine optimal combinations of boiler control settings at full-load conditions for a
range of target NOx, emissions levels below 0.150 lb/MBtu, resulting in minimum unit heat rate, subject to the CO and opacity emissions constraints.
• Determine improved boiler operating settings for 4-mill operation, for various mill firing configurations, and for minimum-load.
Determination of optimal boiler control settings over a range of target NOx levels at full-load conditions is important to Bridgeport because it allows optimum operation at aggressive NOx
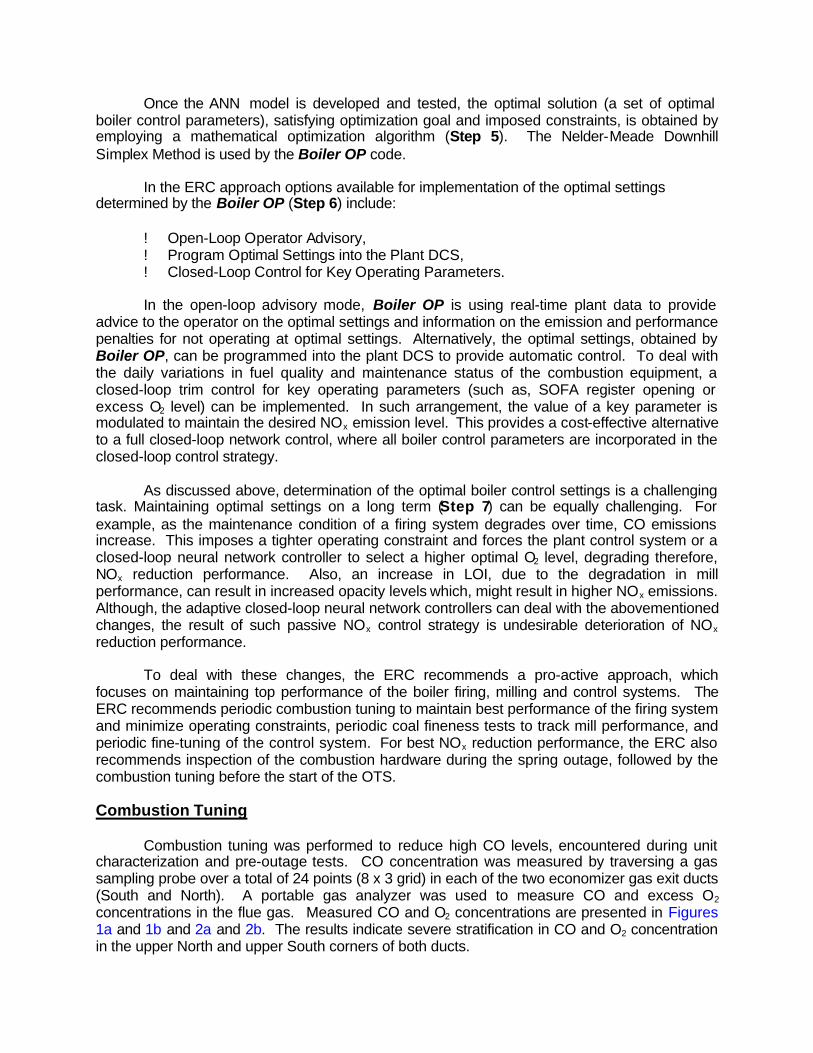
levels during the OTS, when trading of emission allowances is financially beneficial, and also optimum unit operation at higher NOx emission levels for the rest of the year. Full-Load Operation Table1 provides a summary of key boiler operating parameters for a tangentially-fired boiler and the parameters tested and optimized at Bridgeport. The CCOFA register and the top mill bias were partially tested, using the maximum bias available in the firing control system. However, these two parameters had a negligible effect on NOx and were, therefore, not included into combustion optimization program. No information on primary air velocities was available for this unit and, therefore, the effect of this parameter was not tested.
Table 1 Key Operating Parameters for a Tangentially-Fired
Boiler and Parameters Tested and Optimized at Bridgeport
PARAMETER TESTED OPTIMIZED
Economizer O2 Yes Yes Windbox-to-Furnace Differential Pressure Yes Yes SOFA Register Opening and Bias Yes Yes Burner Tilt Angle Yes Yes SOFA Tilt Angle Yes Yes CCOFA Register Opening Partially No Mill Bias Partially No Primary Air Bias No No
Fifty-nine parametric and baseline tests were performed. For each test point, operating data were collected over a 15-minute time interval, once a steady state operation of the unit was achieved. Sootblowing was put on hold while parametric tests were performed to factor out its effect on steam temperatures. A combination of the data collected automatically by the pant data acquisition system (DAS) and manually collected data was used to create a database. Off-line data included fly ash carbon content (LOI), determined from the manually collected ash samples and calculated values of net unit heat rate. Changes in net unit heat rate with respect to baseline conditions were calculated using a heat and mass balance model of the unit and a differential heat rate method developed by the ERC. A database was created from the test results and used to determine baseline emission and performance characteristics of the unit and develop an ANN model of the unit. After verification, the ANN model was used in conjunction with the downhill simplex optimization algorithm to determine optimal boiler control settings over a range of target NOx emission levels. Before parametric tests were conducted, concerns were raised regarding the applicability of the combustion optimization approach to foreign coals and ultra-low-NOx emission levels. However, the results of this project showed that even under these extreme conditions the ERC combustion optimization approach worked well, producing relationships and trends between the emissions, performance, and boiler operating parameters that were the same as for the U.S. bituminous and sub-bituminous coals.
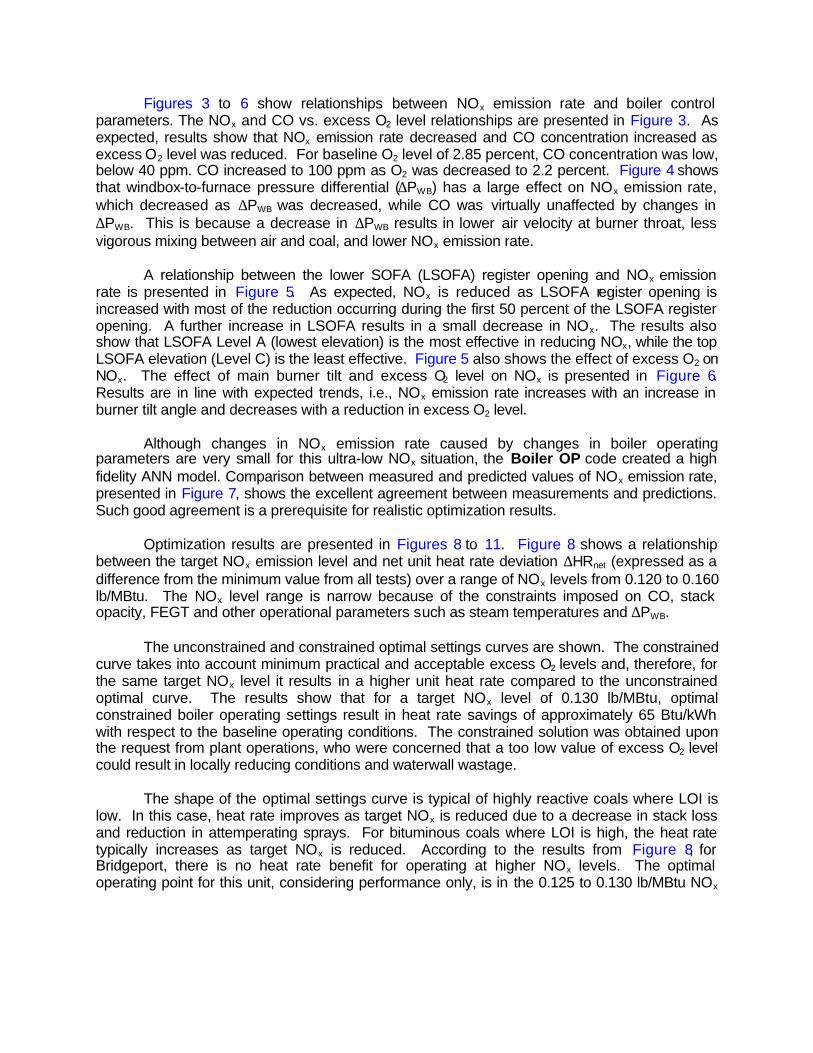
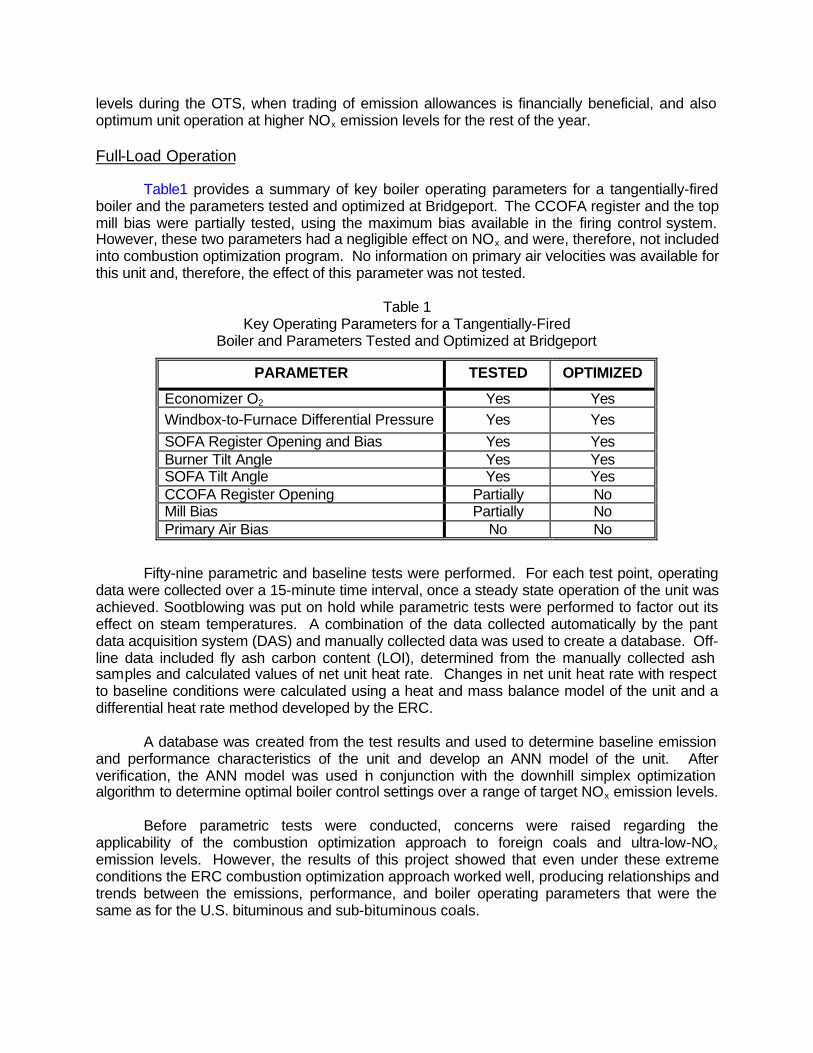
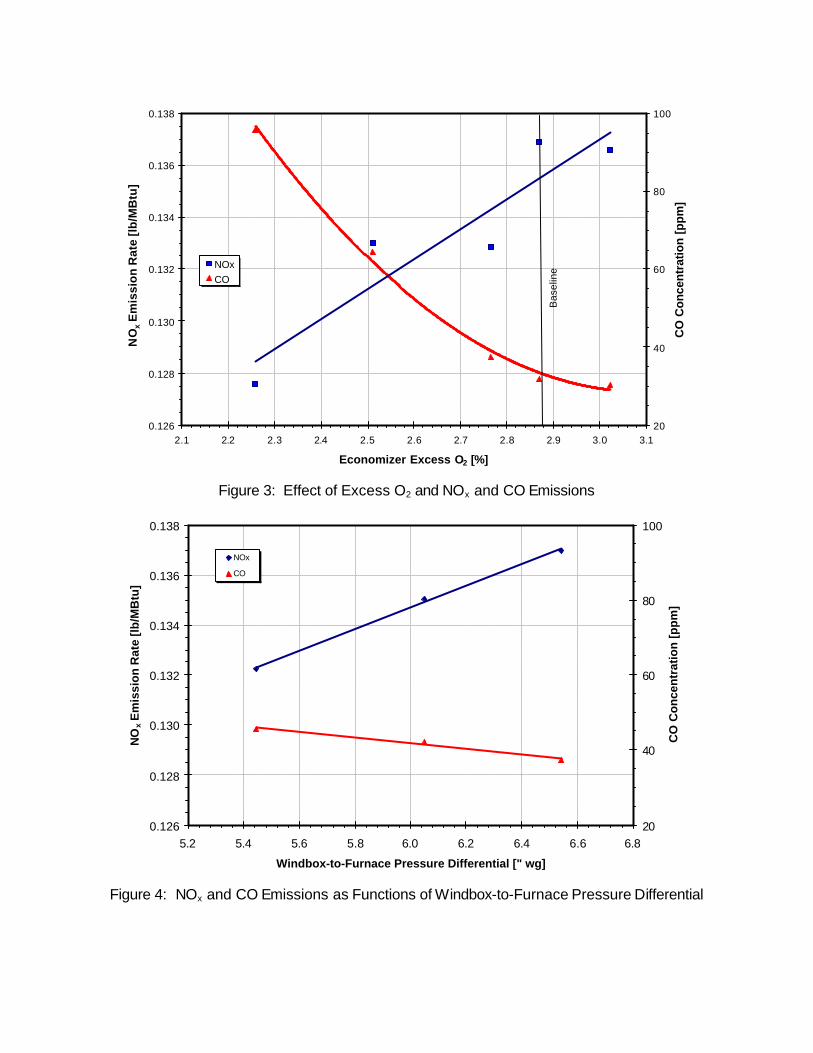
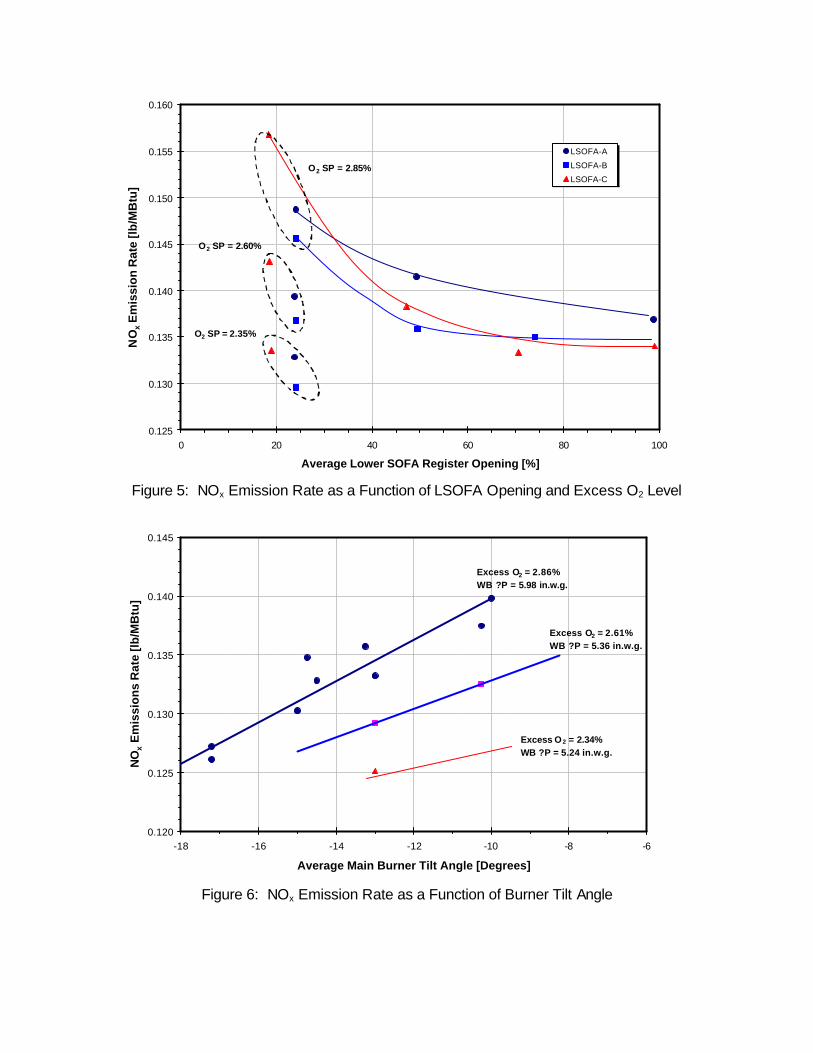
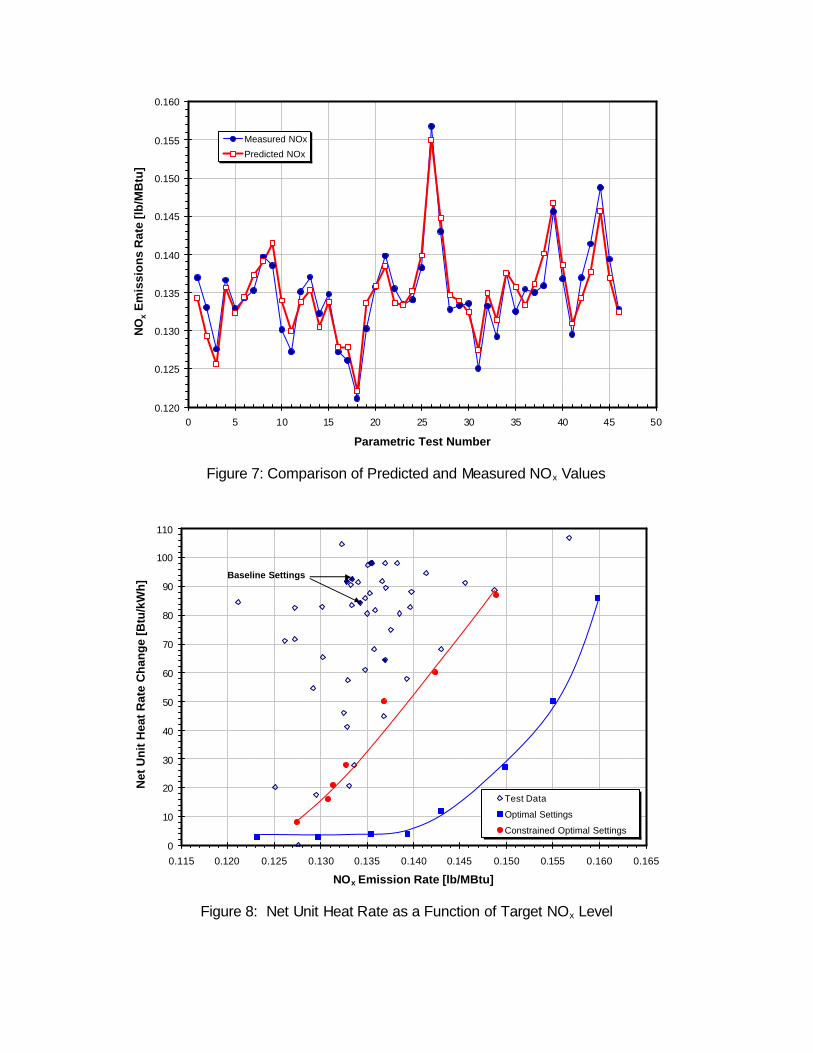
Figures 3 to 6 show relationships between NOx emission rate and boiler control parameters. The NOx and CO vs. excess O2 level relationships are presented in Figure 3. As expected, results show that NOx emission rate decreased and CO concentration increased as excess O2 level was reduced. For baseline O2 level of 2.85 percent, CO concentration was low, below 40 ppm. CO increased to 100 ppm as O2 was decreased to 2.2 percent. Figure 4 shows that windbox-to-furnace pressure differential (∆PWB) has a large effect on NOx emission rate, which decreased as ∆PWB was decreased, while CO was virtually unaffected by changes in ∆PWB. This is because a decrease in ∆PWB results in lower air velocity at burner throat, less vigorous mixing between air and coal, and lower NOx emission rate. A relationship between the lower SOFA (LSOFA) register opening and NOx emission rate is presented in Figure 5. As expected, NOx is reduced as LSOFA register opening is increased with most of the reduction occurring during the first 50 percent of the LSOFA register opening. A further increase in LSOFA results in a small decrease in NOx. The results also show that LSOFA Level A (lowest elevation) is the most effective in reducing NOx, while the top LSOFA elevation (Level C) is the least effective. Figure 5 also shows the effect of excess O2 on NOx. The effect of main burner tilt and excess O2 level on NOx is presented in Figure 6. Results are in line with expected trends, i.e., NOx emission rate increases with an increase in burner tilt angle and decreases with a reduction in excess O2 level. Although changes in NOx emission rate caused by changes in boiler operating parameters are very small for this ultra-low NOx situation, the Boiler OP code created a high fidelity ANN model. Comparison between measured and predicted values of NOx emission rate, presented in Figure 7, shows the excellent agreement between measurements and predictions. Such good agreement is a prerequisite for realistic optimization results. Optimization results are presented in Figures 8 to 11. Figure 8 shows a relationship between the target NOx emission level and net unit heat rate deviation ∆HRnet (expressed as a difference from the minimum value from all tests) over a range of NOx levels from 0.120 to 0.160 lb/MBtu. The NOx level range is narrow because of the constraints imposed on CO, stack opacity, FEGT and other operational parameters such as steam temperatures and ∆PWB. The unconstrained and constrained optimal settings curves are shown. The constrained curve takes into account minimum practical and acceptable excess O2 levels and, therefore, for the same target NOx level it results in a higher unit heat rate compared to the unconstrained optimal curve. The results show that for a target NOx level of 0.130 lb/MBtu, optimal constrained boiler operating settings result in heat rate savings of approximately 65 Btu/kWh with respect to the baseline operating conditions. The constrained solution was obtained upon the request from plant operations, who were concerned that a too low value of excess O2 level could result in locally reducing conditions and waterwall wastage. The shape of the optimal settings curve is typical of highly reactive coals where LOI is low. In this case, heat rate improves as target NOx is reduced due to a decrease in stack loss and reduction in attemperating sprays. For bituminous coals where LOI is high, the heat rate typically increases as target NOx is reduced. According to the results from Figure 8, for Bridgeport, there is no heat rate benefit for operating at higher NOx levels. The optimal operating point for this unit, considering performance only, is in the 0.125 to 0.130 lb/MBtu NOx
0.126
0.128
0.130
0.132
0.134
0.136
0.138
2.1 2.2 2.3 2.4 2.5 2.6 2.7 2.8 2.9 3.0 3.1
Economizer Excess O2 [%]
NO
x Em
issi
on
Rat
e [l
b/M
Btu
]
20
40
60
80
100
CO
Con
cent
ratio
n [p
pm]
NOxCO
Bas
elin
e
0.126
0.128
0.130
0.132
0.134
0.136
0.138
5.2 5.4 5.6 5.8 6.0 6.2 6.4 6.6 6.8
Windbox-to-Furnace Pressure Differential [" wg]
NO
x Em
issi
on
Rat
e [l
b/M
Btu
]
20
40
60
80
100
CO
Co
nce
ntr
atio
n [
pp
m]
NOx
CO
Figure 3: Effect of Excess O2 and NOx and CO Emissions
Figure 4: NOx and CO Emissions as Functions of Windbox-to-Furnace Pressure Differential
0.125
0.130
0.135
0.140
0.145
0.150
0.155
0.160
0 20 40 60 80 100
Average Lower SOFA Register Opening [%]
NO
x Em
issi
on
Rat
e [l
b/M
Btu
]
LSOFA-A
LSOFA-B
LSOFA-CO2 SP = 2.85%
O2 SP = 2.60%
O2 SP = 2.35%
0.120
0.125
0.130
0.135
0.140
0.145
-18 -16 -14 -12 -10 -8 -6
Average Main Burner Tilt Angle [Degrees]
NO
x E
mis
sio
ns
Rat
e [l
b/M
Btu
]
Excess O2 = 2.86%WB ?P = 5.98 in.w.g.
Excess O2 = 2.61%WB ?P = 5.36 in.w.g.
Excess O2 = 2.34%WB ?P = 5.24 in.w.g.
Figure 5: NOx Emission Rate as a Function of LSOFA Opening and Excess O2 Level
Figure 6: NOx Emission Rate as a Function of Burner Tilt Angle
0.120
0.125
0.130
0.135
0.140
0.145
0.150
0.155
0.160
0 5 10 15 20 25 30 35 40 45 50
Parametric Test Number
NO
x E
mis
sio
ns
Rat
e [l
b/M
Btu
]Measured NOx
Predicted NOx
0
10
20
30
40
50
60
70
80
90
100
110
0.115 0.120 0.125 0.130 0.135 0.140 0.145 0.150 0.155 0.160 0.165
NOx Emission Rate [lb/MBtu]
Net
Un
it H
eat
Rat
e C
han
ge
[Btu
/kW
h]
Test Data
Optimal Settings
Constrained Optimal Settings
Baseline Settings
Figure 7: Comparison of Predicted and Measured NOx Values
Figure 8: Net Unit Heat Rate as a Function of Target NOx Level
2.0
2.2
2.4
2.6
2.8
3.0
0.125 0.130 0.135 0.140 0.145 0.150
NOx Emission Rate [lb/MBtu]
Op
tim
al E
xces
s O
2 Le
vel [
%]
5.0
5.1
5.2
5.3
5.4
5.5
5.6
Win
db
ox-
to-F
urn
ace
Dif
fere
nti
al ["
wg
]Windbox-to-Furnace ∆P
Excess O2
20
40
60
80
100
0.125 0.130 0.135 0.140 0.145 0.150
NOx Emission Rate [lb/Mbtu]
Opt
imal
Low
er S
OFA
Reg
iste
r O
peni
ng [
%]
LSOFA - A
LSOFA - B
LSOFA - C
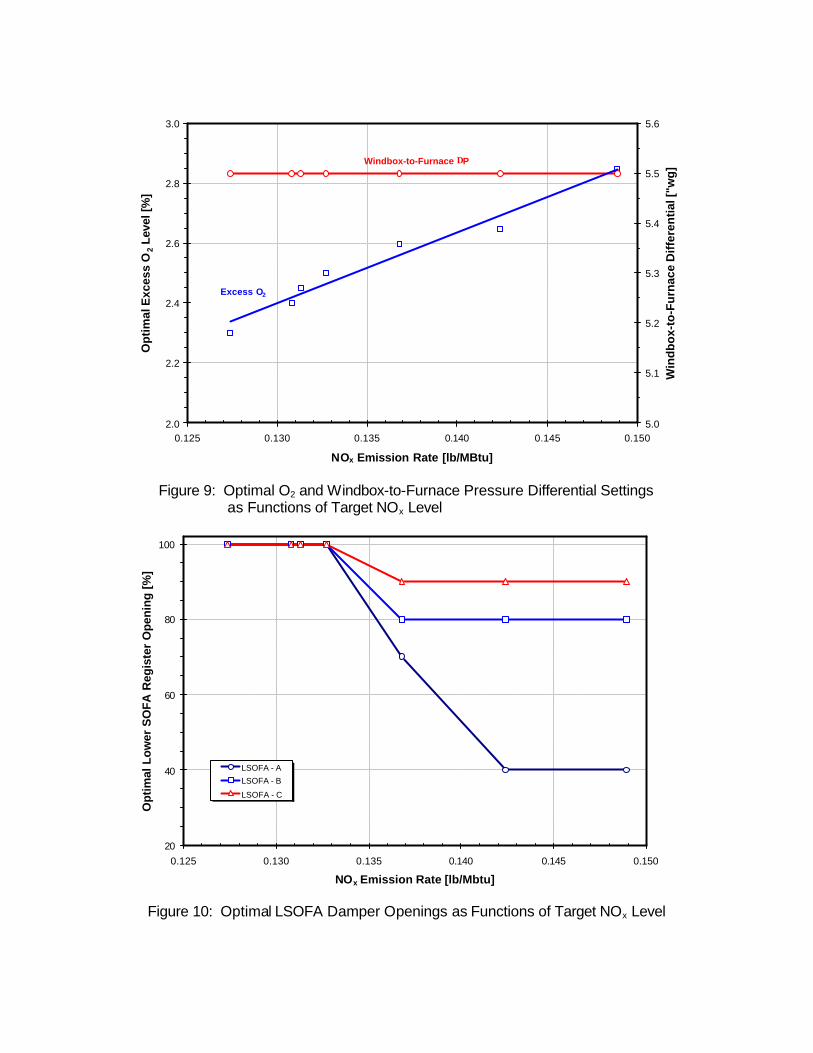
Figure 9: Optimal O2 and Windbox-to-Furnace Pressure Differential Settings as Functions of Target NOx Level
Figure 10: Optimal LSOFA Damper Openings as Functions of Target NOx Level
-14.0
-13.5
-13.0
-12.5
-12.0
-11.5
-11.0
0.125 0.130 0.135 0.140 0.145 0.150
NOx Emission Rate [lb/MBtu]
Op
tim
al B
urn
er T
ilt A
ng
le [D
eg]
6
8
10
12
14
16
18
Op
timal
SO
FA
Tilt
An
gle
[D
egre
es]
SOFA Tilt Angle
Burner Tilt Angle
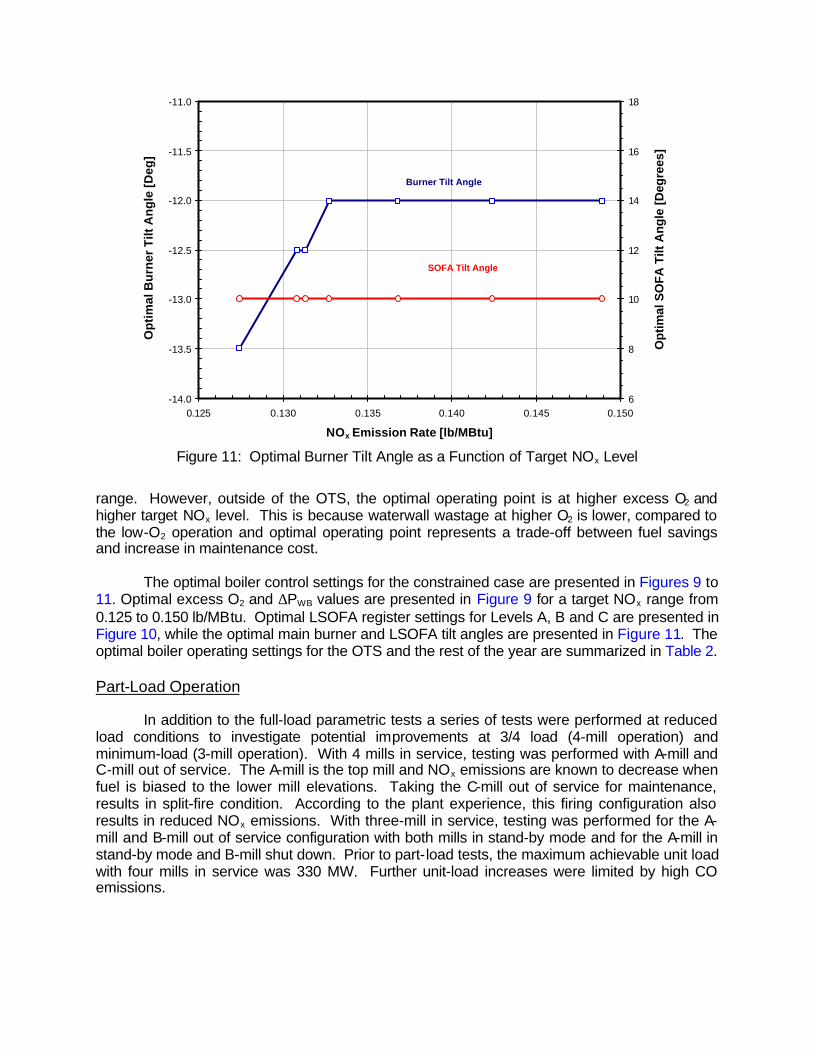
Figure 11: Optimal Burner Tilt Angle as a Function of Target NOx Level
range. However, outside of the OTS, the optimal operating point is at higher excess O2 and higher target NOx level. This is because waterwall wastage at higher O2 is lower, compared to the low-O2 operation and optimal operating point represents a trade-off between fuel savings and increase in maintenance cost. The optimal boiler control settings for the constrained case are presented in Figures 9 to 11. Optimal excess O2 and ∆PWB values are presented in Figure 9 for a target NOx range from 0.125 to 0.150 lb/MBtu. Optimal LSOFA register settings for Levels A, B and C are presented in Figure 10, while the optimal main burner and LSOFA tilt angles are presented in Figure 11. The optimal boiler operating settings for the OTS and the rest of the year are summarized in Table 2. Part-Load Operation In addition to the full-load parametric tests a series of tests were performed at reduced load conditions to investigate potential improvements at 3/4 load (4-mill operation) and minimum-load (3-mill operation). With 4 mills in service, testing was performed with A-mill and C-mill out of service. The A-mill is the top mill and NOx emissions are known to decrease when fuel is biased to the lower mill elevations. Taking the C-mill out of service for maintenance, results in split-fire condition. According to the plant experience, this firing configuration also results in reduced NOx emissions. With three-mill in service, testing was performed for the A-mill and B-mill out of service configuration with both mills in stand-by mode and for the A-mill in stand-by mode and B-mill shut down. Prior to part-load tests, the maximum achievable unit load with four mills in service was 330 MW. Further unit-load increases were limited by high CO emissions.
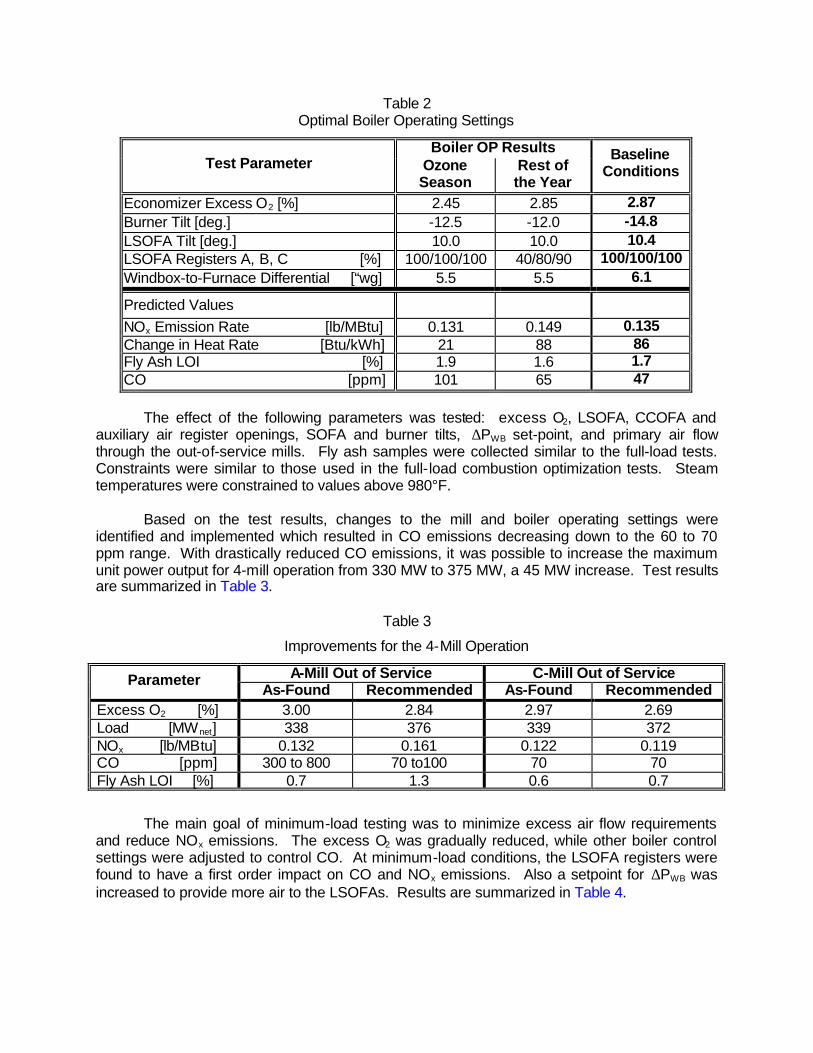
Table 2 Optimal Boiler Operating Settings
Boiler OP Results Test Parameter Ozone
Season Rest of the Year
Baseline Conditions
Economizer Excess O2 [%] 2.45 2.85 2.87 Burner Tilt [deg.] -12.5 -12.0 -14.8 LSOFA Tilt [deg.] 10.0 10.0 10.4 LSOFA Registers A, B, C [%] 100/100/100 40/80/90 100/100/100 Windbox-to-Furnace Differential [“wg] 5.5 5.5 6.1
Predicted Values
NOx Emission Rate [lb/MBtu] 0.131 0.149 0.135 Change in Heat Rate [Btu/kWh] 21 88 86 Fly Ash LOI [%] 1.9 1.6 1.7 CO [ppm] 101 65 47
The effect of the following parameters was tested: excess O2, LSOFA, CCOFA and auxiliary air register openings, SOFA and burner tilts, ∆PWB set-point, and primary air flow through the out-of-service mills. Fly ash samples were collected similar to the full-load tests. Constraints were similar to those used in the full-load combustion optimization tests. Steam temperatures were constrained to values above 980°F. Based on the test results, changes to the mill and boiler operating settings were identified and implemented which resulted in CO emissions decreasing down to the 60 to 70 ppm range. With drastically reduced CO emissions, it was possible to increase the maximum unit power output for 4-mill operation from 330 MW to 375 MW, a 45 MW increase. Test results are summarized in Table 3.
Table 3
Improvements for the 4-Mill Operation
A-Mill Out of Service C-Mill Out of Service Parameter As-Found Recommended As-Found Recommended
Excess O2 [%] 3.00 2.84 2.97 2.69 Load [MWnet] 338 376 339 372 NOx [lb/MBtu] 0.132 0.161 0.122 0.119 CO [ppm] 300 to 800 70 to100 70 70 Fly Ash LOI [%] 0.7 1.3 0.6 0.7
The main goal of minimum-load testing was to minimize excess air flow requirements and reduce NOx emissions. The excess O2 was gradually reduced, while other boiler control settings were adjusted to control CO. At minimum-load conditions, the LSOFA registers were found to have a first order impact on CO and NOx emissions. Also a setpoint for ∆PWB was increased to provide more air to the LSOFAs. Results are summarized in Table 4.

0
1
2
3
4
5
6
7
8
9
10
11
0 50 100 150 200 250 300 350 400 450
Unit Load (MW)
Eco
no
miz
er E
xces
s O
2 (%
)
0.000
0.020
0.040
0.060
0.080
0.100
0.120
0.140
0.160
NO
x E
mis
sio
ns
Rat
e (l
b/M
Btu
)
Actual O2 Curve
Biased O2 Curve
4-Mill OperationC-Mill O/S
3-Mill OperationA & B-Mill O/S
ACTUAL NO x
RECOMMENDED NO x
Table 4 Improvements for the 2-Mill Operation
Parameter As-Found Recommended PA on Both Mills
Recommended PA on A-Mill Only
LOSFAs A/B/C [%] 24/50/75 0/0/50 0/50/100 CCOFAs A/B [%] 30/0 0/0 0/0 ∆PWB [“wg] 3.1 2.8 2.9 Excess O2 [%] 7.60 5.23 5.76 Load [MW net] 146 144 142 NOx [lb/MBtu] 0.156 0.134 0.124 CO [ppm] 85 82 84 Stack Opacity [%] 7.5 5.9 6.1 Fly Ash LOI [%] 3.8 Not Collected 3.1
As shown in Table 4, the excess O2 was reduced from 7.6 percent to 5.2 - 5.8 percent range. NOx emissions were reduced from 0.156 to 0.134 and 0.124 lb/MBtu for the B-mill in stand-by mode and B-mill with no primary air (PA) mode, respectively (a 21 percent improvement). CO emissions remained the same, while stack opacity was improved. A comparison of the as-found and recommended O2 control curves and resulting NOx emissions over a range of unit loads is presented in Figure 12.
Figure 12: O2 Control Curve and NOx Emission Level as Functions of Unit Load
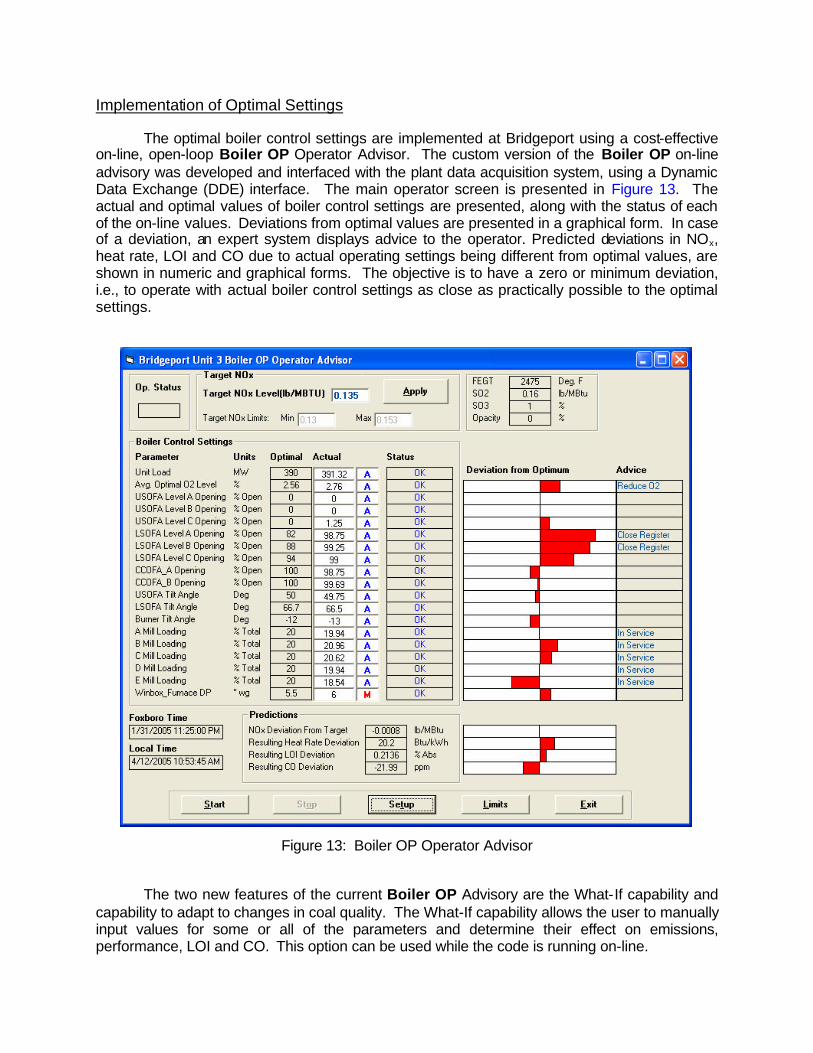
Implementation of Optimal Settings The optimal boiler control settings are implemented at Bridgeport using a cost-effective on-line, open-loop Boiler OP Operator Advisor. The custom version of the Boiler OP on-line advisory was developed and interfaced with the plant data acquisition system, using a Dynamic Data Exchange (DDE) interface. The main operator screen is presented in Figure 13. The actual and optimal values of boiler control settings are presented, along with the status of each of the on-line values. Deviations from optimal values are presented in a graphical form. In case of a deviation, an expert system displays advice to the operator. Predicted deviations in NOx, heat rate, LOI and CO due to actual operating settings being different from optimal values, are shown in numeric and graphical forms. The objective is to have a zero or minimum deviation, i.e., to operate with actual boiler control settings as close as practically possible to the optimal settings.
Figure 13: Boiler OP Operator Advisor The two new features of the current Boiler OP Advisory are the What-If capability and capability to adapt to changes in coal quality. The What-If capability allows the user to manually input values for some or all of the parameters and determine their effect on emissions, performance, LOI and CO. This option can be used while the code is running on-line.
Since fuel quality is variable at Bridgeport, an option was added to the Boiler OP Operator Advisory that allows variations in NOx due to changes in fuel quality to be taken into account when determining optimal operating conditions. CONCLUSIONS AND RECOMMENDATIONS Combustion optimization was performed by the ERC at Bridgeport Harbor Unit 3 during the months of November and December 2004, using the intelligent optimization code Boiler OP. The combustion optimization project included inspection of the unit, combustion tuning of the low-NOx firing system, parametric testing to create a database, building of an ANN model of the plant, determination of optimal control settings and development and implementation of the customized on-line open-loop Operator Advisory. This project was executed in combination with a sootblowing optimization project, also, performed by the ERC. Support for the project was provided by station engineers and Operations personnel. The following conclusions and recommendations were issued:
§ Average full-load baseline NOx emissions with five mills in service were found to be 0.135 lb/MBtu.
§ The key operating parameters, affecting NOx emissions at Bridgeport, in descending order of importance are: excess O2, LSOFA registers, burner and SOFA tilts and windbox-to-furnace differential pressure. NOx emissions were also found to be strongly sensitive to fuel quality, which is very variable at Bridgeport.
§ Unit heat rate was found to be strongly dependent on the excess O2 level and slightly dependent on the burner and LSOFA tilts and average LSOFA register opening.
§ Optimal constrained boiler control settings were developed for a range of target NOx emission levels by limiting minimum value of excess O2 level to avoid operation at extreme reducing environments in the furnace.
§ The shape of the optimal settings curve is typical of highly reactive coals where LOI is low. In this case, heat rate improves as target NOx is reduced due to a decrease in stack loss and reduction in attemperating sprays. The optimal operating point for this unit, considering performance only, is in the 0.125 to 0.130 lb/MBtu NOx range.
§ During the OTS and target NOx level of 0.130 lb/MBtu, optimal constrained boiler operating settings result in heat rate savings of approximately 65 Btu/kWh with respect to the baseline operating conditions.
§ The reduction in NOx emission rate and improvement in unit performance, associated with these optimal operating settings represent total savings of $283,600 (assuming fuel cost of $1.25/MBtu, unit heat rate of 10,000 Btu/kWh, unit capacity factor of 0.85, and NOx credit of $2,000/ton).
§ Due to the lower waterwall wastage at higher O2 levels, the optimal operating point outside of the OTS is at higher excess O2 and higher target NOx level. The optimal excess O2 level for this case represents a trade-off between fuel savings and increase in maintenance cost.
§ From the part-load tests with four mills in service (A-Mill or C-Mill off), gains in load generation of more than 45 MW were achieved by manipulating the boiler control settings and eliminating the stand-by mode on the out-of-service mill.
§ At minimum-load conditions (140 MW), reduction in NOx emissions of more than 20 percent was achieved with A-Mill and B-Mill out-of-service and no primary air flowing through the B-Mill.
§ The economizer excess O2 control curve was modified, which resulted in O2 reductions of the order of 25 percent and a reduction in NOx emissions over the load range.
ACKNOWLEDGEMENTS The authors acknowledge enthusiastic effort of the engineering and operating staff from Bridgeport Generating Station who contributed in the planning, coordination and execution of this project. REFERENCES
1. Sarunac, N., C. E. Romero and E. K. Levy, “Combustion Optimization: Part 1 – Methodology and Tools,” Presented at Combustion Canada 2003 Conference, September 21-24, 2003, Vancouver, BC, Canada.
2. Romero, C. E., N. Sarunac and E. K. Levy, “Combustion Optimization: Part 2 – Results of Field Studies,” Presented at Combustion Canada 2003 Conference, September 21-24, 2003, Vancouver, BC, Canada.
3. Romero, C. E., N. Sarunac, H. Bilirgen, and E. K. Levy, “Combined Optimization for NOx Emissions, Unit Heat Rate and Slagging Control with Coal-Fired Boiler,” Presented at the 28th International Technical Conference on Coal Utilization & Fuel Systems,” Clearwater, Florida, March 10-13, 2003.
4. Sarunac, N., C. E. Romero, E. K. Levy, and W. C. Weston, “Anatomy of a Successful Combustion Optimization Project,” The US EPA/DOE/EPRI Combined Power Plant Air Pollutant Control Symposium: “The MEGA Symposium,” August 20-23, 2001, Chicago, Illinois.
5. Romero, C. E., N. Sarunac, R. Conn, and E. K. Levy, “Combustion Optimization for NOx Control with Slagging Constraints,” The US EPA/DOE/EPRI Combined Power Plant Air Pollutant Control Symposium: “The MEGA Symposium,” August 20-23, 2001, Chicago, Illinois.
6. Romero, C. E., E. K. Levy and N. Sarunac, “Impacts of Combustion Optimization on Power Plant Heat Rate,” EPRI’s 12th Heat Rate Improvement Conference,” Dallas, Texas, January-February, 2001.
7. Romero, C. E., N. Sarunac, J. Luk, K. C. Chan, S. Kho, A. Frank, and B. Benaissa, “Combustion Optimization of a Load-Following Boiler with Flue Gas Recirculation Capabilities.” IJPGC 2000-15057, 2000 International Joint Power Generation Conference, Miami Beach, Florida.
8. Levy, E. K., T. Eldredge, C. E. Romero, and N. Sarunac, “I&C Enhancements for Low NOx Boiler Operation,” Presented at the 9th International Joint ISA POWID/EPRI Instrumentation & Controls Conference in St. Petersburg, Florida, June 1999.
9. Sarunac, N., C. E. Romero, E. K. Levy, et al., “Performance Optimization of R. P. Smith Unit 4,” Presented at EPRI 1998 Heat Rate Improvement Conference, Baltimore, Maryland, September 1998.
10. Romero, C. E., T. Eldredge and E. K. Levy, “Combustion Optimization of Hudson Station 2," Presented at the EPRI 1988 NOx Controls for Utility Boilers Workshop, Baltimore, Maryland, 1988.
11. Maines, P., D. Schnetzler, A. Bilmanis, S. Williams, D. Eskenazi, T. Schmidtt, T., Eldredge, N. Sarunac, and E. K. Levy, “Combustion Optimization of Low NOx Burners at PEPCO's Morgantown Station,” Presented at 1995 EPRI/EPA Joint Symposium on Stationary Combustion NO X Control, Kansas City, Missouri, May 1995.
12. Romero, C. E., N. Sarunac and E. K. Levy, “Field Results from Application of Boiler OP to Utility Boilers.” First Annual Joint ISA POWID/EPRI/DOE Instrumentation and Controls Conference, San Antonio, Texas, 2000.
13. Cramer, D., S. Williams, N. Sarunac, E. K. Levy, “Application of Boiler OP to Utility Boilers: Field Results,” Presented at EPRI 1998 NOx Controls for Utility Boilers Workshop,” Baltimore, Maryland, August 1998.
14. Sarunac, N., M. D’Agostini, J. Miles, T. Eldredge, S. Steele, S. Williams, “Boiler OP: Intelligent Software for Combustion Optimization,” Presented at the POWER-GEN International ‘96 Conference, Orlando, Florida, December 1996.
15. Sarunac, N., C. E. Romero, B. Clements, R. Pomalis, J. Henrikson, W. Cylwa, and J. Luk, “Sootblowing Optimization: Part 1 - Methodology, Instrumentation and Determination of Section Cleanliness,” Presented at Combustion Canada 2003 Conference, September 21-24, 2003, Vancouver, BC, Canada.
16. Sarunac, N., C. E. Romero, J. Shan, X. Bian, B. Clements, R. Pomalis, J. Henrikson, W. Cylwa, and J. Luk, “Sootblowing Optimization: Part 2 – Sootblower Characterization and Implementation of an Intelligent Sootblowing Advisor,” Presented at Combustion Canada 2003 Conference, September 21-24, 2003, Vancouver, BC, Canada.
17. Sarunac, N. and C. Romero, “Sootblowing Optimization and Intelligent Sootblowing,” Presented at 4th Intelligent Sootblowing Workshop, Houston, Texas, March 2002.
18. Sarunac, N., C. E. Romero and H. Bilirgen “Optimization of Sootblowing in Utility Boilers,” EPRI Heat Rate Conference, Birmingham, Alabama, January 28-30, 2003.
19. Sarunac, N., C. E. Romero and E. K. Levy, “Combined Optimization for NOx Emissions, Unit Heat Rate and Slagging Control with Coal-Fired Boilers,” 28th International Technical Conference on Coal Utilization and Fuel Systems, March 9-14, Clearwater, Florida.