Parental smoking during pregnancy and offspring bone mass at age 10 years: findings from a...
11
ORIGINAL ARTICLE Parental smoking during pregnancy and offspring bone mass at age 10 years: findings from a prospective birth cohort C. Macdonald-Wallis & J. H. Tobias & G. Davey Smith & D. A. Lawlor Received: 16 June 2010 / Accepted: 8 September 2010 / Published online: 22 October 2010 # The Author(s) 2010. This article is published with open access at Springerlink.com Abstract Summary We investigated an intrauterine influence of maternal smoking during pregnancy on childhood bone mass. Daughters, but not sons, of mothers who smoked had higher bone mass at age 10 years. This appears to be due to familial factors related to parental smoking influencing increased offspring adiposity rather than a direct intrauterine effect. Introduction Neonatal studies have demonstrated an ad- verse relationship between maternal smoking in pregnancy and foetal bone mineral accrual. We aimed to investigate an intrauterine influence of maternal smoking during pregnancy on offspring bone mass at mean age 9.9 years. Methods We compared associations of maternal and paternal smoking in pregnancy with offspring total body less head (TBLH) and spine bone mineral content (BMC), bone area (BA), bone mineral density (BMD) and area-adjusted BMC (ABMC) in 7,121 children in the Avon Longitudinal Study of Parents and Children. Results Maternal smoking in any trimester was associated with increased TBLH BMC, BA and BMD in girls (mean difference [95% CI] (sex-specific SD scores), 0.13 [0.05– 0.22], 0.13 [0.04–0.21], 0.13 [0.04–0.22], respectively) but not boys (0.01 [−0.07–0.09], 0.00 [−0.08–0.08], 0.04 [−0.05–0.12]), and also with spine BMC, BA and BMD in girls (0.13 [0.03–0.23], 0.12 [0.03–0.22], 0.10 [0.00– 0.21]) but not boys (0.03 [−0.06–0.12], 0.00 [−0.09–0.09], 0.05 [−0.04–0.14]), but not with ABMC. Paternal smoking associations were similar, with no statistical evidence for a difference between maternal and paternal effects. Maternal associations increased on adjustment for offspring birth weight and gestational age, but attenuated to the null after adjustment for current height and weight. Conclusions We found little evidence that maternal smoking was related to bone mass in boys. In girls, maternal smoking associations were similar to those of paternal smoking, suggesting that these were attributable to shared familial characteristics, not intrauterine mechanisms. Keywords ALSPAC . Bone mineral content (BMC) . Bone mineral density (BMD) . Childhood . Pregnancy . Smoking Introduction The development of bone mass throughout childhood is important in determining the peak bone mass achieved in early adulthood [1], and simulation models have demon- strated the potential of small increases in peak bone mass to delay the onset of osteoporosis and therefore decrease the risk of fracture in the elderly [2]. Even during childhood, a reduction in bone mass is associated with an increased fracture risk from all levels of trauma severity [3, 4]. Maternal smoking during pregnancy has been shown to have a detrimental influence on the accrual of bone mass in utero. Two studies in the Southampton Women’ s Survey Electronic supplementary material The online version of this article (doi:10.1007/s00198-010-1415-y) contains supplementary material, which is available to authorized users. C. Macdonald-Wallis (*) : G. Davey Smith : D. A. Lawlor MRC Centre for Causal Analyses in Translational Epidemiology, Department of Social Medicine, University of Bristol, Oakfield House, Oakfield Grove, Bristol BS8 2BN, UK e-mail: [email protected] J. H. Tobias Academic Rheumatology, Clinical Science at North Bristol, University of Bristol, Bristol, UK Osteoporos Int (2011) 22:1809–1819 DOI 10.1007/s00198-010-1415-y
Transcript of Parental smoking during pregnancy and offspring bone mass at age 10 years: findings from a...

ORIGINAL ARTICLE
Parental smoking during pregnancy and offspring bone massat age 10 years: findings from a prospective birth cohort
C. Macdonald-Wallis & J. H. Tobias & G. Davey Smith &
D. A. Lawlor
Received: 16 June 2010 /Accepted: 8 September 2010 /Published online: 22 October 2010# The Author(s) 2010. This article is published with open access at Springerlink.com
AbstractSummary We investigated an intrauterine influence ofmaternal smoking during pregnancy on childhood bonemass. Daughters, but not sons, of mothers who smoked hadhigher bone mass at age 10 years. This appears to be due tofamilial factors related to parental smoking influencingincreased offspring adiposity rather than a direct intrauterineeffect.Introduction Neonatal studies have demonstrated an ad-verse relationship between maternal smoking in pregnancyand foetal bone mineral accrual. We aimed to investigate anintrauterine influence of maternal smoking during pregnancyon offspring bone mass at mean age 9.9 years.Methods We compared associations of maternal and paternalsmoking in pregnancy with offspring total body less head(TBLH) and spine bone mineral content (BMC), bone area(BA), bone mineral density (BMD) and area-adjusted BMC(ABMC) in 7,121 children in the Avon Longitudinal Study ofParents and Children.Results Maternal smoking in any trimester was associatedwith increased TBLH BMC, BA and BMD in girls (meandifference [95% CI] (sex-specific SD scores), 0.13 [0.05–
0.22], 0.13 [0.04–0.21], 0.13 [0.04–0.22], respectively) butnot boys (0.01 [−0.07–0.09], 0.00 [−0.08–0.08], 0.04[−0.05–0.12]), and also with spine BMC, BA and BMDin girls (0.13 [0.03–0.23], 0.12 [0.03–0.22], 0.10 [0.00–0.21]) but not boys (0.03 [−0.06–0.12], 0.00 [−0.09–0.09],0.05 [−0.04–0.14]), but not with ABMC. Paternal smokingassociations were similar, with no statistical evidence for adifference between maternal and paternal effects. Maternalassociations increased on adjustment for offspring birthweight and gestational age, but attenuated to the null afteradjustment for current height and weight.Conclusions We found little evidence that maternal smokingwas related to bone mass in boys. In girls, maternal smokingassociations were similar to those of paternal smoking,suggesting that these were attributable to shared familialcharacteristics, not intrauterine mechanisms.
Keywords ALSPAC . Bone mineral content (BMC) .
Bone mineral density (BMD) . Childhood . Pregnancy .
Smoking
Introduction
The development of bone mass throughout childhood isimportant in determining the peak bone mass achieved inearly adulthood [1], and simulation models have demon-strated the potential of small increases in peak bone mass todelay the onset of osteoporosis and therefore decrease therisk of fracture in the elderly [2]. Even during childhood, areduction in bone mass is associated with an increasedfracture risk from all levels of trauma severity [3, 4].
Maternal smoking during pregnancy has been shown tohave a detrimental influence on the accrual of bone mass inutero. Two studies in the Southampton Women’s Survey
Electronic supplementary material The online version of this article(doi:10.1007/s00198-010-1415-y) contains supplementary material,which is available to authorized users.
C. Macdonald-Wallis (*) :G. Davey Smith :D. A. LawlorMRC Centre for Causal Analyses in Translational Epidemiology,Department of Social Medicine, University of Bristol,Oakfield House, Oakfield Grove,Bristol BS8 2BN, UKe-mail: [email protected]
J. H. TobiasAcademic Rheumatology, Clinical Science at North Bristol,University of Bristol,Bristol, UK
Osteoporos Int (2011) 22:1809–1819DOI 10.1007/s00198-010-1415-y

reported associations between maternal smoking anddecreased whole body bone mineral content (BMC) inneonatal offspring [5, 6]. The earlier of the two studies alsofound a similar relationship with bone mineral density(BMD) [5], but the more recent and larger study did not [6].Little is known about longer term effects, although in aTasmanian cohort of 330 participants, relationships werefound between maternal smoking during pregnancy andreduced offspring femoral neck and lumbar spine BMC andBMD at age 8 years which remained after adjustment forcurrent weight and height [7].
We assessed the associations of maternal smoking inpregnancy with the skeletal size and bone density at meanage 9.9 years of a large cohort of children: the AvonLongitudinal Study of Parents and Children (ALSPAC). Wecompared the effects of maternal smoking with those ofpaternal smoking during pregnancy since the paternalexposure would not be expected to influence foetaldevelopment via an intrauterine mechanism. Hence, stron-ger maternal associations would provide evidence of adirect intrauterine effect on bone development, whilstsimilar-sized maternal and paternal associations wouldindicate relationships driven by shared familial, social,genetic and environmental factors. This method has beenused effectively to study the influences of maternalsmoking on other outcomes in the ALSPAC [8–10], andits validity is demonstrated by the much greater associationof maternal compared with paternal smoking in pregnancywith offspring birth weight, which is known to beinfluenced by maternal smoking via an intrauterine mech-anism [11].
Materials and methods
The ALSPAC
The ALSPAC is a prospective birth cohort study aiming toinvestigate environmental and inheritable influences on thehealth and development of children. It has been previouslydescribed in full elsewhere and on the web site www.alspac.bris.ac.uk. Pregnant women with expected delivery datesbetween 1 April 1991 and 31 December 1992 and living ina defined area of Avon including the city of Bristol wereeligible for recruitment to the study. A total of 14,541women were enrolled, and 13,678 of these had a singletonlive birth. Ethical approval for the study was obtained fromthe ALSPAC Law and Ethics Committee and from localethics committees. At age 9 years, all children with knownaddresses who were still participating were invited to a“Focus @ 9” clinic, and 7,121 of the singleton childrenattended. Of these, 6,868 underwent a full-body dual-energy X-ray absorptiometry (DXA) scan.
DXA measurements
Whole body DXA scans were carried out using a LunarProdigy scanner (GE Healthcare Bio-Sciences Corp., USA),and after exclusion of those containing artefacts, movement orskeletal irregularities, there remained 6,775 scans. The totalbody less head (TBLH) region was used to represent thechild’s total bone mass, with the head excluded as bonedevelopment here is different from the rest of the skeleton andless likely to be influenced by environmental factors. Incontrast to the overall skeleton which primarily comprisescortical bone, the spine subregion which was also analysedhas a relatively high proportion of trabecular bone. Oneoperator reanalysed the scans to check and adjust automatedplacement of body regions; in the case of the spinal region, theupper border comprises the cervicothoracic junction, thelower border the lumbosacral junction, and the lateral bordersthe bone/soft tissue interface. Since curvature in the image ofthe spine leads to contamination of the spinal region with theribs, only images with minor or no curvature are included inthe analysis of spinal outcomes. Measurements for TBLH andspine BMC, bone area (BA) and areal BMD were subse-quently calculated. For both regions, area-adjusted BMC(ABMC) was also derived as a measure of volumetric BMDby using linear regression to adjust BMC for BA and addingthe residuals to the mean BMC for the region. The coefficientof variation for TBLH BMDwas 0.84% based on 122 pairs ofscans repeated on the same day. At the same time as the DXAscan, the child’s standing height (without shoes) wasmeasured using a Harpenden Stadiometer (Holtain Ltd.,UK) and weight (unshod and in light clothing) was measuredusing a Tanita Body Fat Analyzer (model TBF 305, Tanita UKLimited, UK).
Maternal and paternal smoking
At 18 weeks’ gestation, the mothers were sent a postalquestionnaire which asked how many times per day theyhad smoked in the first trimester and in the last 2 weeks,representing smoking during the second trimester. At32 weeks’ gestation, another postal questionnaire askedhow many cigarettes per day the woman was currentlysmoking, representing smoking during the third trimester.Variables describing smoking in any trimester and smokingin all trimesters were derived from these responses, withone or more cigarettes smoked per day considered assmoking regularly. A questionnaire completed by themother’s partner at 18 weeks’ gestation asked if he hadsmoked regularly at any time in the last 9 months. Themother was also asked if her partner smoked in her 18-week questionnaire, and a positive response from either thepartner or the mother was assumed sufficient to indicatethat the partner smoked regularly during the pregnancy.
1810 Osteoporos Int (2011) 22:1809–1819

Other variables
Maternal and paternal height, weight and highest educa-tional qualifications, household social class, father’s ageand the mother’s parity were obtained from question-naires administered during pregnancy. Household socialclass was defined from the highest parental occupation,on a scale from I to V, with I indicating a professional/managerial role and V being unskilled manual. Maternaland paternal body mass index (BMI) were calculated asweight (kg)/height (m)2. The child’s sex was obtained atthe time of birth, and the child’s birth weight, gestationalage and the mother’s age at delivery were abstracted fromobstetric records.
In the questionnaire administered at 18 weeks’ gesta-tion, the mother was asked how many hours per weekshe spent engaging in strenuous physical activity. Thequestionnaire also asked the number of hours per weekthe mother spent in a number of specific types of leisureactivity, each of which was assigned a MET score [12],and a weighted activity index was developed by multiply-ing the MET score by the number of hours of activity perweek. Dietary information for the mothers was obtainedfrom a food frequency questionnaire administered at32 weeks’ gestation which asked how often they con-sumed each of the 43 food groups. Using nutrientinformation on standard-sized portions, the mother’s totalweekly energy, carbohydrate, fat and protein intakes werederived [13]. Although the main analysis did not adjust forthese variables, since the equivalent paternal informationwas not available, an additional analysis was performed inwhich the relationships of maternal smoking in pregnancywith offspring bone outcomes were adjusted for maternalphysical activity (strenuous activity of 3 h or more perweek and weighted activity index) and diet (weeklyenergy, carbohydrate, fat and protein intake) duringpregnancy.
Pubertal stage data for the children were obtained fromTanner stage questionnaires administered to the parents at116 months and were based on pubic hair development forboys and breast development for girls, or pubic hairdevelopment if this was unavailable. For girls, age atmenarche was derived from a series of questionnairesadministered between the ages of 8 and 17 years whichasked if the daughter had started her menstrual periods and,if so, the age she was at her first menstrual period. Wherethere was disagreement between questionnaires, the agegiven on the earliest questionnaire was used. Most children(99% of boys and 96% of girls) with pubertal stageinformation were either pre- or early pubertal (Tanner stage1 or 2). For this reason, and due to the high proportion ofmissing pubertal stage data, this has not been adjusted forin the main regression analysis, but an additional analysis
was performed which adjusted for pubertal stage and, forgirls, whether menarche occurred at age ≤10 years.
Paternity
If, when asked in a questionnaire administered in pregnancy,the mother had not confirmed her partner to be the child’sbiological father, all paternal information (smoking status,BMI, age, height and education) was treated as missing.
Statistical analysis
We assessed maternal and paternal smoking associationswith offspring bone outcomes separately and also incombined mutually adjusted regression models. We usedsex-specific models due to evidence of interactions ofmaternal and paternal smoking with the child’s sex andadjusted first for the child’s age only, then additionally forthe potential confounders of household social class, parityand maternal/paternal age, height, BMI and education.Maternal factors were included in maternal exposuremodels, paternal factors in paternal exposure models, andboth maternal and paternal factors in combined models. Toexplore mediating relationships, we additionally adjustedfor the child’s birth weight and gestational age and thenfinally included the child’s height and weight as potentialmediators. Since there was little change in regressioncoefficients between the simple age-adjusted model andthe model adjusting for all potential confounding factors(full results for all four models available from authors),only the confounder-adjusted model (age and all otherpotential confounders, model 1) and the two additionalmodels exploring potential mediation by birth weight andgestational age (model 2) and by weight and height at age9.9 (model 3) are presented. Sex-specific standard deviation(SD) scores of TBLH and spine BMC, BA, BMD andABMC were used as outcomes.
We used multivariate multiple imputation of missingdata to impute data for all children who attended the 9-year clinic and also analysed the complete cases with nomissing data on any of the exposures, outcomes orcovariates to compare findings from the fully observeddata with those from partially imputed data. Multipleimputation was used to increase the efficiency of themodel estimates and reduce selection bias, which can bepresent in complete case analysis when data are notmissing completely at random. The multiple imputationmethod is valid provided that the reasons for missingnessin the data can be explained by other observed variables[14]. Detailed methods for this procedure are described inthe Electronic supplementary material (ESM). All analyseswere carried out in Stata version 11.0 (StataCorp LP,USA).
Osteoporos Int (2011) 22:1809–1819 1811

Results
Table 1 shows the characteristics of the 7,121 children whoattended the 9-year clinic. There were 6,101 sets of parentsfor whom both maternal and paternal smoking informationwas available; for 3,576 (58.6%) of these neither parentsmoked, for 369 (6.0%) only the mother smoked, for 1,313(21.5%) only the father smoked, and for 843 (13.8%) bothparents smoked. Mothers who smoked at any time duringpregnancy were younger and shorter on average, morelikely to be of a manual social class and less likely to havean A-level or higher qualification than mothers who did notsmoke (ESM Web Table 2). Pre-pregnancy BMI did notdiffer between mothers who smoked and those who did not.Children of mothers who smoked were lighter at birth andolder, heavier and had higher fat mass at the time of theDXA scan on average.
Pairwise correlations of total body and spinal bonemeasures are given in ESM Web Table 3, and correlationsof these measures with child and parental characteristics areshown in ESM Web Table 4. The child’s height and weightwere strongly positively correlated with TBLH and spineBMC and BA and moderately with TBLH and spine BMD.Higher birth weight, longer gestation and greater age atDXA scan were all associated with increased TBLH BMC,BA and BMD.
Multiple imputation analysis of maternal and paternalsmoking in relation to TBLH bone outcomes is shown inTable 2 and the analysis of spinal outcomes shown inTable 3. In girls, maternal smoking in any trimester wasassociated with increased TBLH and spine BMC, BA andBMD in confounder-adjusted models (model 1). Meandifferences in TBLH BMC and BA were slightly higher formothers who smoked in all trimesters of pregnancy, butother associations were similar. In boys, maternal smokingin any trimester was not robustly associated with anyTBLH or spinal bone outcomes. P values for sex differ-ences were 0.007, 0.003 and 0.085 for TBLH BMC, BAand BMD and 0.036, 0.035 and 0.119 for spine BMC, BAand BMD, respectively, in models with maternal smokingin any trimester as the exposure. In combined confounder-adjusted models (model 1) for girls, there were greaterpaternal smoking associations with TBLH BMC, BA andBMD and spine BMD compared with those for maternalsmoking, whilst maternal associations were larger thanpaternal associations with spine BMC and BA. However,all P values for differences between maternal and paternaleffects were >0.15. There were no strong associations ofpaternal smoking with bone outcomes in boys. Onadditional adjustment for the child’s birth weight andgestational age (model 2), there were increases in maternalassociations, whilst paternal associations did not change. Inboys, maternal smoking in all trimesters was positively
associated with TBLH BMC, BA and BMD after adjust-ment for birth weight and gestational age. In fully adjustedmodels including offspring height and weight at age9.9 years (model 3), all maternal relationships attenuatedto the null, although a weak association remained withspine BA in girls. Paternal associations were similarlyattenuated, and although evidence remained of an associ-ation with TBLH BA, this weakened in combined models.There were no associations between parental smokingduring pregnancy and TBLH or spine ABMC, except fora weak positive association between paternal smoking andspine ABMC in girls. These models are not included in thetables (full data available from authors on request).Variance inflation factors for maternal smoking andpaternal smoking in mutually adjusted models wereall <2, indicating that there was low colinearity betweenthe two parental smoking variables in these models.
To examine whether the associations in girls weremediated mainly by the child’s height or weight, weadjusted for each individually (plus confounders). Onadjustment for height without weight, mean differences inTBLH BMC, BA and BMD associated with maternalsmoking in any trimester were 0.13 SD, 0.12 SD and 0.12SD, respectively (all P<0.01). However, on adjustment forweight without height, mean differences were −0.02SD, −0.03 SD and 0.00 SD (all P>0.2), suggesting thatthe positive associations of maternal smoking with off-spring bone mass are driven by the child’s weight at age9.9 years. Mean differences in TBLH BMC, BA and BMDassociated with paternal smoking on adjustment for heightwithout weight were 0.10 SD, 0.10 SD and 0.10 SD (all P<0.01), and adjusting for weight without height were 0.01SD, 0.01 SD and 0.03 SD, respectively (all P>0.2). Asimilar pattern occurred in spine BMC, BA and BMD.
In complete case analysis (ESM Web Tables 5 and 6),associations of maternal smoking with TBLH and spinalBMC, BA and BMD were equivalent to those usingmultiple imputation, but associations of paternal smokingwere generally smaller in girls (by up to 0.07 SD). Nostrong associations of maternal or paternal smoking inpregnancy with bone outcomes were found in boys in thecomplete case in confounder-adjusted models. In combinedconfounder-adjusted models for TBLH bone outcomes ingirls in the complete case maternal and paternal smokingassociations were of a similar size, with little evidence for adifference between parental effects, as in multiple imputa-tion models. However, in models for spinal bone outcomes,there were greater maternal compared with paternalassociations, and there was statistical evidence for adifference between parental smoking associations withspinal BA. ESM Web Tables 7 and 8 compare thecharacteristics of multiply imputed and complete casedatasets for TBLH and spinal bone outcomes, respectively,
1812 Osteoporos Int (2011) 22:1809–1819

Table 1 Characteristics of children who attended the clinic at age 9 years and their parents (N=7,121)
Characteristic N with data (%) Mean (SD) or median (IQR) or%
Child
Age at DXA scan (months) 6,851 (96.2) 118.4 (3.9)
Sex (%) Male 7,121 (100.0) 49.6
Female 50.4
Height (cm) 7,047 (99.0) 139.5 (6.3)
Weight (kg) 7,105 (99.8) 33.2 (29.4–38.4)a
TBLH BMC (g) 6,775 (95.1) 893.8 (184.0)
TBLH BA (cm2) 6,775 (95.1) 1139.5 (164.3)
TBLH BMD (g/cm2) 6,775 (95.1) 0.78 (0.05)
TBLH ABMC 6,775 (95.1) 894.6 (39.8)
Spine BMC (g) 5,487 (77.1) 78.4 (15.7)
Spine BA (cm2) 5,487 (77.1) 100.7 (12.0)
Spine BMD (g/cm2) 5,487 (77.1) 0.77 (0.08)
Spine ABMC (g) 5,487 (77.1) 78.4 (7.1)
Pubertal stage (%) Boys Tanner 1 2,365 (67.0) 82.9
Tanner 2 16.5
Tanner 3+ 0.6
Girls Tanner 1 2,836 (79.0) 81.5
Tanner 2 15.0
Tanner 3+ 3.5
Age at menarche for girls (years) (%) Up to 10 3,107 (86.5) 4.7
11+ 95.3
Gestational age (weeks) 7,121 (100.0) 39.5 (1.8)
Birth weight (kg) 7,035 (98.8) 3.4 (0.5)
Household social class (%) I 6,544 (91.9) 15.5
II 45.1
III NM 24.8
III M 10.3
IV/V 4.3
Mother
Age at delivery (years) 7121 (100.0) 29.0 (4.6)
Height (cm) 6753 (94.8) 164.1 (6.6)
Pre-pregnancy BMI (kg/m2) 6429 (90.3) 22.2 (20.5–24.4)a
No. of previous births (%) 0 6879 (96.6) 45.8
1 35.5
2 13.7
3 3.8
4 or more 1.2
Smoking during pregnancy (%) Never 6379 (89.6) 78.7
1 or 2 trimesters 9.5
All trimesters 11.8
Education (%) None/CSE 6860 (96.3) 13.8
Vocational 8.5
O Levels 35.2
A Levels 26.6
Degree 15.8
Father
Age at child’s birth (years) 5106 (71.7) 31.4 (5.2)
Height (cm) 4931 (69.2) 176.3 (6.9)
Osteoporos Int (2011) 22:1809–1819 1813

and show that parental educational qualifications tended tobe higher in the complete case. We thus investigated therelationships between maternal and paternal smoking andTBLH and spinal BMC, BA and BMD in girls in thecomplete case and stratified the analysis into two sub-groups: families where neither parent had an A-level orhigher qualification and families where one or both parentswas qualified to A level or above (data not shown). InTBLH models, paternal associations were greater thanmaternal associations in the stratum with lower parentalqualifications, whilst maternal associations were greater inthe stratum with higher parental qualifications. In thestratum with less educated parents, there were similar-sized parental smoking associations with spinal boneoutcomes, but greater maternal associations in the highereducated stratum. This suggests that the dissimilaritiesbetween the multiple imputation and complete case analysesare likely to be due to the differing parental educationdistributions in the datasets.
Of the 6,741 children whose ethnicity was known,6,470 (96.0%) were white. Restricting the analysis tochildren of known white ethnicity did not meaningfullychange the model coefficients. Including maternal dietand physical activity during pregnancy in the multipleimputation process and additionally adjusting for thesevariables in models with maternal smoking as theexposure did not alter the findings. When we repeatedthe multiple imputation process with pubertal stage (forboth boys and girls) and age of menarche (for girls only)included and additionally adjusted for these variables,model coefficients were similar for boys. In models withmaternal smoking as the exposure for girls, associationswere attenuated by up to 0.07 SD compared with theoriginal multiple imputation analysis, whilst associationsof paternal smoking were unchanged.
Discussion
We compared the relationships of maternal and paternalsmoking during pregnancy with offspring bone mass atmean age 9.9 years in a large birth cohort and foundsimilar-sized associations of smoking in both parents withincreased total body and spinal BMC, BA and areal BMDin girls, but little evidence for any associations in boys.
Maternal smoking during pregnancy was associated with0.10–0.13 SD increases in TBLH and spinal BMC, BA andBMD in daughters. These relationships were masked by thenegative association of maternal smoking with the child’sbirth weight and gestational age and increased on adjust-ment for these factors, whilst effect sizes associated withpaternal smoking did not change. This may be due to thenegative intrauterine effect on the accrual of bone mass bythe foetus [5, 6], which is unique to the maternal smokingexposure. Maternal smoking during pregnancy is known tolead to a smaller child at birth, both through an increasedrisk of preterm birth and through intrauterine growthretardation [15, 16], and a positive relationship has beenreported between birth weight and BMD at the femoralneck and lumbar spine in 8-year-old children [17].
Conversely, relationships of maternal and paternalsmoking with offspring bone mass attenuated to the nullwhen the child’s height and weight were included inregression models. BMC, BA and BMD are all related tobone size (as BMD is incompletely adjusted for bone area)and therefore correlate strongly with height and weight.Since no relationships were found between maternalsmoking and ABMC, which reflects ‘volumetric’ BMC, itappears that the associations are working through skeletalsize rather than density. The relationships were drivenmainly by offspring weight, concurring with studies whichhave demonstrated an association between maternal smok-
Table 1 (continued)
Characteristic N with data (%) Mean (SD) or median (IQR) or%
BMI (kg/m2) 4887 (68.6) 24.8 (22.9–26.9)a
Regular smoker (%) No 6679 (93.8) 65.3
Yes 34.7
Education (%) None/CSE 6467 (90.8) 19.3
Vocational 8.2
O Levels 21.7
A Levels 28.5
Degree 22.2
ABMC area-adjusted bone mineral content, BA bone area, BMC bone mineral content, BMD bone mineral density, BMI body mass index, IQRinterquartile range, TBLH total body less headaMedian and interquartile range are shown for skewed variables
1814 Osteoporos Int (2011) 22:1809–1819

Table 2 Sex-specific associations of maternal and paternal smoking with total body less head bone outcomes at age 9.9 years in multipleimputation analysis (boys N=3,530; girls N=3,591)
Mean difference 95% CI P value Mean difference 95% CI P value Mean difference 95% CI P value
Boys TBLH BMC (SD score: 1 SD=174.6 g) TBLH BA (SD score: 1 SD=154.9 cm2) TBLH BMD (SD score: 1 SD=0.053 g/cm2)
Maternal smoking in any trimester
Model 1 0.01 −0.07–0.09 0.767 0.00 −0.08–0.08 0.992 0.04 −0.05–0.12 0.419
Model 2 0.05 −0.03–0.14 0.186 0.05 −0.03–0.13 0.232 0.06 −0.03–0.15 0.177
Model 3 0.00 −0.05–0.04 0.885 −0.01 −0.04–0.03 0.736 0.01 −0.06–0.08 0.752
Maternal smoking in all trimesters
Model 1 0.07 −0.04–0.17 0.200 0.05 −0.05–0.15 0.356 0.10 −0.01–0.21 0.086
Model 2 0.13 0.02–0.23 0.016 0.12 0.01–0.22 0.025 0.13 0.02–0.24 0.020
Model 3 0.00 −0.06–0.05 0.877 −0.02 −0.06–0.03 0.482 0.03 −0.06–0.12 0.523
Paternal smoking
Model 1 0.02 −0.05–0.10 0.519 0.03 −0.04–0.10 0.405 0.01 −0.07–0.08 0.887
Model 2 0.03 −0.04–0.10 0.425 0.04 −0.03–0.11 0.305 0.01 −0.07–0.08 0.833
Model 3 −0.02 −0.05–0.02 0.357 −0.01 −0.04–0.02 0.581 −0.03 −0.09–0.03 0.313
Combined models
Model 1 Maternal smokinga 0.01 −0.08–0.09 0.830 −0.01 −0.09–0.08 0.888 0.04 −0.05–0.13 0.396
Paternal smoking 0.03 −0.04–0.10 0.465 0.04 −0.03–0.11 0.298 0.00 −0.08–0.08 0.985
Model 2 Maternal smokinga 0.05 −0.04–0.13 0.277 0.04 −0.04–0.12 0.369 0.06 −0.03–0.16 0.194
Paternal smoking 0.02 −0.05–0.09 0.588 0.03 −0.04–0.10 0.409 −0.01 −0.08–0.07 0.894
Model 3 Maternal smokinga 0.00 −0.04–0.05 0.925 0.00 −0.04–0.03 0.845 0.02 −0.05–0.10 0.523
Paternal smoking −0.02 −0.06–0.02 0.383 −0.01 −0.04–0.02 0.644 −0.03 −0.10–0.03 0.266
Girls TBLH BMC (SD score: 1 SD=191.5 g) TBLH BA (SD score: 1 SD=172.3 cm2) TBLH BMD (SD score: 1 SD=0.055 g/cm2)
Maternal smoking in any trimester
Model 1 0.13 0.05–0.22 0.003 0.13 0.04–0.21 0.004 0.13 0.04–0.22 0.005
Model 2 0.17 0.08–0.25 <0.001 0.17 0.08–0.25 <0.001 0.15 0.06–0.24 0.001
Model 3 0.02 −0.02–0.06 0.384 0.02 −0.01–0.06 0.205 0.02 −0.04–0.08 0.528
Maternal smoking in all trimesters
Model 1 0.15 0.03–0.26 0.011 0.15 0.04–0.26 0.009 0.13 0.01–0.24 0.037
Model 2 0.20 0.09–0.32 0.001 0.21 0.10–0.32 <0.001 0.16 0.04–0.28 0.008
Model 3 0.02 −0.03–0.07 0.371 0.03 −0.01–0.08 0.127 0.01 −0.07–0.09 0.871
Paternal smoking
Model 1 0.15 0.08–0.22 <0.001 0.14 0.08–0.21 <0.001 0.14 0.07–0.21 <0.001
Model 2 0.16 0.09–0.23 <0.001 0.15 0.09–0.22 <0.001 0.15 0.07–0.22 <0.001
Model 3 0.03 −0.00–0.07 0.058 0.03 0.00–0.06 0.029 0.04 −0.02–0.09 0.164
Combined models
Model 1 Maternal smokinga 0.10 0.01–0.19 0.025 0.10 0.01–0.19 0.030 0.10 0.01–0.19 0.032
Paternal smoking 0.12 0.05–0.20 0.001 0.12 0.05–0.19 0.002 0.12 0.04–0.19 0.004
Model 2 Maternal smokinga 0.13 0.04–0.22 0.004 0.13 0.04–0.22 0.003 0.12 0.03–0.21 0.011
Paternal smoking 0.12 0.05–0.19 0.001 0.12 0.05–0.19 0.001 0.11 0.04–0.19 0.004
Model 3 Maternal smokinga 0.01 −0.03–0.05 0.670 0.01 −0.02–0.05 0.457 0.01 −0.05–0.08 0.706
Paternal smoking 0.03 −0.01–0.06 0.101 0.03 −0.00–0.06 0.087 0.04 −0.02–0.10 0.198
Model 1 is adjusted for the child’s age, mother’s parity, household social class and maternal/paternal factors (age, height, pre-pregnancy BMI,education).
Model 2 is adjusted additionally for the child’s gestational age and birth weight
Model 3 is adjusted for all these plus the child’s height and weight at age 9.9 years
Reference category for maternal smoking variables is “Never smoked during pregnancy” and for paternal smoking variable is “Non-smoking”
BA bone area, BMC bone mineral content, BMD bone mineral density, TBLH total body less headaMaternal smoking in any trimester
Osteoporos Int (2011) 22:1809–1819 1815
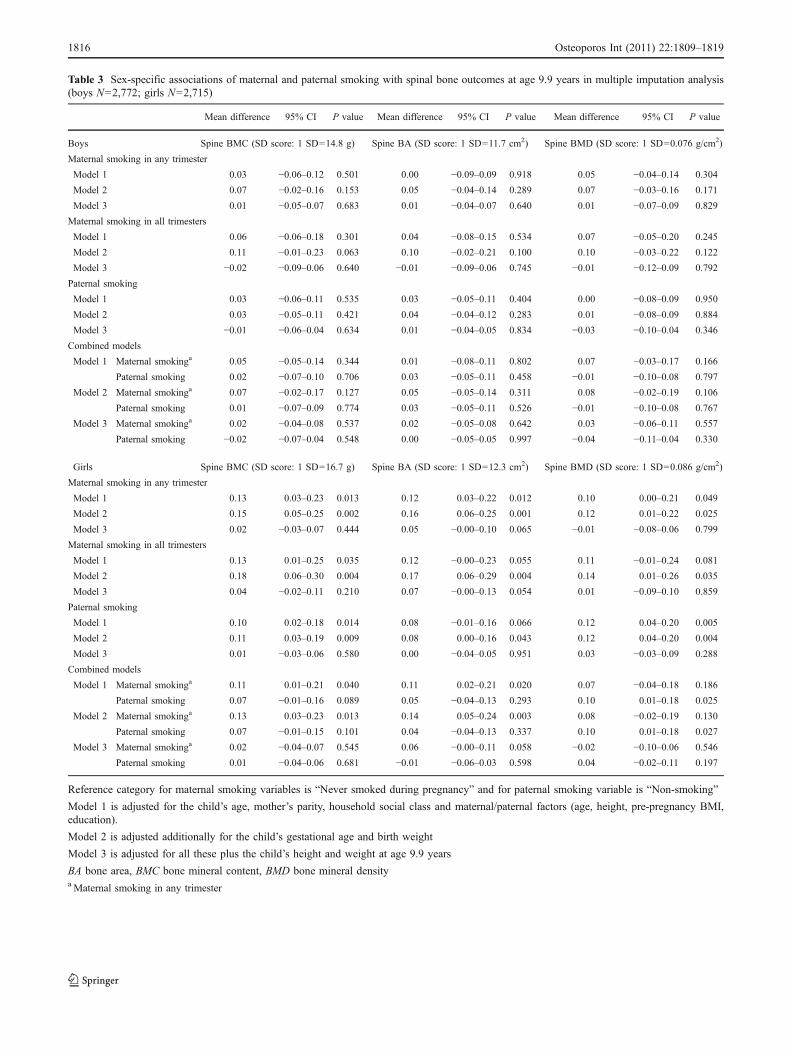
Table 3 Sex-specific associations of maternal and paternal smoking with spinal bone outcomes at age 9.9 years in multiple imputation analysis(boys N=2,772; girls N=2,715)
Mean difference 95% CI P value Mean difference 95% CI P value Mean difference 95% CI P value
Boys Spine BMC (SD score: 1 SD=14.8 g) Spine BA (SD score: 1 SD=11.7 cm2) Spine BMD (SD score: 1 SD=0.076 g/cm2)
Maternal smoking in any trimester
Model 1 0.03 −0.06–0.12 0.501 0.00 −0.09–0.09 0.918 0.05 −0.04–0.14 0.304
Model 2 0.07 −0.02–0.16 0.153 0.05 −0.04–0.14 0.289 0.07 −0.03–0.16 0.171
Model 3 0.01 −0.05–0.07 0.683 0.01 −0.04–0.07 0.640 0.01 −0.07–0.09 0.829
Maternal smoking in all trimesters
Model 1 0.06 −0.06–0.18 0.301 0.04 −0.08–0.15 0.534 0.07 −0.05–0.20 0.245
Model 2 0.11 −0.01–0.23 0.063 0.10 −0.02–0.21 0.100 0.10 −0.03–0.22 0.122
Model 3 −0.02 −0.09–0.06 0.640 −0.01 −0.09–0.06 0.745 −0.01 −0.12–0.09 0.792
Paternal smoking
Model 1 0.03 −0.06–0.11 0.535 0.03 −0.05–0.11 0.404 0.00 −0.08–0.09 0.950
Model 2 0.03 −0.05–0.11 0.421 0.04 −0.04–0.12 0.283 0.01 −0.08–0.09 0.884
Model 3 −0.01 −0.06–0.04 0.634 0.01 −0.04–0.05 0.834 −0.03 −0.10–0.04 0.346
Combined models
Model 1 Maternal smokinga 0.05 −0.05–0.14 0.344 0.01 −0.08–0.11 0.802 0.07 −0.03–0.17 0.166
Paternal smoking 0.02 −0.07–0.10 0.706 0.03 −0.05–0.11 0.458 −0.01 −0.10–0.08 0.797
Model 2 Maternal smokinga 0.07 −0.02–0.17 0.127 0.05 −0.05–0.14 0.311 0.08 −0.02–0.19 0.106
Paternal smoking 0.01 −0.07–0.09 0.774 0.03 −0.05–0.11 0.526 −0.01 −0.10–0.08 0.767
Model 3 Maternal smokinga 0.02 −0.04–0.08 0.537 0.02 −0.05–0.08 0.642 0.03 −0.06–0.11 0.557
Paternal smoking −0.02 −0.07–0.04 0.548 0.00 −0.05–0.05 0.997 −0.04 −0.11–0.04 0.330
Girls Spine BMC (SD score: 1 SD=16.7 g) Spine BA (SD score: 1 SD=12.3 cm2) Spine BMD (SD score: 1 SD=0.086 g/cm2)
Maternal smoking in any trimester
Model 1 0.13 0.03–0.23 0.013 0.12 0.03–0.22 0.012 0.10 0.00–0.21 0.049
Model 2 0.15 0.05–0.25 0.002 0.16 0.06–0.25 0.001 0.12 0.01–0.22 0.025
Model 3 0.02 −0.03–0.07 0.444 0.05 −0.00–0.10 0.065 −0.01 −0.08–0.06 0.799
Maternal smoking in all trimesters
Model 1 0.13 0.01–0.25 0.035 0.12 −0.00–0.23 0.055 0.11 −0.01–0.24 0.081
Model 2 0.18 0.06–0.30 0.004 0.17 0.06–0.29 0.004 0.14 0.01–0.26 0.035
Model 3 0.04 −0.02–0.11 0.210 0.07 −0.00–0.13 0.054 0.01 −0.09–0.10 0.859
Paternal smoking
Model 1 0.10 0.02–0.18 0.014 0.08 −0.01–0.16 0.066 0.12 0.04–0.20 0.005
Model 2 0.11 0.03–0.19 0.009 0.08 0.00–0.16 0.043 0.12 0.04–0.20 0.004
Model 3 0.01 −0.03–0.06 0.580 0.00 −0.04–0.05 0.951 0.03 −0.03–0.09 0.288
Combined models
Model 1 Maternal smokinga 0.11 0.01–0.21 0.040 0.11 0.02–0.21 0.020 0.07 −0.04–0.18 0.186
Paternal smoking 0.07 −0.01–0.16 0.089 0.05 −0.04–0.13 0.293 0.10 0.01–0.18 0.025
Model 2 Maternal smokinga 0.13 0.03–0.23 0.013 0.14 0.05–0.24 0.003 0.08 −0.02–0.19 0.130
Paternal smoking 0.07 −0.01–0.15 0.101 0.04 −0.04–0.13 0.337 0.10 0.01–0.18 0.027
Model 3 Maternal smokinga 0.02 −0.04–0.07 0.545 0.06 −0.00–0.11 0.058 −0.02 −0.10–0.06 0.546
Paternal smoking 0.01 −0.04–0.06 0.681 −0.01 −0.06–0.03 0.598 0.04 −0.02–0.11 0.197
Reference category for maternal smoking variables is “Never smoked during pregnancy” and for paternal smoking variable is “Non-smoking”
Model 1 is adjusted for the child’s age, mother’s parity, household social class and maternal/paternal factors (age, height, pre-pregnancy BMI,education).
Model 2 is adjusted additionally for the child’s gestational age and birth weight
Model 3 is adjusted for all these plus the child’s height and weight at age 9.9 years
BA bone area, BMC bone mineral content, BMD bone mineral densityaMaternal smoking in any trimester
1816 Osteoporos Int (2011) 22:1809–1819

ing in pregnancy and increased BMI and risk of overweightin childhood [15, 18–25], whilst the child’s height deficit atbirth has been shown to track to age 8 years [22]. Studiescomparing the associations of maternal and paternalsmoking in pregnancy with offspring BMI also reportsimilar effects for both parental exposures [9, 24]. Further-more, a previous study in ALSPAC found an inverserelationship of parental social position with offspring BMCand BA at age 9.9 years, also acting via the pathway ofoffspring weight [26]. It therefore seems most plausible thatour associations are not explained by intrauterine effects,but rather that unmeasured aspects of the shared familyenvironment which are associated with parental smoking,such as diet or level of physical activity, influence increasedweight gain and greater bone mass in the children. Studieshave shown that overweight children and adolescents havehigher whole body and spinal bone mass [27–29] and thatBMC is positively related to both lean and fat mass inchildhood [30, 31]. Fat mass has been demonstrated tostimulate bone growth in prepubertal children previously inthe ALSPAC [32, 33].
There has been a greater association reported between fatmass and bone mineral accrual in girls than in boys duringpuberty [34, 35], which may in part explain why we foundno associations in boys, although one study suggests thatthis sex difference is not present in prepubertal children[35]. In our cohort, there was also a weaker univariaterelationship between maternal smoking and offspringweight in sons than in daughters, so it is also possible thatthe social characteristics in families where parents smokehave a lesser influence on adiposity in boys than girls. Inanalysis adjusted for pubertal stage (both genders) and ageat menarche (in girls), the associations between maternalsmoking and bone outcomes in girls were attenuated,whereas the paternal associations remained similar. Thissuggests that these positive maternal associations maypartly be explained by the association between maternalsmoking in pregnancy and earlier age at menarche, whichhas been shown previously in ALSPAC [36]. Adjustmentfor pubertal stage in boys did not affect the associationsbetween parental smoking and bone outcomes, and parentalsmoking was not related to pubertal stage at age 10 years inboys.
Our findings conflict with the study by Jones et al. [7]which indicated negative relationships between maternalsmoking in pregnancy and bone mass in 8-year-olds for thetotal body, femoral neck and lumbar spine, with relation-ships at the femoral neck and lumbar spine remaining afteradjustment for the child’s height and weight. However, theystudied a Tasmanian cohort identified at birth as atincreased risk of sudden infant death syndrome whichcontained 65% male offspring and a higher prevalence ofmaternal smoking during pregnancy (49%) compared with
ours (21%). Children of mothers who smoked were lighterat age 8 years in Jones’ study, whereas we found a strongpositive relationship between maternal smoking and off-spring weight. Jones et al. do not make comparison withpaternal smoking or give sex-specific findings.
The differing associations of parental smoking withspinal bone outcomes which we found in the complete caseand multiple imputation analyses are probably due to thedifferent populations represented by the two datasets sincethe complete case includes only around half of the childrenwho attended the 9-year clinic. The rationale for comparingmaternal and paternal smoking associations with offspringbone mass was that there is likely to be residual confound-ing in these relationships from unmeasured factors. Differ-ing distributions of unmeasured confounders in thecomplete case and multiply imputed datasets could explainthe difference between associations seen. Since there werediffering educational distributions between the completecase and multiply imputed datasets and we found thatparental smoking associations in the complete case differedbetween strata of parental education levels despite adjustingfor all observed confounders, it seems that residualconfounding is a possible explanation. Another possiblereason for the difference is violation of the multipleimputation assumption that the missing data mechanismscan be explained by other observed variables. However, weverified that missingness in each of the variables withmissing data was strongly associated with other observedvariables and included a number of predictors of missing-ness in prediction equations to impute missing data. Wetherefore expect the multiply imputed datasets to be morerepresentative of the study population and analyses basedon these data more accurate.
A limitation to our study was the self-report of smoking bythe mothers and fathers. Maternal smoking could be affectedby reporting bias since mothers may be aware of the harmfuleffects of smoking and less likely to respond affirmatively.Nevertheless, where both the mother and father providedinformation about the father’s smoking status, there wasagreement in 94.5% of couples. The study benefitted from itslarge size, the ability to control for a number of potentialconfounders and the ability to compare associations of boneoutcomes with both maternal and paternal exposures to assessthe level of residual confounding.
Conclusions
Our study has found positive associations of maternalsmoking during pregnancy with offspring total body andspinal bone mass in girls, with minimal evidence for anyassociations in boys, and our multivariable analyses andparental comparisons suggest that these associations are
Osteoporos Int (2011) 22:1809–1819 1817

largely driven by familial characteristics related to child-hood adiposity and unlikely to be due to intrauterinemechanisms. Although our findings do not demonstratenegative effects of maternal smoking in pregnancy onoffspring bone mass, its known adverse effects for mothersand offspring health mean than women should be encour-aged not to smoke.
Acknowledgments We are extremely grateful to all of the familieswho took part in this study, the midwives for their help in recruitingthem and the whole ALSPAC team, which includes interviewers,computer and laboratory technicians, clerical workers, researchscientists, volunteers, managers, receptionists and nurses.
Conflicts of interest None.
Funding The work presented in this paper was funded by WellcomeTrust grant number WT087997MA. Core support for ALSPAC isprovided by the United Kingdom Medical Research Council, theWellcome Trust and the University of Bristol. The UK MedicalResearch Council provides funding for the MRC Centre for CausalAnalyses in Translational Epidemiology (G0600705).
Open Access This article is distributed under the terms of theCreative Commons Attribution Noncommercial License which per-mits any noncommercial use, distribution, and reproduction in anymedium, provided the original author(s) and source are credited.
References
1. Cooper C, Cawley M, Bhalla A, Egger P, Ring F, Morton L,Barker D (1995) Childhood growth, physical-activity, and peakbone mass in women. J Bone Miner Res 10:940–947
2. Hernandez CJ, Beaupré GS, Carter DR (2003) A theoreticalanalysis of the relative influences of peak BMD, age-related boneloss and menopause on the development of osteoporosis.Osteoporos Int 14:843–847
3. Clark EM, Ness AR, Bishop NJ, Tobias JH (2006) Associationbetween bone mass and fractures in children: a prospective cohortstudy. J Bone Miner Res 21:1489–1495
4. Clark EM, Ness AR, Tobias JH (2008) Bone fragility contributesto the risk of fracture in children, even after moderate and severetrauma. J Bone Miner Res 23:173–179
5. Godfrey K, Walker-Bone K, Robinson S, Taylor P, Shore S,Wheeler T, Cooper C (2001) Neonatal bone mass: influence ofparental birthweight, maternal smoking, body composition, andactivity during pregnancy. J Bone Miner Res 16:1694–1703
6. Harvey NC, Javaid MK, Arden NK, Poole JR, Crozier SR,Robinson SM, Inskip HM, Godfrey KM, Dennison EM, CooperC, SWS Study Team (2010) Maternal predictors of neonatal bonesize and geometry: the Southampton Women’s Survey. J Dev OrigHealth Dis 1:35–41
7. Jones G, Riley M, Dwyer T (1999) Maternal smoking duringpregnancy, growth, and bone mass in prepubertal children. J BoneMiner Res 14:146–151
8. Leary S, Davey Smith G, Ness A (2006) Smoking duringpregnancy and components of stature in offspring. Am J HumBiol 18:502–512
9. Leary SD, Davey Smith G, Rogers IS, Reilly JJ, Wells JC, NessAR (2006) Smoking during pregnancy and offspring fat and leanmass in childhood. Obesity (Silver Spring) 14:2284–2293
10. Brion MJA, Leary SD, Davey Smith G, Ness AR (2007) Similarassociations of parental prenatal smoking suggest child bloodpressure is not influenced by intrauterine effects. Hypertension49:1422–1428
11. Davey Smith G (2008) Assessing intrauterine influences onoffspring health outcomes: can epidemiological studies yieldrobust findings? Basic Clin Pharmacol Toxicol 102:245–256
12. Ainsworth BE, Haskell WL, Whitt MC, Irwin ML, Swartz AM,Strath SJ, O’Brien WL, Bassett DR, Schmitz KH, EmplaincourtPO, Jacobs DR, Leon AS (2000) Compendium of physicalactivities: an update of activity codes and MET intensities. MedSci Sports Exerc 32:S498–S516
13. Rogers I, Emmett P (1998) Diet during pregnancy in a populationof pregnant women in South West England. Eur J Clin Nutr52:246–250
14. Rubin DB (1996) Multiple imputation after 18+ years. J Am StatAssoc 91:473–489
15. Vik T, Jacobsen G, Vatten L, Bakketeig LS (1996) Pre- and post-natal growth in children of women who smoked in pregnancy.Early Hum Dev 45:245–255
16. Floyd RL, Rimer BK, Giovino GA, Mullen PD, Sullivan SE(1993) A review of smoking in pregnancy—effects on pregnancyoutcomes and cessation efforts. Annu Rev Public Health 14:379–411
17. Jones G, Dwyer T (2000) Birth weight, birth length, and bonedensity in prepubertal children: evidence for an association thatmay be mediated by genetic factors. Calcif Tissue Int 67:304–308
18. Williams S, Poulton R (1999) Twins and maternal smoking:ordeals for the fetal origins hypothesis? A cohort study. Br Med J318:897–900
19. Toschke AM, Koletzko B, Slikker W, Hermann M, von Kries R(2002) Childhood obesity is associated with maternal smoking inpregnancy. Eur J Pediatr 161:445–448
20. von Kries R, Toschke AM, Koletzko B, Slikker W (2002)Maternal smoking during pregnancy and childhood obesity. AmJ Epidemiol 156:954–961
21. Wideroe M, Vik T, Jacobsen G, Bakketeig LS (2003) Doesmaternal smoking during pregnancy cause childhood overweight?Paediatr Perinat Epidemiol 17:171–179
22. Chen AM, Pennell ML, Klebanoff MA, Rogan WJ, LongneckerMP (2006) Maternal smoking during pregnancy in relation tochild overweight: follow-up to age 8 years. Int J Epidemiol35:121–130
23. Gilman SE, Gardener H, Buka SL (2008) Maternal smokingduring pregnancy and children’s cognitive and physical develop-ment: a causal risk factor? Am J Epidemiol 168:522–531
24. von Kries R, Bolte G, Baghi L, Toschke AM (2008) Parentalsmoking and childhood obesity—is maternal smoking in preg-nancy the critical exposure? Int J Epidemiol 37:210–216
25. Nagel G, Wabitsch M, Galm C, Berg S, Brandstetter S, Fritz M,Klenk J, Peter R, Prokopchuk D, Steiner R, Stroth S, Wartha O,Weiland SK, Steinacker J (2009) Determinants of obesity in theUlm Research on Metabolism, Exercise and Lifestyle in Children(URMEL-ICE). Eur J Pediatr 168:1259–1267
26. Clark EM, Ness A, Tobias JH (2005) Social position affects bonemass in childhood through opposing actions on height and weight.J Bone Miner Res 20:2082–2089
27. Goulding A, Taylor RW, Jones IE, Manning PJ, Williams SM(2002) Spinal overload: a concern for obese children andadolescents? Osteoporos Int 13:835–840
28. Rocher E, Chappard C, Jaffre C, Benhamou CL, Courteix D(2008) Bone mineral density in prepubertal obese and control
1818 Osteoporos Int (2011) 22:1809–1819

children: relation to body weight, lean mass, and fat mass. J BoneMiner Metab 26:73–78
29. El Hage R, Jacob C, Moussa E, Benhamou CL, Jaffre C (2009)Total body, lumbar spine and hip bone mineral density inoverweight adolescent girls: decreased or increased? J BoneMiner Metab 27:629–633
30. Ilich JZ, Skugor M, Hangartner T, An BS, Matkovic V (1998)Relation of nutrition, body composition and physical activity toskeletal development: a cross-sectional study in preadolescentfemales. J Am Coll Nutr 17:136–147
31. Goulding A, Taylor RW, Grant AM, Murdoch L, Williams SM,Taylor BJ (2008) Relationship of total body fat mass to bone areain New Zealand five-year-olds. Calcif Tissue Int 82:293–299
32. Clark EM, Ness AR, Tobias JH (2006) Adipose tissue stimulatesbone growth in prepubertal children. J Clin Endocrinol Metab91:2534–2541
33. Timpson NJ, Sayers A, Davey Smith G, Tobias JH (2009)How does body fat influence bone mass in childhood? AMendelian randomization approach. J Bone Miner Res24:522–533
34. Sayers A, Tobias JH (2010) Fat mass exerts a greater effect oncortical bone mass in girls than boys. J Clin Endocrinol Metab95:699–706
35. Ackerman A, Thornton JC, Wang J, Pierson RN Jr, Horlick M(2006) Sex difference in the effect of puberty on the relationshipbetween fat mass and bone mass in 926 healthy subjects, 6–18 years old. Obesity (Silver Spring) 14:819–825
36. Rubin C, Maisonet M, Kieszak S, Monteilh C, Holmes A,Flanders D, Heron J, Golding J, McGeehin M, Marcus M(2009) Timing of maturation and predictors of menarche in girlsenrolled in a contemporary British cohort. Paediatr PerinatEpidemiol 23:492–504
Osteoporos Int (2011) 22:1809–1819 1819