
Parametric Optimization of MIG Welding for Temperature Distribution Using DOE-FEA Method
13
International Journal of Emerging Trends in Engineering and Development Issue 4, Vol.3 (May 2014) Available online on http://www.rspublication.com/ijeted/ijeted_index.htm ISSN 2249-6149 R S. Publication (rspublication.com), [email protected] Page 644 Parametric Optimization of MIG Welding for Temperature Distribution Using DOE-FEA Method Satyaduttsinh P. Chavda 1 , Jayesh V. Desai 2 , Tushar M. Patel 3 1 M.E Scholar, Mechanical Engineering, KSV University, Gandhinagar, India 2 Assistant Professor, Mechanical Engineering, KSV University, Gandhinagar, India 3 Associate Professor, Mechanical Engineering, KSV University, Gandhinagar, India ABSTRACT The MIG welding parameters are the most important factors affecting the quality, productivity and cost of welding. This paper presents the effect of welding parameters like welding current, welding voltage, Gas flow rate; weld Speed, etc. of temperature distribution on weld plate of AISI 1045 Medium Carbon Steel material during welding. By using DOE and FEA method, the parameters are optimized and having the best parameters combination for target quality. The FEM model is employed to simulate the MIG welding process in order to quantitatively understand the effects of process parameters on temperature distribution. The aim of the model is to predict the thermal analysis resulting from the welding of the plates and experiments have been carried out in order to compare to the FEM model result. Optimal combination parameters contribution effects of MIG operation is obtained by FEA- DOE hybrid modelling with confirmation result. KEYWORDS: MIG welding, AISI1045 Medium carbon steel, DOE method-Orthogonal array, S/N Ratio, FEA (ANSYS) - temperature distribution 1. INTRODUCTION Metal Inert Gas welding as the name suggests, is a process in which the source of heat is an arc formed between a consumable metal electrode and the work piece, and the arc and the molten puddle are protected from contamination by the atmosphere (i.e. oxygen and nitrogen) with an externally supplied gaseous shield of inert gas such as argon, helium or an argon- helium mixture. No external filler metal is necessary, because the metallic electrode provides the arc as well as the filler metal. It is often referred to in abbreviated form as MIG welding. MIG is an arc welding process where in coalescence is obtained by heating the job with an electric arc produced between work piece and metal electrode feed continuously. A metal inert gas (MIG) welding process consists of heating, melting and solidification of parent metals and a filler material in localized fusion zone by a transient heat source to form a joint between the parent metals. Gas metal arc welding is a gas shielded process that can be effectively used in all positions. The American Welding Society refers to the process as Gas Metal Arc Welding and has given it the letter designation GMAW. This term appears simpler because it to covers inert as well as active shielding gases. 1.1 Working principle of MIG Welding : As shown in fig. the electrode in this process is in the form of coil and continuously fed towards the work during the process. At the same time inert gas (e.g. argon, helium, or 2 ) is
Transcript of Parametric Optimization of MIG Welding for Temperature Distribution Using DOE-FEA Method
International Journal of Emerging Trends in Engineering and Development Issue 4, Vol.3 (May 2014)
Available online on http://www.rspublication.com/ijeted/ijeted_index.htm ISSN 2249-6149
R S. Publication (rspublication.com), [email protected] Page 644
Parametric Optimization of MIG Welding for
Temperature Distribution Using DOE-FEA Method
Satyaduttsinh P. Chavda1, Jayesh V. Desai2, Tushar M. Patel3
1M.E Scholar, Mechanical Engineering, KSV University, Gandhinagar, India 2Assistant Professor, Mechanical Engineering, KSV University, Gandhinagar, India 3Associate Professor, Mechanical Engineering, KSV University, Gandhinagar, India
ABSTRACT The MIG welding parameters are the most important factors affecting the quality,
productivity and cost of welding. This paper presents the effect of welding parameters like
welding current, welding voltage, Gas flow rate; weld Speed, etc. of temperature distribution
on weld plate of AISI 1045 Medium Carbon Steel material during welding. By using DOE
and FEA method, the parameters are optimized and having the best parameters combination
for target quality. The FEM model is employed to simulate the MIG welding process in order
to quantitatively understand the effects of process parameters on temperature distribution.
The aim of the model is to predict the thermal analysis resulting from the welding of the
plates and experiments have been carried out in order to compare to the FEM model result.
Optimal combination parameters contribution effects of MIG operation is obtained by FEA-
DOE hybrid modelling with confirmation result.
KEYWORDS: MIG welding, AISI1045 Medium carbon steel, DOE method-Orthogonal
array, S/N Ratio, FEA (ANSYS) - temperature distribution
1. INTRODUCTION
Metal Inert Gas welding as the name suggests, is a process in which the source of heat is an
arc formed between a consumable metal electrode and the work piece, and the arc and the
molten puddle are protected from contamination by the atmosphere (i.e. oxygen and nitrogen)
with an externally supplied gaseous shield of inert gas such as argon, helium or an argon-
helium mixture. No external filler metal is necessary, because the metallic electrode provides
the arc as well as the filler metal. It is often referred to in abbreviated form as MIG welding.
MIG is an arc welding process where in coalescence is obtained by heating the job with an
electric arc produced between work piece and metal electrode feed continuously. A metal
inert gas (MIG) welding process consists of heating, melting and solidification of parent
metals and a filler material in localized fusion zone by a transient heat source to form a joint
between the parent metals. Gas metal arc welding is a gas shielded process that can be
effectively used in all positions.
The American Welding Society refers to the process as Gas Metal Arc Welding and
has given it the letter designation GMAW. This term appears simpler because it to covers
inert as well as active shielding gases.
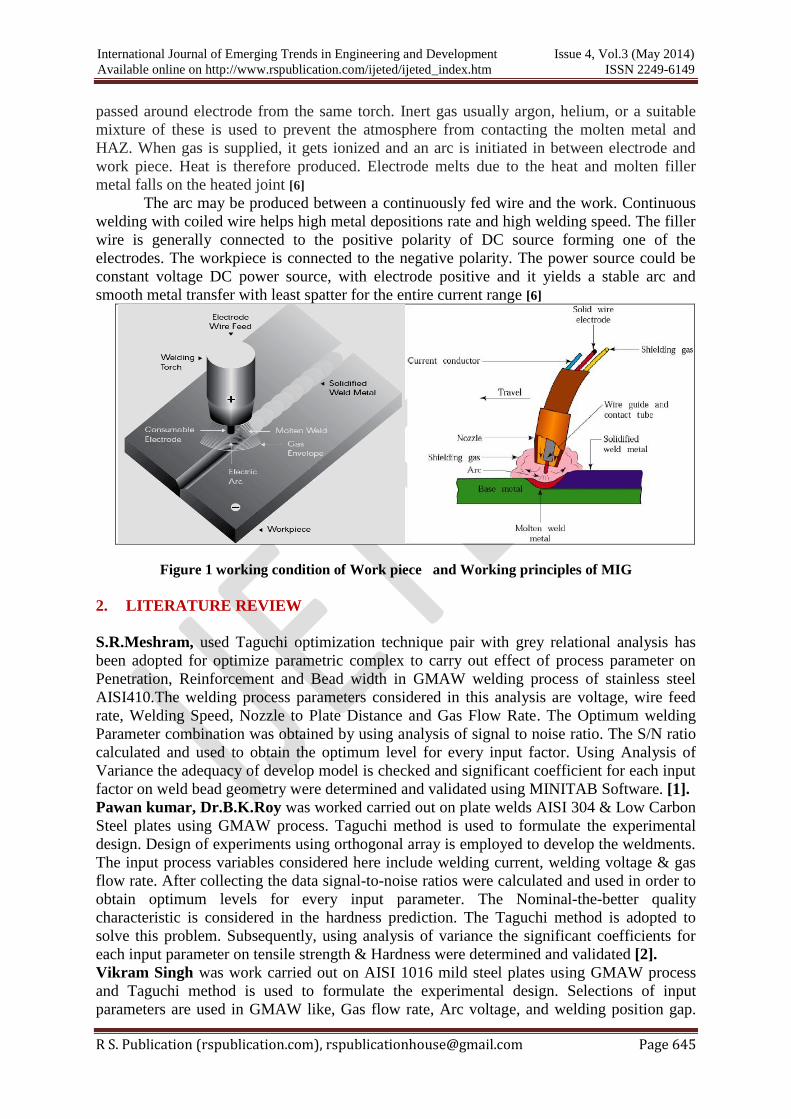
1.1 Working principle of MIG Welding :
As shown in fig. the electrode in this process is in the form of coil and continuously fed
towards the work during the process. At the same time inert gas (e.g. argon, helium, or𝐶𝑂2) is
International Journal of Emerging Trends in Engineering and Development Issue 4, Vol.3 (May 2014)
Available online on http://www.rspublication.com/ijeted/ijeted_index.htm ISSN 2249-6149
R S. Publication (rspublication.com), [email protected] Page 645
passed around electrode from the same torch. Inert gas usually argon, helium, or a suitable
mixture of these is used to prevent the atmosphere from contacting the molten metal and
HAZ. When gas is supplied, it gets ionized and an arc is initiated in between electrode and
work piece. Heat is therefore produced. Electrode melts due to the heat and molten filler
metal falls on the heated joint [6]
The arc may be produced between a continuously fed wire and the work. Continuous
welding with coiled wire helps high metal depositions rate and high welding speed. The filler
wire is generally connected to the positive polarity of DC source forming one of the
electrodes. The workpiece is connected to the negative polarity. The power source could be
constant voltage DC power source, with electrode positive and it yields a stable arc and
smooth metal transfer with least spatter for the entire current range [6]
Figure 1 working condition of Work piece and Working principles of MIG
2. LITERATURE REVIEW
S.R.Meshram, used Taguchi optimization technique pair with grey relational analysis has
been adopted for optimize parametric complex to carry out effect of process parameter on
Penetration, Reinforcement and Bead width in GMAW welding process of stainless steel
AISI410.The welding process parameters considered in this analysis are voltage, wire feed
rate, Welding Speed, Nozzle to Plate Distance and Gas Flow Rate. The Optimum welding
Parameter combination was obtained by using analysis of signal to noise ratio. The S/N ratio
calculated and used to obtain the optimum level for every input factor. Using Analysis of
Variance the adequacy of develop model is checked and significant coefficient for each input
factor on weld bead geometry were determined and validated using MINITAB Software. [1].
Pawan kumar, Dr.B.K.Roy was worked carried out on plate welds AISI 304 & Low Carbon
Steel plates using GMAW process. Taguchi method is used to formulate the experimental
design. Design of experiments using orthogonal array is employed to develop the weldments.
The input process variables considered here include welding current, welding voltage & gas
flow rate. After collecting the data signal-to-noise ratios were calculated and used in order to
obtain optimum levels for every input parameter. The Nominal-the-better quality
characteristic is considered in the hardness prediction. The Taguchi method is adopted to
solve this problem. Subsequently, using analysis of variance the significant coefficients for
each input parameter on tensile strength & Hardness were determined and validated [2].
Vikram Singh was work carried out on AISI 1016 mild steel plates using GMAW process
and Taguchi method is used to formulate the experimental design. Selections of input
parameters are used in GMAW like, Gas flow rate, Arc voltage, and welding position gap.
International Journal of Emerging Trends in Engineering and Development Issue 4, Vol.3 (May 2014)
Available online on http://www.rspublication.com/ijeted/ijeted_index.htm ISSN 2249-6149
R S. Publication (rspublication.com), [email protected] Page 646
Taguchi optimization method was applied to find the optimal process parameters for Tensile
Strength. A Taguchi orthogonal array, the signal-to-noise ratio and analysis of variance were
used for the optimization of welding parameters. A conformation experiment was also
conducted and verified the effectiveness of the Taguchi optimization method [4].
Rabih Kamal, Henri Champliaud, Jacques Lanteigne studied the Finite Element (FE)
modeling of a two-seam welding process for a T-joint preparation and using material AISI
1018 steel plate. The aim of the model is to predict the deformations and residual stresses
resulting from the welding of the plates and experiments have been carried out in order to
compare to the FE model. For the simulation, the temperature dependent thermo-physical
material properties are taken in consideration. A new formula has been presented for the
evaluation of the combined heat loss coefficient the results of the numerical model are
compared to experiments [3].
Amudala Nata Sekhar Babu was investigated finite element model was developed for the
analysis of hybrid welding process. The combination of laser and Arc (MIG/TIG) welding
processes in a same process zone is known as Hybrid Welding. Hybrid welding Simulations
were carried out for AISI 304 stainless Steel plate. The effects of laser beam power, Arc
Welding and torch angle on the weld-bead geometry were investigated. The experimental
plan was based on three factor 5 level central composite rotatable design. Second order
polynomial equations for predicting the weld-bead geometry were developed for bead width
and penetration. A design matrix was developed by identifying proper control variables and
bead dimensions were obtained from the simulations using ANSYS. The developed DOE
involves making a set of representative experiments with regards to a set of input variables.
In factorial design, the experiments are conducted for all possible combinations of the
parameter levels. The FEA model was simulated as per the designed matrix and various
temperature contours, time-temperature history plots; melting point isotherms for weld bead
profile were obtained. ANSYS result was compared with the Experimental [4].
NURAINI, A, A., ZAINAL A.S.M was investigated on MIG welding and two type of
welding process parameter are used as a model in this study. One of them is optimum
parameter and other non-optimum parameter. The welded plates and filler material is
considered as a solid body. A moving heat source model is developed to present the heat
generated by the torch in the Robotic and three-dimensional mesh consisted of 1824 elements
and 11055 nodes are taken. The same size mesh is used for both the thermal and mechanical
analysis and the numbers were consistent for all models. The distribution of the residual
stresses in weld joint of optimization and non-optimum welding parameter was investigated
by finite element method using ANSYS software. The welding simulation was considered as
a sequential coupled thermo-mechanical analysis and the residual stress distribution and
magnitude in the axial direction was obtained [5].
3. OBJECTIVE AND EXPERIMENTAL PROCEDURE:
1. To study the effect of various process parameters are voltage, Welding current, gas flow
rate and welding speed of MIG Welding And optimization of MIG welding operating
process parameters are for Medium carbon steel work piece using FEA -DOE method
2. To study effect of weld quality in terms of Temperature distribution.
3. To get the optimum parameters, combination of FEA and DOE will be implemented and
the experimental data will be used to validate a finite element model.
Experimental investigation includes following steps
1. Formulation of the problem – the success of any experiment is dependent on a full
understanding of the nature of the problem.
International Journal of Emerging Trends in Engineering and Development Issue 4, Vol.3 (May 2014)
Available online on http://www.rspublication.com/ijeted/ijeted_index.htm ISSN 2249-6149
R S. Publication (rspublication.com), [email protected] Page 647
2. Selection of MIG welding process parameters and Choose important factors and their
range & no. of levels
3. Find the upper and lower limits (i.e. range) of the identified process parameters.
4. Select the orthogonal array (design of matrix). And Selection of factor levels.
5. Conduct the experiments as per the selected orthogonal array.
6. Find the optimum condition for maximizing the Temperature Distribution on weld plate.
7. Identify the significant factors.
8. To Perform FEA with appropriate set of parameters.
9. Modeling and FEA with optimum parameter set for validation
10. Check the adequacy of the developed models
3.1 FEA simulation of welding temperature distribution
The study of heat flow input and temperature distribution in the parts being welded
becomes necessary otherwise may lead to failure of the component. Finite element analysis
(FEA) was used by many authors to perform welding simulations and to study the thermal
history. Modeling of the welding process must account for the specialized effects of the
moving weld source. The computer based simulations offer the possibility to examine
different aspects of the process without having the prototype of the product. The finite
element modeling and simulations were performed for welding of AISI 1045 material using
ANSYS 14.5 software. The temperature can be generated during the welding procedure is
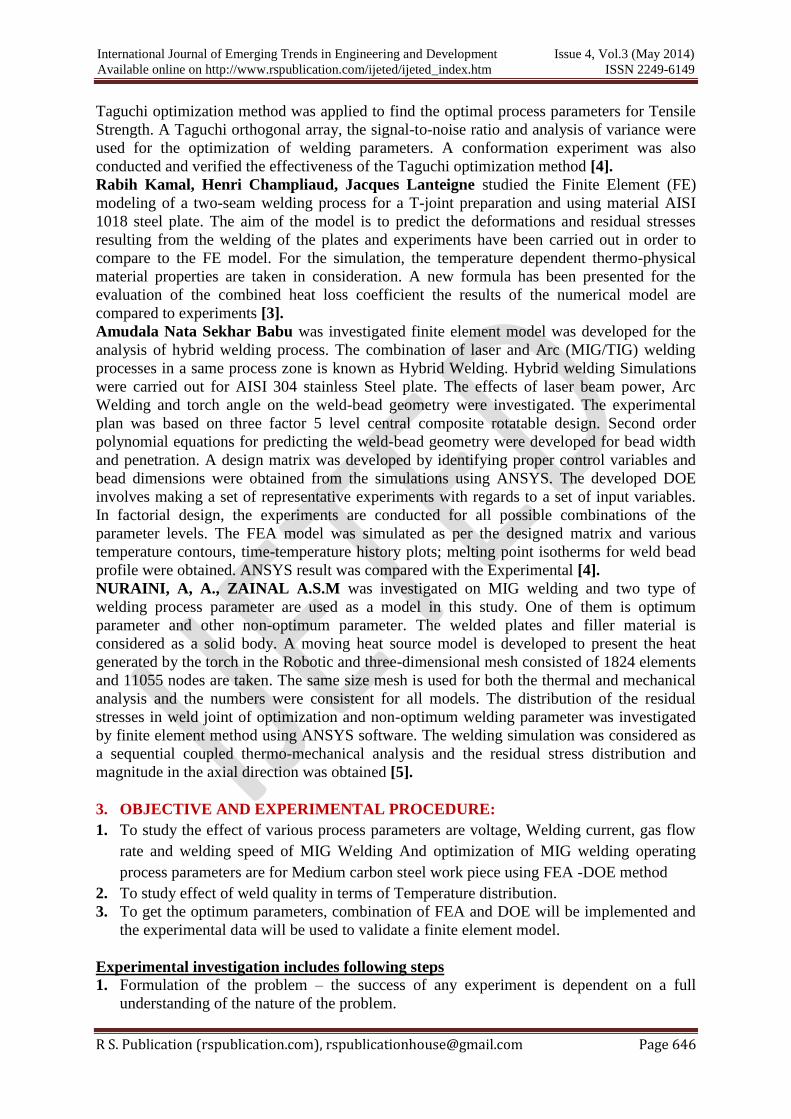
measured by using the infrared sensor instrument. The amount of heat input during welding
‘Q’ was calculated as follows.
(Q) = V×I×60/ U×1000 kJ/mm To simplify the welding simulation, it is computationally efficient to perform thermal
and mechanical analyses separately. The Heat input during welding is modeled in
commercially available software by the equivalent heat input which includes body heat flux.
The amount of heat input has been calculated by using empirical relation shown in equation.
Arc efficiency is denoted by 𝜂, arc voltage by V, Arc current by I, and Travel speed by U.
Typical welding parameters taken in this study as per experiment and arc efficiency is 70% to
85%.
Table 1 Heat Input Calculation
International Journal of Emerging Trends in Engineering and Development Issue 4, Vol.3 (May 2014)
Available online on http://www.rspublication.com/ijeted/ijeted_index.htm ISSN 2249-6149
R S. Publication (rspublication.com), [email protected] Page 648
Total time taken for the entire welding process for different welding speed is given as
follows: (i) Time for completing welding = length of plate/welding speed= 250/200=99.6sec
(ii)Time for completing welding = length of plate/welding speed= 250/225= 66.69sec (ii)
Time for completing welding = length of plate/welding speed= 250/250=60sec. Welding
speed represents the distance of the welding torch traveled along the weld line per unit of
time. The heat input is inversely proportional to the welding speed. Therefore, when the
welding speed is slower the heat input is larger. In this project work, low, medium, and high
welding speeds are considered. Fig 5 and 6 shows the variation of Temperature distribution
with respect to welding speed.
3.2 Design of experiment:
DOE is a technique of defining and investing all possible combinations in an
experiment involving multiple factors and to identify the best combination. In this, different
factors and their levels are identified. Design of experiments is also useful to combine the
factors at appropriate levels, each with the respective acceptable range, to produce the best
results and yet exhibit minimum variation around the optimum results so that better quality
products can be produced quickly and at minimum cost.
The marriage of Design of Experiments with optimization of control parameters to
find best results is attained in the Taguchi Method. “Orthogonal Arrays” (OA) gives a set of
well balanced (minimum) experiments and Dr. Taguchi’s Signal-to-Noise ratios (S/N), which
are log functions of desired output, serve as objective functions in optimization, help in data
analysis and The signal-to-noise (S/N) ratio for each level was based on the S/N ratio
analysis. Based on the tensile strength of the weld joint (larger-the-better), a higher S/N ratio
produced a better quality value. The standard S/N ratio formula for this type of response is:
S/N ratio η is defined as η= -10 log (M.S.D.)
Where, M.S.D. is the mean square deviation for output characteristic.
Where ‘i’ is the number of a trial; ‘Yij’ is the quality of the i^th trial and j^th experiment;
‘n’ is the total number of experiments.
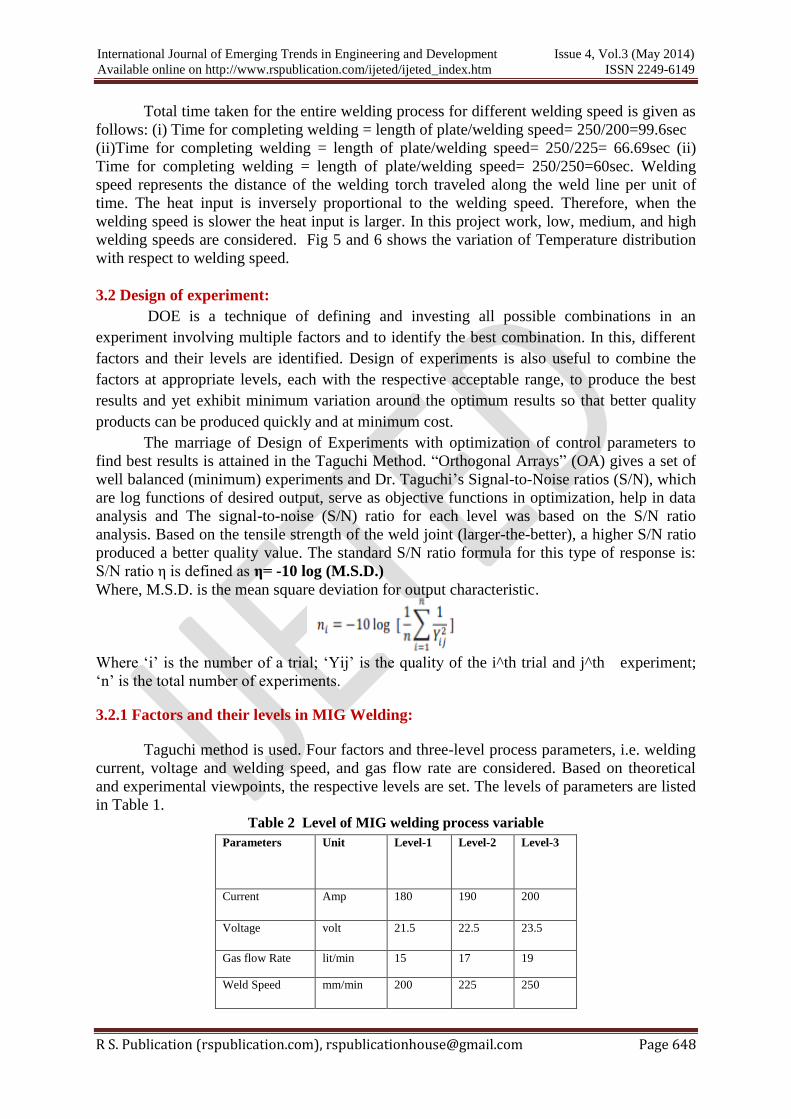
3.2.1 Factors and their levels in MIG Welding:
Taguchi method is used. Four factors and three-level process parameters, i.e. welding
current, voltage and welding speed, and gas flow rate are considered. Based on theoretical
and experimental viewpoints, the respective levels are set. The levels of parameters are listed
in Table 1. Table 2 Level of MIG welding process variable
Parameters Unit Level-1 Level-2 Level-3
Current Amp 180 190 200
Voltage volt 21.5 22.5 23.5
Gas flow Rate lit/min 15 17 19
Weld Speed mm/min 200 225 250
International Journal of Emerging Trends in Engineering and Development Issue 4, Vol.3 (May 2014)
Available online on http://www.rspublication.com/ijeted/ijeted_index.htm ISSN 2249-6149
R S. Publication (rspublication.com), [email protected] Page 649
Table 3 Experimental Layout using L9 Orthogonal Array
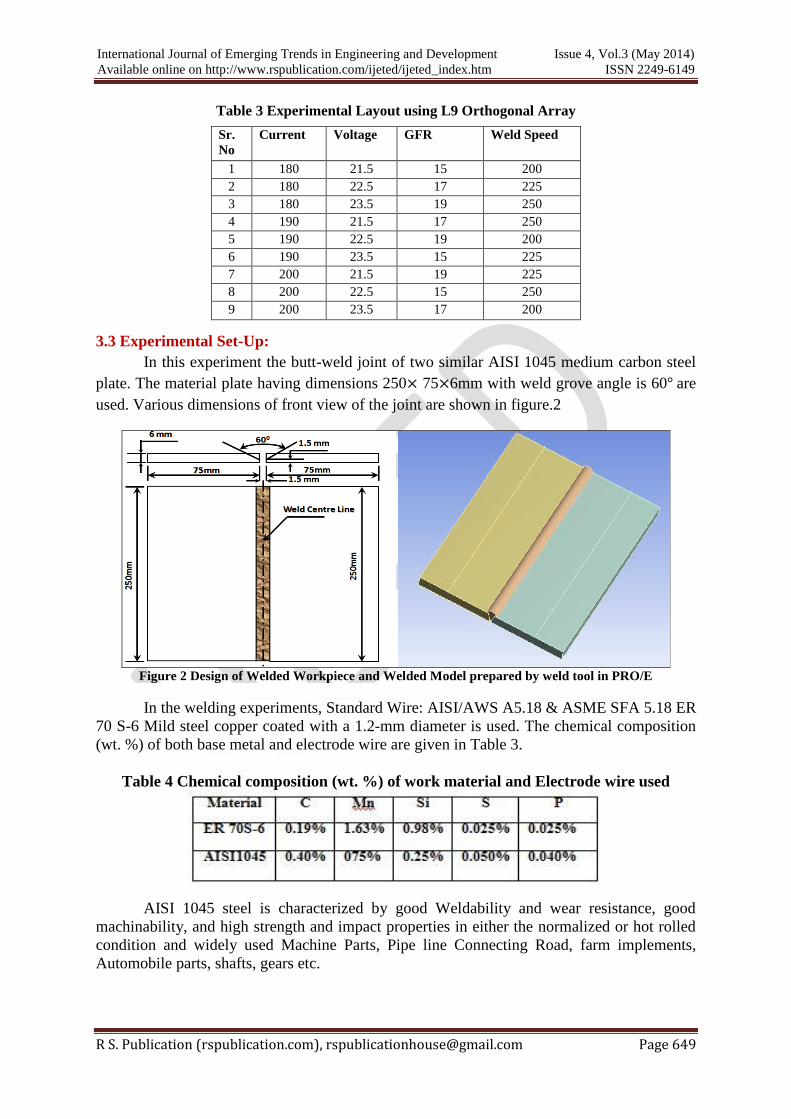
3.3 Experimental Set-Up:
In this experiment the butt-weld joint of two similar AISI 1045 medium carbon steel
plate. The material plate having dimensions 250× 75×6mm with weld grove angle is 60° are
used. Various dimensions of front view of the joint are shown in figure.2
Figure 2 Design of Welded Workpiece and Welded Model prepared by weld tool in PRO/E
In the welding experiments, Standard Wire: AISI/AWS A5.18 & ASME SFA 5.18 ER
70 S-6 Mild steel copper coated with a 1.2-mm diameter is used. The chemical composition
(wt. %) of both base metal and electrode wire are given in Table 3.
Table 4 Chemical composition (wt. %) of work material and Electrode wire used
AISI 1045 steel is characterized by good Weldability and wear resistance, good
machinability, and high strength and impact properties in either the normalized or hot rolled
condition and widely used Machine Parts, Pipe line Connecting Road, farm implements,
Automobile parts, shafts, gears etc.
Sr.
No
Current Voltage GFR Weld Speed
1 180 21.5 15 200
2 180 22.5 17 225
3 180 23.5 19 250
4 190 21.5 17 250
5 190 22.5 19 200
6 190 23.5 15 225
7 200 21.5 19 225
8 200 22.5 15 250
9 200 23.5 17 200
International Journal of Emerging Trends in Engineering and Development Issue 4, Vol.3 (May 2014)
Available online on http://www.rspublication.com/ijeted/ijeted_index.htm ISSN 2249-6149
R S. Publication (rspublication.com), [email protected] Page 650
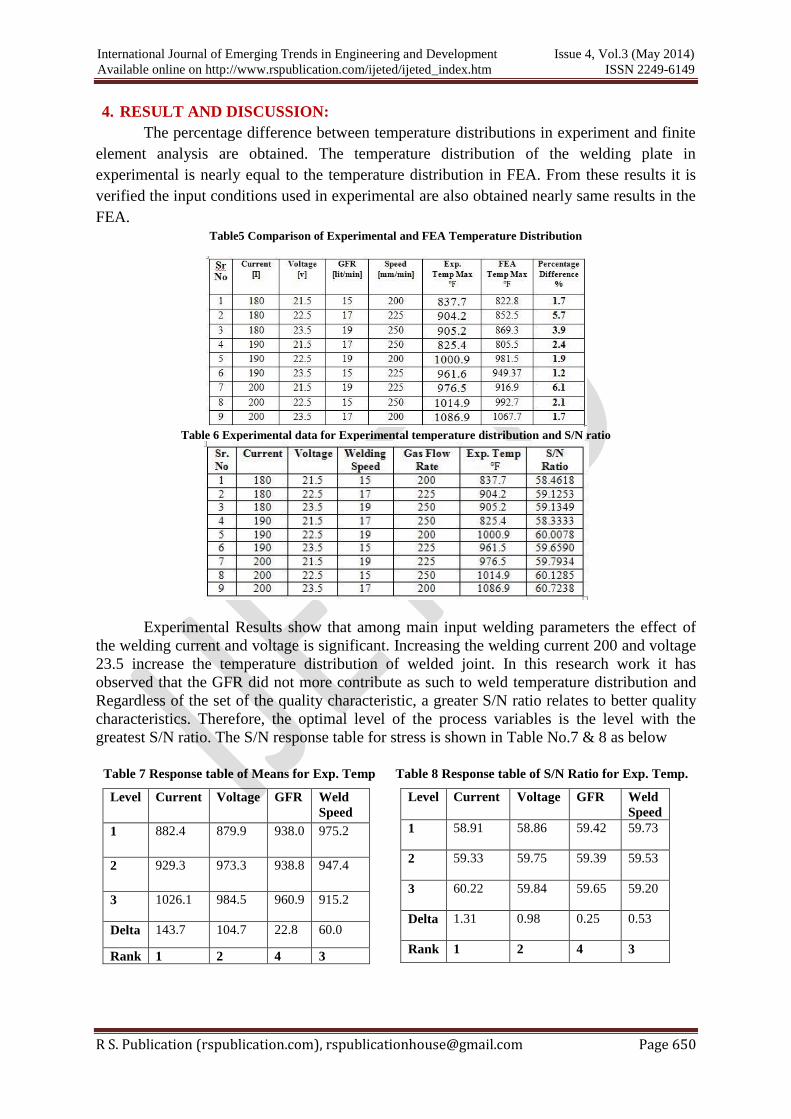
4. RESULT AND DISCUSSION:
The percentage difference between temperature distributions in experiment and finite
element analysis are obtained. The temperature distribution of the welding plate in
experimental is nearly equal to the temperature distribution in FEA. From these results it is
verified the input conditions used in experimental are also obtained nearly same results in the
FEA. Table5 Comparison of Experimental and FEA Temperature Distribution
Table 6 Experimental data for Experimental temperature distribution and S/N ratio
Experimental Results show that among main input welding parameters the effect of
the welding current and voltage is significant. Increasing the welding current 200 and voltage
23.5 increase the temperature distribution of welded joint. In this research work it has
observed that the GFR did not more contribute as such to weld temperature distribution and
Regardless of the set of the quality characteristic, a greater S/N ratio relates to better quality
characteristics. Therefore, the optimal level of the process variables is the level with the
greatest S/N ratio. The S/N response table for stress is shown in Table No.7 & 8 as below
Table 7 Response table of Means for Exp. Temp Table 8 Response table of S/N Ratio for Exp. Temp.
Level Current Voltage GFR Weld
Speed
1 882.4 879.9 938.0 975.2
2 929.3 973.3 938.8 947.4
3 1026.1 984.5 960.9 915.2
Delta 143.7 104.7 22.8 60.0
Rank 1 2 4 3
Level Current Voltage GFR Weld
Speed
1 58.91 58.86 59.42 59.73
2 59.33 59.75 59.39 59.53
3 60.22 59.84 59.65 59.20
Delta 1.31 0.98 0.25 0.53
Rank 1 2 4 3
International Journal of Emerging Trends in Engineering and Development Issue 4, Vol.3 (May 2014)
Available online on http://www.rspublication.com/ijeted/ijeted_index.htm ISSN 2249-6149
R S. Publication (rspublication.com), [email protected] Page 651
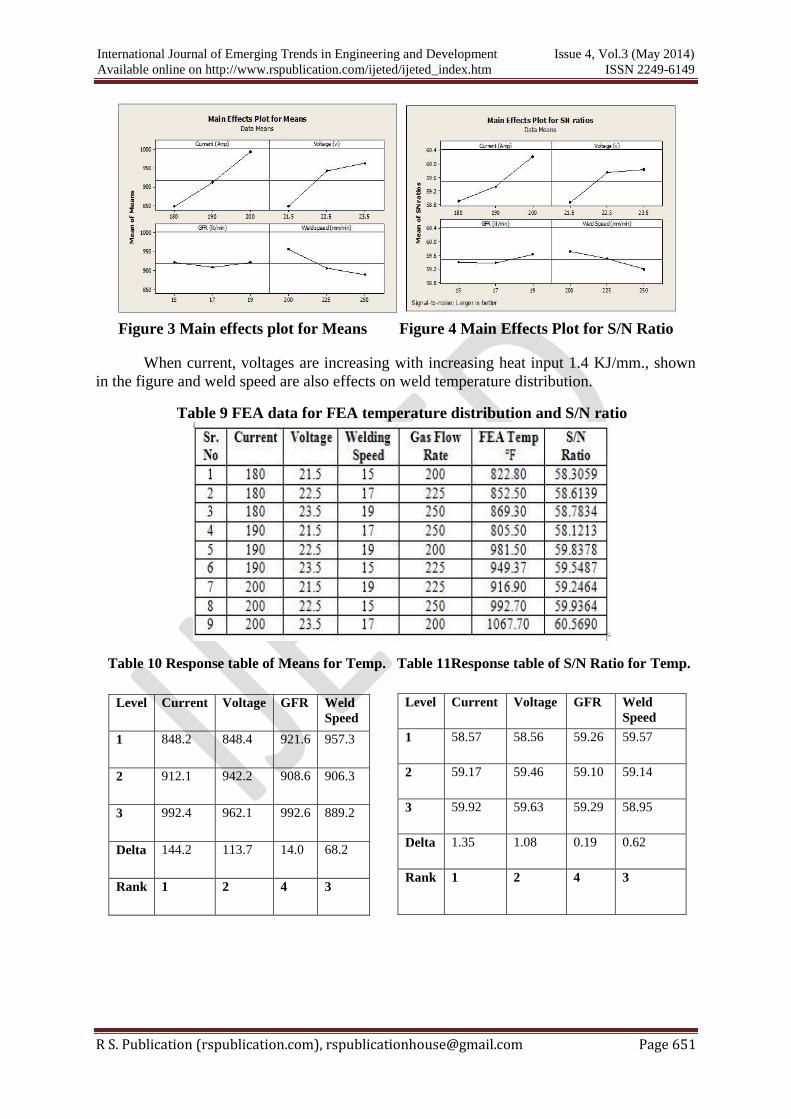
Figure 3 Main effects plot for Means Figure 4 Main Effects Plot for S/N Ratio
When current, voltages are increasing with increasing heat input 1.4 KJ/mm., shown
in the figure and weld speed are also effects on weld temperature distribution.
Table 9 FEA data for FEA temperature distribution and S/N ratio
Table 10 Response table of Means for Temp. Table 11Response table of S/N Ratio for Temp.
Level Current Voltage GFR Weld
Speed
1 848.2 848.4 921.6 957.3
2 912.1 942.2 908.6 906.3
3 992.4 962.1 992.6 889.2
Delta 144.2 113.7 14.0 68.2
Rank 1 2 4 3
Level Current Voltage GFR Weld
Speed
1 58.57 58.56 59.26 59.57
2 59.17 59.46 59.10 59.14
3 59.92 59.63 59.29 58.95
Delta 1.35 1.08 0.19 0.62
Rank 1 2 4 3
International Journal of Emerging Trends in Engineering and Development Issue 4, Vol.3 (May 2014)
Available online on http://www.rspublication.com/ijeted/ijeted_index.htm ISSN 2249-6149
R S. Publication (rspublication.com), [email protected] Page 652
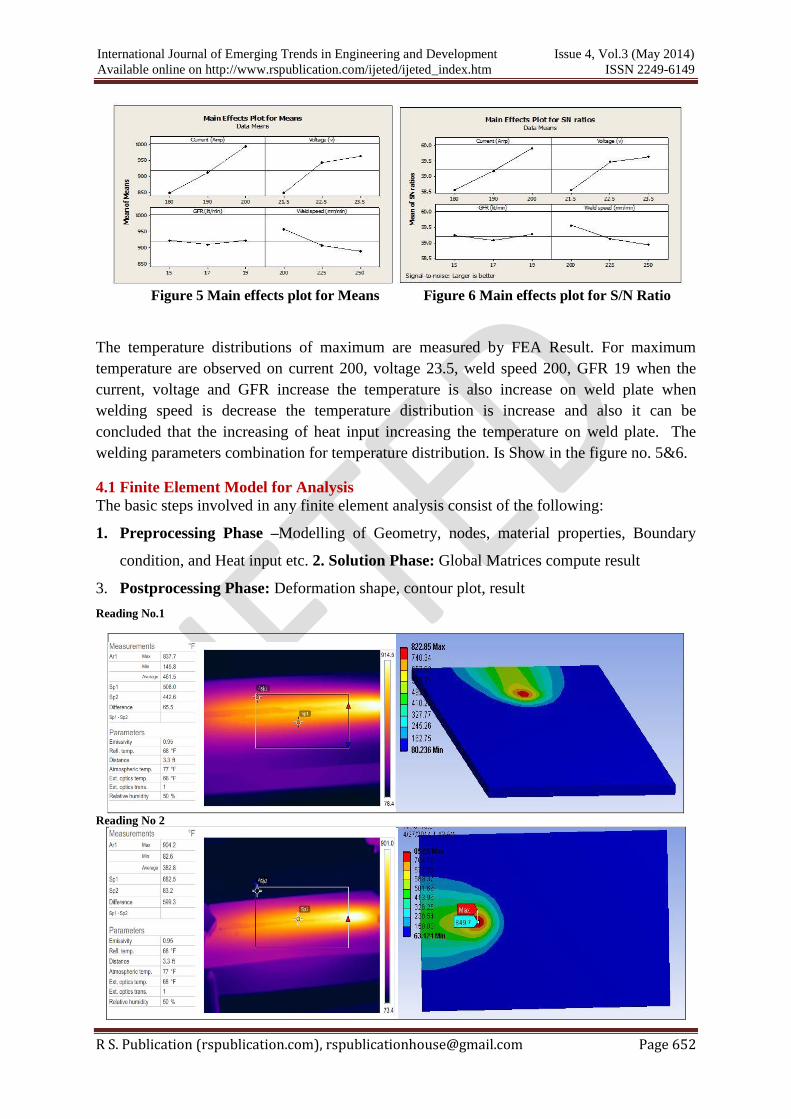
Figure 5 Main effects plot for Means Figure 6 Main effects plot for S/N Ratio
The temperature distributions of maximum are measured by FEA Result. For maximum
temperature are observed on current 200, voltage 23.5, weld speed 200, GFR 19 when the
current, voltage and GFR increase the temperature is also increase on weld plate when
welding speed is decrease the temperature distribution is increase and also it can be
concluded that the increasing of heat input increasing the temperature on weld plate. The
welding parameters combination for temperature distribution. Is Show in the figure no. 5&6.
4.1 Finite Element Model for Analysis
The basic steps involved in any finite element analysis consist of the following:
1. Preprocessing Phase –Modelling of Geometry, nodes, material properties, Boundary
condition, and Heat input etc. 2. Solution Phase: Global Matrices compute result
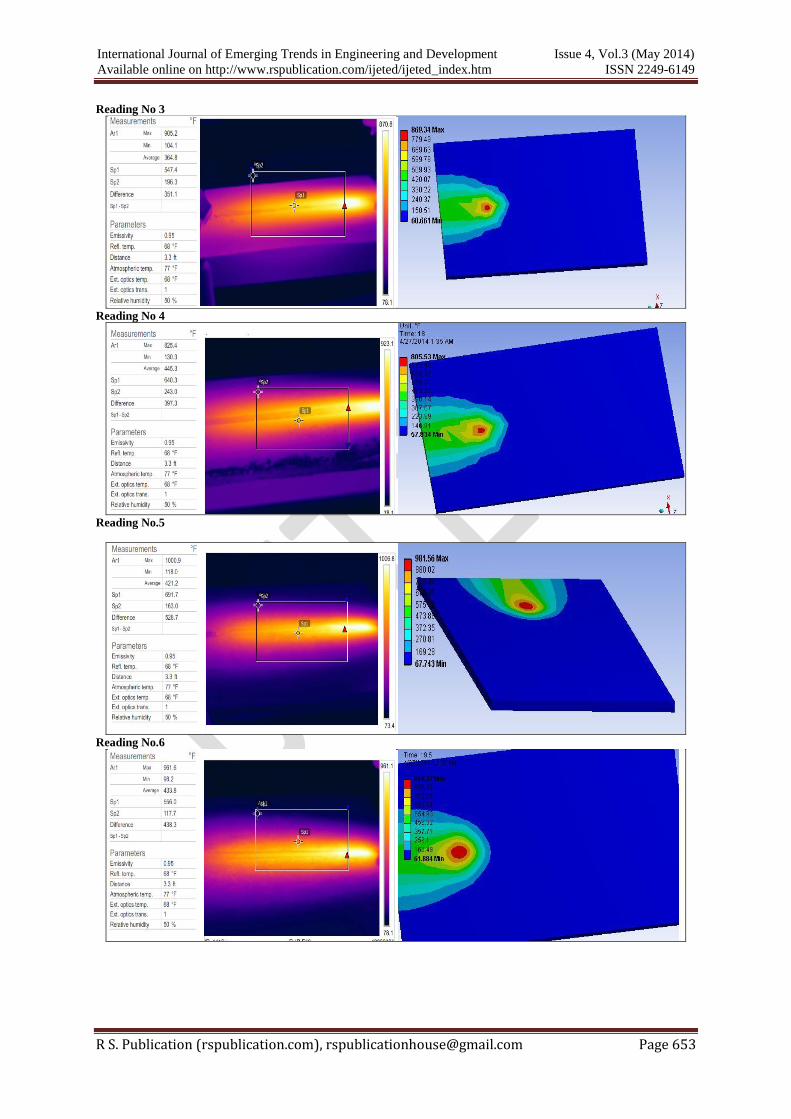
3. Postprocessing Phase: Deformation shape, contour plot, result
Reading No.1
Reading No 2
International Journal of Emerging Trends in Engineering and Development Issue 4, Vol.3 (May 2014)
Available online on http://www.rspublication.com/ijeted/ijeted_index.htm ISSN 2249-6149
R S. Publication (rspublication.com), [email protected] Page 653
Reading No 3
Reading No 4
Reading No.5
Reading No.6
International Journal of Emerging Trends in Engineering and Development Issue 4, Vol.3 (May 2014)
Available online on http://www.rspublication.com/ijeted/ijeted_index.htm ISSN 2249-6149
R S. Publication (rspublication.com), [email protected] Page 654
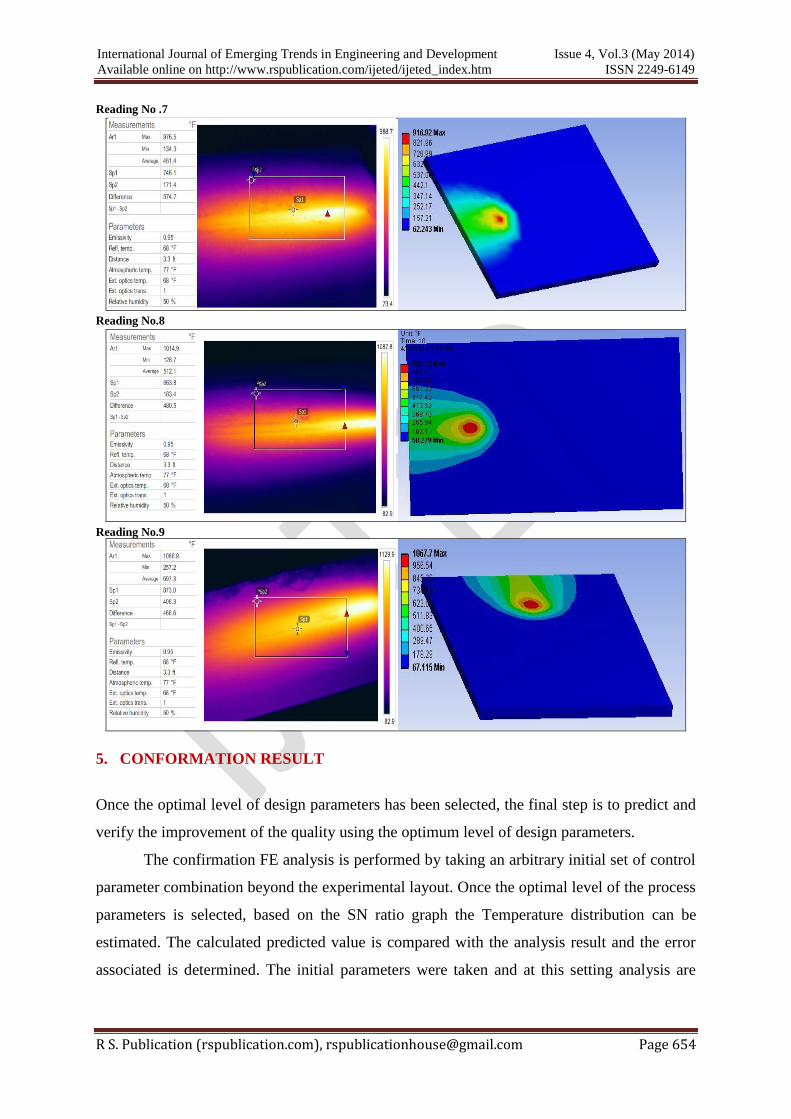
Reading No .7
Reading No.8
Reading No.9
5. CONFORMATION RESULT
Once the optimal level of design parameters has been selected, the final step is to predict and
verify the improvement of the quality using the optimum level of design parameters.
The confirmation FE analysis is performed by taking an arbitrary initial set of control
parameter combination beyond the experimental layout. Once the optimal level of the process
parameters is selected, based on the SN ratio graph the Temperature distribution can be
estimated. The calculated predicted value is compared with the analysis result and the error
associated is determined. The initial parameters were taken and at this setting analysis are
International Journal of Emerging Trends in Engineering and Development Issue 4, Vol.3 (May 2014)
Available online on http://www.rspublication.com/ijeted/ijeted_index.htm ISSN 2249-6149
R S. Publication (rspublication.com), [email protected] Page 655
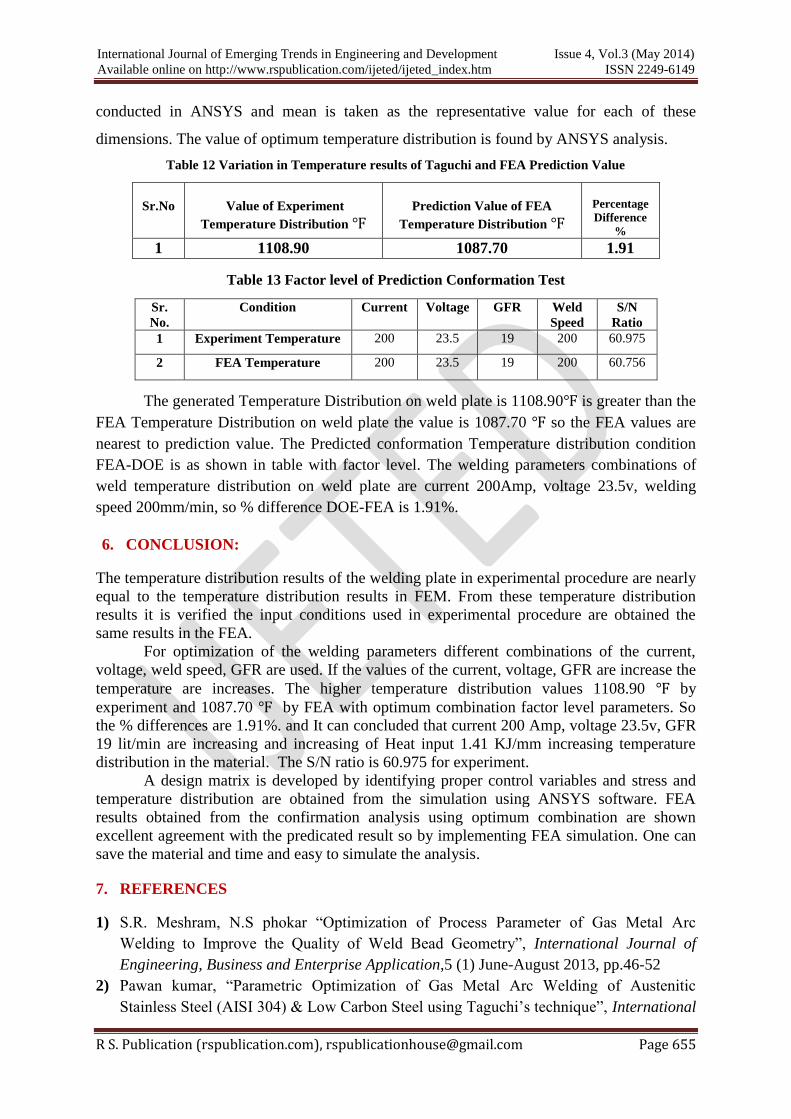
conducted in ANSYS and mean is taken as the representative value for each of these
dimensions. The value of optimum temperature distribution is found by ANSYS analysis.
Table 12 Variation in Temperature results of Taguchi and FEA Prediction Value
Table 13 Factor level of Prediction Conformation Test
The generated Temperature Distribution on weld plate is 1108.90℉ is greater than the
FEA Temperature Distribution on weld plate the value is 1087.70 ℉ so the FEA values are
nearest to prediction value. The Predicted conformation Temperature distribution condition
FEA-DOE is as shown in table with factor level. The welding parameters combinations of
weld temperature distribution on weld plate are current 200Amp, voltage 23.5v, welding
speed 200mm/min, so % difference DOE-FEA is 1.91%.
6. CONCLUSION:
The temperature distribution results of the welding plate in experimental procedure are nearly
equal to the temperature distribution results in FEM. From these temperature distribution
results it is verified the input conditions used in experimental procedure are obtained the
same results in the FEA.
For optimization of the welding parameters different combinations of the current,
voltage, weld speed, GFR are used. If the values of the current, voltage, GFR are increase the
temperature are increases. The higher temperature distribution values 1108.90 ℉ by
experiment and 1087.70 ℉ by FEA with optimum combination factor level parameters. So
the % differences are 1.91%. and It can concluded that current 200 Amp, voltage 23.5v, GFR
19 lit/min are increasing and increasing of Heat input 1.41 KJ/mm increasing temperature
distribution in the material. The S/N ratio is 60.975 for experiment.
A design matrix is developed by identifying proper control variables and stress and
temperature distribution are obtained from the simulation using ANSYS software. FEA
results obtained from the confirmation analysis using optimum combination are shown
excellent agreement with the predicated result so by implementing FEA simulation. One can
save the material and time and easy to simulate the analysis.
7. REFERENCES
1) S.R. Meshram, N.S phokar “Optimization of Process Parameter of Gas Metal Arc
Welding to Improve the Quality of Weld Bead Geometry”, International Journal of
Engineering, Business and Enterprise Application,5 (1) June-August 2013, pp.46-52
2) Pawan kumar, “Parametric Optimization of Gas Metal Arc Welding of Austenitic
Stainless Steel (AISI 304) & Low Carbon Steel using Taguchi’s technique”, International
Sr.No
Value of Experiment
Temperature Distribution ℉
Prediction Value of FEA
Temperature Distribution ℉
Percentage
Difference
%
1 1108.90 1087.70 1.91
Sr.
No.
Condition Current Voltage GFR Weld
Speed
S/N
Ratio
1 Experiment Temperature 200 23.5 19 200 60.975
2 FEA Temperature 200 23.5 19 200 60.756
R S. Publication (rspublication.com), [email protected] Page 656
Journal of Engineering Research and Management research, Vol. 3, Issue 4, Aug 2013,
pp.18-22
3) Vikram singh,“An investigation for Gas Metal Arc Welding Optimum Parameters of mild
steel AISI 1016 using Taguchi’s Method”, International Journal of Engineering and
advance technology, Vol.2, Issue 6, August 2013, pp.407-409
4) Amudala Nata, Sekhar Babu,“ Finite Element Simulation of hybrid welding process for
304 austentic Stainless steel plate”, IJRET ,Vol. 1, Issue 3,NOV2012, pp.401-410
5) Nuraini, A.A., Zainal A.S.M. and Azmah Hanim, M.A.” The Effect of Welding Process
Parameter on Temperature and Residual Stress in Butt-Joint Weld of Robotic Gas Metal
Arc Welding” Australian Journal of Basic and Applied Sciences, 7, July, 2013, pp. 814-
820,
6) Ador Welding Limited, “Modern Arc Welding Technology”, Oxford &IBH Publishing
Co. Pvt. Ltd (Book).