Paradoxical Onset of Arrhythmic Waves from Depolarized ...
14
Paradoxical Onset of Arrhythmic Waves from Depolarized Areas in Cardiac Tissue Due to Curvature-Dependent Instability Alexander S. Teplenin, 1 Hans Dierckx, 2 Antoine A. F. de Vries, 1 Daniël A. Pijnappels, 1,* and Alexander V. Panfilov 1,2,3,† 1 Laboratory of Experimental Cardiology, Department of Cardiology, Heart Lung Center Leiden, Leiden University Medical Center, Leiden, the Netherlands 2 Department of Physics and Astronomy, Ghent University, Ghent, Belgium 3 Ural Federal University, Ekaterinburg, Russia (Received 27 October 2017; revised manuscript received 18 April 2018; published 26 June 2018) The generation of abnormal excitations in pathological regions of the heart is a main trigger for lethal cardiac arrhythmias. Such abnormal excitations, also called ectopic activity, often arise from areas with local tissue heterogeneity or damage accompanied by localized depolarization. Finding the conditions that lead to ectopy is important to understand the basic biophysical principles underlying arrhythmia initiation and might further refine clinical procedures. In this study, we are the first to address the question of how geometry of the abnormal region affects the onset of ectopy using a combination of experimental, in silico, and theoretical approaches. We paradoxically find that, for any studied geometry of the depolarized region in optogenetically modified monolayers of cardiac cells, primary ectopic excitation originates at areas of maximal curvature of the boundary, where the stimulating electrotonic currents are minimal. It contradicts the standard critical nucleation theory applied to nonlinear waves in reaction-diffusion systems, where a higher stimulus is expected to produce excitation more easily. Our in silico studies reveal that the nonconventional ectopic activity is caused by an oscillatory instability at the boundary of the damaged region, the occurrence of which depends on the curvature of that boundary. The onset of this instability is confirmed using the Schrödinger equation methodology proposed by Rinzel and Keener [SIAM J. Appl. Math. 43, 907 (1983)]. Overall, we show distinctively novel insight into how the geometry of a heterogeneous cardiac region determines ectopic activity, which can be used in the future to predict the conditions that can trigger cardiac arrhythmias. DOI: 10.1103/PhysRevX.8.021077 Subject Areas: Biological Physics, Interdisciplinary Physics, Nonlinear Dynamics I. INTRODUCTION Arrhythmias are the most common cause of sudden cardiac death worldwide, accounting for an estimated 6 million deaths annually [1]. However, the underlying mechanisms are still not completely understood. From a practical point of view, it is of paramount importance to understand the mechanisms of arrhythmia initiation, since by removing the triggers, arrhythmic events can be avoided. Multiple recordings have shown that, in many cases, lethal cardiac arrhythmias are triggered by so-called ectopic beats, i.e., ill-timed electrical pulses originating from damaged tissue, which disturb normal cardiac rhythm [2,3]. Despite their practical importance, the meso- scopic biophysical mechanisms of ectopic activity remain largely unknown [4]. In a very general sense, ectopic activity occurs when a depolarized region in the heart produces depolarizing currents strong enough to initiate propagating waves. The process of wave initiation by such depolarizing currents seems to be straightforward at first sight: larger currents or larger sources can more easily depolarize a cell, overcome the sink effect from adjacent cells, and produce a propagating ectopic wave. This principle works perfectly to describe curvature- velocity relationships of waves in excitable media [5]. It closely relates to the nucleation theory of phase tran- sitions [6,7], since one also needs to form a critical volume to initiate a phase transition in a metastable phase of matter. In electrophysiology, this paradigm is called the source- sink relationship [8]. The depolarizing current by itself may depend on many factors, including the shape of the ectopic region. The effect of the shape of injury-induced depolarized zones on ectopic * [email protected] † [email protected] Published by the American Physical Society under the terms of the Creative Commons Attribution 4.0 International license. Further distribution of this work must maintain attribution to the author(s) and the published article’s title, journal citation, and DOI. PHYSICAL REVIEW X 8, 021077 (2018) 2160-3308=18=8(2)=021077(14) 021077-1 Published by the American Physical Society
-
Upload
khangminh22 -
Category
Documents
-
view
6 -
download
0
Transcript of Paradoxical Onset of Arrhythmic Waves from Depolarized ...

Paradoxical Onset of Arrhythmic Waves from Depolarized Areasin Cardiac Tissue Due to Curvature-Dependent Instability
Alexander S. Teplenin,1 Hans Dierckx,2 Antoine A. F. de Vries,1 Daniël A. Pijnappels,1,* and Alexander V. Panfilov1,2,3,†1Laboratory of Experimental Cardiology, Department of Cardiology, Heart Lung Center Leiden,
Leiden University Medical Center, Leiden, the Netherlands2Department of Physics and Astronomy, Ghent University, Ghent, Belgium
3Ural Federal University, Ekaterinburg, Russia
(Received 27 October 2017; revised manuscript received 18 April 2018; published 26 June 2018)
The generation of abnormal excitations in pathological regions of the heart is a main trigger for lethalcardiac arrhythmias. Such abnormal excitations, also called ectopic activity, often arise from areas withlocal tissue heterogeneity or damage accompanied by localized depolarization. Finding the conditions thatlead to ectopy is important to understand the basic biophysical principles underlying arrhythmia initiationand might further refine clinical procedures. In this study, we are the first to address the question of howgeometry of the abnormal region affects the onset of ectopy using a combination of experimental, in silico,and theoretical approaches. We paradoxically find that, for any studied geometry of the depolarized regionin optogenetically modified monolayers of cardiac cells, primary ectopic excitation originates at areas ofmaximal curvature of the boundary, where the stimulating electrotonic currents are minimal. It contradictsthe standard critical nucleation theory applied to nonlinear waves in reaction-diffusion systems, where ahigher stimulus is expected to produce excitation more easily. Our in silico studies reveal that thenonconventional ectopic activity is caused by an oscillatory instability at the boundary of the damagedregion, the occurrence of which depends on the curvature of that boundary. The onset of this instability isconfirmed using the Schrödinger equation methodology proposed by Rinzel and Keener [SIAM J. Appl.Math. 43, 907 (1983)]. Overall, we show distinctively novel insight into how the geometry of aheterogeneous cardiac region determines ectopic activity, which can be used in the future to predict theconditions that can trigger cardiac arrhythmias.
DOI: 10.1103/PhysRevX.8.021077 Subject Areas: Biological Physics,Interdisciplinary Physics,Nonlinear Dynamics
I. INTRODUCTION
Arrhythmias are the most common cause of suddencardiac death worldwide, accounting for an estimated6 million deaths annually [1]. However, the underlyingmechanisms are still not completely understood. From apractical point of view, it is of paramount importanceto understand the mechanisms of arrhythmia initiation,since by removing the triggers, arrhythmic events can beavoided. Multiple recordings have shown that, in manycases, lethal cardiac arrhythmias are triggered by so-calledectopic beats, i.e., ill-timed electrical pulses originatingfrom damaged tissue, which disturb normal cardiac
rhythm [2,3]. Despite their practical importance, the meso-scopic biophysical mechanisms of ectopic activity remainlargely unknown [4]. In a very general sense, ectopicactivity occurs when a depolarized region in the heartproduces depolarizing currents strong enough to initiatepropagating waves.The process of wave initiation by such depolarizing
currents seems to be straightforward at first sight: largercurrents or larger sources can more easily depolarize a cell,overcome the sink effect from adjacent cells, and produce apropagating ectopic wave.This principle works perfectly to describe curvature-
velocity relationships of waves in excitable media [5].It closely relates to the nucleation theory of phase tran-sitions [6,7], since one also needs to form a critical volumeto initiate a phase transition in a metastable phase of matter.In electrophysiology, this paradigm is called the source-sink relationship [8].The depolarizing current by itself may depend on many
factors, including the shape of the ectopic region. The effectof the shape of injury-induced depolarized zones on ectopic
*[email protected]†[email protected]
Published by the American Physical Society under the terms ofthe Creative Commons Attribution 4.0 International license.Further distribution of this work must maintain attribution tothe author(s) and the published article’s title, journal citation,and DOI.
PHYSICAL REVIEW X 8, 021077 (2018)
2160-3308=18=8(2)=021077(14) 021077-1 Published by the American Physical Society

activity has so far not been studied in depth because it waspreviously impossible to produce a depolarized region of agiven shape due to various technical limitations [9,10].Currently, this issue can be resolved by applying optoge-netic techniques, which were first applied in neuroscience[11] and allow excellent spatiotemporal control of cellularproperties and wave dynamics in biological excitable media[12,13]. Capitalizing on these advantages, we previouslyshowed that optogenetically induced localized oxidativestress can be used to generate intentionally shaped zoneswith sustained depolarization and associated ectopic activ-ity [14]. In the current work, this technique was applied toinduce quasistable depolarized (QSD) zones of predefinedshapes in monolayers of cardiac cells.Remarkably, the ectopic activity was found to preferen-
tially emerge from the sharp convex corners of QSD tissueregions. This observation defies the conventional interpre-tation of the source-sink concept, as in convex corners ofthe QSD region, the density of the depolarizing current isminimal.In order to understand this paradoxical phenomenon, we
conducted numerical simulations and reproduced the effect inphysiologically detailed models and even in simple reaction-diffusion models. Below, wewill link the phenomenon to theoccurrence of oscillatory instability at the boundary of theQSD region and explain the onset of this instability semi-analytically using the stationary Schrödinger equation.
II. MATERIALS AND METHODS
A more detailed description is provided in Appendix B.
A. Ectopic activity caused by optogenetic productionof reactive oxygen species
A plasma membrane-targeted version of a mini-singletoxygen generator (miniSOG) [15] was expressed in neonatalrat ventricular myocyte (NRVM) monolayers followinglentiviral transduction, as reported previously [16,17].Lentiviral vector particles were produced from shuttle plas-mid pLV.hCMV-IE.miniSOG-PM.hHBVPRE, as detailedelsewhere [17]. The mode of action of miniSOG and theproviral DNA structure of the lentiviral vector are shown inFigs. S1(a) and S1(b) of the Supplemental Material [18],respectively. After establishing practically uniform trans-duction with miniSOG-encoding lentiviral vector particles,optical mapping was performed on eight- to ten-day-oldcardiac monolayer cultures with the fluorescent voltage-sensitive dye di-4-ANEPPS to observe excitation waves.A patterned projection system was used to focus 470-nmLED light in the plane of the monolayers, in a region ofmaximal size 6 × 6 mm. After irradiation with intensity0.31 mW=mm2 for 3–6 min, to induce reactive oxygenspecies (ROS) production, voltage was optically monitored.Cumulative ROS damage resulted in ultralong action poten-tials (APs) in the previously irradiated zone, lasting for
2–20 s. Light-induced ROS production did not change APduration (APD) in the unexposed parts of the monolayers,which had an APD80 of 200–350 ms. The drastic spatialdifference inAPDcaused ectopicwaves to emanate from theinterface between the normal and damaged tissue regions, asshown in the two examples of paired optical traces presentedin Fig. S1(d) of the Supplemental Material [18]. While, inboth examples, the optical signals from electrical activityin most of the irradiated region remained almost flat witha long plateau phase, the surrounding tissue exhibitedperiodic APs. The ectopic beats emerged only during theplateau phase of ultralong APs, in line with our previousfindings [14].
B. Mathematical model for normal and QSD tissue
A hierarchy of models of different complexity wasused, including the Majumder-Korhonen model forNRVMs [19], which is the model closest to our in vitrosetup. We employed the Ten Tusscher–Noble–Noble–Panfilov (TNNP) model for adult human ventricular myo-cytes [20] to study in silico possible manifestations of theeffects in human ventricular tissue. We also used theFitzHugh-Nagumo (FHN) [21] and the Aliev-Panfilovmodel [22], which were modified to study the genericmechanisms underlying the observed effects. A detaileddescription of all four models is given in Appendix B.To identify the mechanism behind the ectopic activity
observed in our in vitro experiments, a generic description ofthe tissue was used in order to relate the observed phenom-ena to themost fundamental properties of cardiac excitation,i.e., excitation of cardiomyocytes by local currents andestablishment of a transient refractory state in the cellsfollowing excitation. In our view, this can best be achievedby employing low-dimensional models, which focus onthese processes, rather than by relying on complex descrip-tions of the underlying ionic currents and Ca2þ dynamics.Simplified models often describe complex spatiotemporalphenomena without loss of essential details (see, e.g.,Ref. [23]). Therefore, we used the classical cubic FHNmodel [21] in one (1D) or two (2D) spatial dimensions:
∂u∂t ¼ −fðuÞ − vþDΔu;
∂v∂t ¼ ε½u − γðrÞv�; ð1Þ
where u is the normalized transmembrane potential, vrepresents recovery processes, fðuÞ ¼ uðu − 1Þðu − aÞ,0 < a < 0.5, and ε ≪ 1. To distinguish between illuminated(i.e., oxidatively damaged) tissue exhibiting ultralong APs(i.e., quasistable depolarization) and normal (i.e., nonillu-minated) tissue, we altered the slope of the second variableγðrÞ as follows. Normal tissuewas modeled as a monostablesystem (γ ¼ γmono ¼ 1.5), as it allows an excitable regime.After excitation ðu ≈ 1Þ, the system returns to the restingpotential (u ¼ 0); see the nullclines in Fig. 3(a). Such amonostable system supports propagating waves as well.
ALEXANDER S. TEPLENIN et al. PHYS. REV. X 8, 021077 (2018)
021077-2
The tissue exhibiting quasistable depolarization, however,stays in the depolarized state much longer than the durationof a normal AP. The QSD tissue reaches this depolarizedstate from rest only after a depolarizing wave has passedthrough it. The described computational model contains aslow timescale variable, which, in the limiting case, can beadiabatically eliminated [24], andQSD tissue can, therefore,be modeled as a bistable system, which can be realized inEq. (1) by choosing γ ¼ γbi > 5.85, producing stable statesu ¼ 0 and u ¼ u3 > 0, as shown in Fig. 3(a). The otherparameters of the model were taken to be a ¼ 0.13,ε ¼ 0.004, and D ¼ 2.0. The size of the computationaldomain was 1024 × 1024, with a central bistable squarezone of size 400 × 400. Parameters for other shapes andmodels are described in Appendix B.
III. RESULTS
A. Effect of QSD tissue geometry on ectopicbeat generation in optogenetic experiments
with cardiac monolayer cultures
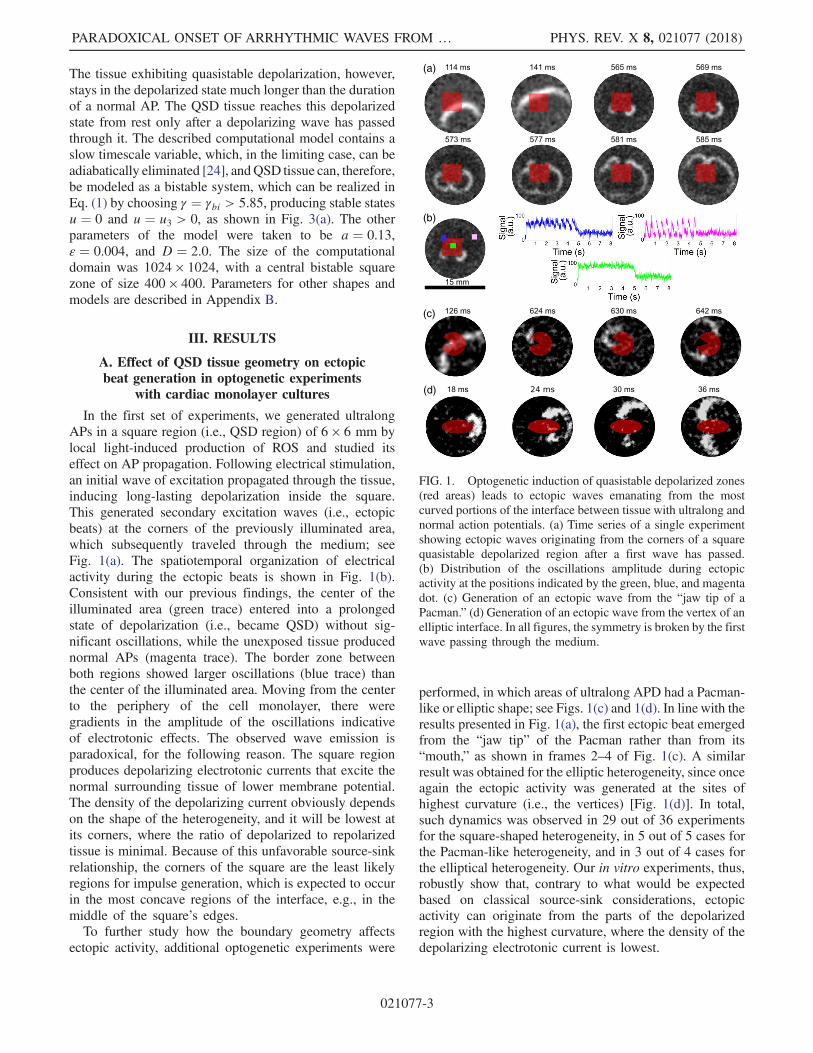
In the first set of experiments, we generated ultralongAPs in a square region (i.e., QSD region) of 6 × 6 mm bylocal light-induced production of ROS and studied itseffect on AP propagation. Following electrical stimulation,an initial wave of excitation propagated through the tissue,inducing long-lasting depolarization inside the square.This generated secondary excitation waves (i.e., ectopicbeats) at the corners of the previously illuminated area,which subsequently traveled through the medium; seeFig. 1(a). The spatiotemporal organization of electricalactivity during the ectopic beats is shown in Fig. 1(b).Consistent with our previous findings, the center of theilluminated area (green trace) entered into a prolongedstate of depolarization (i.e., became QSD) without sig-nificant oscillations, while the unexposed tissue producednormal APs (magenta trace). The border zone betweenboth regions showed larger oscillations (blue trace) thanthe center of the illuminated area. Moving from the centerto the periphery of the cell monolayer, there weregradients in the amplitude of the oscillations indicativeof electrotonic effects. The observed wave emission isparadoxical, for the following reason. The square regionproduces depolarizing electrotonic currents that excite thenormal surrounding tissue of lower membrane potential.The density of the depolarizing current obviously dependson the shape of the heterogeneity, and it will be lowest atits corners, where the ratio of depolarized to repolarizedtissue is minimal. Because of this unfavorable source-sinkrelationship, the corners of the square are the least likelyregions for impulse generation, which is expected to occurin the most concave regions of the interface, e.g., in themiddle of the square’s edges.To further study how the boundary geometry affects
ectopic activity, additional optogenetic experiments were
performed, in which areas of ultralong APD had a Pacman-like or elliptic shape; see Figs. 1(c) and 1(d). In line with theresults presented in Fig. 1(a), the first ectopic beat emergedfrom the “jaw tip” of the Pacman rather than from its“mouth,” as shown in frames 2–4 of Fig. 1(c). A similarresult was obtained for the elliptic heterogeneity, since onceagain the ectopic activity was generated at the sites ofhighest curvature (i.e., the vertices) [Fig. 1(d)]. In total,such dynamics was observed in 29 out of 36 experimentsfor the square-shaped heterogeneity, in 5 out of 5 cases forthe Pacman-like heterogeneity, and in 3 out of 4 cases forthe elliptical heterogeneity. Our in vitro experiments, thus,robustly show that, contrary to what would be expectedbased on classical source-sink considerations, ectopicactivity can originate from the parts of the depolarizedregion with the highest curvature, where the density of thedepolarizing electrotonic current is lowest.
(a)
(b)
(c)
(d)
FIG. 1. Optogenetic induction of quasistable depolarized zones(red areas) leads to ectopic waves emanating from the mostcurved portions of the interface between tissue with ultralong andnormal action potentials. (a) Time series of a single experimentshowing ectopic waves originating from the corners of a squarequasistable depolarized region after a first wave has passed.(b) Distribution of the oscillations amplitude during ectopicactivity at the positions indicated by the green, blue, and magentadot. (c) Generation of an ectopic wave from the “jaw tip of aPacman.” (d) Generation of an ectopic wave from the vertex of anelliptic interface. In all figures, the symmetry is broken by the firstwave passing through the medium.
PARADOXICAL ONSET OF ARRHYTHMIC WAVES FROM … PHYS. REV. X 8, 021077 (2018)
021077-3

B. Numerical simulations of ectopic beat generationat the boundary of QSD regions
The experimental results described above were repro-duced in numerical simulations of the detailed Majumder-Korhonen model of the NRVM monolayer [Fig. 2(a)].Similar results were obtained for the detailed human TNNPventricular model [Fig. 2(b)]. Thus, both in modelingstudies and in in vitro experiments, the ectopic activityalways originates at the corners of the QSD region. This
holds true for a wide range of APDs in the QSD region;e.g., the phenomenon can be observed in silico even forQSD zones with moderately prolonged (1–1.2 s) APDs,resulting in the generation of just one ectopic beat from thecorners (Fig. S5 of the Supplemental Material [18]). Asalso in vitro moderately prolonged APDs give rise toectopic activity from the corners of a square QSD region(Fig. S6 of the Supplemental Material [18]), this phenome-non appears to be very robust. Although ionic modelsaccurately reproduce the biophysical mechanism of APgeneration, in a mathematical sense, they are quite com-plex. Thus, in order to isolate the fundamental mechanismsdriving the observed phenomenon, it is always beneficial toreproduce it using a minimalistic generic description.We were able to reproduce this effect using simplifiedlow-dimensional models, i.e., modified versions of theAliev-Panfilov and FHN models [Figs. 2(c) and 2(d),respectively]. A detailed motivation of the simplifiedmodels choice is presented in Appendix B. As a furthersimplification, we were able to reproduce the same effectwhen the QSD region was represented as a bistable systemand the normal cells as a monostable system [Fig. 3(a)],which was achieved by changing the parameter γ. Thisproduced similar results as obtained in vitro. [CompareFigs. 1(a)–1(d) with Figs. 3(b)–3(e), respectively.] Theectopic activity originated from the corners of the bistable(i.e., QSD) region, as in the in vitro experiments. Similardata were obtained for the bistable/monostable version ofthe Aliev-Panfilov cardiac tissue model [22] (Fig. S2 of theSupplemental Material [18]). These results suggest thatectopic activity is more likely to occur in high-curvatureborder zones of the bistable (i.e., QSD) region than inborder areas with low curvature. Consistently, a small disc-shaped bistable region yielded a propagating response inthe surrounding tissue [Fig. 3(f)], but a larger QSD disc didnot [Fig. 3(g)]. The fact that the effect persists even in asimple computer model implies that it is related tofundamental properties of excitation. Looking closer tothe initiation mechanism of the ectopic waves, we foundthat the interface at the boundary of the bistable regionexhibits oscillatory activity [Figs. 3(c), 3(f), and 3(g)]. Inthe simulation result Fig. 3(c), two oscillations of smallamplitude are followed by one with a larger amplitude. Thelarger oscillation then forms an impulse propagating fromthe corner of the QSD region into the surrounding normaltissue. These numerical data strongly resemble the in vitroresults of Fig. 1(b). Because of the presence of noise in theoptical mapping experiments, the number of smalleramplitude oscillations needed to produce a propagatingimpulse in a real cardiac monolayer could not, however, bereliably determined. The importance of these oscillationswas therefore scrutinized in simulations, in which thepotential in the bistable region was clamped to its higherstable value u ¼ u3. In this case, ectopic activity from thecorners disappeared. Instead, the system generated a single
FIG. 2. Numerical modeling of ectopic wave generation fromcorners of a square quasistable depolarized region in fourdifferent cardiac tissue models. For each model, a snapshot ofectopic activity and voltage signals at three different locations,indicated by the green, blue, and magenta dots, are presented.(a) Majumder-Korhonen model of neonatal rat ventricular my-ocytes. (b) ten Tusscher–Noble–Noble–Panfilov model of adulthuman ventricular myocytes. Both detailed physiological modelscontained an increased conductance and slow inactivation var-iable of the late Naþ current in the QSD tissue. (c) Aliev-Panfilovmodel. (d) FitzHugh-Nagumo model. Both of these simplifiedmodels contained a slow repolarizing variable, in addition to thebistable kinetics of the QSD tissue. In all snapshots of ectopicactivity, the symmetry is broken by the first wave passing throughthe medium.
ALEXANDER S. TEPLENIN et al. PHYS. REV. X 8, 021077 (2018)
021077-4

pulse propagating from the entire border of the hetero-geneity, which was followed by the establishment of asteady-state spatial distribution of voltage (Fig. S3 of theSupplemental Material [18]).To further study the boundary oscillations that are
responsible for ectopic beat generation, we performedsimulations for different nullcline slopes γbi in the bistableregion (Fig. 4), keeping the same 2D setup as in Fig. 3(a).Numerical calculations in the 2D domain were compared to1D simulations modeling the presence of a planar QSDregion. Numerically computed stationary solutions wereused as initial conditions. The following changes wereobserved. First, for γbi ¼ 20, i.e., deep in the bistableregime, no oscillations occurred at the interface [Fig. 4(a)].For γbi ¼ 14 [Fig. 4(b)], oscillations emerged in 1D at theinterface that did not produce any waves. However, in 2D, aperiodic propagating response from the corners of thesquare was observed. Finally, for γbi ¼ 11 [Fig. 4(c)],low amplitude oscillations occurred at the interface
FIG. 3. Numerical modeling of ectopic waves in the FitzHugh-Nagumo model. (a) Modeling scheme. White zones withultralong action potentials (i.e., quasistable depolarization) arerepresented by a bistable system (γ ¼ 14), while the surroundingblack zone (normal tissue) is modeled as a monostable system(γ ¼ 1.5). (b) Snapshots of ectopic beat generation from thecorner of a quasistable depolarized square after passing of aninitial wave [compare to Fig. 1(a)]. (c) Distribution of oscillationamplitude for oscillatory activity in (b); [compare to Fig. 1(b)].(d),(e) Preferential generation of ectopic activity from the highestcurvature areas of Pacman-shaped (d) and elliptic (e) regions[compare to Figs. 1(c) and 1(d), respectively]. The symmetry isbroken by the first wave passing through the medium in (b) and(d). The wave was coming from the bottom of the domain. (f),(g)Ectopic wave potentiation by the curvature of the border zone inradially symmetric cases. Time traces, corresponding to snap-shots, are indicated by green, blue, and magenta lines. (f) Sub-threshold nonpropagating oscillatory response from a disc oflarge size (low curvature). (g) Propagating periodic response froma disc of small size (high curvature).
FIG. 4. Influence of the nullcline slope 1=γ of the bistable zoneon ectopic wave generation. (a)–(c) Induction of ectopic activityfor γ ¼ 20 (a), 14 (b), or 11 (c). Left panels: Nullclines. Middlepanels: Space-time plots of 1D simulation. Right panels: Snap-shot from 2D simulation. (a) For γ ¼ 20, only the stationarysolution is found in 1D and 2D. (b) For γ ¼ 14, subthresholdoscillatory activity is seen in 1D and periodic waves emanatingfrom the corners in 2D. (c) For γ ¼ 11, a propagating response isobserved both in 1D and 2D. Like in (b), the ectopic origins arelocated in the corners of the bistable regions. (d) Bifurcationdiagram for a curved (R ¼ 36.0, red line) and flat (blue line)interface between the monostable (i.e., excitable) and bistable(i.e., quasistable depolarized) regions.
PARADOXICAL ONSET OF ARRHYTHMIC WAVES FROM … PHYS. REV. X 8, 021077 (2018)
021077-5
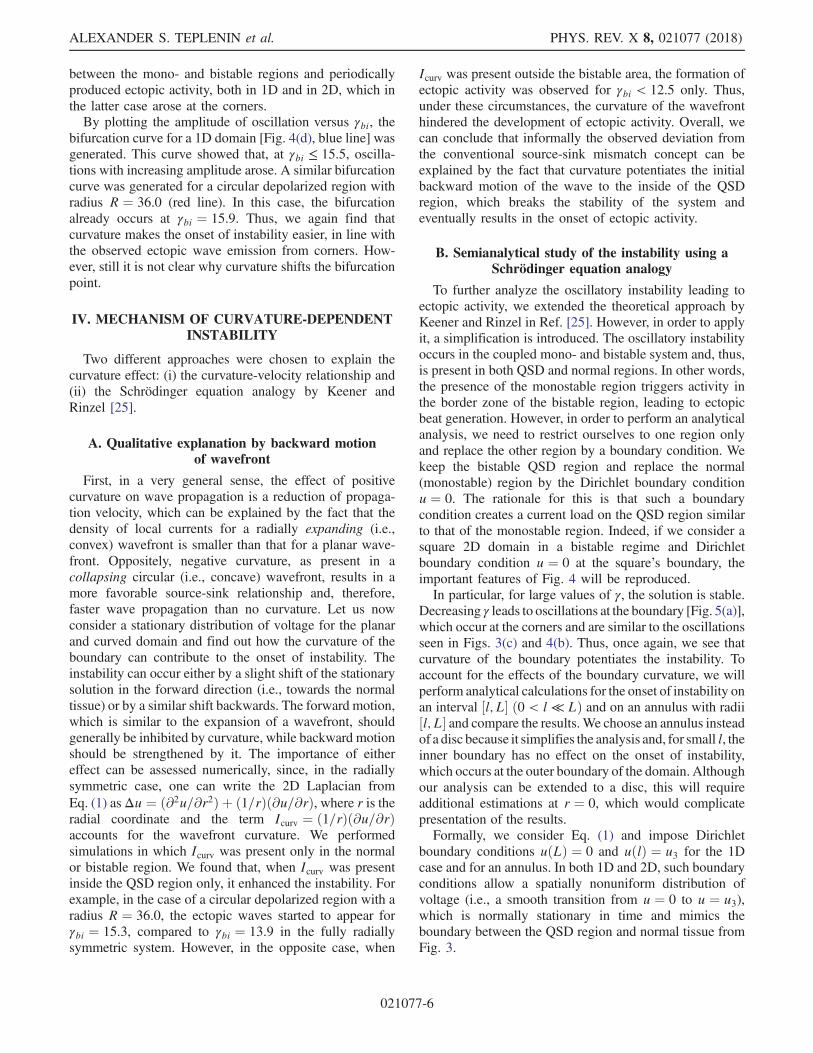
between the mono- and bistable regions and periodicallyproduced ectopic activity, both in 1D and in 2D, which inthe latter case arose at the corners.By plotting the amplitude of oscillation versus γbi, the
bifurcation curve for a 1D domain [Fig. 4(d), blue line] wasgenerated. This curve showed that, at γbi ≤ 15.5, oscilla-tions with increasing amplitude arose. A similar bifurcationcurve was generated for a circular depolarized region withradius R ¼ 36.0 (red line). In this case, the bifurcationalready occurs at γbi ¼ 15.9. Thus, we again find thatcurvature makes the onset of instability easier, in line withthe observed ectopic wave emission from corners. How-ever, still it is not clear why curvature shifts the bifurcationpoint.
IV. MECHANISM OF CURVATURE-DEPENDENTINSTABILITY
Two different approaches were chosen to explain thecurvature effect: (i) the curvature-velocity relationship and(ii) the Schrödinger equation analogy by Keener andRinzel [25].
A. Qualitative explanation by backward motionof wavefront
First, in a very general sense, the effect of positivecurvature on wave propagation is a reduction of propaga-tion velocity, which can be explained by the fact that thedensity of local currents for a radially expanding (i.e.,convex) wavefront is smaller than that for a planar wave-front. Oppositely, negative curvature, as present in acollapsing circular (i.e., concave) wavefront, results in amore favorable source-sink relationship and, therefore,faster wave propagation than no curvature. Let us nowconsider a stationary distribution of voltage for the planarand curved domain and find out how the curvature of theboundary can contribute to the onset of instability. Theinstability can occur either by a slight shift of the stationarysolution in the forward direction (i.e., towards the normaltissue) or by a similar shift backwards. The forward motion,which is similar to the expansion of a wavefront, shouldgenerally be inhibited by curvature, while backward motionshould be strengthened by it. The importance of eithereffect can be assessed numerically, since, in the radiallysymmetric case, one can write the 2D Laplacian fromEq. (1) asΔu ¼ ð∂2u=∂r2Þ þ ð1=rÞð∂u=∂rÞ, where r is theradial coordinate and the term Icurv ¼ ð1=rÞð∂u=∂rÞaccounts for the wavefront curvature. We performedsimulations in which Icurv was present only in the normalor bistable region. We found that, when Icurv was presentinside the QSD region only, it enhanced the instability. Forexample, in the case of a circular depolarized region with aradius R ¼ 36.0, the ectopic waves started to appear forγbi ¼ 15.3, compared to γbi ¼ 13.9 in the fully radiallysymmetric system. However, in the opposite case, when
Icurv was present outside the bistable area, the formation ofectopic activity was observed for γbi < 12.5 only. Thus,under these circumstances, the curvature of the wavefronthindered the development of ectopic activity. Overall, wecan conclude that informally the observed deviation fromthe conventional source-sink mismatch concept can beexplained by the fact that curvature potentiates the initialbackward motion of the wave to the inside of the QSDregion, which breaks the stability of the system andeventually results in the onset of ectopic activity.
B. Semianalytical study of the instability using aSchrödinger equation analogy
To further analyze the oscillatory instability leading toectopic activity, we extended the theoretical approach byKeener and Rinzel in Ref. [25]. However, in order to applyit, a simplification is introduced. The oscillatory instabilityoccurs in the coupled mono- and bistable system and, thus,is present in both QSD and normal regions. In other words,the presence of the monostable region triggers activity inthe border zone of the bistable region, leading to ectopicbeat generation. However, in order to perform an analyticalanalysis, we need to restrict ourselves to one region onlyand replace the other region by a boundary condition. Wekeep the bistable QSD region and replace the normal(monostable) region by the Dirichlet boundary conditionu ¼ 0. The rationale for this is that such a boundarycondition creates a current load on the QSD region similarto that of the monostable region. Indeed, if we consider asquare 2D domain in a bistable regime and Dirichletboundary condition u ¼ 0 at the square’s boundary, theimportant features of Fig. 4 will be reproduced.In particular, for large values of γ, the solution is stable.
Decreasing γ leads to oscillations at the boundary [Fig. 5(a)],which occur at the corners and are similar to the oscillationsseen in Figs. 3(c) and 4(b). Thus, once again, we see thatcurvature of the boundary potentiates the instability. Toaccount for the effects of the boundary curvature, we willperform analytical calculations for the onset of instability onan interval ½l; L� ð0 < l ≪ LÞ and on an annulus with radii½l; L� and compare the results.We choose an annulus insteadof a disc because it simplifies the analysis and, for small l, theinner boundary has no effect on the onset of instability,which occurs at the outer boundary of the domain. Althoughour analysis can be extended to a disc, this will requireadditional estimations at r ¼ 0, which would complicatepresentation of the results.Formally, we consider Eq. (1) and impose Dirichlet
boundary conditions uðLÞ ¼ 0 and uðlÞ ¼ u3 for the 1Dcase and for an annulus. In both 1D and 2D, such boundaryconditions allow a spatially nonuniform distribution ofvoltage (i.e., a smooth transition from u ¼ 0 to u ¼ u3),which is normally stationary in time and mimics theboundary between the QSD region and normal tissue fromFig. 3.
ALEXANDER S. TEPLENIN et al. PHYS. REV. X 8, 021077 (2018)
021077-6
In this case, when γ is decreased, in the same way as inFig. 4, we also observed the transition from stationary tooscillatory behavior, which is moreover facilitated bycurvature.The stability of the stationary solution in such a setup
can be studied analytically. First, note that the stationarysolutions ðu; vÞ ¼ ½ϕðxÞ; ηðxÞ� to Eq. (1) have η ¼ðϕ=γÞ, such that, in the absence of curvature (i.e., on aline), ϕðxÞ can be found by direct integration of thefollowing equation, which can be viewed as Newton’sequation in a potential field:
1
D
�−fðϕÞ−ϕ
γ
�þ∂2ϕ
∂x2 ¼0; ϕðlÞ¼u3; ϕðLÞ¼0; ð2Þ
where u3 is the largest root of fðuÞ. Stability can beanalyzed by linearizing around a stationary solution.Considering the perturbation u¼ϕ þ ϕ1; v¼η þ η1, withϕ1 ¼ eλtψðxÞ, η1 ¼ eλtzðxÞ, yields the stationarySchrödinger equation [25]
−∂2ψ
∂x2 þ VðxÞψ ¼ Eψ ; ð3Þ
with potential VðxÞ ¼ f0½ϕðxÞ�=D and energy E ¼ −½λþðε=λþ εγÞ�=D, subjected to the boundary conditionsψðlÞ ¼ 0, ψðLÞ ¼ 0. The stability of the stationary solutionis lost when λ, which can be found from the energyE ¼ −½λþ ðε=λþ εγÞ�=D, has a positive real part [25].From the relation between E and λ, one can see thatdecreasing E leads to destabilization of the solution, aproperty that will be used below. Note that, since ϕðxÞ is
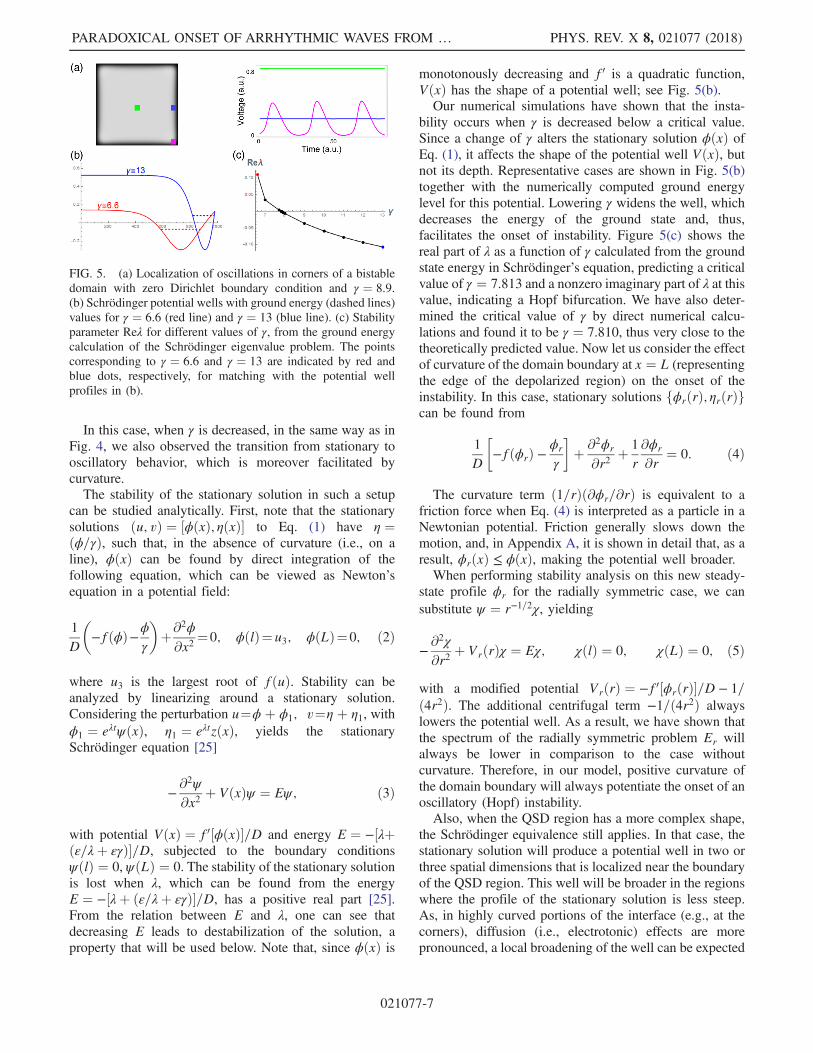
monotonously decreasing and f0 is a quadratic function,VðxÞ has the shape of a potential well; see Fig. 5(b).Our numerical simulations have shown that the insta-
bility occurs when γ is decreased below a critical value.Since a change of γ alters the stationary solution ϕðxÞ ofEq. (1), it affects the shape of the potential well VðxÞ, butnot its depth. Representative cases are shown in Fig. 5(b)together with the numerically computed ground energylevel for this potential. Lowering γ widens the well, whichdecreases the energy of the ground state and, thus,facilitates the onset of instability. Figure 5(c) shows thereal part of λ as a function of γ calculated from the groundstate energy in Schrödinger’s equation, predicting a criticalvalue of γ ¼ 7.813 and a nonzero imaginary part of λ at thisvalue, indicating a Hopf bifurcation. We have also deter-mined the critical value of γ by direct numerical calcu-lations and found it to be γ ¼ 7.810, thus very close to thetheoretically predicted value. Now let us consider the effectof curvature of the domain boundary at x ¼ L (representingthe edge of the depolarized region) on the onset of theinstability. In this case, stationary solutions fϕrðrÞ; ηrðrÞgcan be found from
1
D
�−fðϕrÞ −
ϕr
γ
�þ ∂2ϕr
∂r2 þ 1
r∂ϕr
∂r ¼ 0: ð4Þ
The curvature term ð1=rÞð∂ϕr=∂rÞ is equivalent to afriction force when Eq. (4) is interpreted as a particle in aNewtonian potential. Friction generally slows down themotion, and, in Appendix A, it is shown in detail that, as aresult, ϕrðxÞ ≤ ϕðxÞ, making the potential well broader.When performing stability analysis on this new steady-
state profile ϕr for the radially symmetric case, we cansubstitute ψ ¼ r−1=2χ, yielding
−∂2χ
∂r2 þ VrðrÞχ ¼ Eχ; χðlÞ ¼ 0; χðLÞ ¼ 0; ð5Þ
with a modified potential VrðrÞ ¼ −f0½ϕrðrÞ�=D − 1=ð4r2Þ. The additional centrifugal term −1=ð4r2Þ alwayslowers the potential well. As a result, we have shown thatthe spectrum of the radially symmetric problem Er willalways be lower in comparison to the case withoutcurvature. Therefore, in our model, positive curvature ofthe domain boundary will always potentiate the onset of anoscillatory (Hopf) instability.Also, when the QSD region has a more complex shape,
the Schrödinger equivalence still applies. In that case, thestationary solution will produce a potential well in two orthree spatial dimensions that is localized near the boundaryof the QSD region. This well will be broader in the regionswhere the profile of the stationary solution is less steep.As, in highly curved portions of the interface (e.g., at thecorners), diffusion (i.e., electrotonic) effects are morepronounced, a local broadening of the well can be expected
FIG. 5. (a) Localization of oscillations in corners of a bistabledomain with zero Dirichlet boundary condition and γ ¼ 8.9.(b) Schrödinger potential wells with ground energy (dashed lines)values for γ ¼ 6.6 (red line) and γ ¼ 13 (blue line). (c) Stabilityparameter Reλ for different values of γ, from the ground energycalculation of the Schrödinger eigenvalue problem. The pointscorresponding to γ ¼ 6.6 and γ ¼ 13 are indicated by red andblue dots, respectively, for matching with the potential wellprofiles in (b).
PARADOXICAL ONSET OF ARRHYTHMIC WAVES FROM … PHYS. REV. X 8, 021077 (2018)
021077-7

there. The Schrödinger eigenfunctions will, thus, be local-ized in the broader parts of the well, and these are preciselythe boundary oscillations that cause the onset of instabil-ities. We can now understand the emergence of ectopicbeats at sharp corners from a physical principle: In thecorners, the transition in voltage between QSD and normaltissue will be less steep, offering more room for boundaryoscillations to develop.
V. DISCUSSION
In this study, optogenetics has been applied to investigatethe onset of ectopic activity in cardiac tissue. In our setup,the ectopic activity originated from the boundary of a QSD(ultralong AP) region. Contrary to the classical principle ofsource-sink mismatch, the ectopic activity preferentiallyarose at the boundaries between the oxidatively damagedregion and the normal tissue with the highest curvature.Using in silico models and an analytical approach, wedemonstrate that the mechanism of this effect is closelyrelated to the occurrence of oscillatory (i.e., Hopf) insta-bility at these sites.We demonstrated such a mechanism in detailed physio-
logical and simplified generic models. Since we reproducedthe results in different models and uncovered the generalunderlying biophysical mechanism, we expect that ourresults might be applicable to different clinical situations,in which the APD is abnormally lengthened beyond 2 s.Such situations of APD prolongation might be a result ofoxidative stress [26], drug treatment, poisoning, or geneticmutations [26–29]. Compounds with strong APD-prolong-ing ability include Ca2þ channel agonists like Bay K8644;class Ia antiarrhythmics (e.g., quinidine); unintended hERGchannel blockers like the antibiotic erythromycin; certainclass III antiarrhythmics (e.g., E4031); and a large variety ofneurotoxins (e.g., anemone toxin). APD-prolonging muta-tions have been found, e.g., in the genes encoding calmodu-lin [30], calmodulin-dependent kinase II [31], and fast Naþ
and L-type Ca2þ channels [32,33]. APDs are also drasticallyincreased during bradycardia induced by disease or rest andsleep [28,29]. The fact that APD prolongation might occurheterogeneously due to intrinsic transmural differences inrepolarization kinetics, e.g., caused by increased late Naþand decreased slowly delayed rectifier currents in themidmyocardial wall [28], further increases the proarrhyth-mic risk. However, as we showed experimentally (seeFig. S6 of the Supplemental Material [18]) and in numericalsimulations (see Fig. S5 of the Supplemental Material [18]),extreme prolongation of AP is not required for ectopic waveinitiation from the corners of aQSD region. It was also foundfor shorter APDs of 1.2 s in vitro, of 1 s in the Majumder-Korhonen model of NRVMs, and of 1.5 s in the TNNPmodel of adult human ventricular cardiomyocytes. TheseAPDs are well within the range of those described inmultiple channelopathies [32,33]. APDs of 1–2 s can bemanifested in a transient fashion during pause-induced
[32,34] or rhythm-acceleration-induced [35,36] APD pro-longation. Both of these disturbances lead to torsade depointes arrhythmias, which are widely observed clinicallyfor different types of longQT syndrome [37]. To sumup, ourresults might apply to various clinical situations given thewide range of prolonged APDs for which the emission ofectopic waves from high curvature areas was manifested.Besides by ultralong APs, ectopy from boundary areas of
high curvature can also be caused by regional multifoldincreases in Ca2þ conductance. Such a local increase inCa2þ conductance can result from long-chain fatty acidaccumulation due to regional ischemia [38]. We illustratedthis case in Fig. S7 of the Supplemental Material [18].Another possible example is the ectopic activity arising
from the ostia of pulmonary veins, which is one of themajor triggers of atrial fibrillation. It was reported thatpatients with a common ostium of the left pulmonary veinshave a higher propensity for developing atrial fibrillation[39]. This common ostium has an elliptic shape, thuscontaining border areas of high curvature, which may be areason for the higher chance of developing arrhythmias.Apart from providing a possible explanation for the
emergence of particular forms of cardiac ectopy, our resultsmay also help to refine surgical ablation procedures. Ourfinding that boundary curvature can play an important rolein the generation of arrhythmic waves suggests thatsmoothening the borders between healthy and diseasedmyocardium may be beneficial, and that ablation of onlythe sharp convex corners of damaged cardiac tissue mightbe sufficient to prevent ectopic activity.Usually, ectopic or focal activity is believed to be a result
of abnormal automaticity caused by early or delayedafterdepolarizations [40] or so-called injury currents fromdamaged tissue [3]. For injury currents, it has been reportedthat abnormal automaticity may originate from the couplingof an excitable cell with another cell with a higher (i.e., lessnegative) resting membrane potential [41–43]. Despite thefact that the resting states of both cells are stable, anoscillatory (i.e., Hopf) bifurcation can emerge in such acoupled system. A similar situation exists in Figs. 1(c)and 3(c). However, in our case, the Hopf bifurcationemerges from the coupling of multiple mono- and bistablecells in a diffusive manner.Keener and Rinzel [25] were the first to identify this
Hopf instability in a FHN system for the case of a singlefiber with Dirichlet or Neumann boundary conditions atone of the ends. Here, we have extended their approach tocurved domains.Similar behavior has been observed for the interface
between oscillatory and excitable regions in the Belousov-Zhabotinsky reaction [44,45]. However, no local bifurca-tion analysis was possible for simulation of this chemicalactivity, since the limit cycles already had a high amplitude.In physical systems, curvature-induced effects have been
observed in nonlinear optics of solitons [46,47], shock
ALEXANDER S. TEPLENIN et al. PHYS. REV. X 8, 021077 (2018)
021077-8

waves in Bose-Einstein condensate [48], the appearance ofadditional curvature-induced magnetic force in a magneticshell [49], the onset of superconductivity in curveddomains [50,51], the appearance of prohibited states incondensed matter physics and material science [52], andcurvature-induced bound states for quantum wires [53]. Inall these cases, positive curvature induced unusual behav-ior, which cannot be observed under normal conditions in aflat geometry. The last example is most striking and stemsfrom the fundamental result of topological trapping of aquantum particle [54]. In Ref. [54], it was shown that aquantum mechanical particle is preferentially trappedin a region of high curvature of a spatially extendedSchrödinger well. The same principle applied here: Thestrong curvature near corners of the QSD region lowers theenergy of the Schrödinger well precisely there. Overall, it isnot surprising to find a quantum mechanical analogy in areaction-diffusion context due to the long-standing math-ematical similarity of the diffusion and Schrödinger equa-tions [55]. One can just go to imaginary time and get thesimilar retrograde diffusion equations. Similarity betweenthe diffusion formalism and Schrödinger equation canalso be found on more general physical grounds due tothe analytical continuation connection between the Wienerintegral for the Brownian motion process and the Feynmanpath integral [56]. Therefore, the quantum mechanicalanalogy of localization might be applicable to morecomplex cases of multiple diffusing species [44] in com-parison to the simple diffusion of voltage in our case.Because of the simplicity and generality of our computermodel, we would expect similar effects to be found in otherareas of biology, chemistry, and physics.Albeit we reproduced the phenomenon in complex
detailed models, in our research we have intentionallyfocused on a simplified computer model for cardiac tissuein order to relate the effect to the most fundamentalproperties of cardiac excitation and to be able to performan analytical study of the dynamics. It would, however, alsobe of interest to investigate the role of different ioniccurrents in the observed effects in a more detailed math-ematical model of cardiac muscle cells.In our paper, we were able to reproduce the experimen-
tally observed effect of ectopy from the corners in a highlyrelevant mathematical model for our experimental system,namely, theMajumder-Korhonenmodel of NRVMs and in adetailed and more clinically relevant model of adult humanventricular cardiomyocytes. Although, in all our in silicomodels, ectopy from boundary areas with high curvatureoccurs for a wide range of parameters (for example, for theQSD zone, as shown in Fig. 4, 11 ≤ γbi ≤ 14 results incorner-confined ectopy), we did not study in detail allpossible regimes in such a system, e.g., ectopy from corners,faces, or middles of the region, and the locations of suchregimes in the parametric space. It would, hence, beinteresting to investigate all possible manifestations of
ectopy in a wider class of mathematical models, includingdetailed models for human cardiac tissue (see, e.g., O’Hara-Rudy [57] and Grandi [58]) and modern low-dimensionalcardiac models (see, e.g., Mitchell-Schaeffer [59] andCorrado [60]) in future studies.The extension of our work to 3D would be of importance
as well, since injured cardiac ventricles typically exhibit acomplex 3D structure. The effects of curvature on ectopicactivity are expected to be even more pronounced in 3Dsystems than in our 2D preparations.In conclusion, we have demonstrated, using comple-
mentary in vitro and in silico models, that the border zonesbetween damaged and healthy myocardium with the high-est positive curvature are the most likely areas for the onsetof ectopic activity. As the electrotonic load for formation ofexcitation is maximal in such areas, this effect is para-doxical. Our finding, thus, adds a new potential mechanismfor cardiac ectopy and represents an additional controllabledegree of freedom to prevent arrhythmogenesis.
ACKNOWLEDGMENTS
We thank Annemarie Kip, Cindy Bart, Marc Engels, andJia Liu for excellent technical support and help in produc-ing lentiviral vector particles and Iolanda Feola for guid-ance in preparing NRVM monolayers. We also thankRupamanjari Majumder and Nina Kudryashova for fruitfuldiscussions. This work was supported by the NetherlandsOrganization for Scientific Research (NWO Vidi GrantNo. 917143 to D. A. P.). A. S. T., D. A. P., and A. V. P.initiated and designed the research. A. S. T. performedexperiments and computations. A. S. T., H. D., andA. V. P. analyzed data and conceived theoretical explan-ations. A. A. F. V. designed genetic engineering tools. A.A. F. V. and D. A. P. provided reagents; D. A. P. providedfunding sources; and A. S. T., H. D., A. V. P, A. A. F. V.,and D. A. P. wrote the paper.
APPENDIX A: ANALYTICAL PROOF THATCURVATURE PROMOTES INSTABILITY
Our proof will be based on the Schrödinger analogy firstgiven by Rinzel and Keener. They stated that the relationEðλÞ can be inverted by solving the quadratic equation
λ2 þ ðϵγ þDEÞλþ ϵð1þ γDEÞ ¼ 0: ðA1Þ
From studying the possible locations of roots λ1, λ2 in thecomplex plane, it follows that at least one root has a positivereal part if and only if λ1 þ λ2 ¼ −ðϵγ þDEÞ is positive.Therefore, the stationary solution will become unstablewhen E < E0 ¼ −ϵγ=D. At this critical value, λ1λ2 ¼ð1þ γDE0Þ ¼ 1 − γ2ϵ > 0 in our working regime. Thisindicates that, at the instability threshold, λ1, λ2 are purelyimaginary and, therefore, the system undergoes a Hopfbifurcation.
PARADOXICAL ONSET OF ARRHYTHMIC WAVES FROM … PHYS. REV. X 8, 021077 (2018)
021077-9

We now proceed to show that positive curvature of theboundary promotes instability of the system by proving thatpositive curvature of the boundary always lowers E.Adding curvature to the system changes both the sta-
tionary profile and the associated linearized equation. Weshow this in two steps. First, we write the systems [1] and[3] of the main text as a particle with unit mass in aNewtonian potential: letting u correspond with 1D particleposition X and x with time t ∈ ½l; L� yields
d2Xdt2
þ bðtÞ dXdt
¼ −dUðXÞdX
; ðA2Þ
with potential UðXÞ ¼ RX fðϕÞdϕ. For the case without
curvature, bðtÞ ¼ 0, corresponding to a frictionlessNewtonian system; the case with curvature is equivalentto the particle being subjected to a frictional forcebðtÞ ¼ 1=t. In both cases, the boundary conditions areXðlÞ ¼ u3 and XðLÞ ¼ u1. A representative solution forboth cases is given in Fig. S4(a) of the SupplementalMaterial [18]. Note that, since both particles need to travelthe same distance u3 − u1 in the same time interval L − l,the frictionless case starts with a smaller initial velocityand, therefore, always lags behind the case with friction,only catching up at time t ¼ L. Since u3 > u1 and theNewtonian paths were called ϕðxÞ and ϕrðxÞ in the maintext, we thus have
ϕðxÞ > ϕrðxÞ; l < x < L: ðA3Þ
With this result, we can compare the eigenvalues E of thelinear system,
−∂2ψ
∂x2 þ VðxÞψ ¼ Eψ ; ðA4Þ
for potentials VðxÞ ¼ −f0ðϕÞ=D or VrðxÞ ¼ −f0ðϕrÞ=D,yielding ground state eigenvalues E and E1, respectively.Note that the term ð1=xÞðdψ=dxÞ is not included here yet; itwill be performed below. A well-known property of theSchrödinger problem is that a wider and deeper well lowersthe energy. For the two cases considered, the well depth isequal to −f0ðumÞ=D, with um representing the uniqueinclination point of fðuÞ. Thus, the difference in E willonly depend on the width of the potential well. To definethe well width Wr or W for the cases with and withoutcurvature, we consider the typical wells for our system asshown in Figs. 5(b) and in S4(b) of the SupplementalMaterial [18]. Note that f0ðϕÞ is a quadratic functioncentered at ϕ ¼ um < ðu1 þ u3Þ=2; see Fig. S4(c) of theSupplemental Material [18]. Hence, VðlÞ > VðLÞ; i.e., thepotential is always higher on the left-hand side, wherethe boundary condition is uðlÞ ¼ u3. Therefore, it makessense to define the width of the potential as the regionwhere VðxÞ < VðLÞ; see Fig. S4(a) of the Supplemental
Material [18]. Since f0ðuÞ is a quadratic function andu1 ¼ 0, it follows that f0ð2umÞ ¼ VðLÞ, such that W ¼L − ϕ−1ð2umÞ, Wr ¼ L − ϕ−1
r ð2umÞ. Hence, it followsfrom Eq. (A3) that
Wr > W ⇒ E1 < E: ðA5Þ
We still have to consider the effect of adding the curvatureterm to Eq. (A4). However, in the main text, it is shown thata substitution ψ ¼ r−1=2χ produces again the Schrödingerproblem with a potential shifted down by 1=ð4r2Þ andeigenvalue Er. Therefore,
Er < E1 < E: ðA6Þ
Hence, we have established that positive curvature at theboundary of a bistable domain promotes instability. As wehave only used qualitative properties of the solution, e.g.,monotonicity of the profile and the asymmetric sigmoidalshape of fðuÞ, our analysis is not restricted to the FHNmodel. Our analysis can be extended for a disc. This would,however, require additional estimations at r ¼ 0 that wouldunnecessarily complicate the presentation of the results.
APPENDIX B: SUPPLEMENTARY MATERIALSAND METHODS
1. Cell isolation and culture
NRVMs were isolated and cultured as reported previ-ously [16]. In brief, hearts were excised from neonatalrats under anaesthesia, and venticular tissue was delicatelychopped and dissociated with 450 U=ml collagenasetype I (Worthington, Lakewood, New Jersey) and18.75 Kunitz=ml DNase I (Sigma-Aldrich, St. Louis,Missouri). Cells were seeded on round, fibronectin-coated(Sigma-Aldrich) 15-mm-diameter glass coverslips in 24-well culture plates (Corning Life Sciences, Corning, NewYork). Cells were seeded at a density of 8 × 10⁵ cells=welland incubated for 2 h with mitomycin-C (10 μg=ml,Sigma-Aldrich) to inhibit proliferation of nonmyocytes.
2. Molecular cloning
The self-inactivating lentiviral shuttle plasmidpLV.hCMV-IE.miniSOG-PM.hHBVPRE, which codes fora plasma-membrane-associated version of miniSOG, wasengineered by a two-step operation. In step 1, the miniSOG-coding sequence was extended with the plasma-membranetargeting motif of human K-Ras4B by substituting theBglII × EcoRI fragment of plasmid miniSOG-C1 [15] witha linker molecule composed of oligonucleotides 5’ GATC-CAAGATGAGCAAAGACGGCAAAAAGAAGAAAAA-GAAGTCCAAGACAAAGTGCGTGATCATGTAAAG 3’and 5’AATTCTTTACATGATCACGCACTTTGTCTTGG-ACTCTTTTTCTTCTTTTTGCCGTCTTTGCTCATCTTG3’ (Sigma-Aldrich). The resulting plasmid was designated
ALEXANDER S. TEPLENIN et al. PHYS. REV. X 8, 021077 (2018)
021077-10

pminiSOG-PM. In step 2, the 414-bp Eco47III × EcoRIfragment of pminiSOG-PM was blunt-ended with Klenowpolymerase and inserted in between the SmaI site and filled-in BsrGI site of pLV.hCMV-IE.IRES.eGFP.hHVBPRE[16]. The resulting construct was designated pLV.hCMV-IE.miniSOG-PM.hHBVPRE. The restriction enzymes andother DNA-modifying enzymes were purchased from NewEnglandBiolabs (Bioke, Leiden, theNetherlands) orThermoFisher Scientific (Landsmeer, the Netherlands). Large-scaleplasmid isolation was performed with the JETSTAR 2.0Plasmid Maxiprep kit (Genomed, Löhne, Germany), inaccordance with the instructions supplied with the kit.
3. Lentiviral vector particle production andtransduction of confluent monolayers of NRVMs
Construct pLV.hCMV-IE.miniSOG-PM.hHBVPRE wasused for the production of miniSOG-encoding lentiviralvector particles employing a second-generation packagingsystem as previously detailed [17]. These particles weresubsequently used to transduce 5-day-old continuousmonolayer cultures of NRVMs with a vector dose thatresulted in transduction of approximately 95% of the cells.Assessment of the transduction efficiency was done with aninverted phase-contrast and fluorescence microscope(Axiovert 35, Carl Zeiss, Sliedrecht, the Netherlands) byvisualization of the green fluorescent signals produced byexcited miniSOG molecules.
4. Optical mapping and patterned illuminationof monolayers
After 8–10 days of culturing, ventricular monolayerswere optically mapped using the voltage-sensitive dye di-4-ANEPPS (Thermo Fisher Scientific) as reported previously[17]. The mapping setup was based on a 100 × 100 pixelCMOS Ultima-L camera (Scimedia, Costa Mesa,California). The field of view was 16 × 16 mm, resultingin a spatial resolution of 160 μm=pixel. For targetedillumination of monolayers, the setup was optically con-jugated to a digitally controlled micromirror device (DMD),the Polygon 400 (Mightex Systems, Toronto, Ontario), witha high-power blue (470-nm) LED (BLS-LCS-0470-50-22-H, Mightex Systems). Before starting the actual experi-ments, all monolayers were mapped during 1-Hz electricalpoint stimulation to check baseline conditions. Electricalstimulation was performed by applying 10-ms-long rectan-gular electrical pulses with an amplitude of 8 V to a bipolarplatinum electrode with a spacing of 1.5 mm between theanode and cathode. Only cultures with an APD at 80%repolarization (APD80) below 350 ms and a conductionvelocity above 18 cm=s were used for further experiments.Next, monolayers were illuminated with different lightpatterns at constant intensity (0.3125 mW=mm2) in thesample plane for 3–6 min. The resulting electrical activitywas recorded for 6–24 s at exposure times of 1 or 6 msper frame.
5. Data analysis
Data analysis was performed using specialized BVAnasoftware (Scimedia), ImageJ Ref. [61], and custom-writtenscripts in Wolfram Mathematica (Wolfram Research,Hanborough, Oxfordshire, United Kingdom). APD andconduction velocity were calculated as described previ-ously [17]. To prepare representative frames of wavepropagation, optical mapping videos were filtered with aspatial averaging filter (3 × 3 stencil) and a derivative filter.
6. Numerical modeling and calculations
a. Numerical calculations with simplified models
For 2D and 1D simulations, we used the forward Eulermethod with time step Δt ¼ 0.002 and a centered finite-differencing scheme to discretize the Laplacian with spacestep Δx ¼ 0.25. A 1024 × 1024 grid was used for the 2Dsimulation and a 1024-point cable for the 1D simulation. Inall simplified models, spatially uniform zero initial con-ditions were used for all variables. To eliminate possiblespatial discretization errors, we used time step Δt ¼0.00 015 625 and space step Δx ¼ 0.03 125, and we used8192 grid points for the 1D bistable system and for theSchrödinger eigenvalue problem. The Schrödingereigenvalue problem was solved by calculating a finite-dimensional matrix eigenvalue problem using a centeredsecond-order finite-differencing scheme for the Laplacianoperator.
b. Aliev-Panfilov model
We used the modified Aliev-Panfilov model [22] tocreate bistable and monostable zones as shown in Fig. S2 ofthe Supplemental Material [18],
∂u∂t ¼ −kðu − 1Þðu − aÞ − ruvþDΔu;
∂v∂t ¼ 0.9
�cþ
�d1v
d2 þ u
��½−v − kuðu − b − 1Þ�; ðB1Þ
where c ¼ 0.002, b ¼ 0.15, d1 ¼ 0.2, d2 ¼ 0.3, k ¼ 8, andD ¼ 2.0. These parameters are the same for the bi- andmonostable zone. The equations for the monostable zonewere converted to bistable ones by using the threshold a ¼0.08 and a repolarizing force r ¼ 0.61. The values for themonostable zone were a ¼ 0.15 and r ¼ 1 as in the originalAliev-Panfilov formulation. The corresponding nullclinesare shown in Fig. S2(a) of the Supplemental Material [18].
c. Implementation of ultralong APs in the FHN model
To mimic ultralong APs in a simplified model, wemodified the FHN reaction-diffusion model as follows:
PARADOXICAL ONSET OF ARRHYTHMIC WAVES FROM … PHYS. REV. X 8, 021077 (2018)
021077-11

∂u∂t ¼ −fðuÞ − v − gþDΔu;
∂v∂t ¼ ε½u − γðrÞv�;∂g∂t ¼ ε2ðu − γ2gÞ: ðB2Þ
Here, fðuÞ ¼ uðu − 1Þðu − aÞ, a ¼ 0.13, ε ¼ 0.004, andD ¼ 2.0. The state variable g was added to the standardmodel, having the slowest timescale ε2 ¼ 0.00005 ≪ε ≪ 1. Another parameter γ2 ¼ 3.12. For g ¼ 0, the differ-ential equations for u and v constitute a monostable orbistable system. Normal tissue was modeled as a mono-stable system (γ ¼ γmono ¼ 1.5), if g ¼ 0. QSD tissue wasmodeled as a bistable system (γ ¼ γbi ¼ 14.0), if g ¼ 0.
d. Implementation of ultralong APsin the Aliev-Panfilov model
Similarly to the previous paragraph, we introduced avery slowly recovering variable g in the Aliev-Panfilovmodel:
∂u∂t ¼ −kðu − 1Þðu − aÞ − ruðvþ gÞ þDΔu;
∂v∂t ¼ 0.9
�cþ
�d1v
d2 þ u
��½−v − kuðu − b − 1Þ�;
∂g∂t ¼ ε2ðu − γ2gÞ; ðB3Þ
where ε2 ¼ 0.0001, γ2 ¼ 3.12.
e. Detailed electrophysiological model of NRVMswith regionally activated late Na + current
The monolayer model of NRVMs was adopted from[19]. The steady-state voltage dependence for the inacti-vation variable h of fast Naþ current was changed toh∞ ¼ ½1þ e½ð65þVÞ=6.07��−1, where V is the transmembranepotential. In the square QSD zone, the late Naþ current wasformulated as an additional low-conductance Naþ current,in accordance with [62]
INa ¼ GNaLmL3hLðV − ENaÞ; ðB4Þ
where GNaL ¼ 1.2288 mS=μF. The formulation of theactivation variable mL coincides with the formulation ofm for the fast Naþ current and, for hL, it is given by
dhLdt
¼ hL − hL;∞τhL
: ðB5Þ
Here, the steady-state voltage dependence was chosen to behL;∞ ¼ ½1þ e½ð101þVÞ=6.1��−1. By changing time constantτhL, we were able to modify the duration of ectopic activityepisodes. τhL ¼ 15 000 ms was chosen for Fig. 2 and τhL ¼3000 ms for Fig. S5(a) of the Supplemental Material [18].
The forward Euler method was used to integrate theequations with a time step Δt ¼ 0.005 ms and a centeredfinite-differencing scheme to discretize the Laplacian witha space step of Δx ¼ 0.0625 mm. The total computationaldomain size was 256 × 256 grid points; the centrallylocated square with the activated late Naþ current consistedof 115 × 115 grid points. To create stationary initialconditions, the model was integrated for 2 min before asingle stimulus was applied to the lower border of thedomain.
f. Detailed electrophysiological model of adulthuman ventricular myocytes with regionally
activated late Na + current
The ten Tusscher-Noble-Noble-Panfilov model wasadopted from Ref. [20]. The conductances of the transientoutward (Gto), rapid (GKr), and the slow delayed (GKs)rectifier Kþ current were reduced to 50% of their originalvalues. This did not significantly prolong APD.The late Naþ current was implemented in the same
manner as for the rat model. We used the same formalism asin Eq. (B4), where the activation kinetics coincides with thekinetics of the fast Naþ current. The inactivation variablealso followed Eq. (B5). The steady-state inactivation washL;∞ ¼ ½1þ e½ð101þVÞ=6.1��−1, where V is the transmem-brane potential; the conductance of the channel GNaL ¼0.65536 mS=μF. Time constants were τhL ¼ 25000 ms forthe prolonged episode in Fig. 2 of the main manuscript andτhL ¼ 5000 ms for the short episode in Fig. S5(b)of the Supplemental Material [18]. The forward Eulermethod was used to integrate the equations with a timestep Δt ¼ 0.005 ms and a centered finite-differencingscheme to discretize the Laplacian with a space stepΔx ¼ 0.0625 mm. The diffusion coefficient was equal to0.000154 cm2=ms. The total computational domain sizewas 1024 × 1024 grid points; the centrally located squarewith the activated late Naþ current consisted of 460 × 460grid points. The model was integrated for 2 min to createstationary initial conditions. Thereafter, a single pulse wasdelivered at the lower border of the domain.
g. Detailed electrophysiological model of adulthuman ventricular myocytes with regionally
increased Ca2 + current
The ten Tusscher–Noble–Noble–Panfilov model wasadopted from Ref. [20]. The conductance of the transientrapid delayed rectifier (GKr) was set to zero throughout thecomputational domain. The time constant of the inactivatingf-gate of the L-type Ca2þ was reduced twofold uniformly inthe domain. The conductance of L-type Ca2þ channel GCaLwas increased 12 times inside the square to mimic damagedtissue and 2 times in the surrounding tissue, causing a sixfolddifference in conductance between the inner and outerregions of the domain. The diffusion coefficient was set
ALEXANDER S. TEPLENIN et al. PHYS. REV. X 8, 021077 (2018)
021077-12
to 0.000154 cm2=ms. The forward Euler method was usedto integrate the equations with Δt ¼ 0.005 ms. The Lapla-cian was implemented using a centered finite-differencingscheme with Δx ¼ 0.0625 mm. The total domain size was512 × 512 grid points; the centrally located square with theincreased Ca2þ current consisted of 230 × 230 grid points.The model was integrated for 2 min to create stationaryinitial conditions, after which a stimulus was delivered at thelower domain boundary. The initial wave of excitation led toa sustained depolarization of the square, followed by ectopicwaves originating from the corners of the square (Fig. S7 ofthe Supplemental Material [18]).
[1] R. Mehra, Global Public Health Problem of SuddenCardiac Death, J. Electrocardiol. 40, S118 (2007).
[2] S. M. Pogwizd, R. H. Hoyt, J. E. Saffitz, P. B. Corr, J. L.Cox, and M. E. Cain, Reentrant and Focal MechanismsUnderlying Ventricular Tachycardia in the Human Heart,Circulation 86, 1872 (1992).
[3] M. J. Janse, F. J. Van Capelle, H. Morsink, A. G. Kleber, F.Wilms-Schopman, R. Cardinal, C. N. d’Alnoncourt, and D.Durrer, Flow of “Injury” Current and Patterns of ExcitationDuring Early Ventricular Arrhythmias in Acute RegionalMyocardial Ischemia in Isolated Porcine and CanineHearts. Evidence for Two Different Arrhythmogenic Mech-anisms, Circ. Res. 47, 151 (1980).
[4] A. T. Winfree, The Geometry of Biological Time (SpringerScience & Business Media, New York, 2001), Vol. 12.
[5] H. Dierckx, O. Bernus, and H. Verschelde, AccurateEikonal-Curvature Relation for Wave Fronts in LocallyAnisotropic Reaction-Diffusion Systems, Phys. Rev. Lett.107, 108101 (2011).
[6] J. W. Cahn and J. E. Hilliard, Free Energy of a NonuniformSystem. III. Nucleation in a Two-Component Incompress-ible Fluid, J. Chem. Phys. 31, 688 (1959).
[7] P. W. Bates and P. C. Fife, The Dynamics of Nucleation forthe Cahn-Hilliard Equation, SIAM J. Appl. Math. 53, 990(1993).
[8] A. G. Kleber and Y. Rudy, Basic Mechanisms of CardiacImpulse Propagation and Associated Arrhythmias, Physiol.Rev. 84, 431 (2004).
[9] A. Arutunyan, D. R. Webster, L. M. Swift, and N.Sarvazyan, Localized Injury in Cardiomyocyte Network:A New Experimental Model of Ischemia-Reperfusion Ar-rhythmias, Am. J. Physiol. 280, H1905 (2001).
[10] K. R. Pitts and C. F. Toombs, Coverslip Hypoxia: A NovelMethod for Studying Cardiac Myocyte Hypoxia and Ische-mia In Vitro, Am. J. Physiol. 287, H1801 (2004).
[11] E. S. Boyden, F. Zhang, E. Bamberg, G. Nagel, and K.Deisseroth, Millisecond-Timescale, Genetically TargetedOptical Control of Neural Activity, Nat. Neurosci. 8,1263 (2005).
[12] M. Watanabe, I. Feola, R. Majumder, W. Jangsangthong,A. S. Teplenin, D. L. Ypey, M. J. Schalij, K. Zeppenfeld,A. A. de Vries, and D. A. Pijnappels, Optogenetic Manipu-lation of Anatomical Re-entry by Light-Guided Generation
of a Reversible Local Conduction Block, Cardiovasc. Res.113, 354 (2017).
[13] H. M. McNamara, H. Zhang, C. A. Werley, and A. E.Cohen, Optically Controlled Oscillators in an EngineeredBioelectric Tissue, Phys. Rev. X 6, 031001 (2016).
[14] A. Teplenin, W. Jangsangthong, I. Feola, M. Schalij, D.Ypey, A. DeVries, andD. Pijnappels,Microfoci of OxidativeStress Increase Pro-arrhythmic Risk as Revealed by Pat-terned Illumination of Optogenetically Engineered Myocar-dial Cultures, European Heart Journal 37, 711 (2016).
[15] X. Shu, V. Lev-Ram, T. J. Deerinck, Y. Qi, E. B. Ramko,M.W. Davidson, Y. Jin, M. H. Ellisman, and R. Y. Tsien, AGenetically Encoded Tag for Correlated Light and ElectronMicroscopy of Intact Cells, Tissues, and Organisms, PLoSBiol. 9, e1001041 (2011).
[16] M. C. Engels, S. F. Askar, W. Jangsangthong, B. O. Bingen,I. Feola, J. Liu, R. Majumder, M. I. Versteegh, J. Braun, R. J.Klautz et al., Forced Fusion of Human Ventricular ScarCells with Cardiomyocytes Suppresses Arrhythmogenicityin a Co-culture Model, Cardiovasc. Res. 107, 601 (2015).
[17] I. Feola, A. Teplenin, A. A. de Vries, and D. A. Pijnappels,in Optogenetic Engineering of Atrial Cardiomyocytes,Optogenetics. Methods in Molecular Biology Vol. 1408,edited by A. Kianianmomeni (Humana Press, New York,2016), pp. 319–331.
[18] See Supplemental Material at http://link.aps.org/supplemental/10.1103/PhysRevX.8.021077 for Supplemen-tary Figures 1–7.
[19] R. Majumder, M. C. Engels, A. A. De Vries, A. V. Panfilov,and D. A. Pijnappels, Islands of Spatially Discordant APDAlternans Underlie Arrhythmogenesis by PromotingElectrotonic Dyssynchrony in Models of Fibrotic RatVentricular Myocardium, Sci. Rep. 6, 24334 (2016).
[20] K. H. ten Tusscher, D. Noble, P.-J. Noble, and A. V.Panfilov, A Model for Human Ventricular Tissue, Am. J.Physiol. 286, H1573 (2004).
[21] R. FitzHugh, Impulses, and Physiological States in Theoreti-cal Models of Nerve Membrane, Biophys. J. 1, 445 (1961).
[22] R. R. Aliev and A. V. Panfilov, A Simple Two-VariableModel of Cardiac Excitation, Chaos Solitons Fractals 7, 293(1996).
[23] V. Zykov, A. Krekhov, and E. Bodenschatz, Fast Propa-gation Regions Cause Self-Sustained Reentry in ExcitableMedia, Proc. Natl. Acad. Sci. U.S.A. 114, 1281 (2017).
[24] J. Keener and J. Sneyd, Mathematical Physiology: I:Cellular Physiology (Springer Science & Business Media,New York, 2010).
[25] J. Rinzel and J. P. Keener, Hopf Bifurcation to RepetitiveActivity in Nerve, SIAM J. Appl. Math. 43, 907 (1983).
[26] J. C. Shryock, Y. Song, S. Rajamani, C. Antzelevitch, and L.Belardinelli, The Arrhythmogenic Consequences of Increas-ing Late INa in the Cardiomyocyte, Cardiovasc. Res. 99,600 (2013).
[27] L. Belardinelli,W. R. Giles, S. Rajamani, H. S. Karagueuzian,and J. C. Shryock,Cardiac LateNaþ Current: ProarrhythmicEffects, Roles in Long QT Syndromes, and PathologicalRelationship to CaMKII and Oxidative Stress, Heart Rhythm12, 440 (2015).
[28] C. Antzelevitch, M Cells in the Human Heart, Circ. Res.106, 815 (2010).
PARADOXICAL ONSET OF ARRHYTHMIC WAVES FROM … PHYS. REV. X 8, 021077 (2018)
021077-13

[29] Z. Qu and D. Chung,Mechanisms and Determinants of Ultr-along Action Potential Duration and Slow Rate-Dependencein Cardiac Myocytes, PLoS One 7, e43587 (2012).
[30] B. A. Alseikhan, C. D. DeMaria, H. M. Colecraft, and D. T.Yue, Engineered Calmodulins Reveal the UnexpectedEminence of Ca2þ Channel Inactivation in ControllingHeart Excitation, Proc. Natl. Acad. Sci. U.S.A. 99, 17185(2002).
[31] O. M. Koval, X. Guan, Y. Wu, M.-l. Joiner, Z. Gao, B. Chen,I. M. Grumbach, E. D. Luczak, R. J. Colbran, L.-S. Songet al., CaV 1.2 β-Subunit Coordinates CaMKII-TriggeredCardiomyocyte Death and Afterdepolarizations, Proc. Natl.Acad. Sci. U.S.A. 107, 4996 (2010).
[32] J. D. Moreno, P.-C. Yang, J. R. Bankston, E. Grandi, D. M.Bers, R. S. Kass, and C. E. Clancy, Ranolazine for Congeni-tal and Acquired Late INa Linked Arrhythmias: In SilicoPharmacologic Screening, Circ. Res. 113, e50 (2013).
[33] X. Huang, T. Y. Kim, G. Koren, B.-R. Choi, and Z. Qu,Spontaneous Initiation of Premature Ventricular Com-plexes and Arrhythmias in Type 2 Long QT Syndrome,Am. J. Physiol. 311, H1470 (2016).
[34] P. C. Viswanathan and Y. Rudy, Pause Induced EarlyAfterdepolarizations in the Long QT Syndrome: A Simu-lation Study, Cardiovasc. Res. 42, 530 (1999).
[35] A. Burashnikov and C. Antzelevitch, Acceleration-InducedAction Potential Prolongation and Early Afterdepolariza-tions, J. Cardiovasc. Electrophysiol. 9, 934 (1998).
[36] D. Nuyens, M. Stengl, S. Dugarmaa, T. Rossenbacker, V.Compernolle, Y. Rudy, J. F. Smits, W. Flameng, C. E.Clancy, L. Moons et al., Abrupt Rate Accelerations orPremature Beats Cause Life-Threatening Arrhythmias inMice with Long-QT3 Syndrome, Nat. Med. 7, 1021 (2001).
[37] M. O. Sweeney, L. L. Ruetz, P. Belk, T. J. Mullen, J. W.Johnson, and T. Sheldon, Bradycardia Pacing-InducedShort-Long-Short Sequences at the Onset of VentricularTachyarrhythmias: A Possible Mechanism of Proarrhyth-mia?, J. Am. Coll. Cardiol. 50, 614 (2007).
[38] J. Huang, H. Xian, and M. Bacaner, Long-Chain Fatty AcidsActivate Calcium Channels in Ventricular Myocytes, Proc.Natl. Acad. Sci. U.S.A. 89, 6452 (1992).
[39] D. Schwartzman, R. Bazaz, and J. Nosbisch, Common LeftPulmonary Vein, J. Cardiovasc. Electrophysiol. 15, 560(2004).
[40] Z. Qu, G. Hu, A. Garfinkel, and J. N. Weiss, Nonlinear andStochastic Dynamics in the Heart, Phys. Rep. 543, 61(2014).
[41] J. P. Keener, Model for the Onset of Fibrillation FollowingCoronary Artery Occlusion, J. Cardiovasc. Electrophysiol.14, 1225 (2003).
[42] B. E. Peercy and J. P. Keener, Coupled Cell Model of BorderZone Arrhythmias, SIAM J. Appl. Dyn. Syst. 4, 679 (2005).
[43] V. Jacquemet, Pacemaker Activity Resulting from theCoupling with Nonexcitable Cells, Phys. Rev. E 74,011908 (2006).
[44] K. J. Bishop and B. A. Grzybowski, Localized ChemicalWave Emission and Mode Switching in a Patterned Excit-able Medium, Phys. Rev. Lett. 97, 128702 (2006).
[45] I. N. Motoike, S. Nakata, Y. Iguchi, K. K. Takemura, K.Hayashi, and K. Yoshikawa, Apex of a V-Shaped Cut FieldActs as a Pacemaker on an Oscillatory System, Chem. Phys.Lett. 490, 238 (2010).
[46] D. Mihalache, D. Mazilu, F. Lederer, and Y. S. Kivshar,Spatiotemporal Surface Solitons in Two-DimensionalPhotonic Lattices, Opt. Lett. 32, 3173 (2007).
[47] S. Batz and U. Peschel, Solitons in Curved Space ofConstant Curvature, Phys. Rev. A 81, 053806 (2010).
[48] C. Conti, Localization, and Shock Waves in CurvedManifolds, Science bulletin 61, 570 (2016).
[49] Y. Gaididei, V. P. Kravchuk, and D. D. Sheka, CurvatureEffects in Thin Magnetic Shells, Phys. Rev. Lett. 112,257203 (2014).
[50] H. T. Jadallah, The Onset of Superconductivity in aDomain with a Corner, J. Math. Phys. (N.Y.) 42, 4101(2001).
[51] P. Bauman, D. Phillips, and Q. Tang, Stable Nucleation forthe Ginzburg-Landau System with an Applied MagneticField, Arch. Ration. Mech. Anal. 142, 1 (1998).
[52] M. J. Bowick and L. Giomi, Two-Dimensional Matter:Order, Curvature and Defects, Adv. Phys. 58, 449 (2009).
[53] P. Duclos and P. Exner, Curvature-Induced Bound States inQuantum Waveguides in Two and Three Dimensions, Rev.Math. Phys. 07, 73 (1995).
[54] R. DaCosta,Quantum Mechanics of a Constrained Particle,Phys. Rev. A 23, 1982 (1981).
[55] M. Nagasawa, Schrödinger Equations and Diffusion Theory(Birkhäuser, Basel, 2012), Vol. 86.
[56] L. S. Schulman, Techniques and Applications of PathIntegration (Courier Corporation, Mineola, 2012).
[57] T. O’Hara, L. Virág, A. Varró, and Y. Rudy, Simulation ofthe Undiseased Human Cardiac Ventricular Action Poten-tial: Model Formulation and Experimental Validation,PLoS Comput. Biol. 7, e1002061 (2011).
[58] E. Grandi, F. S. Pasqualini, and D. M. Bers, A NovelComputational Model of the Human Ventricular ActionPotential and Ca Transient, J. Mol. Cell. Cardiol. 48, 112(2010).
[59] C. C. Mitchell and D. G. Schaeffer, A Two-Current Modelfor the Dynamics of Cardiac Membrane, Bull. Math. Biol.65, 767 (2003).
[60] C. Corrado and S. A. Niederer, A Two-Variable ModelRobust to Pacemaker Behaviour for the Dynamics of theCardiac Action Potential, Math. Biosci. 281, 46 (2016).
[61] https://imagej.nih.gov/ij/.[62] B. Trenor, K. Cardona, J. F. Gomez, S. Rajamani, J. M.
Ferrero, Jr., L. Belardinelli, and J. Saiz, Simulation andMechanistic Investigation of the Arrhythmogenic Role of theLate Sodium Current in Human Heart Failure, PLoS One 7,e32659 (2012).
ALEXANDER S. TEPLENIN et al. PHYS. REV. X 8, 021077 (2018)
021077-14