Paper presented at the Annual Meeting of - ERIC
26
DOCUMENT RESUME ED 409 318 TM 026 540 AUTHOR Wang, Lin; McNamara, James F. TITLE An Evaluation of the Sample Designs in Educational Survey Research. PUB DATE Mar 97 NOTE 25p.; Paper presented at the Annual Meeting of the American Educational Research Association (Chicago, IL, March 24-28, 1997). PUB TYPE Reports Evaluative (142) Speeches/Meeting Papers (150) EDRS PRICE MF01/PC01 Plus Postage. DESCRIPTORS Classification; Editing; *Educational Research; Estimation (Mathematics); Evaluation Methods; *Research Design; Sample Size; *Sampling; Scholarly Journals; *Surveys IDENTIFIERS Educational Administration Quarterly; Variance (Statistical) ABSTRACT This paper shares the findings of an inquiry that evaluated 50 survey articles published in a refereed journal, "Educational Administration Quarterly," by examining the 53 sample designs reported in the articles. The paper presents a typology of the sample designs identified, discusses the problems of sample selection and estimation procedures, and delineates possible ways to improve sample design practice in educational research. Major findings are that: (1) one- and two-stage sample selections were typically used in the survey sample designs; (2) the target or survey populations were not defined in about half of the sample designs; (3) where complex survey data was involved, variance estimates, obtained using the standard methods, were not adjusted to account for any possible design effects; and (4) potential nonresponse bias effects were not investigated in any designs with low response rates. Overall, the general quality of the selection procedures in the 53 sample designs was compromised by problems. Editors of this journal should require sufficient information about sample selection procedures. (Contains 3 tables and 36 references.) (Author/SLD) ******************************************************************************** Reproductions supplied by EDRS are the best that can be made from the original document. ********************************************************************************
-
Upload
khangminh22 -
Category
Documents
-
view
0 -
download
0
Transcript of Paper presented at the Annual Meeting of - ERIC
DOCUMENT RESUME
ED 409 318 TM 026 540
AUTHOR Wang, Lin; McNamara, James F.TITLE An Evaluation of the Sample Designs in Educational Survey
Research.PUB DATE Mar 97NOTE 25p.; Paper presented at the Annual Meeting of the American
Educational Research Association (Chicago, IL, March 24-28,1997).
PUB TYPE Reports Evaluative (142) Speeches/Meeting Papers (150)EDRS PRICE MF01/PC01 Plus Postage.DESCRIPTORS Classification; Editing; *Educational Research; Estimation
(Mathematics); Evaluation Methods; *Research Design; SampleSize; *Sampling; Scholarly Journals; *Surveys
IDENTIFIERS Educational Administration Quarterly; Variance (Statistical)
ABSTRACTThis paper shares the findings of an inquiry that evaluated
50 survey articles published in a refereed journal, "EducationalAdministration Quarterly," by examining the 53 sample designs reported in thearticles. The paper presents a typology of the sample designs identified,discusses the problems of sample selection and estimation procedures, anddelineates possible ways to improve sample design practice in educationalresearch. Major findings are that: (1) one- and two-stage sample selectionswere typically used in the survey sample designs; (2) the target or surveypopulations were not defined in about half of the sample designs; (3) wherecomplex survey data was involved, variance estimates, obtained using thestandard methods, were not adjusted to account for any possible designeffects; and (4) potential nonresponse bias effects were not investigated inany designs with low response rates. Overall, the general quality of theselection procedures in the 53 sample designs was compromised by problems.Editors of this journal should require sufficient information about sampleselection procedures. (Contains 3 tables and 36 references.) (Author/SLD)
********************************************************************************
Reproductions supplied by EDRS are the best that can be madefrom the original document.
********************************************************************************
PERMISSION TO REPRODUCE ANDDISSEMINATE THIS MATERIAL
HAS BEEN GRANTED BY
Lin Wang
TO THE EDUCATIONAL RESOURCES.INFORMATION CENTER (ERIC)
AN EVALUATION OF THE SAMPLE DESIGNS IN
EDUCATIONAL SURVEY RESEARCH
Lin Wang
ACT
James F. McNamara
Texas A&M University
U.S. DEPARTMENT OF EDUCATIONOffice of Educational Research and Improvement
EDUCATIONAL RESOURCES INFORMATIONCENTER (ERIC)
g3his document has been reproduced asreceived from the person or organizationoriginating it.Minor changes have been made toimprove reproduction quality.
Points of view or opinions stated in thisdocument do not necessarily representofficial OERI position or policy.
Paper presented at the Annual Meeting of the American Educational Research Association,
March, 1997, Chicago.
2
BEST COPY AVAILABLE
1
Abstract
The purpose of this paper is to share the findings from an inquiry that evaluated 50 survey
articles published in a refereed journal by examining the sample designs reported in the 50
articles. Specifically, this paper will (a) present a typology of the sample designs identified, (b)
report and discuss the problems in sample selection and estimation procedures, and (c) delineate
possible ways to improve sample design practice in educational research. Major findings include:
(1) one- and two-stage selections were typically used in the survey sample designs, (2) the target
or survey populations were not defined in about half of the sample designs, (3) where complex
survey data was involved, variance estimates, obtained using the standard methods, were not
adjusted to account for possible design effects, and (4) potential nonresponse bias effects were
not investigated in any designs with low response rates.
3
2
An Evaluation of the Sample Designs in Educational Survey Research
Surveys play an important role in educational research. Generally, survey research uses
some sampling strategy to select a sample from a population in order to learn certain
characteristics of the population (Barnett, 1991; Ferber, Sheatsley, Turner, & Waksberg, 1980).
It is in this sense that survey is also referred to as sample survey. Sample survey is frequently
employed in educational inquiries. For example, between 1993 and 1995, over 900 dissertations
in educational administration alone reported using some sample survey data (Pro Quest File,
1995). The quality of survey research is determined mainly by its sample design and other survey
objectives (Babbie, 1990; Deming, 1960; Dillman, 1978, 1991; Jolliffe, 1986; Kish, 1965; Pena
& Henderson, 1986; Yates, 1960). Sample design has two components: selection process and
estimation process. Although many things have to be considered in sample design, the selection
process is particularly important in that this process is the basis for the subsequent estimation
process. Without a valid selection process, estimation is subject to problems and errors.
In educational research, just as in other fields, a study using sample survey method is
seldom interested in the sample statistics itself. Instead, the research interest is usually in
generalizing or projecting the sample statistics to the population. Accomplishment of this task
depends on selecting a good sample and. conducting an appropriate data analysis. The statistical
theory for sampling from a finite population, as is the case in most educational survey studies,
emphasizes the importance of sample design, strives for design-unbiasedness, and relies on
random selection to induce probabilities. In addition, since every unit of the finite population
must be uniquely identifiable, it is very important to define clearly the population to be studied
(Kish, 1965; Hedayat & Sinha, 1991). In survey research, strictly speaking, a population means
a target population, which is an ideal but practically unaccessible population in most cases.
Therefore, an operational population, called survey population, is actually sampled. Once a
(target) population is specified, a survey population can then be specified from which a sampling
frame can be constructed. Depending on the scope of a study, resources and precision
requirements, different selection strategies can be applied. Within probability sampling, there are
simple random selection, stratified selection, cluster selection, and the combinations of these
selection methods. There are also a variety of nonprobability selection methods, such as quota
4
3
sampling, purposive sampling, etc.. Again, probability and nonprobability sampling methods
might be combined in application. No matter what sampling strategy is used, the goal is to obtain
a sample representative of the population on the characteristics (study variables) of interest such
that the sample statistics can be generalized to the population with as little error and bias as
possible.
Estimation of population parameters from a simple random sample with high response rate
presents no particular problem in data analysis. When a sample is taken with a complex sampling
design, i.e., a design other than the simple random sampling, estimation can be complicated.
Typically, survey sampling theory requires consideration of sampling design features in the
estimation process (Kish, 1965; Lee, Forthofer, & Lorimor, 1989; Scheaffer, Mendenhall, & Ott,
1990). This is because complex designs have varying design efficiencies compared with a simple
random design. Such design efficiency is defined as design effect, which is the ratio of a complex
variance estimate to a simple variance estimate (Kish, 1965). For example, other conditions being
equal, a stratified design tends to be more efficient than a simple random design, whereas a
cluster design would be less efficient than a simple random design. Put differently, to meet a
specified precision requirement for estimation, say, a 5% margin of error, a stratified design may
need a smaller sample size than a simple random design; a cluster design would call for a larger
sample size than a simple random design. Therefore, computation formulas are different for data
from different designs, such as stratified, clustered, or multi-stage ones. This is particularly
important in variance estimation, using a wrong formula or estimation method can lead to
unwarranted conclusions in a study. In conventional statistical software such as SAS or SPSS,
computation of sample statistics uses formulas for data collected with a simple random design.
If educational researchers fail to notice this fact and analyze data from complex designs without
making any adjustment, the results can be problematic to varying degrees. Unfortunately, this
seems to happen a lot in educational survey studies.
In both selection and estimation processes in a survey study, nonresponse problem calls
for special attention. Survey nonresponse refers to the failure to obtain measurements on sample
units (de Leeuw, 1992). Nonresponse results in missing data either on some items or for the
whole unit: these two instances are called item nonpresponse and unit nonresponse, respectively
(Ka lton, 1983). Discussions of nonresponse problems are not rare in educational research
5

4
literature (Aiken, 1988; Johnson, 1992; McNamara, 1994). Typically, it is recognized that
nonresponse raises the question of potential bias in research findings. The potential bias results
from the possibility that, more often than not, nonrespondents are different from respondents.
(Borg & Gall, 1996; Gay, 1989). Good follow-ups and innovative incentives are ways that may
improve response rates, i.e., to minimize nonresponse and its effects (Armstrong, 1975; Babbie,
1986; Shultz & Luloff, 1990). On the other hand, some statistical adjustments, such as weighting
or post-stratification, may help to compensate for the lost information due to nonresponse (Lin
& Schaeffer, 1995; Zanutto, 1994). Caution should always be exercised in interpreting and
generalizing any findings if low response rates are present in the sampling stage.
Although survey research as well as sample selection is covered in many research method
textbooks and discussed in journal articles, there is very limited amount of research on the quality
of sample designs implemented in educational research. Two studies have been identified that
address sample design problems in educational survey research. In one study, Pena and
Henderson (1986) evaluated the sample designs in ten national surveys of public school teachers
conducted between 1980 and 1985. The sample designs of the ten surveys were examined with
regard to sample size, representativeness, precision and estimation method, source of sampling
frame, selection method, and data collection method. It was found that, "In most of the survey
reports reviewed, the sample design was relegated to the background. Apparently, the important
thing for most researchers was the assurance of an adequate, representative and reliable sample,
or at the very most, an explanation of flaws in this area. Results were reported, without
consideration of the method of sampling" (p. 32). Specifically, five problems in sampling
practices were identified: (1) lack of adequate sampling frame, (2) lack of assurance for
representativeness, (3) theoretical connection between design and computation of estimates, (4)
knowledge of quantitative relationship between the design and precision of the estimates, and (5)
reporting results that show validity, willingness and ability to discuss the strengths and
weaknesses of the survey.
The other study was reported by Miskel and Sand lin (1981) on their findings from an
evaluation of the survey research in educational administration. Two leading journals in
educational administration, the Educational Administration Quarterly and the Journal of
Educational Administration, were chosen for evaluation. The survey articles published from 1972
5
to 1979 were included. The two researchers used four criteria in evaluation of the sample designs
by looking at (1) specification of population, (2) unit of analysis, (3) response rate, and (4)
selection method. The findings of the evaluation include: out of the 23 EAQ articles reviewed,
unit of analysis was specified in only five sample designs (23%). Populations were specified in
seven articles only. In six articles there was no way to tell what selection procedure had been
used. Miskel and Sand lin concluded that, for sampling, "improvements have not been applied
systematically in the field of educational administration. Either many researchers have not learned
of the advances, or they have chosen to ignore them" (p. 17). The two authors seemed to be
particularly critical of the tendency for unwarranted generalization of findings, "After reviewing
a large number of studies, a somewhat cynical impression emerges that the elaborate description
of the sample is part of an effort to suggest that the findings are highly generalizable. Yet, in
many cases, the population is not mentioned, and the participation rate is low or not identified.
This condition is poor practice when the intentions are positive, but it is an unethical practice
when the intentions are negative" (p. 17).
Despite the contribution of these two studies to the research on sample design quality in
educational surveys, no previous research has yet been identified that summarizes and describes
a variety of sample designs actually implemented in educational research. Given the variety of
sample designs in educational research, it is necessary to disseminate the information about such
sample designs to the researchers in a concise and effective way. A typology has the
characteristics of being both multidimensional and conceptual and generally has either labels or
names in its cells (Bailey, 1994). Such characteristics of typology satisfy the needs to sort, group
and present sample selection procedures that can be described in two dimensions: selectiOn stage
and selection method. Also, in our review of the literature, we have not found studies that
systematically evaluate both the selection and estimation processes of survey studies. Such an
evaluation would be very helpful and informative as we need to know how well and effectively
the survey methods have been used in educational research, and what are the problems we need
to be aware of in practice.
The purpose of this study was to address these two issues, namely, a typology of sample
designs and an evaluation of the sample designs reported in literature. This paper reports the
findings of our research in this respect. Specifically, we are going to (a) present a typology of
7
6
the sample selection methods identified in literature, (b) evaluate the selection and estimation
procedures, the data analysis procedures, the interpretation and generalization, and (c) makes
recommendations for improving sample design practices in educational research.
Methods
Data
The sample designs chosen for analysis and for construction of a typology are from the
sample descriptions found in the research articles in Educational Administration Quarterly (EAQ).
This journal was selected because it had published an extensive amount of survey research to
address a variety of issues in education (Miskel and Sand lin, 1981). In addition, the status of
the journal in the field gives reason to believe that the research published in the journal should
reflect the advancement of the field.
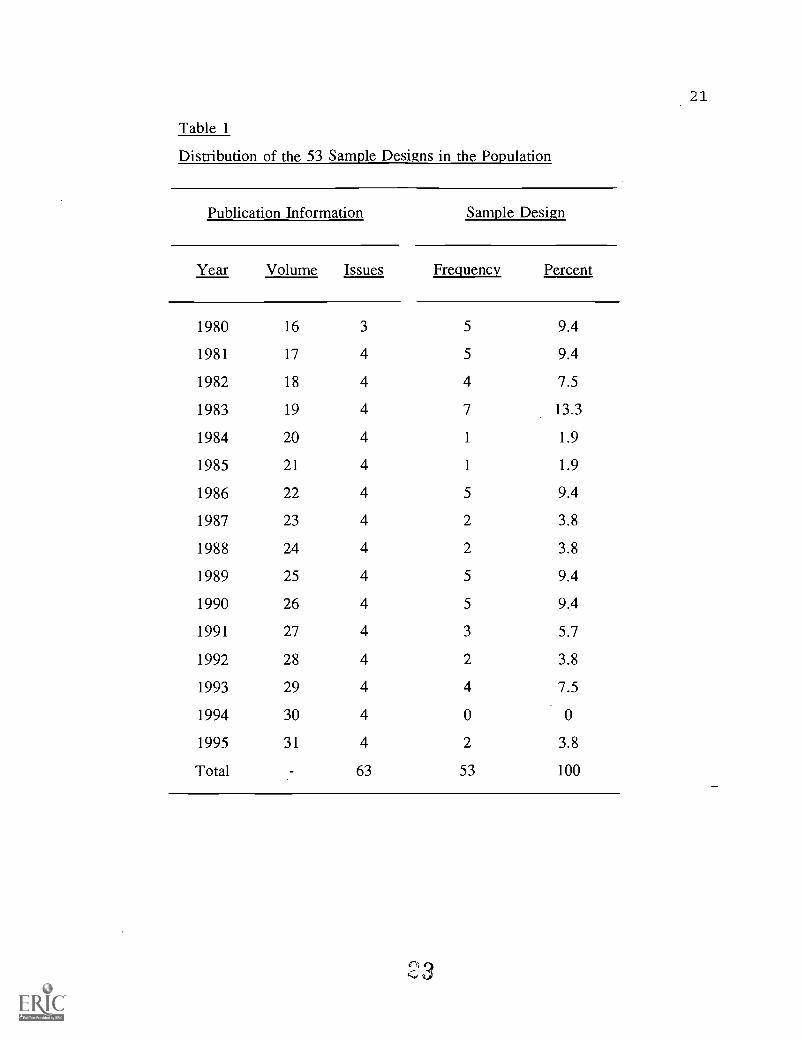
From 1980 through 1995, 286 research articles were published in 63 issues of EAQ.
Using a content analysis method for classification, 50 articles were identified as survey articles.
A research article was classified as a survey article if it reported designing and implementing a
sample survey study, and the data analysis was done using some quantitative methods. The 50
survey articles contain 53 sample designs. These 53 sample designs constituted the population
of this study for both typology development and evaluation. The distribution of the 53 sample
designs is summarized in Table 1.
Since the 53 sample designs were all studied, no sampling was involved in this research.
In other words, this was a census-type investigation of all the sample designs in the survey
studies published in the 16 volumes of EAQ. The unit of analysis was the individual design. The
analysis was descriptive as no inference was needed.
Insert Table 1 about here
Typology of sample designs
Important selection features, such as population specification, sample size decision,
response rate, selection methods, etc., of the 53 sample designs were coded and verified in data
collection. To arrive at a realistic typology that depicts the variety of sample selection procedures
8
in research practice, no attempt was made to impose any concrete models to the data. Instead,
the typological models were derived from the selection procedures described in the 53 sample
designs. The typology was built on two dimensions: selection stage and selection strategy (or
method). A sample design was classified as a one-, two-, or three-stage design according to the
number of actual selections reported. The selection strategy had two broad categories:
nonprobability and probability selections. The nonprobability category included criterion-based
samples, volunteer samples, and convenience samples. The probability category covered simple
random samples, systematic samples, stratified or cluster samples.
Specifically, all the identified sample selection procedures were analyzed and grouped first
according to the number of selection stages involved. This led to the formation of three general
typological models: the one-stage model, the two-stage model, and the three-stage model. No
sample selection was found to involve more than three stages of selection, and there were only
three cases of three-stage selections. Within each model, selection procedures were then grouped
according to whether they involved probability or nonprobability sampling. The three models
seem to be sufficient for describing the sample selection procedures from the EAQ articles, and
can be reasonably extended to the sample designs in many situations.
Evaluation of selection and estimation
Various criteria have been proposed for evaluation of sample design quality (Deming,
1960; Jaeger, 1988; Kish, 1965; McNamara, 1994; Permut, Michel, & Joseph, 1976; Sudman,
1976; Yates, 1960). Based on the theoretical requirements for sampling, and in light of the
checklists from Jaeger (1988) and McNamara (1994), six criteria were deemed as essential and
practical for evaluating the quality of the 53 sample designs. The six criteria are (1) a clearly
specified target population and survey population, (2) an explicit statement of unit of analysis in
light of the research questions, (3) a specification of a desired sample size and how this is
determined, (4) an informative description of the selection procedures, (5) a description of
response rate with information about nonrespondence situation, and (6) demonstration of
appropriate estimation, especially variance estimation, and data analysis according to the selection
strategies used, including the treatment of possible nonresponse bias problem and generalization
of findings.
A coding sheet was designed on the basis of the six criteria and was used to collect
9
8
relevant factual information from the 53 sample designs about various aspects of selection
procedures, estimation processes and other analytic procedures, and generalization of findings.
In some articles, the sample designs, especially the selection processes, were either not explicitly
described or presented in an over-simplistic manner. Efforts had to be made to analyze these
sample design descriptions very closely and to sort out clues for the reconstruction of possible
selection procedures that could have actually been used. A typical example is that the population
of study had to be inferred from the contents of an article if the population was not mentioned
in the sample design part.
Results
Typology models and sample designs
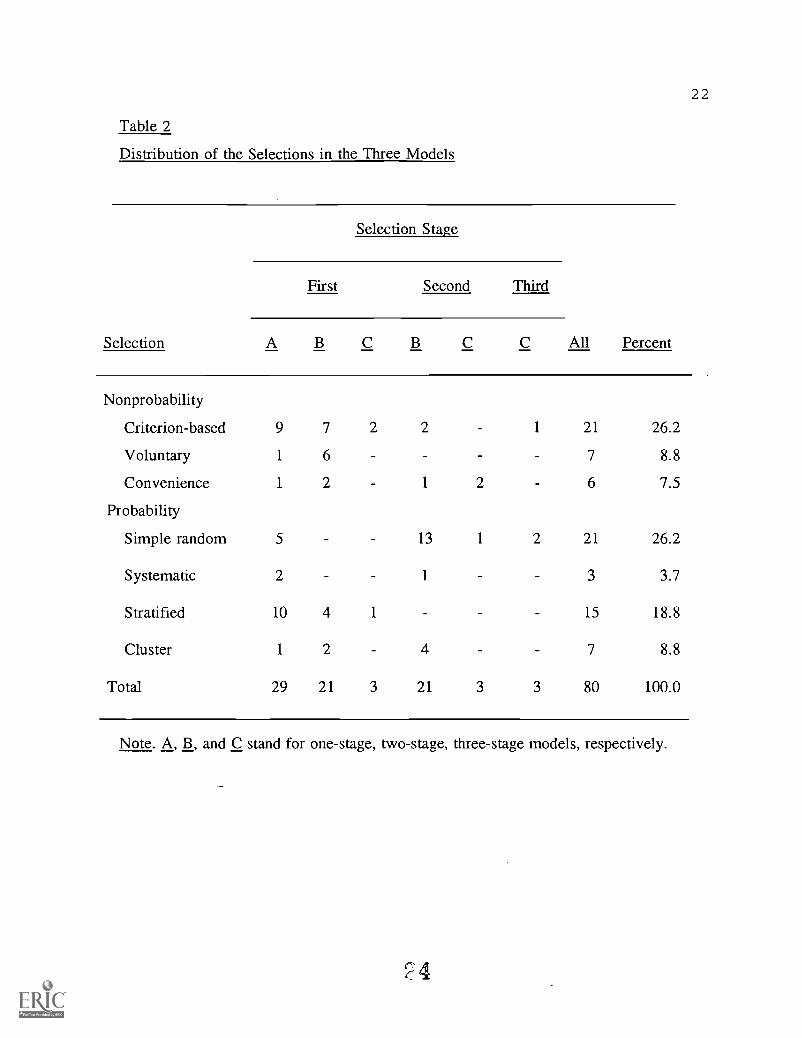
The 53 sample designs were classified into three typology models defined by selection
stages and selection methods, i.e., probability vs. nonprobability selection. The summary
information is given in Table 2. The columns labeled First, Second, and Third denote what
selection methods were used at each selection stage. The subcolumns (A., B, C) under each stage
indicates what selection occurs in a one-, two, or three-stage model. For example, the column A
under the First stage contains all the selections in the one-stage model and the distribution among
the selection methods. Therefore, 29 of the 53 sample designs involve one-stage selection.
Among the 29 designs, 9 used criterion-based nonprobability selection methods, 10 used stratified
probability selection methods, etc.. The B columns contain 21 sample designs that involve two-
stage selection. The B columns under the First and Second stage indicate the selection methods
at the two stages, respectively. For example, the first row of data for columns B means that, of
the 21 two-stage designs, 7 used criterion-based selection at the first stage; only two used
criterion-selection at the second stage.
Since the one-stage and two-stage models contained 29 (54.7%) and 21 (39.6) of the 53
sample designs, respectively, only 3 designs (5.7%) used relatively more complex three-stage
selection. The numbers under the column Percent in Table 1 describe the distribution of the 53
designs across various selection methods. Taken together, nonprobability and probability
selections are 42.5% and 57.5%, respectively. Within the 29 designs in the one-stage model (the
first column in the table), there are 11 (38%) nonprobability selections and 18 (62%) probability
selections. For the 21 designs in the two-stage model (under the two B columns), the differences
9
between nonprobability and probability selections at the two stages are fairly clear. At the first
stage, 15 (71%) nonprobability selections occurred compared to only 6 (29%) probability ones.
At the Second stage, however, only 3 (14%) nonprobability selections are found and there are
18 (86%) probability selections. Finally, for the 3 designs in the three-stage model, the
nonprobability versus probability selections at the three stages are 2 to 1, 2 to 1, and 1 to 2,
respectively. At the individual level of selection method, the simple random and criterion-based
selections have the same percentage of use (26.2%). The simple random selection is
predominantly at the second stage (14 out of 21), whereas the criterion-based selection is found
more at the first stage (18 of 21). The next frequently used method is the stratified selection
(18.8%); this method is mainly found in the one-stage model designs and at the first stage in the
two- or three-stage models.
Insert Table 2 about here
Selection procedures
The evaluation of the selection procedures identified in the 53 sample designs was
primarily focused on four aspects, namely, population specification and population validity,
sample size decisions, response rates and nonresponse problems, and presentation of sample
selection process.
The term "target population" was found in only one sample design description, and
"population" occurred in 10 other designs. Assuming that the populations in the 10 designs
referred to either target or survey populations, the above number amounts to saying that the
populations, whether they are target populations, survey populations, or both, are explicitly
specified in 11 (20.8%) of the 53 sample designs. Put differently, close to 80% of the designs
do not specify explicitly what populations were sampled and studied. Among the 80%, some
give information that can be used to infer what might have been the populations of interest, if
any. For example, in the method section of an article, a statement like "In six large Connecticut
secondary public schools, 4 departments of equal size (6 to 15 teachers) were randomly selected
..." (Freeston, 1987, p. 50) could be considered as an implicit specification of the survey
10
population, namely, all the departments in the six schools in this example. Based on this type of
analysis, it was possible to identify or reconstruct the populations for 37 (69.9%) of the 53
sample designs. Most of such implicit populations were survey populations only. Discussion of
population validity is practically not present in any explanations of the sample designs.
Decisions on what sample size should be used are mentioned in only two sample design
descriptions. One is based on the computation of prespecified margin of error, the other may have
come from a statistical table for sample size selection. In about 21 designs, there is no way to
figure out what the planned sample sizes were since only the obtained sample sizes were
mentioned. Also, stratified selection is reported in several designs, however, no mention is given
about how a planned sample size was allocated to the strata.
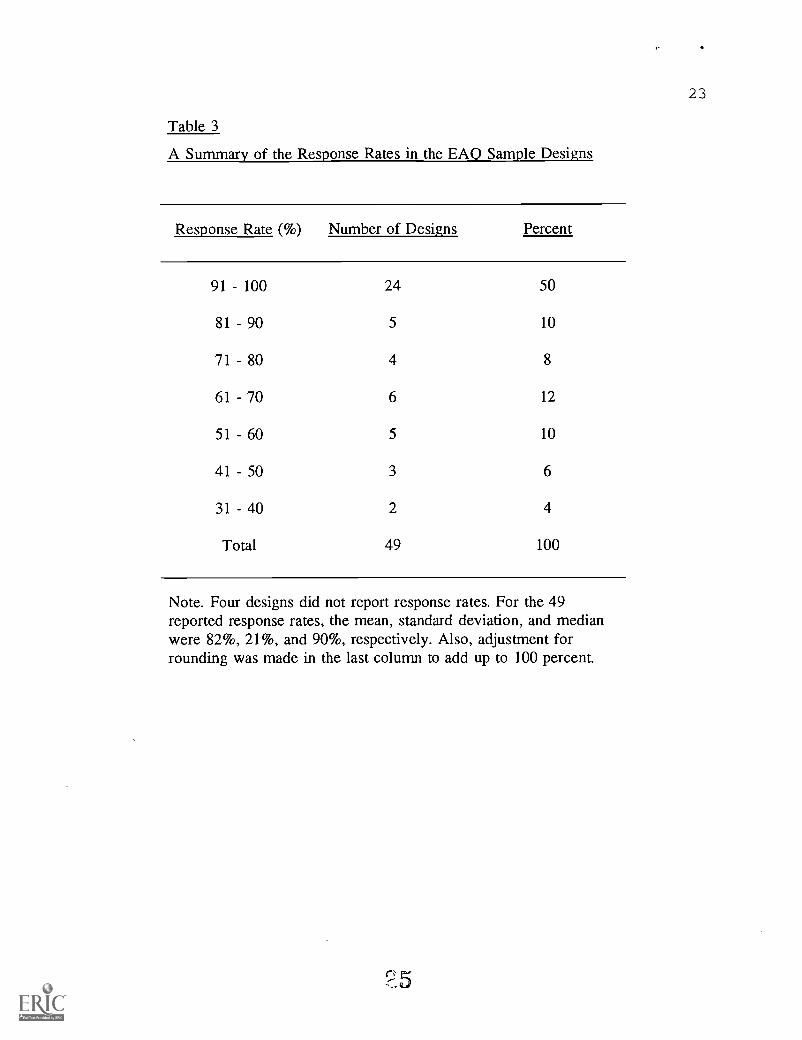
Response rates are reported in 42 designs. A few designs did not specify the response
rates, however, the sample sizes used in analysis suggested that perfect return rates were
achieved. Therefore, the response rates are known for 49 designs, ranging from 34% to 100%,
with a mean of 82% and a median of 90%. A breakdown of the reported response rates is
summarized in Table 3. Information is not available in the designs with low response rates about
whether any follow-ups were used to improve the response rates, or whether the researchers did
anything to find out the nature of nonrespondence.
The descriptions of selection procedures in the 53 sample designs were evaluated with
regard to how much information was provided about the selection procedures. About 10 designs
appear to present good descriptions of selection procedures. These designs include both simple
and complicated selection procedures. Typically, these designs describe what populations were
defined; how many strata, where applicable, were formed and on what variables; what sampling
units were selected at each level in a complex sample; how large the final sample sizes were;
what were the response rates for the overall samples and subgroups; and what were the
characteristics of the sample composition.
In comparison, the rest of the designs provide limited information about selection
procedures. It is difficult to learn how a sample was actually selected in research. Worse still,
a few sample designs give no information about their selection procedures. For example, in one
study, it is only stated that "We have collected data from respondents in schools, higher
education, government, and the private sector. In this article, we report results from two samples:

11
(a) American school and administrators that included 50 principals from Broward County and 90
school administrators (principals and central office administrators) from Beaverton, Oregon and
(b) 274 school administrators (almost all of them principals) from Singapore" (Bolman & Deal,
1992, p. 320). Given the description, the only thing readers can know about the sample design
is the final sample sizes. There is no indication about population definition, about whether
probability or nonprobability method was used, or about what criteria were used to exclude or
include a principal or administrator in the samples.
Insert Table 3 about here
Estimation procedures
The estimation procedures in the 53 sample designs were evaluated to look at how
unequal selection probability problems were handled, whether adjustments were made in variance
estimation for complex survey samples, and whether confidence intervals were used in estimation.
Although a number of sample designs must have involved unequal selection probabilities,
whether that was planned or due to nonresponse, no discussion is found about how this problem
was handled in estimation. Typically, one would expect some weighting procedure in this
situation. It seems that all the estimation was done with the implicit uniform weight of 1/n.
Discussion of variance estimation in complex sampling is abundant in sampling literature
but rare in educational research literature. This is also reflected in the sample designs evaluated
in this study. Complex survey samples are probability samples that are not selected with a simple
random selection scheme. About 12 of the 29 one-stage sample designs and all those two- and
three-stage designs are not simple random ones. Some two- and three-stage designs involve
nonprobability selections and are not considered. In the rest of the complex samples, no
discussion is found about how the variances or standard errors were computed. Very likely, these
statistics were computed using some statistical software where computation of statistics is based
on standard formulas for data from simple random samples. Consequently, where complex sample
designs were used in research, the estimation of variances was carried out without any
adjustments. Finally, in almost all the cases, no confidence intervals are discussed. Only point
12
estimates, means or regression coefficients, etc., are presented and elaborated on in the analysis.
Other aspects of data analysis
Since survey research findings are also influenced by data analysis procedures other than
variance estimation, a few major possible factors were examined in this evaluation of the 53
sample designs. These factors include adjustments for error rates for multiple statistical tests, use
of inferential statistics with nonprobability data, and measures taken to compensate for possible
nonresponse bias.
Many correlation analyses are reported in the 50 survey articles. One common practice
in correlation analysis is to attach statistical significance values to a large number of correlation
or regression coefficients without making any adjustments. Attaching an alpha level to a
correlation coefficient implies that this coefficient is or is not statistically significant at the alpha
level. The coefficient can be small or trivial but is still statistically significant. Also, testing a
large number of coefficients using the same data inflates the actual alpha level to an astronomical
value. Where such multiple tests were found, no adjustments of the alpha level were used for
protection, nor was any discussion given about how to assess the usefulness of these coefficients.
Nonprobability samples constitute a large portion of the 53 sample designs. In the 29 one-
stage samples, over one third (about 38%) were nonprobability samples. About 81% of the two-
stage samples had nonprobability selections at one stage. It is found that various inferential
statistical procedures, simple or complex, were employed to analyze such nonprobability data,
with probability statements attached to the sample statistics. Little if any discussion is given
about the implications for the interpretation and generalization of the findings from applying
statistical procedures to the nonprobability data.
Finally, discussion of nonresponse effects on research findings was missing in practically
all the designs with low response rates. If we go by the rule-of-thumb that 80 percent return rate
is acceptable, then a nonresponse rate above 20 percent is considered a problem. Over one third
of the 53 designs have nonresponse rates above 20%, with five of them over 50%, but few
researchers have put this problem in perspective in discussing the results from their data analyses.
Discussion
Implications from the typology of sample designs

13
The three typology models derived from the 53 EAQ sample designs show that one-stage
and two-stage models are frequently used in practice. The one-stage model consists of over half
of the sample selections in the 53 designs. This indicates that researchers tend to use relatively
simple designs for sample selection. In the two-stage model, three patterns of selection methods
have emerged. First, more nonprobability selections are seen at the first stage than at the second,
the opposite is true of the probability selection. Second, among the nonprobability selections at
stage-one, both criterion-based and voluntary samples are used more than the other methods. At
stage-two, however, only three nonprobability samples are found. Third, simple random selection
has been applied more frequently at the second stage of sampling. It seems that a typical two-
stage sample design would use some nonprobability method at the first stage selection, followed
by a simple random selection at the second stage.
Such a selection model may work well in educational research in that educational surveys,
especially those for organizational study, tend to collect data at two levels, organization (district,
school, classroom) and individuals (principals, teachers, students). The distribution of the
sampling units for the two-stage models shows that over two thirds of the first-stage sampling
units are schools. Districts take up about one quarter of all the first-stage sampling units. At the
second stage, however, two thirds are individuals, with teachers alone accounting for over half
of the sampling units.
The frequent use of nonprobability samples in the 53 designs gives mixed implications.
On the one hand, there is plenty of reason to worry about the representativeness of the samples
since close to half of them are nonprobability samples, either completely nonprobability samples
or partially nonprobability samples as in some two-stage models. On the other hand, over half
of the nonprobability samples were selected using some types of criteria, this indicates that the
researchers seem to have paid attention to what alternative samples to use where probability
samples were not available. The researchers defined some criteria sample selection that would
yield information usable for the purposes of their research.
Sample design quality and need for improvement
Population of study should be clearly specified when reporting findings from a research
study. This is not only a basic requirement of survey research but is also necessary and important
for the intended audience. About 80% of the sample designs evaluated in this study fail to specify
BEST COPY AVAALABLE
14
the populations involved. Consequently, for these studies, it is not sure what populations the
researchers had in mind and how they were going to use the findings. Since researchers seldom
study a sample for the sample per se and they always hope to project the sample findings to a
larger group, i.e., a population, it is not clear what populations the findings associated with the
80% sample designs could have been generalized to. Despite the absence of population
specifications in those sample designs, little discussion is found about how well the findings can
be generalized or what are the limitations of the findings in terms of generalizability.
Population validity in survey research determine to what extent a survey population
represents its target population. This match has to be judged from the information about the two
populations in a sample design. The available evidence from the 53 sample designs indicates that
hardly any attention has been given to the issue of population validity, just as population itself
was ignored in many cases. Instead, sample characteristics are discussed in some designs with
the implication that the samples were representative of their populations on some demographic
variables. This is, however, an issue of whether a sample is representative of a population, not
an issue of population validity.
In terms of sample size decisions, response rate problems, and descriptions of sampling
procedures, much improvement is needed. The quality of a sample design is judged at every step,
not the obtained sample size alone. Lack of information about sample size decisions in the 53
sample designs makes it hard to' tell whether a planned sample size is theoretically reasonable
and how well the obtained sample size would do, compared with the planned sample size.
Researchers can try different techniques to improve response rates and this is a very important
and effective way to ensure the sample quality in a survey study. Several researchers have
suggested that, with some efforts and innovativeness, response rates can be raised to 80% or
higher in many survey situations (Dillman, 1978; Sudman, 1976). Finally, clear descriptions of
sampling procedures are found in about 10 designs only. The remaining designs provide either
sketchy or no information at all. It is very difficult to evaluate such a study, let alone to replicate
it. Compared with the theoretical framework and discussions in an article, it is evident that
method discussions, particularly sample selection procedures, are not given due attention in these
EAQ articles.
In short, the general quality of the selection procedures in the 53 EAQ sample designs is
15
compromised by the problems such as unspecified populations, insufficient information about the
sample selection procedures, and untouched nonresponse problems. The purpose of publishing
the findings of a good study is to share the findings and the methodology with all the researchers
in the field. Accordingly, the EAQ editors should require their contributors to provide sufficient
information about the sample selection procedures if a sample survey is used in a study. If
journal space limits a complete disclosure of such information in an article, efforts should be
made to ensure that essential points (population, planned sample size, response rate, unit of
analysis, and selection strategies) be specified in the method section, and that provisions for
obtaining more detailed information from authors be made available to EAQ readers who plan
to evaluate or replicate a study.
Quality of data analysis and need for improvement
In estimation procedures, the unequal selection probability and the complex sampling
schemes found in the 53 designs require some adjustments in estimation, typically weighting and
complex variance estimation. Such adjustments are not documented in the EAQ articles and, very
likely, they were not performed. Possible consequences of not doing such adjustments include
estimation bias and incorrect variance estimation. For instance, variance may have been
underestimated for the cluster samples and yielded false positive findings, such as some
statistically significant findings that do not exist. Therefore, the subsequent analyses based on
such estimation results may also have been inappropriate.
The complex designs identified in the 53 sample designs are not, in fact, that complicated
and it would not have been too difficult for the researchers to keep track of such information as
cluster sizes in the populations and the samples, and the corresponding selection probabilities.
Given this information, formulas for such analysis are available in basic sampling textbooks and
can be applied without much difficulty. Even in situations where little information is available
about the actual population and sample structures, some approximations can be resorted to in
evaluation of the complex design effects on analysis results, particularly the variance estimation.
One way might be to use jackknife technique to assess empirical standard errors of the means.
or other statistics, for the variables of interest (Efron & Gong, 1990; Lee et al., 1989: Mooney
& Duval, 1993).
As far as other data analysis procedures are concerned, some typical problems found in
16
the EAQ articles include use of inferential statistics for nonprobability samples, unadjusted error
rates, and unspecified scope of generalizations. First, although researchers may use inferential
statistics to explore nonprobability data, they need to be aware, and to remind readers, that
nonprobability data is used. Interpretation and generalization of the findings have to take this fact
into consideration. It undermines the quality of research findings if one uses a nonprobability
sample and goes on in analysis and interpretation as if a probability sample were used. Second,
where multiple statistical tests are performed on the same data, adjustments for the inflated error
rates should be made and reported. Third, the scope of the generalization of findings should be
explicitly stated, and should be in agreement with the population from which the sample is taken.
The quality of the research findings in the EAQ articles has probably been affected by
the problems mentioned above. A suggestion to the EAQ editors and reviewers is the need to
realize the consequences of incorrect estimation and other data analysis procedures in survey
analysis and, more important, to take steps to improve the review process in this area. Moreover,
it is reasonable for the editors and reviewers to ask contributors to describe accurately their
estimation methods wherever complex deigns are involved. The editors should also encourage
reporting analysis results such as effect sizes or confidence intervals, and making it clear that
hypothesis testing is not the only means of statistical analysis.
Making necessary adjustments for nonresponse effect
Since the nonresponse bias problem is a grave concern in survey research, this problem
should never be taken lightly, either in sample selection or in estimation and data analysis.
Although the response rates across the 53 designs are good, the response rates are low in several
cases. No evidence shows that the consequences of nonresponse effect have been investigated.
Therefore, these EAQ studies with the low response rates are open to questions and challenge,
because no one knows how much the nonresponse may have affected the results. It is not enough
to report the response rates only; it is necessary to investigate whether nonresponse effects are
present, and what differences exist between the respondents and nonrespondents. In those studies
with low response rates, weighting adjustments are needed to compensate for nonresponse. Also,
possible nonresponse effects may be investigated by doing a pseudo-nonrespondent analysis. The
information from the respondents who responded only after some follow-up efforts can be used
as a proxy for nonrespondents. Their responses can then be compared with those from the earlier
3
17
respondents to see if there is any systematic difference.
Finally, it is necessary to talk about the limitations of this study and suggestions for future
research. First, as is noted, this study focuses on the research that involved independent sample
design process. Secondary data analysis is not included. It would be of interest to investigate how
secondary analysis of survey data is analyzed and reported. There are many public survey
databases available for educational researchers to use. Such data is usually collected with some
complex design; adjustments such as weighting and design effect consideration are expected in
analysis. Second, the data for this study is from the EAQ journal articles only. A new study may
cover more journals and sample articles from each. This will give a panoramic view of the
sample design practice in educational research as a whole.
18
Reference
Aiken, L. R. (1988). The problem of nonresponse in survey research. Journal of
Experimental Education, 56(3), 116-119.
Armstrong, J. S. (1975). Monetary incentives in mail surveys. The Public Opinion
Quarterly, 39, 111-116.
Babbie, E. (1986). The practice of social research (4th ed.). Belmont, CA: Wadsworth.
Babbie, E. (1990). Survey research methods (2nd ed.). Belmont, CA: Wadsworth.
Bailey, K. D. (1994). Typologies and taxonomies: An introduction to classification
techniques. Thousand Oaks, CA: Sage.
Barnett, V. (1991). Sample survey principles and methods. New York: Oxford University
Press.
Bolman, L. G., & Deal, T. E. (1992). Leading and managing: Effects of context, culture,
and gender. Educational Administration Quarterly, 28(3), 314-329.
Borg, W. R., Gall, M. D. (1989). Educational research (5th ed.). New York: Longman.
de Leeuw, E. D. (1992). Data quality in mail, telephone and face to face surveys.
Amsterdam, Netherlands: Netherlands Organization for Scientific Research. (ERIC Document
Reproduction Service No. ED 374 136)
Deming, W. E. (1960). Sample design in business research. New York: John Wiley &
Sons.
Dillman, D. A. (1978). Mail and telephone surveys: The total design method. New York:
Wiley.
Dillman, D. A. (1991). The design and administration of mail surveys. Annual Review
of Sociology, 17, 225-249.
Efron, B., & Gong, G. (1990). A leisurely look at the bootstrap, the jackknife, and cross-
validation. The American Statistician, 37(1), 36-48.
Ferber, R, Sheatsley, P., Turner, A., & Waksberg, J. (1980) What is a survey?
Washington, DC: American Statistical Association.
Freeston, K. R. (1987). Leader substitutes in educational organizations. Educational
Administration Quarterly, 23(2), 45-59.
Gay, L. R. (1996). Educational research (5th ed.). Englewood Cliffs, NJ: Prentice Hall.
19
Hedayat, A. S., & Sinha, B. K. (1991). Design and inference in finite population
sampling. New York: Wiley.
Jaeger, R. M. (1988). Survey research methods in education. In R. M. Jaeger (Ed.),
Complementary methods for research in education (pp. 303-330). Washington, DC: American
Educational Research Association.
Johnson, E. G. (1992). The design of the National Assessment of Educational Progress.
Journal of Educational Measurement, 29(2), 95-110.
Jolliffe, F. R. (1986). Survey design and analysis. New York: John Wiley & Sons.
Kalton, G. (1983). Introduction to survey sampling. Beverly Hills, CA: Sage.
Kish, L. (1965). Survey sampling. New York: John Wiley & Sons.
Lee, E. S., Forthofer, R. N., & Lorimor, R. J. (1989). Analyzing complex survey data.
Newbury Park, CA: Sage.
Lin, I., & Schaeffer, N. C. (1995). Using survey participants to estimate the impact of
nonparticipation. The Public Opinion Quarterly, 59(2), 236-258.
McNamara, J. F. (1994). Surveys and experiments in education research. Lancaster, PA:
Technomic.
Miskel, C. & Sand lin, T. (1981). Survey research in educational administration.
Educational Administration Quarterly, 17(4), 1-20.
Mooney, C. Z., & Duval, R. D. (1993). Bootstrapping: A nonparametric approach to
statistical inference. Newberry Park, CA: Sage.
Pena, D. M. & Henderson, R. D. (1986). Sampling procedures used for national surveys
of public school teachers -- problems and possible solutions. Paper presented at the annual
meeting of the American Educational Research Association, San Francisco, CA.
Permut, J. E., Michel, A. J., & Joseph, M. (1976). The researcher's sample: A review of
the choice of respondents in marketing research. Journal of Marketing Research, 13, 278-283.
Pounder, D. G., Ogawa, R. T., & Adams, E. A. (1995). Leadership as an organization-
wide phenomena: Its impact on school performance. Educational Administration Quarterly, 31
Pro Quest File. (1995). Dissertation Abstracts: January 1993-June 1995 [CD-ROM].
Scheaffer, R. L., Mendenhall, W., & Ott, L. (1990). Elementary survey sampling (4th ed.).
Boston, MA: PWS-Kent.
20
Shultz, S. D., & Luloff, A. E. (1990). The threat of nonresponse bias to survey research.
Journal of the Community Development Society,. 21(2), 104-115.
Sudman, S. (1976). Applied sampling. New York: Academic Press.
Yates, Frank (1960). Sampling methods for censuses and surveys (3rd ed.). London:
Charles Griffin & Company.
Zanutto, E. L. (1993). Jackknife variance estimation under imputation for missing survey
data [CD-ROM]. Abstract from: Pro Quest File: Dissertation Abstracts Item: MM84169.
21
Table 1
Distribution of the 53 Sample Designs in the Population
Publication Information Sample Design
Year Volume Issues Frequency Percent
1980 16 3 5 9.4
1981 17 4 5 9.4
1982 18 4 4 7.5
1983 19 4 7 13.3
1984 20 4 1 1.9
1985 21 4 1 1.9
1986 22 4 5 9.4
1987 23 4 2 3.8
1988 24 4 2 3.8
1989 25 4 5 9.4
1990 26 4 5 9.4
1991 27 4 3 5.7
1992 28 4 2 3.8
1993 29 4 4 7.5
1994 30 4 0 0
1995 31 4 2 3.8
Total 63 53 100
22
Table 2
Distribution of the Selections in the Three Models
Selection Stage
First Second Third
Selection A B C B C C All Percent
Nonprobability
Criterion-based 9 7 2 2 1 21 26.2
Voluntary 1 6 7 8.8
Convenience 1 2 1 2 6 7.5
Probability
Simple random 5 13 1 2 21 26.2
Systematic 2 1 3 3.7
Stratified 10 4 1 15 18.8
Cluster 1 2 4 7 8.8
Total 29 21 3 21 3 3 80 100.0
Note. A, B, and C stand for one-stage, two-stage, three -stage models, respectively.
23
Table 3
A Summary of the Response Rates in the EAQ Sample Designs
Response Rate (%) Number of Designs Percent
91 100 24 50
81 -90 5 10
71 80 4 8
61 70 6 12
51 - 60 5 10
41 - 50 3 6
31 - 40 2 4
Total 49 100
Note. Four designs did not report response rates. For the 49reported response rates, the mean, standard deviation, and medianwere 82%, 21%, and 90%, respectively. Also, adjustment forrounding was made in the last column to add up to 100 percent.
5
I.
U.S. DEPARTMENT OF EDUCATIONOffice of Educational Research and improvement (OEM)
Educational Resources Information Center (ERIC)
REPRODUCTION RELEASE(Specific Document)
IDENTIFICATION:
ERIC'
Title: HIV t;vALlitierrioal OF -7116 SAMPLE DE516.Als (AI g9wc,q7ionmit...
9,t-Rvey Rece-Apc,0Author(s): JAMES F_ McAlAncw;Corporate Source:
ACT ; 6-xvs (4A1(VERSITy
Publication Date:
17II. REPRODUCTION RELEASE:
In order to disseminate as widely as possible timely and significant materials of interest to the educational community, documentsannounced in the monthly abstract journal of the ERIC system, Resources in Education (RIE), are usually made available to usersin microfiche. reproduced paper copy. and electronic/optical media. and sold through the ERIC Document Reproduction Service(EDRS) or other ERIC vendors. Credit is given to the source of each document, and, if reproduction release is granted. one ofthe following notices is affixed to the document.
If permission is granted to reproduce.the identified document, please CHECK ONE of the following options and sign the releasebelow.
z 01 Sample sticker to be affixed to document Sample sticker to be affixed to document 111.
Check herePermittingmicrofiche(4"x 6" film).paper copy,electronic.and optical mediareproduction
"PERMISSION TO REPRODUCE THISMATERIAL HAS BEEN GRANTED BY
TO THE EDUCATIONAL RESOURCESINFORMATION CENTER (ERIC):'
1.111/01 1
"PERMISSION TO REPRODUCE THISMATERIAL IN OTHER THAN PAPER
COPY HAS BEEN GRANTED BY
cAVS
TO THE EDUCATIONAL RESOURCESINFORMATION CENTER (ERIC)."
Level 2
1/2
or here
Permittingreproductionin other thanpaper copy.
Sign Here, PleaseDocuments will be processed as indicated provided reproduction quality permits. If permission to reproduce is granted, but
neither box is checked, documents will be processed at Level 1.
"I hereby grant to the Educational Resources Information Center (ERIC) nonexclusive permission to reproduce this document asindicated above. Reproduction from the ERIC microfiche or electronic/optical media by persons other than ERIC employees and itssystem contractors requires permission from the copyright holder. Exception is made for non-profit reproduction by libraries and otherservice agencies to satisfy information needs of educators in response to discrete inquiries:*
Signature: Position:
i'brZ.._
Printed Name:Z.11.1 1JA-- CT
Organization: AAC(, Itic__Address: Ac -r ce,4-.),- f. 64cCA.A1 ek Cle42_
ACT) 1%c-2_ s- c Nc-rtk DE4.121,V._ itt)A-xt_
2,---14 ek. C.-il, , i A s21q-3--0168
Telephone Number:(31, ) 337- (9'0
.6
Date:
_ - 0 I /7- /,' 2OVER