Papageorgiou SN, Papadopoulos MA, Athanasiou AE. Assessing small study effects and publication bias...
20
REVIEW Assessing small study effects and publication bias in orthodontic meta-analyses: a meta-epidemiological study Spyridon N. Papageorgiou & Moschos A. Papadopoulos & Athanasios E. Athanasiou Received: 5 July 2013 /Accepted: 20 January 2014 # Springer-Verlag Berlin Heidelberg 2014 Abstract Objective The aim of this study was to examine the presence and extent of small study effects and publication bias in meta- analyses (MAs) based on orthodontic studies. Materials and methods Following an extensive literature search, 25 MAs including 313 studies were identified and were possible to be re-analyzed. For the assessment of publi- cation bias, contour-enhanced funnel plots were examined and their symmetry was tested using the Begg and Mazumdar rank correlation and Egger’ s linear regression tests. Robustness of MAs’ results to publication bias was examined by Rosenthal’ s failsafe N, and adjusted effect sizes were calculated after consideration of publication bias using Duval and Tweedie’ s “trim and fill” procedure. Results Only few of the originally published MAs assessed the existence and effect of publication bias and some only partially. Inspection of the funnel plots indicated possible asymmetry, which was confirmed by Begg and Mazumdar’ s test in 12 % and by Egger ’ s test in 28 % of the MAs. According to Rosenthal’ s criterion, 62 % of the MAs were robust, while adjusted effect estimates with unpublished stud- ies differed from little to great from the unadjusted ones. Pooling of Egger’ s intercepts of included MAs indicated that evidence of asymmetry was found in the orthodontic litera- ture, which was accentuated in medical journals and in diag- nostic MAs. Conclusions Small study effects and publication bias can often distort results of MAs. Since indications of publication bias in orthodontics were found, the influence of small trials on estimated treatment effects should be routinely and more carefully assessed by authors conducting MAs. Keywords Orthodontics . Meta-epidemiological study . Meta-analysis . Publication bias . File-drawer problem . Funnel plot Introduction Publication bias (also known as the “file-drawer problem”) has been identified in many fields of dental research [1, 2], including orthodontics [3], and can be considered as one of the major drawbacks of meta-analyses (MAs) compromising their validity. Analysis of five orthodontic journals indicated that studies with significant results were more likely to be accepted for publication [3]. This trend was also observed for other dental specialties [2] and was independent of the journal’ s impact factor. Scholey [4] reported in his thesis that less than half of the abstracts presented at leading dental conferences proceeded to full publication. According to empirical evi- dence [5], this may indicate that non-significant study results do not reach publication and could be interpreted as a possible indication of publication bias. The validity of systematic reviews and MAs is dependent on the methodological quality and unbiased dissemination of the included trials. Small trials tend to report greater treatment benefits than larger trials [6, 7]. Such “small study effects,” as they are termed, can result from a combination of lower methodological quality of small trials and reporting biases (including publication bias) [7–9]. If however small trials have implemented more careful patient selection and intervention procedures, they could reflect the actual clinical heterogeneity [10]. This phenomenon can be observed on funnel plots. Electronic supplementary material The online version of this article (doi:10.1007/s00784-014-1196-3) contains supplementary material, which is available to authorized users. M. A. Papadopoulos (*) Aristotle University of Thessaloniki, Thessaloniki, Greece e-mail: [email protected] S. N. Papageorgiou University of Bonn, Bonn, Germany e-mail: [email protected] A. E. Athanasiou Dubai School of Dental Medicine, Dubai, United Arab Emirates Clin Oral Invest DOI 10.1007/s00784-014-1196-3
Transcript of Papageorgiou SN, Papadopoulos MA, Athanasiou AE. Assessing small study effects and publication bias...
REVIEW
Assessing small study effects and publication bias in orthodonticmeta-analyses: a meta-epidemiological study
Spyridon N. Papageorgiou & Moschos A. Papadopoulos &Athanasios E. Athanasiou
Received: 5 July 2013 /Accepted: 20 January 2014# Springer-Verlag Berlin Heidelberg 2014
AbstractObjective The aim of this study was to examine the presenceand extent of small study effects and publication bias in meta-analyses (MAs) based on orthodontic studies.Materials and methods Following an extensive literaturesearch, 25 MAs including 313 studies were identified andwere possible to be re-analyzed. For the assessment of publi-cation bias, contour-enhanced funnel plots were examined andtheir symmetry was tested using the Begg andMazumdar rankcorrelation and Egger’s linear regression tests. Robustness ofMAs’ results to publication bias was examined by Rosenthal’sfailsafe N, and adjusted effect sizes were calculated afterconsideration of publication bias using Duval and Tweedie’s“trim and fill” procedure.Results Only few of the originally published MAs assessedthe existence and effect of publication bias and some onlypartially. Inspection of the funnel plots indicated possibleasymmetry, which was confirmed by Begg and Mazumdar’stest in 12 % and by Egger’s test in 28 % of the MAs.According to Rosenthal’s criterion, 62 % of the MAs wererobust, while adjusted effect estimates with unpublished stud-ies differed from little to great from the unadjusted ones.Pooling of Egger’s intercepts of included MAs indicated thatevidence of asymmetry was found in the orthodontic litera-ture, which was accentuated in medical journals and in diag-nostic MAs.
Conclusions Small study effects and publication bias canoften distort results of MAs. Since indications of publicationbias in orthodontics were found, the influence of small trialson estimated treatment effects should be routinely and morecarefully assessed by authors conducting MAs.
Keywords Orthodontics . Meta-epidemiological study .
Meta-analysis . Publication bias . File-drawer problem .
Funnel plot
Introduction
Publication bias (also known as the “file-drawer problem”)has been identified in many fields of dental research [1, 2],including orthodontics [3], and can be considered as one of themajor drawbacks of meta-analyses (MAs) compromising theirvalidity. Analysis of five orthodontic journals indicated thatstudies with significant results were more likely to be acceptedfor publication [3]. This trend was also observed for otherdental specialties [2] and was independent of the journal’simpact factor. Scholey [4] reported in his thesis that less thanhalf of the abstracts presented at leading dental conferencesproceeded to full publication. According to empirical evi-dence [5], this may indicate that non-significant study resultsdo not reach publication and could be interpreted as a possibleindication of publication bias.
The validity of systematic reviews and MAs is dependenton the methodological quality and unbiased dissemination ofthe included trials. Small trials tend to report greater treatmentbenefits than larger trials [6, 7]. Such “small study effects,” asthey are termed, can result from a combination of lowermethodological quality of small trials and reporting biases(including publication bias) [7–9]. If however small trials haveimplemented more careful patient selection and interventionprocedures, they could reflect the actual clinical heterogeneity[10]. This phenomenon can be observed on funnel plots.
Electronic supplementary material The online version of this article(doi:10.1007/s00784-014-1196-3) contains supplementary material,which is available to authorized users.
M. A. Papadopoulos (*)Aristotle University of Thessaloniki, Thessaloniki, Greecee-mail: [email protected]
S. N. PapageorgiouUniversity of Bonn, Bonn, Germanye-mail: [email protected]
A. E. AthanasiouDubai School of Dental Medicine, Dubai, United Arab Emirates
Clin Oral InvestDOI 10.1007/s00784-014-1196-3
Although publication bias is often regarded as the main reasonfor small study effects [5, 11], other factors may also exist [12],such as selective outcome reporting [11], a mathematical arti-fact due to discordant trial sizes [12], or a random error [13, 14].
The most commonly used methods to evaluate funnel plotasymmetry and the possible existence of small study effects orpublication bias are the funnel plot [15], Begg andMazumdar’s rank correlation method [16], and Egger’s linearregression method [10]. The failsafe N [5] and Duval andTweedie’s “trim and fill” method [17] are commonly used tocheck the robustness of the results of meta-analyses to thepossible existence of publication bias. Each method is shortlydiscussed along with its drawbacks.
Funnel plot
The funnel plot is the most common assessment method forthe existence of publication bias in a MA [15]. It plots ameasure of study size on the vertical axis as a function ofeffect size on the horizontal axis. The standard error (SE) iscommonly used as a vertical axis, and thus, it was used also inthis evaluation. Large/precise studies appear at the top of thegraph and tend to cluster near the mean effect size. Smaller/less precise studies appear towards the bottom of the graphand tend to be dispersed across a range of values [18]. Takinginto consideration that—when publication bias is absent—thestudies are expected to be symmetrically distributed about thepooled effect size, visual inspection of a funnel plot may bepossibly an indication of publication bias. In the presence ofbias, the plot’s lower part can be expected to show a higherstudy concentration on one side of the plot than the other. Thisis due to the fact that smaller studies (towards the bottom ofthe plot) are more likely to be published if they have relativelylarge effects, making themmore likely tomeet the criterion forstatistical significance [18]. According to Peters et al. [19] andPalmer et al. [20], under the assumption that effect sizes ofindividual studies are normally distributed, significance of anypoint of the funnel plot can be derived directly from effectsizes and the corresponding SEs with Wald tests. Funnel plotscan be enhanced with contours dividing the plot into areas ofsignificance with a two-sided P≤0.05 or a two-sided P≤0.01and areas of non-significance with a P>0.05 [19, 20]. If trialsseem to be missing in areas of non-significance, this adds tothe notion of the presence of publication bias [19, 21]. Thecontours displayed on funnel plots indicate levels of statisticalsignificance for the primary studies in the MA and are inde-pendent of the pooled estimate, and thus, they are unaffectedby a biased pooled estimate [19].
Regarding its drawbacks, funnel plot asymmetry is notnecessarily due to bias, funnel plots are non-informative aboutthe type of bias, and interpretation of the plot is difficult(especially with less studies).
Begg and Mazumdar’s rank correlation method
The Begg and Mazumdar’s rank correlation test [16] is basedon the assumptions that (a) studies with larger sample sizes arepublished more often and (b) studies with an equal sample sizeare published less often when the effect size is smaller. There-fore, in the case of publication bias, a negative correlation canbe expected to exist between the standardized effect size andthe SEs of these effects. This correlation is tested with a two-tailed P value and Kendall’s tau. A significant result indicatespossible publication bias. Here, it should be mentioned thatKendall’s tau is not to be confused with τ2, which is a measureof between-study heterogeneity.
Regarding its drawbacks, the test investigates only funnelplot asymmetry (not publication bias directly), while its poweris low (especially with few studies or not severe bias) andgenerally less than Egger’s method.
Egger’s linear regression method
Egger’s test of the intercept [10] is the second of the regressionmethods to detect publication and other biases in MA and isintended to quantify the bias captured by the funnel plot. In thistest the standard normal deviate is regressed on precision, whichis the inverse of the SE [18]. The intercept in this regressioncorresponds to the slope in a weighted regression fitted valueline of the effect size on the SE. The test looks for a straight-linerelationship between intervention effect and its SE. When nosmall study effects are present, this line could be expected to bevertical. The greater the association between intervention effectand SE, themore the slopewouldmove away from vertical [22].The power of this test is generally higher than the power of therank correlation method, but still low, unless there is severe biasor a substantial number of studies [7].
Regarding its drawbacks, the test investigates only funnelplot asymmetry (not publication bias directly) and its power islow (especially with few studies or not severe bias).
Failsafe N or “file-drawer number”
As stated before, studies with statistically significant resultsare more likely to be published than those with non-significantresults, while non-significant results may not be published atall (the file-drawer problem) [5, 17]. Thus, the publishedliterature might not be representative, and conclusions drawnfrom MAs not dealing with this issue are likely to be biased.The question that this approach attempts to answer is: “Givena significant result for an overall test of significance in a MA,how many additional null studies would it take to reduce it tonon-significance?” Rosenthal suggested an ad hoc rule ofthumb that raises concern, if the failsafe N<5k+10, with kbeing the number of included studies in the analysis.
Clin Oral Invest
Regarding its drawbacks, the failsafeN emphasizes only onstatistical and not on biological significance and the samplesize of the studies is not integrated in the assessment.
Duval and Tweedie’s trim and fill method
If a MA has included all relevant studies, the funnel plot canbe expected to be symmetric and dispersed equally on eitherside of the mean effect [18]. In contrast, asymmetric funnelplots could be indicative of the existence of publication bias.Duval and Tweedie [17] developed a method of imputingmissing studies, based on the assumptions that funnel plotasymmetry is due only to publication bias and that in itsabsence the studies should be equally distributed on both sidesof the mean effect size. This procedure, usually called theDuval and Tweedie trim and fill procedure, yields an estimateof the effect size after the publication bias has been taken intoaccount (adjusted effect size) and also indicates how manystudies were imputed to correct for publication bias. Thus, thisapproach can be regarded as a sensitivity analysis to publica-tion bias in some way.
Regarding its drawbacks, the trim and fill method relies on anumber of assumptions, which are not necessarily always true.
A recent methodological assessment of MAs in the field oforthodontics [23] indicated that a very few of them formallytook publication bias into account, while the small studyeffects have never been assessed in any field of dentistry sofar. Therefore, the aim of this study was to use that cohort ofpreviously identifiedMAs to assess the presence and extent offunnel plot asymmetry and small study effects, as well as therobustness of the MAs to publication bias.
Material and methods
Selection of MAs and corresponding trials
A comprehensive search of the literature for MAs investigat-ing subjects related to orthodontics has been described previ-ously [23]. This database was augmented by manual searchesof MEDLINE via PubMed and Google Scholar up to thesecond week of March 2012 in order to keep it up to date.No restrictions were applied concerning language, publicationdate, or publication status. MAs were eligible for inclusion ifthey reported data for any group compared with placebo,sham, or other control group from any studies (both random-ized and non-randomized). One such MA could also includesubgroup analyses, sensitivity analyses, or meta-regressionsbut was still counted as one, by including the primary analysis.In case of subgroups being pooled, the pooled analysis wasincluded. If they were not pooled, the subgroup with the moststudies was included. A certain type of MAs of genetic asso-ciation (i.e., related to “genetic linkage”MAs) were excluded,
as they implemented non-conventional methodology andcould not be assessed with the same means. In addition,MAs of single estimates (like mean values or event rates ofone group) were excluded in order to evaluate only compar-ative MAs. From each paper, only one MA synthesis wasincluded, in order to deal with study overlap and data corre-lation, choosing the largest or, in case of equal numbers ofstudies, the one with less heterogeneity. The reports of allstudies from the included MAs were obtained and the corre-sponding original data was re-analyzed. When study data wasnot provided by the paper, and retrieval attempts failed, com-munication of MAs’/trials’ authors was attempted. Althoughno firm guidelines exist, and previous research has includedMAs with a minimum of 5 [10], 8 [24], or 10 studies [25], aminimum of 7 included studies per MA was arbitrarilydeemed as adequate for the assessment of funnel plot asym-metry, due to small number of eligible MAs.
Data synthesis
Calculations of the pooled effect sizes and assessments ofpublication bias were performed with the statistical software“Comprehensive Meta-analysis” version 2.2.021 (www.metaanalysis.com). All analyses were conducted using thereported effect size metrics and fixed-effect (Mantel andHaenszel method) or random-effects model (DerSimonianand Laird method), depending on the original paper. Thesize and impact of the between-study heterogeneity weremeasured by the between-study variance estimate (“tau-squared,” τ2) and I2, respectively. The I2 statistic describesthe variability in the reported effect estimates that originatesonly from heterogeneity and not from chance; 95 % confi-dence intervals (CIs) for I2 were calculated according to thenon-central χ2 approximation ofQ. Reporting focused mainlyon I2, with a value of 0 % indicating no observed heterogene-ity, 25 % as low, 50 % as moderate, and 75 % as highheterogeneity [26]. Journal impact factors (IFs) were acquiredfrom ISI Journal Citation Reports [27]; journal h-indices wereacquired from SCImago Journal & Country Rank [28]. Theintercepts of each MA from Egger’s test were meta-analyzedacross studies, and associations with influencing characteris-tics were investigated via mixed-effects subgroup analyses/meta-regression with the Knapp-Hartung correction. All re-ported P values are two-sided with a significance (α) at 0.05,except for the regression-based tests, where the significance(α) was set at 0.10 [24, 29].
Indications of publication bias
The extent and impact of funnel plot asymmetry and publica-tion bias were assessed by various means [14, 30]: (a) funnelplots enhanced with significance contours in Stata version 12(StataCorp, College Station, TX, USA) were assessed by two
Clin Oral Invest

authors (S.N.P., M.A.P.) and their agreement was measuredwith Cohen’s kappa, (b) Begg and Mazumdar’s rank correla-tion test and Egger’s linear regression test for funnel plotasymmetry were performed, and (c) the failsafe N and Duvaland Tweedie’s trim and fill method were used to check therobustness of the results to the possible existence of publica-tion bias.
Results
The selection and inclusion of studies are summarized inFig. 1. To the original dataset of 80 published MA papers, 9more were added from manual search. These 89 papers in-cluded a total of 623 individual meta-analytical syntheses oftwo or more included studies. A total of 104 meta-analyticalsyntheses, reported in 28 articles, were eligible to be includedin our evaluation [31–57]. The publication of Johnson andLittle [42] contributed with two distinct MAs of different typeand included studies. Data from primary studies was notprovided in three included MAs [52, 53, 56], and as some ofthese primary studies could not be retrieved, and no answersfrom the corresponding authors were received after
communication, these three MAs were excluded. Thus, intotal, 25 MAs were included and re-analyzed (Table 1).
An overview of selected characteristics of all 25 includedstudies originally identified is presented in Table 1. These 25MAs included 313 studies of various designs and over 30million patients (due to including large non-randomized stud-ies). The median number of studies included per MA was 11(range 7–38), and the median number of patients per MAwas1,094 (range 232–13,545,026). The pooled effect sizes rangedfrom 0.01 to 7.97, while the heterogeneity between trials rangedfrom an I2 of 0 to 95% (or a τ2 of 0.01 to 14.43). ThirteenMAsincluded subgroup analyses and one employed meta-regressionanalysis to identify sources of heterogeneity. Fourteen MAsassessed various interventions, while the subjects of the other11 were of diagnostic nature (three of which assessed geneticassociations with conventional MA procedures).
Only few includedMAs assessed the existence or impact ofpublication bias on their results, as is seen in Table 2. Onethird (36 %) of the included MAs used a funnel plot toevaluate the effects of small studies (none used the term “smallstudy effects”—except the MAs of Papadopoulos et al. [49]and Papageorgiou et al. [50])—although the plot was notalways provided in the published article. Statistical tests forfunnel plot asymmetry were used in some articles, with Egger’s
Eligible meta-analyses(n = 28)
MA articles assessed for meta-analytical data synthesis
(n = 89)
Iden
tifi
cati
on
Scr
een
ing
Elig
ibili
ty Eligible meta-analyses(n = 104)
Individual meta-analysis syntheses extracted from included articles
(n = 623)
MA articles identified through manual update
(n = 9)
MA articles identified through database searching
(n = 80)
Meta-analyses excludedGenetic linkage MAs(n = 12)Single estimate MAs(n = 218)MAs with less than 7 included studies(n = 289)
Selection of one MA per included article
(n = 66)
eta-analyses included & re-analyzed(n = 25)
MAs excluded due to unretrieved primary studies
(n = 3)
Incl
ud
ed
Fig. 1 Flow chart describing theidentification and selectionprocedures of included MAs
Clin Oral Invest
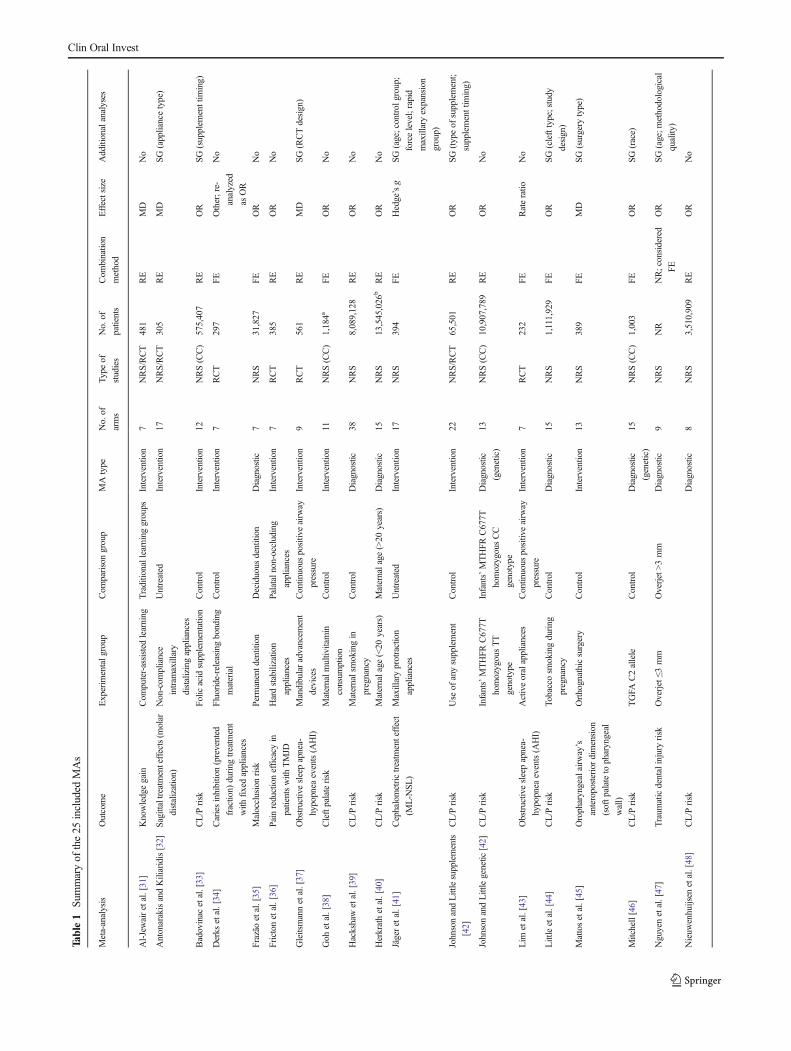
Table1
Summaryof
the25
included
MAs
Meta-analysis
Outcome
Experim
entalg
roup
Com
parisongroup
MAtype
No.of
arms
Type
of
studies
No.of
patients
Com
bination
method
Effectsize
Additionalanalyses
Al-Jewairetal.[31]
Knowledgegain
Com
puter-assisted
learning
Traditionallearninggroups
Intervention
7NRS/RCT
481
RE
MD
No
AntonarakisandKiliaridis[32]
Sagittaltreatmenteffects(m
olar
distalization)
Non-com
pliance
intram
axillary
distalizingappliances
Untreated
Interventio
n17
NRS/RCT
305
RE
MD
SG(appliancetype)
Badovinac
etal.[33]
CL/P
risk
Folicacid
supplementation
Control
Intervention
12NRS(CC)
575,407
RE
OR
SG(supplem
enttim
ing)
Derks
etal.[34]
Cariesinhibition(prevented
fraction)
during
treatm
ent
with
fixedappliances
Fluoride-releasingbonding
material
Control
Intervention
7RCT
297
FE
Other;re-
analyzed
asOR
No
Frazão
etal.[35]
Malocclusionrisk
Permanentd
entition
Deciduous
dentition
Diagnostic
7NRS
31,827
FE
OR
No
Frictonetal.[36]
Painreductionefficacy
in
patientswith
TMJD
Hardstabilizatio
n
appliances
Palataln
on-occluding
appliances
Intervention
7RCT
385
RE
OR
No
Gleitsmannetal.[37]
Obstructivesleepapnea-
hypopnea
events(A
HI)
Mandibularadvancem
ent
devices
Continuous
positiv
eairw
ay
pressure
Intervention
9RCT
561
RE
MD
SG(RCTdesign)
Goh
etal.[38]
Cleftpalaterisk
Maternalm
ultiv
itamin
consum
ption
Control
Intervention
11NRS(CC)
1,184a
FE
OR
No
Hackshawetal.[39]
CL/P
risk
Maternalsmokingin
pregnancy
Control
Diagnostic
38NRS
8,089,128
RE
OR
No
Herkrathetal.[40]
CL/P
risk
Maternalage
(<20
years)
Maternalage
(>20
years)
Diagnostic
15NRS
13,545,026
bRE
OR
No
Jägeretal.[41]
Cephalometrictreatm
enteffect
(ML-N
SL)
Maxillaryprotraction
appliances
Untreated
Interventio
n17
NRS
394
FE
Hedge’sg
SG(age;control
group;
forcelevel;rapid
maxillaryexpansion
group)
JohnsonandLittlesupplements
[42]
CL/P
risk
Use
ofanysupplement
Control
Intervention
22NRS/RCT
65,501
RE
OR
SG(typeof
supplement;
supplementtim
ing)
JohnsonandLittlegenetic
[42]
CL/P
risk
Infants’MTHFR
C677T
homozygousΤΤ
genotype
Infants’MTHFR
C677T
homozygousCC
genotype
Diagnostic
(genetic)
13NRS(CC)
10,907,789
RE
OR
No
Lim
etal.[43]
Obstructivesleepapnea-
hypopnea
events(A
HI)
Activeoralappliances
Continuous
positiv
eairw
ay
pressure
Interventio
n7
RCT
232
FE
Rateratio
No
Littleetal.[44]
CL/P
risk
Tobaccosm
okingduring
pregnancy
Control
Diagnostic
15NRS
1,111,929
FE
OR
SG(clefttype;study
design)
Mattosetal.[45]
Oropharyngealairw
ay’s
anteroposteriordimension
(softp
alateto
pharyngeal
wall)
Orthognathicsurgery
Control
Intervention
13NRS
389
FE
MD
SG(surgery
type)
Mitchell[46]
CL/P
risk
TGFA
C2allele
Control
Diagnostic
(genetic)
15NRS(CC)
1,003
FE
OR
SG(race)
Nguyenetal.[47]
Traum
aticdentalinjury
risk
Overjet≤3
mm
Overjet>3mm
Diagnostic
9NRS
NR
NR;considered
FE
OR
SG(age;m
ethodological
quality)
Nieuw
enhuijsen
etal.[48]
CL/P
risk
Diagnostic
8NRS
3,510,909
RE
OR
No
Clin Oral Invest

Table1
(contin
ued)
Meta-analysis
Outcome
Experim
entalg
roup
Com
parisongroup
MAtype
No.of
arms
Type
of
studies
No.of
patients
Com
binatio
n
method
Effectsize
Additionalanalyses
Exposureto
high
levels
ofchlorination
disinfectionby-products
Exposureto
lowlevelsof
chlorinationdisinfection
by-products
Papadopoulosetal.[49]
Lossof
anchorageof
first
molars
Miniscrew
implant
anchorage
Conventionalanchorage
means
Intervention
10NRS/RCT
255
RE
MD
SG(patients’age;
connectionmethod;
jaw;insertio
nsite;
numberof
implants;
loss
ofanchorage)
Papageorgiouetal.[50]
Miniscrew
implantfailure
Maxillaryim
plantinsertion
Mandibularim
plant
insertion
Intervention
17NRS/RCT
968
RE
Other;re-
analyzed
asOR
No
Perilloetal.[51]
Mandibulartotallength
measurements(Co–Gn;
Co–Pg;
Ar–Gn;
Ar–Pg
)
Fränkelappliance
Control
Intervention
10NRS/RCT
686
RE
MD
SG(cephalometric
measurement);m
eta-
regression
(quality
score)
Verkleij-Hagoortetal.[54]
CL/P
risk
Mothers’MTHFR
C677T
hetero/hom
ozygousCT/
TTgenotype
Mothers’MTHFR
C677T
homozygousCC
genotype
Diagnostic
(genetic)
8NRS(CC)
20,113
RE
OR
No
Vieiraetal.[55]
CL/P
risk
Maternalage
(<20
years)
Maternalage
(>20
years)
Diagnostic
8NRS
9,408,686
NR;considered
FE
OR
SG(onlyisolated
clefts)
Wyszynski
etal.[57]
CL/P
risk
Tobaccosm
okingduring
thefirsttrimesterof
pregnancy
Control
Diagnostic
11NRS
109,831
RE
OR
SG(exposurelevels)
The
meta-analyses
ofPo
lder
etal.[52],Rom
ittietal.[53],and
Weinbergetal.[56]areexcluded,due
tomissing
prim
arystudies
AHIapnea-hypopnea
index,CCcase-controlstudy,CL/Pcleftlip
with
/with
outp
alate,FEfixedeffectsmodel,M
Ameta-analysis,M
Dmeandifference,N
Rnotreported,NRSnon-random
ized
study,OR
odds
ratio
,RCTrandom
ized
controlledtrial,RErandom
effectsmodel,R
Rrisk
ratio
,SGsubgroup
analysis,T
MJD
temporomandibularjointd
isorder
aOnlytotalevent
numberreported
bAsreported
attheoriginaltableforallage
groups
Clin Oral Invest
linear regression test being the most commonly used (n=8;32 %) and Begg and Mazumdar’s rank correlation test comingsecond (n=4; 16 %). Two studies (8 %) assessed the robustnessof the MA results to publication bias with the failsafe N.According to the various methods described, evidence of pub-lication bias was reported in four (16 %) of the included MAs.
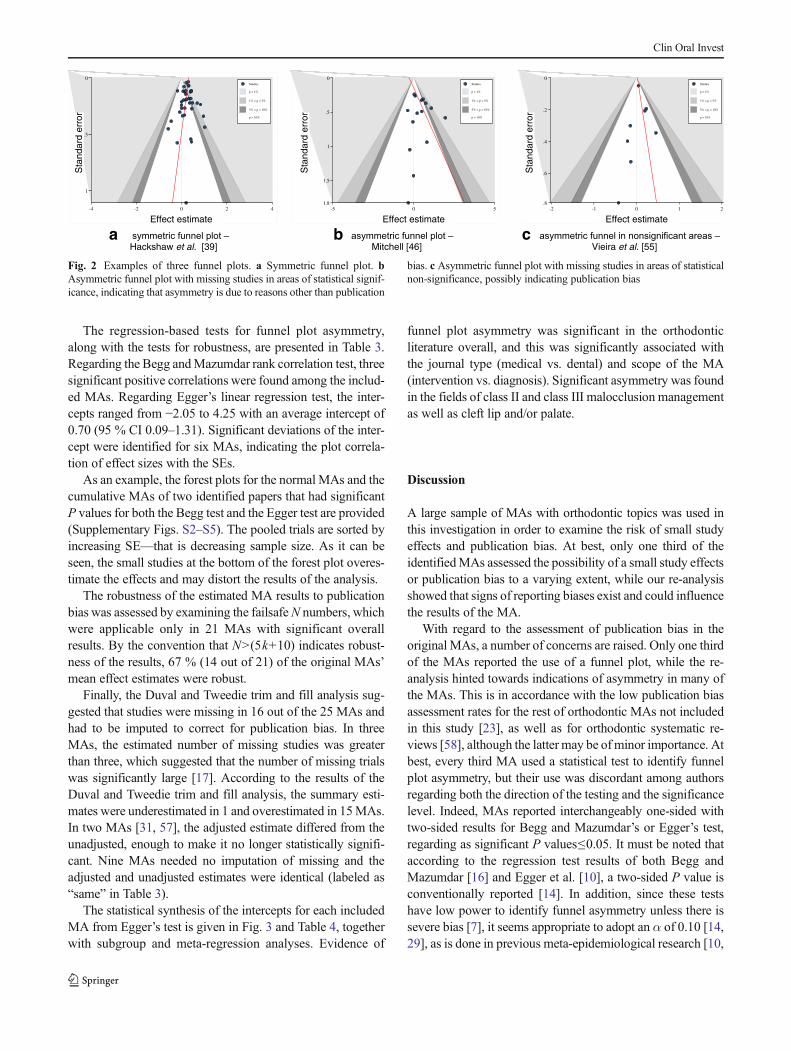
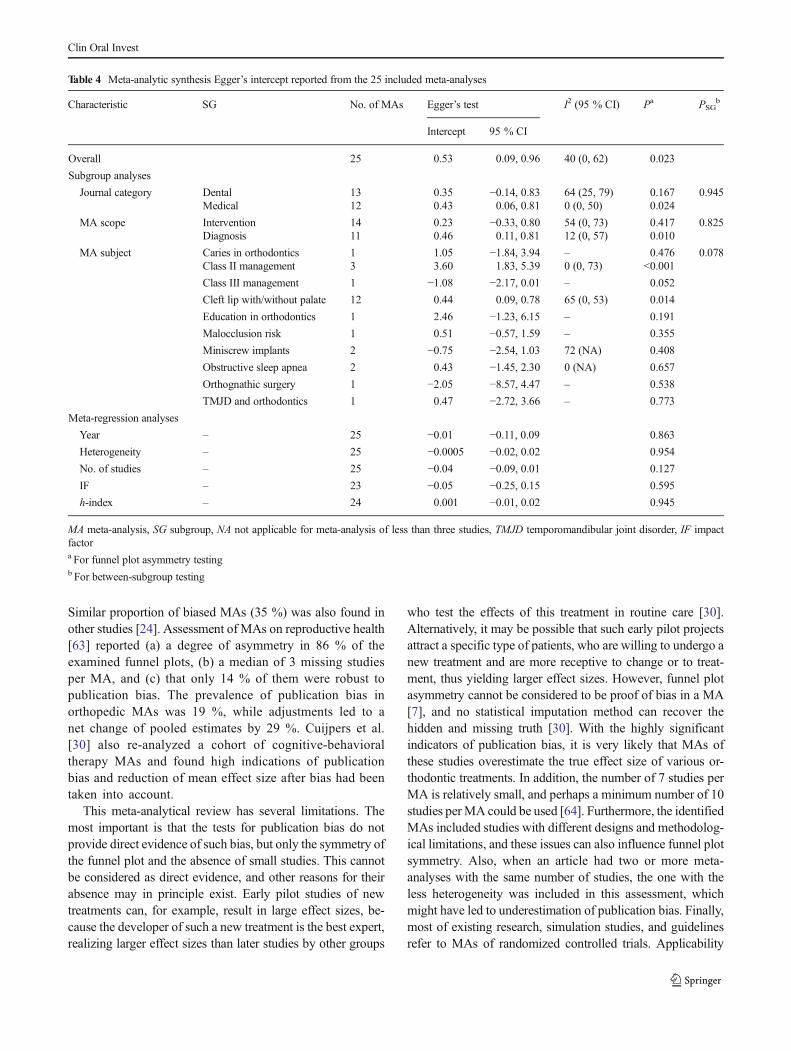
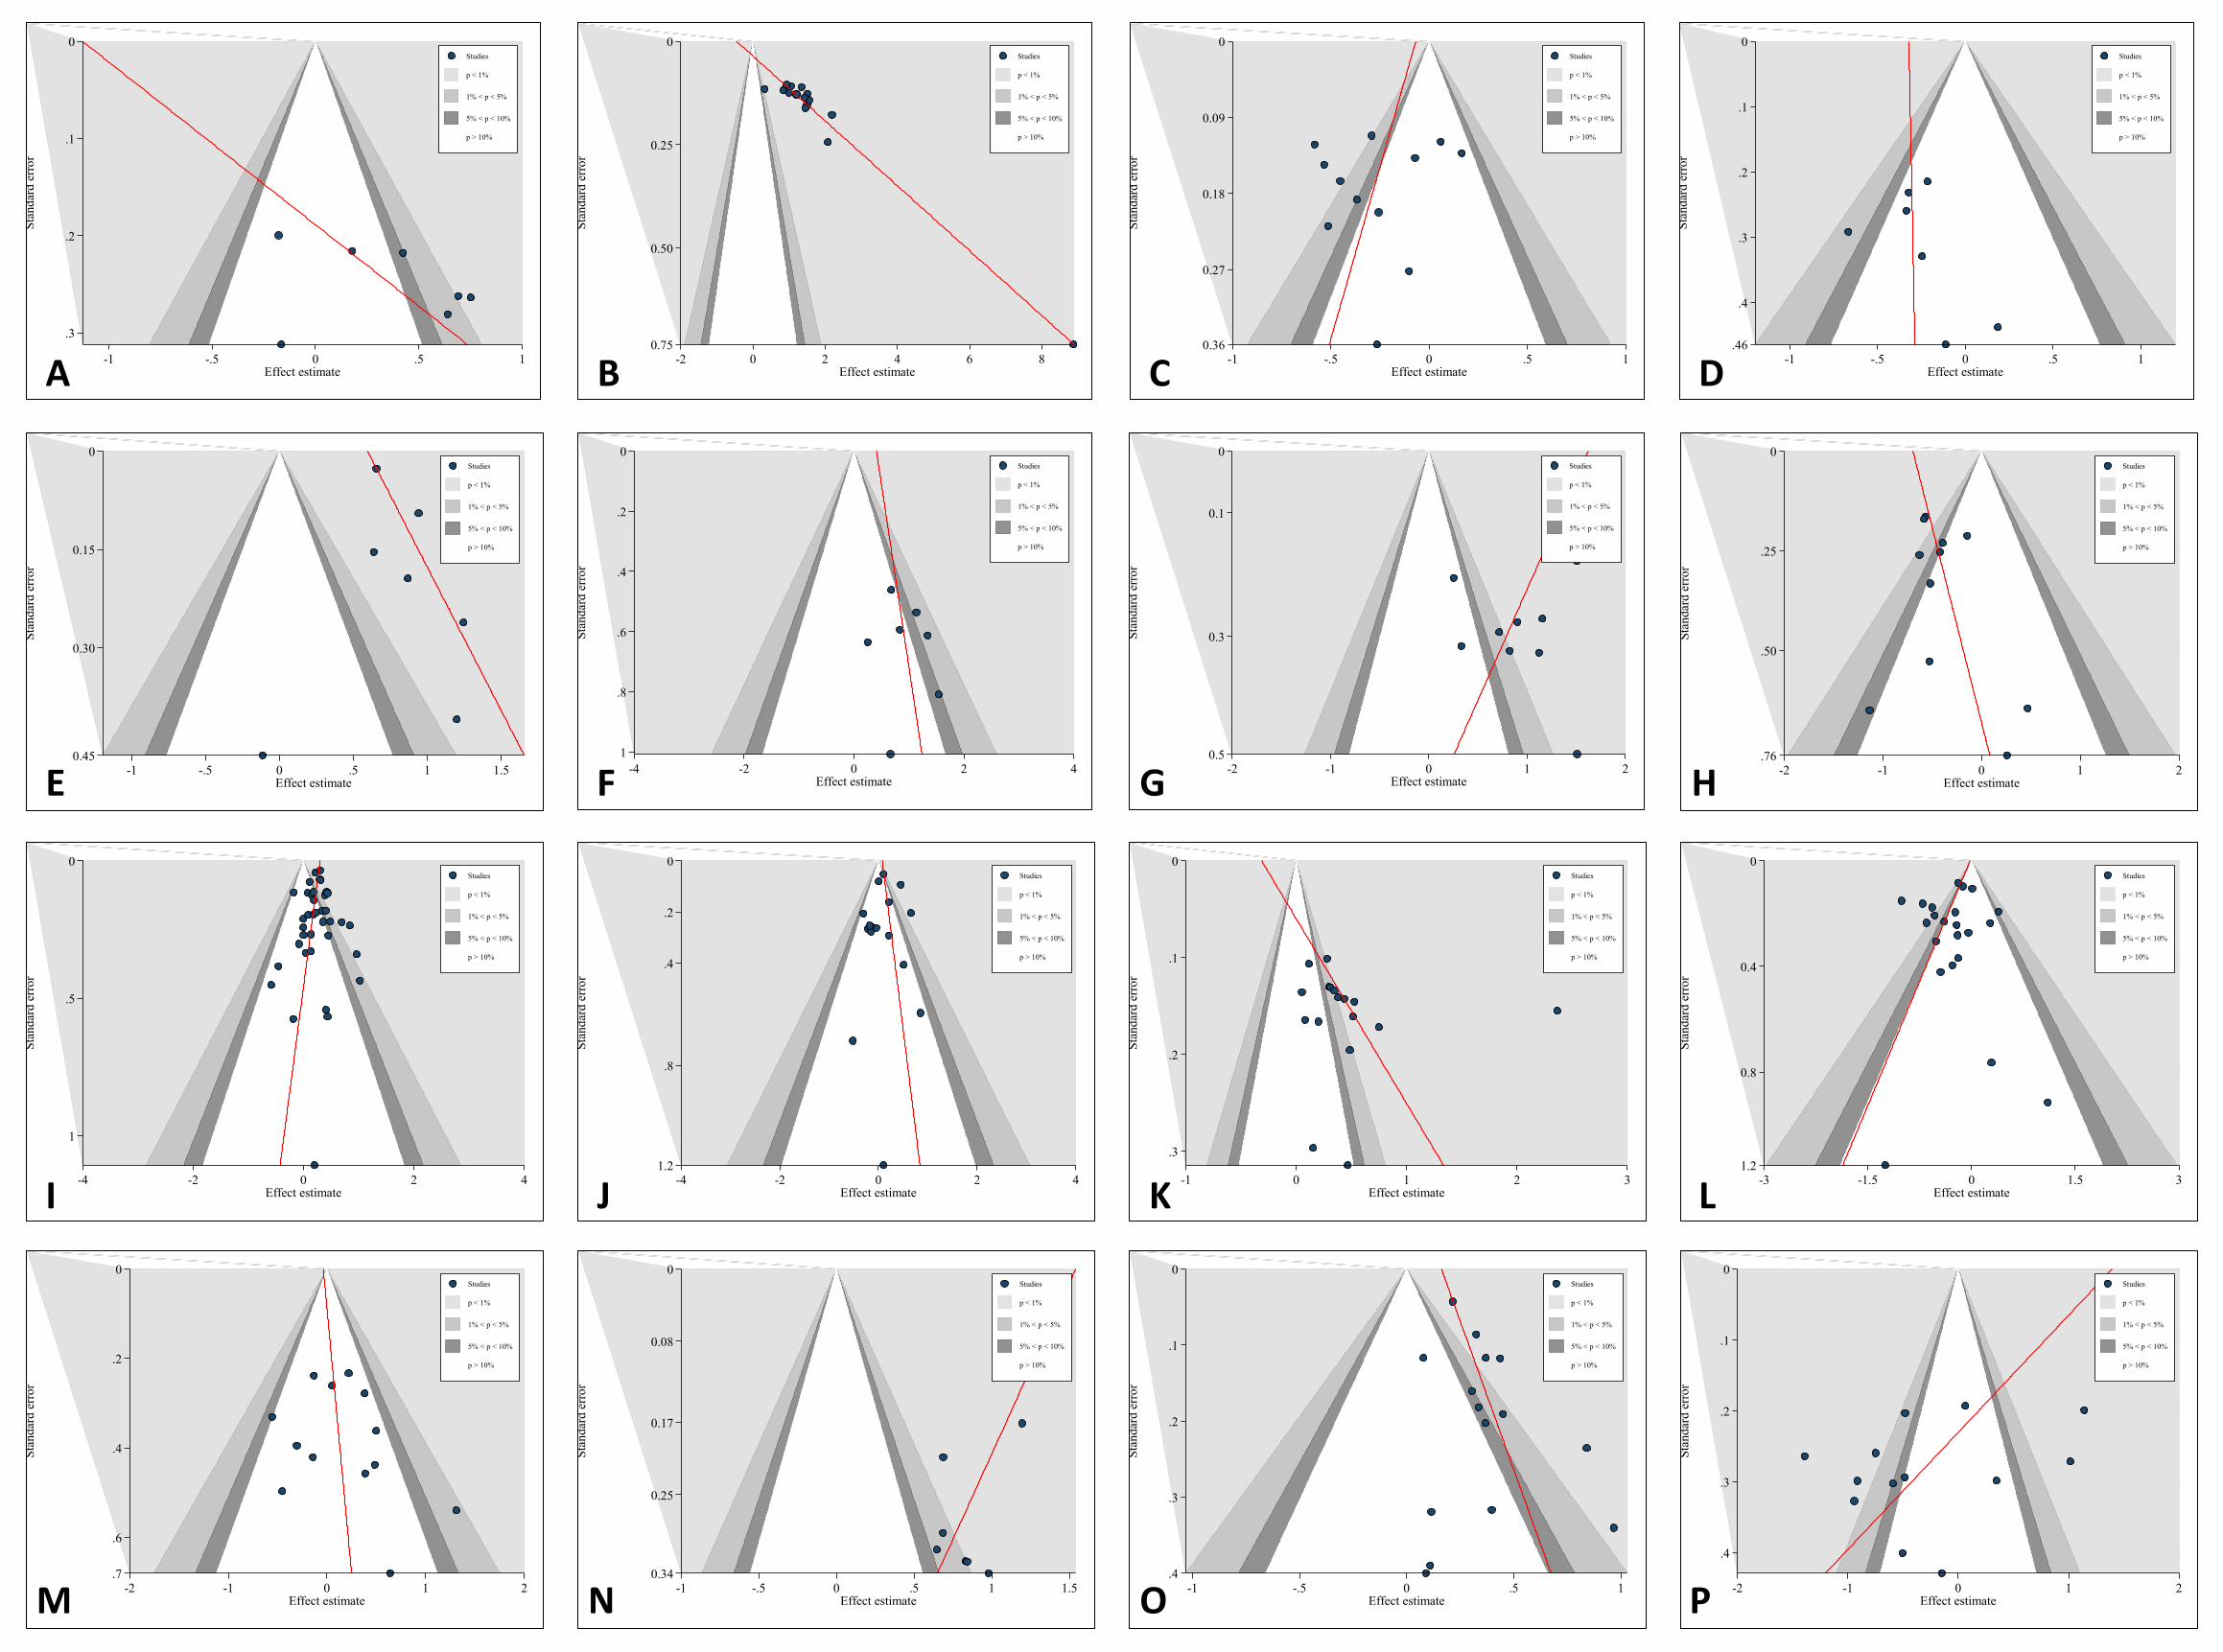
The funnel plots with contours to display areas of signifi-cance and non-significance for the 25 re-analyzed MAs arepresented in Supplementary Fig. S1. Three funnel plots areprovided in Fig. 2 as an example of symmetry, asymmetry and
asymmetry with missing studies in areas of non-significance,the latter indicating publication bias. The inter-rater agreementof the funnel plot assessment—measured by Cohen’s kappa—between the two authors was almost perfect (kappa 0.802;asymptomatic SE 0.134). For 17 funnel plots, the scatter ofeffects and the regression estimates indicated asymmetry(Supplementary Fig. S1 [A, B, C, D, E, F, G, H, K, L, N, O,P, R, S, T, U, V, and Y]). In seven funnel plots, the contourssuggested missing trials in areas of non-significance (Supple-mentary Fig. S1 [E, G, O, S, V, and Y]).
Table 2 Reported assessments of publication bias in the 25 original MAs
Meta-analysis Funnel plot Begg and Mazumdar’s test Egger’s test Failsafe N Evidence
Al-Jewair et al. [31] × × × × NA
Antonarakis and Kiliaridis[32]
× × × × NA
Badovinac et al. [33] ✓ ✓ ✓ × Not evident
Derks et al. [34] × × × × NA
Frazão et al. [35] × × × × NA
Fricton et al. [36] ✓ × ✓ (P values notprovided)
× Not evident
Gleitsmann et al. [37] × × × × NA
Goh et al. [38] ✓ (not provided) × × × Not evident
Hackshaw et al. [39] ✓ (not provided) × × × Not evident
Herkrath et al. [40] × ✓ ✓ × Not evident
Jäger et al. [41] × × × × NA
Johnson and Little supplements[42]
× × ✓ × Evident (test)
Johnson and Little genetic [42] × × ✓ × Evident (test)
Lim et al. [43] × × × × NA
Little et al. [44] ✓ ✓ (P values not provided) ✓ (P values notprovided)
× Not evident
Mattos et al. [45] ✓ (not provided) × × × Evident; considered low, dueto multiple interventions/outcomes studied
Mitchell [46] × × × × NA
Nguyen et al. [47] × × × × NA
Nieuwenhuijsen et al. [48] ✓ (not provided) × ✓ × Evident; test results notconsidered rigorous, due tothe small number ofstudies
Papadopoulos et al. [49] ✓ ✓(Kendall’s tau also provided) ✓ × Not evident
Papageorgiou et al. [50] ✓ (not provided) ✓ ✓ × Evident; trim and fill showedinitial underestimation ofeffects
Perillo et al. [51] × × × × NA
Verkleij-Hagoort et al. [54] ✓ (not provided) × × × Not evident
Vieira et al. [55] × × × ✓ (Rosenthal’s) NA
Wyszynski et al. [57] × × × × NA
Summary ✓ (even notprovided)
✓ (even without P value) ✓ (even withoutP value)
✓ Evident
36 % 16 % 32 % 8 % 16 %
The meta-analyses of Polder et al. [52], Romitti et al. [53], and Weinberg et al. [56] are excluded, due to missing primary studies
× not reported, ✓ reported, NA not applicable
Clin Oral Invest
The regression-based tests for funnel plot asymmetry,along with the tests for robustness, are presented in Table 3.Regarding the Begg andMazumdar rank correlation test, threesignificant positive correlations were found among the includ-ed MAs. Regarding Egger’s linear regression test, the inter-cepts ranged from −2.05 to 4.25 with an average intercept of0.70 (95 % CI 0.09–1.31). Significant deviations of the inter-cept were identified for six MAs, indicating the plot correla-tion of effect sizes with the SEs.
As an example, the forest plots for the normal MAs and thecumulative MAs of two identified papers that had significantP values for both the Begg test and the Egger test are provided(Supplementary Figs. S2–S5). The pooled trials are sorted byincreasing SE—that is decreasing sample size. As it can beseen, the small studies at the bottom of the forest plot overes-timate the effects and may distort the results of the analysis.
The robustness of the estimated MA results to publicationbias was assessed by examining the failsafeN numbers, whichwere applicable only in 21 MAs with significant overallresults. By the convention that N>(5k+10) indicates robust-ness of the results, 67 % (14 out of 21) of the original MAs’mean effect estimates were robust.
Finally, the Duval and Tweedie trim and fill analysis sug-gested that studies were missing in 16 out of the 25 MAs andhad to be imputed to correct for publication bias. In threeMAs, the estimated number of missing studies was greaterthan three, which suggested that the number of missing trialswas significantly large [17]. According to the results of theDuval and Tweedie trim and fill analysis, the summary esti-mates were underestimated in 1 and overestimated in 15MAs.In two MAs [31, 57], the adjusted estimate differed from theunadjusted, enough to make it no longer statistically signifi-cant. Nine MAs needed no imputation of missing and theadjusted and unadjusted estimates were identical (labeled as“same” in Table 3).
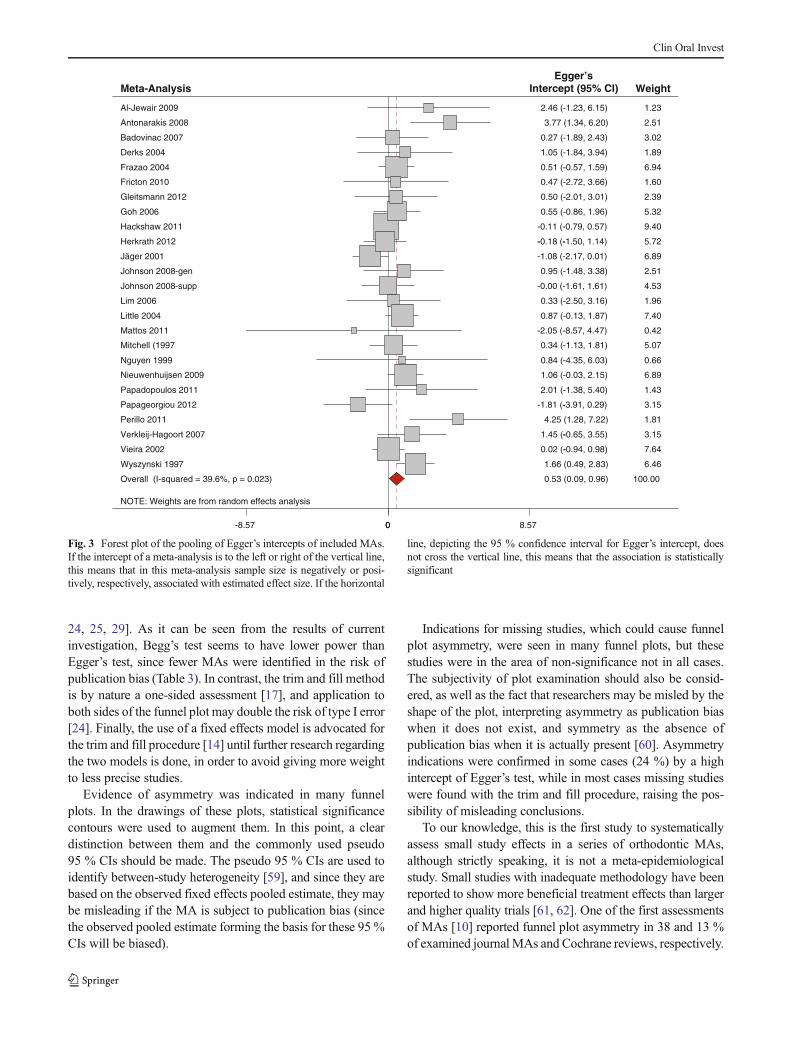
The statistical synthesis of the intercepts for each includedMA from Egger’s test is given in Fig. 3 and Table 4, togetherwith subgroup and meta-regression analyses. Evidence of
funnel plot asymmetry was significant in the orthodonticliterature overall, and this was significantly associated withthe journal type (medical vs. dental) and scope of the MA(intervention vs. diagnosis). Significant asymmetry was foundin the fields of class II and class III malocclusion managementas well as cleft lip and/or palate.
Discussion
A large sample of MAs with orthodontic topics was used inthis investigation in order to examine the risk of small studyeffects and publication bias. At best, only one third of theidentifiedMAs assessed the possibility of a small study effectsor publication bias to a varying extent, while our re-analysisshowed that signs of reporting biases exist and could influencethe results of the MA.
With regard to the assessment of publication bias in theoriginal MAs, a number of concerns are raised. Only one thirdof the MAs reported the use of a funnel plot, while the re-analysis hinted towards indications of asymmetry in many ofthe MAs. This is in accordance with the low publication biasassessment rates for the rest of orthodontic MAs not includedin this study [23], as well as for orthodontic systematic re-views [58], although the latter may be ofminor importance. Atbest, every third MA used a statistical test to identify funnelplot asymmetry, but their use was discordant among authorsregarding both the direction of the testing and the significancelevel. Indeed, MAs reported interchangeably one-sided withtwo-sided results for Begg and Mazumdar’s or Egger’s test,regarding as significant P values≤0.05. It must be noted thataccording to the regression test results of both Begg andMazumdar [16] and Egger et al. [10], a two-sided P value isconventionally reported [14]. In addition, since these testshave low power to identify funnel asymmetry unless there issevere bias [7], it seems appropriate to adopt an α of 0.10 [14,29], as is done in previous meta-epidemiological research [10,
0
.5
1
-4 -2 0 2 4Effect estimate
Studies
p < 1%
1% < p < 5%
5% < p < 10%
p > 10%
Hackshaw et al. [39]
0
1.8
1.5
1
.5
Stan
dard
err
or
-5 0 5Effect estimate
Studies
p < 1%
1% < p < 5%
5% < p < 10%
p > 10%
Mitchell [46]
0
.8
.6
.4
.2
Stan
dard
err
or
-2 -1 0 1 2Effect estimate
Studies
p < 1%
1% < p < 5%
5% < p < 10%
p > 10%
Vieira et al. [55]
Sta
ndar
d er
ror
Sta
ndar
d er
ror
Sta
ndar
d er
ror
Effect estimateEffect estimateEffect estimate
a b c
Fig. 2 Examples of three funnel plots. a Symmetric funnel plot. bAsymmetric funnel plot with missing studies in areas of statistical signif-icance, indicating that asymmetry is due to reasons other than publication
bias. c Asymmetric funnel plot with missing studies in areas of statisticalnon-significance, possibly indicating publication bias
Clin Oral Invest
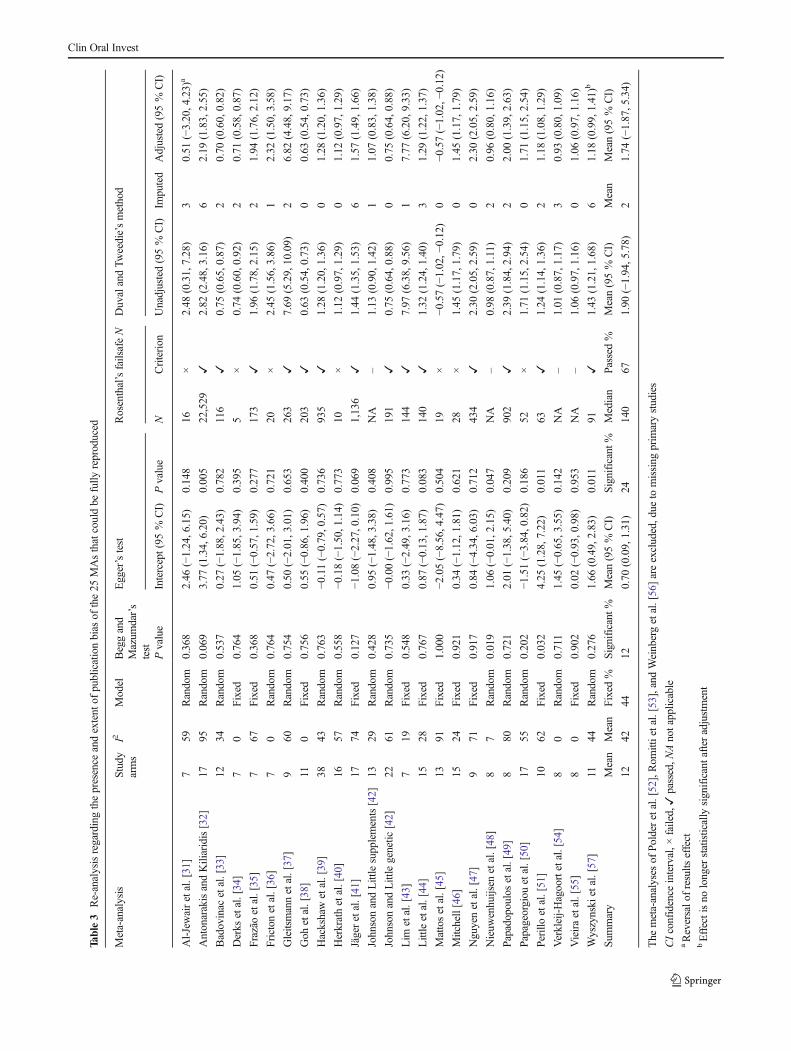
Table3
Re-analysisregardingthepresence
andextent
ofpublicationbias
ofthe25
MAsthatcouldbe
fully
reproduced
Meta-analysis
Study
arms
I2Model
Beggand
Mazum
dar’s
test
Egger’stest
Rosenthal’sfailsafeN
DuvalandTw
eedie’smethod
Pvalue
Intercept(95
%CI)
Pvalue
NCriterion
Unadjusted(95%
CI)
Imputed
Adjusted(95%
CI)
Al-Jewairetal.[31]
759
Random
0.368
2.46
(−1.24,6.15)
0.148
16×
2.48
(0.31,7.28)
30.51
(−3.20,4.23)
a
AntonarakisandKiliaridis[32]
1795
Random
0.069
3.77
(1.34,6.20)
0.005
22,529
✓2.82
(2.48,3.16)
62.19
(1.83,2.55)
Badovinac
etal.[33]
1234
Random
0.537
0.27
(−1.88,2.43)
0.782
116
✓0.75
(0.65,0.87)
20.70
(0.60,0.82)
Derks
etal.[34]
70
Fixed
0.764
1.05
(−1.85,3.94)
0.395
5×
0.74
(0.60,0.92)
20.71
(0.58,0.87)
Frazãoetal.[35]
767
Fixed
0.368
0.51
(−0.57,1.59)
0.277
173
✓1.96
(1.78,2.15)
21.94
(1.76,2.12)
Fricton
etal.[36]
70
Random
0.764
0.47
(−2.72,3.66)
0.721
20×
2.45
(1.56,3.86)
12.32
(1.50,3.58)
Gleitsmannetal.[37]
960
Random
0.754
0.50
(−2.01,3.01)
0.653
263
✓7.69
(5.29,10.09)
26.82
(4.48,9.17)
Goh
etal.[38]
110
Fixed
0.756
0.55
(−0.86,1.96)
0.400
203
✓0.63
(0.54,0.73)
00.63
(0.54,0.73)
Hackshawetal.[39]
3843
Random
0.763
−0.11(−0.79,0.57)
0.736
935
✓1.28
(1.20,1.36)
01.28
(1.20,1.36)
Herkrathetal.[40]
1657
Random
0.558
−0.18(−1.50,1.14)
0.773
10×
1.12
(0.97,1.29)
01.12
(0.97,1.29)
Jägeretal.[41]
1774
Fixed
0.127
−1.08(−2.27,0.10)
0.069
1,136
✓1.44
(1.35,1.53)
61.57
(1.49,1.66)
JohnsonandLittlesupplements[42]
1329
Random
0.428
0.95
(−1.48,3.38)
0.408
NA
–1.13
(0.90,1.42)
11.07
(0.83,1.38)
JohnsonandLittlegenetic
[42]
2261
Random
0.735
−0.00(−1.62,1.61)
0.995
191
✓0.75
(0.64,0.88)
00.75
(0.64,0.88)
Lim
etal.[43]
719
Fixed
0.548
0.33
(−2.49,3.16)
0.773
144
✓7.97
(6.38,9.56)
17.77
(6.20,9.33)
Littleetal.[44]
1528
Fixed
0.767
0.87
(−0.13,1.87)
0.083
140
✓1.32
(1.24,1.40)
31.29
(1.22,1.37)
Mattosetal.[45]
1391
Fixed
1.000
−2.05(−8.56,4.47)
0.504
19×
−0.57(−1.02,−
0.12)
0−0
.57(−1.02,−
0.12)
Mitchell[46]
1524
Fixed
0.921
0.34
(−1.12,1.81)
0.621
28×
1.45
(1.17,1.79)
01.45
(1.17,1.79)
Nguyenetal.[47]
971
Fixed
0.917
0.84
(−4.34,6.03)
0.712
434
✓2.30
(2.05,2.59)
02.30
(2.05,2.59)
Nieuw
enhuijsen
etal.[48]
87
Random
0.019
1.06
(−0.01,2.15)
0.047
NA
–0.98
(0.87,1.11)
20.96
(0.80,1.16)
Papadopoulos
etal.[49]
880
Random
0.721
2.01
(−1.38,5.40)
0.209
902
✓2.39
(1.84,2.94)
22.00
(1.39,2.63)
Papageorgiouetal.[50]
1755
Random
0.202
−1.51(−3.84,0.82)
0.186
52×
1.71
(1.15,2.54)
01.71
(1.15,2.54)
Perilloetal.[51]
1062
Fixed
0.032
4.25
(1.28,7.22)
0.011
63✓
1.24
(1.14,1.36)
21.18
(1.08,1.29)
Verkleij-Hagoortetal.[54]
80
Random
0.711
1.45
(−0.65,3.55)
0.142
NA
–1.01
(0.87,1.17)
30.93
(0.80,1.09)
Vieiraetal.[55]
80
Fixed
0.902
0.02
(−0.93,0.98)
0.953
NA
–1.06
(0.97,1.16)
01.06
(0.97,1.16)
Wyszynski
etal.[57]
1144
Random
0.276
1.66
(0.49,2.83)
0.011
91✓
1.43
(1.21,1.68)
61.18
(0.99,1.41)b
Sum
mary
Mean
Mean
Fixed
%Significant
%Mean(95%
CI)
Significant
%Median
Passed%
Mean(95%
CI)
Mean
Mean(95%
CI)
1242
4412
0.70
(0.09,1.31)
24140
671.90
(−1.94,5.78)
21.74
(−1.87,5.34)
The
meta-analyses
ofPolderetal.[52],Rom
ittietal.[53],and
Weinbergetal.[56]areexcluded,due
tomissing
prim
arystudies
CIconfidence
interval,×
failed,✓
passed,N
Anotapplicable
aReversalo
fresults
effect
bEffectisno
longer
statistically
significantafter
adjustment
Clin Oral Invest
24, 25, 29]. As it can be seen from the results of currentinvestigation, Begg’s test seems to have lower power thanEgger’s test, since fewer MAs were identified in the risk ofpublication bias (Table 3). In contrast, the trim and fill methodis by nature a one-sided assessment [17], and application toboth sides of the funnel plot may double the risk of type I error[24]. Finally, the use of a fixed effects model is advocated forthe trim and fill procedure [14] until further research regardingthe two models is done, in order to avoid giving more weightto less precise studies.
Evidence of asymmetry was indicated in many funnelplots. In the drawings of these plots, statistical significancecontours were used to augment them. In this point, a cleardistinction between them and the commonly used pseudo95 % CIs should be made. The pseudo 95 % CIs are used toidentify between-study heterogeneity [59], and since they arebased on the observed fixed effects pooled estimate, they maybe misleading if the MA is subject to publication bias (sincethe observed pooled estimate forming the basis for these 95 %CIs will be biased).
Indications for missing studies, which could cause funnelplot asymmetry, were seen in many funnel plots, but thesestudies were in the area of non-significance not in all cases.The subjectivity of plot examination should also be consid-ered, as well as the fact that researchers may be misled by theshape of the plot, interpreting asymmetry as publication biaswhen it does not exist, and symmetry as the absence ofpublication bias when it is actually present [60]. Asymmetryindications were confirmed in some cases (24 %) by a highintercept of Egger’s test, while in most cases missing studieswere found with the trim and fill procedure, raising the pos-sibility of misleading conclusions.
To our knowledge, this is the first study to systematicallyassess small study effects in a series of orthodontic MAs,although strictly speaking, it is not a meta-epidemiologicalstudy. Small studies with inadequate methodology have beenreported to show more beneficial treatment effects than largerand higher quality trials [61, 62]. One of the first assessmentsof MAs [10] reported funnel plot asymmetry in 38 and 13 %of examined journal MAs and Cochrane reviews, respectively.
NOTE: Weights are from random effects analysis
Overall (I-squared = 39.6%, p = 0.023)
Wyszynski 1997
Derks 2004
Goh 2006
Al-Jewair 2009
Meta-Analysis
Badovinac 2007
Papadopoulos 2011
Nieuwenhuijsen 2009
Nguyen 1999
Papageorgiou 2012
Mattos 2011
Perillo 2011
Vieira 2002
Herkrath 2012
Fricton 2010
Lim 2006
Jäger 2001
Hackshaw 2011
Gleitsmann 2012
Verkleij-Hagoort 2007
Johnson 2008-supp
Mitchell (1997
Frazao 2004
Little 2004
Johnson 2008-gen
Antonarakis 2008
0.53 (0.09, 0.96)
1.66 (0.49, 2.83)
1.05 (-1.84, 3.94)
0.55 (-0.86, 1.96)
2.46 (-1.23, 6.15)
0.27 (-1.89, 2.43)
2.01 (-1.38, 5.40)
1.06 (-0.03, 2.15)
0.84 (-4.35, 6.03)
-1.81 (-3.91, 0.29)
-2.05 (-8.57, 4.47)
4.25 (1.28, 7.22)
0.02 (-0.94, 0.98)
-0.18 (-1.50, 1.14)
0.47 (-2.72, 3.66)
0.33 (-2.50, 3.16)
-1.08 (-2.17, 0.01)
-0.11 (-0.79, 0.57)
0.50 (-2.01, 3.01)
1.45 (-0.65, 3.55)
-0.00 (-1.61, 1.61)
0.34 (-1.13, 1.81)
0.51 (-0.57, 1.59)
0.87 (-0.13, 1.87)
0.95 (-1.48, 3.38)
3.77 (1.34, 6.20)
100.00
6.46
1.89
5.32
1.23
Weight
3.02
1.43
6.89
0.66
3.15
0.42
1.81
7.64
5.72
1.60
1.96
6.89
9.40
2.39
3.15
4.53
5.07
6.94
7.40
2.51
2.51
Egger’sIntercept (95% CI)
-
-
- -
-
0-8.57 0 8.57
Fig. 3 Forest plot of the pooling of Egger’s intercepts of included MAs.If the intercept of a meta-analysis is to the left or right of the vertical line,this means that in this meta-analysis sample size is negatively or posi-tively, respectively, associated with estimated effect size. If the horizontal
line, depicting the 95 % confidence interval for Egger’s intercept, doesnot cross the vertical line, this means that the association is statisticallysignificant
Clin Oral Invest
Similar proportion of biased MAs (35 %) was also found inother studies [24]. Assessment of MAs on reproductive health[63] reported (a) a degree of asymmetry in 86 % of theexamined funnel plots, (b) a median of 3 missing studiesper MA, and (c) that only 14 % of them were robust topublication bias. The prevalence of publication bias inorthopedic MAs was 19 %, while adjustments led to anet change of pooled estimates by 29 %. Cuijpers et al.[30] also re-analyzed a cohort of cognitive-behavioraltherapy MAs and found high indications of publicationbias and reduction of mean effect size after bias had beentaken into account.
This meta-analytical review has several limitations. Themost important is that the tests for publication bias do notprovide direct evidence of such bias, but only the symmetry ofthe funnel plot and the absence of small studies. This cannotbe considered as direct evidence, and other reasons for theirabsence may in principle exist. Early pilot studies of newtreatments can, for example, result in large effect sizes, be-cause the developer of such a new treatment is the best expert,realizing larger effect sizes than later studies by other groups
who test the effects of this treatment in routine care [30].Alternatively, it may be possible that such early pilot projectsattract a specific type of patients, who are willing to undergo anew treatment and are more receptive to change or to treat-ment, thus yielding larger effect sizes. However, funnel plotasymmetry cannot be considered to be proof of bias in a MA[7], and no statistical imputation method can recover thehidden and missing truth [30]. With the highly significantindicators of publication bias, it is very likely that MAs ofthese studies overestimate the true effect size of various or-thodontic treatments. In addition, the number of 7 studies perMA is relatively small, and perhaps a minimum number of 10studies perMA could be used [64]. Furthermore, the identifiedMAs included studies with different designs and methodolog-ical limitations, and these issues can also influence funnel plotsymmetry. Also, when an article had two or more meta-analyses with the same number of studies, the one with theless heterogeneity was included in this assessment, whichmight have led to underestimation of publication bias. Finally,most of existing research, simulation studies, and guidelinesrefer to MAs of randomized controlled trials. Applicability
Table 4 Meta-analytic synthesis Egger’s intercept reported from the 25 included meta-analyses
Characteristic SG No. of MAs Egger’s test I2 (95 % CI) Pa PSGb
Intercept 95 % CI
Overall 25 0.53 0.09, 0.96 40 (0, 62) 0.023
Subgroup analyses
Journal category Dental 13 0.35 −0.14, 0.83 64 (25, 79) 0.167 0.945Medical 12 0.43 0.06, 0.81 0 (0, 50) 0.024
MA scope Intervention 14 0.23 −0.33, 0.80 54 (0, 73) 0.417 0.825Diagnosis 11 0.46 0.11, 0.81 12 (0, 57) 0.010
MA subject Caries in orthodontics 1 1.05 −1.84, 3.94 – 0.476 0.078Class II management 3 3.60 1.83, 5.39 0 (0, 73) <0.001
Class III management 1 −1.08 −2.17, 0.01 – 0.052
Cleft lip with/without palate 12 0.44 0.09, 0.78 65 (0, 53) 0.014
Education in orthodontics 1 2.46 −1.23, 6.15 – 0.191
Malocclusion risk 1 0.51 −0.57, 1.59 – 0.355
Miniscrew implants 2 −0.75 −2.54, 1.03 72 (NA) 0.408
Obstructive sleep apnea 2 0.43 −1.45, 2.30 0 (NA) 0.657
Orthognathic surgery 1 −2.05 −8.57, 4.47 – 0.538
TMJD and orthodontics 1 0.47 −2.72, 3.66 – 0.773
Meta-regression analyses
Year – 25 −0.01 −0.11, 0.09 0.863
Heterogeneity – 25 −0.0005 −0.02, 0.02 0.954
No. of studies – 25 −0.04 −0.09, 0.01 0.127
IF – 23 −0.05 −0.25, 0.15 0.595
h-index – 24 0.001 −0.01, 0.02 0.945
MA meta-analysis, SG subgroup, NA not applicable for meta-analysis of less than three studies, TMJD temporomandibular joint disorder, IF impactfactora For funnel plot asymmetry testingb For between-subgroup testing
Clin Oral Invest

and performance of proposed procedures on MAs of observa-tional studies is likely to differ [65].
Since a rather narrow definition of publication bias wasused in this study, a broader one might indicate not onlyselective publication of studies but also selective reporting ofoutcomes [8, 66] which may also cause funnel plot asymme-try. A further limitation is that many of the included studieswere small and many included non-randomized studies aswell. Randomized controlled trials are generally consideredpreferable and most of the research is based on them.
Several weaknesses have been attributed to the statisticaltests used to assess the asymmetry of the funnel plot [12, 65].A problem with Duval and Tweedie’s trim and fill procedureis that it is dependent on the assumptions for reasons thatstudies may be missing, and therefore, the algorithm can beinfluenced by one or two deviant studies [12]. Another prob-lem is that it assumes that funnel plot asymmetry is entirelydue to publication bias and as such is inferior to othermethods. Begg and Mazumdar’s test and Egger’s test mayalso yield a different picture depending on the index used inthe analyses [67], and they tend to have low power. The effectsizes (odds ratio, risk ratio, etc.) in this re-analysis were keptas they were originally (except for cases of custom indices),since this choice is also dependent on clinical reasoning.Furthermore, the two regression-based tests only make senseif there is a reasonable amount of sample size dispersion and areasonable number of studies. Other means of adjustmentinclude (a) a regression-based adjustment to detect and adjustfor small study effects [68], (b) a limit MA [69], (c) a modifiedtest for small study effects [70], (d) a generalized weightingregression-derived MA robust to small study effects and het-erogeneity [71], or (e) other sensitivity analyses based onselection models, such as the one proposed by Copas andShi [72]. The latter seems to outperform other sensitivityanalyses to publication bias (like the trim and fill method)but requires a considerable number of studies and a certainstatistical expertise [73]. However, a thorough evaluation ofthese methods is needed as well as a comparison betweenthem, before they can be routinely implemented.
In this evaluation, a relatively large number of studies wereincluded and strong indications of publication bias werefound. Researchers in orthodontics should strive to deal withpublication bias both during the primary level of reporting trialresults (even negative ones) as well as during the synthesis oftrials in meta-analyses, exploring appropriate reasons.
Conclusions
An inspection of the funnel plots and the analyses stratified bysample size should be considered routinely in every MA,accompanied by some statistical test for funnel plot
asymmetry. In the presence of such asymmetry, additionalMAs restricted only on large trials should also be reported.
Since indications of publication bias in orthodontics werefound in current investigation, the influence of small trials onestimated treatment effects should be routinely and morecarefully assessed by the authors conducting MAs, whilereaders and clinicians should be very careful wheninterpreting the results of small trials with high risk of bias,as well as of MAs including such trials.
Recommendations for systematic reviews and MAs
Based on existing evidence from empirical studies, simulationstudies, and guidelines, the following recommendations canbe drawn:
& All systematic reviews and MAs should plan to assessissues, such as the existence of unpublished trials, non-registered trials, financially supported trials, or trials withany other conflict of interest.
& Every MAwith at least 10 studies should present a funnelplot, ideally contour-enhanced, with the SE in the verticalaxis.
& Review authors should use the funnel plot in conjunctionwith critical thinking in order to investigate the reasons forasymmetry or non-existence of trials, and they shouldreport the results accordingly.
& Egger’s test is useful to identify funnel plot asymmetryand is easy to undertake.
& If solid logical and statistical evidence of publication biasis found and adequate studies are included, the use ofadvanced methods is recommended (with assistance froma statistician), such as the Copas selection method.
& The use of the failsafe N is not recommended.
Acknowledgments The authors are grateful to M. C. Cornel (Depart-ment of Clinical Genetics, VU University Medical Centre, Amsterdam,The Netherlands) for providing a copy of their primary trial and to C. Y.Johnson (Department of Epidemiology, Rollins School of Public Health,Emory University, Atlanta, GA, USA) for providing an unobtained trialincluded in their MA.
Conflict of interest The authors declare no conflict of interest. Two ofthe authors (S.N.P. and M.A.P.) were involved in two included papers;however, the data were also checked by I. C. Konstantinidis, Mount SinaiSchool of Medicine, New York City, NY, USA.
References
1. Pitak-Arnnop P, Sader R, Rapidis AD, Dhanuthai K, Bauer U, HerveC, Hemprich A (2010) Publication bias in oral and maxillofacialsurgery journals: an observation on published controlled trials. JCraniomaxillofac Surg 38:4–10
Clin Oral Invest

2. Polychronopoulou A, Pandis N, Eliades T (2010) Assessment ofpublication bias in dental specialty journals. J Evid Based DentPract 10:207–211
3. Koletsi D, Karagianni A, Pandis N, Makou M, Polychronopoulou A,Eliades T (2009) Are studies reporting significant results more likelyto be published? Am J Orthod Dentofac Orthop 136(632):e1–e5
4. Scholey JM (2002) Publication bias in dental research. Thesis,University of Liverpool, UK
5. Dwan K, Altman DG, Arnaiz JA, Bloom J, Chan AW, Cronin E,Decullier E, Easterbrook PJ, Von Elm E, Gamble C, Ghersi D,Ioannidis JP, Simes J, Williamson PR (2008) Systematic review ofthe empirical evidence of study publication bias and outcomereporting bias. PLoS One 3:e3081
6. Sterne JA, Egger M, Smith GD (2001) Systematic reviews in healthcare: investigating and dealing with publication and other biases inmeta-analysis. BMJ 323:101–105
7. Sterne JA, Gavaghan D, EggerM (2000) Publication and related biasin meta-analysis: power of statistical tests and prevalence in theliterature. J Clin Epidemiol 53:1119–1129
8. Chan AW, Hrobjartsson A, Haahr MT, Gotzsche PC, Altman DG(2004) Empirical evidence for selective reporting of outcomes inrandomized trials: comparison of protocols to published articles.JAMA 291:2457–2465
9. Hopewell S, Loudon K, Clarke MJ, Oxman AD, Dickersin K (2009)Publication bias in clinical trials due to statistical significance ordirection of trial results. Cochrane Database Syst Rev 1:MR000006
10. Egger M, Davey Smith G, Schneider M, Minder C (1997) Bias inmeta-analysis detected by a simple, graphical test. BMJ 315:629–634
11. Williamson PR, Gamble C (2005) Identification and impact of out-come selection bias in meta-analysis. Stat Med 24:1547–1561
12. Borenstein M, Hedges LV, Higgins JPT, Rothstein HR (2009)Publication bias. In: Borenstein M, Hedges LV, Higgins JPT,Rothstein HR (eds) Introduction to meta-analysis. Wiley,Chichester, pp 277–294
13. Rücker G (2010) Small-study effects and heterogeneity in meta-analysis. Thesis, Albert-Ludwigs-University, Germany
14. Sutton AJ (2005) Evidence concerning the consequences of publica-tion and related biases. In: Rothstein HR, Sutton AJ, Borenstein M(eds) Publication bias in meta-analysis: prevention, assessment andadjustments. Wiley, Chichester, pp 175–192
15. Light R, Pillemer D (1984) Summing up: the science of reviewingresearch. Harvard University Press, Cambridge
16. Begg CB, Mazumdar M (1994) Operating characteristics of a rankcorrelation test for publication bias. Biometrics 50:1088–1101
17. Duval S, Tweedie R (2000) Trim and fill: a simple funnel-plot-basedmethod of testing and adjusting for publication bias in meta-analysis.Biometrics 56:455–463
18. Borenstein M (2005) Software for publication bias. In: Rothstein H,Sutton AJ, Borenstein M (eds) Publication bias in meta-analysis:prevention, assessment and adjustments. Wiley, Chichester, pp391–403
19. Peters JL, Sutton AJ, Jones DR, Abrams KR, Rushton L (2008)Contour-enhanced meta-analysis funnel plots help distinguish publi-cation bias from other causes of asymmetry. J Clin Epidemiol 61:991–996
20. Palmer TM, Peters JL, Sutton AJ, Moreno SG (2008) Contour-enhanced funnel plots for meta-analysis. Stata J 8:242–254
21. Moreno SG, Sutton AJ, Turner EH, Abrams KR, Cooper NJ, PalmerTM, Ades AE (2009) Novel methods to deal with publication biases:secondary analysis of antidepressant trials in the FDA trial registrydatabase and related journal publications. BMJ 339:b2981
22. Sterne JAC, Egger M, Moher D (2011) Addressing reporting biases.In: Higgins JP, Green S (eds) Cochrane handbook for systematicreviews of interventions 4.2.6 [updated September 2006]. http://www.cochrane.org/resources/handbook/hbook.htm. Accessed 20Mar 2013
23. Papageorgiou SN, Papadopoulos MA, Athanasiou AE (2013)Reporting characteristics of meta-analyses in orthodontics: method-ological assessment and statistical recommendations. Eur J Orthod.doi:10.1093/ejo/cjt008
24. Jennions MD, Møller AP (2002) Publication bias in ecology andevolution: an empirical assessment using the 'trim and fill' method.Biol Rev Camb Philos Soc 77:211–222
25. Sutton AJ, Duval SJ, Tweedie RL, Abrams KR, Jones DR (2000)Empirical assessment of effect of publication bias on meta-analyses.BMJ 320:1574–1577
26. Higgins JP, Thompson SG, Deeks JJ, Altman DG (2003) Measuringinconsistency in meta-analyses. BMJ 327:557–560
27. 2010 Journal Citation Reports® Science Edition 2011, ThomsonReuters. http://thomsonreuters.com. Accessed 20 Mar 2013
28. SCImago 2007 SJR—SCImago Journal & Country Rank. http://www.scimagojr.com. Accessed 20 Mar 2013
29. Ioannidis JP, Trikalinos TA (2007) The appropriateness of asymmetrytests for publication bias in meta-analyses: a large survey. CMAJ 176:1091–1096
30. Cuijpers P, Smit F, Bohlmeijer E, Hollon SD, Andersson G (2010)Efficacy of cognitive–behavioural therapy and other psychologicaltreatments for adult depression: meta-analytic study of publicationbias. Br J Psychiatry 196:173–178
31. Al-Jewair TS, Azarpazhooh A, Suri S, Shah PS (2009) Computer-assisted learning in orthodontic education: a systematic review andmeta-analysis. J Dent Educ 73:730–739
32. Antonarakis GS, Kiliaridis S (2008) Maxillary molar distalizationwith noncompliance intramaxillary appliances in class II malocclu-sion. A systematic review. Angle Orthod 78:1133–1140
33. Badovinac RL, Werler MM, Williams PL, Kelsey KT, Hayes C(2007) Folic acid-containing supplement consumption during preg-nancy and risk for oral clefts: a meta-analysis. Birth Defects Res AClin Mol Teratol 79:8–15
34. Derks A, Katsaros C, Frencken JE, van't Hof MA, Kuijpers-JagtmanAM (2004) Caries-inhibiting effect of preventive measures duringorthodontic treatment with fixed appliances. A systematic review.Caries Res 38:413–420
35. Frazão P, Narvai PC, Latorre Mdo R, Castellanos RA (2004) Aresevere occlusal problems more frequent in permanent than deciduousdentition? Rev Saude Publica 38:247–254
36. Fricton J, Look JO, Wright E, Alencar FG Jr, Chen H, Lang M,OuyangW, Velly AM (2010) Systematic review andmeta-analysis ofrandomized controlled trials evaluating intraoral orthopedic appli-ances for temporomandibular disorders. J Orofac Pain 24:237–254
37. Gleitsmann K, Kriz H, Thielke A, Bunker K, Ryan K Lorish K, KingV (2012) Sleep apnea diagnosis and treatment in adults. Center forEvidence-based Policy, Portland
38. Goh YI, Bollano E, Einarson TR, Koren G (2006) Prenatal multivi-tamin supplementation and rates of congenital anomalies: a meta-analysis. J Obstet Gynaecol Can 28:680–689
39. Hackshaw A, Rodeck C, Boniface S (2011) Maternal smoking inpregnancy and birth defects: a systematic review based on 173 687malformed cases and 11.7 million controls. Hum Reprod Update 17:589–604
40. Herkrath AP, Herkrath FJ, Rebelo MA, Vettore MV (2012) Parentalage as a risk factor for non-syndromic oral clefts: a meta-analysis. JDent 40:3–14
41. Jäger A, Braumann B, Kim C, Wahner S (2001) Skeletal and dentaleffects of maxillary protraction in patients with angle class III mal-occlusion. A meta-analysis. J Orofac Orthop 62:275–284
42. Johnson CY, Little J (2008) Folate intake, markers of folate status andoral clefts: is the evidence converging? Int J Epidemiol 37:1041–1058
43. Lim J, Lasserson TJ, Fleetham J, Wright J (2006) Oral appliances forobstructive sleep apnoea. Cochrane Database Syst Rev 1:CD004435
44. Little J, Cardy A, Munger RG (2004) Tobacco smoking and oralclefts: a meta-analysis. Bull World Health Organ 82:213–218
Clin Oral Invest

45. Mattos CT, Vilani GN, Sant'Anna EF, Ruellas AC, Maia LC (2011)Effects of orthognathic surgery on oropharyngeal airway: a meta-analysis. Int J Oral Maxillofac Surg 40:1347–1356
46. Mitchell LE (1997) Transforming growth factor alpha locus andnonsyndromic cleft lip with or without cleft palate: a reappraisal.Genet Epidemiol 14:231–240
47. Nguyen QV, Bezemer PD, Habets L, Prahl-Andersen B (1999) Asystematic review of the relationship between overjet size and trau-matic dental injuries. Eur J Orthod 21:503–515
48. Nieuwenhuijsen MJ, Martinez D, Grellier J, Bennett J, Best N, IszattN, Vrijheid M, Toledano MB (2009) Chlorination disinfection by-products in drinking water and congenital anomalies: review andmeta-analyses. Environ Health Perspect 117:1486–1493
49. Papadopoulos MA, Papageorgiou SN, Zogakis IP (2011) Clinicaleffectiveness of orthodontic miniscrew implants: a meta-analysis. JDent Res 90:969–976
50. Papageorgiou SN, Zogakis IP, Papadopoulos MA (2012) Failurerates and associated risk factors of orthodontic miniscrew implants:a meta-analysis. Am J Orthod Dentofac Orthop 142:577–595, e7
51. Perillo L, Cannavale R, Ferro F, Franchi L, Masucci C, Chiodini P,Baccetti T (2011) Meta-analysis of skeletal mandibular changesduring Frankel appliance treatment. Eur J Orthod 33:84–92
52. Polder BJ, Van't Hof MA, Van der Linden FP, Kuijpers-Jagtman AM(2004) A meta-analysis of the prevalence of dental agenesis ofpermanent teeth. Community Dent Oral Epidemiol 32:217–226
53. Romitti PA, Herring AM, Dennis LK, Wong-Gibbons DL (2007)Meta-analysis: pesticides and orofacial clefts. Cleft Palate Craniofac J44:358–365
54. Verkleij-Hagoort A, Bliek J, Sayed-Tabatabaei F, UrsemN, Steegers E,Steegers-Theunissen R (2007) Hyperhomocysteinemia and MTHFRpolymorphisms in association with orofacial clefts and congenital heartdefects: a meta-analysis. Am J Med Genet A 143A:952–960
55. Vieira AR, Orioli IM,Murray JC (2002)Maternal age and oral clefts:a reappraisal. Oral Surg Oral Med Oral Pathol Oral Radiol Endod 94:530–535
56. Weinberg SM, Maher BS, Marazita ML (2006) Parental craniofacialmorphology in cleft lip with or without cleft palate as determined bycephalometry: a meta-analysis. Orthod Craniofac Res 9:18–30
57. Wyszynski DF, Duffy DL, Beaty TH (1997) Maternal cigarettesmoking and oral clefts: a meta-analysis. Cleft Palate Craniofac J34:206–210
58. Papageorgiou SN, Papadopoulos MA, Athanasiou AE (2011)Evaluation of methodology and quality characteristics of systematicreviews in orthodontics. Orthod Craniofac Res 14:116–137
59. Sterne JA, Egger M (2001) Funnel plots for detecting bias in meta-analysis: guidelines on choice of axis. J Clin Epidemiol 54:1046–1055
60. Terrin N, Schmid CH, Lau J (2005) In an empirical evaluation of thefunnel plot, researchers could not visually identify publication bias. JClin Epidemiol 58:894–901
61. Kjaergard LL, Villumsen J, Gluud C (2001) Reported methodologicquality and discrepancies between large and small randomized trialsin meta-analyses. Ann Intern Med 135:982–989
62. Shang A, Huwiler-Muntener K, Nartey L, Juni P, Dorig S, Sterne JA,Pewsner D, Egger M (2005) Are the clinical effects of homoeopathyplacebo effects? Comparative study of placebo-controlled trials ofhomoeopathy and allopathy. Lancet 366:726–732
63. Souza JP, Pileggi C, Cecatti JG (2007) Assessment of funnel plotasymmetry and publication bias in reproductive health meta-analyses: an analytic survey. Reprod Health 4:3
64. Higgins JP, Green S (eds) Cochrane handbook for systematic reviewsof interventions 4.2.6 [updated September 2006]. http://www.cochrane.org/resources/handbook/hbook.htm. Accessed 20 Mar 2013
65. Sterne JA, Sutton AJ, Ioannidis JP, Terrin N, Jones DR, Lau J,Carpenter J, Rücker G, Harbord RM, Schmid CH, Tetzlaff J, DeeksJJ, Peters J, Macaskill P, Schwarzer G, Duval S, Altman DG, MoherD, Higgins JP (2011) Recommendations for examining andinterpreting funnel plot asymmetry in meta-analyses of randomisedcontrolled trials. BMJ 343:d4002
66. Furukawa TA, Watanabe N, Omori IM, Montori VM, Guyatt GH(2007) Association between unreported outcomes and effect sizeestimates in Cochrane meta-analyses. JAMA 297:468–470
67. Tang JL, Liu JL (2000)Misleading funnel plot for detection of bias inmeta-analysis. J Clin Epidemiol 53:477–484
68. Moreno SG, Sutton AJ, Ades AE, Cooper NJ, Abrams KR (2011)Adjusting for publication biases across similar interventions per-formed well when compared with gold standard data. J ClinEpidemiol 64:1230–1241
69. Rücker G, Schwarzer G, Carpenter JR, Binder H, Schumacher M(2011) Treatment-effect estimates adjusted for small-study effects viaa limit meta-analysis. Biostatistics 12:122–142
70. Harbord RM, Egger M, Sterne JA (2006) A modified test for small-study effects in meta-analyses of controlled trials with binary end-points. Stat Med 25:3443–3457
71. Moreno SG, Sutton AJ, Thompson JR, Ades AE, Abrams KR,Cooper NJ (2012) A generalized weighting regression-derivedmeta-analysis estimator robust to small-study effects and heteroge-neity. Stat Med 31:1407–1417
72. Copas JB, Shi JQ (2001) A sensitivity analysis for publication bias insystematic reviews. Stat Methods Med Res 10:251–265
73. Schwarzer G, Carpenter J, Rücker G (2010) Empirical evaluationsuggests Copas selectionmodel preferable to trim-and-fill method forselection bias in meta-analysis. J Clin Epidemiol 63:282–288
Clin Oral Invest
0
.1
.2
.3
Stan
dard
err
or
-1 -.5 0 .5 1Effect estimate
Studies
p < 1%
1% < p < 5%
5% < p < 10%
p > 10%
0
0.75
0.25
0.50
Stan
dard
err
or
-2 0 2 4 6 8Effect estimate
Studies
p < 1%
1% < p < 5%
5% < p < 10%
p > 10%
0
0.36
0.18
0.09
0.27
Stan
dard
err
or
-1 -.5 0 .5 1Effect estimate
Studies
p < 1%
1% < p < 5%
5% < p < 10%
p > 10%
0
.46
.3
.2
.1
.4
Stan
dard
err
or
-1 -.5 0 .5 1Effect estimate
Studies
p < 1%
1% < p < 5%
5% < p < 10%
p > 10%
0
0.45
0.30
0.15
Stan
dard
err
or
-1 -.5 0 .5 1 1.5Effect estimate
Studies
p < 1%
1% < p < 5%
5% < p < 10%
p > 10%
0
.2
.4
.6
.8
1
Stan
dard
err
or
-4 -2 0 2 4Effect estimate
Studies
p < 1%
1% < p < 5%
5% < p < 10%
p > 10%
0
0.5
0.3
0.1
Stan
dard
err
or
-2 -1 0 1 2Effect estimate
Studies
p < 1%
1% < p < 5%
5% < p < 10%
p > 10%
0
.76
.50
.25
Stan
dard
err
or
-2 -1 0 1 2Effect estimate
Studies
p < 1%
1% < p < 5%
5% < p < 10%
p > 10%
0
.5
1
Stan
dard
err
or
-4 -2 0 2 4Effect estimate
Studies
p < 1%
1% < p < 5%
5% < p < 10%
p > 10%
0
1.2
.8
.4
.2
Stan
dard
err
or
-4 -2 0 2 4Effect estimate
Studies
p < 1%
1% < p < 5%
5% < p < 10%
p > 10%
0
.1
.2
.3St
anda
rd e
rror
-1 0 1 2 3Effect estimate
Studies
p < 1%
1% < p < 5%
5% < p < 10%
p > 10%
0
1.2
0.8
0.4
Stan
dard
err
or
3-3 1.5-1.5 0Effect estimate
Studies
p < 1%
1% < p < 5%
5% < p < 10%
p > 10%
0
.7
.6
.4
.2
Stan
dard
err
or
-2 -1 0 1 2Effect estimate
Studies
p < 1%
1% < p < 5%
5% < p < 10%
p > 10%
A B C D
I J K L
E F G H
0
0.34
0.17
0.08
0.25
Stan
dard
err
or
-1 -.5 0 .5 1 1.5Effect estimate
Studies
p < 1%
1% < p < 5%
5% < p < 10%
p > 10%
0
.1
.2
.3
.4
Stan
dard
err
or
-1 -.5 0 .5 1Effect estimate
Studies
p < 1%
1% < p < 5%
5% < p < 10%
p > 10%
0
.1
.2
.3
.4
Stan
dard
err
or
-2 -1 0 1 2Effect estimate
Studies
p < 1%
1% < p < 5%
5% < p < 10%
p > 10%
M N O P
0
1.8
1.5
1
.5
Stan
dard
err
or
-5 0 5Effect estimate
Studies
p < 1%
1% < p < 5%
5% < p < 10%
p > 10%
0
.1
.2
.3
.4
.5
Stan
dard
err
or
-2 -1 0 1 2Effect estimate
Studies
p < 1%
1% < p < 5%
5% < p < 10%
p > 10%
0
0.2
0.4
0.6
Stan
dard
err
or
-2 -1 0 1 2Effect estimate
Studies
p < 1%
1% < p < 5%
5% < p < 10%
p > 10%
0
.5
1
Stan
dard
err
or
-4 -2 0 2 4 6Effect estimate
Studies
p < 1%
1% < p < 5%
5% < p < 10%
p > 10%
0
1.2
.8
.4
Stan
dard
err
or
3-3 0 1.5-1.5Effect estimate
Studies
p < 1%
1% < p < 5%
5% < p < 10%
p > 10%
0
.17
.15
.10
.05
Stan
dard
err
or
-.5 0 .5 1Effect estimate
Studies
p < 1%
1% < p < 5%
5% < p < 10%
p > 10%
0
.33
.2
.1
Stan
dard
err
or
-1 -.5 0 .5 1Effect estimate
Studies
p < 1%
1% < p < 5%
5% < p < 10%
p > 10%
0
.8
.6
.4
.2
Stan
dard
err
or
-2 -1 0 1 2Effect estimate
Studies
p < 1%
1% < p < 5%
5% < p < 10%
p > 10%
0
.47
.30
.15
Stan
dard
err
or
-1 -.5 0 .5 1Effect estimate
Studies
p < 1%
1% < p < 5%
5% < p < 10%
p > 10%
Q R S T
Y
U V W X
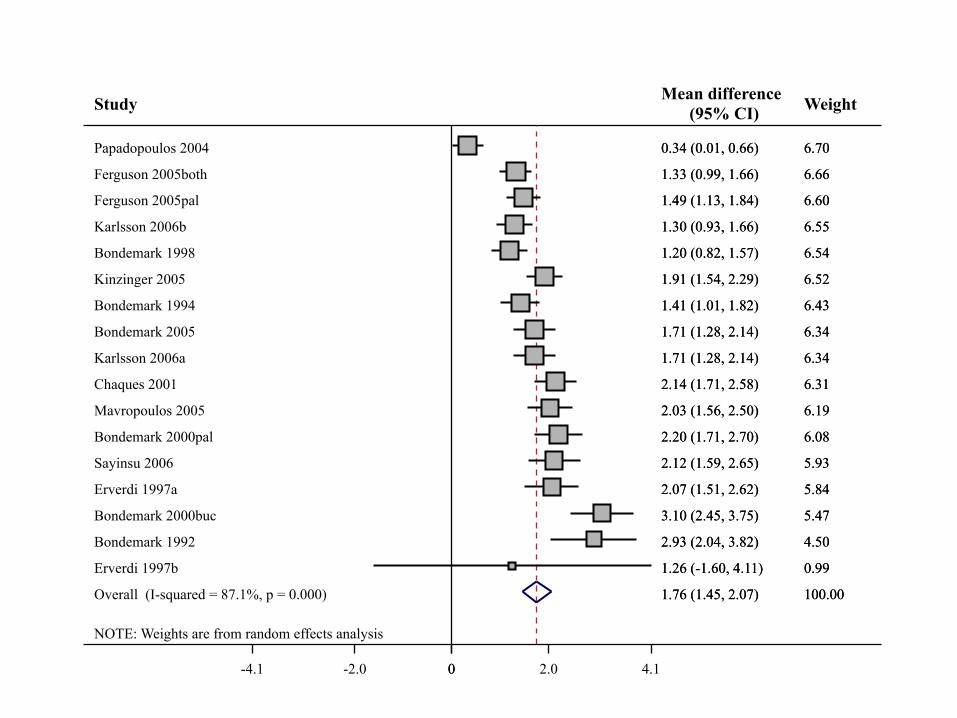
NOTE: Weights are from random effects analysis Overall (I-squared = 87.1%, p = 0.000)
Ferguson 2005both
Erverdi 1997b
Mavropoulos 2005
Papadopoulos 2004
Bondemark 1992
Chaques 2001
Sayinsu 2006 Bondemark 2000pal
Bondemark 2000buc
Bondemark 1998
Karlsson 2006a Bondemark 2005
Ferguson 2005pal
Kinzinger 2005
Study
Bondemark 1994
Erverdi 1997a
Karlsson 2006b
1.76 (1.45, 2.07)
1.33 (0.99, 1.66)
1.26 (-1.60, 4.11)
2.03 (1.56, 2.50)
0.34 (0.01, 0.66)
2.93 (2.04, 3.82)
2.14 (1.71, 2.58)
2.12 (1.59, 2.65) 2.20 (1.71, 2.70)
3.10 (2.45, 3.75)
1.20 (0.82, 1.57)
1.71 (1.28, 2.14) 1.71 (1.28, 2.14)
1.49 (1.13, 1.84)
1.91 (1.54, 2.29)
Mean difference (95% CI)
1.41 (1.01, 1.82)
2.07 (1.51, 2.62)
1.30 (0.93, 1.66)
100.00
6.66
0.99
6.19
6.70
4.50
6.31
5.93 6.08
5.47
6.54
6.34 6.34
6.60
6.52
Weight
6.43
5.84
6.55
1.76 (1.45, 2.07)
1.33 (0.99, 1.66)
1.26 (-1.60, 4.11)
2.03 (1.56, 2.50)
0.34 (0.01, 0.66)
2.93 (2.04, 3.82)
2.14 (1.71, 2.58)
2.12 (1.59, 2.65) 2.20 (1.71, 2.70)
3.10 (2.45, 3.75)
1.20 (0.82, 1.57)
1.71 (1.28, 2.14) 1.71 (1.28, 2.14)
1.49 (1.13, 1.84)
1.91 (1.54, 2.29) 1.41 (1.01, 1.82)
2.07 (1.51, 2.62)
1.30 (0.93, 1.66)
100.00
6.66
0.99
6.19
6.70
4.50
6.31
5.93 6.08
5.47
6.54
6.34 6.34
6.60
6.52 6.43
5.84
6.55
0 -4.1 0 4.1 2.0 -2.0
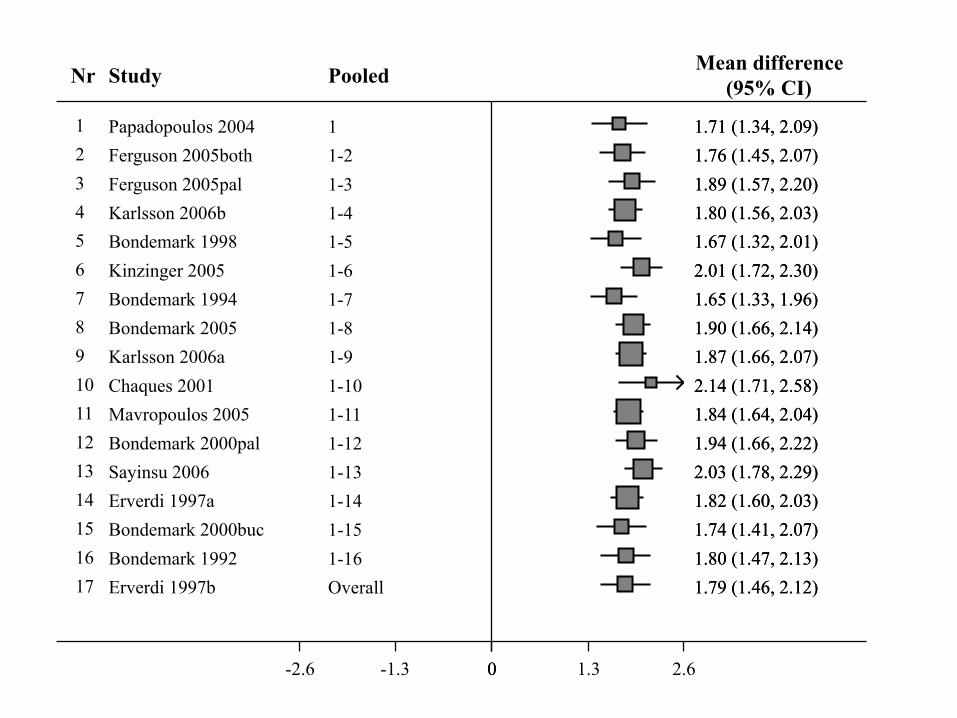
Papadopoulos 2004 Ferguson 2005both Ferguson 2005pal Karlsson 2006b Bondemark 1998 Kinzinger 2005 Bondemark 1994 Bondemark 2005 Karlsson 2006a Chaques 2001 Mavropoulos 2005 Bondemark 2000pal Sayinsu 2006 Erverdi 1997a Bondemark 2000buc Bondemark 1992 Erverdi 1997b
Study
1.71 (1.34, 2.09) 1.76 (1.45, 2.07) 1.89 (1.57, 2.20) 1.80 (1.56, 2.03) 1.67 (1.32, 2.01) 2.01 (1.72, 2.30) 1.65 (1.33, 1.96) 1.90 (1.66, 2.14) 1.87 (1.66, 2.07) 2.14 (1.71, 2.58) 1.84 (1.64, 2.04) 1.94 (1.66, 2.22) 2.03 (1.78, 2.29) 1.82 (1.60, 2.03) 1.74 (1.41, 2.07) 1.80 (1.47, 2.13) 1.79 (1.46, 2.12)
Mean difference (95% CI)
1.71 (1.34, 2.09) 1.76 (1.45, 2.07) 1.89 (1.57, 2.20) 1.80 (1.56, 2.03) 1.67 (1.32, 2.01) 2.01 (1.72, 2.30) 1.65 (1.33, 1.96) 1.90 (1.66, 2.14) 1.87 (1.66, 2.07) 2.14 (1.71, 2.58) 1.84 (1.64, 2.04) 1.94 (1.66, 2.22) 2.03 (1.78, 2.29) 1.82 (1.60, 2.03) 1.74 (1.41, 2.07) 1.80 (1.47, 2.13) 1.79 (1.46, 2.12)
0 -2.6 0 2.6 1.3 -1.3
1 1-2 1-3 1-4 1-5 1-6 1-7 1-8 1-9 1-10 1-11 1-12 1-13 1-14 1-15 1-16 Overall
1 2 3 4 5 6 7 8 9 10 11 12 13 14 15 16 17
Nr Pooled
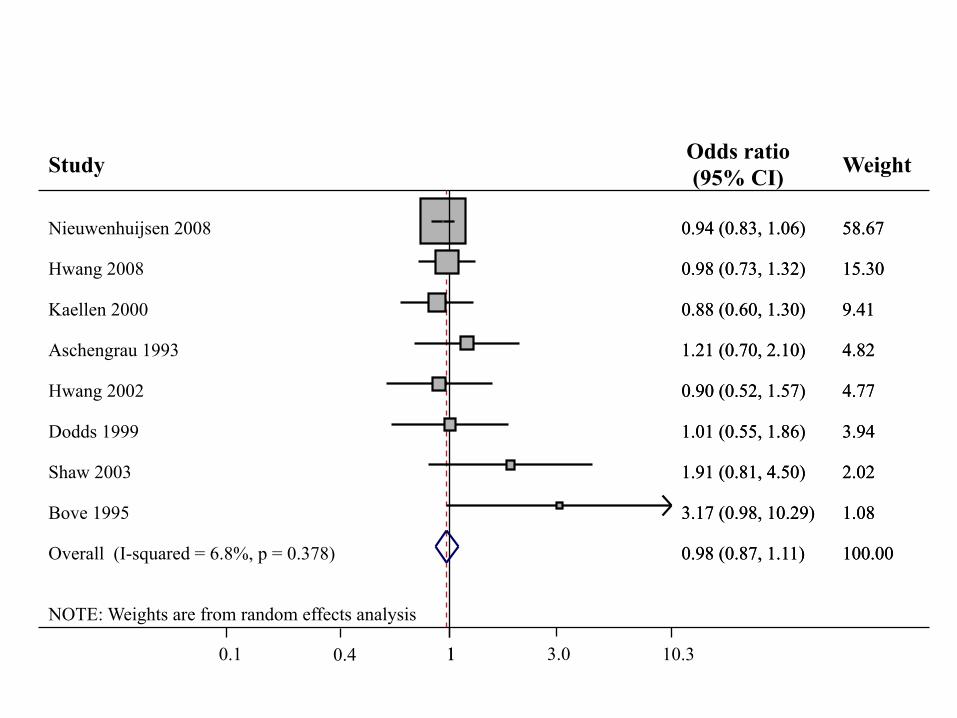
NOTE: Weights are from random effects analysis
Overall (I-squared = 6.8%, p = 0.378)
Shaw 2003
Hwang 2008
Bove 1995
Hwang 2002
Aschengrau 1993
Kaellen 2000
Dodds 1999
Nieuwenhuijsen 2008
Study
0.98 (0.87, 1.11)
1.91 (0.81, 4.50)
0.98 (0.73, 1.32)
3.17 (0.98, 10.29)
0.90 (0.52, 1.57)
1.21 (0.70, 2.10)
0.88 (0.60, 1.30)
1.01 (0.55, 1.86)
0.94 (0.83, 1.06)
Odds ratio (95% CI)
100.00
2.02
15.30
1.08
4.77
4.82
9.41
3.94
58.67
Weight
0.98 (0.87, 1.11)
1.91 (0.81, 4.50)
0.98 (0.73, 1.32)
3.17 (0.98, 10.29)
0.90 (0.52, 1.57)
1.21 (0.70, 2.10)
0.88 (0.60, 1.30)
1.01 (0.55, 1.86)
0.94 (0.83, 1.06)
100.00
2.02
15.30
1.08
4.77
4.82
9.41
3.94
58.67
1 0.1 1 10.3 0.4 3.0
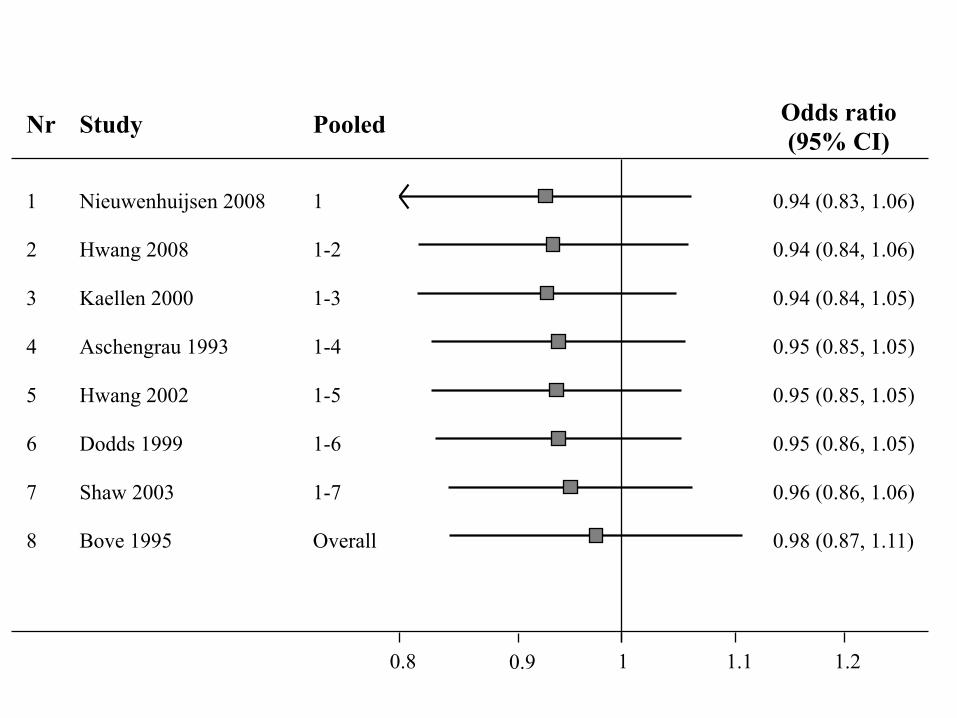
Nieuwenhuijsen 2008 Hwang 2008 Kaellen 2000 Aschengrau 1993 Hwang 2002 Dodds 1999 Shaw 2003 Bove 1995
Study
0.94 (0.83, 1.06) 0.94 (0.84, 1.06) 0.94 (0.84, 1.05) 0.95 (0.85, 1.05) 0.95 (0.85, 1.05) 0.95 (0.86, 1.05) 0.96 (0.86, 1.06) 0.98 (0.87, 1.11)
Odds ratio (95% CI)
1 0.8 1.2 0.9 1.1
1 1-2 1-3 1-4 1-5 1-6 1-7 Overall
Pooled
1 2 3 4 5 6 7 8
Nr


![Almpani K, Papageorgiou SN, Papadopoulos MA. Autotransplantation of teeth in humans - A systematic review and meta-analysis. Clin Oral Investig 2014. [Epub ahead of print]](https://static.fdokumen.com/doc/165x107/63322a5f83bb92fe980447e4/almpani-k-papageorgiou-sn-papadopoulos-ma-autotransplantation-of-teeth-in-humans.jpg)