Pakistan's Ranking in Social Development: Have We ... - CORE
16
Pakistan’s Ranking in Social Development 739 Pakistan’s Ranking in Social Development: Have We Always Been Backward? AISHA GHAUS-PASHA and NAEEM AHMED Consensus is emerging between development thinkers and practitioners that social progress is a necessary pre-condition for sustained economic growth. Social development leads to higher levels of literacy, better health standards and overall improvement in the society’s living conditions. In fact, empirical evidence suggests that there is a two-way relationship between economic growth and social development [Ghaus-Pasha et al. (1998)]. Economic growth leads to higher revenues for government and higher per capita income, encouraging both public and private spendings on human development. Improvements in social indicators feedback as higher economic growth through enhanced productivity for labour and capital. In other words, well-developed human capital makes a significant contribution to economic growth which, in turn, offers improved welfare and better living conditions. However, if there is a breakdown in this chain and economic development is not translated into social development, then the pace of economic development eventually suffers. Pakistan is an example of a country where this chain has broken. Despite moderate economic growth of about 5 percent during the last decade or so, the state of social indicators leaves a lot to be desired. Currently, the female literacy rate is 33 percent, being somewhat higher for males at 56 percent; primary school enrolment for females is 55 percent, for males 78 percent; and infant mortality rate is 105 out of 1000. Today, Pakistan is ranked 138 in the human development index by the UNDP (1999) among 174 countries. The purpose of this paper is to see the state of social development in Pakistan in the international context. A key objective is to see whether the current low level of social indicators is largely a consequence of poor initial conditions or is it due to Aisha Ghaus-Pasha and Naeem Ahmed are Deputy Managing Director and Research Officer respectively at the Social Policy and Development Centre, Karachi. Authors’ Note: The authors acknowledge the comments of Dr Hafiz A. Pasha. Any errors or omissions remain the responsibility of the authors.
-
Upload
khangminh22 -
Category
Documents
-
view
1 -
download
0
Transcript of Pakistan's Ranking in Social Development: Have We ... - CORE

Pakistan’s Ranking in Social Development 739
Pakistan’s Ranking in Social Development: Have We Always Been Backward?
AISHA GHAUS-PASHA and NAEEM AHMED
Consensus is emerging between development thinkers and practitioners that
social progress is a necessary pre-condition for sustained economic growth. Social development leads to higher levels of literacy, better health standards and overall improvement in the society’s living conditions. In fact, empirical evidence suggests that there is a two-way relationship between economic growth and social development [Ghaus-Pasha et al. (1998)]. Economic growth leads to higher revenues for government and higher per capita income, encouraging both public and private spendings on human development. Improvements in social indicators feedback as higher economic growth through enhanced productivity for labour and capital. In other words, well-developed human capital makes a significant contribution to economic growth which, in turn, offers improved welfare and better living conditions.
However, if there is a breakdown in this chain and economic development is not translated into social development, then the pace of economic development eventually suffers. Pakistan is an example of a country where this chain has broken. Despite moderate economic growth of about 5 percent during the last decade or so, the state of social indicators leaves a lot to be desired. Currently, the female literacy rate is 33 percent, being somewhat higher for males at 56 percent; primary school enrolment for females is 55 percent, for males 78 percent; and infant mortality rate is 105 out of 1000. Today, Pakistan is ranked 138 in the human development index by the UNDP (1999) among 174 countries.
The purpose of this paper is to see the state of social development in Pakistan in the international context. A key objective is to see whether the current low level of social indicators is largely a consequence of poor initial conditions or is it due to
Aisha Ghaus-Pasha and Naeem Ahmed are Deputy Managing Director and Research Officer respectively at the Social Policy and Development Centre, Karachi.
Authors’ Note: The authors acknowledge the comments of Dr Hafiz A. Pasha. Any errors or omissions remain the responsibility of the authors.
Pasha and Ahmed 740
relatively low rate of improvement over time in comparison to other countries? For this purpose we analyse the long-term evolution of social development from 1960 to 1995 using international cross-sectional data on a number of indicators. The sample includes developing countries with relatively low per capita income (below $ 400) and relatively large populations (above 8 million) in 1960. Twenty five countries satisfy this criteria: five from South Asia, seven from other parts of Asia, four from Latin America and nine from Africa. Development ranking of these 25 countries has been generated for 1960, 1970, 1980, 1990 and 1995.
The paper is organised as follows: Section 2 of the paper discusses the choice of the indicators included in the analysis. Section 3 describes the choice of technique used for developing the rankings of countries. The resulting rankings are presented in Section 4, while Section 5 describes proxies of social development. Evolution in Pakistan’s ranking is presented in Section 6. Finally, Section 7 summarises the main findings of the paper.
2. CHOICE OF INDICATORS
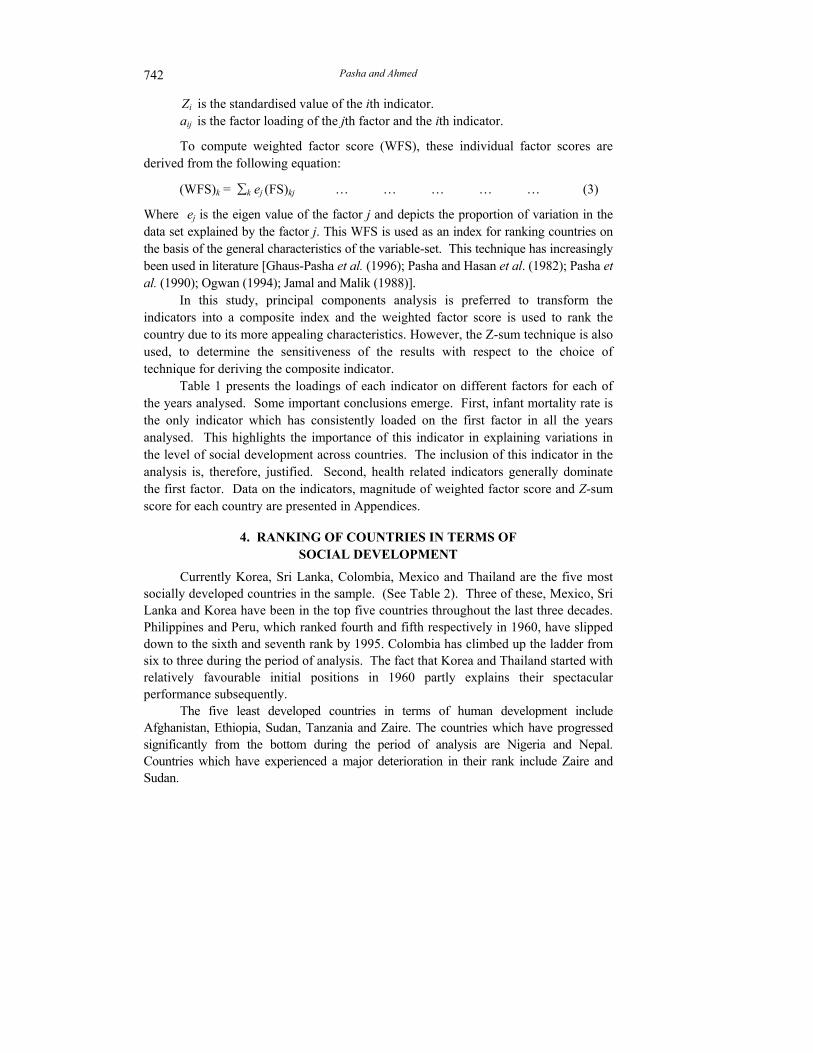
The human development index (HDI), first published in the UNDP report of 1990, relies on three main indicators to measure the extent of human development in a country. These include income, educational attainment (proxied by literacy rate and combined enrolment rate) and life expectancy. HDI is the most widely used composite index of human development. As such, for the purpose of the cross-country analysis in this report we rely on the same output indicators, with one key exception. Instead of just relying on life expectancy at birth to reflect the state of health of the people in a country, we additionally use infant mortality rate.
In the Human Development Report of 1993 it is argued that infant mortality rate is essentially complementary and highly correlated with life expectancy. However, according to our analysis the rank correlation between life expectancy and infant mortality for the sample countries was only 0.64 in 1960 and 0.85 in 1970, reflecting that in the case of developing countries, the high correlation may not necessarily hold. Therefore, we use both infant mortality rate and life expectancy in the analysis.
To cover the level of educational attainment we select three indicators-adult literacy, primary enrolment rate, and secondary enrolment rate. The literacy rate is a stock measure and is fraught with problem of differences in definition among countries. Therefore, we additionally use two flow measures of primary and secondary enrolment rates. GNP per capita adjusted for purchasing power parity differences in US $ is used to construct the income index.
3. CHOICE OF TECHNIQUE
A number of techniques have been used in the relevant literature for measuring and computing a composite index of human development. The first is the Z-sum

Pakistan’s Ranking in Social Development 741
technique which is the sum for a particular country for its Z-score on each indicator. The Z-score is the standardized score, which has zero mean and unit variance. The higher the Z-sum the more developed the country. The second technique computes the taxonomic distance [Noorbakhsh (1998, 1998a)], which is the Euclidean distance from the highest (standardised) values observed for different indicators. The lower the taxonomic distance of a country, the better its position.
The third technique, used for the construction of the HDI, is the unweighted average of the relative distance. This distance is the difference between the actual value of the variable in a country and a minimum value divided by the range of the variable, that is, the difference between the maximum and the minimum values. All three techniques have the problem of assigning equal weight to each development indicator. Further, the taxonomic distance technique is very sensitive to the presence of outliers.
The fourth and the most sophisticated method for indexing a multidimensional phenomenon is the factor analysis (FA) technique [Adelman and Dalton (1971)]. The essential purpose of factor analysis is to describe, if possible, the covariance relationships among many variables in terms of a few underlying, but unobservable, random quantities called factors. Thus the factor analysis model can be described as follows:
Xi = ai1 F1 + ai2 F2 +....+ aij Fj … … … … (1)
Where, Xi is the ith indicator. aij is called the factor loading and represents the proportion of the variation in Xi
which is accounted for by the jth factor. ∑ 2
ija is called the communality and it is equivalent to the multiple regression
coefficient in regression analysis. Fj represents jth factor of component.
Principal Components Analysis (PCA) produces components in descending order of importance, that is, the first component explains the maximum amount of variation in the data, and the last component the minimum. It is often found that the first few components, called principal components, account for a sizeable part of the variation and subsequent components contribute very little. Using factor loadings of these principal components, factor score for each country or unit is computed as follows:
(FS)kj = ∑ k aij * Zi … … … … … … (2)
Where,
FSkj represents factor score of the kth country and the jth factor.
Pasha and Ahmed 742
Zi is the standardised value of the ith indicator. aij is the factor loading of the jth factor and the ith indicator.
To compute weighted factor score (WFS), these individual factor scores are derived from the following equation:
(WFS)k = ∑k ej (FS)kj … … … … … (3)
Where ej is the eigen value of the factor j and depicts the proportion of variation in the data set explained by the factor j. This WFS is used as an index for ranking countries on the basis of the general characteristics of the variable-set. This technique has increasingly been used in literature [Ghaus-Pasha et al. (1996); Pasha and Hasan et al. (1982); Pasha et al. (1990); Ogwan (1994); Jamal and Malik (1988)].
In this study, principal components analysis is preferred to transform the indicators into a composite index and the weighted factor score is used to rank the country due to its more appealing characteristics. However, the Z-sum technique is also used, to determine the sensitiveness of the results with respect to the choice of technique for deriving the composite indicator.
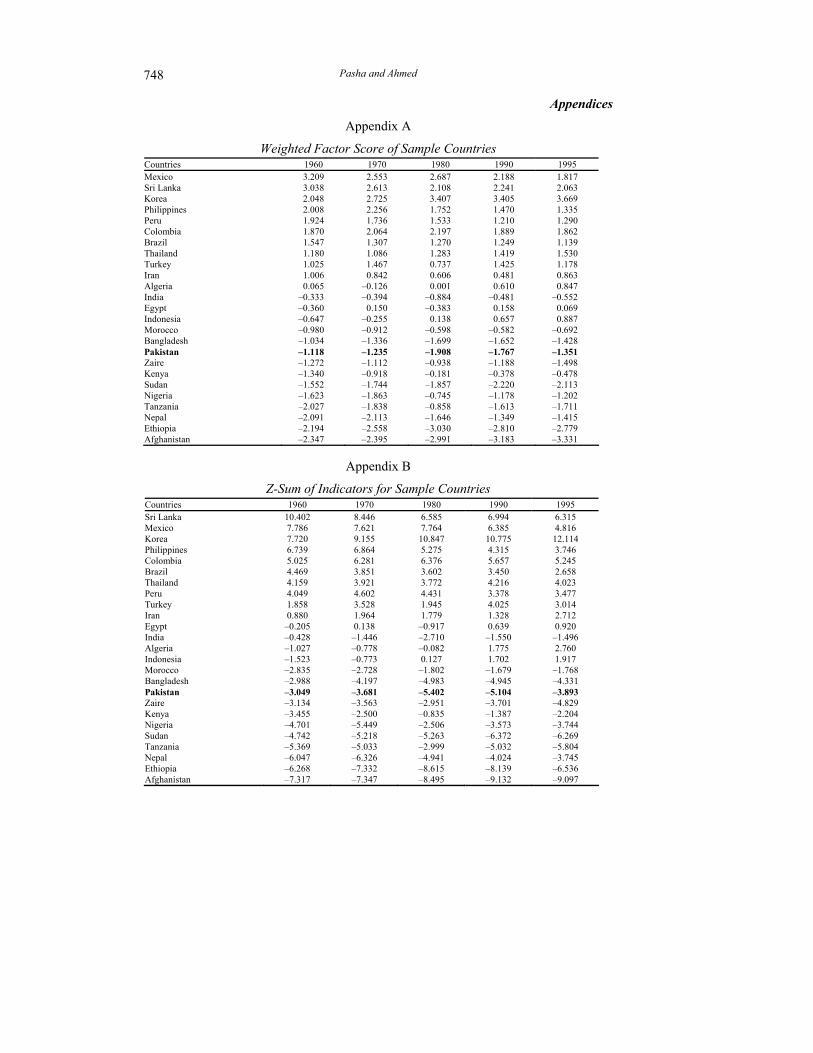
Table 1 presents the loadings of each indicator on different factors for each of the years analysed. Some important conclusions emerge. First, infant mortality rate is the only indicator which has consistently loaded on the first factor in all the years analysed. This highlights the importance of this indicator in explaining variations in the level of social development across countries. The inclusion of this indicator in the analysis is, therefore, justified. Second, health related indicators generally dominate the first factor. Data on the indicators, magnitude of weighted factor score and Z-sum score for each country are presented in Appendices.
4. RANKING OF COUNTRIES IN TERMS OF
SOCIAL DEVELOPMENT
Currently Korea, Sri Lanka, Colombia, Mexico and Thailand are the five most socially developed countries in the sample. (See Table 2). Three of these, Mexico, Sri Lanka and Korea have been in the top five countries throughout the last three decades. Philippines and Peru, which ranked fourth and fifth respectively in 1960, have slipped down to the sixth and seventh rank by 1995. Colombia has climbed up the ladder from six to three during the period of analysis. The fact that Korea and Thailand started with relatively favourable initial positions in 1960 partly explains their spectacular performance subsequently.
The five least developed countries in terms of human development include Afghanistan, Ethiopia, Sudan, Tanzania and Zaire. The countries which have progressed significantly from the bottom during the period of analysis are Nigeria and Nepal. Countries which have experienced a major deterioration in their rank include Zaire and Sudan.

Pakistan’s Ranking in Social Development 743
Table 1
Factor Loading Matrix Variables Factor I Factor II Factor III Communality
[ 1 9 6 0 ] Inverse of Infant Mortality Rate 0.910 0.348 0.024 0.950 Life Expectancy at Birth 0.725 0.426 0.442 0.903 Adult Literacy 0.673 0.618 0.265 0.905 School Enrolment, Secondary 0.328 0.888 0.130 0.914 School Enrolment, Primary 0.544 0.722 0.247 0.879 GNP Per Capita 0.125 0.155 0.973 0.987 Percentage of Variation Explained 71.8 14.2 6.3 Eigen Value 4.308 0.854 0.374
[ 1 9 7 0 ] Inverse of Infant Mortality Rate 0.916 0.139 0.324 0.963 Adult Literacy 0.727 0.424 0.448 0.908 Life Expectancy at Birth 0.674 0.533 0.416 0.911 GNP Per Capita 0.194 0.941 0.204 0.964 School Enrolment, Secondary 0.412 0.215 0.859 0.955 School Enrolment, Primary 0.414 0.556 0.635 0.884 Percentage of Variation Explained 76.5 11 5.6 Eigen Value 4.59 0.66 0.336
[ 1 9 8 0 ] Inverse of Infant Mortality Rate 0.889 0.247 0.292 0.936 School Enrolment, Secondary 0.685 0.536 0.248 0.817 GNP Per Capita 0.247 0.917 0.247 0.963 Life Expectancy at Birth 0.511 0.689 0.415 0.908 School Enrolment, Primary 0.235 0.266 0.909 0.951 Adult Literacy 0.575 0.309 0.657 0.857 Percentage of Variation Explained 73.32 9.45 7.78 Eigen Value 4.399 0.567 0.467
[ 1 9 9 0 ] Inverse of Infant Mortality Rate 0.897 0.262 0.204 0.914 GNP Per Capita 0.651 0.449 0.375 0.767 School Enrolment, Secondary 0.408 0.854 0.197 0.935 Life Expectancy at Birth 0.547 0.612 0.501 0.925 Adult Literacy 0.537 0.160 0.797 0.949 School Enrolment, Primary 0.081 0.648 0.728 0.956 Percentage of Variation Explained 73.88 9.74 7.15 Eigen Value 4.432 0.584 0.429
[ 1 9 9 5 ] School Enrolment, Secondary 0.855 0.388 0.078 0.887 Inverse of Infant Mortality Rate 0.794 0.064 0.490 0.875 GNP Per Capita 0.699 0.283 0.527 0.846 School Enrolment, Primary 0.197 0.920 0.261 0.953 Life Expectancy at Birth 0.566 0.641 0.410 0.899 Adult Literacy 0.270 0.396 0.828 0.916 Percentage of Variation Explained 70.9 11.57 7.13 Eigen Value 4.253 0.694 0.428

Pasha and Ahmed 744
Table 2
Social Development Ranking of Countries, 1960–1995 Ranking by Factor Analysis Countriesa 1960 1970 1980 1990 1995 Mexico Sri Lanka Korea Philippines Peru Colombia Brazil Thailand Turkey Iran Algeria India Egypt Indonesia Morocco Bangladesh Pakistan Zaire Kenya Sudan Nigeria Tanzania Nepal Ethiopia Afghanistan
1 2 3 4 5 6 7 8 9
10 11 12 13 14 15 16 17 18 19 20 21 22 23 24 25
3 2 1 4 6 5 8 9 7
10 12 14 11 13 15 19 18 17 16 20 22 21 23 25 24
2 4 1 5 6 3 8 7 9
10 12 18 14 11 15 21 23 19 13 22 16 17 20 25 24
3 2 1 5 9 4 8 7 6
12 11 15 13 10 16 21 22 18 14 23 17 20 19 24 25
4 2 1 6 7 3 9 5 8
11 12 15 13 10 16 20 18 21 14 23 17 22 19 24 25
aGiven in descending order in 1960.
An interesting result is the robustness of top rankings, countries in the first nine positions in 1960 are the same in 1995. Therefore, one can draw the conclusion that if a country starts with an advantage in human endowment, it is easier to maintain its relative position. Most of the volatility in rankings is observed among countries at lower initial positions.
It appears that the ranking of countries is not sensitive to the choice of technique used for estimation. This is demonstrated by Table 3. There is a very high
Table 3
Correlation of Countries Rankings Obtained from Different Techniques Rank Correlation Coefficient
Years Factor Analysis and Z-Sum Technique
Factor Analysis and HDI
1960 0.911 0.989 1970 0.944 0.980 1980 0.997 0.975 1990 0.988 0.965 1995 0.990 0.936

Pakistan’s Ranking in Social Development 745
correlation ranging from 0.91 to 0.99 between the ranking of countries obtained using factor analysis and Z-sum scores. The robustness of the results is also illustrated by the high degree of correlation (0.936-0.989) between our ranking and the HDI ranking of UNDP. Table 4 presents ranking of countries using Z-sum scores.
Table 4
Social Development Ranking of Countries 1960–95 Ranking by Z-Sum Score Countries 1960 1970 1980 1990 1995 Mexico Sri Lanka Korea Philippines Peru Colombia Brazil Thailand Turkey Iran Algeria India Egypt Indonesia Morocco Bangladesh Pakistan Zaire Kenya Sudan Nigeria Tanzania Nepal Ethiopia Afghanistan
2 1 3 4 8 5 6 7 9
10 13 12 11 14 15 16 17 18 19 21 20 22 23 24 25
3 2 1 4 6 5 8 7 9
10 13 14 11 12 16 19 18 17 15 21 22 20 23 24 25
2 3 1 5 6 4 8 7 9
10 12 17 14 11 15 21 23 18 13 22 16 19 20 25 24
3 2 1 5 9 4 8 6 7
12 10 15 13 11 16 20 22 18 14 23 17 21 19 24 25
4 2 1 6 7 3 11 5 8 10 9 14 13 12 15 20 19 21 16 23 17 22 18 24 25
Presented in descending order according to the weighted factor score in 1960.
5. PROXIES FOR SOCIAL DEVELOPMENT
Variations in the composite human development index across countries are, to a great extent, due to variations in health related indicators—life expectancy and infant mortality rate followed by literacy rate. This is depicted by the high correlation between the composite index and these indicators (see Table 5). This conclusion is in line with the result of Ogwang-Tomson (1994) who suggested that life expectancy is a good proxy for social development. The relatively low value of the GNP per capita coefficient, as compared to health and education, indicates that income is not the best proxy for social development.

Pasha and Ahmed 746
Table 5
Rank Correlation between Composite Social Development Index and Individual Indicators
1960 1970 1980 1990 1995 Life Expectancy at Birth, Total Inverse of Infant Mortality Rate Adult Literacy School Enrolment, Primary School Enrolment, Secondary GNP per Capita
0.873 0.694 0.889 0.889 0.848 0.743
0.941 0.838 0.889 0.910 0.867 0.808
0.922 0.895 0.894 0.821 0.864 0.833
0.959 0.938 0.887 0.829 0.838 0.858
0.937 0.936 0.882 0.780 0.736 0.868
6. EVOLUTION OF PAKISTAN’S RANKING
We next turn to the key question raised in this report. Is the low level of human development in the country due to the low initial endowments or has the condition exacerbated due to a relatively low rate of improvement overtime? Table 6 provides a clear answer to the question. Pakistan was relatively backward in 1960 with a ranking of 17. This ranking deteriorated further to 18 in 1970 and to 23 in 1980. Since then there has been some improvement with the ranking falling to 22 in 1990 and 18 in 1995. It appears that the Pakistani case is one of poorer initial conditions (in 1960) which have been clearly exacerbated by a low rate of improvement since then. In fact, our ranking in the international scenario has actually deteriorated over the period of analysis.
It appears that over the period Pakistan has maintained a fairly stable ranking as far as income is concerned. In all other indicators its ranking has deteriorated .The maximum decline has been in secondary school enrolment, infant mortality rate and adult literacy rate. The improvement in the aggregate ranking in the 90s appears to be a consequence of improvement in enrolment indicators, both primary and secondary, and life expectancy at birth.
Table 6
Pakistan’s Ranking in Individual Indicators 1960 to 1995 Ranking
Indicators 1960 1970 1980 1990 1995 Infant Mortality Rate 15 17 21 20 21 Life Expectancy at Birth 14 15 17 17 15 Adul Literacy Rate 17 20 22 21 22 School Enrolment, Primary 20 19 23 23 20 School Enrolment, Secondary 11 14 22 21 19 GNP per Capita (in PPP$) 15 14 14 15 15 Overall Social Development Ranking 17 18 23 22 18
Pakistan’s Ranking in Social Development 747
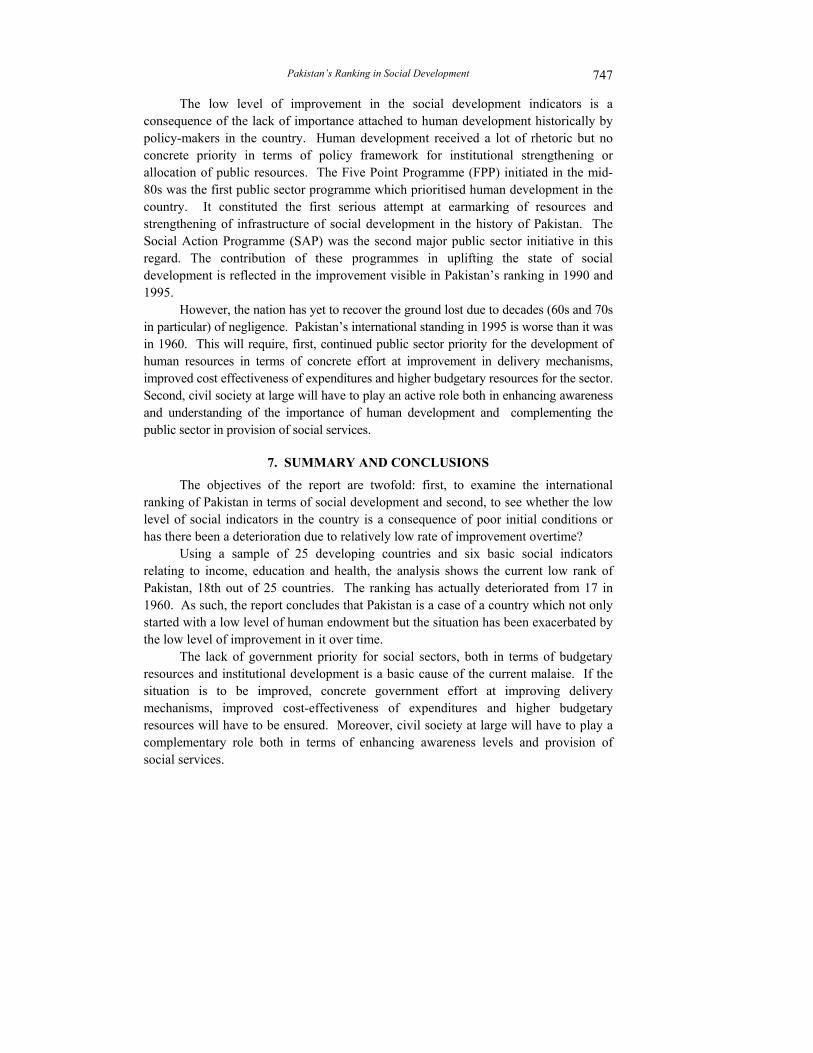
The low level of improvement in the social development indicators is a consequence of the lack of importance attached to human development historically by policy-makers in the country. Human development received a lot of rhetoric but no concrete priority in terms of policy framework for institutional strengthening or allocation of public resources. The Five Point Programme (FPP) initiated in the mid-80s was the first public sector programme which prioritised human development in the country. It constituted the first serious attempt at earmarking of resources and strengthening of infrastructure of social development in the history of Pakistan. The Social Action Programme (SAP) was the second major public sector initiative in this regard. The contribution of these programmes in uplifting the state of social development is reflected in the improvement visible in Pakistan’s ranking in 1990 and 1995.
However, the nation has yet to recover the ground lost due to decades (60s and 70s in particular) of negligence. Pakistan’s international standing in 1995 is worse than it was in 1960. This will require, first, continued public sector priority for the development of human resources in terms of concrete effort at improvement in delivery mechanisms, improved cost effectiveness of expenditures and higher budgetary resources for the sector. Second, civil society at large will have to play an active role both in enhancing awareness and understanding of the importance of human development and complementing the public sector in provision of social services.
7. SUMMARY AND CONCLUSIONS
The objectives of the report are twofold: first, to examine the international ranking of Pakistan in terms of social development and second, to see whether the low level of social indicators in the country is a consequence of poor initial conditions or has there been a deterioration due to relatively low rate of improvement overtime?
Using a sample of 25 developing countries and six basic social indicators relating to income, education and health, the analysis shows the current low rank of Pakistan, 18th out of 25 countries. The ranking has actually deteriorated from 17 in 1960. As such, the report concludes that Pakistan is a case of a country which not only started with a low level of human endowment but the situation has been exacerbated by the low level of improvement in it over time.
The lack of government priority for social sectors, both in terms of budgetary resources and institutional development is a basic cause of the current malaise. If the situation is to be improved, concrete government effort at improving delivery mechanisms, improved cost-effectiveness of expenditures and higher budgetary resources will have to be ensured. Moreover, civil society at large will have to play a complementary role both in terms of enhancing awareness levels and provision of social services.
Pasha and Ahmed 748
Appendices Appendix A
Weighted Factor Score of Sample Countries Countries 1960 1970 1980 1990 1995 Mexico 3.209 2.553 2.687 2.188 1.817 Sri Lanka 3.038 2.613 2.108 2.241 2.063 Korea 2.048 2.725 3.407 3.405 3.669 Philippines 2.008 2.256 1.752 1.470 1.335 Peru 1.924 1.736 1.533 1.210 1.290 Colombia 1.870 2.064 2.197 1.889 1.862 Brazil 1.547 1.307 1.270 1.249 1.139 Thailand 1.180 1.086 1.283 1.419 1.530 Turkey 1.025 1.467 0.737 1.425 1.178 Iran 1.006 0.842 0.606 0.481 0.863 Algeria 0.065 –0.126 0.001 0.610 0.847 India –0.333 –0.394 –0.884 –0.481 –0.552 Egypt –0.360 0.150 –0.383 0.158 0.069 Indonesia –0.647 –0.255 0.138 0.657 0.887 Morocco –0.980 –0.912 –0.598 –0.582 –0.692 Bangladesh –1.034 –1.336 –1.699 –1.652 –1.428 Pakistan –1.118 –1.235 –1.908 –1.767 –1.351 Zaire –1.272 –1.112 –0.938 –1.188 –1.498 Kenya –1.340 –0.918 –0.181 –0.378 –0.478 Sudan –1.552 –1.744 –1.857 –2.220 –2.113 Nigeria –1.623 –1.863 –0.745 –1.178 –1.202 Tanzania –2.027 –1.838 –0.858 –1.613 –1.711 Nepal –2.091 –2.113 –1.646 –1.349 –1.415 Ethiopia –2.194 –2.558 –3.030 –2.810 –2.779 Afghanistan –2.347 –2.395 –2.991 –3.183 –3.331
Appendix B
Z-Sum of Indicators for Sample Countries Countries 1960 1970 1980 1990 1995 Sri Lanka 10.402 8.446 6.585 6.994 6.315 Mexico 7.786 7.621 7.764 6.385 4.816 Korea 7.720 9.155 10.847 10.775 12.114 Philippines 6.739 6.864 5.275 4.315 3.746 Colombia 5.025 6.281 6.376 5.657 5.245 Brazil 4.469 3.851 3.602 3.450 2.658 Thailand 4.159 3.921 3.772 4.216 4.023 Peru 4.049 4.602 4.431 3.378 3.477 Turkey 1.858 3.528 1.945 4.025 3.014 Iran 0.880 1.964 1.779 1.328 2.712 Egypt –0.205 0.138 –0.917 0.639 0.920 India –0.428 –1.446 –2.710 –1.550 –1.496 Algeria –1.027 –0.778 –0.082 1.775 2.760 Indonesia –1.523 –0.773 0.127 1.702 1.917 Morocco –2.835 –2.728 –1.802 –1.679 –1.768 Bangladesh –2.988 –4.197 –4.983 –4.945 –4.331 Pakistan –3.049 –3.681 –5.402 –5.104 –3.893 Zaire –3.134 –3.563 –2.951 –3.701 –4.829 Kenya –3.455 –2.500 –0.835 –1.387 –2.204 Nigeria –4.701 –5.449 –2.506 –3.573 –3.744 Sudan –4.742 –5.218 –5.263 –6.372 –6.269 Tanzania –5.369 –5.033 –2.999 –5.032 –5.804 Nepal –6.047 –6.326 –4.941 –4.024 –3.745 Ethiopia –6.268 –7.332 –8.615 –8.139 –6.536 Afghanistan –7.317 –7.347 –8.495 –9.132 –9.097

Pakistan’s Ranking in Social Development 749
Appendix C
Literacy Rate in Sample Countries Countries 1960 1970 1980 1990 1995 Mexico 65.4 74.2 82.7 87.3 89.6 Sri Lanka 75.0 77.6 85.0 88.4 90.2 Korea 70.0 87.6 93.0 93.0 98.0 Philippines 71.9 82.6 86.2 89.7 94.6 Peru 61.0 70.4 80.0 85.1 88.7 Colombia 63.0 75.9 81.0 86.7 91.3 Brazil 61.0 66.2 76.0 81.1 83.3 Thailand 67.7 78.6 86.0 93.0 93.8 Turkey 38.0 51.3 60.0 80.7 82.3 Iran 16.0 36.9 50.0 54.0 72.1 Algeria 13.4 26.4 35.0 57.4 61.6 India 27.8 34.1 36.0 48.2 52.0 Egypt 25.8 33.0 44.0 48.4 51.4 Indonesia 39.0 56.6 65.5 77.0 83.8 Morocco 13.8 21.4 28.0 49.5 43.7 Bangladesh 21.6 23.0 27.9 35.3 38.1 Pakistan 15.4 20.7 24.0 34.8 37.8 Zaire 31.3 13.0 54.5 72.0 67.0 Kenya 19.5 30.0 47.1 69.0 78.1 Sudan 13.1 16.6 32.0 27.1 46.1 Nigeria 15.4 21.9 34.0 50.7 57.1 Tanzania 9.5 37.4 79.0 72.1 67.8 Nepal 8.8 14.3 19.0 25.6 27.5 Ethiopia 6.0 9.4 15.0 29.4 35.5 Afghanistan 8.0 10.0 20.0 29.4 31.5
Secondary School Enrolment in Sample Countries (%) Mexico 11 22 48 55 58 Sri Lanka 27 47 55 74 75 Korea 25 42 78 90 101 Philippines 26 46 64 73 79 Peru 15 31 59 67 70 Colombia 12 25 41 55 66 Brazil 11 26 34 39 45 Thailand 13 17 29 30 55 Turkey 14 27 35 54 56 Iran 12 27 42 54 69 Algeria 8 11 33 61 62 India 20 26 30 44 49 Egypt 16 35 50 76 74 Indonesia 6 16 29 44 48 Morocco 5 13 26 34 39 Bangladesh 8 13 18 19 19 Pakistan 11 13 14 21 26 Zaire 3 9 24 24 26 Kenya 2 9 20 23 24 Sudan 3 7 16 23 13 Nigeria 4 4 21 24 30 Tanzania 2 3 3 5 5 Nepal 6 10 21 31 38 Ethiopia 0 4 8 13 31 Afghanistan 1 7 10 9 21
Continued—

Pasha and Ahmed 750
Appendix C (Continued—)
Primary School Enrolment in Sample Countries (%) 1960 1970 1980 1990 1995
Mexico 80 104 122 115 115 Sri Lanka 95 99 103 105 113 Korea 94 103 110 105 101 Philippines 95 108 113 113 114 Peru 83 107 114 118 123 Colombia 77 108 124 110 114 Brazil 95 84 99 109 112 Thailand 83 83 99 99 87 Turkey 75 110 96 110 105 Iran 41 72 87 110 99 Algeria 46 76 94 100 107 India 61 73 83 98 100 Egypt 66 72 73 94 100 Indonesia 71 80 107 115 114 Morocco 47 52 83 67 83 Bangladesh 47 52 63 79 92 Pakistan 30 40 39 44 74 Zaire 60 88 92 70 72 Kenya 47 58 115 95 85 Sudan 25 38 50 50 54 Nigeria 36 37 119 86 89 Tanzania 25 34 93 70 67 Nepal 10 26 84 103 110 Ethiopia 7 16 34 31 67 Afghanistan 9 28 34 26.4 34.5
Life Expectancy in Sample Countries (Years) Mexico 57.0 61.9 66.7 70.0 71.5 Sri Lanka 62.0 65.6 68.1 71.0 74.9 Korea 54.4 62.2 66.8 71.0 75.5 Philippines 52.8 58.8 61.0 64.0 67.7 Peru 47.5 53.9 58.0 63.0 65.9 Colombia 53.1 61.0 65.9 68.9 69.9 Brazil 54.7 59.1 62.7 66.0 67.0 Thailand 52.3 60.5 63.5 66.0 71.7 Turkey 50.5 58.6 61.4 67.0 70.9 Iran 49.6 54.5 60.1 63.0 69.2 Algeria 47.0 53.3 59.3 65.0 69.6 India 43.2 48.5 54.4 59.0 63.0 Egypt 43.1 51.3 55.5 60.0 66.3 Indonesia 41.2 47.3 54.8 62.0 66.0 Morocco 46.7 51.9 58.0 62.0 65.4 Bangladesh 37.3 41.6 48.5 52.0 58.4 Pakistan 43.3 49.3 53.0 56.0 64.1 Zaire 40.0 46.8 49.2 52.0 53.0 Kenya 41.3 52.0 54.9 59.0 60.2 Sudan 39.6 44.3 48.2 50.0 54.8 Nigeria 38.7 44.5 47.7 52.0 53.9 Tanzania 41.7 45.5 49.0 48.0 50.9 Nepal 37.6 41.7 47.3 52.0 55.9 Ethiopia 43.7 43.3 43.5 48.0 49.0 Afghanistan 33.4 37.2 40.3 42.0 44.3
Continued—

Pakistan’s Ranking in Social Development 751
Appendix C (Continued—)
GNP Per Capita, in Sample Countries (in PPP$) Countries 1960 1970 1980 1990 1995 Mexico 2160 2980 4112 5918 6769 Sri Lanka 970 1282 1696 2405 3408 Korea 690 1465 3110 6733 11594 Philippines 870 1206 1671 2303 2762 Peru 1720 2118 2608 2622 3940 Colombia 1340 1946 2827 4237 6347 Brazil 990 1716 2975 4718 5928 Thailand 690 1204 2101 3986 7742 Turkey 1260 1886 2824 4652 5516 Iran 1840 2329 2948 3253 5480 Algeria 1300 1635 2056 3011 5618 India 530 633 755 1072 1422 Egypt 500 810 1312 1988 3829 Indonesia 490 783 1251 2181 3971 Morocco 540 917 1558 2348 3477 Bangladesh 760 908 1084 872 1382 Pakistan 560 848 1284 1862 2209 Zaire 310 348 392 367 355 Kenya 470 618 812 1058 1438 Sudan 670 765 873 949 1110 Nigeria 550 688 861 1215 1270 Tanzania 210 300 429 572 636 Nepal 480 568 673 920 1145 Ethiopia 290 310 332 369 455 Afghanistan 670 684 698 714 700
Infant Mortality in Sample Countries (Per 1,000) Mexico 91.1 73.6 51.0 39.0 32.6 Sri Lanka 70.6 58.5 34.4 19.0 15.6 Korea 78.3 50.1 25.8 17.0 9.8 Philippines 105.8 75.0 52.2 41.0 38.8 Peru 162.9 119.7 81.0 69.0 46.7 Colombia 103.0 77.0 45.2 29.9 25.6 Brazil 118.2 98.6 70.0 57.0 44.0 Thailand 103.0 74.6 48.8 27.0 34.8 Turkey 189.5 147.5 109.2 66.0 47.6 Iran 163.0 136.2 91.6 88.0 45.2 Algeria 165.0 144.0 97.6 67.0 33.5 India 165.0 139.0 116.4 92.0 67.7 Egypt 128.0 117.1 107.1 66.0 55.6 Indonesia 149.9 120.9 90.0 61.0 51.0 Morocco 160.5 136.4 99.2 67.0 54.6 Bangladesh 159.0 150.3 131.6 105.0 78.8 Pakistan 161.5 143.0 124.0 103.0 90.0 Zaire 150.0 132.0 111.0 94.0 128.0 Kenya 137.5 112.0 72.4 67.0 58.0 Sudan 168.0 150.4 94.0 102.0 76.6 Nigeria 183.4 158.0 99.4 98.0 79.8 Tanzania 151.5 125.3 104.0 115.0 82.4 Nepal 194.5 172.5 131.8 121.0 91.2 Ethiopia 175.0 158.5 155.0 132.0 111.8 Afghanistan 233.4 210.9 183.0 170.2 157.6

Pasha and Ahmed 752
REFERENCES
Adelman, I., and G. Dalton (1971) A Factor Analysis of Modernisation in Village India. Economic Journal 81:323S.
Jamal, Haroon, and Salman Malik (1988) Shifting Patterns in Development Rank Orderning: A Case Study of the Districts of Sindh Province. The Pakistan Development Review 27:2.
Pasha , Hafiz A., and Tariq Hasan (1982) Development Ranking of the Districts of Pakistan. Pakistan Journal of Applied Economics 1:2.
Pasha, Hafiz A., Salman Malik, and Haroon Jamal (1990) The Changing Profile of Regional Development in Pakistan. Pakistan Journal of Applied Economics 9:1.
Noorbakhsh, Farhad (1998) A Modified Human Development Index. World Development 26:3 517–528.
Noorbakhsh, Farhad (1998a) The Human Development Index: Some Technological Issues and Alternative Indices. Journal of International Development. 10:5 589–605.
Ogwang-Tomson (1994) The Choice of Principle Variables for Computing the Human Development Index. World Development 22:12 2011–14.
Ghaus-Pasha, Aisha, et al. (1996) Social Development Ranking of Districts of Pakistan. Social Policy and Development Centre, Karachi. (Research Report No. 10.)
Ghaus-Pasha, Aisha, et al. (1998) Social Development in Pakistan, Annual Review. Karachi: Social Policy and Development Centre.
UNDP (1991, 1993, 1998) Human Development Report. Washington, D. C.: UNDP.

Comments
The paper by Ghaus-Pasha, Pasha and Ahmed deals with the critical issue of social development ranking of Pakistan relative to selected developing countries. The objective of the paper is to examine the issue whether the current low level of social indicators is a consequence of poor initial conditions or is it due to low rate of improvement relative to other countries? The authors select income, educational attainment, life expectancy and infant mortality rate as indicators of social development. Factor analysis technique is applied to construct index of social development for a sample of 25 countries with per capita income below US$ 400 and population above 8-million in 1960. The results of the study show that Pakistan ranked 17 among the sample of 25 countries in 1960s but it was 23 and 18 out of 25 in 1980s and 1995 respectively. According to the authors, lack of government priority for social sectors is the major cause for the deterioration in social ranking of Pakistan. The study concludes by saying that, “if the situation is to be improved, concrete government effort at improving delivery mechanisms, improved cost-effectiveness of expenditure and higher budgetary resources will have to be ensured. Moreover, civil society at large will have to play a complementary role, both in terms of enhancing awareness levels and provision of social services”.
I agree with this conclusion, however, this is a general statement not a result based on the analysis conducted in the study. Furthermore, my other comments are as follows:
(1) The principal component technique orders the components on the basis of variance not in the order of importance as claimed by the authors.
(2) The problem of interpretation of different factor components are well documented.
(3) The factor loading matrix reported in Table 1 shows that the variables included in each factor changed over time. For example, in 1960s and 1970s, factor 1 did not include GDP-per capita but for 1980s and 1990s it is an important component of factor 1. Similarly, literacy was major component in factor 1 in 1960s and 1970s only. This creates not only the problem of interpretation but also the problem of comparability of the same factor over time.
(4) The role of the initial conditions is not discussed in detail. (5) Emphasis on the role of public sector seems to assume that only the supply
constraints are affecting literacy and education. The role of demand factors in ignored.

Rehana Siddiqui 754
(6) Ranking of a country gives it relative position. The country may have made significant progress in absolute terms. For example, the tables in Appendix C show significant improvements in health related indicators while the overall social development index shows deterioration in Pakistan’s ranking.
Despite these problems the study indicates that overall situation regarding social development in Pakistan needs urgent policy actions as it is a prerequisite for economic growth and for improving population welfare.
Rehana Siddiqui Pakistan Institute of Development Economics, Islamabad.