1. Autopsy Study of Sudden Death in Younger Aged People of Central Gujarat

Supplementary webappendixThis webappendix formed part of the original submission and has been peer reviewed.
Supplement to: GHME Conference Organizing Committee. Shared innovations in measurement and evaluation. Lancet 2011; published online March 14. DOI:10.1016/S0140-6736(11)60169-4.
I
Comment 1 Shared innovations in measurement and evaluation GHME Conference Organizing Committee
Abstracts3 Effective intervention coverage in Zambia:
the heterogeneous picture T Achoki and others
4 Heterogeneity of cause of death data S Y Ahn and others
5 Reduction of inequalities in child mortality through maternal education: an individual-level analysis
M R Alvarado and others
6 Hungering for survival: trends and inequalities in global under-5 malnutrition
K G Andrews and others
7 An innovative tool for linking routine health information system (RHIS) and health system performance
A Aqil and others
8 Tracking global trends in contraceptive security: Contraceptive Security Index 2003–09
D Aronovich and others
9 Costs and effects of a multifaceted intervention to improve the quality of care of children in district hospitals in Kenya
E W Barasa and others
10 Estimation of the burden of disease attributable to mental disorders
A Baxter and others
11 Evaluation of the association between vector control coverage, climate variability, and the spatial distribution of malaria at three periods in Zambia
A Bennett and others
12 Priority cost-effective lessons for systems strengthening in South Africa (PRICELESS-SA): an example of strengthening in-country collaborations and capacity
M Y Bertram and others
13 Estimates of the regional burden of non-fatal injuries in sub-Saharan Africa based on local data sources and new methods
K Bhalla and others
14 The global burden of malaria mortality J Blore and others
15 Strengthening of country capacity for reviews of health progress and performance in the context of monitoring and evaluation of national health strategies
T Boerma and others
16 Make it happen 2015: validation of the maternal mortality ratio in Trinidad and Tobago for 2000–06
E V C Bolastig and others
17 Addressing bias in national estimates of insecticide-treated mosquito net coverage in countries with heterogeneous distribution of malaria transmission with household surveys and GPS data
C R Burgert and others
18 How reliable are maternal mortality estimates for small country populations?
B Butrón Riveros and others
19 Use of data for emergency obstetric care facilities, staff, and their geographical distribution to interpret data for maternal mortality
O M R Campbell, S Gabrysch
Abstracts 20 Socioeconomic determinants of disparities in
cardiovascular risk factor prevalence in Argentina: a prelude to a multilevel approach
J E Caporale and others
21 Thailand’s approach to measuring maternal mortality ratio
W Chandoevwit and others
22 Health-care service inequalities in developing countries: a comparative study based on the world health survey
X Che and others
23 Worldwide surveillance of cancer survival M P Coleman and others
24 A rapid, low-cost method for evaluation of distribution of insecticide-treated nets
D Danforth and others
25 The use of audience response systems for school-based health research surveys in New York City elementary school children: feasibility and cost-effectiveness
A DeSorbo, O Williams
26 Epidemiological transition in Sri Lanka from 1950 to 2006
S D Dharmaratne and others
27 Development assistance, subadditionality, and health outcomes
J Dieleman
28 Decomposition of the fertility response to a mortality-reducing intervention in Matlab, Bangladesh
J Driessen
29 Provincial and district-level trends in under-5 mortality in Zambia
L Dwyer-Lindgren and others
30 Estimates of child deaths prevented from malaria prevention scale-up in Africa, 2001–10
T P Eisele and others
31 The impacts of Aarogyasri health insurance in Andhra Pradesh, India
V Y Fan and others
32 Disentanglement of the effects of wealth and place of residence to interpret trends in health inequalities
K G Fleischman Foreit
33 Identification of epidemiological factors for ischaemic heart disease with predictive validity
K Foreman and others
Information for Authors See www.thelancet.com for guidelines for authors.
Ombudsman Charles Warlow (c/o The Lancet or [email protected])
International Advisory BoardKaren Antman (Boston)Valerie Beral (Oxford)Robert Beaglehole (Auckland)Anthony Costello (London)Robert Fletcher (Boston)Suzanne Fletcher (Boston)Karen Gelmon (Vancouver)David Grimes (Durham)Ana Langer (Mexico City)Judith Lumley (Melbourne)Elizabeth Molyneux (Blantyre)Christopher Murray (Seattle)
Alwyn Mwinga (Lusaka)Marie-Louise Newell (Somkhele)Magne Nylenna (Oslo)Peter Piot (London)Stuart Pocock (London)Giuseppe Remuzzi (Bergamo)Caroline Savage (Birmingham)Ken Schulz (Chapel Hill)Frank Shann (Melbourne)Jan Vandenbroucke (Leiden)Cesar Victora (Pelotas)Nick White (Bangkok)
The Lancet—London32 Jamestown Road,London NW1 7BY, UKT +44 (0)20 7424 4910F +44 (0)20 7424 4911
The Lancet—New York360 Park Avenue South,New York, NY 10010–1710, USAT +1 212 633 3810F +1 212 633 3853
The Lancet—BeijingUnit 1–6, 7F, Tower W1, Oriental Plaza, Beijing 100738 ChinaT + 86 10 85208872F + 86 10 85189297
Global Health Metrics & Evaluation: Controversies, Innovation, Accountability · March 14–16, 2011
Editor Richard Horton
Deputy Editor Astrid James
Senior Executive Editor Sabine Kleinert
Executive Editors Pam Das Justine Davies David McNamee Ros Osmond Pia Pini Stuart Spencer William Summerskill
Managing Editor Stephanie Clark
Web Editors Richard Lane Erika Niesner
Assistant Web Editor Nicolai Humphreys
Senior Editors Niall Boyce Jane Godsland Lin Guo Seema Kang Selina Lo Zoë Mullan Joanna Palmer Udani Samarasekera Richard Turner
Asia Editor Helena Hui Wang (Beijing)
North American Senior Editor Maja Zecevic (New York)
Conference Editor Laura Hart
Deputy Managing Editor Hannah Cumber
Senior Assistant Editors Laura Benham David Holmes Katrina Phillips Onisillos Sekkides Lucy Wilkie Farhat Yaqub
Assistant Editors Olaya Astudillo Mario Christodoulou Tim Dehnel Jessica Greatrex Dara Mohammadi Emma Rogulska
Media Relations Manager Tony Kirby
Editorial Assistants Holly Baker Zena Nyakoojo Katherine Rolfe Frances Whinder
THE LANCET® is a registered trademark of Elsevier Properties S A, used under licence.
Previously published online
Abstracts are listed in alphabetical order by first author surnameDetails of funding sources, conflicts of interest, and author contributions for each Abstract are on file at The LancetCover image © Giacomo Pirozzi/Panos
II
Global Health Metrics & Evaluation: Controversies, Innovation, Accountability · March 14–16, 2011
Abstracts34 Estimation of incidence of cancer for 21 regions of the
world: the Global Burden of Disease study M H Forouzanfar and others
36 Net benefits: the effectiveness of insecticide-treated bednets for reduction of childhood mortality and malaria morbidity across 23 sub-Saharan African countries
N Fullman and others
37 Measurement of the impact of antiretroviral therapy coverage on incidence of AIDS-defining malignancies in sub-Saharan Africa
J D Goldman and others
38 Testing convergence hypothesis for health and health inequalities in India
S Goli, P Arokiasamy
39 Hopes turning backwards: resurgence of the malaria burden in India
S Goli, P Arokiasamy
40 Exploring the determinants of maternal mortality declines
K A Grépin and others
41 State of the art of effective coverage in Latin America R Guerrero, G Carrasquilla
42 An empirically based typology of national health systems
M Hanlon and others
43 Evaluation of economic status indices and their cardinal scale property for quantitative health analyses
P Hanvoravongchai
44 Validation of vaccination coverage estimates with oral fluid: can a non-invasive biomarker of measles immunity improve conventional methods for estimation of vaccination coverage?
K Hayford and others
45 Decomposition of cross-country differences in quality-adjusted life expectancy: the impact of mortality, health states, and values
R Heijink and others
46 Mortality patterns in a rural area of Vietnam, 1999–2008
N P Hoa, N T K Chuc
47 Projections of global health outcomes from 2005 to 2060 with use of the international futures integrated forecasting model
B B Hughes and others
48 Misclassification patterns of causes of maternal deaths in Sri Lanka
R L Jayasuriya, S D Dharmaratne
49 The limited value of cost-effectiveness league tables—the need for a third dimension?
D J Jeffries, W Stevens
50 Assessment of the global burden of disease from unsafe medical care among hospitalised patients
A K Jha and others
51 The HMO Research Network Virtual Data Warehouse: a model for responsible and efficient multicentre health data analysis
K Johnson and others
52 The sentinel panel of districts: Tanzania’s new integrated surveillance system
G Kabadi and others
53 Measuring wellbeing of older populations: a best practice approach to international comparisons
T Kaneda and others
Abstracts 54 Global trends in urban health inequalities M Kano and others
55 Global burden of dental disease N Kassebaum and others
56 Enhancement of epidemiological estimates for stroke and heart failure in Australia with use of linked data
J M Katzenellenbogen and others
57 Geographical variation in the causes of heart failure: a systematic review for the Global Burden of Disease study
S Khatibzadeh and others
59 Shortchanging schistosomiasis: how the DALY metric devalues disease burden due to widely prevalent chronic infections in the developing world
C H King and others
60 Measurement of health systems strengthening: deviance analysis using mixed-method case studies
E Kleinau and others
61 Country capacity building in health metrics: lessons from the Health Observatory of Latin America and the Caribbean
F M Knaul and others
62 Cross-country analysis of financial protection and health financing: results from the Health Observatory of Latin America and the Caribbean
F M Knaul and others
63 Inequalities in cancer survival in low-income and middle-income countries: measurement, identification of outliers, and implications for health-system performance assessment
F M Knaul and others
64 Vaccine-related adverse events in the USA: a need for an integrated open global surveillance system
V O Kolade and others
65 Social return on investment analysis: a new tool for priority setting and strategic decision making in global health?
S Kumar
66 Changes in patterns of premature mortality burden in relation to income in suburban southwest China: 1988 and 2008
C Le and others
67 Measuring adult mortality with sibling and parental survival histories
A Levin-Rector and others
68 Cervical and breast cancer in Latin America: a neoplastic transition
S I Lewis and others
69 Measuring health-care affordability: conceptual issues and empirical analysis for China
Y Liu
70 Putting health metrics into practice: Population Services International’s use of disability-adjusted life-years for programmatic decision making
K Longfield and others
71 Monitoring progress towards the Millennium Development Goal for drinking water and sanitation target: WHO/UNICEF Joint Monitoring Programme for Water-Supply and Sanitation
R Luyendij
72 Estimation of population cause-specific mortality fractions from in-hospital mortality in China
Z Maigeng, Y Gonghuan
III
Global Health Metrics & Evaluation: Controversies, Innovation, Accountability · March 14–16, 2011
Abstracts73 Are we changing epidemiological transition points
by increasing the fraction of deaths due to non-communicable diseases when improving data quality?
L Mallinger and others
74 Progress in access to water and sanitation between 1980 and 2010: a driver of decreases in under-5 mortality?
L Mallinger and others
75 Optimum resource allocation through linear programming and disease modelling
J Marcus and others
76 Economic evaluation of infant-feeding strategies to prevent mother-to-child transmission of HIV in South Africa
M Maredza and others
77 The Pan American Health Organization Health Information Platform: an organisation-wide data warehouse and health intelligence platform to support health analysis and decision making
R Martinez-Piedra
78 Measurement of the maternal mortality rate in an Indian state: early transition
S C Mathur
79 Measurement of malaria in the Democratic Republic of the Congo by molecular analyses of leftover dried blood spots from the 2007 demographic and health survey
J P Messina and others
80 Getting to zero: metrics for achieving malaria elimination in South Africa
D Moonasar and others
81 Epidemiology of ischaemic heart disease in 21 world regions in 2005: a systematic review for the Global Burden of Disease study
A Moran and others
82 Measures of financial protection for health system comparison: can we do better?
R Moreno-Serra, P Smith
83 Cardiovascular disease reduction as a Millennium Development Goal: decomposing life expectancy expected gains in the Americas
O J Mujica and others
84 Causes of death as shown by hospital records in Pakistan S Mursalin and others
85 Safe pregnancy and delivery: a systematic analysis of trends in the coverage of antenatal and intrapartum care
R Myerson and others
86 100-year trends for mortality data by cause M Naghavi and others
87 Evaluation of the population-level impact of HIV prevention interventions in India
M Ng and others
88 Does coinsurance rate reduction reach poor older people? Japan’s health insurance natural experiment
A Nishi and others
89 Prevalence of cardiovascular disease risk factors among young and middle-aged men in urban Mwanza, Tanzania
M A Njelekela and others
90 Socioeconomic status, urbanisation, and cardiometabolic risk factors among middle-aged adults in Tanzania
M A Njelekela and others
91 Challenges in estimation of the global disease burden of gynaecological disorders
R Norman and others
Abstracts 92 Highlighting discrepancies in site-level HIV care and
treatment data collected at sites supported by the Elizabeth Glaser Paediatric AIDS Foundation (EGPAF) in Côte d’Ivoire, 2010
M Ntumbanzondo and others
93 High impact research: building of data ownership and improvement of data use
T Nutley and others
94 10 years after Roll Back Malaria: unattained targets in Benin City, Nigeria
A Obehi, H Talmage
95 Costing of free maternal health services under the National Health Insurance Scheme in Ghana: challenges and implications for sustainability in Ghana
E A Odame, P Akweongo
96 Highland malaria outbreak in Homeyo District, Papua Province, Indonesia: an entomological investigation
A Oktavian and others
97 Geographical information systems in selection of states to participate in a long-term transformative programme to build leadership and accountability in Nigeria’s health sector
A Omoluabi and others
98 Socioeconomic disadvantage and tuberculosis incidence in Washington State
E Oren
99 Measuring health information system (HIS) progress: development of tools to enable country-led evaluation
L Peloso, M Patel
100 Overweight in relation to undernutrition for children younger than 5 years: a country level update
A Pomeroy and others
101 Evaluation of health systems performance and estimation of health-care inequality among US counties: a novel approach for priority setting by proxy metrics and decision trees
L Ponnambalam and others
102 The REACH calculator: an innovative tool for planning and monitoring of family planning programmes
F Pozo-Martin and others
103 WHO’s Urban Health Equity Assessment and Response Tool
A Prasad and others
104 Measurement of socioeconomic status in cross-country studies: comparison of four methods with use of data from the eight-country MAL-ED Network
S Psaki and others
106 The road towards better vital registration systems: under-registration of death counts and ill-defined causes of death in Brazil
B L Queiroz, E E C Lima
107 Prioritisation of quality improvement projects through patient outcome assessments
S Rahimi and others
108 Newborn deaths in the Philippines A T Reolalas
109 The validity and feasibility of a new method to estimate mortality in crisis-affected and resource-poor settings
B Roberts and others
110 An analysis of wealth-related inequalities in breastfeeding rates in 102 countries
T Roberts, E Gakidou
IV
Global Health Metrics & Evaluation: Controversies, Innovation, Accountability · March 14–16, 2011
Abstracts111 Transition in ischaemic heart disease in Mexico:
estimates of disability-adjusted life-years in 1995–2005 at the Mexican Institute of Social Security
G Rodríguez and others
112 Estimation of cause-specific hospital discharges from hospital lethality and population mortality in Colombia, 2006–07
J Rodríguez García
113 Use of severe acute maternal morbidity for the evaluation of the impact of maternal health interventions
C Ronsmans and others
114 Evaluation of trends in the use of modern contraception and its relationship with fertility
L Rosenfeld and others
115 New disability weights for the Global Burden of Disease study
J A Salomon and others
116 Organisational restructuring of the Ministry of Health in Botswana: impact on performance
O Seitio-Kgokgwe and others
117 Large-scale annual health survey to improve health metrics in India
R C Sethi, B Mishra
118 Beyond maternal mortality: the burden of deaths unrelated to pregnancy and careseeking patterns for non-communicable diseases in rural Bangladeshi women of reproductive age
S S Sikder and others
119 Incorporation of comorbidity: the use of non-parametric models to better understand the value of targeted public health strategies
W Stevens, D J Jeffries
Abstracts 120 An innovative mapping tool for analysis of health data
in limited resource settings: the Excel to Google Earth (E2G) tool from MEASURE Evaluation, an example from Senegal
J Stewart and others
121 Measurement of the health system performance of US states in reducing neonatal mortality
L D Straney and others
122 Comparison of recent maternal mortality estimates with national maternal mortality surveillance data: findings from three countries
P Stupp and others
123 Assessment of the impact of malaria interventions: the case of mainland Tanzania
The Tanzania Impact Evaluation Team
124 The cost per year of life lived on HIV antiretroviral therapy
S Verguet and others
125 Evaluation, comparison, and improvement of LiST with use of distal determinants and country-specific measurements
H Wang and others
127 A new approach to indicator harmonisation and monitoring and evaluation
P Whitaker, R Krishnamurthy
128 Evaluation of the Brazilian national violence surveillance system, 2006–09
R T de C Yokota and others
129 Comparative risk factor assessment for 11 Latin American countries
P Zitko-Melo and others

Abstracts
www.thelancet.com Published online March 14, 2011 Webappendix 3
Effective intervention coverage in Zambia: the heterogeneous pictureTom Achoki, Matthew Schneider, Nancy Fullman, Felix Masiye, Emmanuela Gakidou
AbstractBackground The past decade has witnessed major expansions in effective coverage of key health interventions in a number of countries in Africa. Aggregate data from Zambia indicate a drop in child mortality in recent years, which some have quickly attributed to a broad scale-up of key childhood interventions. However, national estimates often mask important subnational differences that could be informative to policy makers. This study aimed to determine the effective coverage trends of key child health interventions in Zambia in the last decade; drilling down to the subnational levels and unmasking within country variability.
Methods We did an in-depth data analysis involving the triangulation of multiple data sources available by country, such as national household surveys, health management information system, surveillance and administrative data, and fitting of statistical models to obtain the most reliable time-series.
Findings Preliminary results show that the last decade has witnessed a national increase in insecticide-treated net coverage from under 20% in 2001 to above 50% in 2008. The rural Luapula and Western provinces registered the most dramatic increase, whereas urban Lusaka and Copperbelt provinces increased at a slower pace. Similarly, vitamin A coverage remained above 50%, with an increasing trend in the rural provinces in contrast to their urban counterparts. Meanwhile, the Copperbelt, Lusaka, and Southern provinces had consistently high coverage of the three doses of diphtheria, pertussis, and tetanus vaccination (DPT3) compared with the Northwestern, Western, and Luapula provinces. Skilled birth attendance showed wide variations among the provinces, with Lusaka and Copperbelt provinces registering higher coverage of above 70% compared with all other provinces that averaged around 35% over the same period.
Interpretation Intervention coverage reported from Zambia has a heterogeneous picture. Some provinces are lagging behind in various crucial interventions, whereas others are performing impressively. With the ongoing efforts to scale up towards universal coverage, policy makers should be cognisant of these subnational gaps and address them.
Published Online March 14, 2011
Institute for Health Metrics and Evaluation, University of Washington, Seattle, WA, USA (T Achoki MD, M Schneider BA,
N Fullman BA, E Gakidou PhD); and Department of Economics, University of Zambia, Lusaka, Zambia (F Masiye PhD)
Correspondence to: Emmanuela Gakidou, Institute for Health Metrics and Evaluation, University of Washington, Seattle, WA 98121, USA [email protected]
Abstracts
4 www.thelancet.com Published online March 14, 2011 Webappendix
Heterogeneity of cause of death dataStephanie Y Ahn, Mengru Wang, Leslie Mallinger, Mohsen Naghavi, Kyle Foreman, David Phillips, Charles Atkinson, Susanna Makela, Janaki O’Brien, Jeanette Birnbaum, Rafael Lozano, Alan Lopez, Christopher J L Murray
AbstractBackground Cause of death data come from several sources with varying formats and different cause lists. Data sources include vital registration systems, censuses, surveys, verbal autopsies, hospital records, mortuaries, sample registration systems, and disease surveillance systems. Heterogeneity across the cause of death data landscape proposes many challenges to analysis. The aim of the data preparation process is to create a single comprehensive cause of death database with standardised formats and cause lists, from template variables found in mortality databases as published by WHO.
Methods Causes found in the data are first mapped to a standardised cause list in order to make variant data sources comparable across cause. We also correct cause of death assignments in ages and sexes when the cause has been determined to be biologically implausible. An age-splitting algorithm is applied to split broad age groups into standard 5-year age intervals while, simultaneously, a sex-splitting algorithm is applied to deaths coded without sex designation. The data are subsequently redistributed with expert algorithms that move deaths from garbage codes to target codes, enhancing the accuracy of cause compositions across ages.
Findings This process generates one comprehensive cause of death dataset with standardised cause lists, age formats, and improved cause of death assignments.
Interpretation We believe that through the data preparation process, we achieve greater comparability across data sources, facilitate the analysis of trends in causes of death, provide further evidence to evaluate theories of the epidemiological transition, and enhance the public health utility of cause of death data.
Published Online March 14, 2011
Institute for Health Metrics and Evaluation, University of
Washington, Seattle, WA, USA (S Y Ahn BA, M Wang BA,
L Mallinger BS, M Naghavi MD, K Foreman AB, D Phillips BS, C Atkinson BS, S Makela BS,
J O’Brien BA, J Birnbaum MPH, Prof R Lozano MD,
Prof C J L Murray DPhil); and University of Queensland,
School of Population Health, Brisbane, QLD, Australia
(Prof A Lopez PhD)
Correspondence to: Rafael Lozano, Institute for
Health Metrics and Evaluation, University of Washington,
Seattle, WA 98121, USA [email protected]
Abstracts
www.thelancet.com Published online March 14, 2011 Webappendix 5
Reduction of inequalities in child mortality through maternal education: an individual-level analysisMiriam R Alvarado, Krycia Cowling, Rafael Lozano, Emmanuela Gakidou
AbstractBackground Increases in women’s education are associated with greater empowerment and productivity, as well as health. Previous studies based on national-level analysis have shown that an extra year of education is associated with a 10% decrease in under-5 mortality. Individual-level studies have been conducted, but only for a subset of countries. Understanding of the contribution of improvements in women’s education to the reduction in the level and inequalities in child mortality is critical. We aimed to quantify the contribution of increased educational attainment in women to the reductions of the levels and inequalities in neonatal, infant, child, and under-5 mortality.
Methods We analysed data from all nationally representative demographic and health surveys, using a hierarchical logistic regression model. We controlled for relevant covariates including household wealth, and a series of mother-specific and child-specific variables (eg, mother’s age, birth spacing, ethnic minority status).
Findings Maternal education is significantly associated with decreases in infant and under-5 mortality. Results varied across countries. In some settings, maternal education had the strongest association with neonatal mortality, whereas in others the association was strongest with child mortality. We found that belonging to an ethnic minority was significantly associated with increased under-5 mortality in several countries, such as Senegal and the Philippines.
Interpretation Continued increases in the education of women are likely to have substantial positive health effects, and might help to reduce inequalities in child health. In addition, future policies should take into consideration the level of child and infant mortality associated with ethnic minority groups.
Published Online March 14, 2011
Institute for Health Metrics and Evaluation, University of Washington, Seattle, WA, USA (M R Alvarado BA, K Cowling BS, Prof R Lozano MD, E Gakidou PhD)
Correspondence to: Emmanuela Gakidou, Institute for Health Metrics and Evaluation, University of Washington, Seattle, WA 98121, USA [email protected]

Abstracts
6 www.thelancet.com Published online March 14, 2011 Webappendix
Hungering for survival: trends and inequalities in global under-5 malnutritionKathryn G Andrews, Ella C Sanman, Annette M Tardif, Christopher J L Murray, Emmanuela Gakidou
AbstractBackground Child malnutrition is a known risk factor for a myriad of childhood diseases and causes of death, such as diarrhoea, recurrent infections, meningitis, and pneumonia. Target 1C of the first Millennium Development Goal (MDG) is to halve the fraction of people suffering from hunger by 2015, and this target is measured by the prevalence of underweight children under 5 years. To track the progress toward MDG1 and to identify disparities, we generated a time series of under-5, moderate-to-severe underweight (weight-for-age below –2 SD) prevalence estimates for all countries, from 1970 to 2015.
Methods We constructed a database of 1743 childhood underweight data points from microdata and tabulated reports. We developed a design to crosswalk between estimates calculated using the 1978 National Center for Health Statistics-WHO growth standard and the 2006 WHO child growth standards. Using income, calorie intake, and maternal education as covariates, we used spatiotemporal regression methods to generate a full malnutrition time-series.
Findings Overall, child underweight prevalence decreased significantly since 1970, and almost all regions appear to be on track to reach MDG1. However, important disparities among regions and countries still exist. Countries such as Somalia, Liberia, and Burundi have experienced an increase in prevalence of underweight from 1970 to 2015, whereas India, Indonesia, and Moldova have seen an absolute reduction in underweight prevalence of more than 30%. South Asia and east Asia have experienced the most dramatic absolute reductions, while central sub-Saharan Africa appears to be the region least likely to achieve MDG1.
Interpretation As the MDG deadline looms, important lessons can be learned from countries that have experienced successful declines in malnutrition. Special efforts need to be placed in areas where large disparities exist. South Asia is still projected to have the highest malnutrition prevalence of more than 20% in 2015, indicating that efforts to reduce childhood malnutrition cannot be relaxed once we pass beyond the MDG era.
Published Online March 14, 2011
Institute for Health Metrics and Evaluation, University of
Washington, Seattle, WA, USA (K G Andrews BA, E C Sanman BS,
A M Tardif BA, Prof C J L Murray DPhil,
E Gakidou PhD)
Correspondence to: Kathryn G Andrews, Institute for
Health Metrics and Evaluation, University of Washington,
Seattle, WA 98121, USA [email protected]
Abstracts
www.thelancet.com Published online March 14, 2011 Webappendix 7
Published Online March 14, 2011
USAID, Kabul, Afghanistan (A Aqil DrPH); John Snow Inc, Boston, MA, USA (T Lippeveld MPH); National Institute of Public Health, Cuernavaca, Mexico (J E Hernández Ávila PhD); and PAIMAN project, Islamabad, Pakistan (N Ali MPH)
Correspondence to: Anwer Aqil, 7016 Hopewood Street, Bethesda, MD 20817, USA [email protected]
An innovative tool for linking routine health information system (RHIS) and health system performanceAnwer Aqil, Theo Lippeveld, Juan Eugenio Hernández Ávila, Nabeela Ali
AbstractBackground There has been a growing demand to provide evidence about the potential of health-facility-based routine health information systems (RHIS) to improve health system performance. To meet this demand, an innovative tool was developed to link RHIS performance with health system performance, on the basis of the peer-reviewed published work under the Performance of Routine Information System Management (PRISM) framework. The tool attempts to assess the impact of RHIS performance on health system performance by controlling for health system (supply) and community (demand) factors. Second, it addresses whether RHIS performance affects health system performance directly or indirectly through the health system and community factors. The aim was to demonstrate the effectiveness of the tool in depicting linkages between RHIS performance and health system performance
Methods 160 health facilities in Mexico (eight districts in Guanajuato state) and 100 in Pakistan (two districts, Punjab) were selected randomly and surveyed. The PRISM diagnostic and link tools were used to assess RHIS performance (data quality and information use), health system performance (service coverage), and other factors through review of facility records and interviews of staff.
Findings The results showed that data quality was high (80%) in both countries, while overall use of information was 36% in Pakistan and 42% in Mexico. Service coverage for immunisation, antenatal care, facility use, and pneumonia cases decreased slightly over a 3-month period in Mexico, while in Pakistan it declined significantly. In both countries less than 20% of the health facilities had made any changes in shifting human resources, supplies, and finances. 73% (Pakistan) and 45% (Mexico) of respondents reported having no decision-making power to adjust resources or purchase supplies if needed. Associations were found between RHIS information use and health-system performance, specifically with overall facility utilisation rate directly, and with immunisation and pneumonia services coverage indirectly. However, availability of resources was associated with better immunisation coverage. Those who used information also perceived more decision-making power and took actions to improve service coverage.
Interpretation This innovative tool opens up opportunities to link RHIS and health system performance. Despite showing internal consistency among different variables, the tool needs to be used in more countries to prove its effectiveness.

Abstracts
8 www.thelancet.com Published online March 14, 2011 Webappendix
Tracking global trends in contraceptive security: Contraceptive Security Index 2003–09Dana Aronovich, Ariella Bock, Nadia Olson, Marie Tien
AbstractBackground Contraceptive security (CS)—ensuring that every person is able to choose, obtain, and use high-quality contraceptives—is a critical component of family planning (FP) programmes. Without a reliable supply of contraceptives, programmes cannot provide good-quality services to clients. Increasing access to and use of FP helps to combat poverty, reduce maternal and infant morbidity and mortality, and reduce social inequities.
Methods The CS Index was developed to measure CS with use of a set of 17 indicators covering the principle components of CS: supply chain, finance, health environment, access, and usage. To minimise data collection costs and maximise data reliability, the CS Index uses only secondary data from reliable sources. The data were collected in 2003, 2006, and 2009, allowing for monitoring progress and trends over time at the national, regional, and global level. By monitoring trends in component scores for individual countries, stakeholders can identify broad strengths and weaknesses needing focused attention and resources. The indicators are also compiled to establish composite scores for more than 60 countries.
Findings Results show some global progress toward CS since 2003. The average CS Index score across countries increased from 51·4 in 2003, to 53·4 by 2009, a statistically significant increase, with the largest increases observed among sub-Saharan African countries. The supply chain component had the highest average scores across all regions, while finance often had the lowest average scores.
Interpretation Stakeholders can use these results to emphasise the importance of CS for better FP programme outcomes and to monitor progress towards reaching this goal. The CS Index can be a strong tool to raise awareness about CS and the inter-relationships between different programme components. The results can also be used to set priorities, inform programme planning, and advocate for more rational resource allocation to achieve a secure supply of good-quality contraceptives.
Published Online March 14, 2011
John Snow Inc, USAID Deliver Project, Arlington, VA, USA
(D Aronovich MHS, A Bock MS, N Olson MA, M Tien MHS)
Correspondence to: Dana Aronovich, John Snow Inc,
1616 North Fort Myer Drive, 11th floor, Arlington, VA 22209,

Abstracts
www.thelancet.com Published online March 14, 2011 Webappendix 9
Costs and effects of a multifaceted intervention to improve the quality of care of children in district hospitals in KenyaE W Barasa, P Ayieko, S Cleary, M English
AbstractBackground Globally, more than 8·8 million children die before they reach the age of 5 years. In Kenya, the under-5 mortality rate was 74 per 1000 children in 2008. To improve care for seriously ill children, a multifaceted approach that uses guidelines, training, supervision, feedback, and facilitation was developed—for brevity called the emergency triage and treatment plus (ETAT+) strategy. We assessed the costs and efficiency of delivery of the ETAT+ strategy in district hospitals in Kenya.
Methods A cost-effectiveness analysis from the provider’s perspective was conducted alongside a cluster randomised study that compared the delivery of ETAT+ in four district hospitals in Kenya with four control district hospitals receiving a partial version of the intervention between 2005 and 2009. Effectiveness of the intervention was measured with 14 process measures that capture improvements in quality of care and span the assessment, diagnosis, and treatment on admission in children younger than 5 years. Economic costs were estimated through interviews with implementers of the intervention, accounting, and clinical record reviews. An annual discount rate of 3% was used, and one way sensitivity analyses were used to assess uncertainty. Incremental cost-effectiveness ratios were defined as the cost per percentage improvement in quality of care.
Findings The cost per child admission was US$54·74 in intervention hospitals compared with $31·06 in control hospitals, while quality of care as measured by the 14 process measures was 25·01% higher in intervention hospitals than in the control hospitals. These results suggest an additional cost of $0·78 to achieve a percentage improvement in quality of care.
Interpretation The delivery of ETAT+ as a multifaceted intervention yields significant improvements in quality of care but at a higher cost. Knowledge of what value decision makers place on quality improvement would be useful in making decisions about their adoption explicit.
Published Online March 14, 2011
KEMRI Centre for Geographic Medicine Research—Coast, and Wellcome Trust Research Programme, Nairobi, Kenya (E W Barasa MPH, P Ayieko MSc, M English MD); Health Economics Unit, University of Cape Town, Cape Town, South Africa (S Cleary PhD); and Department of Paediatrics, University of Oxford, Oxford, UK (M English)
Correspondence to: E W Barasa, Child and Newborn Health Group, Centre for Geographic Medicine, KEMRI-University of Oxford-Wellcome Trust Collaborative Research Programme, Kenyatta National Hospital Grounds, PO Box 43640–00100, Nairobi, Kenya [email protected]

Abstracts
10 www.thelancet.com Published online March 14, 2011 Webappendix
Estimation of the burden of disease attributable to mental disorders Amanda Baxter, Harvey Whiteford, Theo Vos, Rosana Norman
AbstractBackground An important finding of the 1996 Global Burden of Disease (GBD) study was that mental disorders contributed a substantial proportion of the global burden, even though few deaths were attributed to these disorders. For the current update of the GBD, new estimates are being prepared for mental disorders incorporating systematically identified and collected empirical data and applying updated methods and modelling tools. This presentation will describe changes to the process of estimating burden of disease for mental disorders.
Methods The new GBD includes a broader range of disorders, including mental disorders with childhood onset and a number of relatively common anxiety disorders not previously captured. Systematic reviews were conducted in order to obtain representative empirical data on the prevalence, incidence, remission, mortality risk, and severity distributions for each of the disorders. Multiple health states were defined to best capture the variation in disability over the course of each disorder. On the basis of DisMod, epidemiological estimates for 20 world regions were derived. For each disorder, study and country factors were identified that impact on disease parameter estimates and that were applied as covariates in DisMod to derive final estimates. Separately, the contribution of mental disorders as a risk factor for suicide and cardiovascular disease was estimated.
Findings The epidemiological data identified through systematic review contained significant heterogeneity, leading to varying estimates of the burden of mental disorders between world regions. Mental disorders also contribute to the majority of suicide deaths, and depression is a risk factor for coronary heart disease.
Interpretation New GBD estimates for mental disorders are based on a much broader evidence base than in previous studies. For the first time, the uncertainty around these global estimates is quantified. New results confirm the prominent position of mental disorders in all world regions.
Published Online March 14, 2011
University of Queensland, Brisbane, QLD, Australia
(A Baxter MPH, H Whiteford FRANZP,
Prof T Vos PhD, R Norman PhD)
Correspondence to: Theo Vos, Centre for Burden of
Disease and Cost-Effectiveness, School of Population Health,
University of Queensland, Herston, QLD 4006, Australia
Abstracts
www.thelancet.com Published online March 14, 2011 Webappendix 11
Evaluation of the association between vector control coverage, climate variability, and the spatial distribution of malaria at three periods in ZambiaAdam Bennett, John Miller, Hawela Moonga, Busiku Hamainza, Penelope Vounatsou, Mulakwa Kamuliwo, Rick Steketee, Thomas P Eisele
AbstractBackground Three malaria indicator surveys (MIS) have been conducted in Zambia over the past 5 years to evaluate malaria intervention scale-up. Coverage of insecticide-treated mosquito nets (ITNs) and indoor residual spraying (IRS) has increased markedly since 2006. However, while malaria infection and anaemia prevalence in children younger than 5 years dropped in 2008, preliminary results from the 2010 MIS indicate that levels have rebounded in several parts of the country. We sought to ascertain the relative effects of ITN coverage, IRS, and climate variability on the spatial distribution of parasitaemia and anaemia in 2006, 2008, and 2010.
Methods We fit Bayesian geostatistical models to assess the effect of intervention coverage on parasitaemia and severe anaemia prevalence, while adjusting for climatic and socioeconomic factors. We assessed the spatial dependence of disease distribution through time with spatial random effects for each survey. Model fit and predictions were conducted with Markov chain Monte Carlo simulation.
Findings Malaria infection and severe anaemia prevalence rose from 2008 in six of nine provinces, and from 12% to 20% across rural areas nationally. Parasitaemia increased by the largest percentage in Luapula (132%), Northern (97%), and Eastern (137%) provinces. Household ITN possession fell 31% in Luapula province and 29% in Northern province, but stayed constant in Eastern province. Parasitaemia increased in Central (by 19%), Western (96%), and Copperbelt (22%) provinces, while ITN coverage also increased, by 45%, 121%, and 9%, respectively. Conversely, parasitaemia decreased (by 60%) in Northwestern province, while ITN coverage increased (50%).
Interpretation Preliminary results suggest that a combination of climatic factors and intervention decay contributed to the rebound in parasitaemia in some areas. Unusual rainfall patterns in the early part of 2010, perhaps related to moderate El Niño conditions, may have contributed to this increase. We emphasise the importance of accounting for climate variability when using cross-sectional data for malaria evaluation efforts.
Published Online March 14, 2011
Tulane University School of Public Health and Tropical Medicine, New Orleans, LA, USA (A Bennett MA, T P Eisele PhD); Malaria Control and Evaluation Partnership for Africa, PATH, Lusaka, Zambia (J Miller MPH); National Malaria Control Centre, Ministry of Health, Lusaka, Zambia (H Moonga MS, B Hamainza MPH, M Kamuliwo MD); Swiss Tropical and Public Health Institute, Basel, Switzerland (P Vounatsou PhD); and Malaria Control and Evaluation Partnership for Africa, PATH, Ferney-Voltaire, France (R Steketee MD)
Correspondence to: Adam Bennett, Tulane University School of Public Health and Tropical Medicine, New Orleans, LA 70112, USA [email protected]

Abstracts
12 www.thelancet.com Published online March 14, 2011 Webappendix
Priority cost-effective lessons for systems strengthening in South Africa (PRICELESS-SA): an example of strengthening in-country collaborations and capacityM Y Bertram, K J Hofman, M Maredza, S M Tollman
AbstractBackground Priority cost-effective lessons for systems strengthening (PRICELESS-SA) is the South African component of the disease control priorities network (DCP-N). Beginning in February, 2009, this initiative focused on building a network with relevant national bodies including the National Department of Health (DOH) and the Treasury, the Department of Science and Technology, the Medical Research Council (MRC), and Health Systems Trust. Development of this governance network and related collaborators has been instrumental for acceptance of the initiative at a national level, and for meaningful buy-in and accountability. Consultation with these partners has set a research agenda responsive to national priorities including economic evaluation of interventions for chronic disease (including HIV and tuberculosis) and maternal and child health care at the district level. Capacity building to develop a critical mass of appropriate researchers in South Africa is an essential element of the initiative. Limited expertise to perform and interpret health economic evaluation is evident within national and provincial government, and academia. PRICELESS-SA students have attended training courses at the Institute for Health Metrics and Evaluation and the University of Queensland, and a capacity building workshop covering demography, burden of disease, and economic evaluation was held at the University of Witwatersrand in 2010.
Discussion PRICELESS-SA is beginning to provide policy-relevant information and can contribute to resource allocation decisions. However, the absorptive capacity within the country as a whole limits the understanding and application of information provided. Continual capacity building both at an analytical level and for those using the information is required. It has become clear that the focus of the initiative should not only be economic evaluation, but also on how evidence and information is used for policy decisions. Strategic planning with the MRC is underway to ensure the PRICELESS-SA initiative is embedded effectively among South African research groups, and strengthens capacity to provide decision support at a national and subnational level.
Published Online March 14, 2011
School of Public Health, University of the
Witwatersrand, Johannesburg, South Africa (M Y Bertram PhD,
K J Hofman MBBCh, M Maredza MPH,
S M Tollman PhD); and Division of International Science Policy,
Planning and Evaluation Fogarty International Center, National Institutes of Health,
Bethesda, MD, USA (K J Hofman)
Correspondence to: M Y Bertram, School of Public
Health, University of the Witwatersrand, Parktown,
Johannesburg, South Africa [email protected]

Abstracts
www.thelancet.com Published online March 14, 2011 Webappendix 13
Published Online March 14, 2011
Harvard School of Public Health, Boston, MA, USA (K Bhalla PhD); Flinders University, Adelaide, SA, Australia (Prof J Harrison MPH); Brandeis University, Waltham, MA, USA (S Shahraz MD); University of Queensland, Brisbane, QLD, Australia (Prof T Vos PhD); and Institute for Health Metrics and Evaluation, University of Washington, Seattle, WA, USA (J Blore PhD, M Wang BA)
Correspondence to: Kavi Bhalla, Harvard School of Public Health, Boston, MA 02115, USA [email protected]
Estimates of the regional burden of non-fatal injuries in sub-Saharan Africa based on local data sources and new methods Kavi Bhalla, James Harrison, Saeid Shahraz, Theo Vos, Jed Blore, Mengru Wang
AbstractBackground Reliable estimates of the burden of injuries are essential for shaping national and global health priorities. Past Global Burden of Disease (GBD) injury estimates for Africa were based on statistical models that extrapolated on the basis of health data from other regions. We construct estimates of the regional burden of non-fatal injuries in Africa using local measurements of incidence of external causes and all available health facility data.
Methods Our data sources were: (1) regional incidence of injuries by external cause, age, sex, and type of care estimated from data from 100 household surveys; (2) hospital datasets that include both external causes and sequelae (four datasets from Africa, 23 from other world regions); (3) prevalence of permanent disability by cause from census data (eight African census datasets); and (4) estimates of sequelae incidence, duration and persistence, and excess mortality from systematic literature reviews. To generate estimates of incidence of sequelae, we used hospital datasets to model the distribution of sequelae due to each external cause. We used this model to convert incidence of external causes of injury into incidence of injuries by GBD sequelae. We adjusted modelled estimates to account for non-hospitalised sequelae using survey data that measure sequelae incidence. To estimate public health burden, we used these estimates of sequelae incidence, in addition to estimates of duration and persistence of sequelae, excess mortality, and prevalence of injuries, in DisMod3 to construct consistent estimates of regional incidence and prevalence. Finally, we used GBD 2005 disability weights to estimate the burden of disease from non-fatal injuries expressed in disability-adjusted life-years lost.
Findings We present burden of injury estimates by age, sex, and external cause for the four sub-Saharan Africa GBD 2005 regions.
Interpretation The new data sources and methods imply that these estimates for Africa are probably more accurate than are past GBD estimates. In addition, local estimates from local data sources are more likely to convince local policy makers.
Abstracts
14 www.thelancet.com Published online March 14, 2011 Webappendix
The global burden of malaria mortalityJed Blore, Mohsen Naghavi, Rafael Lozano, Abraham Flaxman, Lisa Rosenfeld, Nicole Johns, Kyle Foreman, Katrina Ortblad, Christopher J L Murray
AbstractBackground Despite considerable efforts to control malaria, the disease continues to be a significant contributor to the global mortality burden. In certain countries, malaria mortality estimates generated by WHO’s world malaria report and Oxford’s malaria atlas project may vary widely. India’s 2006 estimates, for instance, report a 13-fold difference between malaria death estimates. In order to track progress on combating the illness, policy makers must have access to reliable information on the rates of and trends in malaria mortality. In light of the discrepant nature of malaria mortality estimates, this study aggregates data from different sources in order to generate a more consistent time-series of country-specific malaria death rates from 1980 to 2010, in countries where malaria is endemic for the Global Burden of Disease 2005 study.
Methods We have constructed a database containing estimates of malaria mortality for 1980–2010, from vital registration data, surveys, notification data, and verbal autopsy studies. We use spatiotemporal regression to reconcile discrepancies in the data sources and to predict malaria mortality for country-years for which there are no data. We use parasitaemia concentrations, annual rainfall, distance above sea level, bednet coverage, and indoor residual spraying coverage as predictors in our model. With the output from this regression, we use Gaussian process regression to generate prediction intervals. We have conducted sensitivity analyses on our model specifications and show the out-of-sample predictive validity of our methods.
Findings We present revised estimates of malaria mortality in countries where malaria is endemic from 1980 to 2010. Our model will also indicate which of the covariates are most strongly related with malaria mortality.
Interpretation The combination of different sources of malaria mortality and new methods is expected to yield more accurate estimates of the burden of malaria mortality in comparison to past estimates of the global burden of disease.
Published Online March 14, 2011
Institute for Health Metrics and Evaluation, University of
Washington,Seattle, WA, USA (J Blore PhD, M Naghavi PhD,
Prof R Lozano MD, A Flaxman PhD, L Rosenfeld BS,
N Johns BA, K Foreman BA, K Ortblad BA,
Prof C J L Murray DPhil)
Correspondence to: Jed Blore, Institute for Health
Metrics and Evaluation, University of Washington,
Seattle, WA 98121, USA [email protected]
Abstracts
www.thelancet.com Published online March 14, 2011 Webappendix 15
Strengthening of country capacity for reviews of health progress and performance in the context of monitoring and evaluation of national health strategiesTies Boerma, Edward Addai, Ed Bos, Peter Hansen, Daniel Low-Beer
AbstractBackground Many developing countries have made considerable progress in using data to inform decision-making processes such as annual health sector reviews, midterm reviews, and evaluations. National authorities have expressed the need to further enhance their analytical capacities to implement comprehensive assessments of progress and performance. This presentation aims to review the current status in terms of country practices and global supply of methods and tools, and propose a way to strengthen country analytical capacity for monitoring and evaluation of national health strategy.
Methods We assessed current practices and gaps in ten countries, using a standardised approach focusing on indicator and target use, measurement issues, decision-making processes, and institutional capacity. Additionally, multicountry workshops were used to obtain further insights.
Findings Regular health sector reviews are conducted in an increasing number of countries, and generally focus on 15–30 core health indicators and targets. These reviews involve multiple partners and form the basis for subsequent plans. There are, however, major weaknesses in data availability, data quality, and analysis. The use of global estimation methods, comparative and equity analyses is limited. Most countries do not have systematic involvement of country institutions outside of the Ministry of Health. International partners contribute to the monitoring and review process in a very fragmented manner.
Interpretation There is demand for a strong country monitoring and evaluation platform that should also form the basis for accountability, in countries and globally. Such a platform should include a strong monitoring and evaluation plan for the national health strategy, high-quality analytical reviews, a public repository of country data and analyses, institutional capacity, and alignment of global partners with the country monitoring and evaluation platform.
Published Online March 14, 2011
WHO, Geneva, Switzerland (T Boerma MD); Global Fund to Fight AIDS, Tuberculosis and Malaria, Geneva, Switzerland (E Addai MD, D Low-Beer PhD); GAVI Alliance, Geneva, Switzerland (P Hansen PhD); and World Bank, Washington, DC, USA (E Bos PhD)
Correspondence to: Ties Boerma, WHO, 1211 Geneva, Switzerland [email protected]
Abstracts
16 www.thelancet.com Published online March 14, 2011 Webappendix
Make it happen 2015: validation of the maternal mortality ratio in Trinidad and Tobago for 2000–06 Edwin Vicente C Bolastig, Yoko Laurence, Valmiki Lutchmedial, Karen Pierre, Hamish Mohammed
AbstractBackground Estimates of the maternal mortality ratio (MMR) in Trinidad and Tobago (TT) are unreliably determined and may not reflect the true burden. Anecdotally, maternal deaths are thought to be under-reported because of misclassification, uncertain pathogenesis, and failure to report abortion, leading to undetermined progress in meeting Millennium Development Goal 5: a 75% reduction in MMR by 2015. A timely and representative surveillance system is required for informed decision making, and without standardised reporting systems, data quality is compromised. The aim of this work is to examine the quality of the data used for the estimates of MMR provided by the TT Central Statistical Office (CSO).
Methods Criteria from the International Classification of Diseases, tenth revision (ICD-10) will be applied to all deaths of women of reproductive age (14–49 years) from all public delivery facilities in TT to determine who died from birth complications. A retrospective reproductive age mortality survey (RAMOS) will be applied for 2000–06 to evaluate national estimates. A data management plan will be implemented, and collected data will be subsequently analysed.
Findings From 2000 to 2006, data from CSO indicate that 84·9% of all pregnancies were delivered in public facilities. Data collection is ongoing on the analysis of MMR based on ICD-10 and the RAMOS survey; results are pending. At present, data from CSO and external data sources yield conflicting results. The CSO estimate of MMR in 2005 was 34·8, while those provided by UNICEF and the World Bank were 45·0 and 55·0, respectively.
Interpretation Inaccurate measurement will lead to misconceptions regarding the magnitude of the burden of maternal deaths, the leading cause of death and the timing of maternal death. Surveillance for maternal mortality must be a requirement for the maternal care system and comprehensive prenatal health surveillance. A specific maternal death review committee should be established as the ideal maternal death review mechanism across all health jurisdictions.
Published Online March 14, 2011
Health Sciences, University of Trinidad and Tobago, O’Meara Campus, Trinidad, West Indies
(E V C Bolastig MD, Y Laurence MSc, K Pierre MBA);
St Georges University, True Blue Campus, St Georges,
Grenada, West Indies (V Lutchmedial BSc); and Ross
University School of Veterinary Medicine, St Kitts, West Indies
(H Mohammed PhD)
Correspondence to: Edwin Vicente C Bolastig, Health
Sciences, University of Trinidad and Tobago, O’Meara Campus, Lots 74-98 O’Meara Industrial
Park, Arima, Trinidad, West Indies [email protected]

Abstracts
www.thelancet.com Published online March 14, 2011 Webappendix 17
Addressing bias in national estimates of insecticide-treated mosquito net coverage in countries with heterogeneous distribution of malaria transmission with household surveys and GPS data Clara R Burgert, Sarah E K Bradley, Fred Arnold, Erin Eckert
AbstractBackground Insecticide-treated mosquito net (ITN) ownership and use is typically measured by nationally representative surveys, which may include areas with little or no malaria transmission. In some countries with little variation in malaria endemicity this method is not problematic, but in countries with varied transmission zones national coverage estimates can be biased. We describe methods for quantification of bias in national estimates of ITN coverage in countries with heterogeneous malaria distribution.
Methods Data come from 16 recent sub-Saharan demographic and health surveys (DHS) or malaria indicator surveys (MIS). Global positioning system (GPS) location of household cluster is linked with malaria atlas project maps to identify the malaria transmission zone. National ITN coverage estimates are compared with estimates adjusted for endemicity zone.
Findings In 12 of the countries analysed, 90% or more of the population lives within the same transmission zone, usually high or intermediate. These countries have little difference between the national coverage estimate and estimates adjusted for endemicity zones. Our analysis focused on four countries in which the population is distributed across varying endemicity zones: Ethiopia, Namibia, Tanzania, and Zimbabwe. In these four countries, at least 15% of the population is located in transmission zones of low or no edemicity.
Interpretation Estimates of ITN coverage that do not control for endemicity may be substantially biased downwards, particularly in countries with heterogeneity in malaria transmission. Use of a national coverage estimate may not be appropriate in countries where more than 15% of the population inhabits low or non-endemic transmission zones. Countries with this type of heterogeneity should consider using regional or zonal estimates for bednet coverage instead of national coverage estimates. These factors should be taken into account to improve the monitoring of progress toward achieving national goals and to inform in-country programmatic decision making for the distribution of ITNs.
Published Online March 14, 2011
ICF Macro, Calverton, MD, USA (C R Burgert MPH, S E K Bradley MSH, F Arnold PhD, E Eckert PhD)
Correspondence to: Clara R Burgert, ICF Macro, Calverton, MD 20705, USA [email protected]
Abstracts
18 www.thelancet.com Published online March 14, 2011 Webappendix
How reliable are maternal mortality estimates for small country populations? B Butrón Riveros, J A Escamilla, A Gerger, P Soliz, F Marinho
AbstractBackground Maternal mortality (MM) is a key event useful in assessing the quality of a health-care system. A maternal death is a relatively rare event leading to considerable random variation, especially in countries with small populations. Moreover, weak registration systems and inadequate mortality classification can lead to omission of a maternal death. This study aimed to assess whether MM estimates could be used as an alternative to routine reporting in countries with small populations.
Methods We used data for MM provided by Member States from the Pan American Health Organization (PAHO) for 1990–2009 through the PAHO Regional Core Health Data Initiative (RCHDI). Reported data were compared with estimates provided by the Institute for Health Metrics and Evaluation (IHME) and WHO. Information was presented to national officials responsible for the collection, analysis, and publication of health statistics in the English-speaking eastern Caribbean countries and territories (ECC), with a population ranging from 5000 to 256 000 inhabitants.
Findings Two of ten countries presented at least one MM estimate. IHME estimates for Barbados were higher than national data as compared with lower estimates from WHO. Saint Vincent and the Grenadines IHME estimates were lower than data reported by the country. Eight countries did not have estimates due to high uncertainty of estimates. The main difficulties encountered for indicator monitoring based on national official data as reported to PAHO were: timeliness and data availability, indicator consistency, and reliability. Other limitations were fragmented health information systems, missing standards, and lack of capacities for indicator interpretation, as well as supporting legal frameworks.
Interpretation Countries with small population cannot rely on estimates. There is an urgent need to improve routine health information systems in order to increase timeliness, accuracy, and reliability.
Published Online March 14, 2011
Pan American Health Organization (PAHO), Washington, DC, USA (B Butrón Riveros MSc,
J A Escamilla PhD, A Gerger MSc, P Soliz MD, F Marinho PhD)
Correspondence to: B Butrón Riveros, PAHO/WHO
Office of Eastern Caribbean Countries, Bridgetown,
BB11000, Barbados [email protected]

Abstracts
www.thelancet.com Published online March 14, 2011 Webappendix 19
Use of data for emergency obstetric care facilities, staff, and their geographical distribution to interpret data for maternal mortalityOona M R Campbell, Sabine Gabrysch
AbstractBackground Studies in low-income countries generally measure maternal mortality at two or three points in time, or for intervention or comparison groups. Without information about other indicators, it can be difficult to attribute causality to any associations seen. Process indicators, such as use of skilled delivery care, are widely used to supplement and to interpret health impact data. We argue, however, that indicators of health-system outputs, such as emergency obstetric care (EmOC) facilities, staff, and their geographical distribution, have great potential for monitoring of progress and understanding of impact, and are comparatively easy to measure. Yet they remain underused. The aim of our study was to make better use of data for EmOC facilities, staff, and their geographical distribution to interpret data for maternal mortality.
Methods We compared national and subnational density of health facilities, EmOC facilities, and health professionals against current benchmarks generally, and for a high maternal mortality setting (Zambia) and a low one (Sri Lanka). For Zambia, we also examined geographical accessibility by linking health facility data to population data.
Findings We showed that the EmOC facility density indicator is inconsistently defined by different UN agencies. Birth-based denominators are preferable as they are associated with maternal mortality. Current benchmarks for EmOC and staffing fail to discriminate between high and low maternal mortality settings. Zambia meets many of these benchmarks and yet has high mortality, probably because geographical access is poor and less than half its population live within 15 km of an EmOC facility. These health system output indicators are most interpretable when they specify facility capacity and staffing, and are adapted for settings with different population density to ensure geographical accessibility.
Interpretation Current health system output indicators and benchmarks need to be revised to enhance their discriminatory power. Subnational disaggregation and assessment of geographical access can identify gaps in EmOC provision and help to interpret mortality differences, and so should be routinely considered.
Published Online March 14, 2011
London School of Hygiene and Tropical Medicine, London, UK (Prof O M R Campbell PhD); and Institute of Public Health, University of Heidelberg, Heidelberg, Germany (S Gabrysch MD)
Correspondence to: Oona M R Campbell, London School of Hygiene and Tropical Medicine, London WC1E 7HT, UK [email protected]

Abstracts
20 www.thelancet.com Published online March 14, 2011 Webappendix
Socioeconomic determinants of disparities in cardiovascular risk factor prevalence in Argentina: a prelude to a multilevel approachJoaquín E Caporale, Adolfo Rubinstein, Osvaldo U Garay, Andrea Beratarrechea, Eiman Jahangir, Jonathan Willner, Andrea Alcaraz
AbstractBackground There is strong evidence that inequalities in the distribution of health outcomes are related to socioeconomic factors. Moreover, most of the traditional cardiovascular risk factors (CVRF) are determined by unhealthy lifestyles that are more commonly adopted by poor people. We explored socioeconomic inequalities in the distribution of CVRF between 2005 and 2009 in Argentina.
Methods We did a descriptive and comparative analysis using the first two National Risk Factors Surveys conducted in Argentina in 2005 and 2009. Participants were drawn from a representative general population sample from all the districts. Questionnaires included socioeconomic variables and information on self-reported modifiable risk factors: high blood pressure, high cholesterol, obesity, diabetes, tobacco use, and physical inactivity. Other aggregate socioeconomic variables by district were included (human development index, expected life expectancy at birth, gross regional product, public/private health expenditure per capita, access and supply of health services, structural poverty, maternal and child mortality, and population density and increase) to build the regression models.
Findings Except for tobacco use, which decreased from 33·4% to 30·1%, and high blood pressure, which showed no change, all CVRF analysed increased their prevalence between 2005 and 2009. In addition, their distribution showed socioeconomic gradients both at individual and provincial or regional level when incorporating the aggregate variables. Sedentary lifestyle had an important increase (from 46·2% to 54·9%), which mainly impacted on the lower income groups. High cholesterol, obesity, and diabetes also had modest increases; the most affected group was the poorest quintile, particularly for obesity.
Interpretation There are wide disparities in the distribution of CVRF in Argentina that are partly explained by socioeconomic determinants. A multilevel approach is warranted to understand this association in order to implement policies to reduce cardiovascular health disparities related to social determinants.
Published Online March 14, 2011
Institute for Clinical Effectiveness and Health Policy,
Buenos Aires, Argentina (J E Caporale MSc, A Rubinstein PhD,
O U Garay MSc, A Beratarrechea MD,
E Jahangir MD, J Willner MD, A Alcaraz MSc)
Correspondence to: Joaquín E Caporale, Instituto de
Efectividad Clínica y Sanitaria, Dr Emilio Ravignani 2024,
Ciudad de Buenos Aires, C1414CPV, Argentina
Abstracts
www.thelancet.com Published online March 14, 2011 Webappendix 21
Published Online March 14, 2011
Thailand Development Research Institute, Bangkok, Thailand (W Chandoevwit PhD); Institute for Population and Social Research, Mahidol University, Nakhon Pathom, Thailand (P Vapattanawong PhD); and Bureau of Health Promotion, Department of Health (N Riewpitak MA), and Bureau of Policy and Strategy, Office of The Permanent Secretary (A Sublon MSc), Ministry of Public Health, Nonthaburi, Thailand
Correspondence to: Worawan Chandoevwit, Thailand Development Research Institute, Wangthonglang, Bangkok 10310, Thailand [email protected]
Thailand’s approach to measuring maternal mortality ratioWorawan Chandoevwit, Patama Vapattanawong, Nuchpiya Riewpitak, Auraphin Sublon
AbstractBackground The aims of this study are to use multiple sources of data to calculate the maternal mortality ratio (MMR) in 2004–09, and to illustrate the difference between the official causes of death with the research findings.
Methods This research uses individual data from civil registration and inpatient records from all public hospitals. The civil registration contains data about individual’s personal identification (PID), parent’s PID, date of birth, date of death, cause of death, place of birth, place of death, and individual address. Inpatient records contain individual’s PID, type of health insurance, diagnosis, treatment modality, and discharge type. Matching technique is used. The key variable for matching these data sources is individual’s PID.
Findings The results show that the number of maternal deaths declined from 362 in 2004 to 269 in 2009. The country’s MMR declined from 44·5 to 35·2, a 21% reduction. In 2009, about 11% of maternal deaths were in women aged 15–19 years. The north had the highest MMR in 2008–09, but the south had the highest MMR in 2007.
Interpretation About 20–30% of maternal deaths with the matching technique are officially reported as maternal death in the individual’s death certificate. The remaining 70–80% were reported as other causes unrelated to pregnancy, childbirth, and the puerperium. The main causes of death reported in the death certificates were infectious and parasitic diseases (about 20%); diseases of the circulatory and respiratory systems (about 17%); and symptoms, signs, and abnormal clinical and laboratory findings, which are not classified elsewhere (about 20%). Using matching technique together with individual data, policy makers can get reliable information about the causes of maternal death. As a result, policy can be designed to improve maternal health.
Abstracts
22 www.thelancet.com Published online March 14, 2011 Webappendix
Health-care service inequalities in developing countries: a comparative study based on the world health surveyXuan Che, Maria Matrosova, Priyanka Saksena, Ke Xu
AbstractBackground Inequality of a country’s health-care system plays a determinant role to its performance level. In many developing countries there are big challenges to achieve health-service equality, both in terms of the financial burden to the patients and the system’s ability to meet their needs. We study the causes behind those challenges and reveal similarities shared by more than one country.
Methods The world health survey (WHS) was conducted by WHO across 72 countries and provided a unique opportunity to compare individual samples and national averages of health-care use and demand around the world with a consistent and standardised method of sampling. We focused on the 52 developing countries of low to middle-low income in an effort to understand the patterns towards demand, use, and cost among different subpopulations in each country. The WHS samples for 1 year inpatient services and 30 day outpatient services in each country were analysed by statistical modelling with main covariates of interest of age, sex, urban or rural, education, and employment and habitation status. Inequality distributions were measured and the concentration indices, an inequality indicator, were calculated.
Findings The inference clearly showed that the 52 countries could be separated into three groups, denoted as pro-poor, pro-rich, and neutral according to their health-care system performances against patients’ demand, use, and financial burden. Out-of-pocket expenditure was a heavy burden in almost all low-income countries. Demands varied between countries and showed a distance from actual medical needs, and were generally lower in low-income countries. The inequality indicators were also decomposed to the proportions attributed to each of the covariate of interest; we found that education, employment, and habitation status were the driving forces, among others, affecting the inequality level in many developing countries.
Interpretation Several countries are able to maintain a pro-poor system in which the lowest income subpopulation bears the lightest burden when visiting a health-care service, while the highest income subpopulation bears the heaviest. Understanding the key of balancing the strata in these systems will provide an insight into the reformation of health-care systems in other pro-rich countries.
AcknowledgmentsThis study is made possible by the data provided by the world health survey conducted by WHO. WHO does not endorse the statements, views, or opinions expressed by the authors herein under any circumstance, or assume any legal liability or responsibility for the accuracy, completeness, or usefulness of any information and product.
Published Online March 14, 2011
Oregon State University, Corvallis, OR, USA (X Che MS);
University of Geneva, Geneva, Switzerland (M Matrosova MS); and WHO, Geneva, Switzerland
(P Saksena MSc, K Xu PhD)
Correspondence to: Xuan Che, Oregon State
University, Corvallis, OR 97331, USA

Abstracts
www.thelancet.com Published online March 14, 2011 Webappendix 23
Worldwide surveillance of cancer survivalMichel P Coleman, Cary Adams, Tom Tucker
AbstractBackground Cancer causes 10 million deaths a year, and 16 million new cases a year are expected by 2020, two-thirds in developing countries that are least equipped to cope. Even with optimal prevention, millions of patients will need treatment each year for the foreseeable future. The aims of this study are to establish standardised global surveillance of cancer survival and to provide comparable outcome metrics for evaluating health system effectiveness.
Methods Over 140 population-based cancer registries in 50 countries worldwide will submit individual tumour records for adults (15–99 years) diagnosed in 1995–2007 to centralised quality control. Ten malignancies will be studied: stomach, colon, rectum, liver, lung, breast (women), cervix, ovary, prostate, and leukaemia. Relative survival will be estimated with the maximum likelihood method using the open-source strel algorithm in Stata, corrected for background mortality by single year of age, sex, calendar year, and race in each country or region, with life tables constructed from the numbers of deaths and populations. Survival trends will be age-standardised with the international cancer survival standard weights.
Findings 5-year survival varied very widely among 2 million adults diagnosed in 1990–94 with cancers of the breast (women), colon, rectum, or prostate in 101 populations in 31 countries on five continents. Results of the second cycle will establish global surveillance of survival trends from 1995 to 2007.
Interpretation International inequalities in survival represent great avoidable premature mortality. Establishing surveillance will prompt countries to improve their health systems. It will also measure progress toward the World Cancer Declaration goal of major improvements in survival worldwide by 2020.
Published Online March 14, 2011
London School of Hygiene and Tropical Medicine, London, UK (Prof M P Coleman BM BCh); Union for International Cancer Control, Geneva, Switzerland (C Adams MBA); and University of Kentucky Markey Cancer Center, Lexington, KY, USA (Prof T Tucker MPH)
Correspondence to: Michel P Coleman, London School of Hygiene and Tropical Medicine, London WC1E 7HT, UK [email protected]

Abstracts
24 www.thelancet.com Published online March 14, 2011 Webappendix
A rapid, low-cost method for evaluation of distribution of insecticide-treated netsDennis Danforth, James Lin, Stephen Merjavy, Brendan Milliner, Nils Hennig
AbstractBackground Distribution of insecticide-treated nets (ITNs) is the centrepiece of most malaria intervention programmes, with an estimated 140 million ITNs distributed in high-burden African countries in 2006–08. WHO has advocated for additional coverage of 200 million more ITNs by the end of 2010. Evaluations of these interventions have largely relied on morbidity rates reported by local ministries of health and estimates of coverage based on ITN distribution data. A rapid, low-cost method of evaluation that reports malaria prevalence and ITN usage at the household level is needed to properly evaluate different intervention programme designs and ensure maximum efficacy of future ITN distributions.
Methods A governmental ITN distribution to households with children under 5 years in northwestern Tanzania was evaluated with a two-phase approach. With a systematic random sampling method, household surveys were completed in a village of 5600 residents before the intervention and 1 year after. All individuals in the households were tested for malaria with an antigen-based rapid diagnostic test, and bednet ownership and usage were determined through a survey and visual inspection.
Findings Malaria prevalence decreased from 15·8% at baseline (n=392) to 6·5% at 1 year post-intervention (n=417). Household net ownership increased from 50·6% to 70·4%, and self-reported net usage increased from 20·4% to 38·4%.
Interpretation Our evaluation allowed detailed analysis of the ITN distribution, including the intervention’s efficacy in reaching the target population of children under 5 years, and enabled the intervention sponsor to receive rapid feedback on their programme design. Our methodology is adaptable to a wide range of intervention targets, and can be implemented with minimum training and cost. Application of this evaluation methodology has the potential to allow improvement in the efficacy of malaria interventions.
Published Online March 14, 2011
Global Health Center, Mount Sinai School of Medicine,
New York, NY, USA (D Danforth BS, J Lin MS,
S Merjavy BA, B Milliner BA, N Hennig MD)
Correspondence to: Dennis Danforth, Global Health
Center, Mount Sinai School of Medicine, New York,
NY 10029, USA [email protected]

Abstracts
www.thelancet.com Published online March 14, 2011 Webappendix 25
The use of audience response systems for school-based health research surveys in New York City elementary school children: feasibility and cost-effectivenessAlexandra DeSorbo, Olajide Williams
AbstractBackground The use of audience response systems (ARS) has gained acceptance in recent years, especially amongst college and graduate students. Studies have shown that this system increases student participation rates, and helps to build students’ self-confidence, knowledge of self-mastery, and motivation. To the best of our knowledge, no published data exist regarding the feasibility and cost-effectiveness of this technology for health research surveys among elementary school children. This study aimed to evaluate the feasibility and cost-effectiveness of use of ARS among elementary school children aged 8–11 years in low-income communities.
Methods 10 000 elementary school children aged 8–11 years in New York City, USA, were enrolled over 1 year in a school-based health literacy intervention. Pretest and post-test surveys were performed with palm-sized wireless ARS devices. In a comparative study, we evaluated the average time and costs, including personnel, required to score traditional paper tests. Surveys were assessed for the quality of responses, including missing data, participation, and student preference. Questions were asked regarding students’ preference for either traditional paper tests or ARS. We also collected cost data for the ARS system and its implementation. Data were analysed with SAS (version 9.2).
Findings Participation rates by children were 90% across pretests and post-tests, for both ARS and paper tests. The average time required by a trained individual to score each paper test was 3 min compared with instant results generated by the ARS software. 85% of children preferred using ARS to traditional paper tests. The average cost per test for the ARS system was US$0·54 compared with $0·94 for the traditional paper tests.
Interpretation The use of ARS among low-income elementary school children aged 8–11 years for school-based health surveys is feasible and cost effective. Our findings suggest that ARS is the preferred choice of student participants and may be more cost effective and efficient for researchers.
Published Online March 14, 2011
Harlem Hospital Center, New York, NY, USA (A DeSorbo MPH); and Columbia University Medical Center College of Physicians and Surgeons, New York, NY, USA (O Williams MD)
Correspondence to: Alexandra DeSorbo, Harlem Hospital Center, New York, NY 10037, USA [email protected]
Abstracts
26 www.thelancet.com Published online March 14, 2011 Webappendix
Epidemiological transition in Sri Lanka from 1950 to 2006Samath D Dharmaratne, Kyle Foreman, Rajitha Jayasuriya
AbstractBackground Sri Lanka is one of few developing countries to have a long running civil registration system of all deaths. The epidemiological transition has not been addressed. Our aim was to examine the epidemiological transition in Sri Lanka to show trends in the three broad categories of disease (communicable, non-communicable, and injuries) and to examine several specific diseases in detail.
Methods We adapted maps from the Global Burden of Disease (GBD) project to translate data from International Classification of Diseases versions 7–10 into a common set of 29 causes. We then applied these maps to cause of death (CoD) data from 1950 to 2006, available from the Registrar General’s Department, and created trends in age-specific and sex-specific death rates by cause. We used LOESS regression to smooth the data.
Findings Sri Lanka has had a large decline in deaths from communicable diseases since 1950. Age-adjusted death rates for men from communicable diseases were over 400 per 100 000 people in 1950, down to about 30 in 2006. Parasitic and vector diseases declined from 55 to five deaths per 100 000 from 1950 to 1970, and tuberculosis similarly dropped from 60 to less than ten per 100 000 from 1950 to 2006. An increase in non-communicable diseases was observed in the same period. Just over 300 per 100 000 men died of non-communicable diseases in 1950, increasing to over 450 in 2006. Cardiovascular deaths doubled from 80 to 160 per 100 000 men. Diabetes trebled from less than ten deaths to about 30 per 100 000. Additionally, injuries increased from 55 to 150 per 100 000 men from 1950 to 2006.
Interpretation Sri Lanka has undergone vast changes in the composition of its deaths since 1950. Under-registration and misclassification of deaths, particularly from the early period, may contribute to increases in non-communicable diseases since 1950, which is an aspect that we plan to address and present.
Published Online March 14, 2011
Department of Community Medicine, Faculty of Medicine,
University of Peradeniya, Peradeniya, Sri Lanka (S D Dharmaratne MD,
R Jayasuriya MSc); and Institute for Health Metrics and
Evaluation, University of Washington, Seattle, WA, USA
(K Foreman AB)
Correspondence to: Samath D Dharmaratne,
Department of Community Medicine, Faculty of Medicine,
University of Peradeniya, Peradeniya 20400, Sri Lanka
Abstracts
www.thelancet.com Published online March 14, 2011 Webappendix 27
Development assistance, subadditionality, and health outcomesJoe Dieleman
AbstractBackground The past several decades have seen an enormous scale-up of development assistance for health (DAH), with recent estimates suggesting that DAH has nearly quadrupled between 1990 and 2007. This explosion of funds, combined with persistent global health needs, makes tracking and assessment of these international flows of unprecedented importance. Until recently, the dearth of cross-national data has limited macrolevel analysis. With recently published data for financial flows, this study offers preliminary results that begin to fill a portion of this gap, providing measurements and the corresponding health effects of subadditionality.
Methods A 102-country, 12-year panel of health, education, government expenditure, and development assistance data was compiled. Fixed-effects and random-parameter estimation techniques are used to measure subadditionality across 12-year, 6-year, and 4-year increments and estimate the health effect of substitution across sectors.
Findings Results suggest that subadditionality varies across countries and time, suggesting an assortment of national health finance policies. With the 12-year measurements, estimates range from extremes where five countries substitute away more than they receive in DAH, while one country, Malawi, is measured as supplementing its development assistance with additional health expenditure. These measurements also show that subadditionality has negative consequences for health, even when controlling for total public health expenditure. These estimates show that if a country with the median 6-year measurement of subadditionality did not substitute funds across sectors and simply held total public health expenditure constant, child mortality could be reduced by 1·9%.
Interpretation Subadditionality varies across country and time, but on average leads to statistically significant lower levels of population health as measured. More research is certainly warranted.
Published Online March 14, 2011
Institute for Health Metrics and Evaluation, University of Washington, Seattle, WA, USA (J Dieleman MA)
Correspondence to: Joe Dieleman, Institute for Health Metrics and Evaluation, University of Washington, Seattle, WA 98121, USA [email protected]

Abstracts
28 www.thelancet.com Published online March 14, 2011 Webappendix
Decomposition of the fertility response to a mortality-reducing intervention in Matlab, BangladeshJulia Driessen
AbstractBackground This paper examines how an exogenous decline in child mortality risk affects fertility with use of data from a measles vaccination intervention in Matlab, Bangladesh. The intervention is assumed to generate the exogenous mortality decline. There has been considerable past research on the fertility–mortality link, but the majority of studies examine only the effect of totals—namely, the effect of cumulative net child mortality on cumulative fertility outcomes (pregnancies, birth intervals, etc). I show that this method is biased and that unbiased estimates can be obtained from a sequential, year-by-year model with fertility as a function of recent child mortality and treatment exposure.
Methods With use of panel data from Matlab, Bangladesh, and incorporating fixed effects to account for unobservable fertility preferences, I examine how mothers with varying fertility and child mortality histories adjust their fertility differently from the measles vaccination intervention. Examination of individual fertility decisions rather than the total outcomes allows for control of time-sensitive factors such as the introduction of other interventions and the effect of recent births.
Findings By contrast with the total approach, I find not only an overall positive effect of the intervention on fertility, but also significant variation in the fertility response based on the number of living children, the number children eligible for vaccination, the number of recent child mortalities, and family gender composition.
Interpretation By examination of the individual fertility decisions, this decomposition allows for a more nuanced look at how the intervention operates in the population. In terms of programme evaluation, the results show that current techniques may not be completely capturing the costs and benefits, possibly leading to biased decision making.
Published Online March 14, 2011
Johns Hopkins University, Baltimore, MD, USA
(J Driessen MA)
Correspondence to: Julia Driessen, Johns Hopkins
University, Baltimore, MD 21044, USA

Abstracts
www.thelancet.com Published online March 14, 2011 Webappendix 29
Provincial and district-level trends in under-5 mortality in Zambia Laura Dwyer-Lindgren, Emmanuela Gakidou, Julie Rajaratnam, Felix Masiye
AbstractBackground From 1990 to 2010, under-5 mortality in Zambia at the national level dropped by 31·3%, from 173 to 119 deaths per 1000 livebirths. These national figures, however, may mask considerable differences in the trend and level of under-5 mortality within Zambia. In order to understand how the burden of mortality is distributed within Zambia, and how reductions in under-5 mortality have been distributed throughout the country, we need to examine mortality at a finer geographical level. Our objective is to produce estimates of under-5 mortality over time at the province and district level.
Methods We will use direct and indirect demographic methods to analyse complete and/or summary birth histories contained in population censuses, demographic and health surveys (DHS), and malaria indicator surveys (MIS) done in Zambia. This study will allow us to produce estimates at the province level and initial estimates at the district level. We will then construct a small area model to produce final district level estimates.
Findings Preliminary analyses of the DHS complete birth histories, pooled across all surveys, suggest considerable variability in both the level of and trend in under-5 mortality among the provinces (figure). In 2005, the most recent year for which estimates from the DHS are available, under-5 mortality at the province level ranged from 88·0 (95% CI 67·8–110·9) in Northwestern province to 139·2 (113·3–165·9) in Northern province, a nearly two-fold difference. Similarly, the annualised percentage decline between 1990 and 2005 ranged from less than 1% in Lusaka to more than 5% in Luapula.
Interpretation By analysing available data sources in addition to the DHS and constructing a small area model to allow us to produce district level estimates, we will be able to create a more complete picture of how under-5 mortality varies within Zambia.
Published Online March 14, 2011
Institute for Health Metrics and Evaluation, University of Washington, Seattle, WA, USA (L Dwyer-Lindgren BA, E Gakidou PhD, J Rajaratnam PhD); and University of Zambia, Lusaka, Zambia (F Masiye PhD)
Correspondence to: Laura Dwyer-Lindgren, Institute for Health Metrics and Evaluation, University of Washington, Seattle, WA 98121, USA [email protected]
Figure: National estimates of under-5 mortality (5q0) and provincial level 5q0 estimates from pooled analysis of DHS complete birth histories
0002099108910791
100
150
200
250
300
Under-5 mortality in Zambia
Year
5q0
(per
100
0)
national
central
copperbelt
eastern
luapula
lusaka
north-western
northern
southern
western

Abstracts
30 www.thelancet.com Published online March 14, 2011 Webappendix
Estimates of child deaths prevented from malaria prevention scale-up in Africa, 2001–10Thomas P Eisele, Neff Walker, David A Larsen, Richard I Cibulskis, Joshua O Yukich, Charlotte M Zikusooka, Richard W Steketee
AbstractBackground The unprecedented effort to scale up malaria prevention interventions is probably improving child survival. Unfortunately, vital registration data are generally not available in most malaria-endemic countries for ascertainment of such changes at the national level. We used the Lives Saved Tool (LiST) model to quantify the likely impact that malaria prevention intervention scale-up has had on child malaria mortality over the past decade (2001–10) across 34 countries in sub-Saharan Africa.
Methods We modelled the likely impact of vector control (insecticide-treated mosquito nets [ITNs] and indoor-residual spraying) and malaria prevention in pregnancy (intermittent preventive treatment and ITNs) from 2001 to 2010 with the LiST model. The model estimates child deaths prevented due to intervention scale-up as a function of three primary parameters: number of child malaria deaths estimated to occur each year; each intervention’s protective effect on malaria mortality; and increases in intervention coverage. In an effort to validate the LiST model, we compared modelled estimates of all-cause child mortality to those from seven studies that measured mortality following ITN scale-up.
Findings We estimated that malaria prevention intervention scale-up over the past decade has prevented 736 700 (uncertainty range 483 600–1 021 800) child deaths across 34 countries in sub-Saharan Africa since 2000, representing a 7·5% decrease in child deaths over this period. The biggest impact will have occurred in 2010, with a 17·7% decrease in child deaths. The percentage reduction in child mortality estimated by LiST was within the 95% CIs reported by all studies in the validation analysis.
Interpretation The results suggest that funding for malaria control in Africa over the past decade has had a substantial impact on prevention of child deaths related to malaria. Rapidly achieving and then maintaining universal coverage of these interventions should be of the highest priority for malaria control programmes.
Published Online March 14, 2011
Department of International Health and Development,
Tulane School of Public Health and Tropical Medicine, New
Orleans, LA, USA (T P Eisele PhD, D A Larsen MPH, J O Yukich PhD);
Department of International Health, Johns Hopkins
Bloomberg School of Public Health, Baltimore, MD, USA
(N Walker PhD); Global Malaria Programme, WHO, Geneva,
Switzerland (R I Cibulskis PhD); HealthNet Consult, Kampala, Uganda (C M Zikusooka PhD);
and Malaria Control and Evaluation Partnership in
Africa (MACEPA), a programme at PATH, Ferney-Voltaire, France (R W Steketee MD)
Correspondence to: Thomas P Eisele, Department of
International Health and Development, Tulane University
School of Public Health and Tropical Medicine, New Orleans,
LA 70112, USA [email protected]
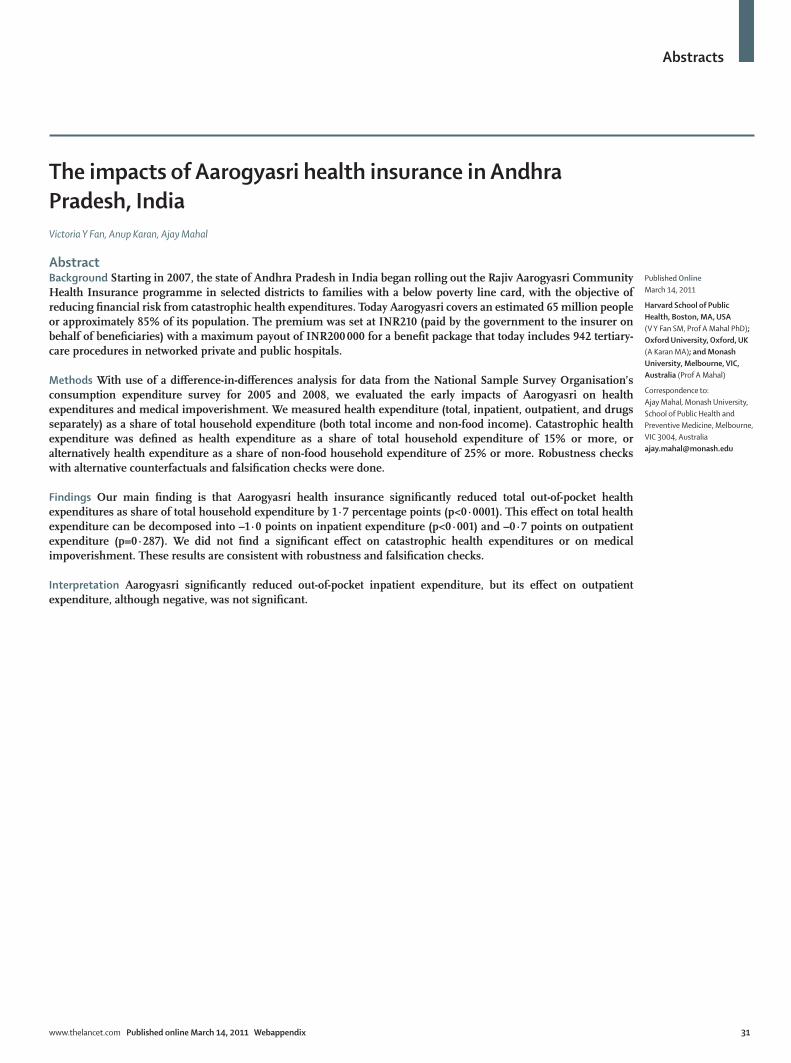
Abstracts
www.thelancet.com Published online March 14, 2011 Webappendix 31
The impacts of Aarogyasri health insurance in Andhra Pradesh, IndiaVictoria Y Fan, Anup Karan, Ajay Mahal
AbstractBackground Starting in 2007, the state of Andhra Pradesh in India began rolling out the Rajiv Aarogyasri Community Health Insurance programme in selected districts to families with a below poverty line card, with the objective of reducing financial risk from catastrophic health expenditures. Today Aarogyasri covers an estimated 65 million people or approximately 85% of its population. The premium was set at INR210 (paid by the government to the insurer on behalf of beneficiaries) with a maximum payout of INR200 000 for a benefit package that today includes 942 tertiary-care procedures in networked private and public hospitals.
Methods With use of a difference-in-differences analysis for data from the National Sample Survey Organisation’s consumption expenditure survey for 2005 and 2008, we evaluated the early impacts of Aarogyasri on health expenditures and medical impoverishment. We measured health expenditure (total, inpatient, outpatient, and drugs separately) as a share of total household expenditure (both total income and non-food income). Catastrophic health expenditure was defined as health expenditure as a share of total household expenditure of 15% or more, or alternatively health expenditure as a share of non-food household expenditure of 25% or more. Robustness checks with alternative counterfactuals and falsification checks were done.
Findings Our main finding is that Aarogyasri health insurance significantly reduced total out-of-pocket health expenditures as share of total household expenditure by 1·7 percentage points (p<0·0001). This effect on total health expenditure can be decomposed into –1·0 points on inpatient expenditure (p<0·001) and –0·7 points on outpatient expenditure (p=0·287). We did not find a significant effect on catastrophic health expenditures or on medical impoverishment. These results are consistent with robustness and falsification checks.
Interpretation Aarogyasri significantly reduced out-of-pocket inpatient expenditure, but its effect on outpatient expenditure, although negative, was not significant.
Published Online March 14, 2011
Harvard School of Public Health, Boston, MA, USA (V Y Fan SM, Prof A Mahal PhD); Oxford University, Oxford, UK (A Karan MA); and Monash University, Melbourne, VIC, Australia (Prof A Mahal)
Correspondence to: Ajay Mahal, Monash University, School of Public Health and Preventive Medicine, Melbourne, VIC 3004, Australia [email protected]
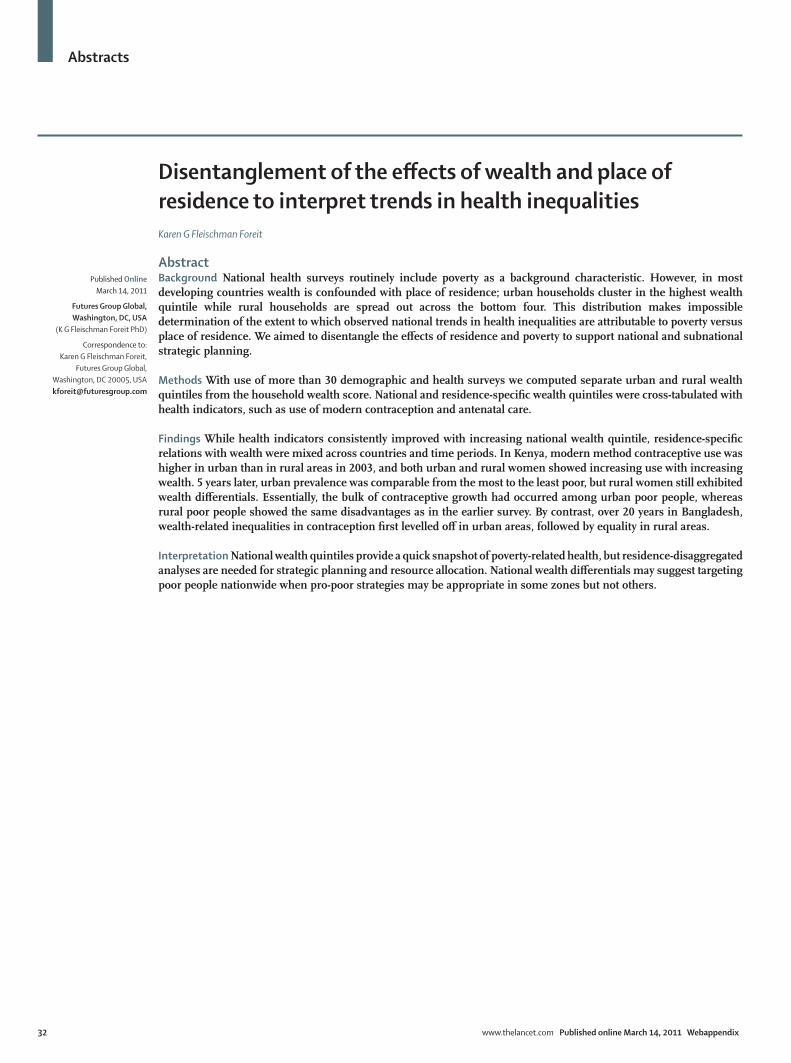
Abstracts
32 www.thelancet.com Published online March 14, 2011 Webappendix
Disentanglement of the effects of wealth and place of residence to interpret trends in health inequalitiesKaren G Fleischman Foreit
AbstractBackground National health surveys routinely include poverty as a background characteristic. However, in most developing countries wealth is confounded with place of residence; urban households cluster in the highest wealth quintile while rural households are spread out across the bottom four. This distribution makes impossible determination of the extent to which observed national trends in health inequalities are attributable to poverty versus place of residence. We aimed to disentangle the effects of residence and poverty to support national and subnational strategic planning.
Methods With use of more than 30 demographic and health surveys we computed separate urban and rural wealth quintiles from the household wealth score. National and residence-specific wealth quintiles were cross-tabulated with health indicators, such as use of modern contraception and antenatal care.
Findings While health indicators consistently improved with increasing national wealth quintile, residence-specific relations with wealth were mixed across countries and time periods. In Kenya, modern method contraceptive use was higher in urban than in rural areas in 2003, and both urban and rural women showed increasing use with increasing wealth. 5 years later, urban prevalence was comparable from the most to the least poor, but rural women still exhibited wealth differentials. Essentially, the bulk of contraceptive growth had occurred among urban poor people, whereas rural poor people showed the same disadvantages as in the earlier survey. By contrast, over 20 years in Bangladesh, wealth-related inequalities in contraception first levelled off in urban areas, followed by equality in rural areas.
Interpretation National wealth quintiles provide a quick snapshot of poverty-related health, but residence-disaggregated analyses are needed for strategic planning and resource allocation. National wealth differentials may suggest targeting poor people nationwide when pro-poor strategies may be appropriate in some zones but not others.
Published Online March 14, 2011
Futures Group Global, Washington, DC, USA
(K G Fleischman Foreit PhD)
Correspondence to: Karen G Fleischman Foreit,
Futures Group Global, Washington, DC 20005, USA [email protected]

Abstracts
www.thelancet.com Published online March 14, 2011 Webappendix 33
Identification of epidemiological factors for ischaemic heart disease with predictive validityKyle Foreman, Farshad Pourmalek, Mohsen Naghavi, Rafael Lozano, Christopher J L Murray
AbstractBackground The processes and criteria used to select covariates in models for cause of death estimation vary widely. Ideally, the process should be informed by whether the model is descriptive or predictive, a-priori physiological or epidemiological relationships, and the amount or pattern of missing data. Our method selects model covariates based on both relationships to the quantity of interest and ability to predict for out-of-sample datapoints. It identifies which covariates generate accurate out-of-sample estimates when the pattern of missing data is not random, such as compositional bias seen in datasets when predicting global disease burden. We present such an analysis of ischaemic heart disease (IHD).
Methods Our dataset contained 2752 country-years of age-specific and sex-specific IHD death rates; because of data availability it is heavily skewed towards high-income countries (>45% of datapoints) with few data from sub-Saharan Africa (<2%). A battery of tests on our spatial-temporal model determined which covariates best predicted IHD death rates for countries without complete data. Test cases included dropping all data for 20% of countries, dropping 20% of total country-years, and dropping the earliest or latest 20% of all data. We used the out-of-sample root mean square error (RMSE) and coverage to inform covariate choices.
Findings Demographic characteristics such as income, education, and age structure best predicted IHD death rates out-of-sample. Tobacco consumption worked best when lagged by 10 years. Some dietary factors (eg, amount of animal fat consumed) improved the model, whereas others (eg, total caloric intake and alcohol consumption) did not. We plan to test others—eg, fish oil and nut consumption. The predictive validity tests successfully rejected covariates that we believe should not be related (eg, HIV prevalence and level of sanitation).
Interpretation Predictive validity can help to select the best covariates when ordinary measures like R² fail to account for non-random aspects of the data and when the goal is to estimate out-of-sample.
Published Online March 14, 2011
Institute for Health Metrics and Evaluation, University of Washington, Seattle, WA, USA (K Foreman AB, F Pourmalek PhD, M Naghavi PhD, Prof R Lozano MD, Prof C J L Murray DPhil)
Correspondence to: Kyle Foreman, Institute for Health Metrics and Evaluation, University of Washington, Seattle, WA 98121, USA [email protected]
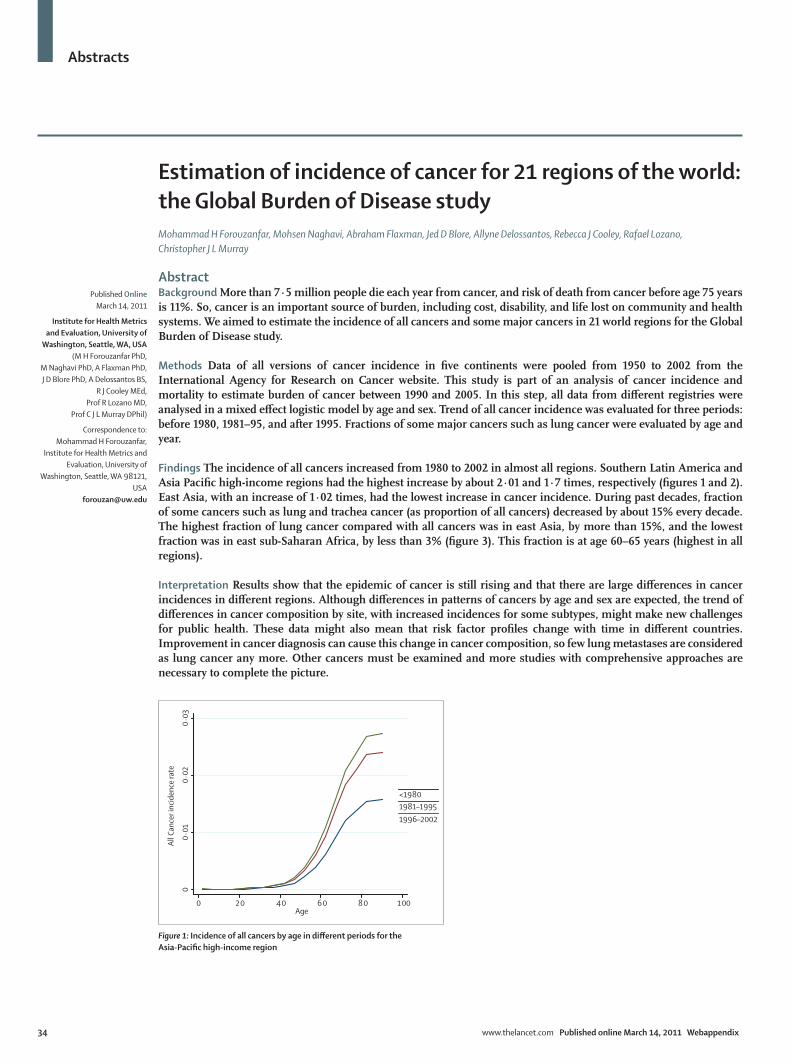
Abstracts
34 www.thelancet.com Published online March 14, 2011 Webappendix
Estimation of incidence of cancer for 21 regions of the world: the Global Burden of Disease studyMohammad H Forouzanfar, Mohsen Naghavi, Abraham Flaxman, Jed D Blore, Allyne Delossantos, Rebecca J Cooley, Rafael Lozano, Christopher J L Murray
AbstractBackground More than 7·5 million people die each year from cancer, and risk of death from cancer before age 75 years is 11%. So, cancer is an important source of burden, including cost, disability, and life lost on community and health systems. We aimed to estimate the incidence of all cancers and some major cancers in 21 world regions for the Global Burden of Disease study.
Methods Data of all versions of cancer incidence in five continents were pooled from 1950 to 2002 from the International Agency for Research on Cancer website. This study is part of an analysis of cancer incidence and mortality to estimate burden of cancer between 1990 and 2005. In this step, all data from different registries were analysed in a mixed effect logistic model by age and sex. Trend of all cancer incidence was evaluated for three periods: before 1980, 1981–95, and after 1995. Fractions of some major cancers such as lung cancer were evaluated by age and year.
Findings The incidence of all cancers increased from 1980 to 2002 in almost all regions. Southern Latin America and Asia Pacific high-income regions had the highest increase by about 2·01 and 1·7 times, respectively (figures 1 and 2). East Asia, with an increase of 1·02 times, had the lowest increase in cancer incidence. During past decades, fraction of some cancers such as lung and trachea cancer (as proportion of all cancers) decreased by about 15% every decade. The highest fraction of lung cancer compared with all cancers was in east Asia, by more than 15%, and the lowest fraction was in east sub-Saharan Africa, by less than 3% (figure 3). This fraction is at age 60–65 years (highest in all regions).
Interpretation Results show that the epidemic of cancer is still rising and that there are large differences in cancer incidences in different regions. Although differences in patterns of cancers by age and sex are expected, the trend of differences in cancer composition by site, with increased incidences for some subtypes, might make new challenges for public health. These data might also mean that risk factor profiles change with time in different countries. Improvement in cancer diagnosis can cause this change in cancer composition, so few lung metastases are considered as lung cancer any more. Other cancers must be examined and more studies with comprehensive approaches are necessary to complete the picture.
Published Online March 14, 2011
Institute for Health Metrics and Evaluation, University of
Washington, Seattle, WA, USA (M H Forouzanfar PhD,
M Naghavi PhD, A Flaxman PhD, J D Blore PhD, A Delossantos BS,
R J Cooley MEd, Prof R Lozano MD,
Prof C J L Murray DPhil)
Correspondence to: Mohammad H Forouzanfar,
Institute for Health Metrics and Evaluation, University of
Washington, Seattle, WA 98121, USA
Figure 1: Incidence of all cancers by age in different periods for the Asia-Pacific high-income region
00·
010·
020·
03
All C
ance
r inc
iden
ce ra
te
0 20 40 60 80 100Age
<19801981–19951996–2002

Abstracts
www.thelancet.com Published online March 14, 2011 Webappendix 35
Figure 2: Incidence of all cancers by age in different regions of the world, 1996–2002
00·
010·
020·
030·
04
Canc
er in
ciden
ce ra
te0 20 40 60 80 100
Age
Region=Asia Pacific, High Income/Region = Sub-Saharan Africa, SouthernRegion=Asia, EastRegion=Asia, SouthRegion=Asia, SoutheastRegion=AustralasiaRegion=Europe, CentralRegion=Europe, EasternRegion=Europe, WesternRegion=Latin America, AndeanRegion=Latin America, CentralRegion=Latin America, SouthernRegion=Latin America, TropicalRegion=North Africa/Middle EastRegion=North America, High IncomeRegion=Sub-Saharan Africa, East
Figure 3: Lung and trachea cancer fraction by age and three periods from before 1980 to 2002
00·
050·
10·
150·
2Lu
ng a
nd T
rach
ea ca
ncer
frac
tion
0 20 40 60 80 100Age
gbd_re~n=Asia_East/gbd_re~n = Sub_Saharan_Africa_Southerngbd_re~n=Asia_Pacific_High_Incomegbd_re~n=Asia_Southgbd_re~n=Asia_Southeastgbd_re~n=Australasiagbd_re~n=Europe_Centralgbd_re~n=Europe_Easterngbd_re~n=Europe_Westerngbd_re~n=Latin_America_Andeangbd_re~n=Latin_America_Centralgbd_re~n=Latin_America_Southerngbd_re~n=Latin_America_Tropicalgbd_re~n=North_Africa_Middle_Eastgbd_re~n=North_America_High_Incomegbd_re~n=Sub_Saharan_Africa_East

Abstracts
36 www.thelancet.com Published online March 14, 2011 Webappendix
Net benefits: the effectiveness of insecticide-treated bednets for reduction of childhood mortality and malaria morbidity across 23 sub-Saharan African countriesNancy Fullman, Andrew Stokes, Nirmala Ravishankar, Felix Masiye, Christopher J L Murray, Emmanuela Gakidou, Stephen S Lim
AbstractBackground Several sub-Saharan African countries have rapidly scaled up the number of households owning insecticide-treated bednets (ITNs). Although the efficacy of ITNs in trials has been repeatedly demonstrated, evidence for their impact under routine conditions is limited. Without such information, the extent to which the scale-up of ITNs has improved population health remains uncertain. We aimed to systematically assess the association between degree of ITN household ownership and use in children under 5 years and child mortality and parasitaemia among children across a range of countries.
Methods We used Cox proportional hazards models to assess the individual-level association between household ITN ownership and use and the prevalence of parasitaemia as well as child mortality, controlling for numerous confounders. We examined the effect of ITN ownership by underlying malaria transmission risk, and the number of ITNs in households.
Findings With random effects meta-analysis, the pooled reduction in parasitaemia associated with ITN ownership was 15% (95% CI 3–25; I²=20·8, p=0·271) and with ITN use by children under 5 years was 14% (95% CI 2–25; I²=0·0, p=0·977). Additionally, there was a significant pooled reduction in child mortality of 18% (95% CI 8–26; I²=16·5%, p=0·237). Compared with low transmission areas, we found a larger effect of ITN ownership on child mortality in high and medium transmission areas. In high and medium transmission areas, owning two or more ITNs appears to have a greater effect on health outcomes than owning only one ITN.
Interpretation Our findings are highly consistent with clinical trial results and suggest that the recent scale-up in ITN coverage has probably been accompanied by significant reductions in child mortality. Additional gains in improvement of population health may be achieved with further increases in ITN coverage in areas at risk of malaria.
Published Online March 14, 2011
Institute for Health Metrics and Evaluation, University of
Washington, Seattle, WA, USA (N Fullman BA,
Prof C J L Murray DPhil, E Gakidou PhD, S S Lim PhD);
Population Studies Center, University of Pennsylvania,
Philadelphia, PA, USA (A Stokes AM); Abt Associates
Inc, Bethesda, MD, USA (N Ravishankar PhD); and
Department of Economics, University of Zambia, Lusaka,
Zambia (Prof F Masiye PhD)
Correspondence to: Nancy Fullman, Institute for
Health Metrics and Evaluation, University of Washington,
Seattle, WA 98121, USA [email protected]
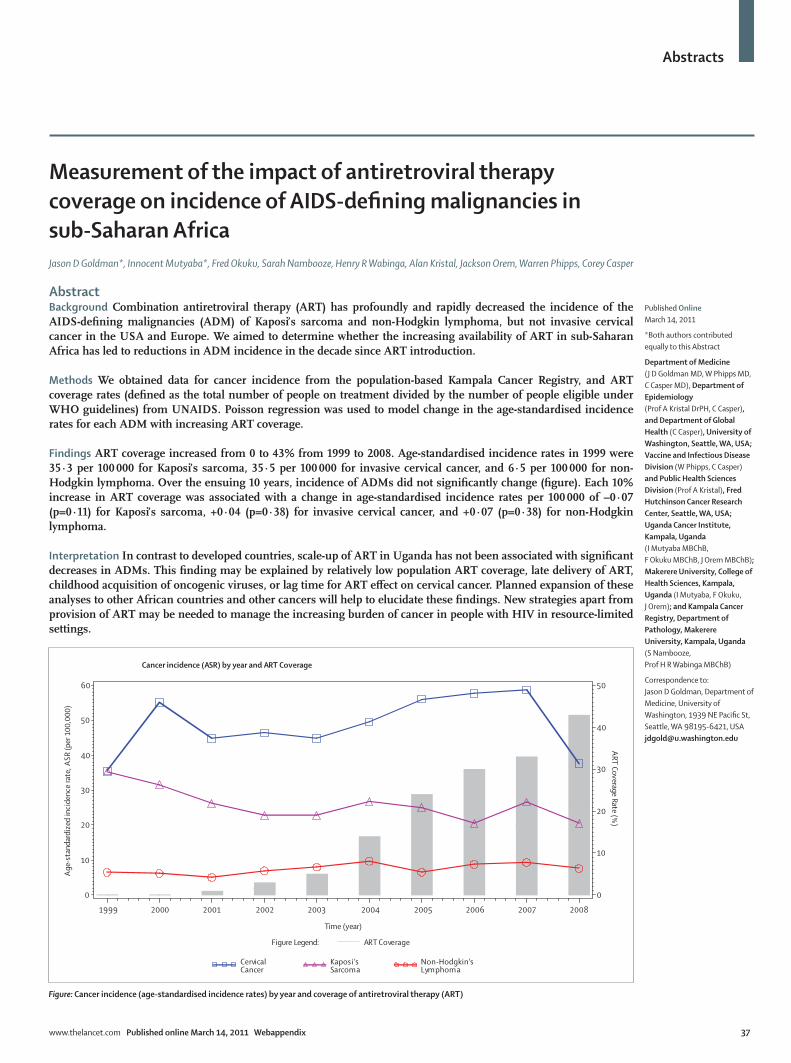
Abstracts
www.thelancet.com Published online March 14, 2011 Webappendix 37
Measurement of the impact of antiretroviral therapy coverage on incidence of AIDS-defining malignancies in sub-Saharan Africa Jason D Goldman*, Innocent Mutyaba*, Fred Okuku, Sarah Nambooze, Henry R Wabinga, Alan Kristal, Jackson Orem, Warren Phipps, Corey Casper
AbstractBackground Combination antiretroviral therapy (ART) has profoundly and rapidly decreased the incidence of the AIDS-defining malignancies (ADM) of Kaposi’s sarcoma and non-Hodgkin lymphoma, but not invasive cervical cancer in the USA and Europe. We aimed to determine whether the increasing availability of ART in sub-Saharan Africa has led to reductions in ADM incidence in the decade since ART introduction.
Methods We obtained data for cancer incidence from the population-based Kampala Cancer Registry, and ART coverage rates (defined as the total number of people on treatment divided by the number of people eligible under WHO guidelines) from UNAIDS. Poisson regression was used to model change in the age-standardised incidence rates for each ADM with increasing ART coverage.
Findings ART coverage increased from 0 to 43% from 1999 to 2008. Age-standardised incidence rates in 1999 were 35·3 per 100 000 for Kaposi’s sarcoma, 35·5 per 100 000 for invasive cervical cancer, and 6·5 per 100 000 for non-Hodgkin lymphoma. Over the ensuing 10 years, incidence of ADMs did not significantly change (figure). Each 10% increase in ART coverage was associated with a change in age-standardised incidence rates per 100 000 of –0·07 (p=0·11) for Kaposi’s sarcoma, +0·04 (p=0·38) for invasive cervical cancer, and +0·07 (p=0·38) for non-Hodgkin lymphoma.
Interpretation In contrast to developed countries, scale-up of ART in Uganda has not been associated with significant decreases in ADMs. This finding may be explained by relatively low population ART coverage, late delivery of ART, childhood acquisition of oncogenic viruses, or lag time for ART effect on cervical cancer. Planned expansion of these analyses to other African countries and other cancers will help to elucidate these findings. New strategies apart from provision of ART may be needed to manage the increasing burden of cancer in people with HIV in resource-limited settings.
Published Online March 14, 2011
*Both authors contributed equally to this Abstract
Department of Medicine (J D Goldman MD, W Phipps MD, C Casper MD), Department of Epidemiology (Prof A Kristal DrPH, C Casper), and Department of Global Health (C Casper), University of Washington, Seattle, WA, USA; Vaccine and Infectious Disease Division (W Phipps, C Casper) and Public Health Sciences Division (Prof A Kristal), Fred Hutchinson Cancer Research Center, Seattle, WA, USA; Uganda Cancer Institute, Kampala, Uganda (I Mutyaba MBChB, F Okuku MBChB, J Orem MBChB); Makerere University, College of Health Sciences, Kampala, Uganda (I Mutyaba, F Okuku, J Orem); and Kampala Cancer Registry, Department of Pathology, Makerere University, Kampala, Uganda (S Nambooze, Prof H R Wabinga MBChB)
Correspondence to: Jason D Goldman, Department of Medicine, University of Washington, 1939 NE Pacific St, Seattle, WA 98195-6421, USA [email protected]
Figure: Cancer incidence (age-standardised incidence rates) by year and coverage of antiretroviral therapy (ART)
Age
-sta
ndar
dize
d in
cide
nce
rate
, ASR
(per
100
,000
)
0
10
20
30
40
50
60
Time (year)
1999 2000 2001 2002 2003 2004 2005 2006 2007 2008
ART Coverage Rate (%)
0
10
20
30
40
50
Cancer incidence (ASR) by year and ART Coverage
CervicalCancer
Kaposi'sSarcoma
Non-Hodgkin'sLymphoma
Figure Legend: ART Coverage

Abstracts
38 www.thelancet.com Published online March 14, 2011 Webappendix
Testing convergence hypothesis for health and health inequalities in IndiaSrinivas Goli, Perianayagam Arokiasamy
AbstractIntroduction Convergence in average health status is an emerging phenomenon in India. Recent improvements in average socioeconomic and health status are remarkable. However, lack of a quantitative assessment in terms of volume of convergence led a foundation to quantify convergence in health and change in health inequalities in India. This study aimed to estimate volume of convergence in average health status and changes in health inequalities among states and socioeconomic groups in India.
Methods Sample registration system (1971–2007) data for life expectancy and infant mortality rate were used to assess convergence in health status. Data from three rounds of the national family health survey (1992–2006) were used to estimate the trends of health inequalities for key child health indicators. Analysis of the study was done in three stages. First, convergence in life expectancy and infant mortality rate were estimated by dispersion measure of mortality (DMM). Second, trends of health inequality in terms of concentration indices were estimated. Third, convergence change in health inequalities were estimated by use of beta convergence method.
Findings The DMM for life expectancy at birth declined until 1990s, but has since increased, signalling a shift from convergence to divergence in life expectancy. By contrast, the DMM for infant mortality indicates continued convergence. However, trends in health inequalities show that although the volume of inequalities is declining, the level of socioeconomic inequalities in child immunisation coverage and underweight are high in India. The results of absolute beta convergence model estimates show positive significant beta coefficients, and goodness of fit as measured by the adjusted R² is high. Estimates from the conditional beta convergence model for socioeconomic groups accord with these findings.
Interpretation Our findings do not support the convergence hypothesis for life expectancy, but the opposite is true for infant mortality rate. However, evidence suggests divergence in the relative health status of socioeconomic groups.
Published Online March 14, 2011
International Institute for Population Sciences, Mumbai,
India (S Goli MPS, Prof P Arokiasamy PhD)
Correspondence to: Srinivas Goli, International
Institute for Population Sciences, Deonar, Mumbai 40008, India

Abstracts
www.thelancet.com Published online March 14, 2011 Webappendix 39
Hopes turning backwards: resurgence of the malaria burden in IndiaSrinivas Goli, Perianayagam Arokiasamy
AbstractBackground India contributes 77% of the total malaria burden in southeast Asia. Most of the malaria burden is borne by the population of economically productive age and leads to economic loss. Recent retrospective analyses of burden of malaria for India showed that disability-adjusted life-years lost because of malaria were 1·86 million years, against WHO estimates of 0·8 million years. This study has two objectives: first, critical review of recent debate on the burden of malaria estimates by drawing evidence from previous efforts in India; second, assessment of trends of malaria incidence and the cost incurred in malaria control effort.
Methods This study uses multiple data sources: (1) compiled statistics for malaria incidence rates and expenditure incurred on malaria from Ministry of Health and Family Welfare, Government of India; (2) data from previous efforts from national and international organisations and surveys on burden of malaria and other official statistics.
Findings Assessment of trends for malaria incidence in India reveals impressive achievement in malaria eradication during the 1950s and 1960s, during which malaria cases fell significantly to less than 100 000. However, reversal was experienced in the late 1970s, and malaria cases had touched the 6·4 million mark in 1976. Although malaria incidence stabilised around 2 million cases in the 1990s, and was 1·8 million cases in 2005, the Plasmodium falciparum proportion has steadily risen to 50% in recent years. Official estimates based on reporting show under-reporting, whereas state-level longitudinal surveys show rising malaria incidence in India. Evidence from these longitudinal data reveal that numbers of deaths due to malaria have increased manifold in the recent past. However, recent allocation for Anti Malaria Control Programme in India has fallen, leading to shortfall of allocations with respect to expenditure.
Interpretation Recent stagnation in decline of malaria incidence makes a strong case for adequate investment in malaria control to turn around the present situation of heavy burden of malaria deaths in India.
Published Online March 14, 2011
International Institute for Population Sciences, Mumbai, India (S Goli MPS, Prof P Arokiasamy PhD)
Correspondence to: Srinivas Goli, International Institute for Population Sciences, Deonar, Mumbai 40008, India [email protected]
Abstracts
40 www.thelancet.com Published online March 14, 2011 Webappendix
Exploring the determinants of maternal mortality declines Karen A Grépin, Nandini Oomman, Christina Droggitis, Jing Dong
Abstract Introduction According to new estimates produced by the Institute for Health Metrics and Evaluation (IHME), the global maternal mortality ratio (deaths per 100 000 livebirths) has declined from 422 in 1980, to 251 in 2008. Despite this achievement, the overall rate of progress has been well below rates that would be required to achieve Millennium Development Goal 5 (MDG5). In addition, there has been great heterogeneity in progress; 24 countries are on track to achieve MDG5, while some countries have actually seen increased rates of maternal deaths over this same time. The purpose of this paper is to explore the factors that explain declines in maternal mortality seen across countries by analysing the determinants of these changes.
Methods This report will explore determinants of maternal mortality declines with use of international comparable data for maternal health-seeking behaviour (ie, use of antenatal and intrapartum care), health system infrastructure, progress outside the health sector (ie, education, infrastructure, water, and sanitation), the HIV epidemic, fertility, socioeconomic factors, national governance indicators, and macroeconomic changes, and with use of cross-country regression approaches, including first differencing, fixed-effects, and related models. The main sources of data will include demographic and health surveys, IHME datasets, and data from the WHO Statistical Information System, UNAIDS, UN Population Fund, and the World Bank.
Findings The analysis will be conducted and completed by early February, 2011.
Interpretation The conclusions will be made once the analysis has been conducted.
Published Online March 14, 2011
New York University, New York, NY, USA (K A Grépin PhD,
J Dong MPH); and Center for Global Development, Washington, DC, USA
(N Oomman PhD, C Droggitis BA)
Correspondence to: Karen A Grépin, New York
University, New York, NY 10012, USA

Abstracts
www.thelancet.com Published online March 14, 2011 Webappendix 41
State of the art of effective coverage in Latin America Ramiro Guerrero, Gabriel Carrasquilla
AbstractBackground Effective coverage is a central measure of the adequate provision of health services and of the extent to which these improve population health. The Effective Coverage network was launched in 2008, as part of the Health Observatory of Latin America and the Caribbean (HO-LAC), to advance the implementation of this metric in the region. This study aimed to measure, compare, and explore the determinants of effective coverage of health systems in Latin America.
Methods A set of interventions was selected, according to policy relevance and data availability, for comparative measurement of effective coverage in Bolivia, Colombia, Chile, Costa Rica, Haiti, Honduras, Mexico, Peru, and Dominican Republic. Selected interventions were classified in three categories: maternal health, child health, and chronic conditions. Crude coverage was estimated, measures of quality were explored, and effective coverage was measured for a subset of interventions. Comparisons are made across countries and at the subnational level when possible. Determinants of coverage are explored for hypertension and diabetes.
Findings For most maternal and child interventions, most countries in the region have achieved relatively high levels of crude coverage, yet the comparison with outcomes for these interventions reveals important challenges in terms of quality. Coverage tended to be lower for screening interventions, such as mammography, and for chronic conditions (both crude and effective coverage). Disparities at the subnational level were as wide as those observed across countries.
Interpretation Measurement of effective coverage continues to be imperfect, especially when considering the quality component. Only Chile and Costa Rica have data that allow for its estimation without relying on surveys. Efforts to improve information systems and the development of methods for better exploitation of existing information should proceed in parallel. The network has identified specific areas in which these efforts should concentrate. However, use of the metric so far has highlighted the importance of focusing on final outcomes while evaluating performance and policy.
Published Online March 14, 2011
PROESA—Centro de Estudios en Protección Social y Economía de la Salud, Cali, Colombia (R Guerrero MSc); and Centro de Estudios e Información en Salud—CEIS, Fundación Santa Fe de Bogotá, Bogota, Colombia (G Carrasquilla DrPH)
Correspondence to: Ramiro Guerrero, PROESA—Centro de Estudios en Protección Social y Economía de la Salud, Calle 18 #122-135 Edificio B, Oficina B 102, Cali, Colombia [email protected]

Abstracts
42 www.thelancet.com Published online March 14, 2011 Webappendix
An empirically based typology of national health systemsMichael Hanlon, Brendan DeCenso, Shane M Murphy, Raymond Zhang
Abstract Background To facilitate cross-country comparisons, we constructed an empirically based topography of national health systems. This topography enables us to identify a system’s defining features, relative to a comparison group. Given the complexity of even the simplest system, no single tool could consider every consequential feature. Yet we believe this analysis is a useful illustration of how a topology can be formed, and our results may be of general interest to researchers conducting cross-country analyses.
Methods We evaluated 183 countries along four health-service dimensions: provision; financing; coverage and infrastructure; and population density, which is expected to influence the costs of service. Our analysis considered multiple variables within each dimension, and we used factor analyses and statistical clustering to classify countries with similar characteristics into exclusive categories. By simultaneously considering all these dimensions, we obtained a clearer picture than from a national health account, which often considers only financing and some elements of provision.
Findings We believe that our analysis has two results of general interest: our provision estimates are generated from world health surveys, demographic and health surveys, and national health account data, and they suggest that the volume of health care provided by public entities is extremely high across all countries; and the topology itself. Our topology produces a sparse data structure, with 183 countries classified into one of a possible total of 576 categories. 61 countries are singletons, which are uniquely described (they differ from every other country in at least one respect). This finding supports the notion that a great deal of cross-country variation exists. Yet we also find that the 18 most populated categories contain 68 countries, or nearly 40% of our sample. So it may be quite reasonable to apply evidence from one country to another, so long as countries are carefully associated.
Interpretation There is a great deal of diversity in the organisation and performance of national health systems. Our typology provides a framework to qualify, and in some respects quantify, those differences. Consequently, this framework engenders more meaningful interpretations of cross-country results.
Published Online March 14, 2011
Institute of Health Metrics and Evaluation, University of
Washington, Seattle, WA, USA (M Hanlon PhD, B DeCenso BS,
S M Murphy MS, R Zhang BA)
Correspondence to: Michael Hanlon, Institute for
Health Metrics and Evaluation, University of Washington,
Seattle, WA 98121, USA [email protected]

Abstracts
www.thelancet.com Published online March 14, 2011 Webappendix 43
Evaluation of economic status indices and their cardinal scale property for quantitative health analyses Piya Hanvoravongchai
AbstractBackground Quantitative analyses of health determinants generally require a measure of economic status in the health production model. In many studies, especially in developing countries, information on household income or expenditures is not readily available in the survey data. A number of indices based on household possession of assets have been used as a proxy of household economic status based on their ordinal scale property to rank individuals or households into income groups for further analyses. However, a number of studies have used asset-based indices in quantitative analyses assuming an unproven cardinal scale property. This study aims to evaluate the cardinal scale property of five types of asset indices and their relative performance.
Methods The five types of asset indices in this analysis are principle component analysis (PC) index, factor analysis (FA) index, dichotomous high ordered probit (DiHOPit) index, share-weighted-average (SWA) index, and count index. Using the Thailand socioeconomic status surveys for 1990 and 2000, these indices were comparatively analysed in comparison to consumption expenditure and income in three characteristics—namely, ordinal scale property, cardinal scale property, and intertemporal coherence.
Findings The study shows that PC index, FA index, and DiHOPit index are highly correlated with each other and with the SWA index and count index. PC, FA, and DiHOPit indices correlate quite well with average income and consumption, while SWA and count indices do not. Although the PC, FA, and DiHOPit indices are highly correlated with each other with high scale and rank correlations with average income and consumption, the performance of DiHOPit index and PC or FA index when evaluated at cluster level varies. PC and FA indices are inferior to DiHOPit index when tested against intertemporal change.
Interpretation The findings from this study can be helpful in guiding future research on the potential application of an asset index in quantitative analyses.
Published Online March 14, 2011
London School of Hygiene and Tropical Medicine, Bangkok, Thailand (P Hanvoravongchai MD)
Correspondence to: Piya Hanvoravongchai, London School of Hygiene and Tropical Medicine, Anek Prasong Building, 420/6 Rajvithi Road, Bangkok 10400, Thailand [email protected]
Abstracts
44 www.thelancet.com Published online March 14, 2011 Webappendix
Validation of vaccination coverage estimates with oral fluid: can a non-invasive biomarker of measles immunity improve conventional methods for estimation of vaccination coverage?Kyla Hayford, Shams El Arifeen, David Bishai, William Moss, Orin Levine
AbstractBackground Vaccination coverage, based on reported or recorded vaccination status from sample surveys and clinic records, is widely used as an indicator of immunisation and health system functioning and progress towards Millennium Development Goal 4. But how well do conventional methods of ascertaining vaccination status actually predict susceptibility in a population? Antibody prevalence surveys using oral fluid samples are a non-invasive, low-cost, and safer alternative to blood collection for evaluating population immunity to vaccine-preventable diseases. Our aim was to estimate immunity to measles virus using an oral fluid biomarker and compare it to vaccination cards and maternal recall of measles vaccination.
Methods A cross-sectional survey with oral fluid collection was conducted with children aged 12–16 months in Mirzapur, Bangladesh. Oral fluid samples were tested for measles-specific IgG. The questionnaire elicited the child’s vaccination history on the basis of first, the mother’s recall, and subsequently of the child’s vaccination card. An estimated 1200 children will provide adequate samples for analysis. Results from the antibody test were assumed to be vaccine-induced because the last measles outbreak in Bangladesh occurred in 2007. Population immunity to measles will be ascertained from oral fluid and compared to vaccination coverage rates calculated from the card plus report method and from government clinic records. Individual-level analyses will include assessment of whether maternal recall or card records are adequate predictors of measles immunity and identification of family characteristics associated with discordant results between reported or recorded vaccination history and antibody status. Because many countries are getting closer to eliminating measles, it has become increasingly important to assess whether vaccination history is a good predictor of immunity and whether oral fluid biomarkers are a feasible substitute to monitor immunisation performance.
Published Online March 14, 2011
International Vaccine Access Center (K Hayford MA,
O Levine PhD), Department of Population, Family and
Reproductive Health (Prof D Bishai PhD), and
Department of Epidemiology (W Moss MD), Johns Hopkins
Bloomberg School of Public Health, Baltimore, MD, USA; and International Centre for Diarrhoeal Disease Research,
Bangladesh, Dhaka, Bangladesh (S El Arifeen DrPH)
Correspondence to: Kyla Hayford, Johns Hopkins Bloomberg School of Public Health, 615 N. Wolfe Street,
Baltimore, MD 21205, USA [email protected]
Abstracts
www.thelancet.com Published online March 14, 2011 Webappendix 45
Decomposition of cross-country differences in quality-adjusted life expectancy: the impact of mortality, health states, and valuesRichard Heijink, Pieter van Baal, Mark Oppe, Xander Koolman, Gert Westert
AbstractBackground The validity, reliability, and cross-country comparability of population health measures have been debated persistently. In this debate, the definition, measurement, and valuation of non-fatal health outcomes are key issues. Against this backdrop we explored international differences in health-utility-based health expectancy and quantified the contribution of mortality, health states, and values.
Methods We estimated quality-adjusted life expectancy (QALE) in 15 countries. We selected countries in which EQ-5D population surveys had been conducted, and combined these data with life tables from WHO. A parametric approach was applied to calculate mean health utility by country-sex-age. The predicted health utility was included in the life tables to calculate QALE with the Sullivan approach. We used non-parametric bootstrap techniques to compute 95% CIs. Three counterfactual estimates were generated in order to decompose international differences in QALE—ie, to assess the contribution of mortality, health states, and valuation.
Findings The regression results demonstrated that health utility declined over age, and this age-related reduction was greater in women. The interaction terms showed that the impact of age and sex on health utility differed across countries. QALE at 20 years ranged between 33 years in Armenia and around 60 years in Japan, with use of the UK value set. The value sets of five other countries generated different estimates, up to 9 years higher, with varying changes across countries. In 50% of the country-sex combinations the ranking changed by two or more positions across value sets. The decomposition demonstrated that the impact of valuation, mortality, and health states varied across countries.
Interpretation A health-utility-based health expectancy may prove useful as population health measure from both a theoretical and practical perspective. However, as shown in our analysis, the value set choice may seriously affect health expectancy measurements. To our opinion it is essential to get better insight into the drivers of differences in health valuation across populations.
Published Online March 14, 2011
National Institute for Public Health and the Environment, Bilthoven, Netherlands (R Heijink MSc, P van Baal PhD); Erasmus University Rotterdam, Rotterdam, Netherlands (P van Baal, M Oppe MSc); Delft University of Technology, Delft, Netherlands (X Koolman PhD); and University Medical Centre St Radboud, Nijmegen, Netherlands (Prof G Westert PhD)
Correspondence to: Richard Heijink, National Institute for Public Health and the Environment (RIVM), 3720 BA Bilthoven, Netherlands [email protected]

Abstracts
46 www.thelancet.com Published online March 14, 2011 Webappendix
Mortality patterns in a rural area of Vietnam, 1999–2008Nguyen Phuong Hoa, Nguyen Thi Kim Chuc
AbstractBackground Mortality information is an important element for supporting the development of health plans and evidence-based policy actions. This study estimates mortality rates, analyses mortality trends during more than 9 years, and examines the associations between mortality patterns and socioeconomic status in Bavi district, Vietnam.
Methods This is a longitudinal follow-up study in a demographic surveillance site in Bavi, Hanoi. Data were available for 68 518 individuals, with 79 288 records, during more than 9 years of follow-up.
Findings A total of 2510 deaths were recorded over 447 680 person-years. Sex-specific death rates were 5·0 per 1000 person-years (95% CI 4·69–5·26) for women and 6·3 (5·95–6·61) for men. The trend of standardised mortality rates among women was stable throughout the 9 years. However, mortality trends among men varied and increased. Mortality rates increased substantially with age. Being in low economic group increased the probability of dying compared with the high economic group. Geography and education factors did not affect mortality rates. The mortality pattern reflected a transitional pattern of disease in which the leading cause of death was cardiovascular diseases (28·2%), followed by neoplasms (17·7%), external causes (12·2%), and infectious and parasitic diseases (12·1%).
Interpretation Men had higher mortality rates than did women in all age groups. Mortality was higher in lower wealth groups. The leading causes of death were non-communicable diseases. However, further studies are needed to analyse the mortality inequity across all age groups.
Published Online March 14, 2011
Family Medicine Department, Hanoi Medical University,
Hanoi, Vietnam (N P Hoa PhD, N T K Chuc PhD)
Correspondence to: Nguyen Phuong Hoa, Family Medicine Department, Hanoi
Medical University, 1 Ton That Tung, Hanoi, Vietnam

Abstracts
www.thelancet.com Published online March 14, 2011 Webappendix 47
Projections of global health outcomes from 2005 to 2060 with use of the international futures integrated forecasting modelBarry B Hughes, Randall Kuhn, Cecilia Mosca Peterson, Dale S Rothman, José Roberto Solórzano, Colin D Mathers, Janet R Dickson
AbstractBackground Long-term forecasts of mortality and disease burdens are essential to set current and future health system priorities, yet few cover a wide range of nations over a long time-span or situate health changes into an integrated framework. Building on the work of the Global Burden of Disease project (GBD), we developed an integrated health forecasting model as part of the larger international futures (IFs) modelling system.
Methods IFs health begins with historical relationships between economic and social development and cause-specific mortality used by GBD, but we build forecasts from endogenous projections of these drivers, incorporating forward linkages from health outcomes themselves back to inputs such as population and economic growth. The hybrid system adds alternative structural formulations for causes not well served by regression models (eg, HIV/AIDS) and accounts for changes in proximate health risk factors. We forecast to 2100 but report findings to 2060.
Findings The base model projects that deaths related to communicable disease (CD) will decline by 50% while those related to both non-communicable diseases (NCD) and injuries more than double. Considerable cross-national convergence in life expectancy is expected. Climate-induced variations in agricultural yield cause surprisingly little excess childhood CD mortality, although we do not explore other climate-health pathways. Optimistic and pessimistic scenarios deviate considerably, with the former producing, in 2060, 39 million fewer deaths and a 20% relative increase in gross domestic product per capita, despite a billion additional people. South Asia would experience the greatest mortality and economic benefit.
Interpretation While reduction of CD risk factors remains critical over the short term, long-term success depends on targeting NCD and injury risk factors and broader social determinants of health. Economic growth effects are positive, but modest, and should not constitute a singular rationale for health investment. Long-term, integrated forecasting advances our understanding of the connections between health and other markers of human progress, offering powerful insight into our current path and key points of leverage for future improvements.
Published Online March 14, 2011
Josef Korbel School of International Studies, University of Denver, Denver, CO, USA (B B Hughes PhD, R Kuhn PhD, C M Peterson MSPH, D S Rothman PhD, J R Solórzano MS, J R Dickson MSW); and Mortality and Burden of Disease, Innovation, Information, Evidence and Research Cluster (IER), WHO, Geneva, Switzerland (C D Mathers PhD)
Correspondence to: Randall Kuhn, Josef Korbel School of International Studies, University of Denver, Denver, CO 80208, USA [email protected]

Abstracts
48 www.thelancet.com Published online March 14, 2011 Webappendix
Misclassification patterns of causes of maternal deaths in Sri LankaRajitha L Jayasuriya, Samath D Dharmaratne
AbstractBackground All maternal deaths and pregnancy-related deaths in Sri Lanka are investigated extensively by the Family Health Bureau through the maternal death surveillance system (MDSS) to confirm the cause of death and to prevent similar incidents in future. The civil registration system (CRS) of Sri Lanka under-report maternal deaths. One possible reason for this insufficient recording could be the absence of a place in the death certificate (DC) to indicate that the death was related to pregnancy. No comparison of maternal deaths and pregnancy-related deaths with the DCs has yet been done. This study aimed to identify the misclassification patterns of maternal deaths by the CRS in Sri Lanka.
Methods All maternal deaths and pregnancy-related deaths that occurred in the two tertiary care hospitals in the Kandy district in 2006, 2007, and 2009 were included in the study. The MDSS data were collected from the Regional Director of Health Services, Kandy. DCs issued by the CRS for these deaths were obtained from the registrars and were compared with the MDSS cause of death.
Findings 30 maternal deaths were included in the study. The mean age of the deceased was 28·8 years (SD 5·9). 13 (43%) deaths were related to the first pregnancy. There were five unregistered deaths. Only four (13·3%) deaths had a pregnancy-related cause of death given in the DC. In 11 (44%) deaths, the causes given in the DC cannot be used for further analysis. Seven deaths (28%) were indicated to be caused by infections (dengue fever, H1N1 virus, and pneumonia), whereas for the remaining three deaths (12%), the cause of death in the DC was injury.
Interpretation This analysis highlights the existing gross misclassification (86·7%) of maternal deaths to other causes in the CRS. Inclusion of a place in the DC to indicate that the death was pregnancy related might rectify this problem.
Published Online March 14, 2011
Department of Community Medicine, Faculty of Medicine,
University of Peradeniya, Peradeniya, Sri Lanka
(R L Jayasuriya MSc, S D Dharmaratne MD)
Correspondence to: Rajitha L Jayasuriya, Department of Community Medicine, Faculty
of Medicine, University of Peradeniya, Sri Lanka [email protected]
Abstracts
www.thelancet.com Published online March 14, 2011 Webappendix 49
The limited value of cost-effectiveness league tables—the need for a third dimension? David J Jeffries, Warren Stevens
AbstractBackground Traditionally, data for cost-effectiveness studies of medical or health technology interventions have come from randomised controlled trials. The limitations of this type of trial as a source for cost-effectiveness data have been discussed at length. League tables of interventions or models, such as WHO’s cost-effectiveness tables or the Lives Saved Tool (LiST), to predict the cost-effectiveness of scaling up interventions use summary data from these same studies, and as such are subject to many of the same limitations. The argument against the use of trials for cost-effectiveness data is that the outcomes and the resource use data are rarely likely to be representative of any setting outside the trial itself; as a result, its value for generalising to other settings is limited. Some reasons such as the widespread use of exclusion criteria in recruiting, the ethical constraints put upon the ability of researchers to eschew intervention affecting outcomes, and the scale and resource intensity of a one-off intervention, have been addressed in the literature, but what has largely been ignored is the role of the various other contextual factors prominent in defining the relationship between the intervention studied and the health outcome of interest.
Methods We used an agent-based model structure to test the accepted view that these contextual factors are controlled for by the act of random sampling, and that these factors are independent of each other, and their relationships to the studied outcome are linear and homogeneous across the study population.
Findings The multidimensional probability distribution functions from the agent-based model show substantial variance caused by the presence of key criteria.
Interpretation This report puts forward the hypothesis that the reason that systematic reviews of studies betray such huge variance in efficacy is because the level of variance in contextual factors underpinning the health outcomes are often greater, and more complex, than they are given credit for.
Published Online March 14, 2011
Population Services International, Washington, DC, USA (W Stevens PhD); and Medical Research Council Tropical Diseases Research Unit, Banjul, The Gambia (D J Jeffries PhD)
Correspondence to: Warren Stevens, 19 Burroughs Street, Boston, MA 02130, USA [email protected]
Abstracts
50 www.thelancet.com Published online March 14, 2011 Webappendix
Assessment of the global burden of disease from unsafe medical care among hospitalised patientsAshish K Jha, Hugh Waters, David W Bates
AbstractBackground Iatrogenic injury among hospitalised patients is common and might be a source of substantial morbidity and mortality across the world. This study aimed to calculate, with the global burden of disease approach, the health impact of unsafe medical care (ie, iatrogenic injury) across the globe.
Methods We used a combination of a comprehensive literature review, supplemented with data from several epidemiological studies, to calculate, using WHO‘s approach, the total number of disability-adjusted life years (DALYs) lost from seven common causes of iatrogenic injury, including drug errors, falls in hospital, decubitus ulcers, thromboembolism, and three types of healthcare-associated infections (catheter-related urinary tract infections, bloodstream infections, and nosocomial pneumonia).
Findings We estimated that there are about 35 million iatrogenic injuries in a given year, of which 22 million occur in low-income and middle-income countries and 13 million occur in high-income countries. These adverse events were responsible for about 17·5 million DALYs lost, nearly two-thirds of which occurred in low-income or middle-income countries. Injuries from medication errors were the biggest source of lost DALYs (2·5 million) per year, followed closely by catheter-related bloodstream infections (2·3 million DALYs) and venous thromboembolism (2·1 million DALYs).
Interpretation Injuries from medical care represent a major source of morbidity and mortality across the globe and probably constitute one of the major causes of human suffering. Policy makers worldwide need to pay special attention to improving the safety of health systems.
Published Online March 14, 2011
Department of Health Policy and Management, Harvard
School of Public Health, Boston, MA, USA (A K Jha MD);
RAND Health, Santa Monica, CA, USA (H Waters PhD); and Division of General Internal Medicine and Primary Care,
Brigham and Women’s Hospital, Harvard Medical School, Harvard School of
Public Health, Boston, MA, USA (D W Bates MD)
Correspondence to: Ashish K Jha, Department of
Health Policy and Management, Harvard School of Public Health,
Boston, MA 02115, USA [email protected]

Abstracts
www.thelancet.com Published online March 14, 2011 Webappendix 51
The HMO Research Network Virtual Data Warehouse: a model for responsible and efficient multicentre health data analysis Karin Johnson, Mark Hornbrook, Sarah Greene, Roy Pardee, Gene Hart, Daniel Ng, Leah Tuzzio, on behalf of the Virtual Data Warehouse implementation group
AbstractBackground The HMO Research Network (HMORN) is a consortium of 15 US health-care delivery systems with affiliated research centres committed to closing the loop between research and clinical care. The HMORN supports collaborative projects using a federated data-sharing model for multisite research.
Methods The model for aggregating and sharing data in the HMORN is known as the Virtual Data Warehouse (VDW). This model produces generally comparable data across institutions and over time from administrative health data, while letting each participating institution control its data. A cross-disciplinary workgroup guides the mapping of each site’s data into a common format. Person-level data are standardised but remain at the parent institution until a study-specific need arises—there is no central repository. The VDW is supported by hardware and software that facilitate: storage, retrieval, processing, and managing VDW datasets; access policies and procedures governing use of VDW resources; documentation; and procedures for the periodic addition of new variables.
Findings Once data are mapped, they are available for analysis in several ways that balance analytical needs with privacy safeguards. Programmes can be written by one site and run elsewhere with minimum customisation; typically, programmes return aggregate data to the lead site, which pools and reports results. Summarised data are maintained as a web resource to facilitate understanding of network-wide data availability. Some members are adding new tools that allow ad-hoc queries with no additional programming effort. Challenges include time required to add new variables and produce comprehensive documentation and quality control, and enabling responsible data sharing beyond VDW participants.
Interpretation Clinical and administrative data are used for health services and population health research worldwide. Therefore, the VDW model is potentially applicable for multisite research within and among countries—protecting patient privacy and data security while providing analytical precision for records-based studies.
Published Online March 14, 2011
Group Health Research Institute, Seattle, WA, USA (K Johnson PhD, M Hornbrook PhD, S Greene MPH, R Pardee JD, G Hart MS, D Ng MBA, L Tuzzio MPH); Kaiser Permanente, Portland, OR, USA (M Hornbrook); and Kaiser Permanente, Oakland, CA, USA (D Ng)
Correspondence to: Karin Johnson, Group Health Research Institute, 1730 Minor Avenue, Suite 1600, Seattle, WA 98101, USA [email protected]

Abstracts
52 www.thelancet.com Published online March 14, 2011 Webappendix
The sentinel panel of districts: Tanzania’s new integrated surveillance systemGregory Kabadi, on behalf of the Sentinel Panel of Districts’ partners and implementers
AbstractBackground There is a general consensus for evaluation of large-scale programmes of use of the district as the unit of design and analysis, especially in low-income and middle-income countries, where many programmes are being scaled up at the national level. The sentinel panel of districts (SPD) has been set up in Tanzania to generate both facility and population-based information. From all health facilities of 27 national representative districts, SPD will continuously monitor a minimum of 43 indicators under the Tanzanian health sector strategic plan phase III. At the community level, SPD will continuously monitor registration of all births and deaths from sampled enumeration areas within each district and report on sex-specific and age-specific causes of death for profiling burden of disease in the country.
Methods On a monthly basis, district facility coordinators collected aggregated summaries of indicators from all health facilities within their districts. Data were entered with district health information system software, and reports were produced and shared with relevant authorities. Trained key informants residing in sampled enumeration areas reported all birth and death events on a continuous basis to district community coordinators, who facilitated registration with a government agency for vital registration. For every death reported, a verbal autopsy interview was done to ascertain cause of death with use of WHO’s International Classification of Diseases, tenth revision.
Findings SPD’s first results are expected by mid-2011. We anticipate improved routine and programme data collection, with better monitoring of the burden of disease, health outcomes, service delivery, and clinical practice.
Interpretation SPD is a very powerful information platform to generate both facility and population-based data. With national representation, SPD will provide an economical, high-quality platform for detailed programme monitoring and evaluation with comparability over time (trend analysis). It will also provide an opportunity for fundamental and operational research. This platform integrates activities from three ministries of the Tanzanian Government.
Published Online March 14, 2011
Sentinel Panel of Districts, Ifakara Health Institute, Dar es Salaam, Tanzania
(G Kabadi MSc); and Faculty of Infectious and Tropical
Diseases, London School of Hygiene and Tropical Medicine,
London, UK (G Kabadi)
Correspondence to: Gregory Kabadi, 463 Kiko
Avenue, Mikocheni, PO BOX 78383, Dar es Salaam,
Tanzania [email protected]

Abstracts
www.thelancet.com Published online March 14, 2011 Webappendix 53
Measuring wellbeing of older populations: a best practice approach to international comparisonsToshiko Kaneda, Marlene Lee, Kelvin Pollard
AbstractBackground Ageing of populations challenges national governments on many fronts: allocation of resources, readiness of health services, and impact on the workforce. The complex and multidimensional nature of ageing requires policy makers to track many indicators. Detecting and interpreting trends across multiple indicators is difficult. We constructed an evidence-based comprehensive and robust summary measure of wellbeing for older population groups with which to compare performance across countries, among groups within countries, and progress over time.
Methods We used data from nationally representative surveys and international databases to identify indicators of material, physical, social, and emotional wellbeing, and constructed a summary index of elderly wellbeing. We selected indicators based on relevance and comparability across 12 countries (11 European and the USA) that are broadly similar in their stage of economic development and culture. Because no gold standard for indicators of elderly wellbeing exists, we used a best practice analysis in which the externally constructed standard to which we compare the indicators in each country is the best observed value among the countries.
Findings We identified 12 indicators of wellbeing. We estimated a composite index and composite ranking for three age-groups in each country: 50–64 years, 65–74 years, and 75 years and older. Physical wellbeing was more similar across the 12 countries than was material, social, or emotional wellbeing. Material wellbeing declined for older age groups. Performance on emotional wellbeing lags behind country performance in other dimensions.
Interpretation The index is a robust summary measure that distinguishes the level of wellbeing between countries for older populations. The index also discriminates among age groups within countries. Rankings based on such a measure might support decision makers in attracting public interest to the issue of population ageing and might facilitate the development of policy messages.
Published Online March 14, 2011
Population Reference Bureau, Washington, DC, USA (T Kaneda PhD, M Lee PhD, K Pollard MA)
Correspondence to: Marlene Lee, Population Reference Bureau, Washington, DC 20009, USA [email protected]

Abstracts
54 www.thelancet.com Published online March 14, 2011 Webappendix
Global trends in urban health inequalitiesM Kano, A Prasad, C Vidal Fuertes
Abstract Background Over half the world’s population now lives in urban settings where striking health disparities exist. There is a growing need to understand these health inequalities in order to guide effective actions to address them. Studies have shown that health tends to improve with higher levels of socioeconomic status. More evidence is needed about whether this social gradient in health exists across countries of different regions and development stages, and across various health determinants, risk factors, and outcomes. We aimed to examine global trends in health inequalities in urban settings.
Methods Secondary analysis was conducted on recent data from the world health survey, the world mental health survey, and the demographic and health surveys. Prevalence rates of health determinants (eg, access to piped water), risk factors (eg, smoking), and health outcomes (eg, child malnutrition, mental health) were calculated with only urban data, disaggregated by income, education, and sex, as appropriate. Some analyses were conducted at the city or municipality level. Decomposition analysis was used to identify explanatory factors of health inequalities.
Findings A social gradient was observed in maternal and child health indicators and in access to piped water, from demographic and health survey data from low-income and middle-income countries. Wealth and education were the key factors explaining these health inequalities. Analysis of world health survey and world mental health survey data revealed less uniform patterns of inequality in non-communicable health conditions and in behavioural risk factors.
Interpretation Socioeconomic inequalities in health that favour wealthier populations exist more consistently for certain health indicators than for others. More research is needed on the causal mechanisms of health inequality and their implications for health policy. Global health survey data can be useful to assess international trends in health inequalities; however, they pose some critical methodological challenges such as data coverage and sample size issues.
Published Online March 14, 2011
WHO Centre for Health Development, Kobe, Japan
(M Kano DrPH, A Prasad MPA, C Vidal Fuertes MA)
Correspondence to: Megumi Kano, WHO Centre for
Health Development, IHD Centre Bldg 9F, 1-5-1 Wakinohama-
Kaigandori, Chuo-ku, Kobe 651-0073, Japan
Abstracts
www.thelancet.com Published online March 14, 2011 Webappendix 55
Global burden of dental diseaseNicholas Kassebaum, Mohsen Naghavi, Manu Dahiya, Wagner Marcenes, Jed Blore, Christopher J L Murray
AbstractBackground Dental disease is ubiquitous. While acute episodes of dental caries usually confer only mild and temporary disability, other conditions such as chronic periodontal disease and edentulism have been associated with reductions in health-related quality of life and increased relative risk of mortality. As we continue to invest heavily in improving oral health throughout the world, we need to analyse how the epidemiology of individual conditions is changing, or whether or not our efforts are having an impact at all. The purpose of this analysis, therefore, was to create worldwide region-level estimates of oral disease epidemiology for four conditions: deciduous caries, permanent caries, edentulousness, and chronic periodontitis.
Methods With DisMod III software for Bayesian inference estimation, models were created for each oral condition for each of 21 global regions for both 1990 and 2005. Experts compiled all relevant global data from primary literature, national surveys, and government reports for each condition. Epidemiological and demographic data were standardised to pre-determined formats. Modelling constraints (conditional priors) and covariates were selected on the basis of established risk factors for each condition. Detailed results for each condition will be presented.
Findings Estimates of deciduous caries followed expected age patterns, with incidence peaking at age 5–6 years for both male and female individuals. Estimates of permanent caries are consistent with greatest incidence during early teenage years, although with a substantial continuing incidence throughout adulthood. Edentulism appears to have decreased worldwide from 1990 to 2005, although this decrease has been partly offset by a corresponding increase in chronic periodontitis prevalence, especially in older age groups.
Interpretation Overall, there has been a substantial impact on global dental disease, although it is clear a significant burden remains in every region.
Published Online March 14, 2011
University of Washington Institute of Health Metrics and Evaluation, Seattle, WA, USA (N Kassebaum MD, Prof M Naghavi MD, J Blore PhD, Prof C J L Murray DPhil); and Barts and the London School of Medicine and Dentistry at Queen Mary, University of London, London, UK (M Dahiya MSc, Prof W Marcenes PhD)
Correspondence to: Nicholas Kassebaum, Institute for Health Metrics and Evaluation, University of Washington, Seattle, WA 98121, USA [email protected]
Abstracts
56 www.thelancet.com Published online March 14, 2011 Webappendix
Enhancement of epidemiological estimates for stroke and heart failure in Australia with use of linked data Judith M Katzenellenbogen, Theo Vos, Peter Somerford, Stephen Begg, James Semmens, James Codde
AbstractBackground In high-income countries with accurate mortality registration, challenges remain in estimating the non-fatal burden from routinely available data. Linked health records provide opportunities for extracting disease-specific data necessary for calculating transition rates underlying disease modelling in DisMod. We aimed to describe how data linkage was used to estimate stroke incidence and case fatality, and heart failure prevalence and case fatality in Western Australia.
Methods Hospital and death data spanning 1988 to 2003 were extracted and person linked with use of the Western Australia Data Linkage System. For stroke, incident non-fatal strokes were defined as cases never admitted to hospital for stroke in the 12-year clearance period and surviving 28 days. Assumptions about out-of-hospital cases were based on published studies. Case fatality was calculated as the mortality rate in stroke cases prevalent in 1997–2002 after subtracting out the background mortality. For heart failure, all cases presenting to hospital between 1990 and 2003 with a diagnosis of heart failure and still alive in 1998–2003 represented prevalent hospital cases. Case-fatality rates were calculated as for stroke. Rates for non-hospitalised heart failure assumed lower case fatality and lower likelihood of being coded as a heart failure death. Hospital and non-hospital cases were modelled separately.
Findings Plausible, country-specific estimates of stroke and heart failure occurrence were obtained. Extrapolation of prevalence from North American studies would have overestimated Australian heart failure cases by 80 000 cases. Case-fatality rates in prevalent survivors based on a period approach increased with age for stroke and heart failure, having a different pattern to rates calculated with a cohort approach.
Interpretation Innovative use of linked data improved the quality of epidemiological rates underlying estimates of the non-fatal burden of stroke and heart failure in Australia. Linked health data have substantial potential to feed into ongoing methodological refinements in estimating the burden of disease.
Published Online March 14, 2011
Centre for International Health (J M Katzenellenbogen PhD) and
Population Health Research (J Semmens PhD), Curtin Health Innovation Research Institute,
Curtin University, Perth, WA, Australia; School of Population
Health, University of Western Australia, Perth, WA, Australia (J M Katzenellenbogen); Centre for Burden of Disease and Cost
Effectiveness, School of Population Health, University of Queensland, Brisbane, QLD,
Australia (T Vos PhD); Health Department of Western
Australia, Perth, WA, Australia (P Somerford MSc, J Codde PhD);
and Health Economics Unit, Funding and Resourcing
Branch, Queensland Health, Brisbane, QLD, Australia
(S Begg MPH)
Correspondence to: Judith M Katzenellenbogen,
Centre for International Health, Curtin Health Innovation Research Institute, Curtin
University, GPO Box U1987, Perth, WA, Australia

Abstracts
www.thelancet.com Published online March 14, 2011 Webappendix 57
Geographical variation in the causes of heart failure: a systematic review for the Global Burden of Disease studyShahab Khatibzadeh, Farshad Farzadfar, Majid Ezzati, Andrew Moran
AbstractBackground Causes of heart failure (HF) are diverse and vary proportionally among world regions on the basis of risk factor prevalence and quality of health care. International classification of disease (ICD) rules classify HF as an intermediate, not underlying cause of death. There are few estimates of the relative contribution of underlying causes to HF worldwide. Quantification of the pattern of HF causes by region is essential to estimate the global burden of HF. We aimed to describe the prevalence of major underlying causes of HF in five world regions.
Methods Medline, Embase, and LILACS databases were systematically searched for HF epidemiology studies in all world regions published in 1980–2008. 30 clinic-based studies from 39 nations reported HF causes. HF causes were classified as ischaemic heart disease, hypertension, rheumatic or other valvular, cor pulmonale, idiopathic cardiomyopathy, and other. Three studies were dropped from the analysis (Middle East and north Africa had only one study, study sample deemed not representative of the region for two studies).
Findings Many HF cases were assigned multiple underlying causes, leading to considerable overlap among causes. Relative prevalence of HF causes varied among regions. The two most frequent causes worldwide were ischaemic heart disease and hypertension. When causes were considered individually, on average, ischaemic heart disease was reported as a cause in more than 50% of cases in Europe and North America, approximately 30% in east Asia and Latin America and the Caribbean, and less than 10% in sub-Saharan Africa (figure). In contrast, hypertension was a common cause of HF in all regions.
Interpretation HF has diverse causes, and HF causes vary proportionally among world regions because of differences in risk factor levels and health-care delivery. No single approach will prevent heart failure worldwide; approaches targeted at region-specific underlying causes are needed. Quantification of the contribution of HF causes by region is an important step towards estimating and reducing the global burden of HF.
Published Online March 14, 2011
Harvard School of Public Health, Boston, MA, USA (S Khatibzadeh MPH, F Farzadfar MPH); MRC-HPA Centre for Environment and Health and Department of Epidemiology and Biostatistics, Imperial College London, London, UK (Prof M Ezzati PhD); and Department of Medicine, Columbia University, New York, NY, USA (A Moran MD)
Correspondence to: Andrew Moran, Division of General Medicine, Columbia University Medical Center, Presbyterian Hospital 9th floor, room 105, 622 West 168th Street, New York, NY 10032, USA [email protected]
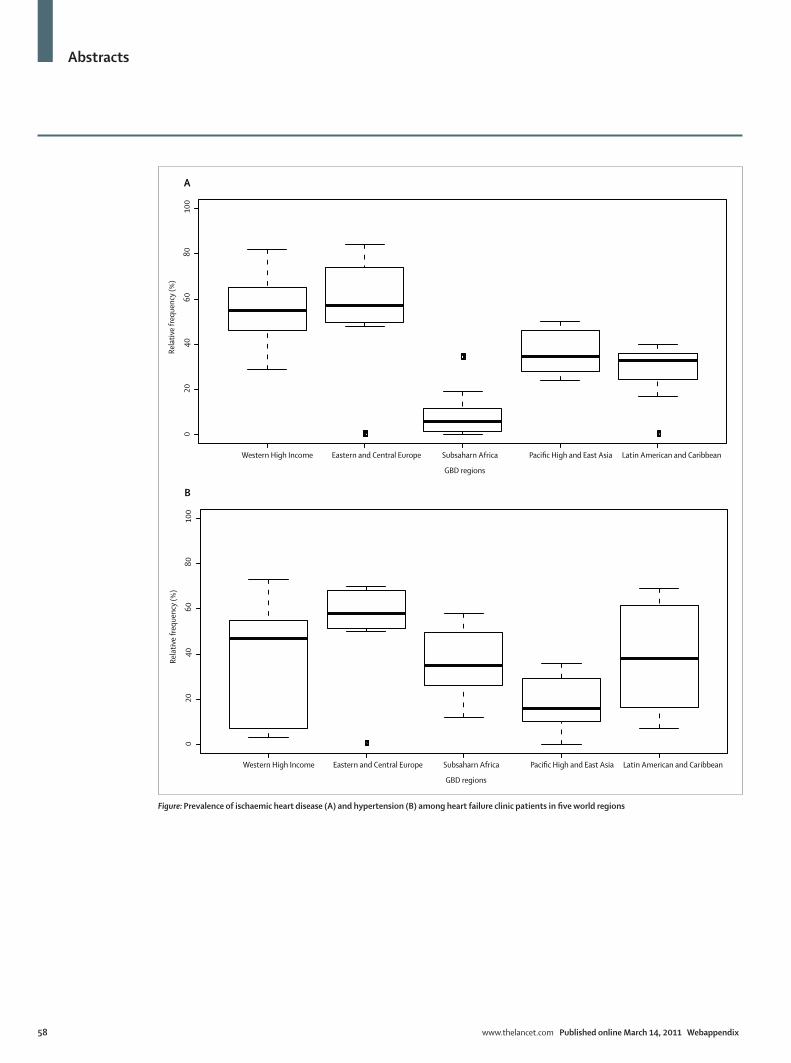
Abstracts
58 www.thelancet.com Published online March 14, 2011 Webappendix
Western High Income Eastern and Central Europe Subsaharn Africa Pacific High and East Asia Latin American and Caribbean
020
4060
8010
0A
GBD regions
Rela
tive
frequ
ency
(%)
Western High Income Eastern and Central Europe Subsaharn Africa Pacific High and East Asia Latin American and Caribbean
020
4060
8010
0
B
GBD regions
Rela
tive
frequ
ency
(%)
Figure: Prevalence of ischaemic heart disease (A) and hypertension (B) among heart failure clinic patients in five world regions

Abstracts
www.thelancet.com Published online March 14, 2011 Webappendix 59
Shortchanging schistosomiasis: how the DALY metric devalues disease burden due to widely prevalent chronic infections in the developing worldCharles H King, Maria J King, A Desirée LaBeaud, Amaya Bustinduy
AbstractBackground Promulgation of the disability-adjusted life-year (DALY) metric in the 1990s and its use by groups such as the disease control priorities project has strongly shifted research and public health agendas in favour of controlling chronic non-communicable diseases (found primarily in high-income countries) at the expense of limiting programmes for the control of chronic communicable diseases in less-developed countries. We hypothesised that this imbalance was a direct consequence of intended and unintended flaws in the design of the DALY construct.
Methods We revisited the disability associated with the chronic disease schistosomiasis via meta-analysis of published and unpublished evidence on the prevalence, incidence, and duration of Schistosoma spp infection, including the full range of infection-associated and post-infection morbidities. Step-by-step review of the DALY calculations was performed, along with sensitivity analysis for the input decisions for current DALY estimates.
Findings Problems with the 1996–2006 DALY estimates for schistosomiasis included: inaccurate prevalence estimates (systematic undercounting of the number of cases), reliance on expert opinion and not on data in formulating the life-path scenarios for disability weight determination, and the absence of reliable population data on schistosomiasis-specific mortality. Unacknowledged disability-associated morbidities, including anaemia, growth stunting, nutritional wasting, impaired cognition, and poor school performance, were not included in the disability assessments used for DALY calculation. Furthermore, in the less-developed country settings, schistosomiasis is often overlapped with other chronic infections, which poses difficulties in partitioning joint health burden due to combined infections and nutritional deficits.
Interpretation The current DALY metric is heavily biased in favour of conditions that cause mortality and not chronic morbidity, are well studied in terms of disability impact, and have been well enumerated, as in high-income countries. The unrealistic DALY focus on diseases that occur in isolation devalues estimates for overlapping chronic infections, particularly in areas with limited public health resources.
Published Online March 14, 2011
Center for Global Health and Diseases, Case Western Reserve University School of Medicine, Cleveland, OH, USA (Prof C H King MD, A Bustinduy MD); Tufts University, Medford, MA, USA (M J King); and Children’s Hospital of Oakland Research Institute, Oakland, CA, USA (A D LaBeaud MD)
Correspondence to: Charles H King, Center for Global Health and Diseases, Case Western Reserve University School of Medicine, Cleveland, OH 44106-7286, USA [email protected]
Abstracts
60 www.thelancet.com Published online March 14, 2011 Webappendix
Measurement of health systems strengthening: deviance analysis using mixed-method case studiesEckhard Kleinau, Soumya Alva, Amanda Makulec, Loren Bausell, Pamela Rao
AbstractBackground Country decision makers, donors, and international health leaders need to make evidence-based decisions about cost-effective investing in health systems strengthening by understanding the causal relationship between health systems functions and inputs and health outcomes. Unlike population surveys, the systematic collection of health systems performance data that would quantify such a relationship has yet to be adopted. To bridge this data gap, we developed and will have tested a deviance analysis using a mixed-method case study approach. This analysis aims to identify which combination of health system functions and inputs best explains high or low health systems performance, as measured by various health outcomes, such as skilled birth attendance and under-5 mortality.
Methods The deviance analysis compares health systems functions and inputs in high-performing, low-performing, and rapidly improving countries. The performance classification of 81 countries is based on coverage and progress over time for seven intermediate health outcomes. Data collection relies on mixed-method case studies that combine qualitative contextual health systems information with quantitative country health systems effort indices with use of a methodology similar to effort indices for family planning, maternal and neonatal health, and HIV/AIDS.
Findings Nine countries for the deviance analysis were selected based on their normalised performance scores across seven outcomes. Results from testing the health systems case studies in several countries will be presented, including health systems effort indices and results from validating the instrument through consistency checks and factor analyses.
Interpretation Contextual information combined with health systems effort indices for specific health systems functions and inputs explain why some countries experience great success in their health systems or why some struggle to improve their health systems, which suggests priorities for investments in health systems strengthening. Effort indices are a reliable, rapid, and inexpensive means for gathering missing data about health systems functions and inputs.
Published Online March 14, 2011
RTI International, Rockville, MD, USA (E Kleinau MD,
L Bausell MPH); ICF Macro, Calverton, MD, USA (S Alva PhD,
A Makulec MPH); and USAID, Washington, DC, USA
(P Rao PhD)
Correspondence to: Eckhard Kleinau, Analysis,
Information Management and Communications Activity,
Rockville, MD 20852-3907, USA [email protected]

Abstracts
www.thelancet.com Published online March 14, 2011 Webappendix 61
Country capacity building in health metrics: lessons from the Health Observatory of Latin America and the CaribbeanFelicia Marie Knaul, Gustavo Nigenda, Hector Arreola-Ornelas
AbstractBackground The Health Observatory of Latin America and the Caribbean (HO-LAC), an initiative of the not-for-profit private sector in Mexico, was created in 2007 to improve capacity for health metrics analysis to inform and improve health systems performance assessment and priority setting. A group of more than 260 researchers, from academic and policy institutions, has come together, covering 19 countries. Six networks of metrics (burden of disease, comparative risk assessment, effective coverage, financial protection, national health accounts, and human resources) are operating, each led by a researcher and research institute based in an LAC country. National initiatives are operating in the Dominican Republic, Costa Rica, Mexico, and Colombia. The regional initiative is based at the Mexican Health Foundation, with majority funding from the Carlos Slim Health Institute. This report aimed to describe the process of developing the HO-LAC and to identify lessons for capacity building in health metrics in other countries and regions.
Methods Literature review and key informant interviews were done, complemented by presentations of comparative regional results from each metric-specific network.
Findings Key ingredients of success include the network-of-networks concept and ongoing funding.
Interpretation The HO-LAC is an initiative that is gaining presence in the region as a producer of relevant and useful information. HO-LAC networks have been able to design and estimate metrics in six key fields, train researchers, and participate in the development of policy in several countries.
Published Online March 14, 2011
Harvard Global Equity Initiative, Boston, MA, USA (F M Knaul PhD); El Instituto Nacional de Salud Publica, Cuernavaca, Morelos, Mexico (G Nigenda PhD); and Fundación Mexicana para la Salud, Observatorio de la Salud para América Latina y el Caribe, Mexico City, DF, Mexico (H Arreola-Ornelas MSc)
Correspondence to: Felicia Marie Knaul, Harvard Global Equity Initiative, Boston, MA 02115, USA [email protected]
Abstracts
62 www.thelancet.com Published online March 14, 2011 Webappendix
Cross-country analysis of financial protection and health financing: results from the Health Observatory of Latin America and the CaribbeanFelicia Marie Knaul, Hector Arreola-Ornelas, Rebeca Wong, Oscar Méndez, the LAC Health Financing Network
Abstract Background Lack of financial protection in health plagues most poor countries. Financial protection for health is segmented and fragmented, and many are excluded from public, pre-payment options and resort to out-of-pocket payment. Families suffer the burden not only of illness, but also of economic ruin from financing their care, resulting in increased poverty. International recognition of this challenge to health systems has grown, spurred by the World Health Report, 2000. Academics and policy makers increasingly recognise the importance of evaluating health systems performance and financing with a view to achieving greater financial protection. We analysed the distribution and determinants of lack of financial protection expressed through catastrophic and impoverishing expenditure in Argentina, Bolivia, Brazil, Chile, Colombia, Costa Rica, Dominican Republic, Ecuador, Guatemala, Mexico, Nicaragua, and Peru. For several countries there are no previous estimates of catastrophic health spending.
Methods As part of a regional project, teams from each country analysed national household survey data using identical metrics. We compared the relative propensity to report catastrophic health-care expenditures within countries across specific population subgroups (eg, households with and without older adults). Simple multivariate analysis was undertaken with similarly defined variables for all countries.
Findings The prevalence of catastrophic health expenditures varied across countries and was associated with rural residency, poverty, the presence of older adults and young children, and lack of access to social security.
Interpretation This analysis provides insights into the relative vulnerability of subgroups to lack of financial protection in health. Measurement of health spending across countries is hampered by differences in types of data collected, and a priority for future analysis is to achieve compatibility in survey design. A serious challenge to measurement and analysis is the lack of longitudinal data on health spending.
Published Online March 14, 2011
Harvard Global Equity Initiative, Boston, MA, USA (F M Knaul PhD); Fundación
Mexicana para la Salud, Mexico City, DF, Mexico
(H Arreola-Ornelas MSc, O Méndez BSc); and University
of Texas Medical Branch, Galveston, TX, USA
(R Wong PhD)
Correspondence to: Felicia Marie Knaul, Harvard
Global Equity Initiative, Boston, MA 02115, USA

Abstracts
www.thelancet.com Published online March 14, 2011 Webappendix 63
Inequalities in cancer survival in low-income and middle-income countries: measurement, identification of outliers, and implications for health-system performance assessmentFelicia Marie Knaul, Hans-Olov Adami, David Hunter, Hector Arreola-Ornelas, Julio Frenk
AbstractBackground Cancer is now a health priority, in low-income and middle-income countries. Certain cancers (eg, breast and cervical) are leading causes of mortality for particular population groups. Yet, the health systems in these countries are particularly ill prepared to meet this challenge. In addition to preventing new cancers by reducing risk factors, strategies are needed to close the gap between rich and poor countries in cancer survival. Understanding of differences in survival across countries can contribute to developing effective strategies.
Methods We analysed survival rates by country income, health spending, and basic indicators of population health status and human development for cancers that can be prevented, treated, or both. We identified outliers—countries that perform particularly well or poorly at a given level of income and health status—to guide future in-depth research on health and health systems in a selection of countries for specific cancers. We used GLOBOCAN 2008 data by age (provided by the International Agency for Research on Cancer) and reviewed how projections of incidence and mortality affect the results. Data on mortality and access by state and income grouping for a specific country (Mexico) and focusing on breast cancer complements the global analysis. This analysis provides evidence of income-related barriers to access.
Findings Substantial inequalities exist in cancer survival rates across countries. Survival varied significantly among countries with similar levels of income, health spending, education, and basic health indicators for certain cancers, such as cervical, breast, testicular and childhood acute lymphoblastic leukaemia.
Interpretation Outlier analysis can provide an opportunity to identify poor and good performers and delve more deeply into the health and health system determinants of cancer survival. More and better cancer registries will be key for producing better evidence and to help countries face the transitions in non-communicable disease.
Published Online March 14, 2011
Harvard Global Equity Initiative, Boston, MA, USA (F M Knaul PhD); Harvard School of Public Health, Boston, MA, USA (Prof H-O Adami MD, Prof D Hunter ScD, J Frenk PhD); and Fundación Mexicana para la Salud, Mexico City, DF, Mexico (H Arreola-Ornelas MSc)
Correspondence to: Felicia Marie Knaul, Harvard Global Equity Initiative, Boston, MA 02115, USA [email protected]

Abstracts
64 www.thelancet.com Published online March 14, 2011 Webappendix
Vaccine-related adverse events in the USA: a need for an integrated open global surveillance systemVictor O Kolade, Xiangke Huang, Rajasree Pai Ramachandra, Riddhi Doshi
AbstractBackground The rapid spread of the H1N1 influenza pandemic in 2009 led to major concerns among policy makers worldwide. By September, 2009, a vaccine was approved and released. The safety profile of the vaccine was expected to resemble that of the existing seasonal influenza vaccine. By October, 2009, tens of millions of Americans were inoculated, making it imperative to monitor the impact and safety of this vaccine. This study aimed to determine the distribution and burden of H1N1 vaccine-related adverse events (AEs) reported to the Vaccine Adverse Events Reporting System (VAERS) between October, 2009, and September, 2010. Within the USA, VAERS serves as a central, national database for passive collection, sorting, and analysis of vaccine-related AEs.
Methods Univariate analyses were performed. β2 tests were used for comparison of AEs between the H1N1 injectable and nasal vaccines.
Findings Among the 10 646 reported AEs, 19% of cases occurred after nasal vaccine, while 81% resulted following parenteral vaccination. The magnitude of reported AEs was higher among male patients (64%) than in female patients (35%). Almost all (92%) the AEs were reported within 1 week of vaccination; the mean duration from vaccination to onset of AEs was 2∙9 days. More than a third of the AEs required emergency room visits: 6∙8% required hospitalisation (mean duration 7∙5 days). About 2% of the AEs were life threatening, with 61 deaths and 73 disabilities. Nasal vaccine AEs were associated with significantly fewer emergency room visits (p=0∙018), hospitalisations (p=0∙006), deaths (p=0∙029), and life-threatening events (p=0∙011).
Interpretation Analysis of the VAERS database demonstrated a significant magnitude of H1N1 vaccine-related severe AEs in the USA, with favourable results for the nasal vaccine. These findings warrant broader investigation and emphasise the need for an open-source global database for country-level vaccine-related AEs.
Published Online March 14, 2011
Department of Medicine, University of Tennessee College of Medicine, Chattanooga, TN,
USA (V O Kolade MD, X Huang MD, R Doshi MBBS); and Department of Internal
Medicine, University of Connecticut Health Center,
Farmington, Connecticut, CT, USA (R P Ramachandra MD)
Correspondence to: Riddhi Doshi, Department of
Medicine, University of Tennessee College of Medicine,
Chattanooga, TN 37403, USA [email protected]

Abstracts
www.thelancet.com Published online March 14, 2011 Webappendix 65
Social return on investment analysis: a new tool for priority setting and strategic decision making in global health?Shubha Kumar
AbstractBackground In a world of limited resources and dire needs, policy makers, non-governmental organisation managers, and donors face difficult decisions of where to invest their efforts. This study aimed to consider if and how social return on investment (SROI) analysis, an emerging decision-analysis tool that measures the social, economic, and environmental value generated by a programme or policy, might add value compared with current approaches to priority setting and evaluation of global health efforts.
Methods An analytical review of the literature on SROI analyses, including organisational case studies, was conducted, in addition to informal interviews with SROI experts. The framework was applied to a current project underway to develop an emergency medical system in Kenya.
Findings Consistent with an approach that recognises the complexity of international health and development, SROI analysis involves both quantitative and qualitative techniques, including impact mapping, engagement with multiple stakeholders, an SROI metric (which compares the value of benefits to the value of investment), and sensitivity analysis, on which to base decisions. The analysis: (1) encourages investing for social impact; (2) encourages accountability, transparency, and sustainability in decision making; and (3) places stakeholders at the centre of the process, including beneficiaries of aid whose voices have traditionally been ignored during planning. These are all critical principles for successful humanitarian efforts that have not been adequately encapsulated by current approaches, including cost-benefit and log-frame analyses. Applying SROI analysis in planning an emergency medical system in Kenya revealed critical insights during the stakeholder interviewing step, which shaped the priorities, cost estimates, and projected monetised value of the effort, none of which would have been discovered or factored into calculations had a traditional cost-benefit approach been taken given that stakeholders would not necessarily have been consulted during the process.
Interpretation This study suggests that SROI analysis might add value over current approaches used by decision makers in priority setting and evaluation of global health efforts.
Published Online March 14, 2011
UCLA School of Public Health, Los Angeles, CA, USA (S Kumar MPH)
Correspondence to: Shubha Kumar, UCLA School of Public Health, 10370 Northvale Road, Los Angeles, CA 90064, USA [email protected]
Abstracts
66 www.thelancet.com Published online March 14, 2011 Webappendix
Changes in patterns of premature mortality burden in relation to income in suburban southwest China: 1988 and 2008Cai Le, Dong Jun, Lu Yi-chun, Virasakdi Chongsuvivatwong
AbstractBackground We aimed to gain insight on changing profiles of premature mortality burden and the relationship between income and premature mortality at two points in time (1988 and 2008) in a suburban area of Yunnan province, a poor province in southwest China.
Methods Mortality data by cause for 1988 were obtained from a 1999 retrospective survey, and 2008 mortality data by cause were obtained from Guan Du Centre for Diseases Control. Annual years of life lost per 1000 population was calculated without age-weighting, but with 3% discounting rate. Rate was age adjusted to the total population of two points in time (1988 and 2008). The inflation rate between 1988 and 2008 was used to standardised 2008 per capita income. Multiple linear regression was used to model the variation in per capita income and years of life lost per 1000 population value.
Findings The overall premature mortality burden has fallen dramatically from 1988 to 2008, whereas the proportion of premature mortality burden because of non-communicable disease has grown rapidly since 1988. There has been a marked reduction in premature mortality burden due to prenatal and neonatal conditions since the 1980s. Non-communicable diseases and injuries are major causes of current premature mortality burden in this area. Chronic obstructive pulmonary disease, stroke, ischaemic heart disease, and road traffic injuries remain significant causes of premature mortality. There are strong negative relationships between premature mortality burden and income for both 1988 and 2008, which is why the areas with lower economic level had higher premature mortality burden.
Interpretation Emphasis of health care in this region should be placed on further control of non-communicable diseases and injuries and on reducing health disparities.
Published Online March 14, 2011
Department of Health Management and Economics,
School of Public Health, Kunming Medical University,
Kunming, China (Prof C Le PhD, Prof D Jun MD); Guan Du Centre
for Disease Control, Kunming, China (L Yi-chun MD); and
Epidemiology Unit, Faculty of Medicine, Prince of Songkla
University, Hat Yai, Songkhla, Thailand
(Prof V Chongsuvivatwong PhD)
Correspondence to: Cai Le, School of Public Health,
Kunming Medical University, 1168 Yu Hua Street, Chun Rong
Road, Cheng Gong New City, 650500, Kunming, Yunnan
Province, China [email protected]
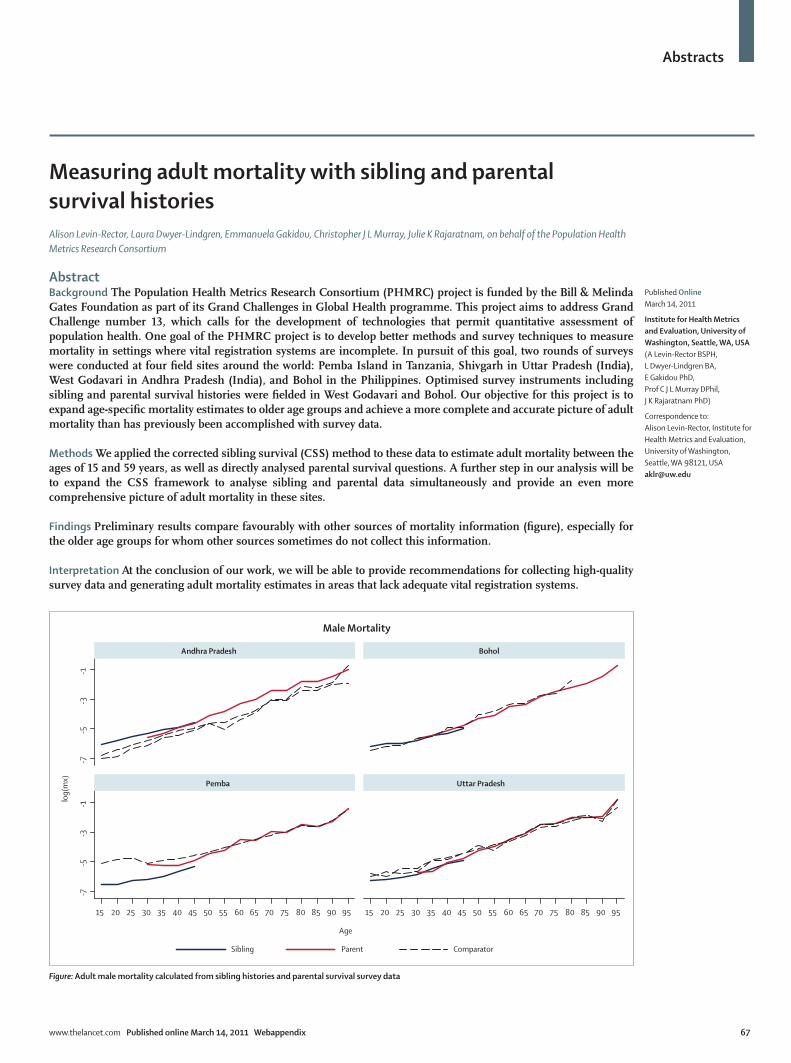
Abstracts
www.thelancet.com Published online March 14, 2011 Webappendix 67
Measuring adult mortality with sibling and parental survival historiesAlison Levin-Rector, Laura Dwyer-Lindgren, Emmanuela Gakidou, Christopher J L Murray, Julie K Rajaratnam, on behalf of the Population Health Metrics Research Consortium
AbstractBackground The Population Health Metrics Research Consortium (PHMRC) project is funded by the Bill & Melinda Gates Foundation as part of its Grand Challenges in Global Health programme. This project aims to address Grand Challenge number 13, which calls for the development of technologies that permit quantitative assessment of population health. One goal of the PHMRC project is to develop better methods and survey techniques to measure mortality in settings where vital registration systems are incomplete. In pursuit of this goal, two rounds of surveys were conducted at four field sites around the world: Pemba Island in Tanzania, Shivgarh in Uttar Pradesh (India), West Godavari in Andhra Pradesh (India), and Bohol in the Philippines. Optimised survey instruments including sibling and parental survival histories were fielded in West Godavari and Bohol. Our objective for this project is to expand age-specific mortality estimates to older age groups and achieve a more complete and accurate picture of adult mortality than has previously been accomplished with survey data.
Methods We applied the corrected sibling survival (CSS) method to these data to estimate adult mortality between the ages of 15 and 59 years, as well as directly analysed parental survival questions. A further step in our analysis will be to expand the CSS framework to analyse sibling and parental data simultaneously and provide an even more comprehensive picture of adult mortality in these sites.
Findings Preliminary results compare favourably with other sources of mortality information (figure), especially for the older age groups for whom other sources sometimes do not collect this information.
Interpretation At the conclusion of our work, we will be able to provide recommendations for collecting high-quality survey data and generating adult mortality estimates in areas that lack adequate vital registration systems.
Published Online March 14, 2011
Institute for Health Metrics and Evaluation, University of Washington, Seattle, WA, USA (A Levin-Rector BSPH, L Dwyer-Lindgren BA, E Gakidou PhD, Prof C J L Murray DPhil, J K Rajaratnam PhD)
Correspondence to: Alison Levin-Rector, Institute for Health Metrics and Evaluation, University of Washington, Seattle, WA 98121, USA [email protected]
-7-5
-3-1
-7-5
-3-1
15 20 25 30 35 40 45 50 55 60 65 70 75 80 85 90 95 15 20 25 30 35 40 45 50 55 60 65 70 75 80 85 90 95
Andhra Pradesh Bohol
Pemba Uttar Pradesh
Sibling Parent Comparator
log(
mx)
Age
Male Mortality
Figure: Adult male mortality calculated from sibling histories and parental survival survey data
Abstracts
68 www.thelancet.com Published online March 14, 2011 Webappendix
Cervical and breast cancer in Latin America: a neoplastic transitionSarah I Lewis, Héctor Gómez Dantés, Rafael Lozano
AbstractBackground Demographic and epidemiological transitions in Latin American and Caribbean (LAC) countries have contributed to shifts in the main types of cancers that affect women, characterised by differential burdens of cancer associated with a country’s stage of demographic transition. We aimed to compare and contrast measures of cancer burden in women to describe and analyse the double burden of disease in many LAC countries as they navigate neoplastic transitions.
Methods We searched literature indexes and compiled statistics from registries and databases on breast and cervical cancer morbidity, mortality, and disability-adjusted life-years (DALYs) for 28 LAC countries. Incidence was analysed over time, and mortality and DALYs were analysed descriptively and comparatively to arrive at proportional burdens of each cancer. Case-fatality ratios were calculated and plotted against single-year incidence rates.
Findings Countries that are further advanced in their demographic transitions have a greater magnitude of breast cancer—namely, in the anglophone Caribbean, Uruguay, and Argentina. Cervical cancer burden is generally greater in Andean and Central American countries and Haiti, which are in earlier stages of demographic transition. Case-fatality ratios for breast cancer range from 0∙28 in the Dominican Republic to 0∙49 in Cuba, and decrease as incidence rates increase. Cervical cancer ratios vary from 0∙34 in Puerto Rico and Argentina to more than 0∙50 in nine LAC countries, and tend to increase with increased incidence. Bolivia, Honduras, Guatemala, and Haiti have ratios above 0∙45 for both cancers.
Interpretation Cervical and breast cancers cause a significant burden among Latin American women. Despite the fact that both are detectable and curable, mortality rates and case-fatality ratios are unacceptably high in the region because of lack of early detection and inadequate resources for effective treatment. Because the risk factors that cause breast cancer are largely unmodifiable and tend to increase with economic development, its share of the burden is likely to grow.
Published Online March 14, 2011
National Institute of Public Health (INSP), Cuernavaca,
Mexico (S I Lewis MS, H Gómez Dantés MD); and
Institute for Health Metrics and Evaluation, University of
Washington, Seattle, WA, USA (Prof R Lozano MD)
Correspondence to: Sarah I Lewis, Instituto Nacional
de Salud Pública, Centro de Investigación en Sistemas de
Salud, Universidad No. 655, Col. Santa María Ahuacatitlán,
C.P. 62100, Cuernavaca, Mor. México

Abstracts
www.thelancet.com Published online March 14, 2011 Webappendix 69
Measuring health-care affordability: conceptual issues and empirical analysis for ChinaYuanli Liu
AbstractBackground One of the intrinsic goals of health systems is making health care affordable for all. There have been attempts to develop indicators of financial risk protection and fairness in financing. I would argue that health-care affordability should and can be measured at the microlevel (individual affordability) and macrolevel (social affordability), because both perspectives are highly policy relevant. While numerous studies on individual affordability exist, there is a relative lack of studies on measurement of social affordability. The aim of this study was to make a contribution to the literature by examining conceptual issues in developing the two indicators and applying them in an empirical study on China’s health-system performance.
Methods Drawing on China’s latest national household survey data as well as national health account data, we estimated the country’s changes in individual and social affordability over 5 years from 2003 to 2008.
Findings Several important findings emerged. First, with basic health insurance coverage being increased from merely 22·1% in 2003, to 87·1% in 2008, health-care use, especially hospitalisation rate, went up significantly. Second, medical costs outgrew people’s income and insurance outlay. Thus, overall individual affordability in terms of percentage of disposable income spent on health care, forgoing hospitalisation because of inability to pay and catastrophic spending, has not seen any remarkable improvement. Worse still, health-care affordability for low-income families appeared to have decreased during this period. Third, China’s social affordability of health care seemed to be very high. The share of China’s increased income spent on health was as low as 4·8%, and government spending on health only accounted for 4·5% of its total budget in 2008.
Interpretation In the short run, China certainly can afford to spend more money on health in general (not at the expense of reducing non-health spending) and to help to increase affordability for the low-income families in particular.
Published Online March 14, 2011
Department of Global Health and Population, Harvard School of Public Health, Boston, MA, USA (Y Liu PhD)
Correspondence to: Yuanli Liu, Department of Global Health and Population, Harvard School of Public Health, Boston, MA 02115, USA [email protected]

Abstracts
70 www.thelancet.com Published online March 14, 2011 Webappendix
Putting health metrics into practice: Population Services International’s use of disability-adjusted life-years for programmatic decision makingKim Longfield, Steven Chapman, Warren Stevens, David Jeffries
AbstractBackground PSI adopted the disability-adjusted life-year (DALY) in 2006 as its key performance metric to estimate the health impact of its products, services, and behaviour change interventions, and to inform programmatic decision making. While international standards exist to calculate DALYs at the national level, Population Services International (PSI) has pioneered the application of DALYs to individual health interventions. This paper describes DALY-based tools used for decision making. It presents and discusses the practical constraints of an organisation using priority-setting processes to optimise health impact and cost-effectiveness.
Methods PSI creates intervention-specific DALY models based on epidemiological and programme data. Each country office reports on activities and data feeds into models to calculate estimates of health impact achieved. A separate model uses annual expenditure and output activity data to calculate incremental cost per DALY estimates across health areas, for each country. Results are used to assess potential for growth and increases in efficiency for the organisation.
Findings In 2009, PSI averted 15∙1 million DALYs, a 13% increase over the previous year. The average cost per DALY in 2008 was US$29, well below the World Bank’s benchmark of $50 or less. New tools have been developed to: (1) provide country-specific burden of disease and rank the importance of each health area in which PSI works; (2) calculate the proportion of disease burden averted because of current programmes; (3) evaluate strategies that should either be scaled up or diversified to increase health impact; and (4) identify new investment areas for maximising cost-effectiveness.
Interpretation Use of an evidence-based approach has been valuable for increasing PSI’s scope and focusing on achievable goals. The organisation is now shifting its use of DALYs to inform strategy and programme design. The development of any model is an evolutionary process, and PSI is continually refining and improving its calculator.
Published Online March 14, 2011
Research and Metrics, Population Services
International, Washington, DC, USA (K Longfield PhD,
S Chapman PhD, W Stevens PhD, D Jeffries PhD)
Correspondence to: Kim Longfield, Research and Metrics, Population Services
International (PSI), 1120 19th Street, NW, Suite 600,
Washington, DC 20036, USA [email protected]

Abstracts
www.thelancet.com Published online March 14, 2011 Webappendix 71
Monitoring progress towards the Millennium Development Goal for drinking water and sanitation target: WHO/UNICEF Joint Monitoring Programme for Water-Supply and SanitationRolf Luyendij
AbstractBackground The WHO/UNICEF Joint Monitoring Programme on Water-Supply and Sanitation (JMP), the official UN mechanism to monitor progress towards the Millennium Development Goal (MDG) for water and sanitation target, produces its country, regional, and global estimates of the population with sustainable access to safe drinking water and basic sanitation. We address the challenges of periodic reporting of estimates that are comparable over time and across countries. For the developing world, the JMP estimates are exclusively based on national data from household sample surveys and censuses. The choice by the UN to maintain intercountry comparability of estimates required the use of standard indicators across countries, which was limited by data and information readily available across countries going back to the MDG baseline year 1990.
Discussion The use of data from sample surveys and censuses, many of which are available for the period going back to 1990, facilitates the reconciliation of national and international coverage estimates, and also serves to align definitions of responsible line-ministries with those maintained by the National Statistics Offices. We present some of the experiences of the JMP in this area. Recently, sample survey data were used to show trends in use of sanitation facilities by socioeconomic status drawing on the disaggregation by wealth quintiles provided by household sample surveys. We provide an illustration of such analysis and also present a further disaggregation of access levels beyond the improved/unimproved dichotomy. Finally we discuss the challenges of global monitoring of the other aspects of the MDG target not captured by the MDG indicators. These challenges include issues like water quality and safety, the sanitation value chain, indicators measuring sustainable access, and redefining access to drinking water and sanitation in high density peri-urban and slum areas. With this work the JMP is laying the groundwork for the formulation of targets after 2015, corresponding indicators, and data collection mechanisms.
Published Online March 14, 2011
Statistics and Monitoring Section, UNICEF, New York, NY, USA (R Luyendijk MPH)
Correspondence to: Rolf Luyendijk, Statistics and Monitoring Section, UNICEF, New York, NY 10017, USA [email protected]

Abstracts
72 www.thelancet.com Published online March 14, 2011 Webappendix
Estimation of population cause-specific mortality fractions from in-hospital mortality in ChinaZhou Maigeng, Yang Gonghuan
AbstractBackground At present, the coverage of all-cause mortality surveillance in China is only about 20% of the whole country; the rest has only data from hospital reports. Most hospital reports are highly reliable with credible diagnosis of the causes of death. This study aims to build a multifactor model on the basis of an analysis of factors affecting places of death, particularly in hospital or elsewhere. On the basis of existing hospital data, we will estimate the nationwide and regional cause-of-death compositions and evaluate the effects of the estimates.
Methods A multifactor logistic regression model on factors affecting places of death will be built from data from the third retrospective survey on the cause of death in 2004. The model will include whether patients died in hospital as a dependent variable, and diseases, individual factors, and regional factors as independent variables, using systematic error as inherent error of the model. The established model and hospital mortality data will be used to evaluate the 2008 population-based cause-of-death data from the national disease surveillance system.
Findings The average systematic errors of the model built on 2004 data in terms of estimation of the whole country, urban and rural, and eastern, central, and western regions are 10∙46%, 7∙98%, 17∙14%, 19∙46%, 11∙70%, and 13∙46%, respectively. The results of the verification of model over 2008 cause-of-death data show that the model has average relative errors over the whole country, urban and rural, and eastern, central, and western regions of 13∙99%, 12∙17%, 19∙72%, 18∙69%, 10∙69%, and 18∙93%, respectively. The estimated death cause composition of the model is very close to the actual cause-of-death composition, and the estimation effect is promising.
Interpretation The study provides a population-based cause-of-death composition estimation method for areas without all-cause mortality surveillance. This method can estimate the cause-of-death compositions with lower relative estimation errors. Meanwhile, the method might, to some extent, evaluate the accuracy of population-based cause-of-death composition, suggest missed reporting or incorrect classification of diseases, and find clues for on-site problems.
Published Online March 14, 2011
Chinese Centre for Disease Control and Prevention,
Beijing, China (Z Maigeng PhD, Y Gonghuan MD)
Correspondence to: Zhou Maigeng, Chinese Centre
for Disease Control and Prevention, 155 Changbai Road,
Changping District, Beijing 102206, China
Abstracts
www.thelancet.com Published online March 14, 2011 Webappendix 73
Are we changing epidemiological transition points by increasing the fraction of deaths due to non-communicable diseases when improving data quality?Leslie Mallinger, Kyle Foreman, Susanna Makela, Stephanie Ahn, Mengru Wang, David Phillips, Charles Atkinson, Janaki O’Brien, Jeanette Birnbaum, Mohsen Naghavi, Alan Lopez, Rafael Lozano, Christopher J L Murray
AbstractBackground Over 35% of available cause-of-death data from 1901 to 2008 contained deaths assigned to causes often called garbage codes (GCs). These cases include reported causes with insufficient detail or those that cannot or should not be considered underlying causes of death. Thus, it is necessary to redistribute deaths from GCs to more meaningful causes on the basis of certification practice, pathophysiology, or both; this correction often changes time trends across causes and can influence the timing of the epidemiological transition. We aimed to determine the effect of GC redistribution on the timing of the epidemiological transition in developed and developing countries with sufficient cause-of-death data, with a focus on changing trends in selected countries such as the UK, Australia, Japan, and Chile.
Methods GC redistribution methods have been applied to publically available vital registration cause-of-death data encompassing 743 million deaths from 145 countries from 1901 to 2008. The timing of the epidemiological transition was identified both before and after GC redistribution. Changes were investigated in depth within selected countries.
Findings For both developed and developing countries, GC redistribution tends to shift the epidemiological transition to occur earlier in time. The magnitude of the change varies with the fraction of deaths assigned to GCs for each country and time period. A greater increase in major non-communicable diseases due to GC corrections is observed in earlier years compared with more recent time periods, partly because GCs have declined from more than 43% in the 1950s to 24% in the 1990s.
Interpretation By improving the comparability of cause-of-death data through GC redistribution, we found that non-communicable diseases were prominent earlier than previously believed. Much of this change is attributable to improper certification and coding of deaths due to non-communicable diseases around the time of the epidemiological transition.
Published Online March 14, 2011
Institute for Health Metrics and Evaluation, University of Washington, Seattle, WA, USA (L Mallinger BS, K Foreman AB, S Makela BS, S Ahn BA, M Wang BA, D Phillips BS, C Atkinson BS, J O’Brien BA, J Birnbaum MPH, M Naghavi MD, Prof R Lozano MD, Prof C J L Murray DPhil); and University of Queensland, School of Population Health, Brisbane, QLD, Australia (Prof A Lopez PhD)
Correspondence to: Rafael Lozano, Institute for Health Metrics and Evaluation, University of Washington, Seattle, WA 98121, USA [email protected]

Abstracts
74 www.thelancet.com Published online March 14, 2011 Webappendix
Progress in access to water and sanitation between 1980 and 2010: a driver of decreases in under-5 mortality?Leslie Mallinger, Ella Sanman, Christopher J L Murray, Emmanuela Gakidou
AbstractBackground An estimated 4∙2% of all deaths could be prevented simply through access to and the appropriate use of safe water, sanitation, and hygiene facilities. Many of these deaths are caused by diarrhoeal disease, the second biggest contributor to the disease burden in children under 5 years. There is a strong correlation between infant mortality and the proportion of the population without access to improved water sources. However, a complete time series for national access to improved drinking water sources and improved sanitation facilities has yet to be developed. We aimed to create estimates of the proportion of the population with access to an improved drinking water source and an improved sanitation facility, for all countries from 1980 to 2010. We also aimed to quantify the contribution of improvements in access to safe water and sanitation to the reductions in infant and child mortality.
Methods Data from over 1000 surveys from 169 countries were used to estimate national access to safe water and sanitation. Source and facility classifications were assigned according to the WHO-UNICEF Joint Monitoring Programme for Water Supply and Sanitation. A variant of spatial-temporal regression was used to develop estimates for country-years without survey data.
Findings Although progress is being achieved for both access to safe water and sanitation, access to improved water sources tends to be much higher than access to improved sanitation facilities. The rate of progress varies widely across countries. Preliminary analysis suggests that there is a significant contribution of improved access to water and sanitation to reductions in under-5 mortality across countries.
Interpretation Our findings can help to inform policy makers of the areas with the greatest need for interventions aiming to increase access to water and sanitation facilities, and to identify countries where successful scale-ups have occurred. Inequalities across countries in terms of infant and child mortality may be partly attributable to inequalities in access to safe water and sanitation.
Published Online March 14, 2011
Institute for Health Metrics and Evaluation, University of
Washington, Seattle, WA, USA (L Mallinger BS, E Sanman BS,
Prof C J L Murrary DPhil, E Gakidou PhD)
Correspondence to: Emmanuela Gakidou, Institute
for Health Metrics and Evaluation, University of
Washington, Seattle, WA 98121, USA
Abstracts
www.thelancet.com Published online March 14, 2011 Webappendix 75
Optimum resource allocation through linear programming and disease modellingJake Marcus, Abraham Flaxman, Alireza Vahdatpour, Christopher J L Murray
AbstractBackground Previous approaches to priority setting, including major efforts by the World Bank in 1993 with the Health Sector Priorities Review and by WHO in 1998 with the CHOICE project (Choosing Interventions that are Cost Effective), have provided important evidence for the cost-effectiveness of a range of health interventions. They have, however, largely neglected the decisions surrounding development of the physical and human infrastructure required to deliver those interventions. We introduce a simulation and optimisation tool for priority setting in the health sector. Our tool provides guidance on interventions as well as on service delivery platforms, such as district hospitals, rural health clinics, or community health workers. The tool consists of two parts: simulation software to assess the consequences of policy choices on a population, and optimisation software to determine the best course of action on the basis of those results and a set of political and budgetary constraints.
Methods For the simulation tool, we evolve a population through a compartmental model of health, disease, and death states with various probabilities of transitioning between those states. This generic disease model accommodates the analysis of a wide range of policy decisions. Preventative interventions, for instance, are modelled as lowering the incidence of a disease, or the probability of transitioning from a healthy compartment to a disease compartment. The simulation tool produces the costs incurred and DALYs averted by policy choices. These numbers are then fed into software that determines the optimum portfolio of investments via linear programming.
Findings We produce optimum portfolios for a wide range of contexts by varying the current burden of disease, the cost of interventions and platforms, and the availability of physical and human infrastructure.
Interpretation We provide guidance to decision makers on investing in prevention and treatment, interventions and infrastructure, and the uncertainty associated with these decisions.
Published Online March 14, 2011
Institute for Health Metrics and Evaluation, University of Washington, Seattle, WA, USA (J Marcus BA, Prof A Flaxman PhD, Prof A Vahdatpour PhD, Prof C J L Murray DPhil)
Correspondence to: Jake Marcus, Institute for Health Metrics and Evaluation, University of Washington, Seattle, WA 98121, USA [email protected]
Abstracts
76 www.thelancet.com Published online March 14, 2011 Webappendix
Economic evaluation of infant-feeding strategies to prevent mother-to-child transmission of HIV in South AfricaMandy Maredza, Leigh Johnson, Melanie Bertram, Haroon Saloojee, Matthew Chersich, Karen Hofman
AbstractBackground WHO and UNICEF guidelines recommend that exclusive breastfeeding is the optimum mode of infant feeding during the first 6 months. This recommendation is challenging in settings such as South Africa, where on average 25% of pregnant women are HIV positive. Without prophylaxis, transmission can be increased by 5–20% during breastfeeding. In order to reduce vertical transmission, the newly revised South African national guidelines for preventing mother-to-child transmission for HIV-positive mothers recommend either exclusive formula feeding or exclusive breast feeding with infant nevirapine prophylaxis for 6 months. We present an analysis of the cost-effectiveness of exclusive formula feeding compared with exclusive breastfeeding combined with infant nevirapine prophylaxis in the first 6 months.
Methods This study will estimate all direct public sector costs including the costs of providing formula milk, infant nevirapine prophylaxis, and antiretroviral treat ment for infants who test HIV positive at 6 weeks. A mathematical model of HIV incidence in children and HIV survival has been developed from South African data and will be used to model outcomes. The model allows for transmission from infected mothers to infants after birth as a result of breastfeeding; the transmission rate changes based on the infant feeding scenario being analysed.
Findings The cost per HIV transmission averted will be calculated for each feeding strategy. A secondary outcome measure will be the cost per death averted in the first 2 years of life. In both cases, analysis will be at the district level with a representative urban, semi-urban, and a rural district with differing socioeconomic status and background infant mortality levels.
Interpretation This study will be the first South African study to estimate the cost of infant feeding strategies using the revised guidelines for preventing mother-to-child transmission. Analysis across different districts will facilitate development of one national or subnational recommendation of infant feeding among HIV-positive mothers in accordance with WHO 2010 infant feeding guidelines.
Published Online March 14, 2011
Medical Research Council/University of the
Witwatersrand, Rural Public Health and Health Transitions
Research Unit (Agincourt), Johannesburg, South Africa
(M Maredza MPH, M Bertram PhD,
K Hofman MBBCh); Health and Population Division of Public
Health, Faculty of Health Sciences (M Maredza,
M Bertram, K Hofman), Division of Community Paediatrics
(Prof H Saloojee MBBCh), Centre for Health Policy, School of
Public Health (M Chersich MBBCh), University
of the Witswatersrand, Johannesburg, South Africa;
Centre for Infectious Disease Epidemiology and Research,
University of Cape Town, Cape Town, South Africa
(L Johnson PhD); Department of Obstetrics and Gynaecology,
Ghent University, Ghent, Belgium (M Chersich); and
Division of International Science Policy, Planning and
Evaluation Fogarty International Center, National Institutes of Health, Bethesda,
MD, USA (K Hofman)
Correspondence to: Mandy Maredza, Health and
Population Division, School of Public Health, University of the
Witwatersrand, 10th Floor, Room 10B09, 7 York Road,
Parktown 2193, South Africa [email protected]

Abstracts
www.thelancet.com Published online March 14, 2011 Webappendix 77
The Pan American Health Organization Health Information Platform: an organisation-wide data warehouse and health intelligence platform to support health analysis and decision making Ramon Martinez-Piedra
AbstractBackground The Pan American Health Organization (PAHO) collects, analyses, and synthesises a large amount of health-related data from member states. These data are often collected by individual departments on specific health topics and kept in distinct databases. Users often find it difficult to identify and access the data they need to answer specific questions. In addition, the increasing demand for health information in the context of the scaling up for better health requires a dynamic approach to analysing, synthesising, and communicating relevant information to users. In this study I present the design and implementation of the PAHO Health Information Platform (PHIP), highlighting processes and features such as data integration, data access and use for analysis, and fast visual analytical approach and information dissemination approach.
Methods A PAHO-wide data warehouse was designed and implemented. Health data from technical areas and programmes across PAHO have been integrated into the health data warehouse. A visual and fast analytical approach was adopted as the health intelligence component.
Findings Integrated health data are available and ready to be used for more comprehensive analysis by health analysts within PAHO. The visual and fast analytical approach of PHIP allows exploring large and complex datasets, understanding data, unveiling data patterns, and enabling ad-hoc data exploration. PHIP also facilitates the elaboration and publication of diverse information products, including reports, visualisation, and dashboards. High interactivity is a feature of information products, allowing end-users to ask questions and get answers while exploring them. Some information products are illustrated during the presentation.
Interpretation PHIP has been the solution for: (1) the integration of data from technical areas and programmes across PAHO; (2) the accessibility to health data for analysis; (3) the elaboration and dissemination of information products and providing health information and evidence to member states, policy makers, and the public; and (4) applying a more efficient and effective way to communicate relevant information to users.
Published Online March 14, 2011
Health Information and Analysis, Health Surveillance and Disease Prevention and Control, Pan American Health Organization (PAHO), Washington, DC, USA (R Martinez-Piedra MEng)
Correspondence to: Ramon Martinez-Piedra, Health Information and Analysis, Health Surveillance and Disease Prevention and Control, Pan American Health Organization (PAHO), 525 23rd Street, NW, Washington, DC 20037, USA [email protected]
Abstracts
78 www.thelancet.com Published online March 14, 2011 Webappendix
Measurement of the maternal mortality rate in an Indian state: early transitionShiv Chandra Mathur
AbstractBackground Rajasthan is the largest state in India, with an area of 320 000 km², inhabited by more than 65 million people. The current estimate of over 8000 maternal deaths in a year throughout the state is based on the data collected for 2004–06. With heavy inputs in the Reproductive Health Programme, mechanisms are now being devised to improve the maternal health information system with focus on the maternal mortality rate. This report presents the early transition observed in this context. The study documents the change induced through special software on pregnancy and child tracking systems (PCTS) used by 368 community health centres and 1504 primary health-care units, covering more than 41 000 inhabited villages.
Methods The study covers all the 33 districts and 237 rural development blocks of the state. It records the problems faced in the first year of PCTS installation and data transfer in the health systems of Rajasthan. Change brought through vigilance in the tracking in the delivery of maternal services over a year has been recorded. Information on maternal death review introduced through this system has also been compiled and analysed at the state level.
Findings PCTS is software that state government could install at all health facilities with help from the Government of India under the National Rural Health Mission. Whenever a combination of a committed health manager and a well oriented data-entry operator was available, rapid change in recording—thereby providing supportive supervision—started. There is a major change in organisation culture that has initiated an improvement in maternal health status.
Interpretation Consistent efforts are needed to sustainably hold on to the required software and in-service orientation with attitudinal change for the use of modern technology in remote places if Millennium Development Goal 5 is to be achieved in time.
Published Online March 14, 2011
State Health System Resource Centre, Rajasthan, India
(Prof S C Mathur MD)
Correspondence to: Shiv Chandra Mathur, National Rural Health Mission, Swasthya
Bhawan, Rajasthan, Jaipur, India [email protected]
Abstracts
www.thelancet.com Published online March 14, 2011 Webappendix 79
Measurement of malaria in the Democratic Republic of the Congo by molecular analyses of leftover dried blood spots from the 2007 demographic and health surveyJane P Messina, Steven M Taylor, Carla C Hand, Jonathan J Juliano, Jeremie Muwonga, Antoinette K Tshefu, Benjamin Atua, Md Tauqeer Alam, Venkatachalam Udhayakumar, Michael Emch, Steven R Meshnick
AbstractBackground Current estimates of malaria burden and distribution are based on limited data, primarily from convenience sampling. Demographic and health surveys (DHS), which are large population-based, representative surveys conducted at regular intervals in many malaria-endemic countries, offer an opportunity for improved estimates and maps of malaria prevalence. We aimed to determine the prevalence and distribution of malaria and drug-resistant malaria in the Democratic Republic of the Congo using high-throughput molecular methods.
Methods DNA was extracted from 8838 dried blood spots obtained from DHS participants in 2007. Real-time pan-species PCR analyses were conducted on all specimens, followed by species-specific PCRs for Plasmodium falciparum, P malariae, and P ovale. Single-nucleotide polymorphisms associated with antimalarial drug resistance were measured in a subset of samples by DNA sequencing of the parasite pfdhfr, pfdhps, and pfcrt genes.
Findings 2682 respondents (weighted proportion 33∙5%) were parasitaemic; prevalence ranged from 0% to 82% within geographically defined survey clusters. P falciparum monoinfections were most common (90∙4%), but monoinfections and co-infections with P malariae (8∙7%) and P ovale (0∙7%) were also present. On a cluster-level analysis, the prevalence of malaria was strongly associated with increased under-5 mortality. There was a great deal of geographical heterogeneity and clustering in the distribution of drug-resistance alleles.
Interpretation PCR analysis of leftover dried blood spots from the DHS is a simple and effective means of measuring and mapping all species of malaria and drug-resistant malaria. Comparisons of malaria prevalence maps from consecutive DHS can be used to monitor the effectiveness of malaria control interventions. PCR-based surveillance enables mapping of malaria reservoirs (PCR-positive asymptomatic adults) overlooked by other surveillance programmes but that are of particular relevance for malaria elimination efforts.
Published Online March 14, 2011
Department of Geography (J P Messina MS, M Emch PhD), Carolina Population Center (J P Messina, M Emch), Department of Epidemiology, Gillings School of Global Public Health (S M Taylor MD, C C Hand MD, Prof S R Meshnick MD), Division of Infectious Diseases (J J Juliano MD), University of North Carolina, Chapel Hill, NC, USA; Division of Infectious Diseases and International Health, Duke University Medical Center, Durham, NC, USA (S M Taylor); Laboratoire National de Reference SIDA et IST (LNRS), Kinshasa, Democratic Republic of the Congo (J Muwonga MD); Ecole de Santé Publique, Faculté de Medecine, Université de Kinshasa, Democratic Republic of the Congo (Prof A K Tshefu MD); Programme National de Lutte contre le Paludisme (PNLP), Kinshasa, Democratic Republic of the Congo (B Atua MD); Malaria Branch, Division of Parasitic Diseases and Malaria, Center for Global Health, Centers for Disease Control and Prevention, Atlanta, GA, USA (M Tauqeer Alam PhD, V Udhayakumar PhD); and Atlanta Research and Education Foundation, VA Medical Center, Atlanta, GA, USA (M Tauqeer Alam)
Correspondence to: Steven R Meshnick, Department of Epidemiology, Gillings School of Global Public Health, University of North Carolina, Chapel Hill, NC 27599, USA [email protected]
Abstracts
80 www.thelancet.com Published online March 14, 2011 Webappendix
Getting to zero: metrics for achieving malaria elimination in South AfricaDevanand Moonasar, Tej Nuthulaganti, Philip Kruger, Aaron Mabuza, Eric Rasiswi, Rajendra Maharaj
AbstractBackground Recently, South Africa has launched a new strategic plan for malaria elimination 2010–18. A massive scale-up of interventions is being planned during the next 8 years, and improving the existing metrics for monitoring and evaluation is key to ensure robust tracking of progress towards elimination. We aimed to determine appropriate indicators for tracking progress towards malaria elimination and to ensure strengthening of the National Department of Health’s capacity for the monitoring and evaluation system.
Methods A comprehensive review of best practices, gaps, and epidemiological trends against WHO’s elimination continuum was conducted in each endemic province. The availability of malaria information was assessed and feasibility of routinely collecting data was determined.
Findings After conducting a national and provincial level review of available malaria information, we determined that information on cases, deaths, and outbreak response time are widely available (98% reporting). Stratified data on incidence per local municipality and case importation were less widely available (more than 30% incomplete reporting). A centralised integrated information system does not exist to aggregate data to track epidemiological indicators and intervention coverage rates. Baseline information and feasibility for routine collection were determined.
Interpretation Selecting appropriate metrics for countries embarking on malaria elimination is of great importance to ensure programme success. Assessing the strength and feasibility of the monitoring and evaluation system has allowed South Africa to select indicators appropriate for tracking progress and has revealed areas for national monitoring improvement. A core set of 15 indicators across five thematic areas was determined appropriate for routine monitoring and evaluation at the national level. Integration for a national malaria information system is needed to monitor intervention coverage rates. Reviewing and assessing current availability of information and determining areas for monitoring and evaluation improvement will help to build surveillance capacity to ensure every case of malaria is found, diagnosed, and treated.
Published Online March 14, 2011
National Department of Health, Pretoria, Gauteng,
South Africa (D Moonasar DrPH); Clinton
Health Access Initiative, Pretoria, Gauteng, South Africa
(T Nuthulaganti MS); Global Health Group, University of
California–San Francisco, San Francisco, CA, USA
(T Nuthulaganti); Harvard School of Public Health,
Boston, MA, USA (T Nuthulaganti); Limpopo
Provincial Government, Department of Health and
Social Welfare, Tzaneen, South Africa (P Kruger Dip);
Mpumalanga Provincial Government, Department of
Health, Nelspruit, Mpumalanga, South Africa
(A Mabuza Dip); KwaZulu-Natal Provincial Government,
Department of Health, Jozini, KwaZulu-Natal, South Africa
(E Rasiswi Dip); and Medical Research Council of South
Africa, Durban, KwaZulu-Natal, South Africa (R Maharaj PhD)
Correspondence to: Tej Nuthulaganti, Civitas
Building Office 831N, Cnr of Andries and Struben Street,
Pretoria, Gauteng 0001, South Africa

Abstracts
www.thelancet.com Published online March 14, 2011 Webappendix 81
Epidemiology of ischaemic heart disease in 21 world regions in 2005: a systematic review for the Global Burden of Disease studyAndrew Moran, Mohammad H Forouzanfar, Laurie Anderson, Masoud Mirzaei, Adrianna Murphy, Marina Chilov, John T Oliver, Lee Goldman, Mohsen Nahgavi, Christopher J L Murray, Majid Ezzati, George Mensah
AbstractBackground Ischaemic heart disease (IHD) is the leading cause of death worldwide, and affects both high-income and lower-income regions. We aimed to estimate the epidemiology of IHD in 21 world regions in 2005 for the Global Burden of Disease (GBD) study.
Methods Medline, Embase, and LILACS were searched for IHD epidemiology studies in GBD high-income and developing regions published between 1980 and 2008, with use of a systematic protocol validated by regional IHD experts. The disease model of IHD for the GBD study included three sequelae: myocardial infarction (MI), heart failure, and angina pectoris. Meta-analysis methods were used to obtain summary estimates of MI and heart failure incidence and angina prevalence within regions.
Findings Literature searches yielded 40 205 papers, of which 1801 met initial screening criteria. On detailed review of full text papers, 368 met final inclusion criteria. Summary estimates of MI and heart failure incidence and angina prevalence from the review varied across regions with data. Data were sufficient for high-income regions, but missing or sparse in developing regions, particularly sub-Saharan Africa.
Interpretation A systematic review for the GBD study will provide comprehensive IHD epidemiology estimates for most world regions, with the exception of sub-Saharan Africa and other developing regions. For forthcoming final estimates, DisMod III software will use covariates such as mortality, case fatality, method of measurement, and major risk factors (tobacco consumption and mean cholesterol) to impute missing data and refine the review’s summary estimates. Biases addressed in the analysis will include not only non-representative data, but also the influence of diagnostic methods—eg, use of troponin enzyme on incidence in high-income regions, and false positive angina diagnoses with the Rose angina questionnaire. More complete knowledge of the global burden of IHD will require improved IHD surveillance programmes in all world regions.
Published Online March 14, 2011
Columbia University Medical Center, New York, NY, USA (A Moran MD, M Chilov MLIS, J T Oliver MLIS, Prof L Goldman MD); Institute for Health Metrics and Evaluation, University of Washington, Seattle, WA, USA (M H Forouzanfar PhD, M Nahgavi PhD, Prof C J L Murray DPhil); United States Centers for Disease Control, Georgia, GA, USA (L Anderson PhD); Yazd Cardiovascular Research Centre, Shahid Sadoughi University, Yazd, Iran (M Mirzaei PhD); Harvard University, Boston, MA, USA (A Murphy MPH); Imperial College, London, London, UK (Prof M Ezzati PhD); and Global Research and Development, Pepsico, Purchase, New York, NY, USA (G Mensah MD)
Correspondence to: Andrew Moran, Division of General Medicine, Columbia University Medical Center, Presbyterian Hospital 9th floor, room 105, 622 West 168th Street, New York, NY 10032, USA [email protected]

Abstracts
82 www.thelancet.com Published online March 14, 2011 Webappendix
Measures of financial protection for health system comparison: can we do better?Rodrigo Moreno-Serra, Peter Smith
Abstract Background A fundamental objective of health systems is to protect citizens from the financial consequences of illness, as emphasised by the 2010 WHO World Health Report. However, despite significant progress on the development of metrics to assess financial risk protection, traditional measures offer an incomplete picture for health system comparison. Within an economic analytical framework, we explain why the actual incidence of inadequate financial protection in a health system can be misjudged by currently used metrics, and present alternatives for complementing and improving them.
Methods We describe the main financial protection metrics—catastrophic and impoverishing health spending—with a focus on their economic under pinnings, usefulness, and limitations for system performance assessments. We indicate how performance comparisons can be undertaken through non-parametric estimations of efficiency frontiers, in which traditional financial protection measures are augmented with national indicators of socioeconomic development and coverage for some health interventions.
Findings The construction of current metrics, from household survey data, fails to recognise that inability to pay might deter access to necessary care, resulting in very low or zero health expenditures reported. We show that countries with similar measured incidence of catastrophic spending can exhibit significantly different pre-payment and coverage figures. In addition to suggesting complementary indicators, we discuss methodological alternatives for the development of broader catastrophic or impoverishing spending measures better suited to capture the consequences of financial barriers to access.
Interpretation Current metrics exhibit shortcomings that might result in misleading conclusions for policy making if used in isolation to assess financial protection levels. We present some indicators that complement these metrics, the use of which offers a more rounded assessment of financial barriers to access.
Published Online March 14, 2011
Institute of Global Health Innovation and Business School, Imperial College
London, London, UK (R Moreno-Serra, Prof P Smith)
Correspondence to: Rodrigo Moreno-Serra, Institute
of Global Health Innovation, Imperial College London, South
Kensington Campus, London SW7 1NA, UK
Abstracts
www.thelancet.com Published online March 14, 2011 Webappendix 83
Cardiovascular disease reduction as a Millennium Development Goal: decomposing life expectancy expected gains in the AmericasO J Mujica, A Barcelo, E Arriaga
AbstractBackground The Millennium Development Goals (MDGs) were established to provide both support and a roadmap for less developed countries to reverse the spread of poverty and disease by 2015. Health-related MDGs include reduction of under-5 and maternal mortality, and combating of HIV/AIDS, malaria, and other diseases. No mention is made of cardiovascular diseases (CVD) despite them being the leading cause of premature death in the world. We aimed to estimate the comparative impact in potential gains in life expectancy at birth by the attainment of a modest, feasible MDG-like goal of reduction of CVD mortality by 2015 in the Americas.
Methods We decomposed changes in life expectancy between 2000 and 2015 in 19 countries of the Americas, comprising 92% of the continental population, using Arriaga’s method. Sex-specific period life tables were built from the regional mortality database, after correction for incompleteness, applying health-related MDG targets by age groups. The CVD-related MDG was defined as a reduction by half of mortality rates due to hypertensive disease (ICD-10 codes I10–I13), ischaemic heart disease (I20–I25), pulmonary circulatory disease (I26–I51), and cerebrovascular disease (I60–I69) in men and women aged 30–69 years.
Findings Population-weighted mean of years of life expectancy to be gained by full attainment of the health-related MDGs was 1·08 years (0·98 years for women; 1·18 years for men) as compared with 1·90 years (1·66 and 2·13 years, respectively) when the CVD-related MDG is also attained. Gains are bigger in middle-income countries and in those with highest income inequality.
Interpretation A modest reduction of CVD mortality in adults (ie, of 4·5% per year) may have as large an impact in survival in the Americas as the one associated with the attainment of the three known health-related MDGs combined.
AcknowledgmentsWe are responsible for the views expressed in this Abstract, and they do not necessarily represent the decisions, policy, or views of the Pan American Health Organization, PAHO/WHO.
Published Online March 14, 2011
Pan American Health Organization, Washington, DC, USA (O J Mujica MD, A Barcelo MD, E Arriaga PhD)
Correspondence to: Oscar J Mujica, Pan American Health Organization, PAHO/WHO, Washington, DC 20037, USA [email protected]
Abstracts
84 www.thelancet.com Published online March 14, 2011 Webappendix
Causes of death as shown by hospital records in PakistanS Mursalin, Salman Cheema, Mubashar Junaid
AbstractBackground Information on the magnitude and pattern of mortality is essential for planning and evaluating health policies and programmes. However, like many other developing nations of the world, Pakistan lacks an established system for generating mortality data, and, if death is recorded, mostly ignores the cause. However, use of standard and reliable case definitions for labelling a cause of death is important to assess mortality patterns. Keeping in view its importance, the National Health Management Information System Cell designed a study to assess the mortality patterns identified in hospital records in Pakistan by using WHO’s criteria from the International Classification of Diseases, tenth revision (ICD-10).
Methods 23 major hospitals were selected from all over the country and data were collected through examining hospitals records. The data collection forms and guidelines were already circulated to all the hospitals in order to consolidate their mortality information according to ICD-10 classification. While extracting the mortality data, age, sex, and cause of death were taken into account.
Findings Analysis of the major causes of death shows that total deaths belonged to four major groups: cardiovascular diseases, other infections and parasitic infections, unintentional injuries, and respiratory infections. 56% of unintentional injuries were from road traffic accidents, which is often a neglected aspect in developing countries. In children, meningitis, measles, and tetanus were the leading causes of deaths. Among infants, pneumonia was the highest contributor followed by neonatal sepsis and septicaemia, low birthweight, and prematurity, and respiratory distress in neonates. These analyses give a very clear picture about which group and disease need to be targeted.
Interpretation Pakistan lacks an efficient health information system at the hospital level with a potential to provide basic evidence-based information on disease and mortality patterns. There is also need to establish the vital registration systems and to integrate these with the hospital-based registration system.
Published Online March 14, 2011
National HMIS/Surveillance Programme Ministry of Health,
Islamabad, Pakistan (S Mursalin MPH, S Cheema MPS,
M Junaid BCS)
Correspondence to: S Mursalin, National HMIS/
Surveillance Programme Ministry of Health, 10-D, West Shan Plaza,
Blue Area Islamabad 44000, Pakistan

Abstracts
www.thelancet.com Published online March 14, 2011 Webappendix 85
Safe pregnancy and delivery: a systematic analysis of trends in the coverage of antenatal and intrapartum careRebecca Myerson, Lisa Claire Rosenfeld, Stephen S Lim, Christopher J L Murray
AbstractBackground Increasing the coverage of antenatal and intrapartum care is central to improving child and maternal health. We estimated time trends in coverage of antenatal and intrapartum care and quantified the role of determinants of these trends for 136 developing countries from 1986 to 2008.
Methods We analysed data from more than 250 surveys to determine the coverage of one antenatal care visit from a skilled provider (ANC1), four antenatal care visits from a skilled provider (ANC4), skilled birth attendance (SBA), and in-facility delivery (IFD), and added to this reported estimates from surveys. We used validated statistical models to estimate time trends and track determinants of progress.
Findings Coverage of skilled ANC4 in developing countries was 35% (uncertainty interval 27–44) in 1986, 36% (30–44) in 1990, 44% (40–48) in 2000, and 51% (47–55) in 2008. ANC1 coverage was higher—almost 80%—and exhibited a slightly greater rate of increase. Coverage of SBA was 44% (37–51) in 1986, 45% (40–51) in 1990, 55% (52–57) in 2000, and 64% (62–66) in 2008. The trend in IFD was similar to SBA but at lower levels. Considerable disparities exist in terms of both the level and trend in antenatal and intrapartum care. More rapid progress has been made in Latin America and north Africa and Middle East than in south Asia; coverage has remained unchanged in eastern sub-Saharan Africa. HIV prevalence was associated with a significant negative effect on changes in coverage; development assistance for health was associated with a significant positive effect.
Interpretation Global progress on antenatal and intrapartum care coverage has been gradual, partly because of the HIV/AIDS epidemic. Accelerated progress is possible, however, and development assistance for health is a positive driver of changes in coverage.
Published Online March 14, 2011
Institute for Health Metrics and Evaluation, University of Washington, Seattle, WA, USA (R Myerson MPHc, L C Rosenfeld BA, S S Lim PhD, Prof C J L Murray DPhil)
Correspondence to: Rebecca Myerson, Institute for Health Metrics and Evaluation, University of Washington, Seattle, WA 98121, USA [email protected]
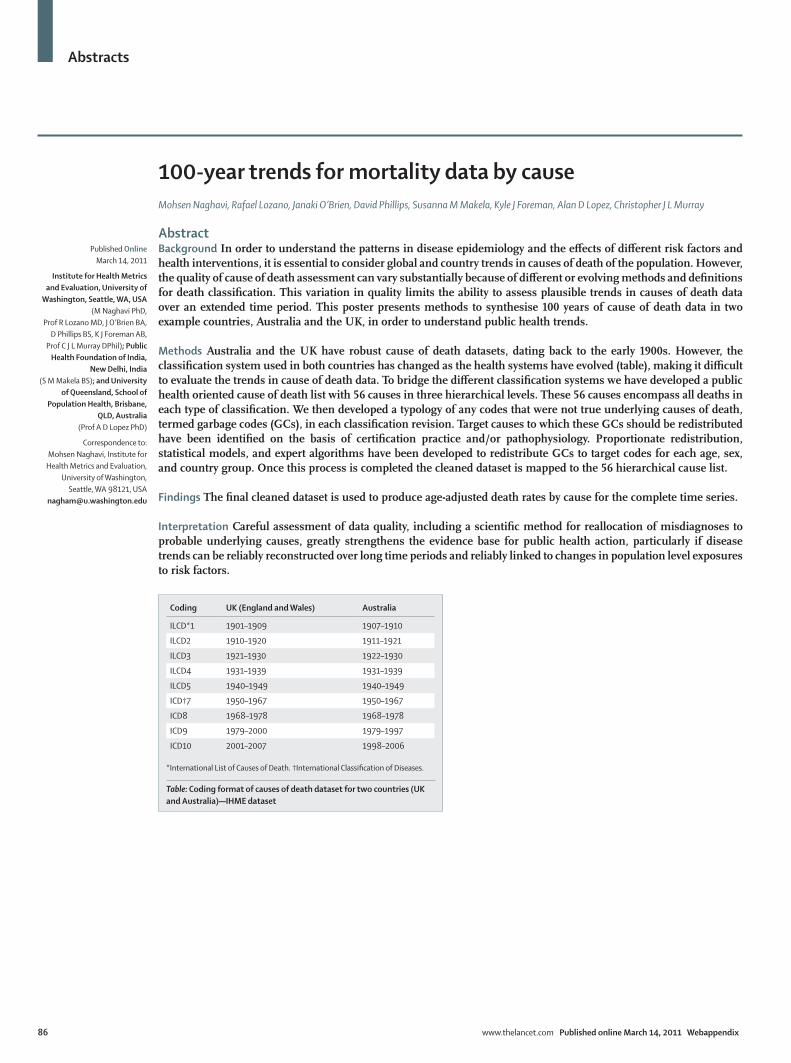
Abstracts
86 www.thelancet.com Published online March 14, 2011 Webappendix
100-year trends for mortality data by causeMohsen Naghavi, Rafael Lozano, Janaki O’Brien, David Phillips, Susanna M Makela, Kyle J Foreman, Alan D Lopez, Christopher J L Murray
AbstractBackground In order to understand the patterns in disease epidemiology and the effects of different risk factors and health interventions, it is essential to consider global and country trends in causes of death of the population. However, the quality of cause of death assessment can vary substantially because of different or evolving methods and definitions for death classification. This variation in quality limits the ability to assess plausible trends in causes of death data over an extended time period. This poster presents methods to synthesise 100 years of cause of death data in two example countries, Australia and the UK, in order to understand public health trends.
Methods Australia and the UK have robust cause of death datasets, dating back to the early 1900s. However, the classification system used in both countries has changed as the health systems have evolved (table), making it difficult to evaluate the trends in cause of death data. To bridge the different classification systems we have developed a public health oriented cause of death list with 56 causes in three hierarchical levels. These 56 causes encompass all deaths in each type of classification. We then developed a typology of any codes that were not true underlying causes of death, termed garbage codes (GCs), in each classification revision. Target causes to which these GCs should be redistributed have been identified on the basis of certification practice and/or pathophysiology. Proportionate redistribution, statistical models, and expert algorithms have been developed to redistribute GCs to target codes for each age, sex, and country group. Once this process is completed the cleaned dataset is mapped to the 56 hierarchical cause list.
Findings The final cleaned dataset is used to produce age-adjusted death rates by cause for the complete time series.
Interpretation Careful assessment of data quality, including a scientific method for reallocation of misdiagnoses to probable underlying causes, greatly strengthens the evidence base for public health action, particularly if disease trends can be reliably reconstructed over long time periods and reliably linked to changes in population level exposures to risk factors.
Published Online March 14, 2011
Institute for Health Metrics and Evaluation, University of
Washington, Seattle, WA, USA (M Naghavi PhD,
Prof R Lozano MD, J O’Brien BA, D Phillips BS, K J Foreman AB,
Prof C J L Murray DPhil); Public Health Foundation of India,
New Delhi, India (S M Makela BS); and University
of Queensland, School of Population Health, Brisbane,
QLD, Australia (Prof A D Lopez PhD)
Correspondence to: Mohsen Naghavi, Institute for
Health Metrics and Evaluation, University of Washington,
Seattle, WA 98121, USA [email protected]
Coding UK (England and Wales) Australia
ILCD*1 1901–1909 1907–1910
ILCD2 1910–1920 1911–1921
ILCD3 1921–1930 1922–1930
ILCD4 1931–1939 1931–1939
ILCD5 1940–1949 1940–1949
ICD†7 1950–1967 1950–1967
ICD8 1968–1978 1968–1978
ICD9 1979–2000 1979–1997
ICD10 2001–2007 1998–2006
*International List of Causes of Death. †International Classification of Diseases.
Table: Coding format of causes of death dataset for two countries (UK and Australia)—IHME dataset
Abstracts
www.thelancet.com Published online March 14, 2011 Webappendix 87
Evaluation of the population-level impact of HIV prevention interventions in IndiaMarie Ng, Emmanuela Gakidou, Alison K Levin-Rector, Ajay Khera, Christopher J L Murray, Lalit Dandona
AbstractBackground Established in 1992, the National AIDS Control Programme (NACP) aims to combat HIV in India. The majority of NACP budget has been allocated to prevention activities rather than treatment. The effort to tackle HIV through preventive measures was further reinforced by the launch of the India AIDS Initiative (Avahan) in 2003, sponsored by the Bill & Melinda Gates Foundation. The effectiveness of controlling HIV via prevention has long been a subject of debate. Few studies have provided substantive evidence on this issue. The objective of this study was to examine the impact of NACP and the Avahan initiative on population level HIV prevalence in India.
Methods We evaluated the population level impact of NACP and Avahan by examining the association between HIV prevalence trend and the intensity of intervention programmes between 2003 and 2008. Population prevalence was estimated on the basis of the national HIV sentinel surveillance data obtained annually at antenatal clinics. The intensity of interventions was estimated with the annual cumulative grants and services provided by both programmes at the district level. A mixed effects regression model was used to estimate the association between the intervention intensity and the population HIV prevalence trends, taking into account differences in the underlying epidemic trends across states.
Findings In general, the preventive efforts through NACP and Avahan appeared to be associated with a decline in HIV prevalence in the general population. Specifically, in the high HIV-burden states of Andhra Pradesh and Karnataka, higher intervention intensity was associated with significant decline in HIV prevalence between 2003 and 2008. This association was less pronounced in Maharashtra and Tamil Nadu states during this period.
Interpretation This study is the first to demonstrate a beneficial impact of a nationwide HIV prevention programme. The findings suggest that HIV prevention is effective in containment of the spread of HIV. It provides support for India’s strategy, which emphasises comprehensive prevention programmes for the control of HIV.
Published Online March 14, 2011
Institute for Health Metrics and Evaluation, University of Washington, Seattle, WA, USA (M Ng PhD, E Gakidou PhD, A K Levin-Rector BSPH, Prof C J L Murray DPhil, Prof L Dandona MD); Faculty of Education, The University of Hong Kong, Hong Kong (M Ng); Ministry of Health and Family Welfare, Government of India, New Delhi, India (A Khera MD); and Public Health Foundation of India, New Delhi, India (Prof L Dandona)
Correspondence to: Emmanuela Gakidou, Institute for Health Metrics and Evaluation, University of Washington, Seattle, WA 98121, USA [email protected]
Abstracts
88 www.thelancet.com Published online March 14, 2011 Webappendix
Does coinsurance rate reduction reach poor older people? Japan’s health insurance natural experimentAkihiro Nishi, Hideki Hashimoto, Haruko Noguchi, Nanako Tamiya
AbstractBackground Coinsurance rate for medical care under universal health insurance decreases from 30% to 10% at 70 years of age among the general population in Japan. Our aim was to determine the effect of the coinsurance rate reduction on health-related behaviours (smoking, cancer screening), access to health care (frequency of physician visit), amount of out-of-pocket expenditure, and overall health status, including mental health status, as a health insurance natural experiment.
Methods We used a national cross-sectional cluster sample in June, 2007. Overall health (best 20, worst 0) was measured by the sum of general health status, mobility, self-care and usual activities, pain, and mental health (transformed K6; best 4, worst 0 for each) based on prior principal component analysis. Among 10 751 individuals aged 60–79 years, we measured the effect of the treatment variable representing coinsurance rate reduction (0 if age <70 years; 1 if age ≥70 years) by use of sharp regression discontinuity design. Linear or logistic regression was used dependent on the nature of the outcomes.
Findings Although the coinsurance rate reduction did not change access to health care and health-related behaviours among the entire population, it increased health-care consumption. It did not induce a significant change in overall health (β=–0·02, p=0·811). However, the reduction improved mental health (β=0·05, p=0·011). The mental health effect was seen in those whose income was 50–100% of the median (β=0·10, p=0·010), but was not seen in people whose income was below 50% of the median (β=0·04, p=0·615). Several kinds of sensitivity analyses did not change the result.
Interpretation Coinsurance rate reduction for older people improved mental health status, especially among the second lowest socioeconomic status group.
Published Online March 14, 2011
Department of Society, Human Development, and Health,
Harvard School of Public Health, Boston, MA, USA
(A Nishi MPH); Department of Health Services Research,
Graduate School of Comprehensive Human
Sciences, University of Tsukuba, Ibaraki, Japan
(A Nishi, Prof N Tamiya PhD); Department of Public Health, Graduate School of Medicine,
The University of Tokyo, Tokyo, Japan (A Nishi); Institute for Quantitative Social Science, Harvard University, Boston,
MA, USA (A Nishi); Department of Health Economics and
Epidemiology Research, School of Public Health, The University
of Tokyo, Tokyo, Japan (Prof H Hashimoto MD); and
National Institute of Population and Social Security
Research, Tokyo, Japan (H Noguchi PhD)
Correspondence to: Akihiro Nishi, Department of
Society, Human Development, and Health, Harvard School of
Public Health, 677 Huntington Avenue, Boston, MA 02115, USA

Abstracts
www.thelancet.com Published online March 14, 2011 Webappendix 89
Prevalence of cardiovascular disease risk factors among young and middle-aged men in urban Mwanza, Tanzania Marina A Njelekela, Alfa Muhihi, Rose Mpembeni, Zablon Masesa, Kazuya Kitamori, Mari Mori Yamori, Norihiro Kato, Jacob Mtabaji, Yukio Yamori
AbstractBackground The burden of cardiovascular disease (CVD) risk factors has increased over the past two decades in most developing countries. This rise in CVD risk factors is associated with an increase in morbidity and mortality from this disease in these countries. However, few studies have reported prevalence of CVD risk factors among young adults in Africa. This health survey was conducted to assess the prevalence of CVD risk factors and explore their relationship with socioeconomic characteristics in a population of young and middle-aged men in the second largest and fast growing city of Mwanza, Tanzania.
Methods A descriptive cross-sectional epidemiological study was undertaken in an urban setting of Mwanza among men aged 20–50 years. Anthropometric and blood pressure measurements, dietary history, physical activity, blood samples, and 24-h urine (24U) were collected according to the basic protocol of the WHO cardiovascular disease and alimentary comparison (WHO-CARDIAC).
Findings The prevalence of hypertension, low HDL cholesterol, raised LDL cholesterol, obesity, hyper cholestero-laemia, and hypertriglyceridaemia were 23·7%, 10·3%, 9·3%, 4·1%, 4·1%, and 1·0%, respectively. Prevalence of metabolic syndrome was 3·1%. Age and education correlated positively with waist circumference (p<0·001) and waist-to-hip ratio (p<0·05). Education and income correlated positively with body-mass index, total cholesterol, and LDL cholesterol (all p=0·05). Age was the most important determinant of body-mass index (β=0·2, p=0·02), waist circumference (β=0·3, p=0·01), and waist-to-hip ratio (β=0·2, p=0·002), whereas education predicted serum LDL cholesterol (β=1·7, p=0·03).
Interpretation This urban population of young and middle-aged men has shown a low prevalence of CVD risk factors. The challenge is to maintain such a low profile of CVD risk factors in the absence of national guidelines for prevention of CVD and amid rapid urbanisation and nutrition transition that is taking place in urban areas including the city of Mwanza, Tanzania.
Published Online March 14, 2011
Department of Physiology (M A Njelekela PhD) and Department of Epidemiology and Biostatistics (R Mpembeni PhD), Muhimbili University of Health and Allied Sciences, Dar es Salaam, Tanzania; Harvard School of Public Health, Boston, MA, USA (A Muhihi MD); Department of Physiology, Weill Bugando University College of Health Sciences, Mwanza, Tanzania (Prof Z Masesa PhD, Prof J Mtabaji PhD); Department of Food and Nutritional Environment, Human Life and Environment, Kinjo Gakuin University, Nagoya, Japan (K Kitamori PhD); Institute for World Health Development, Mukogawa Women’s University, Nishinomiya, Japan (M M Yamori BSc, Prof Y Yamori); and Department of Gene Diagnostics and Therapeutic Research Institute, International Medical Centre of Japan, Tokyo, Japan (N Kato PhD)
Correspondence to: Alfa J Muhihi, Harvard School of Public Health, 677 Huntington Avenue, Mail Box 846, Kresge Bldg, Boston, MA 02115, USA [email protected]

Abstracts
90 www.thelancet.com Published online March 14, 2011 Webappendix
Socioeconomic status, urbanisation, and cardiometabolic risk factors among middle-aged adults in TanzaniaMarina A Njelekela, Enju Liu, Rose Mpembeni, Alfa Muhihi, Nurru L Mligiliche, Donna Spiegelman, Julia L Finkelstein, Wafaie W Fawzi, Walter C Willett, Jacob Mtabaji
AbstractBackground Changes in lifestyle associated with urbanisation and development have contributed to an emerging epidemic of cardiovascular disease in developing countries. However, there is limited evidence from urban African settings regarding the role of socioeconomic status and urbanisation in cardiovascular risk factors. We aimed to determine the associations between socioeconomic status, urbanisation, and cardiometabolic risk factors in middle-aged adults in Temeke District, Dar es Salaam, Tanzania.
Methods A cross-sectional analysis included 209 adults, aged 45–66 years, residing in five wards of Temeke districts in Tanzania. A structured questionnaire was used to evaluate socioeconomic status and behavioural characteristics, including income, education, occupation, residence (rural, urban, mixed), smoking, and dietary factors. Socioeconomic status was defined on the basis of the 75th percentile of the Filmer-Pritchett wealth index. A food frequency questionnaire was used to assess dietary intake. Physical activity was evaluated with the sub-Saharan Africa activity questionnaire. Blood samples were collected and analysed to measure lipid profile and fasting glucose levels. Cardiometabolic risk factors were defined with WHO criteria.
Findings Higher socioeconomic status was associated with decreased consumption of traditional staple foods and increased meat intake, and a 4 kg/m² higher body-mass index. Urban residents consumed significantly more meat products and less coconut milk than did residents from rural or mixed areas; fruit intake was increased in urban and mixed localities. Urban residence was associated with poorer lipid profile, compared with rural residence, including significantly higher total cholesterol, increased LDL cholesterol, and lower triglycerides. Higher socioeconomic status and urban residence were significantly associated with metabolic syndrome.
Interpretation The prevalence of cardiovascular risk factors was high in this population. Increased socioeconomic status was associated with a two-fold increase in the risk of obesity. Health promotion, primary prevention, and health screening strategies are needed to target obesity in urban areas in Tanzania.
Published Online March 14, 2011
Department of Physiology (M A Njelekela PhD,
A Muhihi MD) and Department of Epidemiology and
Biostatistics (R Mpembeni PhD), Muhimbili University of Health
and Allied Sciences, Dar es Salaam, Tanzania; Department
of Nutrition (E Liu PhD, J L Finkelstein MSc,
Prof W W Fawzi PhD, Prof W C Willett PhD),
Department of Epidemiology (Prof D Spiegelman PhD,
J L Finkelstein, Prof W W Fawzi, Prof W C Willett), Department
of Biostatistics (Prof D Spiegelman), and
Department of Global Health and Population
(Prof W W Fawzi), Harvard School of Public Health,
Boston, MA, USA; Department of Anatomy and Physiology,
Weill Cornell University, Doha, Qatar (N L Mligiliche PhD); and
Department of Physiology, Weill Bugando Medical
University, Mwanza, Tanzania (Prof J Mtabaji PhD)
Correspondence to: Marina A Njelekela, Muhimbili University of Health and Allied
Sciences, School of Medicine, Department of Physiology,
PO Box 65001, Dar es Salaam, Tanzania
Abstracts
www.thelancet.com Published online March 14, 2011 Webappendix 91
Challenges in estimation of the global disease burden of gynaecological disordersRosana Norman, Eva Curley, Yong Yi Lee, Katherine Jeffress, Theo Vos
AbstractBackground Previous burden of disease studies have been criticised for failing to provide a comprehensive picture of burden of disease among women by excluding some reproductive health conditions associated with high morbidity. For the first time, the Global Burden of Disease (GBD) 2005 study will include estimates for five gynaecological disorders: endometriosis, polycystic ovary syndrome, premenstrual syndrome, uterine fibroids, and genital prolapse. We aimed to develop reliable and internally consistent disease parameters for five gynaecological diseases in 21 world regions between 1990 and 2005, as part of the new GBD 2005 project.
Methods A systematic review of prevalence, incidence, remission, and mortality for the five gynaecological disorders was carried out with data collated with the new DisMod III tool. DisMod uses Bayesian estimation techniques to pool primary data and derive priors by imposing a common age pattern on disease parameters. We modelled the overall prevalence of each disorder and estimated the proportion of cases that experience disability. DisMod was also used to predict parameter estimates for data-poor regions from data-rich regions of the world with a set of country and study level covariates. Finally, DisMod generated posteriors—the most plausible and internally consistent epidemiological estimates for 21 world regions between 1990 and 2005.
Findings Epidemiological data for the five gynaecological conditions were sparse and the use of disparate case definitions was common. Additional challenges included the significant heterogeneity among study types and the proportion of cases that experienced disability. Despite uncertainty and data limitations, the results indicate that these disorders are highly prevalent and important contributors to the burden of disease.
Interpretation There is an urgent need to measure the prevalence and severity of gynaecological disorders in more detail. For the first time, the substantial contribution of these disorders to the overall disease burden has been estimated and will assist global priority setting.
Published Online March 14, 2011
University of Queensland, School of Population Health, Herston, QLD, Australia (R Norman PhD, E Curley BSc, Y Y Lee BHSci, K Jeffress MPH, Prof T Vos PhD)
Correspondence to: Eva Curley, University of Queensland, Centre for Burden of Disease and Cost Effectiveness, School of Population Health, Herston, QLD 4006, Australia [email protected]

Abstracts
92 www.thelancet.com Published online March 14, 2011 Webappendix
Highlighting discrepancies in site-level HIV care and treatment data collected at sites supported by the Elizabeth Glaser Paediatric AIDS Foundation (EGPAF) in Côte d’Ivoire, 2010M Ntumbanzondo, C B Diby, A Laurence, E Nawar, S Ramachandran, C Devore, N Hoffman, S Bose, G Kebede, J Seclen, S Ismail
AbstractBackground Because of the shortage of skilled data managers and partner-harmonised standard operating procedures at different levels of the data collection and reporting cascade, the site-level data being reported to the Elizabeth Glaser Paediatric AIDS Foundation in CÔte d’Ivoire (EGPAF-CdI) was of questionable quality. We aimed to conduct an internal data quality assessment highlighting discrepancies in reporting of key HIV care and treatment indicators.
Methods Between February and June, 2010, we performed a review of 26 sites altogether providing antiretroviral therapy (ART) to 75% of all ART clients served at EGPAF-CdI-supported sites. Indicators used were: current number of patients on HIV care, current number of patients on ART, and number of patients who did not receive ART during the last month of the reporting period for unknown reasons. Proxy data were used to report on the number of patients currently on care and the number of patients who did not receive ART for unknown reasons. With use of the available patient records and the drug management databases, we calculated the discrepancy between data previously reported to EGPAF and data audited during the data quality assessment. Discrepancies below 10% were deemed acceptable, discrepancies above 20% were rejected, and discrepancies between 10% and 20% were of moderate quality.
Findings Discrepancies for the total number of patients on care or on ART at all audited sites were 3·6% and 4·6%, respectively. When discrepancies were computed site-by-site, the average discrepancy went up to 13·6% and 12·9% for on care and on ART, respectively. The number of patients reported as not receiving ART for unknown reasons was inflated by more than 100%. In general, the aggregate data reported to EGPAF were of acceptable quality but there was a clear need for site-specific interventions.
Interpretation A site-level approach to monitoring and evaluation capacity building, which includes harmonisation of indicator definitions across partners and standard operating procedures on calculation of indicators, is crucial to ensure good data quality.
Published Online March 14, 2011
Elizabeth Glaser Paediatric AIDS Foundation, Washington, DC,
USA (M Ntumbanzondo MD, E Nawar MHS,
S Ramachandran MPH, C Devore BA, N Hoffman MPH,
S Bose MPH, G Kebede MSc, J Seclen MD, S Ismail MD); and
Elizabeth Glaser Paediatric AIDS Foundation, Abidjan, CÔte
d’Ivoire (C B Diby MD, A Laurence MD)
Correspondence to: Eric Nawar, Elizabeth Glaser Pediatric AIDS Foundation,
Washington, DC 20036, USA [email protected]
Abstracts
www.thelancet.com Published online March 14, 2011 Webappendix 93
High impact research: building of data ownership and improvement of data use Tara Nutley, Theresa Hoke, Scott Moreland
AbstractBackground In countries grappling with limited financial resources and an insufficient skilled workforce, programmatic and policy decisions need to be based on sound evidence to ensure the highest possible return on investments in health. Despite this need, there is an underuse of data in decision making. MEASURE Evaluation developed a framework, tools, and guidance to help researchers to enhance the impact of their work on health programmes by building local ownership of data. An early version of the framework was applied in 2007 in a study conducted in Madagascar that tested the safety, feasibility, and acceptability of lay-health workers to provide injectable contraceptives (DMPA) and resulted in the scale-up of the programme to additional districts in Madagascar. The aim of this study was to describe the elements of the framework, how it was applied in the Madagascar study, and how it facilitated the use of study results.
Methods The conceptual framework highlights a continuum linking the programme and policy processes to the research process. Specific tools and guidance complement the framework and assist the researcher to improve the use of study results. The tools and guidance address: involvement of decision makers in the research process; identification of research topics relevant to programmes or policies; extraction of programme or policy recommendations from research findings; and packaging and communication of research results to facilitate their use in decision making.
Findings The study found that all workers provided DMPA according to set safety standards; that lay provision of DMPA was acceptable to workers, their clinical supervisors, and clients; and that the provision of the new service attracted 41% new family planning users. The data were used by the Ministry of Health to scale up the programme from 13 to 27 districts.
Interpretation The conceptual framework improves the uptake of positive study results by identifying linkages between the research process and the programme or policy process before, during, and after study implementation.
Published Online March 14, 2011
MEASURE Evaluation, University of North Carolina, Chapel Hill, NC, USA (T Nutley MPH, S Moreland PhD); and FHI, Durham, NC, USA (T Hoke PhD)
Correspondence to: Tara Nutley, MEASURE Evaluation, University of North Carolina at Chapel Hill, 308 West Rosemary Street, Suite 203, Chapel Hill, NC 27516, USA [email protected]
Abstracts
94 www.thelancet.com Published online March 14, 2011 Webappendix
10 years after Roll Back Malaria: unattained targets in Benin City, NigeriaAkoria Obehi, Holmes Talmage
AbstractBackground Nigeria contributes the most to the burden of malaria worldwide and loses over US$800 million annually on account of malaria. By Roll Back Malaria (RBM) targets, 60% of people with malaria should access and use artemisinin-based combination therapy (ACT) within 24 h of fever onset; 60% of pregnant women and children younger than 5 years should sleep under insecticide-treated nets (ITNs) by 2005. ITN distribution, adoption of ACT for the treatment of uncomplicated malaria, plus a scale-up programme (2006–10) to achieve targets are some of the steps taken by government since RBM was launched in 2000.
Methods This study was designed to describe malaria prevention and treatment practices in households, for children younger than 5 years and pregnant women in Benin City, Nigeria, and to assess achievements of five RBM indicators: proportion of children younger than 5 years with fever or malaria receiving ACTs within 24 h of fever onset, proportions of children younger than 5 years sleeping under mosquito nets and under ITNs, and proportions of pregnant women sleeping under mosquito nets and ITNs in the previous night. Households were selected from each of the three local government areas in Benin City by multistage sampling. Consenting adults were interviewed by a physician-researcher from December, 2009, to May, 2010.
Findings 30 pregnant women and 174 children younger than 5 years were recruited consecutively from 232 households. Only 5·6% of children younger than 5 years got ACTs within 24 h of fever onset; six (3·4%) slept under untreated nets and five (2·8%) under ITNs; one pregnant woman (3·3%) slept under an ITN. ACT use was six times greater in households with people in managerial/professional categories (odds ratio 5·526, 95% CI 1·470–20·758). Fathers’ tertiary or higher education predicted non-use of ACTs in households (0·054, 0·006–0·510) and in children younger than 5 years (0·052, 0·006–0·478).
Interpretation Scores on the indicators assessed ranged between 2·8% and 5·6%, which is much less than the targeted 60%. Socioeconomic determinants of use of malaria preventive and treatment interventions should be addressed for greater public health impact.
Published Online March 14, 2011
University of Benin and University of Benin Teaching Hospital, Benin City, Nigeria (A Obehi MPH); University of
Liverpool, Liverpool, UK (A Obehi, H Talmage PhD); and
University of Arkansas, Fayetteville, AR, USA
(H Talmage)
Correspondence to: Akoria Obehi, No 31, Ihama
Road, P O Box 5212, Benin City, Nigeria

Abstracts
www.thelancet.com Published online March 14, 2011 Webappendix 95
Costing of free maternal health services under the National Health Insurance Scheme in Ghana: challenges and implications for sustainability in GhanaEmmanuel Ankrah Odame, Patricia Akweongo
AbstractBackground Reducing the maternal mortality rate of 451 per 100 000 livebirths in Ghana to meet the target for Millennium Development Goal (MDG) 5 by 2015 remains challenging. Several factors including the lack of financial access pose a challenge. A free maternal health policy was therefore launched in 2008, with a grant from the British Government to improve financial access to maternal services. The main objective of this study was therefore to examine the cost of the free maternal health services to the southern part of Ghana and to explore factors that contribute to these costs.
Methods Available routine financial claim records for 2009 were used to compile the cost information for the various maternal services with a compilation sheet for the three national insurance scheme accredited facilities and the scheme office in the area. The financial cost of antenatal, postnatal, delivery, abortion, and the overall costs of all the maternal health services were obtained by facility type for both services and drugs.
Findings Among other findings, we found that the financial cost of antenatal care was GH¢289 094·96 (US$199 375·83), postnatal care was GH¢159 913·34 (US$110 285·06), and spontaneous vaginal delivery was GH¢205 452·58 (US$141 691·44). GH¢1358 647·98 (US$936 998·61) was spent in 2009, which represented 7·7% of expenditure of the British grant.
Interpretation This study showed that the unit costs of maternity services were consistently higher at hospitals (level D) than at lower level health facilities (levels B and C). The lower health facilities were underused. Cost savings can be made if services such as antenatal care and normal deliveries, which form the bulk of maternal health services, are done with the levels B and C facilities, for free maternal health services to be sustained.
Published Online March 14, 2011
School Of Public Health, University Of Ghana, Legon, Ghana (E A Odame MPH, P Akweongo PhD)
Correspondence to: Emmanuel Ankrah Odame, University of Ghana, School of Public Health, PO Box LG 73, Legon, Accra, Ghana [email protected]

Abstracts
96 www.thelancet.com Published online March 14, 2011 Webappendix
Highland malaria outbreak in Homeyo District, Papua Province, Indonesia: an entomological investigationAntonius Oktavian, Hanna Kawulur, Mirna Widiyanti, Mardi Raharjo, Damar Triboewono
AbstractBackground The first highland malaria outbreak and associated deaths were reported in May, 2010, from several villages in Homeyo District, Papua Province. Homeyo is located more than 1900 m above sea level with air temperatures of 15–250°C—an uncommon condition for mosquitoes to breed. The epidemiological and parasitological survey in June, 2010, conducted by the Papua Health Department found that Plasmodium falciparum rates (PFR) in Bamba, Sanepa, Pogapa, and Degesiga villages were 44·23%, 6·73%, 20·27%, and 7·40%, respectively. On the basis of verbal autopsy, the team found 36 deaths suspected to be due to malaria. The entomological survey was intended to identify the species and breeding habitat of suspected mosquito vectors, and the distribution of the highland malaria cases related to the village location and human behaviour.
Methods The survey was done from Aug 30 to Sept 3, 2010. We collected larva and adult stage mosquitoes from the breeding habitat, malaria case mapping with global positioning system based on the location of case’s houses, environmental observation, short interview, and blood test with rapid diagnostic test.
Findings Although neither larva nor adult stage of Anopheles spp were caught because of the heavy rain and limited time of survey, we found that the opening of new land programme was likely to play an important role in creating a new mosquito breeding site, including many new ponds with no fish and ground pools with ideal temperature, salinity, and pH. Further, the indigenous Papuan live in traditional wooden houses (called Honai), without windows and light, and only a fireplace at night. The cases’ houses were located close to the breeding habitat and within a flight range of Anopheles.
Interpretation A more systematic and sustainable health education programme is needed to raise public health awareness. The use of longlasting insecticide nets is the best choice for this area.
Published Online March 14, 2011
National Institute of Health Research and Development for
Biomedicine, Papua Province, Indonesia (A Oktavian MD,
H Kawulur MSc, M Widiyanti BSc, M Raharjo DiplEnvHlth); and Research and Development
Centre for Vector and Disease Reservoirs, Salatiga, Indonesia
(D Triboewono PhD)
Correspondence to: Antonius Oktavian, National
Institute of Health Research and Development for Biomedicine,
jl.Kesehatan no.10. Dok 2 Jayapura 99112, Papua Province,
Indonesia [email protected]
Abstracts
www.thelancet.com Published online March 14, 2011 Webappendix 97
Geographical information systems in selection of states to participate in a long-term transformative programme to build leadership and accountability in Nigeria’s health sector Anddy Omoluabi, Osondu Ogbuoji, Chioma Ogbozor
AbstractBackground With competing interests and priorities by funding agencies and the need for quick wins, the selection of project states continues to be subjective in Nigeria. To address this issue, Management Sciences for Health (MSH) recently applied a geographical information system (GIS) to objectively and transparently select states for the implementation of a long-term transformative programme to build leadership and accountability in Nigeria’s health sector. The aim of our study was to provide an objective and transparent basis for the selection of two of 36 possible states and the Federal Capital Territory, and to communicate the outcome to relevant stakeholders.
Methods Relevant stakeholders including the project funder were consulted and agreed to demographic parameters including: high State HIV/AIDS prevalence, minimum presence of other donor-funded HIV/AIDS programmes, reasonable security alert levels, accessibility to other MSH offices, and presence of graduates of the MSH Fellowship Programme. With secondary demographic data, a one-to-many relationship was established between these attribute data and a state-level shapefile with the use of Manifold professional edition build 8.0.16. A layer of the state-level map was created for each parameter, and a series of select queries with agreed upon values were ran on the appropriate fields in the attribute data. The resultant maps were layered onto one and varying transparency levels were set to allow for visualisation across all the layers.
Findings The rationale, transparency, graphical results, and objectivity of the process facilitated the acceptance of and buy-in to the choice of the Federal Capital Territory and Gombe States by the donor agency and other stakeholders.
Interpretation GIS as a decision support system can help to objectively select states by managing and analysing multiple selection parameters and promote buy-in by relevant stakeholders.
Published Online March 14, 2011
Management Sciences for Health, Abuja, Nigeria (A Omoluabi MSc, O Ogbuoji MPh, C Ogbozor MSc)
Correspondence to: Anddy Omoluabi, Management Sciences for Health, Block B, Plot 564/565 Independence Avenue, Central Area, Abuja, Nigeria [email protected]

Abstracts
98 www.thelancet.com Published online March 14, 2011 Webappendix
Socioeconomic disadvantage and tuberculosis incidence in Washington StateEyal Oren
AbstractBackground Traditional individual-level studies and ecological studies are unable to simultaneously examine the role of individual-level and group-level factors in the risk of disease. Few studies have used a multilevel approach to assess the role of area-based socioeconomic status on tuberculosis incidence. This analysis examined neighbourhood-level influences on tuberculosis incidence in a multilevel population-based sample as well as the modifying effect of living in an urban area.
Methods All incident tuberculosis cases in Washington State (n=2161) reported between Jan 1, 2000, and Dec 31, 2008, were identified with a retrospective cohort design. Multivariate Poisson analysis was used at the zip-code tabulation area (ZCTA) level, which allowed for further exploration of area-specific influences on tuberculosis incidence.
Findings A significant association was found between indices of socioeconomic position and tuberculosis incidence in Washington State, with a clear gradient of higher rates observed among lower ZCTA socioeconomic quartiles (incidence rate ratio of lowest to highest socioeconomic position index quartile: 2·17, 95% CI 1·93–2·45; p for trend <0·001). In multivariate analyses, addition of individual-level and area-level covariates significantly attenuated this association, although statistical significance was preserved. No interaction between level of urbanness and socioeconomic status was observed for any of the socioeconomic position quartiles.
Interpretation This study found significant socioeconomic differences in the risk of tuberculosis incidence across ZCTAs in Washington even after adjustment for individual age and sex and area-based race, ethnicity, origin, and level of urbanness. The results emphasise the importance of neighbourhood context and the need to target prevention efforts to low-socioeconomic status neighbourhoods regardless of urban or rural status.
Published Online March 14, 2011
Department of Epidemiology, University of Washington,
Seattle, WA, USA (E Oren PhD)
Correspondence to: Eyal Oren, Tuberculosis Control
Program, 325 Ninth Avenue, HMC Box 359776,
Seattle, WA 98104-2420, USA [email protected]
Abstracts
www.thelancet.com Published online March 14, 2011 Webappendix 99
Measuring health information system (HIS) progress: development of tools to enable country-led evaluationLiz Peloso, Mona Patel
AbstractBackground Addressing global and regional inequities in health is a complex issue. This issue is made even more complex by the frustrating lack of accurate data on which to both base decisions and to evaluate the impact of interventions. Continued focus only on service delivery—although very important—without the corresponding metrics will not provide the necessary foundation and evidence on which to build future health-care policy. Systems (which do not necessarily mean electronic systems) have to be in place to determine and evaluate the outcomes of decisions. However, evidence-based decision making can only occur with the availability of consistent, reliable data collection, analysis, and monitoring.
Discussion The presentation will discuss collaboration with multiple international partners to develop a tool to measure the progress countries are making towards their health information systems (HIS) goals. In the process of this development, we reviewed similar tools developed and in production to date. We examined and incorporated the use and intersections of current frameworks, as well as the complexities of integrating a maturity model that can be applied subjectively across multiple countries and multiple domain areas. The presentation will outline the approach to development of a new generation HIS measurement tool, share some of the interesting lessons learned, and discuss practical steps countries can initiate to evaluate and improve their own progress with managing and using information. We will highlight the benefits and challenges of collaborating with multiple stakeholders to harmonise indicators and collect data that are meaningful at the country level. The collaborative learning and broad input involved to date provides an opportunity to learn from the approach. Focusing on data that are relevant and used at the country level will help to improve stakeholders’ ability to make good decisions, foster a sense of accountability across various stakeholders, and deepen competence within the health system.
Published Online March 14, 2011
Jembi Health Systems, Guelph, ON, Canada (L Peloso MSc); and National Health Practice, Deloitte Consulting Canada, Toronto, ON, Canada (M Patel MHA)
Correspondence to: Liz Peloso, Jembi Health Systems, 25 Parkview Crescent, Guelph, ON N1H7S5, Canada [email protected]
Abstracts
100 www.thelancet.com Published online March 14, 2011 Webappendix
Overweight in relation to undernutrition for children younger than 5 years: a country level updateAmanda Pomeroy, Soumya Alva, Loren Bausell
AbstractBackground In 2000, de Onis and Blossner documented trends in overweight among preschool children globally, and discussed a shift towards overnutrition and away from undernutrition in many developing countries. This global perspective provided an opportunity to see the percentage of children who were overweight in relation to the pecentage in developed countries, where adult obesity is a known public health issue. 10 years later, what has happened to the percentage of overweight in relation to undernutrition among children younger than 5 years?
Methods Using the new WHO standards, we will document nutrition data from the latest demographic and health surveys available for about 35 countries from four regions, as well as nutrition data for a selection of developed countries. We will extend the analysis to examine where there is overlap in overweight and stunting, to illuminate the complications associated with controlling obesity in transitioning environments.
Findings Latest data suggest that, even in sub-Saharan Africa, several countries are seeing the rate of children who are overweight outstrip those who are wasted. There is also evidence of compound burdens of stunting and being overweight within the same child; in some cases such as in Benin and Malawi, about three-quarters of those who are overweight are also stunted.
Interpretation As noted in the recent 2010 series in The Lancet on chronic disease, continued increases in the percentage of children who are overweight could lead to unsupportable cost burdens on burgeoning health systems because of non-communicable diseases related to adult overweight and obesity. Current behaviour change research suggests that prevention interventions among young people are the most effective way to interrupt the upward trend towards being overweight or obese in adulthood. Therefore, increased monitoring and surveillance of weight among children younger than 5 years is critical for targeting a public health response to the rise in non-communicable diseases related to obesity and being overweight.
Published Online March 14, 2011
John Snow Inc, Arlington, VA, USA (A Pomeroy MS); and AIM
Activity, Rockville, MD, USA (S Alva PhD, L Bausell MPH)
Correspondence to: Amanda Pomeroy, John Snow
Inc, 1616 Fort Myer Drive, 11th Floor, Arlington, VA 22209,
Abstracts
www.thelancet.com Published online March 14, 2011 Webappendix 101
Evaluation of health systems performance and estimation of health-care inequality among US counties: a novel approach for priority setting by proxy metrics and decision treesLoganathan Ponnambalam, Lakshminarayanan Samavedham, Hao Ran Lee
AbstractBackground An important challenge for policy makers is to understand what affects population health and to quantify health-care inequality that prevails among counties. Small area estimates and novel data-based decision-making algorithms provide an excellent platform to address this challenge. This evaluation used county-level mortality data during infectious disease outbreaks to study its association with socioeconomic status using classification and regression trees and to obtain a proxy metric to estimate health-care inequality among US counties.
Methods An application of our approach is illustrated by H1N1 data collected from state health websites. Counties that reported both cases and deaths, 108 in total, were divided into four classes based on 50th percentile of cases per 1000 and deaths per 1000. A classification tree was built with classes as target variables and socioeconomic indicators (from US census) as predictors. This classification tree was then used to predict the classes for all other counties.
Findings Classification accuracy was 82%. Relative importance of population density, per capita personal income, and educational attainment (bachelor’s degree or higher) were 100%, 36%, and 13%, respectively. Counties with a population density greater than 77∙05 and income higher than US$30 605 reported higher cases and lower deaths. Counties with a population density lower than 46∙6 reported higher cases and higher deaths. A geographical cluster with all the counties of Massachusetts, Connecticut, Rhode Island, and New Jersey reported higher cases and lower deaths. Among the geographical cluster with counties of Wyoming, Montana, North Dakota, South Dakota, Nebraska, and Kansas, more than 87% reported higher cases as well as higher deaths. A byproduct of our work includes a choropleth map with classes superimposed on each county.
Interpretation The classification rule, a proxy metric, can offer guidance in locating the peer counties or states, better and worst performing clusters, and selecting the priority population. These findings can be used to improve state or county policies to address health-care inequality and set priorities to channel the resources efficiently.
Published Online March 14, 2011
Department of Chemical and Biomolecular Engineering, National University of Singapore, Singapore (L Ponnambalam, L Samavedham PhD, H R Lee)
Correspondence to: Lakshminarayanan Samavedham, Department of Chemical and Biomolecular Engineering, E4-06-05 Block E4, 4 Engineering Drive 3, National University of Singapore, Singapore 117576 [email protected]

Abstracts
102 www.thelancet.com Published online March 14, 2011 Webappendix
The REACH calculator: an innovative tool for planning and monitoring of family planning programmesFrancisco Pozo-Martin, Miguel Romero-Durana, Kristen Hopkins, Tania Boler
AbstractBackground Many family planning providers wish to move beyond counting annual services delivered, to estimate their contribution towards meeting the contraceptive needs of a particular population. There is currently no tool available to facilitate this. We aimed to build an interactive tool for estimating and monitoring the current and future contribution of family planning programmes to the family planning needs of national and local populations.
Methods An Excel-based mathematical model was developed and populated with the most recent evidence-based data to estimate the following variables for 40 countries, for each year from 2005 to 2010. (1) Total women of reproductive age protected against unwanted pregnancy by any modern, traditional, or folk method of contraception, and the total women with unmet need for contraception. (2) Total women currently using a modern method of contraception provided by Marie Stopes International (MSI), including cumulative longer-acting method clients. (3) The percentage contribution of MSI to a population’s need for contraception services. (4) The number of clients who would need to be reached in the future to attain a target contraceptive prevalence rate in any specified population. (5) Numbers 1–4 repeated for national safe and unsafe abortion users compared with MSI’s safe abortion clients. A Visual Basic interface was designed and programmed to allow for easy use of the model.
Findings The REACH calculator is now used by MSI national managers to: (1) assess progress towards meeting total contraception and safe abortion needs; and (2) plan and seek funding for future service expansion to properly meet these population needs.
Interpretation The REACH calculator is user friendly and can be easily adopted as a management tool by any reproductive health organisation.
AcknowledgmentsThis publication was funded by the UK charity Marie Stopes International (MSI), with support from the American People through the United States Agency for International Development (USAID) and non-earmarked funds from the Netherlands Ministry of Foreign Affairs, William and Flora Hewlett Foundation, and other US-based foundations. The contents are the responsibility of MSI and do not necessary reflect the views of USAID or the United States Government.
Published Online March 14, 2011
London School of Hygiene and Tropical Medicine, London, UK (F Pozo-Martin MSc); Barcelona
Supercomputing Centre, Barcelona, Spain
(M Romero-Durana MSc); and Marie Stopes International, London, UK (K Hopkins MSc,
T Boler PhD)
Correspondence to: Francisco Pozo-Martin, London School of Hygiene and Tropical
Medicine, London WC1E 7HT, UK francisco.pozo-martin@lshtm.
ac.uk

Abstracts
www.thelancet.com Published online March 14, 2011 Webappendix 103
WHO’s Urban Health Equity Assessment and Response ToolA Prasad, M Kano, J Kumaresan
AbstractBackground The WHO Centre for Health Development (WKC) served as the hub for the Knowledge Network on Urban Settings, which supported the work of the WHO Commission on Social Determinants of Health. Since then, WKC has been intensifying its efforts to equip urban policy makers with the evidence and tools necessary to improve health equity. We aimed to develop a new quantitative tool to identify health equity problems and set priorities to address them.
Methods The Urban Health Equity Assessment and Response Tool (Urban HEART) consists of two main modules: health equity assessment and response prioritisation. It provides a method for assessment of health equity using both health outcomes and health determinants indicators, including a set of 12 core indicators, which can be applied to either intracity or intercity analysis. Second, it provides guidance on presenting the assessment results to policy makers and other stakeholders, and using them for prioritising problems and interventions. Urban HEART was pilot tested in 17 municipalities in ten countries: Brazil, Indonesia, Iran, Kenya, Malaysia, Mexico, Mongolia, the Philippines, Sri Lanka, and Vietnam. The pilot study and expertise of an ad-hoc advisory group helped to strengthen the scientific validity and practical utility of the tool.
Results Urban HEART was published in 2010. Standardised training workshops have been conducted to facilitate the uptake of Urban HEART globally. Some cities and countries are institutionalising the use of Urban HEART. The pilot study results and growing interest in Urban HEART are promising signs of its wider application and its potential for making health equity assessment and response a routine practice for city governments.
Interpretation A new tool is available from WHO that responds to the needs of local and national policy makers who want to systematically use broad-based evidence to identify health inequities and prioritise actions for tackling them. Further research is necessary to evaluate and improve the effectiveness of the tool.
Published Online March 14, 2011
WHO Centre for Health Development, Kobe, Japan (A Prasad MPA, M Kano DrPH, J Kumaresan MD)
Correspondence to: Megumi Kano, WHO Centre for Health Development, IHD Centre Building 9F, 1-5-1 Wakinohama-Kaigandori, Chuo-ku, Kobe 651-0073, Japan [email protected]
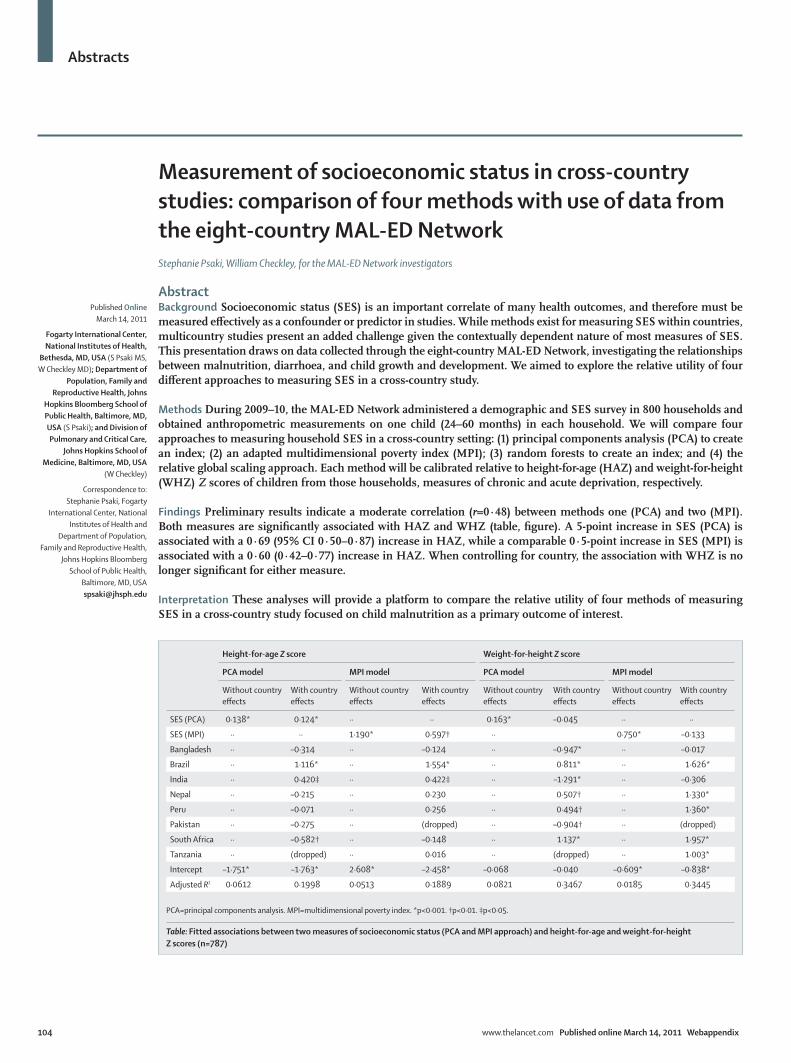
Abstracts
104 www.thelancet.com Published online March 14, 2011 Webappendix
Measurement of socioeconomic status in cross-country studies: comparison of four methods with use of data from the eight-country MAL-ED NetworkStephanie Psaki, William Checkley, for the MAL-ED Network investigators
AbstractBackground Socioeconomic status (SES) is an important correlate of many health outcomes, and therefore must be measured effectively as a confounder or predictor in studies. While methods exist for measuring SES within countries, multicountry studies present an added challenge given the contextually dependent nature of most measures of SES. This presentation draws on data collected through the eight-country MAL-ED Network, investigating the relationships between malnutrition, diarrhoea, and child growth and development. We aimed to explore the relative utility of four different approaches to measuring SES in a cross-country study.
Methods During 2009–10, the MAL-ED Network administered a demographic and SES survey in 800 households and obtained anthropometric measurements on one child (24–60 months) in each household. We will compare four approaches to measuring household SES in a cross-country setting: (1) principal components analysis (PCA) to create an index; (2) an adapted multidimensional poverty index (MPI); (3) random forests to create an index; and (4) the relative global scaling approach. Each method will be calibrated relative to height-for-age (HAZ) and weight-for-height (WHZ) Z scores of children from those households, measures of chronic and acute deprivation, respectively.
Findings Preliminary results indicate a moderate correlation (r=0·48) between methods one (PCA) and two (MPI). Both measures are significantly associated with HAZ and WHZ (table, figure). A 5-point increase in SES (PCA) is associated with a 0·69 (95% CI 0·50–0·87) increase in HAZ, while a comparable 0·5-point increase in SES (MPI) is associated with a 0·60 (0·42–0·77) increase in HAZ. When controlling for country, the association with WHZ is no longer significant for either measure.
Interpretation These analyses will provide a platform to compare the relative utility of four methods of measuring SES in a cross-country study focused on child malnutrition as a primary outcome of interest.
Published Online March 14, 2011
Fogarty International Center, National Institutes of Health,
Bethesda, MD, USA (S Psaki MS, W Checkley MD); Department of
Population, Family and Reproductive Health, Johns
Hopkins Bloomberg School of Public Health, Baltimore, MD, USA (S Psaki); and Division of Pulmonary and Critical Care,
Johns Hopkins School of Medicine, Baltimore, MD, USA
(W Checkley)
Correspondence to: Stephanie Psaki, Fogarty
International Center, National Institutes of Health and
Department of Population, Family and Reproductive Health,
Johns Hopkins Bloomberg School of Public Health,
Baltimore, MD, USA [email protected]
Height-for-age Z score Weight-for-height Z score
PCA model MPI model PCA model MPI model
Without country effects
With country effects
Without country effects
With country effects
Without country effects
With country effects
Without country effects
With country effects
SES (PCA) 0·138* 0·124* ·· ·· 0·163* –0·045 ·· ··
SES (MPI) ·· ·· 1·190* 0·597† ·· 0·750* –0·133
Bangladesh ·· –0·314 ·· –0·124 ·· –0·947* ·· –0·017
Brazil ·· 1·116* ·· 1·554* ·· 0·811* ·· 1·626*
India ·· 0·420‡ ·· 0·422‡ ·· –1·291* ·· –0·306
Nepal ·· –0·215 ·· 0·230 ·· 0·507† ·· 1·330*
Peru ·· –0·071 ·· 0·256 ·· 0·494† ·· 1·360*
Pakistan ·· –0·275 ·· (dropped) ·· –0·904† ·· (dropped)
South Africa ·· –0·582† ·· –0·148 ·· 1·137* ·· 1·957*
Tanzania ·· (dropped) ·· 0·016 ·· (dropped) ·· 1·003*
Intercept –1·751* –1·763* 2·608* –2·458* –0·068 –0·040 –0·609* –0·838*
Adjusted R2 0·0612 0·1998 0·0513 0·1889 0·0821 0·3467 0·0185 0·3445
PCA=principal components analysis. MPI=multidimensional poverty index. *p<0·001. †p<0·01. ‡p<0·05.
Table: Fitted associations between two measures of socioeconomic status (PCA and MPI approach) and height-for-age and weight-for-height Z scores (n=787)

Abstracts
www.thelancet.com Published online March 14, 2011 Webappendix 105
00·
20·
40·
60·
81
SES
(MPI
Mea
sure
)
−6 −4 −2 0 2 4
Height-for-age Z score (HAZ)
−5−4
−3−2
−10
12
34
5SE
S (P
CA M
easu
re)
−6 −4 −2 0 2 4
Height-for-age Z score (HAZ)
−5−4
−3−2
−10
12
34
5SE
S (P
CA M
easu
re)
−4 −2 0 2 4
Weight-for-height Z score (WHZ)
00·
20·
40·
60·
81
SES
(MPI
Mea
sure
)−4 −2 0 2 4
Weight-for-height Z score (WHZ)
Figure: Fitted associations between each measure of socioeconomic status (PCA and MPI approaches) and height-for-age Z score and weight-for-height Z score (n=787)PCA=principal components analysis. MPI=multidimensional poverty index.
Abstracts
106 www.thelancet.com Published online March 14, 2011 Webappendix
The road towards better vital registration systems: under-registration of death counts and ill-defined causes of death in BrazilBernardo L Queiroz, Everton E C Lima
Abstract Background In developing countries, mortality estimates and knowledge of levels and trends of adult mortality are limited by the quality of data. The most common problems faced in these countries are incomplete coverage of vital registration systems and errors in age declaration for both population and death counts. In recent years, collection of data for death counts has improved. However, this improvement comes with an increase in the number of deaths by ill-defined causes, which affects the elaboration of proper health policies and limits the action of government agencies in improving the quality of life of the population, especially in the context of an ageing population. In this context, we aim to study the spatial pattern of ill-defined deaths causes and death coverage (under-registration) in Brazil over the past three decades.
Methods We use spatial statistics analysis combined with traditional demographic methods to analyse the problem. More specifically, we search for spatial correlations measures, which can be easily applied to identify spatial clusters of ill-defined death counts. We make extensive use of the Brazilian Ministry of Health database and population censuses. We analyse the evolution of ill-defined death counts and mortality under-registration for 558 comparable small areas. We use Kulldorff and Nagarwalla’s (1995) method, which considers the rates and geographical coordinates information linked to these rates.
Findings Our results indicate that, over the past few years, the risks of ill-defined causes of death have spread homogeneously across the country, whereas there are clear clusters of under-registration of death counts in the poorest northern and northeastern parts of the country. We speculate that the cause of these findings is that under-registration of deaths counts is being replaced by ill-defined deaths, and due to population ageing in more developed parts of the country where deaths among the older population are commonly classified as ill-defined. That is, although there was an improvement in collection of the data, the change in age profile of mortality has affected the quality of data collection.
Interpretation In general, our results indicate that better covergae of death counts is not associated with improvements in data quality.
Published Online March 14, 2011
Department of Demography, CEDEPLAR-UFMG, Belo
Horizonte, Minas Gerais, Brazil (B L Queiroz PhD, E E C Lima PhD)
Correspondence to: Bernardo L Queiroz,
Departamento de Demografia, Cedeplar-UFMG, Av. Antônio Carlos, 6627, Belo Horizonte,
Minas Gerais, Brazil 31270-901 [email protected]

Abstracts
www.thelancet.com Published online March 14, 2011 Webappendix 107
Prioritisation of quality improvement projects through patient outcome assessments Shakera Rahimi, Shafiqa Babak, Najia Tariq
AbstractBackground The availability of safe and life-saving clinical interventions is key for maternal and neonatal survival, as well as for the achievement of Millennium Development Goals 4 and 5. In Afghanistan, decades of conflict-related violence has resulted in neonatal and maternal mortality rates that are among the top ten in the world; maternal mortality was estimated at 1600 per 100 000 livebirths. Rabia Balkhi Hospital, a maternity tertiary care hospital located in Kabul, serves as the site for the US-funded Afghanistan Health Initiative. We aimed to identify maternal and perinatal mortality rates and the related obstacles to timely and appropriate care, for further linking to quality improvement projects and other administration-driven efforts targeted at improving health-care services at Rabia Balkhi Hospital.
Methods The patient outcomes assessment, adapted from the Centres for Disease Control and Prevention’s patient flow analysis, was used. The patient outcomes assessment is a facility-based, cross-sectional study (public health practice), tracking patients from their admission to their exit. Post-discharge follow-up for specific subpopulations was included. Data collectors were trained to prioritise their data gathering through observational means.
Findings Data for the Rabia Balkhi Hospital service population and the delivery of health-care services were obtained. These data included staff to patient ratios, patient monitoring activities, and proportions of caesarean sections received within 30 min. Gaps were targeted by quality improvement projects and other administratively driven interventions. Ongoing analysis of data from a second patient outcomes assessment will measure the success and impact of these activities.
Interpretation The patient outcomes assessment has informed, fuelled, and assessed various quality improvement activities at Rabia Balkhi Hospital by providing timely and reliable data. At the hospital, the assessment has also served as an important standard for the maturation of other hospital surveillance systems. These features, along with its successful implementation and administrative uses in low-resource settings, warrants consideration for its use in similar settings.
Published Online March 14, 2011
Comforce Technical Services Contractor (CTS Global), Assign to Centre for Disease Control and Prevention (CDC), Kabul, Afghanistan (S Rahimi MD); and Rabia Balkhi Hospital, Kabul, Afghanistan (S Babak MD, N Tariq MD)
Correspondence to: Shakera Rahimi, c/o Brian McCarthy, Centers for Disease Control and Prevention, Division of Reproductive Health, Columbia Building, MS-K20, 2900 Woodcock Boulevard, Chamblee, GA 30341, USA [email protected]
Abstracts
108 www.thelancet.com Published online March 14, 2011 Webappendix
Newborn deaths in the PhilippinesAurora T Reolalas
AbstractBackground Large numbers of children die soon after birth, many of them in the first 4 weeks of life (neonatal deaths), and most are newborn babies who died during the first week of life (early neonatal deaths). This report aimed to provide a profile of newborn deaths and early neonatal deaths in the Philippines and its regions, based on the registered deaths in 2006 and 2007.
Methods The analysis for early neonatal deaths is limited to the information that comes from the death certificates, such as sex, age at death, mother’s age at death of the child, usual residence, type of birth (single, twin, or triplet), whether attended by a physician at death, and cause of death.
Findings The results showed that early neonatal deaths constituted around 46·8% of all infant deaths in 2006, and increased to 47·3% in 2007 based on the registered deaths. Of total early neonatal deaths, 39·8% and 39·6% of the deaths occurred before the first day of life in 2006 and 2007, respectively, and around 81·3% and 81·6% during the first 3 days of life in 2006 and 2007, respectively. Rates varied by region.
Interpretation Early neonatal deaths can be prevented if proper care after birth is given by mothers. Post-natal check-ups are important for mothers and for babies.
Published Online March 14, 2011
Vital Statistics Division, Civil Registration Department, National Statistics Office,
Quezon City, Philippines (A T Reolalas MA)
Correspondence to: Aurora T Reolalas, Vital Statistics
Division, Civil Registration Department, National Statistics Office, 3rd Floor Vibal Building,
Times Street corner EDSA, West Triangle, Quezon City, Philippines
Abstracts
www.thelancet.com Published online March 14, 2011 Webappendix 109
The validity and feasibility of a new method to estimate mortality in crisis-affected and resource-poor settingsBayard Roberts, Oliver W Morgan, Mohammed Ghaus Sultani, Peter Nyasulu, Sunday Rwebangila, Mark Myatt, Egbert Sondorp, Daniel Chandramohan, Francesco Checchi
AbstractBackground Data for mortality rates are crucial to guide health interventions in crisis-affected and resource-poor settings. The methods currently available to collect mortality data in such settings feature important methodological limitations. We developed and validated a new method (the informant method) to provide near real-time mortality estimates in such settings. The objective was to assess the validity and feasibility of the informant method.
Methods We selected four study sites: Kabul, Afghanistan; Mae La refugee camp, Thailand; Chiradzulu District, Malawi; and Lugufu and Mtabila refugee camps, Tanzania. We recorded information about all deaths in a 60-day period by asking key community informants and decedents’ next of kin to refer interviewers to bereaved households. We used the total number of deaths and population estimates to calculate mortality rates for 60-day and 30-day periods. For validation, we compared these rates with a best estimate of mortality using capture-recapture analysis with two further independent lists of deaths. For feasibility, time and cost inputs for the informant method were compared with those estimated for a retrospective mortality survey. We also assessed the feasibility of using verbal autopsy methods with the informant method (for Chiradzulu District only).
Findings The population covered by the informant method was 76 476 people in Kabul, 43 794 in Mae La camp, 54 418 in Chiradzulu District, and 80 136 in Tanzania camps. The informant method showed moderate sensitivity (55·0% in Kabul, 64·0% in Mae La, 72·5% in Chiradzulu, and 67·7% in Tanzania), but performed better than the active surveillance system in the Tanzania refugee camps. The informant method required an average of 29% less time inputs and 33% less monetary inputs across all four study sites than retrospective surveys with a 6-month recall period. The addition of verbal autopsy was highly feasible, and enabled estimation of cause-attributable mortality.
Interpretation The informant method currently features moderate sensitivity for accurately assessing mortality, but warrants further development, particularly considering its advantages over current options of better feasibility and near real-time estimates of mortality rates.
Published Online March 14, 2011
Department of Public Health and Policy (B Roberts PhD, M G Sultani BSc, E Sondorp MD), Department of Infectious and Tropical Diseases (Prof D Chandramohan PhD, F Checchi PhD), London School of Hygiene and Tropical Medicine, London, UK; US Centers for Disease Control and Prevention, Atlanta, GA, USA (O W Morgan PhD); Médecins Sans Frontières France, Malawi programme, Chiradzulu, Malawi (P Nyasulu BSc); UN High Commissioner for Refugees, Tanzania Office, Kigoma, Tanzania (S Rwebangila MD); and Brixton Health, Plymouth, UK (M Myatt PhD)
Correspondence to: Bayard Roberts, Faculty of Public Health and Policy, London School of Hygiene and Tropical Medicine, London WC1E 7HT, UK [email protected]

Abstracts
110 www.thelancet.com Published online March 14, 2011 Webappendix
An analysis of wealth-related inequalities in breastfeeding rates in 102 countries Thomas Roberts, Emmanuela Gakidou
AbstractBackground In 2010, more than 7∙7 million children died before their fifth birthday. Over 98% of these deaths occurred in developing countries, and within these countries, child mortality is concentrated in the lowest wealth quintile. Breastfeeding is a proven child health intervention available to all mothers that does not require additional health infrastructure. However, breastfeeding rates remain low in many developing countries, and breastfeeding behaviours have been linked to indicators of economic status. We seek to examine how differential breastfeeding rates between income quintiles affect inequalities in child mortality.
Methods Using data from more than 250 multinational, national, and subnational surveys from 102 developing countries, we calculated rates of exclusive and partial breastfeeding for 1990–2010. Country-years without data were estimated with a cohort model, and all available data were combined with use of Loess regression to produce a complete time series of breastfeeding rates for each country. We estimated breastfeeding rates for each wealth quintile and linked them with child mortality rates. Efficacy data for exclusive breastfeeding was used to determine the proportion of child deaths that could be averted in each quintile by achieving universal exclusive breastfeeding in children younger than 6 months.
Findings Within countries, there are wide inequalities in breastfeeding rates across wealth quintiles, indicating that differences in breastfeeding patterns between quintiles contribute to inequalities in child mortality. The variation in breastfeeding rates between countries does not correlate with level of economic development.
Interpretation Breastfeeding is an effective child health intervention that reduces inequalities in child mortality in developing countries. However, low breastfeeding rates in many countries indicate that more active promotion of breastfeeding can prevent millions of child deaths. Additionally, inconsistencies in current breastfeeding data indicate that more effort is needed to promote standard data collection methods.
Published Online March 14, 2011
Institute for Health Metrics and Evaluation, University of
Washington, Seattle, USA (T Roberts BA, E Gakidou PhD)
Correspondence to: Emmanuela Gakidou,
Institute for Health Metrics and Evaluation, University of
Washington, Seattle, WA 98121, USA
Abstracts
www.thelancet.com Published online March 14, 2011 Webappendix 111
Transition in ischaemic heart disease in Mexico: estimates of disability-adjusted life-years in 1995–2005 at the Mexican Institute of Social SecurityGabriela Rodríguez, Jorge Escobedo, J Joaquín Herrera, Juan G Aranda, Beatriz Zurita
AbstractBackground Although ischaemic heart disease (IHD) mortality trends have started to show a decline in Mexico, morbidity still shows a constant increasing trend. Disability-adjusted life-years (DALYs) allow assessment of the burden of disease and guide future health strategies. We aimed to provide estimates of the burden of IHD in a population covered by the Mexican Institute of Social Security and to assess the trends of estimated DALYs in the past two decades.
Methods The burden of disease was estimated in 1995, 2000, and 2005 for the population covered by the Mexican Institute of Social Security, an institution that protects half the inhabitants of Mexico. DALYs were calculated to provide a comprehensive assessment of premature mortality (years of life lost) and disability attributable (years lived with disability) due to IHD, with the methodology proposed by the Global Burden of Disease study. Rates of DALYs, years of life lost, and years lived with disability were graphed and compared in the three estimated points of this period.
Findings While in 1995 the total DALYs attributable to non-communicable disease were 64% of the total burden, this figure rose to 71% in 2005. The rate of DALYs lost per 1000 inhabitants due to IHD was 4∙32 in 1995, which rose to 12∙95 in 2005, an increase by a factor of three in this period. Most of lost DALYs were due to years of life lost (94%) in 2005. Myocardial infarction was the major contributor to DALYs (12·2 per 1000 inhabitants), and the rate was higher in men (14∙3) than in women (10∙4). There was an age effect on DALY rates for IHD.
Interpretation The observed increase of DALYs despite a decrease in mortality, might be attributable to an earlier onset of the disease and increase in premature death, as well as to an increase on its incidence and prevalence. Mexico is facing a protracted polarised epidemiological transition, with IHD being a clear example.
Published Online March 14, 2011
Mexican Institute of Social Security, Mexico City, Mexico (G Rodríguez MD, J Escobedo MD, J J Herrera Eng, J G Aranda MD, B Zurita MD)
Correspondence to: Jorge Escobedo, Mexican Institute of Social Security, Apartado Postal 40-028, 06140 Mexico City, Mexico [email protected]
Abstracts
112 www.thelancet.com Published online March 14, 2011 Webappendix
Estimation of cause-specific hospital discharges from hospital lethality and population mortality in Colombia, 2006–07Jesús Rodríguez García
AbstractBackground By 2006, Colombia reached an estimated 92% coverage of deaths from the vital registration system and 99% coverage of cause of death defined by a physician. However, hospital discharge data from in-hospital records have an estimated coverage of 35% as per the 2007 National Health Study. Hospital discharge frequencies by causes and ages are a necessary input for planning health services. Drawing from the methods used by Murray and colleagues (2007), with some changes, cause-specific hospital discharge data were corrected relating hospital lethality and population mortality using the data sets of 2006 and 2007. This study aimed to correct hospital discharge data for Colombia by cause, age, and subnational regions for 2006 and 2007, relating in-hospital lethality from in-hospital records and in-hospital deaths from the vital registration system.
Methods We assumed that in-hospital deaths from vital registration systems and in-hospital lethality from in-hospital records are the best data we have. We calculated expected hospital discharges by dividing hospital mortality from the vital registration system by in-hospital lethality for each disease category (49 disease categories using codes from the International Statistical Classification of Diseases, tenth revision). The average relative error was calculated to compare observed and expected cause-specific hospital discharges fractions.
Findings The coverage of hospital discharges (registered vs expected) were smaller in the less urban regions (10–20%) than the others (25–45%). The coverage reached its greatest value for ages 1–29 years (75%). The average relative error associated with the correction was, in general, greater than 30%, except in Bogota (22%). This relative error was less than 30% until age 15 years, and was higher from that age. In-hospital lethality increased with age in all the causes and regions, in general, maintaining higher values in less developed areas.
Interpretation Correction of hospital discharges were, in general, associated with small coverage and average relative errors higher than 30%.
Published Online March 14, 2011
Pontificia Universidad Javeriana, Bogota, Colombia
(J Rodríguez García MSc)
Correspondence to: Jesús Rodríguez García, Pontificia
Universidad Javeriana, Bogota 110231, Colombia

Abstracts
www.thelancet.com Published online March 14, 2011 Webappendix 113
Use of severe acute maternal morbidity for the evaluation of the impact of maternal health interventionsC Ronsmans, V Filippi, A Adler
AbstractBackground Impact evaluation in safe motherhood has almost solely focused on measurement of maternal mortality. There has been a growing interest in investigating the levels and causes of severe acute maternal morbidity (SAMM), but experience so far has been limited. We aim to examine how SAMM can be used for the quantitative evaluation of the health impact of maternal health interventions.
Methods The use of SAMM will be illustrated by data from four studies: (1) a systematic review of fatality rates associated with SAMM; (2) a systematic review of SAMM associated with unsafe abortion; (3) a population-based study of the incidence of SAMM and maternal mortality in Indonesia; and (4) a summary of studies reporting the incidence of life-saving surgery (a subset of SAMM) in sub-Saharan Africa.
Findings Fatality rates in women with SAMM are extremely low in high-income countries, whereas they range from 0∙5% to 20∙8% in low-income countries. Summarising the results from 15 studies, we found that every year, 237 women experience a SAMM from unsafe abortion for every 100 000 livebirths. This rate is much higher than the abortion-related maternal mortality ratio of 40 deaths per 100 000 livebirths estimated in low-income countries. The met need for life-saving obstetric surgery is a powerful indicator of inequalities in access to care. The rural rates range from 209 per 100 000 births in Guinea to 687 per 100 000 in a population in the Democratic Republic of the Congo, and none of the upper-bound confidence limits exceed 1000 per 100 000 births (the threshold above which the need is met).
Interpretation SAMM are more common than maternal deaths, and estimates of the incidence of and fatality associated with SAMM are powerful indicators for the evaluation of the health impact of maternal health interventions. The larger numbers of cases of SAMM allow a further disaggregation of data across geographical or other relevant subgroups than is possible for maternal deaths, and help to identify areas in greatest need of maternal health interventions.
Published Online March 14, 2011
London School of Hygiene and Tropical Medicine, London, UK (Prof C Ronsmans MD, V Filippi PhD, A Adler PhD)
Correspondence to: Carine Ronsmans, London School of Hygiene and Tropical Medicine, London WC1E 7HT, UK [email protected]

Abstracts
114 www.thelancet.com Published online March 14, 2011 Webappendix
Evaluation of trends in the use of modern contraception and its relationship with fertilityLisa Rosenfeld, Lahn Straney, Rashmi Jasrasaria, Christopher J L Murray, Stephen S Lim
AbstractBackground Contraceptive prevalence is a key indicator of progress toward the Millennium Development Goal for improving maternal health. Despite this, there is a lack of current information on trends and patterns of contraception use and its effect on fertility. We aim to generate a time series from 1980 to 2010 of modern, traditional, and method-specific contraceptive prevalence for all countries, estimate the relationship between contraception method and fertility, and examine how the level and method composition relate to variations in fertility.
Methods We applied spatiotemporal regression to 42 432 data points to estimate modern, traditional, and method-specific prevalence for women aged 15–49 years in 187 countries between 1980 and 2010. We used a Cox proportional hazards model to estimate the effectiveness of contraception methods at preventing pregnancy using 57 country-specific surveys.
Findings Globally, modern contraceptive prevalence rose from 31% to 45% between 1980 and 2010. Regionally, average annual increases in prevalence ranged from 0∙09% in central sub-Saharan Africa to 0∙95% in east Asia. Similar trends in overall modern contraceptive prevalence conceal differences in the method-specific composition among different age groups and countries. Modern contraceptive prevalence in 2010 was between 40% and 50% for women aged 25–29 years in Bangladesh, Ecuador, Lesotho, and Russia; however, the most common method was oral contraceptives in Bangladesh (22∙5%), intrauterine devices in Ecuador (12∙8%), injections in Lesotho (16∙3%), and condoms in Russia (20∙9%). Our cohort analysis suggests that, under routine conditions, female and male sterilisation reduces pregnancy rates by 100%, implants by 98%, intrauterine devices by 95%, injections by 92%, oral contraceptives by 84%, and condoms by 80%.
Interpretation Although increases in contraceptive prevalence by region are similar, the mix of methods varies considerably across countries, as does the relationship between different methods and fertility. Large gains in maternal and child health could be realised by accelerating access to effective modern contraception methods.
Published Online March 14, 2011
Institute for Health Metrics and Evaluation, University of
Washington, Seattle, WA, USA (L Rosenfeld BA, L Straney PhD,
R Jasrasaria BA, Prof C J L Murray DPhil,
S S Lim PhD)
Correspondence to: Lisa Rosenfeld, Institute for
Health Metrics and Evaluation, University of Washington,
Seattle, WA 98121, USA [email protected]

Abstracts
www.thelancet.com Published online March 14, 2011 Webappendix 115
New disability weights for the Global Burden of Disease studyJoshua A Salomon, Theo Vos, Daniel R Hogan, Michael Gagnon, Mohsen Naghavi, Colin Mathers, Ali Mokdad, on behalf of the Disability Weights Measurement Collaboration
AbstractBackground Measurement of the burden of disease by disability-adjusted life-years requires disability weights that quantify health decrements for all non-fatal consequences of disease and injury. Existing disability weights are criticised on various conceptual and methodological grounds. Our primary objective was to estimate new disability weights for 233 disabling sequelae, as inputs to the latest revision of the Global Burden of Disease study. We also aimed to assess variability in these weights across cultures.
Methods Surveys were conducted through personal interviews in Bangladesh, Indonesia, Peru, and Tanzania; telephone interviews in the USA; and an open-access internet-based questionnaire. The surveys used paired-comparison questions, in which respondents considered two hypothetical individuals with different functional limitations (corresponding to a randomly selected pair of sequelae), and indicated which person they regarded as healthier. The internet survey added questions on population health equivalence, which compared the overall health benefits of interventions that had saved lives or averted non-fatal diseases or injuries. Data were analysed with a statistical model combining probit regression for the paired-comparison responses with logit-normal interval regression for the equivalence responses to estimate disability weights for all sequelae.
Findings Preliminary analyses based on 10 115 responses from Bangladesh, Peru, Indonesia, and Tanzania, 2832 responses from the USA, and 6726 responses from the internet survey showed high consistency across surveys. Pearson’s r ranged from 0·88 to 0·96 for probit coefficients in each household survey and the US telephone survey compared with the pooled household results. Preliminary results from the internet survey were also highly correlated (r=0·89 vs the household surveys, and 0·95 vs the USA). Provisional estimates of disability weights tended to be lower overall than corresponding weights from prior studies.
Interpretation This study represents the most extensive empirical effort on measuring disability weights so far. The new approach we apply, based on paired comparisons, accommodates broad-ranging measurement in diverse communities. Contrary to the popular hypothesis that disability weights vary widely across samples with different cultural environments, we find strong evidence of highly consistent results.
Published Online March 14, 2011
Harvard School of Public Health, Boston, MA, USA (J A Salomon PhD, D R Hogan MPH, M Gagnon MS); University of Queensland, Brisbane, QLD, Australia (Prof T Vos PhD); Institute for Health Metrics and Evaluation, University of Washington, Seattle, WA, USA (M Naghavi PhD, Prof A Mokdad PhD); and WHO, Geneva, Switzerland (C Mathers PhD)
Correspondence to: Joshua A Salomon, Department of Global Health and Population, Harvard School of Public Health, Boston, MA 02115, USA [email protected]
Abstracts
116 www.thelancet.com Published online March 14, 2011 Webappendix
Organisational restructuring of the Ministry of Health in Botswana: impact on performanceOnalenna Seitio-Kgokgwe, Pauline Barnett, Philip C Hill, Robin D C Gauld
AbstractBackground Responding to performance challenges identified during an internal review in 2000, the Botswana Ministry of Health engaged a team of consultants to review the organisational structure. A new structure was adopted in 2005. This report is part of a PhD study designed to assess performance of the Ministry following adoption of the new organisational structure.
Methods Using WHO’s health systems performance assessment framework, the study assessed the Ministry’s performance in four key health system functions: stewardship, health financing, resource generation, and service provision. Performance indicators were designed and used to assess the Ministry’s performance. Data were collected through document review, interviews with key informants comprising policy makers, senior ministry officials, staff in charge of key processes at the Ministry (n=38), stakeholders (n=15), and surveys of health workers (n=389) and hospital managers (n=42). This report presents analysis from document review and interviews.
Findings The structure adopted in 2005 has not been adequately implemented, which is attributed to lack of an implementation plan, ineffective management of the restructuring process, limited human resource capacity, and turnover of senior management. The Ministry has limited capacity for policy development, planning, and oversight. There are chronic challenges in financial management. There is increasing loss of focus on human resource development despite investment in health infrastructure. Inadequate equipment planning and management limit delivery of services. Ineffective supply management systems contribute to poor drug availability.
Interpretation Adoption of a new organisational structure brought about limited changes in performance of the functions under study. Limited leadership capacity and lack of skilled personnel undermine delivery of services. Innovative approaches to human resource development are needed to leverage system performance.
Published Online March 14, 2011
Ministry of Health, Gaborone, Botswana
(O Seitio-Kgokgwe MPH); Department of Preventive and
Social Medicine, University of Otago School of Medicine,
Dunedin, New Zealand (O Seitio-Kgokgwe,
Prof P C Hill MD, R D C Gauld PhD); and Health
Sciences Centre, University of Canterbury, Christchurch, New
Zealand (P Barnett PhD)
Correspondence to: Onalenna Seitio-Kgokgwe,
Centre for International Health, University of Otago University,
Dunedin 9016, New Zealand [email protected]

Abstracts
www.thelancet.com Published online March 14, 2011 Webappendix 117
Large-scale annual health survey to improve health metrics in IndiaRamesh C Sethi, Bhaskar Mishra
AbstractBackground Decentralised district-based health planning is essential in India because of the large interdistrict variations. The district level household survey conducted every 5 years mainly provides data on reproductive and child health, but not on the other major causes of disease burden. To meet the need for regular data on key health issues, the Annual Health Survey (AHS) funded by the Ministry of Health and Family Welfare has been launched in India.
Methods The first round of AHS is being conducted in all 284 districts of nine less-developed states of Assam, Bihar, Chhattisgarh, Jharkhand, Madhya Pradesh, Orissa, Rajasthan, Uttar Pradesh, and Uttarakhand, having a population of about 550 million people. The survey has a sample size of 18·2 million people in 3·6 million households. In each district, 64 000 people are sampled in 71 sampling units. The sample size has been calculated to provide reliable estimates of infant mortality rate at the district level and to provide key data for maternal and child health, communicable and non-communicable diseases and injuries, and access to health care. The fieldwork was outsourced to experienced survey agencies, and the supervision was done by the staff of Office of Registrar General, India. The fieldwork for the survey has been completed and the data processing is done.
Findings The district-level results from the first round of AHS in India will be available in the first quarter of 2011 for fertility and mortality; prevalence of acute and chronic illnesses, injuries, and disabilities; and access to health-care services.
Interpretation This ambitious annual survey, probably the largest health survey in the world, will provide regular data for crucial disease and health system issues to make health planning in India more informed at the district level. Anthropometric, clinical, and biochemical measurements are planned for inclusion in the AHS in 2011. Inclusion of verbal autopsy for causes of death is also being planned.
Published Online March 14, 2011
Office of the Registrar General of India, Government of India, New Delhi, India (R C Sethi MBA, B Mishra MA)
Correspondence to: R C Sethi, Additional Registrar General of India, Government of India, 2A, Mansingh Road, New Delhi 110011, India [email protected]

Abstracts
118 www.thelancet.com Published online March 14, 2011 Webappendix
Beyond maternal mortality: the burden of deaths unrelated to pregnancy and careseeking patterns for non-communicable diseases in rural Bangladeshi women of reproductive ageShegufta S Sikder, Alain B Labrique, Mahbubur Rashid, Keith P West Jr, Hasmot Ali, Abu Ahmed Shamim, Parul Christian
Abstract Background Although maternal deaths in rural Bangladesh have been well studied, the causes and careseeking patterns of excess adult female mortality from causes unrelated to pregnancy have been largely ignored. We sought to describe the burden of deaths and careseeking patterns for deaths unrelated to pregnancy in women of reproductive age.
Methods A physician reviewer assigned biomedical causes of death for 341 non-pregnancy-related verbal autopsies from one of the largest population-based trials in South Asia, a cohort of roughly 125 000 women of reproductive age followed between 2001 and 2006 in northwest rural Bangladesh. We also conducted qualitative textual analysis on verbal autopsy narratives to describe careseeking patterns for non-communicable diseases.
Findings Non-pregnancy-related mortality represented 58% (n=686) of the total 1192 female deaths that occurred between 2001 and 2006. Of the 341 deaths with assigned cause of death, 73% (n=250) were attributed to non-communicable diseases, 15% (n=51) to injuries, and 12% (n=40) to infectious causes. Cardiovascular disease (29%), cancer (22%), and diabetes (5%) were the leading causes of non-communicable disease deaths. More than half of women who died of chronic diseases went to three different treatment providers over the course of illness. About 70% (n=174) first sought care from traditional providers such as village doctors due to the proximity of these providers and the low cost of visits. Beyond the first stage of careseeking, however, most women sought care from certified medical practitioners after traditional treatment failed to cure their conditions.
Interpretation The majority of deaths in women of reproductive age in this setting occur from causes unrelated to pregnancy, most from non-communicable diseases. Traditional providers remain the first-line providers for women who die of non-communicable diseases. Non-pregnancy-related mortality warrants further research attention for better understanding of how to prevent these deaths in resource-poor settings of south Asia.
Published Online March 14, 2011
Department of International Health, Johns Hopkins
Bloomberg School of Public Health, Baltimore, MD, USA
(S S Sikder MHS, A B Labrique PhD,
Prof K P West Jr DrPH, P Christian DrPH); and JiVitA
Maternal and Child Health and Nutrition Research Project,
Gaibandha, Bangladesh (M Rashid MBBS, H Ali MBBS,
A A Shamim MA)
Correspondence to: Alain B Labrique, Department of
International Health, Johns Hopkins Bloomberg School of
Public Health, Baltimore, MD 21205, USA
Abstracts
www.thelancet.com Published online March 14, 2011 Webappendix 119
Incorporation of comorbidity: the use of non-parametric models to better understand the value of targeted public health strategiesWarren Stevens, David J Jeffries
AbstractBackground Attempts to achieve Millennium Development Goals (MDGs) 4 and 5 have centred primarily on achievement of high levels of population-wide coverage of interventions such as immunisation, antenatal care, and insecticidal bednets. The rationale for the goal of universal coverage is that it moves us ever closer to reductions in overall disease burden and reductions in health inequalities, but given that achievement of universal coverage has often proved problematic, how much has the focus on the MDGs marginalised attempts to value approaches that target the most vulnerable? It is widely accepted that disease burden is not evenly distributed across populations, but to what degree this variance can be predicted is more open to debate. Single-disease, single-intervention models may not capture the full compound effect of comorbidities in the most vulnerable subpopulations. We looked at the potential of agent-based models to predict the true variance in disease burden distribution by considering comorbidities rather than examining diseases and their outcomes in silos. The inverse care law suggests that suboptimum coverage of health care will most likely worsen health inequalities, because those in most need are the least likely to benefit.
Methods We used agent-based models to test a hypothetical methodology of viewing the heterogeneity in disease burden distribution in practical terms, eschewing the more traditional silo approach to reduction of disease burden.
Findings We tested the feasibility of our hypothesis by estimating marginal low dimensional probability distribution functions from high dimensionality multivariate distributions generated from large-scale health outcome datasets.
Interpretation This method builds on the growing evidence that comorbidity has a major effect on relative risk of child mortality and suggests the use of agent-based modelling techniques as a more effective strategy of setting priorities than modelling based on single disease interventions.
Published Online March 14, 2011
Population Services International, Washington, DC, USA (W Stevens PhD); and MRC Tropical Diseases Research Unit, Banjul, The Gambia (D J Jeffries PhD)
Correspondence to: Warren Stevens, Research and Metrics Department. Population Services International, Washington, DC NW, 20036, USA [email protected]
Abstracts
120 www.thelancet.com Published online March 14, 2011 Webappendix
An innovative mapping tool for analysis of health data in limited resource settings: the Excel to Google Earth (E2G) tool from MEASURE Evaluation, an example from SenegalJames Stewart, Adama Ndir, John Spencer
AbstractBackground Many national and district health officers store routine health information system (RHIS) and surveillance data in Excel, and do not have access to mapping software. Geographical display tools such as Google Earth make map-based data visualisation increasingly feasible for those who lack geographical data, technical expertise in geographical information systems (GIS), or access to a GIS program. Without customisation, however, many of these tools are incapable of creating choropleth maps (colour-shaded maps by administrative or statistical area), which can provide valuable insights for health programme decision makers. MEASURE Evaluation created a simple, step-by-step Excel macro that allows these decision makers to map data by national administrative divisions (eg, provinces and districts) in Google Earth with use of data contained in Excel spreadsheets. Maps are created with the Keyhole Markup Language (KML), and can easily be shared. Available as a free download, the Excel to Google Earth (E2G) mapping tool builds capacity for geographical analysis in limited resource settings, facilitates evidence-based decision making, and helps to improve data quality. We aimed to demonstrate how health data stored in Excel spreadsheets can be leveraged to create choropleth maps for evidence-based decision making.
Methods The presentation uses RHIS data from Senegal, which represent what might be found in a national or district programme office, and shows how E2G can help to overcome many of the barriers to choropleth mapping. The presentation also illustrates how E2G maps can support improved analysis and use of RHIS and other data.
Findings E2G allows area-based health data for Senegal to be mapped quickly and easily with use of data stored in Excel spreadsheets. Geographical comparison of health data provides a solid basis for evidence-based programme planning and decision making.
Interpretation The E2G tool provides a free, easy, and effective method for geographical visualisation of area-based health data stored in Excel spreadsheets. The E2G tool can be used with minimum effort by health decision makers in limited resource settings.
Published Online March 14, 2011
MEASURE Evaluation, Carolina Population Center, University
of North Carolina at Chapel Hill, Chapel Hill, NC, USA
(J Stewart MA, J Spencer MA); and CDC Global AIDS Program
(GAP), Bamako, Mali (A Ndir MD)
Correspondence to: James Stewart, Senior Spatial
Analyst, MEASURE Evaluation, Carolina Population Center,
University of North Carolina at Chapel Hill, Chapel Hill,
NC 27516-2524, USA [email protected]
Abstracts
www.thelancet.com Published online March 14, 2011 Webappendix 121
Measurement of the health system performance of US states in reducing neonatal mortalityLahn D Straney, Stephen S Lim, Christopher J L Murray
AbstractBackground Geographical disparities in neonatal mortality rates in the USA reflect underlying differences in the prevalence of risk factors, such as gestational age and birthweight, as well as differences in access and quality of health services. The extent to which disparities are driven by health system performance versus differences in risk factor prevalence are not well known. We used risk adjustment models to estimate an outcome-based measure of health system performance at the state and county levels.
Methods With a database of 44 178 182 linked births and deaths, 1996–2006, we compared multivariate logistic regression and machine learning approaches to control for risk factor prevalence and estimate overall temporal trends in mortality at the county level. Out-of-sample validation was used for final model selection. Multilevel modelling was used to quantify the county and state level variation in neonatal mortality.
Findings The model with the lowest out-of-sample error included gestational age, birthweight, and the presence of a congenital anomaly. Controlling for risk factors, there were no clear temporal trends in neonatal mortality at the national level. There was significant variation in neonatal outcomes across states and counties; however, the degree of heterogeneity decreased over time. Controlling for risk factors, in 1996, 39 states had a significantly higher or lower rate of neonatal mortality than the national average, compared with 17 states in 2006.
Interpretation Rates of neonatal mortality in the USA are confounded by the prevalence of early-term deliveries. We documented large differences in risk-adjusted neonatal mortality by geographical area that likely reflect differences in health-system performance. Understanding of how this variation relates to process-based measures of access and quality of care can help to guide policies to reduce disparities in neonatal mortality in the USA.
Published Online March 14, 2011
Institute for Health Metrics and Evaluation, University of Washington, Seattle, WA, USA (L D Straney PhD, S S Lim PhD, Prof C J L Murray DPhil)
Correspondence to: Lahn D Straney, Institute for Health Metrics and Evaluation, University of Washington, Seattle, WA 98121, USA [email protected]
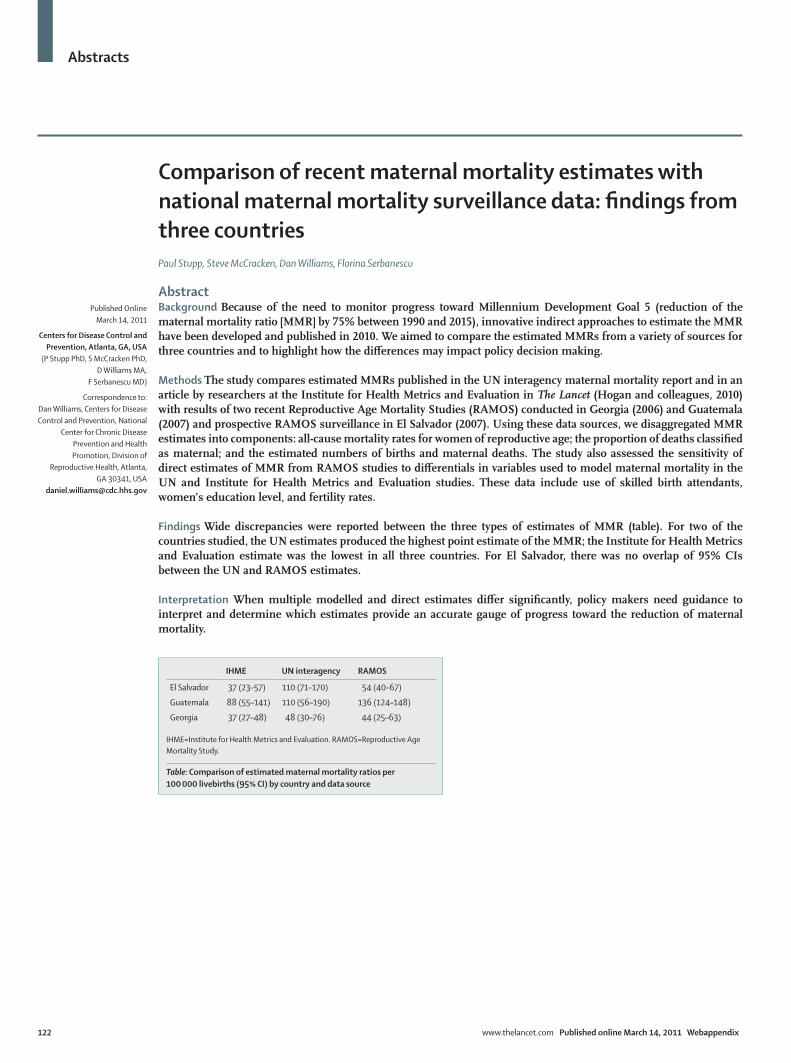
Abstracts
122 www.thelancet.com Published online March 14, 2011 Webappendix
Comparison of recent maternal mortality estimates with national maternal mortality surveillance data: findings from three countriesPaul Stupp, Steve McCracken, Dan Williams, Florina Serbanescu
AbstractBackground Because of the need to monitor progress toward Millennium Development Goal 5 (reduction of the maternal mortality ratio [MMR] by 75% between 1990 and 2015), innovative indirect approaches to estimate the MMR have been developed and published in 2010. We aimed to compare the estimated MMRs from a variety of sources for three countries and to highlight how the differences may impact policy decision making.
Methods The study compares estimated MMRs published in the UN interagency maternal mortality report and in an article by researchers at the Institute for Health Metrics and Evaluation in The Lancet (Hogan and colleagues, 2010) with results of two recent Reproductive Age Mortality Studies (RAMOS) conducted in Georgia (2006) and Guatemala (2007) and prospective RAMOS surveillance in El Salvador (2007). Using these data sources, we disaggregated MMR estimates into components: all-cause mortality rates for women of reproductive age; the proportion of deaths classified as maternal; and the estimated numbers of births and maternal deaths. The study also assessed the sensitivity of direct estimates of MMR from RAMOS studies to differentials in variables used to model maternal mortality in the UN and Institute for Health Metrics and Evaluation studies. These data include use of skilled birth attendants, women’s education level, and fertility rates.
Findings Wide discrepancies were reported between the three types of estimates of MMR (table). For two of the countries studied, the UN estimates produced the highest point estimate of the MMR; the Institute for Health Metrics and Evaluation estimate was the lowest in all three countries. For El Salvador, there was no overlap of 95% CIs between the UN and RAMOS estimates.
Interpretation When multiple modelled and direct estimates differ significantly, policy makers need guidance to interpret and determine which estimates provide an accurate gauge of progress toward the reduction of maternal mortality.
Published Online March 14, 2011
Centers for Disease Control and Prevention, Atlanta, GA, USA
(P Stupp PhD, S McCracken PhD, D Williams MA,
F Serbanescu MD)
Correspondence to: Dan Williams, Centers for Disease Control and Prevention, National
Center for Chronic Disease Prevention and Health Promotion, Division of
Reproductive Health, Atlanta, GA 30341, USA
IHME UN interagency RAMOS
El Salvador 37 (23–57) 110 (71–170) 54 (40–67)
Guatemala 88 (55–141) 110 (56–190) 136 (124–148)
Georgia 37 (27–48) 48 (30–76) 44 (25–63)
IHME=Institute for Health Metrics and Evaluation. RAMOS=Reproductive Age Mortality Study.
Table: Comparison of estimated maternal mortality ratios per 100 000 livebirths (95% CI) by country and data source

Abstracts
www.thelancet.com Published online March 14, 2011 Webappendix 123
Assessment of the impact of malaria interventions: the case of mainland Tanzania The Tanzania Impact Evaluation Team*
AbstractBackground The US President’s Malaria Initiative, in coordination with the Roll Back Malaria Partnership and global stakeholders, is supporting evaluations to assess the effect of malaria control efforts over the past decade on morbidity and mortality in children younger than 5 years. Tanzania is the first country to conduct this evaluation and will be used as a model for subsequent countries. We aimed to assess whether changes in the scale-up of malaria control efforts in mainland Tanzania from 1999 to date were associated with a reduction in the malaria burden.
Methods The evaluation used multiple sources of data including the demographic and health surveys, other large national surveys, facility data, and other relevant studies. The analytical approach included trend analysis and modelling (logistic regression and Lives Saved Tool [LiST] model). Trends in key coverage indicators of the main control strategies (insecticide-treated bednets [ITNs], indoor residual spraying [IRS] of insecticides, intermittent preventive treatment in pregnancy [IPTp], and case management) were compared with trends in morbidity (parasitaemia, anaemia, and fever) and mortality. Logistic regression was performed to assess the association between malaria interventions and morbidity. The LiST model was then used to compute the number of lives saved with the change in intervention coverage.
Findings Attributing change in all-cause under-5 mortality to malaria interventions is challenging. Non-malaria related factors and interventions must be measured as they play a significant role in mortality risk. Identifying appropriate data sources can be problematic. While national surveys can be used to assess survival risk over time, these surveys do not measure exposure to malaria interventions longitudinally, making causality difficult to assess. National surveys also mask other small-scale heterogeneities, which are important in the dynamics of malaria transmission.
Interpretation Thorough assessment of malaria control efforts requires data from a range of sources, at multiple spatial and temporal scales. More frequent measurement of intervention exposure would strengthen evidence of causality.
The Tanzania Impact Evaluation TeamAlex Mwita, Frank Chaky, Monica Olewe, Renata Mandike (National Malaria Control Program, Dar es Salaam, Tanzania); Adeline Komba (National Bureau of Statistics, Dar es Salaam, Tanzania); Angelica Rugarabamu, Honorati Masanja, Paul Smithson, Rose Lusinde, Salim Abdulla (Ifakara Health Institute, Dar es Salaam, Tanzania); Christine Hershey, Rene Salgado, Misun Choi (President’s Malaria Initiative, Washington, DC, USA); Erin Eckert, Fred Arnold, Lia Florey, Yazoume Ye (ICF Macro, Calverton, MD, USA); Peter McElroy, Chonge Kitojo, Jessica Kafuko (President’s Malaria Initiative, Dar es Salaam, Tanzania); Achuyt Bhattarai, Audrey Mitchell, Hannah Gould, Steven Yoon (Centers for Disease Control and Prevention/President’s Malaria Initiative, Atlanta, GA, USA), and Rita Njau (WHO, Dar es Salaam, Tanzania)
Published Online March 14, 2011
*Members listed at end of Abstract
Correspondence to: Yazoume Ye, ICF Macro, Calverton, MD 20705, USA [email protected]

Abstracts
124 www.thelancet.com Published online March 14, 2011 Webappendix
The cost per year of life lived on HIV antiretroviral therapyStéphane Verguet, Emmanuela Gakidou, Christopher J L Murray
AbstractBackground Under the leaderships of the Global Fund for AIDS, Tuberculosis and Malaria (GFATM) and the US President’s Emergency Plan for AIDS Relief (PEPFAR), international aid allocated to HIV/AIDS has skyrocketed in the past decade. Yet, with 33·4 million people living with HIV and 2·7 million new infections worldwide in 2008, the financial sustainability of the epidemic is uncertain. We aimed to propose an approach to assess the cost-effectiveness of antiretroviral therapy (ART) programmes offered by different providers, and to identify the determinants of programmes’ success.
Methods First, we identified a set of attributes for ART providers in sub-Saharan Africa and Latin America through systematic literature review and expert consultation. Second, we used a logistic regression model with the patient’s probability to have completed 1 full year of ART as outcome variable and the identified attributes as independent variables. We then estimated the number of providers and patients per provider to be sampled in order to be able to detect a statistically significant difference of 10% overlapping the true 95% confidence interval for each of the attributes identified.
Findings The attributes identified were eight determinants of care: whether ART was free; whether ART was provided in a clinic within hospital or a dedicated facility; whether the facility was run by government or a non-governmental organisation; whether funding came from PEPFAR or GFATM; whether community health workers were reaching out to individuals in the community; whether the programme was physician-led or nurse-led; distance from the facility; and drug regimen. We simulated (n=1000) the power to detect an effect for various combinations of sample size of individuals and providers.
Interpretation A field data collection involving about 25 providers treating at least 500 patients should give the power to identify the determinants of programmes’ success and draw meaningful policy recommendations.
Published Online March 14, 2011
Institute for Health Metrics and Evaluation, University of
Washington, Seattle, WA, USA (S Verguet PhD, E Gakidou PhD,
Prof C J L Murray DPhil)
Correspondence to: Stéphane Verguet, Institute for Health Metrics and Evaluation,
University of Washington, Seattle, WA 98121, USA

Abstracts
www.thelancet.com Published online March 14, 2011 Webappendix 125
Evaluation, comparison, and improvement of LiST with use of distal determinants and country-specific measurementsHaidong Wang, Andres Vecino-Ortiz, Thomas Roberts, Stephen Lim, Christopher J L Murray
Abstract Background Over 7·7 million children younger than age 5 years die each year. Although this number has decreased from 16 million in 1970, child deaths still account for about 14% of all deaths that occur annually worldwide. Of all the child deaths in 2010, south Asia and sub-Saharan Africa account for about 82%. The leading causes of death are lower respiratory tract infections, diarrhoeal disease, malaria, malnutrition, and HIV/AIDS. Thus, rapid reduction of child deaths worldwide depends on the decline of child mortality in regions with high mortality rates from these preventable diseases.
Discussion The Lives Saved Tool (LiST) is a cohort model used to estimate changes in child mortality given changes in coverage of certain interventions. It focuses on a select list of interventions and does not address the effects of distal factors such as maternal education, income, and household characteristics. The goal of our study is to provide a more comprehensive conceptual and analytical framework (figure) to study the causal pathways between distal factors and child mortality and morbidity outcomes. We have compiled an extensive database that includes microlevel data from demographic and health surveys and macrolevel socioeconomic and environmental indicators such as gross domestic product and population density. The hierarchical mixed-effect models that we are using reflect hypotheses based on the complex and comprehensive conceptual framework that our analysis is based on. With the results from our model estimation, we will be able to assess the impact of all the distal and intermediate factors on child morbidity and mortality. This evidence-based approach will enable us to recommend the most appropriate, cost-effective inventions to reduce child mortality and avert child deaths at different levels.
Published Online March 14, 2011
Institute for Health Metrics and Evaluation, University of Washington, Seattle, WA, USA (H Wang PhD, A Vecino-Ortiz MD, T Roberts BA, S Lim PhD, Prof C J L Murray DPhil)
Correspondence to: Haidong Wang, Institute for Health Metrics and Evaluation, University of Washington, Seattle, WA 98121, USA [email protected]

Abstracts
126 www.thelancet.com Published online March 14, 2011 Webappendix
CHILDBEARING PATTERN & FERTILITY CHOICES
MATERNAL HEALTH STATUS PARENTAL HEALTH
RELATED BEHAVIORS
Kinship support
Birth Spacing
Number of children
Sex Preference
Indoor Air Pollu�on
Water & Sanita�on /Hygiene
Toxic Exposure
Climate
Geography
Natural Disasters
Popula�on Density
Maternal Educa�on
Mother’s labor force par�cipa�on
Paternal Educa�on
Father’s Occupa�on
Household Income
Electricity
Household Decision-making process
Soci
al P
olic
y
Infr
astr
uctu
re
Hea
lth
Care
Sys
tem
an
d Br
eakt
hrou
gh P
rogr
ams
Urban/Rural
Race / Ethnicity
Polygyny
Family Values
INTERNATIONAL AID
Hea
lth
Serv
ice
and
Effec
�ve
Cov
erag
e
Other cultural factors
Dietary Choices
Breast Feeding Prac�ces
Immuniza�ons (BCG, DPT3, Polio, measles)
Contracep�on choices
Stun�ng (height for age)
Vita. A deficiency
Iodine deficiency
Zinc deficiency
Iron deficiency
Food prepara�on and storage prac�ces
Maternal Micronutrients supplementa�on
Tetanus toxoid immuniza�on
Various screening and treatments: Syphilis, malaria, asymptoma�c bacteriuria, etc
Labour surveillance
Clean delivery prac�ces
An�bio�cs for preterm premature rupture of membrances
Cor�costeroids for preterm labour
Detec�on and management of breech
Resuscita�on of newborn baby
Preven�on and management of hypothermia
Kangaroo mother care
Community-based pneumonia case management
HEA
LTH SERV
ICES AN
D IN
TERVEN
TION
S
Bednet usage
Folic acid deficiency
Pret
erm
Com
plic
a�on
s (s
uch
as L
ow b
irth
-wei
ght)
Birt
h A
sphy
xia
Inju
ry
Cong
enita
l Abn
orm
ali�
es
Oth
er N
on-c
omm
unic
able
Teta
nus
Seps
is
Dia
rrhe
a
Pneu
mon
ia
Oth
erIn
fec�
ous
Dis
ease
s
Mal
aria
HIV
/AID
S
Pert
usis
Men
ingi
�s
Mea
sles
PATH
OG
EN
EXPOSU
RE
MO
RTALITY
Therapeu�c medical technology
Was�ng (weight for height)
B vitamins deficiency
Envi
ronm
enta
l Pol
icy
Access to Food
Protein deficientcy
Maternal weight/height
Maternal height/age
Maternal micronutrient levels (Vit A, iodine, thiamin, riboflavin, pyridoxine, cobalamin)
Maternal Infec�ous Disease Status (HIV, Hepa��s B, Malaria)
Maternal diabetes/glycemic control
Unsafe Sexual Behavior
Tobacco use by mother/father
Alcohol use by mother/father
Illicit drug use by mother/father
Mul�ple births Maternal age at birth
Intrahousehold crowding
Household Background
Household Division of labor
Figure: Conceptual framework
Abstracts
www.thelancet.com Published online March 14, 2011 Webappendix 127
A new approach to indicator harmonisation and monitoring and evaluationPatrick Whitaker, Ramesh Krishnamurthy
AbstractBackground Monitoring and evaluation supports effective decision making and management of public health programmes. Countries need high-quality disaggregated data from many sources for this purpose. Variations in indicator definitions across organisations and the need for local customisation have been obstacles in the development of monitoring systems that can exchange indicator values. We aimed to develop an approach to decrease variations in indicator definitions across organisations and allow monitoring systems to exchange indicator values.
Methods On the basis of standards, select indicators from multiple sources were evaluated with the indicator and measurement registry (IMR) that supports indicator harmonisation at the international level and indicator customisation at the local level for data exchange. Standards for the statistical data and metadata exchange health domain (SDMX-HD) were then applied for data exchange to evaluate outcome.
Findings Preliminary analysis suggests that indicator metadata attributes vary across organisations, indicating that current harmonisation processes need strengthening. The WHO IMR, in combination with activities of subject matter reference groups and SDMX-HD, can facilitate establishment of a common indicator definitions, reducing the burden of reporting and promoting indicator adoption. Subject matter reference groups can play a critical role in defining robust and unambiguous indicator definitions, reducing the number of variant indicators in systems.
Interpretation The management of indicators has lagged behind development of systems. Interoperable systems have remained elusive. The IMR and SDMX-HD were developed by WHO to address both the issue of indicator harmonisation and indicator data exchange to promote development of monitoring and evaluation activities.
Published Online March 14, 2011
WHO, Geneva, Switzerland (P Whitaker MSMOT, R Krishnamurthy PhD)
Correspondence to: Patrick Whitaker, WHO, 1211 Geneva 27, Switzerland [email protected]
Abstracts
128 www.thelancet.com Published online March 14, 2011 Webappendix
Evaluation of the Brazilian national violence surveillance system, 2006–09Renata Tiene de Carvalho Yokota, Lenildo de Moura, Márcio Dênis Medeiros Mascarenhas, Marta Maria Alves da Silva, Deborah Carvalho Malta, Eduardo Marques Macário, Aglaêr Alves da Nóbrega
AbstractBackground Violence is an important public health problem in Brazil. In 2008, it was the fifth leading cause of death in the country. We aimed to describe and evaluate the continuous component of the Brazilian violence surveillance system from 2006 to 2009.
Methods This evaluation was based on CDC guidelines for evaluation of public health surveillance systems.
Findings From 2006 to 2008, the information system was developed in Epi-Info. In 2009, it was implemented in the information system for notifiable diseases (Sinan). It is a complex system because the reporting cities should ensure full care for the victims. The system is flexible, since the reporting form and the information system was modified once during this evaluation period, and adaptation to the information system was straightforward. The proportion of duplicated registers was 1·4% in Epi-Info and 0·5% in Sinan. 13 variables in Epi-Info and ten variables in Sinan of the 15 variables used to calculate health indicators presented excellent completeness (≥90%), demonstrating regular data quality. The system had a general acceptability, because the number of reporting cities increased from 27 (2006) to 670 (2009), but 67% reported ten or fewer violence cases in 2009. The notifications were timely (≤30 days after the occurrence date) in more than 90% of all notifications. The system presented a low level of usefulness since only half the reporting cities implemented the protection network for violence victims and 65% implemented prevention measures.
Interpretation The implementation of a new national information system for violence reporting contributed to the sustainability of the surveillance system. However, the protection network for violence victims was not implemented in all reporting cities in Brazil. The Brazilian Ministry of Health was recommended to improve the technical and financial support for the implementation of the protection network for violence victims.
Published Online March 14, 2011
Brazilian Field Epidemiology Training Programme
(FETP-EPISUS), Ministry of Health, Brasilia, Brazil
(R T de Carvalho Yokota MSc, E M Macário MS,
A Alves da Nóbrega MS); and General Coordination of
Noncommunicable Diseases and Injuries, Ministry of
Health, Brasilia, Brazil (L de Moura MPH,
M D M Mascarenhas MSH, M M Alves da Silva MS,
Prof D Carvalho Malta PhD)
Correspondence to: Renata Tiene de Carvalho
Yokota, Brazilian Field Epidemiology Training
Programme (FETP-EPISUS), Ministry of Health,
Brasilia 70070-600, Brazil [email protected]
Abstracts
www.thelancet.com Published online March 14, 2011 Webappendix 129
Comparative risk factor assessment for 11 Latin American countriesPedro Zitko-Melo, Francisco Franco-Marina, Jesús Rodríguez-García, Paula Margozzini-Maira, Héctor Gómez-Dantes, Emma Domínguez-Alonso, Azálea Espinoza-Aguirre, William Valdéz-Huarcaya, Jorge Miranda-Monzón, Rolando Enrique Peñaloza-Quintero, Victoria Castro-Borbonio, Óscar Méndez-Carniado, Rafael Lozano-Ascencio
AbstractIntroduction Comparative risk assessment (CRA) studies allow comparison of the attributable burden of risk factors in the health of populations, and aid setting of priorities for public policy. Only two Latin American countries have national CRA studies: Mexico (2005) and Chile (2007). Other studies (WHO, 2008; Global Burden of Disease, 2002) have aggregated estimation for the entire region. We aimed to estimate deaths attributable to 11 risk factors for 11 Latin American countries: Brazil, Chile, Colombia, Costa Rica, Cuba, Dominican Republic, Ecuador, Mexico, Peru, Paraguay, and Uruguay.
Methods We used the WHO tabulates of death for 2005, for all countries. We separated the causes of death (165) by ICD-10 code, sex, and eight age groups. The numbers of deaths in children younger than 5 years were corrected for all countries with CELADE life tables and the code of misclassification. Risk factors were selected by importance in the region, and by availability of national representative information about exposure measures. Outcomes, relative risks, and counterfactuals (ie, alternative distribution of exposure) for each risk factor were explicit. The selected risk factors included: alcohol use, tobacco consumption, body-mass index (BMI), glycaemia, systolic blood pressure, and insufficient physical activity. Uncertainty was included in our estimations by different procedures.
Findings We collected around 80% of the 11 risk factor exposures for all countries. Preliminary results suggested a great importance of alcohol use, especially in Dominican Republic (19·4% attributable deaths) and Brazil (17·8%). Systolic blood pressure was another important risk factor, mainly for Chile (15·4%) and Colombia (13·8%). In Mexico, BMI contributed to 14·5% of deaths. Tobacco consumption was especially important in some countries, such as Chile (9·8%).
Interpretation This is the first report developed by so many countries in Latin America to take into account national data. This study confirms the importance of cardiovascular and alcohol risk factors in Latin America, and shows specific differences between countries.
Published Online March 14, 2011
División de Planificación Sanitaria, Ministerio de Salud, Santiago, Chile (P Zitko-Melo MD); Instituto Nacional de Enfermedades Respiratorias, Mexico City, Mexico (F Franco-Marina MD); Pontificia Universidad Javeriana, Bogota, Colombia (Prof J Rodríguez-García MD, Prof R E Peñaloza-Quintero OD); Departamento de Salud Pública, Pontificia Universidad Católica de Chile, Santiago, Chile (Prof P Margozzini-Maira MD); FUNSALUD, México DF, México (H Gómez-Dantes MD, V Castro-Borbonio Lic, Ó Méndez-Carniado Lic); Instituto Nacional de Endocrinología, Havana, Cuba (E Domínguez-Alonso MD); Dirección de Vigilancia de la Salud, Ministerio de Salud, San José, Costa Rica (A Espinoza-Aguirre DS); Dirección General de Epidemiología, Minsiterio de Salud, Lima, Peru (W Valdéz-Huarcaya MD, J Miranda-Monzón MSc); and Institute for Health Metrics and Evaluation, University of Washington, Seattle, WA, USA (Prof R Lozano-Ascencio MD)
Correspondence to: Pedro Zitko-Melo, División de Planificación Sanitaria, Ministerio de Salud, Mac Iver 541, Santiago 8320064, Chile [email protected]
Copyright © 2022 FDOKUMEN