The Activation of Aging Stereotypes in Younger and Older Adults

Fat Finger Worries:How Older and Younger UsersPhysically Interact with PDAs
Katie A. Siek, Yvonne Rogers, and Kay H. Connelly
Indiana University, Bloomington, IN 47405, USA{ksiek, yrogers, connelly}@indiana.edu
Abstract. There has been a steady growth in the global population of elderlypeople, challenging researchers in the HCI community to design technologiesto help them remain independent and preserve their quality of life. One approachhas been to create assistive technology solutions using Personal Digital Assistants(PDAs). However, some have questioned whether older people can use PDAs be-cause of age related problems with dexterity, coordination, and vision. This pa-per presents an initial usability study that shows there are no major differences inperformance between older and younger users when physically interacting withPDAs and completing conventional (e.g. pressing buttons, viewing icons, record-ing messages) and non-conventional tasks (e.g. scanning bar codes).
1 Introduction
Each month, the world’s elderly population grows by 795,000. By the year 2030, theworld’s older population will grow by 847,000 per month [1]. Researchers in the HCIcommunity have taken notice of this trend and are working on applications to helpolder people live independent and productive lives. Personal Digital Assistants (PDAs)[2, 3] and smart phones [4] are some of the devices researchers use to create assistivetechnologies for older people. Our research is concerned with how PDAs can be usedas personal aids for health informatics, in particular, for helping older people who haveend-stage renal disease (ESRD) monitor their nutrition more effectively.
When we started our nutrition monitoring project, we were cautioned that olderpeople may not be able to use PDAs given the adverse effects age can have on vision,dexterity, and coordination [5, 6]. If elderly populations have difficulties using tradi-tional personal computers (PCs), as has been found in some studies, how will they farewhen interacting with the smaller screen and buttons of a PDA? The lack of literatureavailable on how elderly physically interact with PDAs led us to conduct an initial studyto see if there were any differences between older and younger people when physicallyinteracting with PDAs.
In this paper, we present the findings from our study investigating whether elderlypeople (75-85 years old) have problems using PDAs. As a control to compare olderpeople with, a group of younger people (aged 25-30 years old) participated in the study.Participants were asked to complete three conventional PDA tasks (e.g. pushing buttons,viewing icons, and recording voice messages) and two additional tasks (e.g. scanningbar codes with two kinds of scanners). The scanning tasks were included in the study to
M.F. Costabile and F. Paterno (Eds.): INTERACT 2005, LNCS 3585, pp. 267–280, 2005.c© IFIP International Federation for Information Processing 2005

268 K.A. Siek, Y. Rogers, and K.H. Connelly
(1) determine how easy it is to input nutrition information that is found on food itemsand (2) give insight into how older people would perform on other less familiar PDAtasks, such as taking digital pictures with the device.
The findings from our initial study suggest that older people completed the tasksnearly as well as younger participants. While older people needed more practice beforecompleting each task, their performance was similar to the younger participants.
We begin with a review of related work. The technology, applications, and evalua-tion techniques we used in the study are discussed in Section 3. In Section 4, we discussthe user study and evaluate the results. We conclude with a discussion of the results andideas for future work.
2 Related Work
There has been a proliferation of handheld devices designed for the general public,including PDAs, cell phones, remote controls, digital cameras, digital music players,and game playing devices. The interfaces to these vary considerably, suggesting theremay be variable age-related performance effects. Hence, when creating applicationsfor older populations that run on these devices, there is a need to consider age-relatedabilities such as vision, dexterity, coordination, and cognition. HCI researchers haveacknowledged that within older populations, there are noticeable differences in abilitiesand that different design methodologies such as Universal Design [7] and User SensitiveInclusive Design [8] should be used. Here we discuss some of the research that has beendone to better understand older populations interaction with technology.
Bernard et al. found that older people could read faster with a larger, more legi-ble 14-point san serif font on web sites [9]. Researchers at Georgia Tech studied howmultimodal feedback (sound, touch, visual effect) could assist participants with varyingvision problems perform basic mouse tasks (drag and drop). They found that all groupsperformed better when sound was added, however groups performed the best when allthree modal feedbacks were implemented [10].
A number of recent studies [11, 12, 13, 14] focused on the ability of older popu-lations to use PC input devices. The studies showed that older people completed tasksmore slowly when compared to younger groups. Charness et al. evaluated control key,mouse, and light pen input devices and found older people preferred the light pen fol-lowed by the mouse and control keys [13].
Smith et al. and Laursen et al. found older people made more mistakes than youngerpeople and had the most difficulty with fine motor control tasks such as double clicking.However, Chaparro et al. found older people performed “point and click” and “click anddrag” tasks slower than younger people, but with the same amount of accuracy. Theresearchers deduced that older people were slower because of the reduced fine motorcontrol, muscle strength, and pincher strength associated with older age.
Most of the human computer interaction studies on elderly and technology havefocused on the usability of PCs. As pervasive computing technology applications be-come more widespread, the usability of handheld devices will be scrutinized more care-fully. Researchers are already assessing the needs of older people with respect to mo-bile phones. Maguire and Osman found that older people primarily considered mobile

Fat Finger Worries: How Older and Younger Users Physically Interact with PDAs 269
phones as a way to assist in emergencies, whereas younger people saw mobile phonesas a way to interact socially. Older people were interested in small phones with largebuttons and location aware systems [15].
Abascal and Civit looked at the pros (safety, increased autonomy, etc.) and cons (so-cial isolation, loss of privacy, etc.) of older people using mobile phone technologies andgave a needs assessment [7]. The pros and cons apply to assistive PDA solutions as well,however the needs assessments differ because PDAs have larger physical interfaces anddifferent input mechanisms.
Smith et al. and Maguire and Osman suggested voice input could assist with dif-ficulties older users have with mouse and mobile phone input. Using PDAs for voicerecordings is becoming a popular way to get user feedback in situ. For example, In-tille et al. integrated voice recordings into their context-aware experience sampling toolfor PDAs to obtain feedback from participants [16]. The natural decrease in pincherstrength [17] and difficulty maintaining constant force [18] that accompanies old agemay hinder older populations from using voice input technologies.
The findings from these studies suggest that there may be performance differencesfor older people when using small handheld devices. They may find it hard to manipu-late small buttons that are close to one another and read small icons on a screen. PDAShave been designed to allow users to select from two size icons and input informationusing other kinds of devices besides keypads, keyboards, and mice (e.g. bar code scan-ners, touch screen). The aim of our study was to assess PDA input mechanisms that donot involved mouse movement or the cognitive mapping between mouse pad coordi-nates and screen position. PDAs also have the advantage of being all-in-one devices -users can input commands and view output on the same devices. We also wanted to seeif older people could successfully record voice messages using a PDA.
In particular, the goal of our usability study was to see whether vision, dexterity,and coordination effects transfer to PDAs or whether the ergonomic design of PDAs isadequately “large” enough to enable older populations who may have more dexterity,coordination, and vision problems. The specific aims were to:
– Compare performance between older and younger participants performing conven-tional (pushing buttons, viewing icons, and recording voice messages) and non-conventional (scanning bar codes with two different types of scanners) tasks
– Study how older and younger participants physically interact with PDAs (e.g. howthey hold the device, how far away they hold the device, etc.) to understand anydifficulties participants may have completing PDA tasks
3 Experiment Design
In this section, we discuss why we selected the Tungsten T3 PDA, Socket SDIO scannerand Baracoda pencil as our scanners, and how we developed the usability tasks. Detailedinformation about the experimental design can be found in our full report [19].
3.1 Hardware
PDA Selection PDAs are the center of our study and the building block of many per-vasive computing applications. Most HCI PDA applications use off-the-shelf PDAs to

270 K.A. Siek, Y. Rogers, and K.H. Connelly
make their application more widely accessible and less expensive. The physical designof PDAs are similar because they have small screens with five buttons. The middlebutton is usually larger than the other four and (in newer models) is a 5-way naviga-tor buttons. The 5-way navigator buttons allow users to scroll through applications anddocuments with one hand. We conducted the study with an off-the-shelf PDA so theresults would be useful to the HCI community. We chose the Tungsten T3 because ithas a 5-way navigator button, four large application buttons, Bluetooth, an SDIO slot,and a voice recorder.
Fig. 1. Usability test tasks: (L-R) button press, icon size, Socket scanning, and Baracoda scanning
Scanner Selection A scanner needs to be small, easy to use, and robust for integrationinto HCI applications. We found two scanners that met our criteria - Socket SDIO cardscanner and the Baracoda pencil. To operate the Socket scanner, users press the prede-fined PDA scanning button and line up the scanning light with the bar code as shownin Figure 1. The PDA beeps and shows the bar code number on the screen when usershave successfully scanned the bar code. To operate the Baracoda pencil scanner, userspress a button on the side of the Baracoda pencil and run the pencil tip over the barcode as shown in Figure 1. The users must look at the PDA screen to see if they havesuccessfully scanned the bar code.
3.2 Designing the Applications
People must have a basic level of dexterity, coordination, and vision to use a PDA.We tested these three aspects by asking people to complete a set of tasks summarizedin Table 1. The tasks were designed to measure primarily motor control, rather than
Table 1. Types of tasks and the characteristics needed to successfully complete the task
Type of Task Ability Needed To Complete TaskPush PDA buttons DexteritySelecting an icon VisionRecording a voice diary entry Dexterity & CoordinationSocket Scanning bar code Dexterity & CoordinationPencil Scanning bar code Dexterity & Coordination

Fat Finger Worries: How Older and Younger Users Physically Interact with PDAs 271
mental effort. We chose not to investigate stylus input because we considered it mightbe too intimidating for first-time users (e.g. learning graffiti). In this section, we discusshow we designed and evaluated the five different input tasks.
PDA Button Press Task. We tested whether participants could press buttons on the PDAbecause buttons are the primary input method for accessing applications and scrollingthrough data. We developed an event-driven test modeled after the 1980’s Simon Saysgame, shown in Figure 2, to test the ability to press buttons. The picture on the PDAscreen showed the same configuration of buttons as the buttons on the Tungsten T3.The buttons take turns “lighting up” by turning red until the participant selects thecorresponding button on the PDA. The task tests if the participant can press each of thenine Tungsten T3 buttons once (four buttons and each of the 5-way navigator buttons).Errors (e.g. if a participant pushes the incorrect button) were recorded as shown onthe last screen image in Figure 2. We also recorded how far away the participant heldthe PDA and what hands and or fingers the participant used to complete the task. Weexamined how participants held the PDA to see how comfortable the participants wereinteracting with the device.
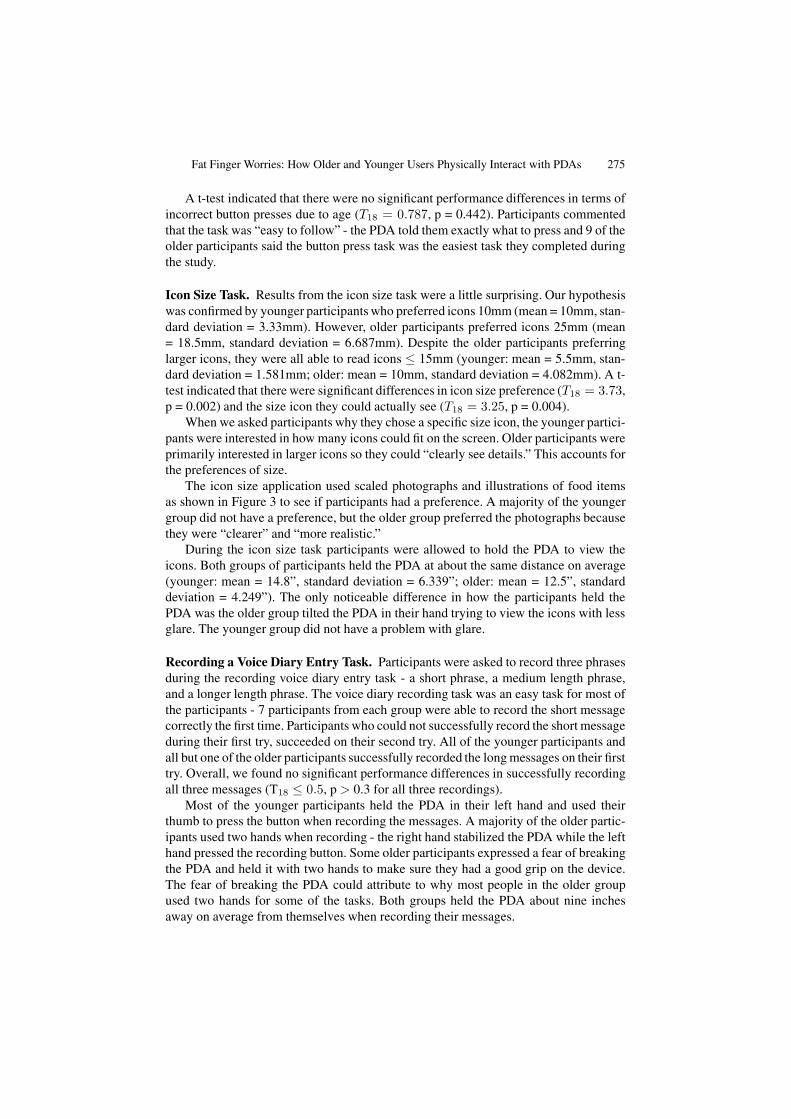
Icon Size Task. Icons are used to select PDA applications from the main menu and nav-igate within applications. Moreover, icons can convey information to users independentof literacy skills. We created a task similar to an eye exam chart, shown in Figure 3,to test what size icons participants prefer to use (vision). Icon sizes ranged from 5mmto 25mm. Current PDA icons are 7.76mm or 5.29mm square depending on the layout
Fig. 2. Button Press Task. The last screen indicates the errors that were made.
Fig. 3. Icon Size Task. From left to right: 5mm, 10mm, 15mm, 20mm, and 25mm screens.

272 K.A. Siek, Y. Rogers, and K.H. Connelly
chosen [20]. When the task was started, a screen with four 15mm icons was displayed.The participant was asked to read the pictures on the screen. We increased or decreasedthe size of the icons based on the participants answers. The task concluded by record-ing what size icons the participants preferred, the smallest icon size the participantscould read, how far the participants held the PDA from them, and if they had a prefer-ence between the realistic pictures or the illustrated drawing icons. We noted preferredicon size and what sizes the participants could read to see if there were any noticeabledifferences between their preference and vision.
Recording a Voice Diary. For this task, we asked participants to record comments andquestions to see how the participants created voice diaries. To do this requires pressingthe record button on the side of the PDA, waiting for a beep, and then continuing to holdthe button down while recording a voice diary. We asked participants to record threephrases - a short phrase (approximately 1 second), a medium length phrase (approxi-mately 5 seconds), and a longer phrase (approximately 15-20 seconds) . After recordingeach phrase, the participants were asked to play it back. If the participants did not recordthe message properly, they could try recording the phrase again. We recorded how manytimes participants successfully recorded each phrase, if the participants waited for thebeep before saying each phrase (learning), how far the participants held the PDA awayfrom them, and any difficulties the participants had finding the recording button.
Scanning Items. Scanning bar codes is an easy input mode that does not require inten-sive cognitive effort to choose items from a menu. However, participants must have areasonable level of manual dexterity and coordination to scan an object because partic-ipants must hold the scanner steady (dexterity) and work with two objects - the scannerand object being scanned (coordination). For the usability test, participants were askedto scan three items: a book, a small bag of pretzels, and a can of soda. Participants hadto hold each item differently because the properties varied among items (e.g. one washard, another mushy, and the other curvy and reflective). We were interested in seeinghow the physical properties of the object affected their ability to scan the items. Werecorded how many times it took participants to successfully scan each item, if the par-ticipants moved the PDA or object being scanned, and how many times they practicedscanning an item after successfully scanning an item the first time.
4 PDA Usability Study
The study required the participants to complete a set of tasks testing their ability to usePDA buttons, view icons, record a message, and scan items with two types of scanners.Younger participants were tested in a meeting room in an academic building. Olderparticipants were tested in a meeting room in an assisted living community building.
4.1 Hypotheses
Based on the literature that showed elderly people can use PCs equally, we hypothesizedthat there would be no difference between the two age groups. We predicted that:

Fat Finger Worries: How Older and Younger Users Physically Interact with PDAs 273
– Participants of all ages can press buttons on the PDA.– Participants of all ages prefer medium size (10mm or 15mm) icons.– Participants can record voice messages of various lengths.– Participants can scan bar codes with some practice.
4.2 Participants
Twenty participants volunteered for the study. The control group consisted of ten par-ticipants 25-30 years old (two female, eight male). The older group had ten participants75-85 years old (five female, five male). We chose a younger group to compare themwith as they have normal dexterity, vision and coordination and therefore, would beable to use PDAs with ease.
Sixteen participants reported using computers a lot. Younger participants used com-puters primarily for word processing, emailing, and Internet searches. Older participantsused computers primarily for emailing and viewing images. We asked how often andwhat kind of applications participants used to get a more accurate measure on computerexperience (scaled 0-3: 0 - not at all; 1- not often with 1 application; 2 - sometimes with1-2 applications; and 3 - often with various applications). We found participants hadsimilar computer experience (T18 = 1.24, p = 0.232).
None of the participants in the two groups owned a PDA. However, three youngerparticipants reported they had some experience with PDAs (e.g. occasionally playedwith a friend’s PDA by playing a game or drawing a picture).
All of the older participants and over half of the younger participants wore glasseswhen using a computer, but did not report any problems reading computer screens.None of the participants had problems using television remote controls. Over threequarters of the younger participants and three of the older participants used cell phoneswithout any difficulty.
4.3 Design and Procedure
Participants completed the five tasks without any time constraints. We did not enforceany maximum amount of viewing time because we wanted the participants to feel com-fortable reading the icons and avoid the stress associated with timed events. Laursen etal. found placing time constraints on older people increase the number of errors [14].Each participant was given a task sheet describing what to do for each task. We letparticipants hold the PDA for each task as shown in Figure 1.
Since both groups had experience pushing small buttons on cell phones and remotecontrols, we allowed participants only one chance to complete the button press task. Inaddition, the button press task gave us insight into how intuitive it was for participantsto hold the PDA.
For the icon size task, participants held the PDA and moved the PDA to see the iconsclearly. The task administrator or participant changed the size of the icons by pressingPDA buttons.
During the voice diary task, participants read aloud three phrases printed on the tasksheet. Participants played back their recording to ensure they successfully recorded themessages. Participants recorded each phrase as many times as they wanted.

274 K.A. Siek, Y. Rogers, and K.H. Connelly
During the scanning tasks, participants scanned the bar codes on three items: a book,a small bag of pretzels, and a can of soda. Participants scanned each object as manytimes as they wanted so they could practice and become familiar with the scanningdevice. They were encouraged to start the task by scanning the book, then the bag ofpretzels, and finally the soda can because each item was increasingly difficult to scanbased on bar code material and object size.
At the end of the tasks, we discussed the comments the participants made duringthe study.
4.4 Findings
As predicted, the key findings from our study were that:
– There were no differences in performance between the older and younger groupsfor the button press and voice recording task.
– We also found some small differences between the two groups: The younger par-ticipants preferred smaller icons (5mm or 10mm), whereas the older participantspreferred larger icons (20mm).
– The older participants scanned items more with both scanners, but had the samesuccess rate as younger participants.
In this section, we look in more detail at the results for each task. The results are pre-sented in the order the tasks were completed - button press, icon size, voice recording,Socket SDIO scanning, and Baracoda pencil scanning.
Button Press Task. The button press results supported our hypothesis by showing nosignificant performance differences between older and younger participants - 8 partic-ipants from each group did not make any mistakes during the task. All participantsvoiced some confusion over the 5-way navigator button. The button press task startedby making participants press the middle of the 5-way navigator button, thus participantsknew the 5-way navigator button was different than the other buttons. When participantssaw the up or down part of the 5-way navigator light up they made comments about howthe navigator is an “up and down” button. However, when the left and right part of the5-way navigator lit up, participants voiced some concerns. Most participants followedtheir instincts and pressed the left or right part of the large navigation button, but threeparticipants pressed the incorrect button. The participants who pressed the incorrectbutton learned quickly from their mistakes.
The older male participants voiced concerns about how their “fat fingers” may causeproblems when completing the task. They worried that the size of their fingers wouldcause them to push multiple buttons at the same time. However, the “fat finger” problemwas not supported since not many errors were recorded during the task. As previouslystated, the only errors were caused by the 5-way navigator button.
Most of the participants held the PDA in their non-dominant hand and selectedbuttons with their dominant hand. Only three younger participants completed the taskby using one hand to hold the PDA and select buttons. This was the first task participantscompleted with the PDA, thus they were not as comfortable with holding the PDA.
Fat Finger Worries: How Older and Younger Users Physically Interact with PDAs 275
A t-test indicated that there were no significant performance differences in terms ofincorrect button presses due to age (T18 = 0.787, p = 0.442). Participants commentedthat the task was “easy to follow” - the PDA told them exactly what to press and 9 of theolder participants said the button press task was the easiest task they completed duringthe study.
Icon Size Task. Results from the icon size task were a little surprising. Our hypothesiswas confirmed by younger participants who preferred icons 10mm (mean = 10mm, stan-dard deviation = 3.33mm). However, older participants preferred icons 25mm (mean= 18.5mm, standard deviation = 6.687mm). Despite the older participants preferringlarger icons, they were all able to read icons ≤ 15mm (younger: mean = 5.5mm, stan-dard deviation = 1.581mm; older: mean = 10mm, standard deviation = 4.082mm). A t-test indicated that there were significant differences in icon size preference (T18 = 3.73,p = 0.002) and the size icon they could actually see (T18 = 3.25, p = 0.004).
When we asked participants why they chose a specific size icon, the younger partici-pants were interested in how many icons could fit on the screen. Older participants wereprimarily interested in larger icons so they could “clearly see details.” This accounts forthe preferences of size.
The icon size application used scaled photographs and illustrations of food itemsas shown in Figure 3 to see if participants had a preference. A majority of the youngergroup did not have a preference, but the older group preferred the photographs becausethey were “clearer” and “more realistic.”
During the icon size task participants were allowed to hold the PDA to view theicons. Both groups of participants held the PDA at about the same distance on average(younger: mean = 14.8”, standard deviation = 6.339”; older: mean = 12.5”, standarddeviation = 4.249”). The only noticeable difference in how the participants held thePDA was the older group tilted the PDA in their hand trying to view the icons with lessglare. The younger group did not have a problem with glare.
Recording a Voice Diary Entry Task. Participants were asked to record three phrasesduring the recording voice diary entry task - a short phrase, a medium length phrase,and a longer length phrase. The voice diary recording task was an easy task for most ofthe participants - 7 participants from each group were able to record the short messagecorrectly the first time. Participants who could not successfully record the short messageduring their first try, succeeded on their second try. All of the younger participants andall but one of the older participants successfully recorded the long messages on their firsttry. Overall, we found no significant performance differences in successfully recordingall three messages (T18 ≤ 0.5, p > 0.3 for all three recordings).
Most of the younger participants held the PDA in their left hand and used theirthumb to press the button when recording the messages. A majority of the older partic-ipants used two hands when recording - the right hand stabilized the PDA while the lefthand pressed the recording button. Some older participants expressed a fear of breakingthe PDA and held it with two hands to make sure they had a good grip on the device.The fear of breaking the PDA could attribute to why most people in the older groupused two hands for some of the tasks. Both groups held the PDA about nine inchesaway on average from themselves when recording their messages.

276 K.A. Siek, Y. Rogers, and K.H. Connelly
Socket SDIO Scanning Task. The older group was more successful in scanning thebook on the first try than the younger group (50% versus 40% success rate). Nineyounger and 10 older participants were able to scan the book in less than four attempts.Younger participants were able to scan the bag of pretzels on the first try better thanolder participants (60% versus 50% success rate). All of the participants were able toscan the the bag of pretzels eventually. The can of soda was the most difficult item toscan - only 4 of the younger participants and 2 of the older participants were able to scanthe can within three tries. Overall, we found no significant performance differences inall three scannings (book: T18 = 0.958, p = 0.351; bag: T18 = 0.247, p = 0.808; can:T11 = 1.30, p = 0.221).
We observed how practice affects scanning success when we compared the num-ber of successful book scans participants completed before trying to scan the bag ofpretzels. Younger participants who practiced successfully scanning the book 3-8 timeswere able to scan the bag of pretzels more quickly (successfully scanned bag after1.6 attempts) than those who only practiced successfully scanning the book 1-2 times(successfully scanned bag after 2.6 attempts). Half the younger and older participantspracticed scanning the book three or more times before trying to scan the bag. We didnot find any relation between overall scanning practice and the ability to successfullyscan the soda can. The soda can was an especially challenging item to scan because ofits curved edges and reflective material.
Most participants operated the scanner with one hand, using their thumb to pressthe scanning button on the PDA. The older participants liked the multimodal feedbackthe scanner provided. They used the scanner light to indicate the distance needed fora successful scan and the beep as a way of ensuring they were successful scanningthe bar code. All of the participants exhibited some confusion on what part of the barcode to scan (numbers or lines) and what direction to scan the bar code (sweepingvertically or shine the scanner light across the bar code). When scanning items, olderpeople kept the scanner still and moved the item being scanned, whereas the youngerpeople moved scanner and kept the item stationary. Even though the older participantscompleted 66% more scans (successful and unsuccessful) than the younger group, theywere not frustrated by the activity and felt they did the best they could.
Baracoda Pencil Scanning Task. The Baracoda pencil scanner task was the mostdifficult task. Only two younger participants and one older participant successfullyscanned the book on the first attempt. On average, younger participants attempted toscan the book more than older participants (4.2 times versus 3.3 times) before success-fully scanning the bar code on the book. A t-test indicated that there were no significantperformance differences due to age when scanning the book (T17 = 0.430, p = 0.672).
Additionally, older participants attempted to scan the bag of pretzels more thanthe younger participants before giving up (15.4 times versus 8.8 times). Only threeparticipants were able to successfully scan the bag of pretzels. Participants inability toscan the bag of pretzels and soda can simply shows the limitations of the device.
Two female participants had difficulty scanning with the Baracoda pencil becausethe length of their nails (the length of nails ranged from an 1
8” to 14”) inhibited them from
depressing the narrow button fully. Female participants held the pencil precariouslyand used the tip of their nail to press the button. Older participants usually pressed the

Fat Finger Worries: How Older and Younger Users Physically Interact with PDAs 277
scanner button, reflected the scanner light on their hand, and then scanned the item.They commented that they wish they could see the scanner light while scanning.
Scanning with the Baracoda pencil scanner required the use of a pencil scannerand the PDA. The PDA did not give any audible feedback on successful scans, thusparticipants had to check the PDA screen to see if they had successfully scanned theobject. Participants rested the PDA and item on the table when scanning. From ourobservations, it appears that the Baracoda pencil scanner would be difficult to use whilestanding or moving.
5 Discussion
The results of our preliminary study supported our null hypotheses. Concerns that olderparticipants would have difficulty pressing the PDA buttons because of decreases indexterity with age or the similarity of the layout between PDA buttons and PC controlkeys [13] were unfounded. Similar to the study by Chaparro et al., we found that olderparticipants were able to select the correct button (fine motor control) and push the but-ton while holding the PDA (pincher strength) with the same accuracy as younger par-ticipants [12]. We also found no difference between age groups: both older and youngerparticipants performed at the same level in the button press task.
Participants preference for icon size was the only hypothesis that was rejected -younger participants preferred smaller icons (5mm or 10mm) and older participantspreferred larger icons (20mm). The older participants preferred larger icons in com-parison with the younger participants because it was easier to see the details. Youngerpeople are also more familiar with distinguishing small graphical images from variousapplications they use. Our findings are similar to those reported by Czaja and Lee wholooked at numerous PC studies on vision and the elderly [21]. During the icon size task,we noted that older people tilted the PDA to view the icons with less glare. Older peo-ple’s sensitivity to glare was also recorded in a study by Kosnik et al. [5]. The icon sizetask showed us a one-size-fits all approach to developing PDA applications does notwork. Current PDA applications offer two different size icons, but both of these sizesare smaller than the preferences of our two groups.
Similar to the button press results, assumptions that older participants may not doas well recording a message because of age related difficulty maintaining a constantpincher force [18] were not evident in our study. Older and younger participants wereable to record voice messages with similar performance rates. The difference in how thetwo groups held the PDA (two hands for older participants and one hand for youngerparticipants) could be attributed to grip strength. Mathiowetz et al. found high corre-lations between grip strength in age and observed that younger people had over 50%more grip strength than older people in our age groups [17]. Our participants showedthat they could hold down the recording button (dexterity) while interacting with thePDA (coordination).
All of the participants were capable of scanning bar codes with some practice us-ing the Socket SDIO scanner with no major differences in performance. Participantsshowed that they could hold the PDA steady (dexterity) while interacting with the PDAand object being scanned (coordination). Older participants liked the multimodal feed-back (sound, visual effect) the PDA made when participants successfully scanned a bar

278 K.A. Siek, Y. Rogers, and K.H. Connelly
code. Jacko et al. found that people in various age groups performed PC input tasks bet-ter with multimodal feedback (sound, touch, visual effect) [10]. Similar to PCs, PDAshave the ability to emit sound, vibrations, and visual feedback to assist participantsperform better.
When we selected scanners for the study, we based our selection on product docu-mentation and reviews. Our study showed the Baracoda pencil’s scanning (inability toscan a bag of pretzels and can of soda efficiently) and usability (small button made itdifficult to scan with longer nails) limitations. The Baracoda pencil scanner was equallyhard for both participants. In future studies we will discontinue the use of the Baracodapencil and add other tasks such as standing or walking when completing tasks.
This was the first time the participants had used a PDA for an extended periodof time. We surmise with more practice, the participants would be able to easily scanall three items. Application developers can learn from our study: (1) older people cancomplete conventional and non-conventional PDA tasks and (2) applications for a widerange of participants need more icon sizes to select from to ensure universal usability.
The study investigated whether elderly people can physically interact with PDAs aswell as younger people. Gick et al. found that the performance of younger and olderpeople are similar when cognitive tasks are not complex [22]. We designed the tasksto emphasize motor control, not mental effort. Thus, we conclude that the participantsare performing at similar levels because older participants can physically interact withPDAs at the same level as young novice PDA participants.
6 Future Work
In the future we would like to test more participants and investigate cognitive orientedtasks. We would also like to recruit 25-30 year old people from outside of the universityand 75-85 year old people who live on their own or live in a public assisted livingfacilities instead of private assisted living facilities to diversify the participant pool.
Other avenues of research could include having participants stand and walk dur-ing tasks. Testing participants while standing and walking may affect icon size pref-erence [23] and the ability to find and push correct buttons for the button press andvoice recording applications. Scanning bar codes may also become more difficult whenstanding because participants will not have anything to balance their arm or the item onwhen scanning the bar code. Scanning bar codes while standing is important for us toevaluate because participants using our nutritional monitoring application must be ableto input data anywhere - standing while preparing food, buying a can of soda from amachine, etc.
7 Conclusion
Researchers in the HCI community question whether older people can use PDAs giventhat they can have reduced vision, dexterity, and coordination. Our findings showed thisnot to be true: older participants can physically interact with PDAs the same as youngerparticipants, with no major impediments. Our results can be used as a guidelines forcreating applications for diverse age groups.

Fat Finger Worries: How Older and Younger Users Physically Interact with PDAs 279
Acknowledgments
We would like to thank the participants from Bell Trace Senior Living Community,Meadowood Retirement Community, and Indiana University. Katie Siek is supportedin part by a NPSC fellowship and Sandia National Laboratories/CA. This work wassupported by NSF grant EIA-0202048 and by a grant from the Lilly Endowment. Wewould like to thank Dorrie Hutchinson, Yu-Hsiu Li, and Kelli Gehlhausen for their helpduring usability testing. The authors would like to thank Jeremy Siek and the refereesfor their careful reading of this paper and for their well-considered comments.
References
1. Kinsella, K., Velkoff, V.A.: An aging world: 2001. Technical report, U.S. Dept. of Healthand Human Services, National Institutes of Health, National Institute on Aging, U.S. Dept.of Commerce, Economics and Statistics Administration, and U.S. Census Bureau (2001)
2. Carmien, S., Gorman, A.: Creating distributed support systems to enhance the quality of lifefor people with cognitive disabilities. In: UbiHealth 2003. (2003)
3. Coroama, V., Rothenbacher, F.: The chatty environment - providing everyday independenceto the visually impaired. In: UbiHealth 2003. (2003)
4. Helal, S., Giraldo, C., Kaddoura, Y., Lee, C.: Smart phone based cognitive assistant. In:UbiHealth 2003. (2003)
5. Czaja, S.J.: Computer technology and the older adult. In Helander, M., Landauer, T., Prabhu,P., eds.: Handbook of Human-Computer Interaction. 2nd edn. Elsevier Science, B.V. (1997)797–812
6. Faye, E.E., Stappenbeck, W.: Normal changes in the aging eye.http://www.lighthouse.org/aging eye normal.htm (2000)
7. Abascal, J., Civit, A.: Universal access to mobile telephony as a way to enhance the au-tonomy of elderly people. In: Proceedings of the 2001 EC/NSF Workshop on UniversalAccessibility of Ubiquitous Computing: Providing for the Elderly. (2001)
8. Newell, A., Gregor, P.: Accessibility and interfaces for older people - a unique, but manyfaceted problem. In: EC/NSF Workshop on Universal Accessibility of Ubiquitous Comput-ing: Providing for the Elderly. (2001)
9. Bernard, M., Liao, C., Mills, M.: The effects of font type and size on the legibility andreading time of online text by older adults. In: CHI 2001. (2001)
10. Jacko, J., Scott, I., Sainfort, F., Barnard, L., Edwards, P., Emery, V., Kongnakorn, T.,Moloney, K., Zorich, B.: Older adults and visual impairment: What do exposure times andaccuracy tell us about performance gains associated with multimodal feedback? In: CHI2003. (2003)
11. Smith, M., Sharit, J., Czaja, S.: Age, motor control, and the performance of computer mousetasks. Human Factors 41 (1999) 389–396
12. Chaparro, A., Bohan, M., Fernandez, J., Choi, S.: The impact of age on computer inputdevice - psychophysical and psychological measures. International Journal of Industrial Er-gonomics 24 (1999) 503–513
13. Charness, N., Bosman, E., Elliott, R.: Senior-friendly input devices: Is the pen mightierthan the mouse? In: 103rd Annual Convention of the American Psychological AssociationMeeting, New York (1995)
14. Laursen, B., Jensen, B., Ratkevicius, A.: Performance and muscle activity during computermouse tasks in young and elderly adults. European Journal of Applied Physiology 25 (2001)167–183

280 K.A. Siek, Y. Rogers, and K.H. Connelly
15. Maguire, M., Osman, Z.: Designing for older inexperienced mobile phone users. In Stephani-dis, C., ed.: Proceedings of HCI International 2003, Mahwah, New Jersey, Lawrence ErlbaumAssociates (2003) 22–27
16. Intille, S.S., Tapia, E.M., Rondoni, J., Beaudin, J., Kukla, C., Agarwal, S., Bao, L., Larson,K.: Tools for studying behavior and technology in natural settings. In Dey, A.K., Schmidt,A., McCarthy, J.F., eds.: UbiComp 2003: Ubiquitous Computing, Springer (2003) 157–174
17. Mathiowetz, V., Kashman, N., Volland, G., Weber, K., Dowe, M., Rogers, S.: Grip and pinchstrength: Normative data for adults. Arch Phys med Rehabil 66 (1985) 69–72
18. Galganski, M., Fuglevand, A., Enoka, R.: Reduced control of motor output in a human handmuscle of elderly subjects during submaximal contractions. Journal of Neurophysicology 69(1993) 2108–2115
19. Moor, K.A., Connelly, K.H., Rogers, Y.: A comparative study of elderly, younger, and chron-ically ill novice pda users. Technical Report TR 595, Indiana University (2004)
20. Rhodes, N., McKeehan, J.: Palm OS Programming. 2nd edn. O’Reilly (2002)21. Czaja, S.J., Lee, C.C.: 21: Designing Computer Systems for Older Adults. In: The Hu-
man Computer Interaction Handbook: Fundamentals, Evolving Technologies, and EmergingApplications. Lawrence Erlbaum Associates, Mahwah, NJ (2003) 413–425
22. Gick, M., F.I.M. Craik, R.M.: Task complexity and age differences in working memory.Memory and Cognition 16 (1988) 353–361
23. Hall, A., Cunningham, J., Roache, R., Cox, J.: Factors affecting performance using touch-entry systems: tactual recognition fields and systems accuracy. Journal of Applied Psychol-ogy 73 (1988) 711–720
Copyright © 2022 FDOKUMEN