Overview of the inorganic and organic composition of size-segregated aerosol in Rondônia, Brazil,...
35
Overview of the inorganic and organic composition of size-segregated aerosol in Rondo ˆnia, Brazil, from the biomass-burning period to the onset of the wet season Sandro Fuzzi, 1 Stefano Decesari, 1 Maria Cristina Facchini, 1 Fabrizia Cavalli, 1 Lorenza Emblico, 1 Mihaiela Mircea, 1 Meinrat O. Andreae, 2 Ivonne Trebs, 2 Andra ´s Hoffer, 2 Pascal Guyon, 2 Paulo Artaxo, 3 Luciana V. Rizzo, 3 Luciene L. Lara, 3 Theotonio Pauliquevis, 3 Willy Maenhaut, 4 Nico Raes, 4 Xuguang Chi, 4 Olga L. Mayol-Bracero, 5 Lydia L. Soto-Garcı ´a, 5 Magda Claeys, 6 Ivan Kourtchev, 6 Jenny Rissler, 7 Erik Swietlicki, 7 Emilio Tagliavini, 8,9 Gal Schkolnik, 10 Alla H. Falkovich, 10 Yinon Rudich, 10 Gilberto Fisch, 11 and Luciana V. Gatti 12 Received 5 October 2005; revised 17 March 2006; accepted 10 July 2006; published 6 January 2007. [1] The aerosol characterization experiment performed within the Large-Scale Biosphere- Atmosphere Experiment in Amazonia–Smoke, Aerosols, Clouds, Rainfall and Climate (LBA-SMOCC) field experiment carried out in Rondo ˆnia, Brazil, in the period from September to November 2002 provides a unique data set of size-resolved chemical composition of boundary layer aerosol over the Amazon Basin from the intense biomass- burning period to the onset of the wet season. Three main periods were clearly distinguished on the basis of the PM 10 concentration trend during the experiment: (1) dry period, with average PM 10 well above 50 mgm 3 ; (2) transition period, during which the 24-hour-averaged PM 10 never exceeded 40 mgm 3 and never dropped below 10 mgm 3 ; (3) and wet period, characterized by 48-hour-averaged concentrations of PM 10 below 12 mgm 3 and sometimes as low as 2 mgm 3 . The trend of PM 10 reflects that of CO concentration and can be directly linked to the decreasing intensity of the biomass-burning activities from September through November, because of the progressive onset of the wet season. Two prominent aerosol modes, in the submicron and supermicron size ranges, were detected throughout the experiment. Dry period size distributions are dominated by the fine mode, while the fine and coarse modes show almost the same concentrations during the wet period. The supermicron fraction of the aerosol is composed mainly of primary particles of crustal or biological origin, whereas submicron particles are produced in high concentrations only during the biomass-burning periods and are mainly composed of organic material, mostly water-soluble, and 10% of soluble inorganic salts, with sulphate as the major anion. Size-resolved average aerosol chemical compositions are reported for the dry, transition, and wet periods. However, significant variations in the aerosol composition and concentrations were observed within each period, which can be classified into two categories: (1) diurnal oscillations, caused by the diurnal cycle of the boundary layer and the different combustion phase active during day (flaming) or night (smouldering); and (2) day-to-day variations, due to alternating phases of relatively wet and dry conditions. In a second part of the study, three subperiods representative of the JOURNAL OF GEOPHYSICAL RESEARCH, VOL. 112, D01201, doi:10.1029/2005JD006741, 2007 Click Here for Full Articl e 1 Institute of Atmospheric Sciences and Climate, National Research Council, Bologna, Italy. 2 Biogeochemistry Department, Max Planck Institute for Chemistry, Mainz, Germany. 3 Instituto de Fisica, Universidade de Sa ˜o Paulo, Sa ˜o Paulo, Brazil. 4 Department of Analytical Chemistry, Institute for Nuclear Sciences, Ghent University, Ghent, Belgium. 5 Institute for Tropical Ecosystem Studies, University of Puerto Rico, San Juan, Puerto Rico, USA. 6 Department of Pharmaceutical Sciences, University of Antwerp, Antwerp, Belgium. Copyright 2007 by the American Geophysical Union. 0148-0227/07/2005JD006741$09.00 D01201 7 Division of Nuclear Physics, Department of Physics, Lund University, Lund, Sweden. 8 Dipartimento di Chimica ‘‘G. Ciamician’’, University of Bologna, Bologna, Italy. 9 Also at Centro di Ricerche per le Scienze Ambientali, University of Bologna, Ravenna, Italy. 10 Department of Environmental Sciences, Weizmann Institute, Rehovot, Israel. 11 Centro Te ´cnico Aeroespacial, Instituto de Aerona ´utica e Espac ¸o, Divisa ˜o de Cie ˆncias Atmosfe ´ricas, Sa ˜o Jose ´ dos Campos, Sa ˜o Paulo, Brazil. 12 Divisao de Quimica Ambiental, Instituto de Pesquisas Energe ´ticas e Nucleares, Sa ˜o Paulo, Brazil. 1 of 35
-
Upload
independent -
Category
Documents
-
view
5 -
download
0
Transcript of Overview of the inorganic and organic composition of size-segregated aerosol in Rondônia, Brazil,...

Overview of the inorganic and organic composition of size-segregated
aerosol in Rondonia, Brazil, from the biomass-burning period
to the onset of the wet season
Sandro Fuzzi,1 Stefano Decesari,1 Maria Cristina Facchini,1 Fabrizia Cavalli,1
Lorenza Emblico,1 Mihaiela Mircea,1 Meinrat O. Andreae,2 Ivonne Trebs,2
Andras Hoffer,2 Pascal Guyon,2 Paulo Artaxo,3 Luciana V. Rizzo,3
Luciene L. Lara,3 Theotonio Pauliquevis,3 Willy Maenhaut,4 Nico Raes,4
Xuguang Chi,4 Olga L. Mayol-Bracero,5 Lydia L. Soto-Garcıa,5 Magda Claeys,6
Ivan Kourtchev,6 Jenny Rissler,7 Erik Swietlicki,7 Emilio Tagliavini,8,9 Gal Schkolnik,10
Alla H. Falkovich,10 Yinon Rudich,10 Gilberto Fisch,11 and Luciana V. Gatti12
Received 5 October 2005; revised 17 March 2006; accepted 10 July 2006; published 6 January 2007.
[1] The aerosol characterization experiment performed within the Large-Scale Biosphere-Atmosphere Experiment in Amazonia–Smoke, Aerosols, Clouds, Rainfall and Climate(LBA-SMOCC) field experiment carried out in Rondonia, Brazil, in the period fromSeptember to November 2002 provides a unique data set of size-resolved chemicalcomposition of boundary layer aerosol over the Amazon Basin from the intense biomass-burning period to the onset of the wet season. Three main periods were clearlydistinguished on the basis of the PM10 concentration trend during the experiment: (1) dryperiod, with average PM10 well above 50 mg m�3; (2) transition period, during which the24-hour-averaged PM10 never exceeded 40 mg m�3 and never dropped below 10 mg m�3;(3) and wet period, characterized by 48-hour-averaged concentrations of PM10 below12 mg m�3 and sometimes as low as 2 mg m�3. The trend of PM10 reflects that of COconcentration and can be directly linked to the decreasing intensity of the biomass-burningactivities from September through November, because of the progressive onset of the wetseason. Two prominent aerosol modes, in the submicron and supermicron size ranges,were detected throughout the experiment. Dry period size distributions are dominated bythe fine mode, while the fine and coarse modes show almost the same concentrationsduring the wet period. The supermicron fraction of the aerosol is composed mainly ofprimary particles of crustal or biological origin, whereas submicron particles are producedin high concentrations only during the biomass-burning periods and are mainly composedof organic material, mostly water-soluble, and �10% of soluble inorganic salts, withsulphate as the major anion. Size-resolved average aerosol chemical compositions arereported for the dry, transition, and wet periods. However, significant variations in theaerosol composition and concentrations were observed within each period, which can beclassified into two categories: (1) diurnal oscillations, caused by the diurnal cycle of theboundary layer and the different combustion phase active during day (flaming) ornight (smouldering); and (2) day-to-day variations, due to alternating phases of relativelywet and dry conditions. In a second part of the study, three subperiods representative of the
JOURNAL OF GEOPHYSICAL RESEARCH, VOL. 112, D01201, doi:10.1029/2005JD006741, 2007ClickHere
for
FullArticle
1Institute of Atmospheric Sciences and Climate, National ResearchCouncil, Bologna, Italy.
2Biogeochemistry Department, Max Planck Institute for Chemistry,Mainz, Germany.
3Instituto de Fisica, Universidade de Sao Paulo, Sao Paulo, Brazil.4Department of Analytical Chemistry, Institute for Nuclear Sciences,
Ghent University, Ghent, Belgium.5Institute for Tropical Ecosystem Studies, University of Puerto Rico,
San Juan, Puerto Rico, USA.6Department of Pharmaceutical Sciences, University of Antwerp,
Antwerp, Belgium.
Copyright 2007 by the American Geophysical Union.0148-0227/07/2005JD006741$09.00
D01201
7Division of Nuclear Physics, Department of Physics, Lund University,Lund, Sweden.
8Dipartimento di Chimica ‘‘G. Ciamician’’, University of Bologna,Bologna, Italy.
9Also at Centro di Ricerche per le Scienze Ambientali, University ofBologna, Ravenna, Italy.
10Department of Environmental Sciences, Weizmann Institute, Rehovot,Israel.
11Centro Tecnico Aeroespacial, Instituto de Aeronautica e Espaco,Divisao de Ciencias Atmosfericas, Sao Jose dos Campos, Sao Paulo, Brazil.
12Divisao de Quimica Ambiental, Instituto de Pesquisas Energeticas eNucleares, Sao Paulo, Brazil.
1 of 35

conditions occurring in the dry, transition, and wet periods were isolated to follow theevolution of the aerosol chemical composition as a function of changes in rainfall rate andin the strength of the sources of particulate matter. The chemical data set provided by theSMOCC field experiment will be useful to characterize the aerosol hygroscopic propertiesand the ability of the particles to act as cloud condensation nuclei.
Citation: Fuzzi, S., et al. (2007), Overview of the inorganic and organic composition of size-segregated aerosol in Rondonia, Brazil,
from the biomass-burning period to the onset of the wet season, J. Geophys. Res., 112, D01201, doi:10.1029/2005JD006741.
1. Introduction
[2] The Large-Scale Biosphere-Atmosphere Experimentin Amazonia–Smoke, Aerosols, Clouds, Rainfall and Cli-mate (LBA-SMOCC) field campaign was conducted inRondonia, southwest of Amazonia, Brazil, in the periodfrom September to November 2002, extending from theintense biomass-burning period to the onset of the wetseason. The overall goal of SMOCC was to investigatethe connection between the physical and chemical proper-ties and the abundance of biomass-burning aerosol particles,with changes in cloud microphysical properties, such as thedecreasing of the size of cloud droplets forming on thisaerosol, and the climatic consequences of the resultingperturbation of cloud physics [Andreae et al., 2004]. Forthis purpose, a full physical and chemical characterizationof the aerosol particles throughout the experimental periodwas carried out, in order to determine the link between theaerosol chemical and physical properties and their hygro-scopic and cloud-nucleating properties. The data obtainedwill also provide input for models simulating the effect ofbiomass-burning aerosol on cloud microphysics [Roberts etal., 2002], with the aim of investigating the effect of smokeaerosols on climate dynamics and the resulting large-scaleclimatic effects. Aerosols emitted during biomass burningare predominantly in the form of submicrometer, accumu-lation-mode particles [Artaxo et al., 2002]. While theinorganic composition of this aerosol and its emissionfactors from fires have been determined in a number ofprevious studies [Artaxo et al., 1998, 2000, 2002; Andreaeet al., 1998; Reid et al., 1998; Formenti et al., 2003], thereis still very little information about its organic composition,although organic matter is known to constitute the majorfraction of smoke aerosols, accounting for up to 80% of thetotal aerosol mass [Artaxo and Hansson, 1995]. The organicmaterial within smoke aerosols is composed of a highlycomplex mixture of compounds, covering a wide range ofmolecular structures, physical properties and reactivities.Apart from a few field studies that have shown that water-soluble organic acids are significantly enriched in smokeaerosol [Mayol-Bracero et al., 2002; Gao et al., 2003], verylittle work has gone into the sampling of fresh and agedbiomass smoke to determine the quantity and molecularforms of the oxygenated, water-soluble organic compounds(WSOC) produced by biomass burning. The need for theanalysis of this fraction, however, has gained in relevancesince it has now been shown that the burning of celluloseproduces smoke particles that are nearly 100% water-soluble [Novakov and Corrigan, 1996], in addition tomounting evidence that water-soluble organics significantlycontribute to the cloud condensation nuclei (CCN) activityof aerosols [Roberts et al., 2002]. Moreover, the high
concentrations of WSOC within smoke aerosols suggestthat they may play a significant role in the aqueous phasechemistry occurring within cloud droplets nucleated bysmoke [Herrmann, 2003]. Thus for the LBA-SMOCCproject additional and novel methods for the analysis oforganic aerosols were developed and applied [Decesari etal., 2006].[3] The purpose of this paper is to provide an overview of
the LBA-SMOCC experiment itself, and describe measure-ments of the size segregated aerosol composition during thewhole field campaign. After this overall description, somecharacteristic periods within the campaign are analysed anddiscussed in greater detail to provide deeper insight on theevolution of size-segregated aerosol composition from thedry (burning) season to the onset of the wet season.
2. Experimental Part
[4] The ground-based part of the LBA-SMOCC fieldexperiment was performed at the Fazenda Nossa SenhoraAparecida (FNS) (10�04.70s, 61�56.020W, 145 m asl.), arural site in central Rondonia. The ground-based componentwas complemented by a large-scale airborne experimentaimed at looking at vertical profiles and measuring large-scale aerosol and cloud properties [Andreae et al., 2004].The field site was deforested by fire about 25 years ago andis now a pasture, with Brachiaria brizantha as the dominantspecies of grass. A complete description of the site as wellas maps at different scales is given by Andreae et al. [2002].The period of the experiment encompasses the latedry season (September to early October) and extends tothe onset of the rainy period in this part of Amazonia(November). In 2002, the weather typical of the dry seasonlasted until the first week of October, while the rest of thatmonth was a transition period characterized by intermittentprecipitation episodes and dry days (M. A. F. Silva Dias, inpreparation, 2006). During the dry season and, to a lesserextent, the transition period, widespread fire activity wasobserved in Rondonia and Mato Grosso, as well as in theother states that contain the ‘‘arc of deforestation’’ along thesouthern and south eastern margin of the Amazon forest(Figures 1a–1c). During the SMOCC campaign, the mostintense nearby burning was taking place at the edge of thewoodlands, extending from north to east of the FNS site at adistance of about 20–30 km. Wood burning was also activein Ouro Preto de Oeste (�40,800 inhabitants) which is 8 kmfrom the sampling site. The FNS site is located on a strip ofcleared land 4 km wide and several tens of kilometers long,where only sparse domestic fires were observed. Biomassburning was substantially reduced in the region at thebeginning of November after the onset of persistent wetconditions.
D01201 FUZZI ET AL.: BIOMASS-BURNING AEROSOL COMPOSITION
2 of 35
D01201

Figure 1. Monthly cumulated number of fire points over Brazil detected by the NOAA-12 satelliteduring the period of the SMOCC campaign: (a) September, (b) October, and (c) November 2002.Courtesy of Centro de Previsao de Tempo e Estudios Climaticos, Instituto Nacional de PesquisasEspaciais (CPTEC/INPE).
D01201 FUZZI ET AL.: BIOMASS-BURNING AEROSOL COMPOSITION
3 of 35
D01201

2.1. Overview of the Meteorological Situation
[5] From the climatological records of the dry-to-wetseason transition in Rondonia [Ferreira da Costa et al.,1998], the average rainfall amount varies from a monthlytotal of 96 mm (with 6 days of rainfall higher than 1 mm/day)in September, to 153mm (with 12 days of rainfall) inOctober,up to 238 mm (with 16 days of rainfall) in November.The air temperature is less variable during the periodconsidered, with monthly mean values around 25.0�C,although there is a variation in the daily maximumtemperature span: 10.7�C in September, 9.4�C in Octoberand 8.0�C in November. This is due to the increase ofminimum temperature and a slight decrease in the max-imum temperature.[6] The weather conditions during the LBA-SMOCC
experiment were mainly consistent with the above clima-tology: temperatures were around the average (deviationsless than 1�C from the average) throughout the period, withthe rainfall slightly above normal in September (deviation ofup to 50 mm) and November (25 mm up to 100 mm) andslightly below average in October (up to �50 mm). Radio-soundings were performed at the sampling site in order toidentify the vertical structure and characteristics of theconvective boundary layer (CBL) (G. Fisch, in preparation,2006). The soundings were performed several times per day(08, 11, 14 and 17 Local Time (LT)) and the 17 LTsoundings were used to represent the maximum height ofthe CBL. During the dry season, the boundary layer wasvery well mixed and developed, with an average height ofaround 1690 m (standard deviation. 250 m) at midday. Forthe transition period, when some systematic convectiverainfalls developed during the afternoons, the CBL averageheight was reduced to around 1320 m (standard deviation.250 m). The nocturnal boundary layer height was muchlower, with maximum height approximately 200–250 m.The surface cooling due to the nocturnal radiation budget isthe main force for the developing of this layer as winds arevery weak. No soundings are available for the last period ofthe campaign, i.e., after 31 October at the onset of the wetseason. The evolution of the boundary layer is also dis-cussed in a paper by Rissler et al. [2006].
2.2. Aerosol Sampling and Analysis
[7] The experimental set-up employed during the LBA-SMOCC campaign at the FNS site was designed for a fullcharacterization of the optical, physical, hygroscopic andchemical properties of the aerosol [Chand et al., 2006;Decesari et al., 2006; Trebs et al., 2005, 2006]. Trace gas(CO and NOx) concentrations were also measured through-out the experiment. CO was measured with the ThermoEnvironmental Instrument Inc. analyzer (Model 48C GasFilter Correlation) with a detection limit of 40 ppb. Becauseof the high ambient humidity, a cooler was used to removewater from the sample stream prior to the CO analyzer. Thechemiluminescence NO/NOx analyzer (Model 42C TL,Thermo Environment Instruments Inc.) was equipped witha molybdenum converter to transform ambient NO2 to NO(for details, see Trebs et al. [2006]). The dry aerosol numbersize distributions were measured with a Differential Mobil-ity Particle Sizer (DMPS) at a time resolution of 10 min[Rissler et al., 2004]. The aerosol entered the DMPS atambient relative humidity. The DMPS was operated in
stepping mode, measuring at steps of equal logarithmicdiameter, for a total of 38 mobility channels covering thesize range from 3 to 850 nm. The inversion programconverting the measured mobility distribution to dry num-ber size distributions takes into account sampling linelosses, bipolar charging probabilities, calibrated DMAtransfer functions, DMA diffusion broadening and losses,and CPC counting efficiencies. PM10 and PM2.5 weredetermined every 30 min by means of two Tapered ElementOscillating Microbalance (TEOM) instruments, operating atan inlet temperature of 50 degrees. Aerosol total carbon(TC) in PM2.5 and its volatile and refractory fractions, weredetermined every 60 min with a R&P Ambient CarbonParticulate Monitor series 5400 [Artaxo et al., 2002]. Withthe R&P 5400, refractory carbon was derived as the fractionof carbon that is converted to CO2 above a temperature of350�C. Organic carbon was obtained as the differencebetween total carbon and refractory carbon. The TEOMsand the carbon monitor were operated at the FNS sitethroughout the campaign until 3 November.[8] A combination of wet annular denuder/steam jet
aerosol collector (SJAC) was used to measure the concen-trations of inorganic aerosol species (ammonium, nitrate,nitrite, chloride and sulphate) and their gaseous precursors(ammonia, nitric acid, nitrous acid, hydrochloric acid andsulphur dioxide) online with a time resolution of 20 minfrom 12 to 23 September, and of 40–60 min from 7 Octoberto 11 November [Trebs et al., 2004].[9] Aerosol samples for chemical analysis were collected
by means of a suite of filter samplers and five differentmodels of cascade impactors. The characteristics of theimpactors are reported in Table 1. The filter samplersincluded PM10 and PM2.5 collectors, stacked filter unit(SFU) samplers, and high-volume dichotomous samplers(HVDS). The SFU samplers and HVDS provide separatecoarse and fine size fractions, with coarse being the sizerange 2–10 mm aerodynamic diameter (AD) for the SFUand >2.5 mm AD for the HVDS, and fine being the sizerange of <2 mm AD for the SFU and <2.5 mm AD for theHVDS. The chemical analyses for the filter samples aredescribed elsewhere [Falkovich et al., 2005; Decesari et al.,2006; W. Maenhaut, in preparation, 2006; M. Claeys, inpreparation, 2006]. Among the techniques for measuringindividual chemical species or elements in the filter sampleswere ion chromatography (IC), gas chromatography/massspectrometry (GC/MS), instrumental neutron activationanalysis (INAA) and particle-induced X-ray emission spec-trometry (PIXE). The sampling time for all aerosol collec-tion devices was initially set at 12 hours, and then extendedto 24 and 48 hours following the decrease in the aerosol airconcentrations monitored by TEOM. The collectors wereoperated in parallel with the exception of the 8-stage micro-orifice uniform deposition impactor (MOUDI). Because ofexpected differences in the concentrations and compositionof the aerosol during day and night [Artaxo et al., 2002],samplings were performed separately for day and nightconditions. Therefore during the transition and wet periods,24 and 48 hour diurnal/nocturnal samplings were performedon two and four consecutive days/nights, respectively.[10] The 13-stage Dekati low-pressure impactor (DLPI),
11-stage MOUDI and the 5-stage Berner Impactor (BI) usedaluminium foils for the determination of particulate mass
D01201 FUZZI ET AL.: BIOMASS-BURNING AEROSOL COMPOSITION
4 of 35
D01201

(PM). Selected samples from the 11-stage MOUDI wereanalysed for TC with a TOC (total organic carbon) analyserwith Solid Sample Module (Shimadzu) and selected DLPIsamples were analysed for TC by evolved gas analysis(EGA) [Novakov et al., 1997] and for inorganic and organicionic species by IC [Andreae et al., 2000; Gabriel et al.,2002]. Elemental carbon (EC) was determined by EGA inthe fine fraction from the HVDS, after water extraction toremove soluble inorganic and organic species to reducethe artifacts resulting from catalysis and charring [Mayol-Bracero et al., 2002; Hoffer et al., 2005].[11] Quartz fiber filters and aluminium foils were alter-
natively mounted on the DLPI, with the quartz substratesallowing more accurate analysis of TC by EGA analysis, ofinorganic ions by IC and of elements by InductivelyCoupled Plasma Atomic Emission Spectrometry(ICP-AES). The BI was equipped with double aluminium/Tedlar substrates [Matta et al., 2003] during the first periodof sampling (9–28 September) and with only Tedlarsubstrates during the second period (15 October to9 November). Tedlar substrates had been thoroughlywashed with deionized water before sampling. Aerosolscollected on Tedlar foils were extracted with water for thedetermination of total water-soluble organic compounds(WSOC) by liquid TOC analysis [Decesari et al., 2006],
and of inorganic ions by IC [Matta et al., 2003]. A 12-stagesmall deposit area low-pressure impactor (SDI) was specif-ically devoted to elemental analysis. Samples were collectedon Kimfol polycarbonate foils and analysed by PIXE[Maenhaut et al., 1996].[12] The organic analysis was performed by means of
different analytical techniques for both speciation at themolecular level and functional group analysis. A detaileddescription of the organic chemical characterization is givenby Decesari et al. [2006]. Briefly, ion exchange chroma-tography coupled to UV detection for fractionation ofWSOC into neutral and acidic compounds was performedon all BI samples collected on Tedlar substrates. IC and ionexclusion chromatography (IEC) for the analysis of inor-ganic ions, low molecular weight organic acids and hydrox-ylated compounds were performed on selected 8-stageMOUDI samples [Falkovich et al., 2005; Schkolnik et al.,2005]. The 11-stage MOUDI samples representative of thevarious periods of the campaign were also extracted withdichloromethane/methanol for GC/MS analysis of the polarfraction of organic carbon (OC) (M. Claeys, in preparation,2006). Finally, two BI samples collected during episodes ofvery high aerosol concentrations were subjected to func-tional group analysis by proton nuclear magnetic resonance(NMR) spectroscopy [Tagliavini et al., 2006]. For both
Table 1. Cascade Impactors Deployed During the SMOCC Field Experiment by the Various Groups Participating in the Field
Experimenta
Impactor Type
Dekati Low-PressureImpactorDLPI
MOUDI (Micro-orificeUniform Deposit Impactor)
Berner Low-PressureImpactor LPI 80
Small Deposit AreaLow-Pressure Impactor (SDI)
Operator UPR UGent IFUSP ISAC UGent
Sampling period 15 Sept to14 Nov
9 Septto 14 Nov
15 Septto 14 Nov
8–28 Sept;15 Octto 9 Nov.
9 Septto 14 Nov
Flow rate (Lpm) 28.9–28.3 27 20–25 80b 11Lower cut off (mm) 0.030c 0.053 0.09 0.05 0.045
0.079c 0.094 0.18 0.14 0.0860.104c 0.164 0.33 0.42 0.1530.162 0.301 0.56 1.2 0.2310.269 0.603 1.00 3.5 0.3430.393 1.0 1.80 0.5910.628 1.8 3.20 0.7960.970 3.1 10.0 1.061.64 6.2 1.662.44 9.9 2.684.09 18 4.086.73 8.510.2
Inlet cut-size (mm) 30 None 30 10 15Substrates Aluminum
or quartzfiber filters
Aluminum Polycarbonate Aluminumg and Tedlar polycarbonate
Weighting (RH) 50% 50% N.A. 30%Analysis Gravimetry,
EGA, ICPd, ICdGravimetry;
TOCd,e, GCMSdGravimetry, ICd,
IECdon aluminum foils:
gravimetry; onTedlar foils: IC,TOCf, IC-UV, NMRd
PIXE
aUPR: University of Puerto Rico; UGent: Ghent University; IFUSP: Instituto de Fisica, Universidade de Sao Paulo; ISAC: Institute of AtmosphericSciences and Climate. The cut-offs are provided as aerodynamic diameters (AD).
bNominal flow rate.cAverage cut-off for the experiment. The actual values vary among samplings.dOn selected samples.eThermal analysis of TC directly on the impactor foils.fThermal analysis of TC in the water extracts of the impactor foils.gMounted only in the sampling period 8–28 September.
D01201 FUZZI ET AL.: BIOMASS-BURNING AEROSOL COMPOSITION
5 of 35
D01201

filters and impactor foils, blanks were stored in the fieldwith an approximate frequency of one every ten samples.All data reported in the paper are corrected for blanks.
3. Aerosol Composition and Trends
[13] The trend in ambient aerosol concentrations (PM10)throughout the experiment is shown in Figure 2a. Threemain periods can be clearly distinguished on the basis of thePM10 concentration trends: (1) dry period (from 7 Septem-ber until 7 October) including two major episodes ofsubsequent days showing PM10 constantly above 50 mg m�3;(2) transition period (8–30 October), 20 days during whichthe 24-hour-averaged PM10 never exceeded 40 mg m�3 andnever dropped below 10 mg m�3; (3) wet period (after30 October) characterized by 48-hour-averaged concentra-tions of PM10 below 12 mg m�3 and sometimes as low as2 mg m�3. These low values of PM10 concentrations arecharacteristic of the wet season in Amazonia [Artaxo et al.,2002]. The trend of PM10 reflects that of CO concentrations(r2 = 0.87) and can be directly linked to the decreasingintensity of the biomass-burning activities from Septemberthrough November due to the progressive onset of the wetseason (Figure 2b). It is possible to observe that localRondonia fires explain only part of the PM10 variabilitybut, for some periods, high PM10 concentrations wereobserved with low fire counts in Rondonia. During theseperiods, fires in the nearby Mato Grosso state might havebeen responsible for the observed high PM10 concentrations,pointing to the importance of regional aerosol transport overAmazonia. The mean circulation was responsible for the nettransport of smoke from Mato Grosso and other upwindregions to Rondonia, and from Rondonia in the south/southeastern direction, along the margin of the Andesmountains (M. A. F. Silva Dias, in preparation, 2006).[14] The large difference in the height of the boundary
layer between night and day is responsible for the oscil-lations in the 12-hour-averaged PM10 concentrationswhich can be observed especially during the dry period(Figure 2a), with higher ground concentrations at nighttime[Rissler et al., 2006]. For example, from 17 to 20 Septemberthe aerosol concentration measured by the 11-stage MOUDIimpactor varied by a factor of two between night and day,whereas the 24-hour-averaged concentrations (measured bythe 8-stage MOUDI impactor) indicated only a 10% vari-ation between consecutive samples. Because of such diurnalcycles of the aerosol concentration and to the 24-hourperiodicity of other phenomena connected with the aerosolcycle (e.g., turbulence and cloud formation, biomass burn-ing and other anthropogenic activities, biological activity),in the following sections we will discuss separately noctur-nal and diurnal aerosol populations and size distributions.[15] Despite the general agreement among the trends of
PM10 measured by the different impactors, significantdeviations were frequently observed. The integrated massfrom DLPI was alternatively higher or lower than thatdetermined by MOUDIs. Conversely, the BI providedsystematically lower PM10 concentrations than the otherthree impactors (Figure 2a). The different weighting con-ditions employed (Table 1) may have contributed to theobserved discrepancies between the impactor measure-ments. However, the change in the aerosol volume due to
water uptake between 30 and 50% RH is estimated to beless than 10% on the basis of the measurements performedwith a Hygroscopic Tandem Differential Mobility Analyzer(H-TDMA, Rissler et al. [2006]). The main losses of BIcompared to MOUDIs were observed in different sizeranges, especially above 3.5 mm and below 0.42 mm. Theintegrated concentrations of PM and of the chemical com-ponents determined on the BI were on average 22% lowercompared to that determined on the 11-stage MOUDI, withthe larger deviations observed during daytime, when thelow relative humidity shifted the mode in the PM sizedistribution at aerosol diameters below 0.42 mm (see thefollowing section). However, the chemical analyses showedthat the same artifacts observed for PM were also found forall main chemical constituents of the aerosol, so that theratio of individual chemical components to PM in thedifferent size ranges was essentially the same as that foundin the other impactors. Therefore we can conclude thatsampling with BI was affected mostly by nonspecificartifacts with respect to the chemical composition of theaerosol particles.
3.1. Aerosol Mass and Volume Size Distributions
[16] The PM size distributions during the experimentwere systematically determined by sampling with an11-stage MOUDI (80 samples) and an 8-stage MOUDI(33 samples). Size-resolved PM data were also provided bythe BI and by the DLPI, but with lower time coveragecompared to the MOUDIs. Figures 3a–3c report the statis-tics of the measured 11-stage MOUDI size distributions forthe three main periods of the campaign. Since the aerosolconcentrations followed a diurnal cycle for most of thetime, the average size distributions were calculated sepa-rately for the daytime and the nighttime samples. Twoprominent modes, in the submicron and supermicron sizeranges, respectively, were detected throughout the experi-ment, but the relative magnitude of the two changedaccording to the period. Dry period size distributions aredominated by the fine mode, but the fine and coarse modesshow almost the same concentrations during the wet period.These findings are in agreement with those provided by pastLBA measurement campaigns in Rondonia [Artaxo et al.,2002; Guyon et al., 2003], showing that the intense biomass-burning activity is reflected by high concentrations ofsubmicron particles, whereas the pristine Amazon Basinenvironment is characterized by higher concentrations ofcoarse-mode biogenic particles emitted by the vegetation.During the LBA-SMOCC experiment, fine-mode particleconcentrations decreased by a factor of 20 from the dry tothe wet period, while the coarse-mode particle concentrationswere relatively stable throughout the campaign, suggestingthat the natural background of supermicron particles is almostconstant during the dry-to-wet season transition.[17] The average concentrations of both fine and coarse
particles were lower during the day than during the night,supporting the proposed dilution effect due to the evolutionof the boundary layer that is much higher during daytime, asa result of intense vertical mixing and dilution. Anotherdistinguishing feature of daytime PM size distribution is theoccurrence of two overlapping modes in the submicronfraction at �300 and 700 nm which correspond to the‘‘condensation’’ (lower submicron) and ‘‘droplet’’ (upper
D01201 FUZZI ET AL.: BIOMASS-BURNING AEROSOL COMPOSITION
6 of 35
D01201

Figure 2. (a) Trends in PM10 concentrations from TEOM and from integrated impactor measurementsversus GMT throughout the experiment. (b) Trends in CO concentrations and of fire spots versus GMT inthe states of Rondonia and Mato Grosso measured by NOAA-14. The time resolution is 5 min for the COmonitor, 30 min for TEOM and 12 to 48 h for the impactors.
D01201 FUZZI ET AL.: BIOMASS-BURNING AEROSOL COMPOSITION
7 of 35
D01201

submicron) modes, respectively [Maenhaut et al., 2004].Finally, during the dry period, the mean modal diameter inthe submicron size range is higher during the night thanduring the day, possibly because of the marked difference inrelative humidity (RH) between day and night (near 50 and100%, respectively), promoting hygroscopic growth of theaerosol during nighttime [Trebs et al., 2005]. The diametergrowth factors of the aerosol (between <15% and 90% RH)
measured by a hygroscopic tandem DMA (HTDMA)ranged from 1.1 to 1.3 for particles having dry diameterof 50–440 nm [Rissler et al., 2006]. By taking into accountthe hygroscopic growth factors and by assuming a densityfor the dry aerosol particles, the volume size distributionsdetermined by DMPS can be compared to the PM sizedistributions from the 11-stage MOUDI impactors. Thecorrection for the difference between the mobility diameter
Figure 3. PM size distributions from the 11-stage MOUDI. Mass size distributions derived fromintegrated DMPS volume size distributions assuming a dry density of 1.37 are also reported. (a) Dryperiod; (b) transition period; (c) wet period. Percentiles were not calculated in the cases of transitionperiod and wet period samples, because of the small number of samples (n � 5) in each subset.
D01201 FUZZI ET AL.: BIOMASS-BURNING AEROSOL COMPOSITION
8 of 35
D01201

(DMA technique) and aerodynamic diameter (impactortechnique) was made using the relation:
dae ¼ dme �ffiffiffiffiffiffiffiffi
rwetp
with dae = aerodynamic diameter, dme = mobility diameter,and rwet = wet density, assumed to be 1.2 kg dm�3. Figures3a–3c reports the PM size distributions obtained fromDMPS integrated over the size intervals of the MOUDI andaveraged over the time periods of the samplings with theimpactors. The PM distributions were calculated fromDMPS data assuming a dry density of 1.37 kg dm�3
[Rissler et al., 2006]. Comparison with the 11-stageMOUDI size distributions shows (1) a good agreementduring the transition and wet periods, (2) broader distribu-tions from MOUDI than for DMPS, especially in the dryperiod; (3) systematically higher concentrations fromDMPS than from MOUDI in daytime conditions. Theinterpretation of the differences between MOUDI andDMPS PM size distributions is not straightforward, andthe assumed dry density seems to have little effect on thediscrepancies. The broader (and sometimes multimodal)distributions from MOUDI impactors can be partlyattributed to external mixing of the hygroscopic andnonhygroscopic compounds in the particles, causing aerosolpopulations to have the same modal dry diameter butdifferent ambient diameters. However, such explanationholds only for the samples collected at nighttime, when theRH was close to 100% and the aerosol could absorb anontrivial amount of water, whereas during the day, whenRH often fell below 50%, the particles showed a verylimited hygroscopic growth [Rissler et al., 2006]. Thehigher concentrations provided by DMPS during daytimemight reflect negative artifacts affecting sampling with theimpactors, either because of the high ambient temperature(generally in the order of 35�C) promoting evaporation ofsemivolatile compounds, or because of the low relativehumidity causing bouncing of dry particles on the impactorplates. The problems of lack of agreement between theDMA-based and the impactor-based aerosol measurementscannot fully be addressed here.
3.2. Size Distributions of the Main InorganicComponents of the Aerosol
[18] Figures 4a–4c show the size distributions of themain inorganic components of the aerosol resulting fromthe analysis of SDI and DLPI (for the N-containing com-pounds) samples. Because of the limited number of DLPIsamples subjected to full chemical analysis, averages for thethree periods of the campaign could not be calculated.Instead, samples representative for the three periods andfor nocturnal and diurnal conditions were selected and theirsize distributions are reported in the figure, together with thePM size distributions from 11-stage MOUDI.[19] With the exception of nitrate, sulphate, and potassium,
the other inorganic components show size distributions withmaxima either in the fine or in the coarse size range. We candistinguish between elements and ionic species enriched inthe fine fraction and occurring with higher concentrations inthe biomass-burning period (‘‘pyrogenic’’ species), andother elements showing a main mode in the coarse sizefraction and occurring in relatively constant concentrations
throughout the experiment. The latter include silicon,calcium, aluminium and iron (the last two not shown inthe figure), plus other minor elements (titanium andmanganese), which can all be associated with a singlesource of crustal particles, possibly suspended by the actionof the wind and/or the convection generated by fires[Freitas et al., 2000]. Phosphorus, considered as a tracerof primary biogenic particles, shows similar size distribu-tions as the crustal elements. The concentrations of phos-phorus were lower than those of silicon and calcium in thedry period, while they were higher than those of calciumand comparable to those of silicon in the wet period. Thisfinding indicates that at the onset of the wet season, primarybiogenic particles increased their contribution to the coarsefraction relative to suspended soil particles. This is consis-tent with the combined effects of the decreasing number offires and increasing humidity of soil, which hinder theresuspension of crustal particles. At the same time, plantproductivity and emission of primary biogenic particles areexpected to increase after the beginning of the rainy season.[20] Pyrogenic species include the aerosol chemical com-
pounds produced during combustion, either directly emittedin the particulate phase or formed by subsequent oxidationand condensation of gaseous products. Sulphate, ammoni-um and, in the dry and transition periods potassium, are themost representative inorganic species of this category. Tracepyrogenic compounds (Zn, Se, Br, Rb, Pb) were alsoidentified by PIXE analysis [Maenhaut et al., 2004]. Potas-sium, usually considered a marker for primary combustionproducts, shows size distributions with maxima in thesupermicron size range during the wet period, suggestingthat other sources of potassium, likely biogenic [Guyon etal., 2004a; Schkolnik et al., 2005], become importanttoward the wet season.[21] The difference in the elemental composition of the
fine and coarse aerosol in Rondonia and its interpretation onthe basis of two main processes of aerosol emission, i.e.,biomass burning and resuspension of soil particles, are ingood agreement with the results provided by past experi-ments using filter-based techniques [Artaxo et al., 1998,2002; Guyon et al., 2004b]. However, several previouslyunnoticed features in the size distributions of the inorganiccomponents have been highlighted by the detailed analysisof the impactor data. A first important finding is that themaximum in the size distribution of pyrogenic compoundscan be deconvoluted into two modes, with aerosol meandiameters of 0.3 and 0.7 mm, respectively, which correspondapproximately to the two modes often observed in PM sizedistributions (see the section above). The two modes aremore pronounced in the size distributions of potassium andsulphate, because of the larger number of stages of the SDIand DLPI compared to the 11-stage MOUDI. The occur-rence of two modes in the submicrometer size range hasfrequently been attributed to the production of large accu-mulation-mode particles in nonprecipitating clouds [Ricardet al., 2002]. During this experiment, the activation ofaerosol particles within nonprecipitating cumuli in theafternoon and within the nocturnal fogs may be responsiblefor the appearance of a ‘‘droplet mode’’ at a diameter of0.7 mm.[22] Size distributions in the supermicron size range
always exhibit a single broad maximum. However, the
D01201 FUZZI ET AL.: BIOMASS-BURNING AEROSOL COMPOSITION
9 of 35
D01201

Figure 4
D01201 FUZZI ET AL.: BIOMASS-BURNING AEROSOL COMPOSITION
10 of 35
D01201

composition of coarse particles is likely to be a mixture ofinorganic compounds originating from different sources. Inparticular, there is evidence of the adsorption of inorganicvapours produced by biomass burning onto primary par-ticles made up of crustal material and phosphorus-richbiogenic organic material. Indeed, unlike ammonium,whose size distribution remains always confined to thesubmicron fraction, sulphate and nitrate size distributionsalso show a distinct coarse mode. In the case of the mostvolatile species (nitrate), during the transition and wetperiods, the coarse mode is generally even higher than thefine mode. These data suggest that the primary coarseparticles contain alkaline material, which promotes thecondensation of sulphur dioxide and nitric acid. Thereforethe condensation of semivolatiles onto the coarse particlescompeted with that on the submicrometer particles, theformer becoming dominant for nitrate after the end of thedry season, when the concentrations of fine aerosolsdropped considerably.
3.3. Size Distributions of the Main Aerosol CarbonClasses
[23] Size segregated TC data were obtained from theanalysis of selected 11-stage MOUDI samples for the dryperiod and of DLPI for the transition and wet periods. Sizedistributions of EC have not been determined. Examples ofTC size distributions, together with the PM distributions forthe same samples, are shown in Figures 5a–5c. Generally,there is a close correlation between the size spectra of PMand TC in the submicrometer size range. The TC/PM ratiofor the fine fraction of the aerosol is 0.41 ± 0.11, on average,when calculated on the analysed MOUDI samples. Thesefindings strongly support previous observations that the fineparticulate matter produced by biomass burning is largelycarbonaceous. Little or no difference was observed in theTC/PM ratio between the size ranges corresponding to thecondensation mode and the droplet mode [Maenhaut et al.,2004], indicating that TC was the primary constituent of thefine particles throughout the submicron size range. The sizedistribution of TC is different from that of PM in thesupermicron size range, where a substantial fraction of themass is expected to be accounted for by inorganic crustalmaterial. This is particularly evident in the samples from thedry period. The TC distributions determined by EGAanalysis on the DLPI samples from the transition and wetperiods essentially follow the same behaviour observed forthe MOUDI samples, suggesting that fine particles continueto be substantially carbonaceous in nature also after the endof the biomass-burning period.[24] Size distributions of the water-soluble (i.e., water-
extractable) organic compounds (WSOC) were determinedfor BI samples. Average distributions for the various periodsare reported in Figure 6. The WSOC size distributionsqualitatively follow those of TC, with a distinct mode inthe fine fraction in all periods. Because of the low size
resolution of the BI, the occurrence of a WSOC coarsemode cannot be readily noticed in most samples. However,it can be noted that the concentration of WSOC in theparticles of the supermicron size range is relatively higherduring the night in the transition and wet periods. In the dryperiod, the standard deviation of the concentrations is highercompared to the other two periods, following the analoguevariations observed for fine PM. Compared to the sizedistributions of PM and TC, the mode of WSOC in thesubmicron size range is shifted toward larger sizes, beingwithin the 0.42–1.2 mm interval in all periods, with theexception of the wet period daytime samples. The analysisof specific classes of WSOC by IC on 8-stage MOUDIsamples [Falkovich et al., 2005] also supports an enrich-ment of the polar fraction of OC in the size range between0.4 and 1 mm, i.e., at larger diameters compared to themodal size of PM and TC.
3.4. Size Distributions of Key Aerosol Organic Tracers
[25] Organic chemical analyses were able to speciate atthe molecular level about 6–8% of the measured TC[Decesari et al., 2006]. The identified organic compoundsencompass polyhydroxylated compounds, with levogluco-san as the most abundant species, short-chain aliphaticcarboxylic acids with oxalic acid as the most abundantcompound, and, finally, benzoic and phenolic acids. Func-tional group analysis by proton nuclear magnetic resonance(H NMR) spectroscopy [Tagliavini et al., 2006] indicatesthat saturated aliphatic compounds and many aromaticswere not detected by individual compound analysis, whilesignificant amounts of the compounds carrying C-OH andCOOH groups were identified at the molecular level[Decesari et al., 2006]. Furthermore, only low molecularweight species could be efficiently determined by GC/MSand IC methods, while the medium-to-high molecularweight fraction, mostly accounted for by humic-like sub-stances, could be characterized only by functional groupanalysis [Tagliavini et al., 2006]. Among the identifiedWSOC, many were considered as molecular markers forspecific sources of organic material. For example, levoglu-cosan and the other sugar anhydrides are known tracers ofbiomass combustion [Simoneit et al., 1999], sugars andsugar alcohols enter the aerosol phase by direct emissionfrom the biota [Graham et al., 2003] or because of theresuspension of organic-rich soil particles [Simoneit et al.,2004], and malic acid is believed to be an intermediatephoto-oxidation product of unsaturated fatty acids[Kawamura et al., 1996]. Finally, methyltetrols and C5
alkene triols were recently identified as products ofisoprene photo-oxidation [Claeys et al., 2004a, 2004b;Wang et al., 2005]. A full discussion of the results of thesize segregated organic analyses on 8-stage and 11-stageMOUDI samples collected during the SMOCC campaignis given by Falkovich et al. [2005], Schkolnik et al.[2005] and M. Claeys et al. (in preparation, 2006).
Figure 4. Size distributions of inorganic ions and elements for selected samples collected during nighttime and daytime inthe dry (a), transition (b) and wet periods (c). Nitrate and ammonium size distributions were derived from DLPI impactors.All the other chemical species were determined for SDI samples. Sulphate concentrations were calculated as three times theconcentrations of elemental sulphur determined by PIXE on the SDI substrates. PM size distributions from MOUDI for thesame samples are also reported.
D01201 FUZZI ET AL.: BIOMASS-BURNING AEROSOL COMPOSITION
11 of 35
D01201
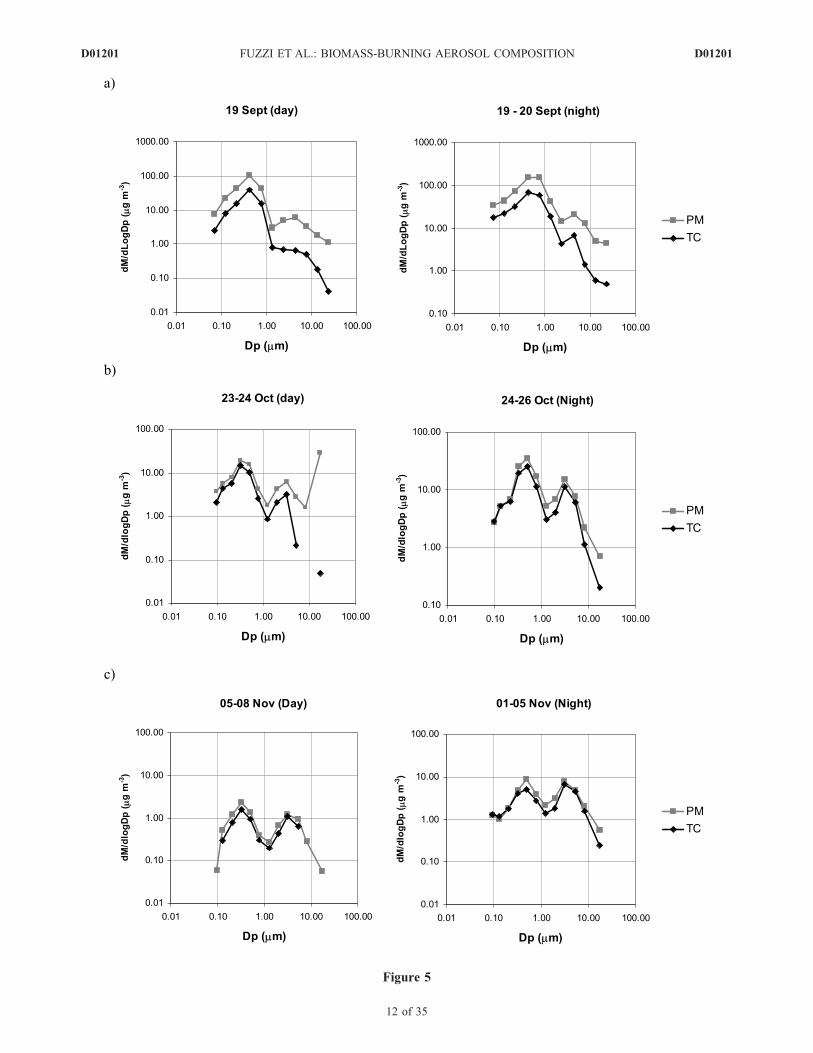
Figure 5
D01201 FUZZI ET AL.: BIOMASS-BURNING AEROSOL COMPOSITION
12 of 35
D01201

[26] Despite the fact that the organic compounds identi-fied at the molecular level add up to a relatively smallpercentage of total OC, their total mass is of the same orderof magnitude as that of inorganic ions [Falkovich et al.,2005; Trebs et al., 2005]. Therefore in principle, organictracer analysis on the SMOCC samples is as important forthe source apportionment of PM as the analysis of theinorganic composition. Figures 7a and 7b show the sizedistributions of some organic tracers representative of themain sources of OC identified in the various periods. Thedata refer to GC/MS analyses performed on 11-stageMOUDI samples and PM is shown in the figure for thesame samples. Mannitol exhibits a size distribution with asingle mode in the supermicron size range in all periods. Infact, sugar alcohols are produced by fungal spores whichcan be directly emitted in the atmosphere or associatedwith plant debris and soil particles [Graham et al., 2003;Simoneit et al., 2004]. Conversely, biogenic organic com-pounds formed by secondary processes, like methyltetrolsand malic acid, are enriched in submicrometer particles. Thesame is true for the biomass-burning products like levoglu-cosan. By contrast, both levoglucosan and malic acidexhibit a bimodal distribution during the wet period, witha coarse mode which is slightly shifted toward larger sizescompared to that of mannitol.[27] These findings suggest that the previous conclusions
concerning the nature of OC in the fine and in the coarsemodes must be treated with caution for two reasons: (1) notall submicrometer particles are produced by biomass burn-ing, and biogenic compounds are common constituents inall three periods [see also Graham et al., 2002, 2003];(2) coarse particles actually include biogenic materialderived from plant debris, plant pollen and fungal sporesbut, in the wet period, when the concentrations of the fineparticles is small, semivolatile compounds originating fromboth biomass burning and biogenic sources are present ascondensed material onto the coarse particles. Therefore thesimple interpretation of the modality of PM, with the fineparticles derived from biomass burning and the coarse onesfrom natural background, cannot be fully sustained on thebasis of the present results.
3.5. Size-Segregated Chemical Mass Balance of theAerosol
[28] In the previous section, the size distributions of thechemical constituents of the aerosol were compared to thatof PM with respect to modal size and shape. For a morequantitative comparison between the concentrations of PMand those of the analysed chemical compounds, a size-segregated mass balance of the aerosol must be calculated,provided that all concentrations are available for the samesize intervals. The results of the mass balance calculationperformed on the 8-stage MOUDI samples, for which bothPM and the concentrations of inorganic ions and organictracers determined by IC are available, are discussed byFalkovich et al. [2005]. Here, we provide a mass balance
Figure 5. Size distributions of total carbon (TC) for selected samples collected during nighttime and daytime in the dry(a), transition (b) and wet periods (c). Dry period samples were collected by 11-stage MOUDI and analysed with aShimadzu TOC analyser with Solid Sample Module (SSM). Samples for the transition and wet periods were collected byDLPI and analysed by EGA. PM size distributions for the same samples are also reported.
Figure 6. Average WSOC size distributions from the5-stage BI for the dry, transition and wet periods.
D01201 FUZZI ET AL.: BIOMASS-BURNING AEROSOL COMPOSITION
13 of 35
D01201

involving both inorganic (soluble and insoluble) com-pounds and the main carbon classes. Unfortunately, therewere no impactor samples on which a complete determina-tion of PM, TC classes, inorganic ions and elements couldbe performed, and the data had therefore to be retrievedfrom the analysis of samples from different impactor types.To this aim, the concentrations determined on the higher-resolution multistage impactors (SDI, MOUDI and DLPI)were integrated into the BI cut-offs: 0.05–0.14, 0.14–0.42,0.42–1.2, 1.2–3.5, 3.5–10 mm. The BI data were dividedby the size-resolved ratios PM(BI)/PM(MOUDI) for the dryperiod samples in order to account for the different sam-pling efficiencies of the impactors. For the transition andwet periods, the [SO4(BI)]/[SO4(DLPI)] ratios were used to
correct the BI data, since aluminium foils for PM determi-nation were not mounted on the BI during the last part of thecampaign. The SDI data concentrations of crustal elementswere also corrected using the factor [K(BI corrected)]/[K(SDI)].Crustal elements were then converted into mineral fractionson the basis of the equation: [crustal material] = 1.16(1.90Al + 2.15Si + 1.41Ca + 1.67Ti + 2.09Fe) [Maenhautet al., 2002]. Finally, the mass of water-soluble organiccompounds (i.e., the water-soluble organic mass, WSOM)characterized by chromatographic techniques and NMRfunctional group analysis was calculated from the measuredcarbon concentrations and organic matter (OM) to OC ratioson the basis of the average chemical composition [Decesariet al., 2006]. For the uncharacterized WSOC (ranging from
Figure 7. Size distributions of the main identified organic compounds determined by GC/MS analysisfor 11-stage MOUDI samples. (a) Dry period (day and night conditions), (b) transition and wet periods.PM size distributions for the same samples are also reported.
D01201 FUZZI ET AL.: BIOMASS-BURNING AEROSOL COMPOSITION
14 of 35
D01201

5 to 50% of the total), a conversion factor of 1.7 was used.The resulting size-resolved aerosol chemical mass budgetfor the three periods of the campaign and for day and nightconditions is reported in Tables 2a–2c. The TC concen-trations during the transition and wet periods are likelyaffected by instrumental biases; systematically higher TC/PMratios were obtained for the DLPI samples analysed by theEGA technique compared to the 11-stage MOUDI samplesanalysed by the solid TOC analyser. For this reason, theestimation of the non-water-soluble carbon mass was notattempted in this study. Figure 8 reports the mass balance ofthe aerosol expressed as a percentage of PM accounted for byWSOM, inorganic ions (details in Figure 9) and the mineralfraction in the five size intervals of the BI. The unac-counted mass, representing some 0 to 60%, includesinsoluble TC species (insoluble OC + EC), and, possibly,aerosol water. However, bon the basis of the hygroscop-icity data [Rissler et al., 2006], the amount of water inthe samples conditioned for gravimetry (RH = 30 to 50%;see Table 1) represents less than 10% of the particlevolume. The mean ratio EC/TC in the fine fraction duringthe dry and transition periods was 0.12 ± 0.04, with nosignificant differences between these two periods. With aTC/PM ratio of 0.41, this corresponds to an EC massfraction of 5.0 ± 1.6%.[29] The mineral fraction is a major aerosol component in
the supermicron size range, accounting for 5 to 40% of PM.Inorganic ions represent from 5 to 20% of PM, and show anenrichment in the intermediate size intervals, always peak-ing in the 0.42–1.2 mm size range, and they have asignificantly lower contribution to PM in the supermicronsize range during the wet period. Interestingly, the maxi-mum percentage of PM accounted for by inorganic ionsappears in the size interval which includes the ‘‘droplet’’mode evident in the size distributions of PM, potassium andsulphate. Clearly, WSOC are the main contributors to theaerosol mass balance in the submicron size range during allperiods of the experiment, with maxima in the lowest sizerange (0.05–0.14 mm) and in the 0.42–1.2 mm interval. Itshould be noted that the uncertainty associated with theanalysis of the very lightly loaded samples of the wet periodmay be partly responsible for the very high contribution ofWSOM to PM with respect to the lowest size range.[30] Despite some differences observed between the var-
ious periods of the experiment and diurnal/nocturnal con-ditions, we can summarize the mass balance of the aerosolanalyzed within LBA-SMOCC as follows:[31] 1. Particles belonging to the lowest size range
(<�0.4 mm) are characterized by a large fraction of PMconsisting of water-soluble and insoluble carbonaceousspecies, while inorganic ions (mainly potassium and ammo-nium sulphates) represent only 5–15% of that size range.[32] 2. Particles in the size range 0.42–1.2 mm exhibit a
completely different composition, characterized by the high-est contribution from water-soluble compounds (both inor-ganic and organic). WSOC are still dominant, but inorganicions (with ammonium sulphate and, sometimes ammoniumnitrate, as major species) may account for up to 20% of themass.[33] 3. Coarse aerosols are characterized by variable
amounts of WSOC, inorganic ions (with sodium nitrate asthe most abundant compound) and crustal material, plus a
fraction of undetermined insoluble organic species, whichdominate the composition during the transition and wetperiods.[34] Clearly, despite the relatively simple PM size distri-
butions showing one or two distinct modes in the fine andcoarse fractions, the chemical composition varied quitesignificantly as a function of aerosol particle size. Thereforea single homogeneous aerosol composition, or even acomposition differentiated between fine and coarse fractionscannot be justified for model applications.
4. Evolution of the Size-Segregated AerosolChemical Composition From the Dry (BiomassBurning) Period to the Onset of the Wet Season
[35] In the previous sections, average size-segregatedcompositions of the aerosol collected at the FNS site wereobtained for the three main periods of the campaign,separately for samples collected at daytime and nighttime.However, the trend of PM10 (Figure 2a) clearly showssignificant variability within each period, especially in thedry period, when the accumulation of smoke particles wasoccasionally interrupted by sparse but intense precipitationevents. After dry conditions were established again, PM10
levels increased within a couple of days of the propagationof fires. Such changes in rainfall rate and burning activityare, therefore likely to affect the chemical composition ofthe aerosols.[36] In this second part of the study, an attempt is made to
follow the evolution of the aerosol chemical compositionfollowing changes in rainfall rate and source strength, byisolating three subperiods representative of the conditionsoccurring in the dry, transition and wet periods. A summaryof the main meteorological parameters for the selectedsubperiods is provided in Table 3. Subperiods 1 and 2 hadsimilar values of temperature extremes (both minimumand maximum), while the period from 30 October to15 November was characterized by much lower maximumtemperatures. RH followed the rainfall distribution, increas-ing from the first (driest) subperiod to the third one (wetter).Solar radiation was highest in the second subperiod (21–29 October) and lowest in the third one.
4.1. Subperiod 1 (14–22 September 2002)
[37] During this period, the region was very dry (norainfall at all), smoke was constantly produced by wide-spread local and regional fires and maximum temperaturesat the surface reached 34–35�C. The height of the CBLreached 1800–2000 m in the middle of the afternoon,associated with maximum solar radiation fluxes of 800–850 W m�2. RH values ranged from 100% (with foggyconditions) at nighttime till sunrise, to around 40–50% inthe early afternoon.4.1.1. High Time Resolution Aerosol Measurements[38] Just before the period considered here, the passage of
a cold front caused a considerable reduction of PM10
concentrations at the FNS station, down to 20–30 mg m�3,i.e., well below the average for the dry period. Startingon September 16, smoky conditions were observed at theFNS site, causing a marked reduction in visibility duringthe following days. The PM2.5 time trends from TEOMindicate that concentrations increased steadily from 16 to
D01201 FUZZI ET AL.: BIOMASS-BURNING AEROSOL COMPOSITION
15 of 35
D01201

Table
2a.ConcentrationsofSize-Resolved
AerosolChem
ical
ComponentsfortheThreePeriodsoftheCam
paign:Dry
perioda
AD,mm
MinorIons,mg
m�3
NO3�,mgm
�3
SO4=,mgm
�3
NH4+,mgm
�3
K+,mgm
�3
WSOC,mgCm
�3
WSOM,mgm
�3
TCMOUDI,mgC
m�3
Mineral
Fraction
SDI,mgm
�3
PM,mgm
�3
Mean
Standard
Deviation
Mean
Standard
Deviation
Mean
Standard
Deviation
Mean
Standard
Deviation
Mean
Standard
Deviation
Mean
Standard
Deviation
Mean
Standard
Deviation
Mean
Standard
Deviation
Mean
Standard
Deviation
Mean
Standard
Deviation
Night
0.05–0.14
0.02
0.03
0.16
0.17
0.22
0.16
0.14
0.13
0.17
0.12
3.41
2.31
5.73
3.89
8.03
0.99
0.009
0.008
10.32
5.38
0.00
0.01
0.02
0.01
0.02
0.34
0.58
0.45
0.00
0.14–0.42
0.03
0.03
0.45
0.45
0.55
0.27
0.34
0.22
0.40
0.26
6.63
4.10
11.92
7.39
22.44
2.81
0.015
0.009
27.49
15.22
0.00
0.01
0.03
0.01
0.02
0.25
0.45
0.47
0.00
0.42–1.2
0.11
0.10
1.63
1.19
1.99
0.78
1.58
0.85
0.82
0.46
13.68
8.05
25.28
15.02
26.96
7.55
0.220
0.167
37.62
21.46
0.00
0.04
0.06
0.04
0.02
0.36
0.67
0.46
0.01
1.2–3.5
0.12
0.08
0.25
0.22
0.18
0.18
0.14
0.17
0.08
0.07
1.66
1.43
2.83
2.44
3.01
1.54
1.340
1.000
7.44
5.07
0.02
0.03
0.02
0.02
0.01
0.22
0.38
0.31
0.18
3.5–10
0.19
0.14
0.26
0.20
0.06
0.05
0.04
0.04
0.09
0.04
1.75
0.72
2.95
1.21
1.81
0.26
2.002
1.364
9.77
2.33
0.02
0.02
0.01
0.00
0.01
0.18
0.30
0.16
0.21
Day
0.05–0.14
0.01
0.01
0.09
0.13
0.33
0.28
0.15
0.06
0.13
0.05
2.57
1.26
4.58
2.26
3.18
2.03
0.012
0.010
7.12
3.78
0.00
0.01
0.05
0.02
0.02
0.36
0.65
0.28
0.00
0.14–0.42
0.02
0.01
0.18
0.27
0.78
0.40
0.38
0.19
0.33
0.16
6.74
3.79
12.31
7.02
11.74
5.39
0.020
0.013
19.91
12.08
0.00
0.01
0.04
0.02
0.02
0.34
0.63
0.40
0.00
0.42–1.2
0.07
0.12
0.31
0.33
0.94
0.47
0.55
0.32
0.32
0.18
5.95
3.66
10.93
6.86
10.71
5.29
0.138
0.093
13.99
9.30
0.01
0.02
0.08
0.04
0.02
0.43
0.78
0.52
0.01
1.2–3.5
0.15
0.08
0.15
0.12
0.12
0.11
0.05
0.08
0.05
0.09
1.00
1.44
1.74
2.60
6.03
10.95
0.813
0.479
4.78
5.84
0.04
0.04
0.03
0.01
0.01
0.19
0.33
0.20
0.24
3.5–10
0.20
0.10
0.30
0.36
0.17
0.46
0.10
0.37
0.08
0.19
1.38
3.08
2.45
5.71
6.95
13.34
1.180
0.614
6.68
7.87
0.04
0.05
0.02
0.01
0.01
0.16
0.27
0.15
0.25
aDry
periodandforday
andnightconditions.Datareferto
theanalysisoftheBIsample
set,unless
otherwiseindicated.Theconcentrationsdetermined
onthehigh-resolutionmultistageim
pactors(SDI,MOUDI,
DLPI)havebeensummed
into
thesize
ranges
defined
bytheBIcut-offs.Meanconcentrationsarereported
togetherwithstandarddeviationsandthePM
fractions(initalics)accountedforbyeach
chem
icalspecies.For
thetransitionandwet
periodsamples,PM
fractionsarecalculatedwithrespectto
PM
(DLPI)concentrations.Minorions=Cl�
+Na+
+Mg2++Ca2
+.
D01201 FUZZI ET AL.: BIOMASS-BURNING AEROSOL COMPOSITION
16 of 35
D01201

Table
2b.ConcentrationsofSize-Resolved
AerosolChem
ical
ComponentsfortheThreePeriodsoftheCam
paign:TransitionPerioda
AD,mm
MinorIons,mg
m�3
NO3�,mgm
�3
SO4=,mgm
�3
NH4+,mgm
�3
K+,mgm
�3
WSOC,mgC
m�3
WSOM,mgm
�3
TCDLPI,mgC
m�3
Mineral
Fraction
SDI,mgm
�3
PM
DLPI,mg
m�3
PM
MOUDI,mg
m�3
Mean
Standard
Deviation
Mean
Standard
Deviation
Mean
Standard
Deviation
Mean
Standard
Deviation
Mean
Standard
Deviation
Mean
Standard
Deviation
Mean
Standard
Deviation
Mean
Standard
Deviation
Mean
Standard
Deviation
Mean
Standard
Deviation
Mean
Standard
Deviation
Night
0.05–0.14
0.002
0.001
0.006
0.004
0.049
0.025
0.015
0.007
0.030
0.014
0.60
0.31
1.17
0.61
1.20
0.001
0.000
1.12
1.91
1.20
0.00
0.00
0.03
0.01
0.02
0.30
0.59
1.07
0.00
0.14–0.42
0.008
0.003
0.044
0.014
0.498
0.146
0.175
0.039
0.171
0.051
2.97
0.97
5.72
1.91
5.74
0.008
0.001
7.06
7.87
3.11
0.00
0.01
0.08
0.03
0.02
0.34
0.65
0.81
0.00
0.42–1.2
0.026
0.018
0.151
0.073
0.905
0.399
0.364
0.142
0.213
0.079
3.59
1.56
6.74
2.94
6.87
0.085
0.025
9.85
8.76
3.56
0.00
0.02
0.10
0.04
0.02
0.35
0.65
0.70
0.01
1.2–3.5
0.115
0.064
0.146
0.044
0.146
0.051
0.038
0.014
0.044
0.004
0.84
0.06
1.67
0.10
2.89
0.332
0.118
4.25
3.92
0.88
0.03
0.04
0.04
0.01
0.01
0.21
0.41
0.68
0.11
3.5–10
0.073
0.035
0.124
0.033
0.017
0.015
0.004
0.001
0.044
0.009
0.85
0.31
1.59
0.57
2.29
0.594
0.316
3.09
5.18
1.06
0.03
0.05
0.00
0.00
0.01
0.32
0.58
0.74
0.29
Day
0.05–0.14
0.002
0.002
0.001
0.001
0.055
0.058
0.026
0.013
0.024
0.012
0.42
0.15
0.79
0.30
1.13
0.17
0.002
0.000
1.56
0.02
1.57
0.76
0.00
0.00
0.01
0.01
0.01
0.24
0.46
0.72
0.00
0.14–0.42
0.012
0.005
0.008
0.002
0.391
0.138
0.134
0.038
0.103
0.039
1.72
0.37
3.24
0.72
4.36
0.13
0.016
0.006
5.26
0.61
3.47
1.06
0.00
0.00
0.06
0.02
0.02
0.29
0.55
0.84
0.00
0.42–1.2
0.015
0.004
0.012
0.004
0.564
0.235
0.201
0.074
0.101
0.031
1.59
0.35
2.93
0.66
2.84
0.65
0.126
0.034
4.23
0.73
3.91
1.08
0.00
0.00
0.10
0.04
0.02
0.33
0.60
0.67
0.03
1.2–3.5
0.152
0.078
0.136
0.067
0.102
0.089
0.004
0.000
0.023
0.003
0.38
0.08
0.72
0.15
0.90
0.12
0.334
0.061
2.01
0.06
1.72
0.25
0.05
0.05
0.01
0.00
0.01
0.17
0.32
0.45
0.19
3.5–10
0.069
0.047
0.099
0.066
0.060
0.088
0.002
0.001
0.016
0.000
0.20
0.03
0.35
0.07
0.37
0.16
0.616
0.160
1.27
0.04
1.66
0.24
0.03
0.05
0.01
0.00
0.01
0.14
0.24
0.30
0.49
aAsin
Table
2a,
butforthetransitionperiod.
D01201 FUZZI ET AL.: BIOMASS-BURNING AEROSOL COMPOSITION
17 of 35
D01201

Table
2c.
ConcentrationsofSize-Resolved
AerosolChem
ical
ComponentsfortheThreePeriodsoftheCam
paign:Wet
Perioda
AD,mm
MinorIons,mg
m�3
NO3�,mgm
�3
SO4=,mgm
�3
NH4+,mgm
�3
K+,mgm
�3
WSOC,mgC
m�3
WSOM,mgm
�3
TCDLPI,mgC
m�3
Mineral
fraction
SDI,mgm
�3
PM
DLPI,mg
m�3
PM
MOUDI,mg
m�3
Mean
Standard
Deviation
Mean
Standard
Deviation
Mean
Standard
Deviation
Mean
Standard
Deviation
Mean
Standard
Deviation
Mean
Standard
Deviation
Mean
Standard
Deviation
Mean
Standard
Deviation
Mean
Standard
Deviation
Mean
Standard
Deviation
Mean
Standard
Deviation
Night
0.05–0.14
0.008
0.008
0.004
0.004
0.012
0.012
0.010
0.010
0.008
0.008
0.22
0.22
0.41
0.41
0.40
0.40
0.003
0.003
0.38
0.38
0.38
0.38
0.01
0.01
0.04
0.02
0.02
0.57
1.08
1.38
0.00
0.14–0.42
0.004
0.004
0.029
0.029
0.106
0.106
0.056
0.056
0.024
0.024
0.67
0.67
1.27
1.27
1.46
1.46
0.003
0.003
1.56
1.56
1.65
1.65
0.00
0.02
0.06
0.04
0.02
0.44
0.73
0.84
0.00
0.42–1.2
0.003
0.003
0.091
0.091
0.163
0.163
0.104
0.104
0.036
0.036
0.91
0.91
1.69
1.69
1.25
1.25
0.011
0.011
1.90
1.90
1.88
1.88
0.00
0.05
0.09
0.06
0.02
0.49
0.70
0.66
0.01
1.2–3.5
0.016
0.016
0.021
0.021
0.037
0.037
0.019
0.019
0.019
0.019
0.33
0.33
0.59
0.59
1.61
1.61
0.112
0.112
2.01
2.01
2.12
2.12
0.01
0.01
0.02
0.01
0.01
0.17
0.23
0.78
0.07
3.5–10
0.016
0.016
0.011
0.011
0.015
0.015
0.002
0.002
0.030
0.030
0.44
0.44
0.81
0.81
1.77
1.77
0.204
0.204
2.28
2.28
4.77
4.77
0.01
0.01
0.01
0.00
0.01
0.18
0.24
0.85
0.13
Day
0.05–0.14
0.001
0.001
0.001
0.001
0.013
0.013
0.004
0.004
0.003
0.003
0.07
0.07
0.14
0.14
0.04
0.04
0.006
0.006
0.21
0.21
0.21
0.21
0.00
0.00
0.05
0.02
0.01
0.27
0.54
0.38
0.02
0.14–0.42
0.007
0.007
0.005
0.005
0.115
0.115
0.043
0.043
0.011
0.011
0.35
0.35
0.64
0.64
0.47
0.47
0.003
0.003
1.31
1.31
1.05
1.05
0.00
0.00
0.13
0.05
0.01
0.35
0.66
0.67
0.00
0.42–1.2
0.002
0.002
0.002
0.002
0.085
0.085
0.027
0.027
0.010
0.010
0.19
0.19
0.37
0.37
0.24
0.24
0.029
0.029
1.03
1.03
0.97
0.97
0.00
0.00
0.18
0.06
0.02
0.35
0.68
0.72
0.07
1.2–3.5
0.012
0.012
0.007
0.007
0.018
0.018
0.003
0.003
0.008
0.008
0.10
0.10
0.19
0.19
0.28
0.28
0.095
0.095
0.59
0.59
0.84
0.84
0.02
0.01
0.04
0.01
0.01
0.18
0.36
0.80
0.22
3.5–10
0.007
0.007
0.010
0.010
0.006
0.006
0.001
0.001
0.006
0.006
0.07
0.07
0.12
0.12
0.22
0.22
0.128
0.128
0.45
0.45
0.97
0.97
0.01
0.02
0.01
0.00
0.01
0.15
0.29
0.65
0.32
aAsin
Table
2a,
butforthewet
period.
D01201 FUZZI ET AL.: BIOMASS-BURNING AEROSOL COMPOSITION
18 of 35
D01201
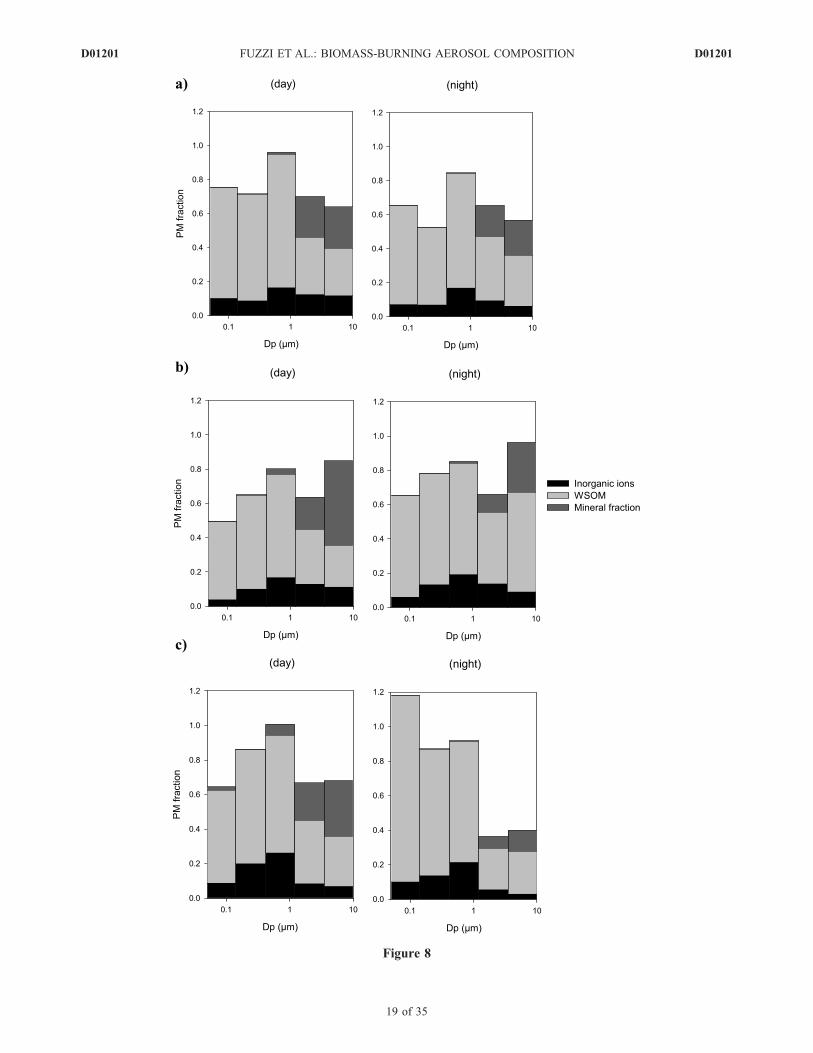
Figure 8
D01201 FUZZI ET AL.: BIOMASS-BURNING AEROSOL COMPOSITION
19 of 35
D01201

21 September (Figure 10). The concentrations of PM10
deviated very little from that of PM2.5 (r2 = 0.97). In thisperiod, the fairly constant ratio between the concentra-tions of CO and PM2.5 (0.080 ± 0.014, mg m�3 ppb�1)indicates that (1) fires were essentially responsible for theobserved aerosol levels; (2) aerosols did not experienceany important loss, while their concentration was simplydependent on the intensity of the sources, the transport to/from the area and the dynamics of the boundary layer.During the biomass-burning period, the concentrations ofpyrogenic trace gases and of PM showed clear diurnaloscillations, which are linked to the cycle of the boundarylayer. This means that combustion sources were activethroughout the day and the night, and that the concen-tration peaks observed at nighttime are due to theaccumulation of freshly produced aerosol particles in thenocturnal surface layer. Concentrations dropped after sunrisebecause of the increase in the height of the mixing layer.During the day, the emissions from new fires led to a veryslight increase in the concentrations since the boundary layerwas thicker and well mixed. At the same time, more agedparticles from the upper layers, which had been isolated fromthe surface during the night, entered the boundary layer andreached the ground. Therefore the aerosol at the ground levelwas a mixture of fresh and aged particles during the day,whereas the increase in the nocturnal aerosol concentrationswas only due to fresh aerosol emitted after sunset.[39] The concentrations of aerosol TC from the carbon
monitor follow exactly the same trend as PM2.5, confirmingthat biomass-burning particles are mainly carbonaceous(Figure 10). The carbon monitor discriminates betweenrefractory carbon evolving above 350�C and the morevolatile carbon species. The ratio between the refractorycarbon and TC was �0.3, with no clear trend between14 and 16 September. On subsequent days, after theincrease of biomass-burning activities, this ratio oscillatesbetween 0.2 at night and 0.3 during the day. The enrichmentin refractory carbon during the day can be due to widespreadflaming combustion, peaking in the afternoon, whereas morefrequent smouldering conditions typically occurred duringthe night. Smouldering combustion is known to emit particleswith a lower refractory carbon to TC ratio compared toflaming conditions [Rau, 1989]. Photochemical reactionscan also contribute to the formation of refractory carbonduring the day [Hoffer et al., 2005]. In any case, the measure-ments provided by the carbon monitor clearly indicate thatthe carbonaceous material in freshly produced particlesovernight has a different composition compared to the moreaged one of daytime aerosol.4.1.2. Time-Integrated Measurements[40] For the 14–22 September period, impactor measure-
ments integrated over 12 h are available from the 11-stageMOUDI, SDI and the BI. Sampling with several filterdevices was also performed in parallel with the impactors.The trend of PM1.8 from MOUDI is consistent with theTEOM PM2.5 concentration trend, showing large diurnalvariations after 15 September. Average nocturnal concen-
trations increased four times from 14 to 20 September,while the increase in the average daytime concentrationsis of �2.5 times. 21 September was atypical, showing muchhigher daytime concentrations compared to the previousdays. The high time resolution measurements by TEOM andthe carbon monitor (Figure 10) suggest that the evolution ofthe mixing layer and the consequent dispersal of thenocturnal aerosol were retarded that day until afternoon.Therefore the time-integrated impactor and filter samplesfor 21 September likely contained aerosol particles of thenocturnal surface layer of the night before.[41] The TC and WSOC in PM2.5 determined on HVDS
samples follow the same trend as fine PM (Figure 11a)(r2 = 0.93 for both TC(HVDS) vs. PM1.8(MOUDI) andWSOC(HVDS) vs. PM1.8(MOUDI)), confirming the evidencefrom the mass balance results (Figure 8) that the fine PMduring the biomass-burning period was constituted mostlyby organic compounds. Also the concentrations of themajor inorganic species, determined in fine aerosol sam-ples from filter and impactor measurements, increasedafter 15 September (Figure 11b), indicating that theyare also products of biomass burning. However, while thetrend of potassium concentration overlaps with those of PM,TC and WSOC (r2 = 0.92 for K(SDI) vs. PM1.8(MOUDI)),sulphate and nitrate profiles show a weaker correlation (r2 =0.64 and 0.86, respectively, for sulphate(SDI) vs. PM1.8(MOUDI)
and nitrate(BI) vs. PM1.8(MOUDI)). In the case of nitrate inPM1.2 (from the sum of the concentrations in the first threestages of the BI), only the nighttime concentrationsunderwent a sudden increase, starting on the night of16–17 September and peaking at 4 mg m�3. Conversely, thedaytime concentrations remained below 0.5 mg m�3 through-out thewhole period, with the exception of 21 September. Thestable meteorological conditions encountered at the FNSfrom 15 to 21 September were characterized by markeddifferences of T and RH values between day and night. Thiscaused aerosol nitrate to evaporate forming gaseous nitricacid during daytime, followed by recondensation of nitricacid and ammonia onto particles during the night [Trebs et al.,2004, 2005]. Sulphate in PM1.7 (from SDI) shows an averageincrease of only a factor of two (from 2 to 4 mg m�3). Thetrend of sulphate concentrations shows no diurnal variationand reflects that of its precursor in the gas phase, sulphurdioxide [Trebs et al., 2004].[42] From the analysis of trends in the concentrations of
PM and the main carbonaceous and inorganic components,it can be concluded that biomass-burning activities wereresponsible for the increase in both inorganic and organiccompounds concentrations in the aerosol observed from16 to 21 September. However, the increase of PM wasdriven mostly by TC, whereas only a limited increase insulphate concentrations was observed, and nitrate contrib-uted only at nighttime. Regression analysis of sulphateconcentrations versus fine PM levels indicates that inconditions of very low PM concentrations, there is asulphate ‘‘background’’ of �2 mg m�3. A good correlationbetween TC, PM, potassium and CO was found for both
Figure 8. Size-segregated aerosol mass balance on the chemical species in the dry, transition and wet periods and for dayand night samples. Mineral fraction = estimated mass fraction due to insoluble inorganic oxides; WSOM = water-solubleorganic mass; inorganic ions = water-soluble inorganic ionic material. (a) Dry period; (b) transition period; (c) wet period.
D01201 FUZZI ET AL.: BIOMASS-BURNING AEROSOL COMPOSITION
20 of 35
D01201

Figure 9. Size-resolved contribution of inorganic ionic species to PM for the dry, transition and wetperiods and for day and night samples. (a) Dry period; (b) transition period; (c) wet period.
D01201 FUZZI ET AL.: BIOMASS-BURNING AEROSOL COMPOSITION
21 of 35
D01201

nocturnal and diurnal samples, irrespectively of the varia-tions in relative humidity, temperature and oxidizing capac-ity of the atmosphere, indicating that the carbonaceousparticles produced by biomass burning were mainly primarycompounds, or at least formed very close to the fires, as alsoshown by Guyon et al. [2005]. The contribution of second-ary compounds, like nitrate and sulphates, to PM is mini-mal. The good agreement between the trend of WSOC andthat of potassium (r2 = 0.93) suggests that the polar fractionof particulate organic compounds was also mainly ofprimary origin or formed during the early ageing of theplumes.4.1.3. Size-Segregated Inorganic Composition[43] The conclusions on the relative importance of the
various sources of fine PM during dry polluted conditionsare not necessarily valid when considering specific sizefractions. The evolution of the composition of fine particlesin the size ranges 0.05–0.14, 0.14–0.42 and 0.42–1.2 mmof the 5-stage BI is shown in Figure 12. During the initialless polluted conditions, there was a ‘‘background’’ ofaerosols characterized by a relatively high amount ofsulphate, especially in the 0.42–1.2 mm size range. Highconcentrations of SO2, up to several hundreds ppt in themiddle to upper troposphere, have been detected overnorthern Sao Paulo state (F. Arnold, personal communica-
tion, 2005), most likely deriving from fossil fuel andindustrial emissions. This evidence supports the hypothesisof a contribution to the observed ‘‘background’’ sulphateaerosols at the FNS from long-range transport of pollutedair masses from distant sources.[44] After 15 September, the SO4/PM ratio shows clear
minima during the nights, which is correlated with thesignificant increase in the concentrations of sulphate-poorcarbonaceous particles in the nocturnal surface layer afterthe onset of widespread biomass combustion. As aconsequence, organic compounds and potassium becamesystematically enriched relatively to sulphate at nighttime(Figures 12b and 12c). However, the decrease of sulphatecontribution to PM during the night was much morerelevant in the finest size intervals (0.05–0.14 and0.14–0.42 mm) compared to the 0.42–1.2 mm size range.[45] The figure also shows that the daytime SO4/PM,
SO4/K and SO4/WSOC ratios were initially rather constant,but starting on 19 September, after about three days ofpersistent biomass-burning emissions in a stable atmo-sphere, they also showed a negative trend, reaching aminimum on 21 September. At that time, the contributionof sulphate to PM was reduced by almost a factor of 2 in the0.42–1.2 mm range, compared to the initial less pollutedconditions. This finding can be explained by a slow accu-
Table 3. Statistics of Temperature, Relative Humidity, and Solar Radiation
14–22 Sept 21–29 Oct 31 Oct to 15 Nov
Temperature (�C) Min 22.4 23.3 22.8Max 34.3 34.2 30.8Mean 27.9 28.1 25.8
Relative humidity (%) Min 49 53 66Max 98 98 99Mean 76 79 87
Solar radiation Integrated (MJ m�2 day�1) 18.3 21.6 16.9Max (W m�2) 782 812 670
Figure 10. Trends of CO, PM10, PM2.5 and aerosol TC concentrations determined by high timeresolution measurements during the period 14–21 September. The ratio between refractory carbon andTC determined by the carbon monitor is also reported. The horizontal scale is in local time units.
D01201 FUZZI ET AL.: BIOMASS-BURNING AEROSOL COMPOSITION
22 of 35
D01201

mulation of sulphate-poor carbonaceous particles producedovernight in the CBL.[46] In conclusion, the onset of stable dry conditions with
consequent accumulation of biomass-burning smoke in theboundary layer did not lead to a progressive ageing of theaerosol. On the contrary, it caused a replacement (rapid andalmost complete for the finest size range of the aerosol inthe nocturnal surface layer; slower and partial for largerparticles in the diurnal mixing layer) of the backgroundsulphate aerosols with fresh carbonaceous aerosols pro-duced mainly by smouldering fires.4.1.4. Size-Segregated Organic Composition[47] The extensive analyses of the polar organic
compounds performed during the SMOCC experiment[Falkovich et al., 2005; Schkolnik et al., 2005; Decesariet al., 2006] allowed the tracing of changes in the aerosolorganic composition (Figure 13), analogous to the aboveobservations for inorganic compounds.[48] The concentrations of the most abundant speciated
compounds, e.g., polyhydroxylated compounds (mainlylevoglucosan), determined in PM2.5 HVDS samples[Decesari et al., 2006], show a clear diurnal variation withenrichment during the night. This is due to the fact thathigher levels of levoglucosan and anhydrosugars are emit-
ted for smouldering combustion than for flaming fires[Schkolnik et al., 2005].[49] Neutral compounds (NC) from IC-UV analysis of BI
samples [Decesari et al., 2006] were enriched in WSOCduring the night, especially in the smallest size range.The diurnal variations became more pronounced after16 September, closely following those of polyhydroxylatedcompounds, suggesting that the processes leading to theproduction of the anhydrosugars were also responsible forthe formation of most of the other nonacidic organiccompounds.[50] The concentrations of polyacidic compounds (PA)
also show diurnal variations (but not before 16 September)especially in the finest particles, however, contrary to NC,their contribution to WSOC was higher during daytime.This trend is in agreement with that of high molecularweight (HMW) WSOC determined by EGA analysis onfilter samples [Hoffer et al., 2005], and also with themeasurements of refractory carbon performed by the carbonmonitor. All these measurements point to the same conclu-sion that the processes leading to the formation of HMWorganic material are less efficient during smouldering com-bustion, mostly occurring overnight. According to labora-tory experiments showing that HMW organic compoundscan form by oxidation of simple organic molecules by H2O2
Figure 11. Trends of (a) PM, TC, WSOC and (b) main inorganic species concentrations in thesubmicrometer fraction of the aerosol in the period 14–21 September. The carbon fractions weredetermined on HVDS filter samples (PM2.5), whereas PM and the inorganic ions concentrations werederived from impactor data integrated over the submicron size range: PM1.8, PM1.7 and PM1.2 forMOUDI, SDI and BI, respectively. The horizontal scale is in local time units.
D01201 FUZZI ET AL.: BIOMASS-BURNING AEROSOL COMPOSITION
23 of 35
D01201

in liquid particles [Gelencser et al., 2003], it was alsohypothesized that photochemistry may have played a rolein the diurnal variation of WSOC chemical composition[Hoffer et al., 2005].[51] In summary, when the meteorological conditions
were stable, the enhanced emission of primary TC andWSOC from fires triggered the sharp increase in fine PMconcentrations in Rondonia. However, the chemical com-position of the carbonaceous material was not constant withtime and not homogenous over the aerosol size spectrum. Inparticular, fresh organic material, characterized by a highcontent of levoglucosan and other hydroxylatedcompounds, was emitted overnight by smouldering fires.These freshly produced compounds were superimposed(especially in the finest size ranges) on particles enrichedin high molecular weight, thermally refractory organiccompounds, which had been initially dominant in thedaytime boundary layer. The enrichment of high molecularweight organic compounds in the daytime CBL aerosol
could be due to either strong emission from flaming fires orto chemical ageing of the aerosol.
4.2. Subperiod 2 (21–29 October 2002)
[52] During this period, the only precipitation event wason 21 October, when a rainfall (12.3 mm) occurred in theearly evening. However, it should be emphasized that from17 until 21 October, heavy rainfall took place (total precip-itation amounted to 100 mm over 4 days) and the soil waswet. Cloudy conditions characterized by a reduced height ofthe boundary layer (1000–1300 m) were encountered on21–23 and 25–26 October. Toward the end of the period,clear sky conditions prevailed and the height of the mixinglayer reached 1500 m.[53] Extremes of temperature ranged between 22–24�C
and 33–35�C. The RH values ranged between 50–60%during midafternoon and 95–100% after sunset. No large-scale meteorological phenomena influenced the weather atthe site. The rainfall was mostly due to local convection andsparse isolated cells.
Figure 12. Size-segregated ratios of sulphate to (a) PM, (b) K and (c) WSOC, determined on the 5-stageBI for the period 14–21 September. The submicron size intervals of the BI are reported in the legend:0.05–0.14, 0.14–0.42, 0.42–1.2 mm. The horizontal scale is in local time units.
D01201 FUZZI ET AL.: BIOMASS-BURNING AEROSOL COMPOSITION
24 of 35
D01201
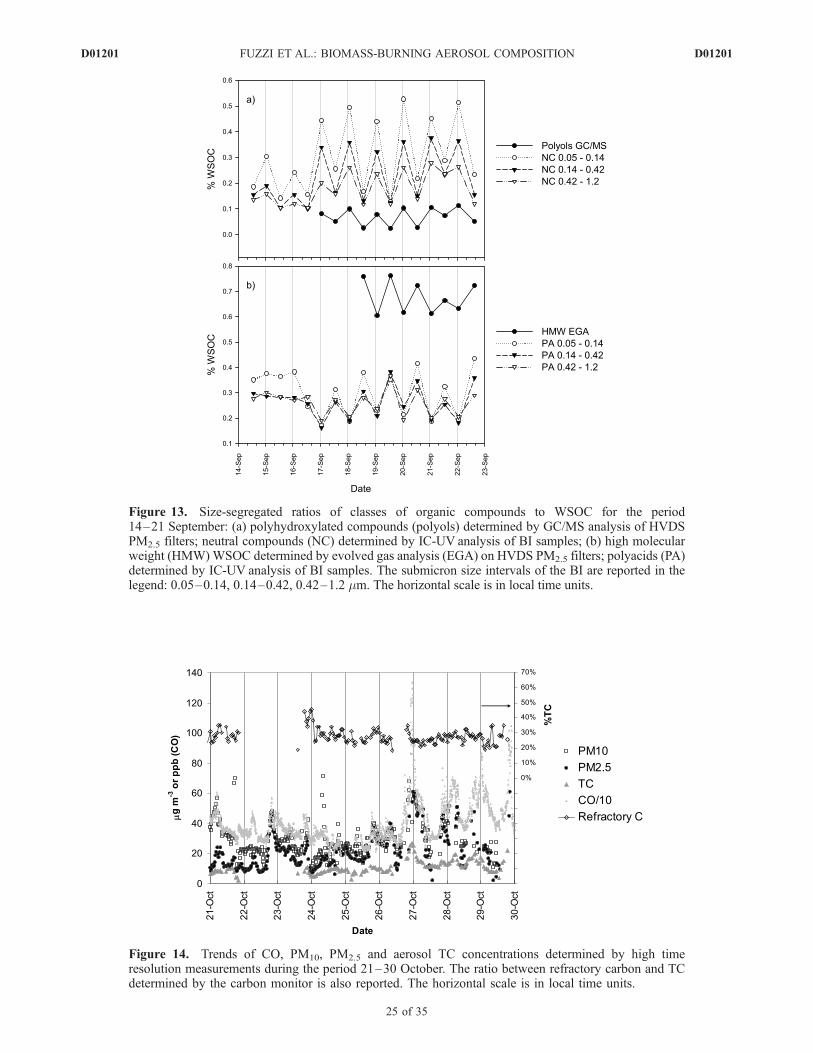
Figure 13. Size-segregated ratios of classes of organic compounds to WSOC for the period14–21 September: (a) polyhydroxylated compounds (polyols) determined by GC/MS analysis of HVDSPM2.5 filters; neutral compounds (NC) determined by IC-UV analysis of BI samples; (b) high molecularweight (HMW)WSOC determined by evolved gas analysis (EGA) on HVDS PM2.5 filters; polyacids (PA)determined by IC-UV analysis of BI samples. The submicron size intervals of the BI are reported in thelegend: 0.05–0.14, 0.14–0.42, 0.42–1.2 mm. The horizontal scale is in local time units.
Figure 14. Trends of CO, PM10, PM2.5 and aerosol TC concentrations determined by high timeresolution measurements during the period 21–30 October. The ratio between refractory carbon and TCdetermined by the carbon monitor is also reported. The horizontal scale is in local time units.
D01201 FUZZI ET AL.: BIOMASS-BURNING AEROSOL COMPOSITION
25 of 35
D01201

4.2.1. High Time Resolution Aerosol Measurements[54] The trends of CO and PM10 and PM2.5 from TEOM
(Figure 14) show rather irregular profiles during the firstpart of the period, from 20 to 24 October, and large diurnaloscillations over the subsequent days, displaying the samedynamics already observed in the dry period: as soon as themeteorological conditions became stable, the burning activ-ities in the region resumed, leading to a steep increase in theconcentrations of CO and PM in the shallow nocturnalsurface layer. The increase in daytime concentrations wasless marked compared to nighttime, because the rise in theheight of the mixing layer (reaching 1500 m by the end ofthe period) compensated for the stronger emissions fromnew fires. The close correlation between the profile of COconcentration and that of PM concentration characteristic ofthe dry period does not exist in this case. The COconcentrations varied between 300 and 500 ppb from21 to 26 October, reaching 700 ppb during nighttime ofthe subsequent days. The PM10 and PM2.5 concentrationmaxima usually corresponded to those of CO, but TEOMprofiles indicate that aerosol concentrations were muchmore variable than those of CO throughout the period.[55] Unlike during the dry period, in the transition period
the same straight correlation between the time series ofPM2.5 and PM10 is not observed. The PM10 was oftensignificantly higher than PM2.5, up to a factor of two, on21–23 October, while the two trends overlap quite wellduring the following period characterized by drier condi-tions. Conversely, there is always a good agreementbetween the trends of PM2.5 and TC from the carbonmonitor, with an average TC/PM ratio of about 0.44. Thesedata indicate that during the transition phase, submicrometerparticles were still dominated by carbonaceous aerosolsemitted by biomass burning. However, the levels of PM10
concentrations from TEOM were rather constant throughoutthe period, because the lower concentrations of biomass-burning particles during the first days characterized byrelatively wet conditions were compensated by higherconcentrations of coarse-mode particles, possibly due tosuspension of particles by winds associated with the passageof storms.4.2.2. Time-Integrated Aerosol Measurements[56] Sampling with filters and impactors during the tran-
sition period was performed over time intervals of approx-imately 24 hours. Samples of filter devices, DLPI, BI and11-stage MOUDI were collected in parallel during twoconsecutive nights or days. The concentrations of PM10,PM2.5, TC and WSOC determined on filter samples show anincrease of a factor of two in both daytime and nighttimeconcentrations throughout the period (Figure 15a). Thisindicates that also during the transition period the submi-crometer aerosols were mainly carbonaceous particles frombiomass burning. It should be noted that the rise in thepyrogenic particle concentration after the end of a rain eventwas modest in the transition period compared to the dryperiod, when PM2.5 and TC concentrations increased by afactor of four in only two days without precipitation.[57] The analysis of the major inorganic ions in submi-
cron aerosol from integrated impactor samples shows thatsulphate dominated the inorganic composition throughoutthe period (Figure 15b). Particulate nitrate was also ob-served in the nocturnal samples but, contrary to the dry
period, the concentrations stayed well below those ofsulphate. The ratios K/SO4 were also on average lower inthe transition period compared to the dry period, indicatinga higher proportion of ionic material formed by secondaryprocesses, which is consistent with the more aged characterof the combustion products as indicated by the CO profiles.In fact, SO2 levels in the transition period, determined by thewet annular denudermeasurements, were about 100–200ppb[Trebs et al., 2004], i.e., 1/3–1/2 of those observed in the14–21 September period. This explains why the concen-trations of particulate sulphate in PM1.7 (from integratedSDI stages) during the transition period (1 to 2 mg m�3)were only half of those found for the dry period, despitea decrease of 4–5 times in PM2.5 and TC. Apparently,relatively high background concentrations of sulphurdioxide ensured a stable reservoir of sulphate aerosols,which became important, compared to the other aerosolconstituents (i.e., TC, K salts and nitrate) outside theperiod of more intense fire activity. This offers anexplanation for the generally high contribution of sulphateto the aerosol mass budget shown in Figure 9. Actually,the conversion of sulphur dioxide to sulphate is not likelyto be constant during the experiment, because of thevarious ambient conditions influencing the photochemicalactivity and the in-cloud oxidation processes. During theperiod considered here (21–29 October), the daytimeconcentrations of sulphate increased by a factor of twofrom 20–21 October to 26–27 October. Conversely, thenighttime concentrations increased by only 25% over theperiod. This suggests that the clear-sky conditions en-countered after 24 October increased the production ofsulphate in daytime compared to that at nighttime. Bycontrast, the effect of cloud processing in sulphate for-mation cannot be clearly evidenced.4.2.3. Size-Segregated Inorganic Composition[58] The changes in the size-segregated SO4/WSOC and
SO4/K ratios in the period 20–29 October are shown inFigures 16a and 16b. Data were obtained from BI samples.Since each sample was collected over two 12-hour timeintervals for two consecutive nights or days, the diurnalvariations in the chemical composition could not be fol-lowed in a continuous way. However, Figures 16a and 16bclearly shows that systematic differences between the diur-nal and nocturnal compositions were encountered in thisperiod, suggesting that the processes responsible for aerosolformation in the transition period were similar to thoseactive in the dry period. The enrichment of potassium andorganics relative to sulphate in submicron particles duringthe night is clearly seen throughout the period. Suchenrichment is more significant in the smallest particles(a factor of two in the 0.05–0.14 mm size range). Thisindicates that primary compounds from smouldering sour-ces during nighttime affect the composition of the aerosolmainly in the lowest size range. Similar results wereobtained for the period of most intense burning (seeFigure 12). However, in the dry period, the nocturnal enrich-ment of potassium and organics relative to sulphatewas largerby a factor of two for particles up to 0.42 mm size range.[59] In conclusion, changes in the size-segregated aerosol
composition due to the diurnal evolution of the pyrogenicsources and of the boundary layer structure were foundthroughout the period considered here, indicating that the
D01201 FUZZI ET AL.: BIOMASS-BURNING AEROSOL COMPOSITION
26 of 35
D01201

aerosol composition was affected by relatively fresh smokeparticles. The dynamics of aerosol formation and transfor-mation by such emissions are the same as those identified inthe dry period. However, primary biomass-burning com-pounds, traced by low SO4/K ratios, affected the composi-tion of aerosol particles with diameter larger than 0.14 mmto a lesser extent in the transition period compared to the dryperiod. Furthermore, the sulphate contribution in the sizerange 0.14–1.2 mm shows no trend during the transitionperiod, indicating that there is no accumulation of freshaerosol particles produced overnight in the diurnal CBL.Such relatively stable aged population of sulphate-rich
aerosol particles can be responsible for the backgroundconcentrations of PM2.5 particles as seen in the TEOM timetrends.4.2.4. Size-Segregated Organic Composition[60] Figures 17a and 17b provides insights into the
changes in the chemical composition of the polar fractionof aerosol OC (WSOC). The relative contributions of thechemical classes determined by IC-UV analysis of the BIsamples are shown in the figure, together with the HMW-WSOC from EGA analysis and the poly hydroxylatedcompounds (mainly anhydrosugars) from GC/MS. As inthe dry period, neutral compounds (NC) and anhydrosugars
Figure 15. (a) Concentrations of PM10, PM2, TC and WSOC determined in filter samples in the period21–30 October. b) Concentrations of the main inorganic ions from impactor data integrated over thesubmicron size range, in the same period: PM1.7 and PM1.2 for SDI and BI, respectively. The COconcentration profile is also shown in the figure. ‘D’ and ‘N’ refer to day and night. The horizontal scaleis in local time units.
D01201 FUZZI ET AL.: BIOMASS-BURNING AEROSOL COMPOSITION
27 of 35
D01201

are enriched compared to total WSOC in the nocturnalsamples in all size ranges (Figure 17a). On the other hand,polyacids (PA) do not show any clear diurnal maxima, butthere is a slight enrichment in WSOC in the 0.14–0.42 mmsize range. The HMW fraction of WSOC by EGA analysisstill shows a diurnal variation, which is much less pro-nounced than during the dry period (Figure 17b). Thesefindings are in agreement with the measurements of thecarbon monitor, which showed a rather constant fraction ofrefractory carbon throughout the period. According toHoffer et al. [2005], HMW organic compounds are formedcontinuously during the ageing of the aerosol throughpolymerization of aromatic acids promoted by sunlight.Following this hypothesis, the higher proportion of HMWcompounds with less diurnal variations in the transitionperiod compared to the dry period, should be attributed tothe more aged character of the aerosol. However, thepatterns in the NC composition indicate that some distinctevolution processes in the WSOC composition linked to thebiomass-burning activity of the dry period are still active inthe transition period.
4.3. Subperiod 3 (31 October to 15 November 2002)
[61] Meteorological conditions in this period were verysimilar to the transition case. Extremes of temperatureranged between 22–23�C for the lowest values and30–31�C for the highest values. The RH values ranged
between 65–70% during midafternoon and 95–100%near sunrise. The numerous rain events during this period,with a total of 50.5 mm of rain in the first 10 days ofNovember reduced the amount of solar radiation reachingthe surface. No radiosoundings are available for the period.[62] At the beginning of November, only 24 fire spots
were reported in Rondonia (Figure 2b) for the first 15 days,as measured by NOAA-14. However, fires were still activein the nearby Mato Grosso state (Figure 1c), with theoccurrence of 497 fires in the period November 1–15.4.3.1. High Time Resolution Aerosol Measurements[63] The trend of CO concentration shows a slight
decrease from the last, relatively polluted, days of October,down to �200 ppb, with no further change during the firsttwo weeks of November (Figure 18). This indicates that theproducts of combustion with relatively long lifetime werewell mixed in the boundary layer, which can be explainedby a longer-range transport. Therefore at the onset of thewet season, the distributions of the pyrogenic sources wascompletely different from that of the middle dry season,when the massive emissions of fresh smoke during night-time triggered the rise in CO concentrations up to 3000 ppb.[64] Data from TEOM and the carbon monitor are avail-
able for this period only until 3 November. The concen-trations of PM2.5, PM10 and TC show irregular variations,with no trends and no apparent correlation with the profile
Figure 16. Size-segregated ratios of sulphate to (a) WSOC and (b) K, determined on the 5-stage BI forthe period 21–30 October. The size intervals of the BI are reported in the legend: 0.05–0.14, 0.14–0.42,0.42–1.2, 1.2–3.5, 3.5–10 mm. The horizontal scale is in local time units.
D01201 FUZZI ET AL.: BIOMASS-BURNING AEROSOL COMPOSITION
28 of 35
D01201

Figure 17. Size-segregated ratios of classes of organic compounds to WSOC for the period 21–30 October: (a) polyhydroxylated compounds (polyols) determined by GC/MS analysis of HVDS PM2.5
filters; neutral compounds (NC) determined by IC-UV analysis of BI samples; (b) high molecular weight(HMW) WSOC determined by evolved gas analysis (EGA) on HVDS PM2.5 filters; polyacids (PA)determined by IC-UV analysis of BI samples. The submicron size intervals of the BI are reported in thelegend: 0.05–0.14, 0.14–0.42, 0.42–1.2 mm. The horizontal scale is in local time units.
Figure 18. Trends of CO, PM10, PM2.5 and aerosol TC concentrations determined by high timeresolution measurements during the period 30 October to 14 November. The ratio between refractorycarbon and TC determined by the carbon monitor is also reported. Measurements of PM10, PM2.5 and TCstopped on 31 October. The horizontal scale is in local time units.
D01201 FUZZI ET AL.: BIOMASS-BURNING AEROSOL COMPOSITION
29 of 35
D01201

of CO. The ratio between refractory carbon and TC show nodiurnal variation either.4.3.2. Time-Integrated Aerosol Measurements[65] Only a small number of samples could be collected
on filters and impactors, because the sampling time gener-ally had to be extended to �48 h to allow sufficientlyloaded samples. Only during the last two days of October,when the higher aerosol concentrations encountered at theend of the transition period was not completely abated by theenhanced precipitation, was one set of 24 h samples collectedover two consecutive nights. Then, from 1 to 5 November,sampling was performed separately for the night and the day,leading to two sets of 48 h samples. Similarly, another coupleof sample sets (one diurnal and one nocturnal) wascollected between 5 and 9 November. Finally, samplingwas also performed from 10 to 12 November and from12 to 14 November with no distinction between day andnight.
[66] The average PM concentrations in the fine fraction(PM2 from SFU samples) were only 3–4 mg m�3 during thewet period with no apparent trend (Figure 19a). Coarse-mode particle concentration reached 4–8 mg m�3 with littleor no trend. Since the samples were collected over long timeintervals, it is possible that the average concentrations weredriven by short episodes of relatively high concentrations.TC and WSOC in PM2.5 exhibit similar trends and, after5 November the TC/PM2 ratios are about 0.40, as in thetransition period, indicating that fine particles are essentiallycarbonaceous (see section 3.5). Somewhat lower ratios arecharacteristic of the first days of November.[67] Concentrations of the main aerosol inorganic com-
pounds, integrated over the submicron size range, wereobtained from impactor measurements with DLPI and SDI(Figure 19b). Except for the first sample, showing anunusually high NO3/SO4 ratio, the concentrations of potas-sium, nitrate and sulphate followed a similar trend. How-
Figure 19. Concentrations of (a) PM10, PM2, and of TC and WSOC in the fine fraction of the aerosoldetermined in filter samples, and (b) concentrations of main inorganic ions from impactor data integratedover the submicron size range (PM1.7 and PM1.2 for SDI and BI, respectively), in the period 30 Octoberto 14 November. The horizontal scale is in local time units.
D01201 FUZZI ET AL.: BIOMASS-BURNING AEROSOL COMPOSITION
30 of 35
D01201

ever, the nighttime concentrations of nitrate changed by afactor of ten with respect to daytime, those of potassium bya factor of two, while the lowest variations were observed inthe sulphate concentration. The maxima in the PM2 mass,TC and inorganic ions concentrations appear to beconnected with episodes of very high concentrations ofpotassium and especially nitrate in the fine aerosolfraction. Apparently, biomass-burning emissions fromlocal fires caused an increase in the PM2 mass, TC andpotassium concentrations, which was relevant in the period5–9 November, while most (60–90%) of sulphate-richparticles were likely associated with the background aerosol.4.3.3. Size-Segregated Composition[68] The size-segregated data from the BI samples were
obtained for the period 29 October to 9 November. Since notime trends for the organic compounds were obtained, onlythe inorganic composition is discussed here (Figures 20aand 20b). Sulphate contribution increased compared toWSOC and K in all submicrometer size ranges, especiallyin daytime conditions, with a trend which is opposite to theone observed during the peak of the biomass-burningseason (see Figure 12). As previously observed, duringthe transition period low SO4/WSOC and SO4/K valuesare found in the lowest size range (0.05–0.14 mm) for
nocturnal samples, whereas the diurnal variations of theseratios for larger particles are smaller. Such findings indicatethat during the period under consideration, even with almostbackground conditions, the smoke significantly affected thecomposition of the aerosol especially in the finest size range(<0.14 mm) during the night. The SO4/WSOC and SO4/Kratios observed in daytime for particles with diameter of0.42–1.2 mm in the wet period were three to four timeshigher than in the dry period. Therefore during the wetperiod, the accumulation of sulphate-rich accumulation-mode particles in the boundary layer became the dominantprocess. Our hypothesis concerning the formation of astable background of fine aerosol particles from agedcombustion products is supported by the CO time seriesand the relative high content of sulphate in these particles.[69] Nonetheless, the contribution of biogenic sources to
the organic fraction of background particles should not beunderestimated. A relatively constant K/WSOC ratio of�0.05, characteristic of biomass-burning emissions[Graham et al., 2002], was found in all size rangesthroughout the campaign until the end of the transitionperiod (Figure 21). However, this ratio is significantly lowerduring the wet period in the case of the fine aerosol fraction.Such decrease in the submicron size range hint at sources of
Figure 20. Size-segregated ratios of sulphate to (a) WSOC and (b) K, determined on the 5-stage BI forthe period 30 October to 14 November. The size intervals of the BI are reported in the legend: 0.05–0.14,0.14–0.42, 0.42–1.2, 1.2–3.5, 3.5–10 mm. The horizontal scale is in local time units.
D01201 FUZZI ET AL.: BIOMASS-BURNING AEROSOL COMPOSITION
31 of 35
D01201

OC other than biomass burning, thus possible biogenicemissions. In conclusion, there is evidence that biogenicorganic compounds contributed significantly to fine PMtogether with aged pyrogenic compounds (both OC andammonium sulphate) in the wet period.
5. Conclusions
[70] The aerosol characterization experiment performedduring the LBA-SMOCC field campaign provided a uniquedata set of size-resolved chemical composition of boundarylayer aerosol over the Amazon Basin during the dry-to-wetseason transition. Although sampling was performed at asingle station located in a pasture site, the data on aerosolcomposition and concentration are representative also forthe neighboring areas [Artaxo et al., 2002], since aerosolloads in the boundary layer were mainly controlled byburning activities extending over large areas in the statesof Rondonia, Mato Grosso, and other upwind states in thearc of deforestation, and (with respect to removal processes)by large-scale convective systems (M. A. F. Silva Dias, inpreparation, 2006). Substantial improvements were made inthe characterization of the size distributions of inorganic andorganic components of the aerosol, owing to the systematicdeployment of multistage impactor-based sampling techni-ques. In this way, the size-resolved particulate matter wasapportioned into its main organic and inorganic chemicalconstituents. On the one hand, our findings provide confir-mation of the outcomes of previous LBA experiments,showing that the supermicron fraction of the aerosol iscomposed mainly of primary particles of crustal or biolog-ical origin, whereas submicron particles are produced in
high concentrations only during the biomass-burning period,and are mainly composed of organic material with �10% ofsoluble inorganic salts, including sulphate as the major anion.On the other hand, evidence was found that inorganic (e.g.,nitrates) and organic (e.g., levoglucosan) compounds origi-nating from biomass burning exist also in the coarse particles,a fact that was particularly evident in the wet period of theexperiment. Furthermore, the occurrence of methyltetrols inthe fine aerosol fraction in all periods indicates that a naturalbackground of secondary organic aerosols produced byisoprene oxidation [Claeys et al., 2004a] affected the com-position of submicrometer particles, and their contributionwas highest during the wet period. Size-segregated dataindicate that the chemical composition was not homogeneouswith aerosol size. In particular, inorganic ions were enrichedin large accumulation-mode particles, where they accountedfor up to 20% of aerosol mass, whereas lower proportions(usually below 10%) were encountered in the finest sizefractions. Previous experiments, relying on elemental (PIXE)analysis, did not provide measurements of the N-containingcompounds, i.e., ammonium and nitrate, which, during LBA-SMOCC, were found to account for 20–50% of the inorganicwater-soluble mass. In particular, our data show that ammo-nium (not potassium) was the most abundant cation in allperiods of the campaign and in all size fractions, indicatingthat condensation of inorganic gaseous compounds normallyoccurred on smoke particles. Nitrate size distributions variedin shape and size according to season and day/night con-ditions. This can be interpreted as the different effects ofacidity/alkalinity of the particles, surface size distribution ofthe preexisting aerosol population and especially ambientconditions (T, RH) on nitric acid condensation/evaporation
Figure 21. Potassium versus WSOC (K/WSOC) ratio determined for 5-stage BI samples. The BI wasnot deployed from 29 September to 14 October. The size intervals of the BI are reported in the legend:0.05–0.14, 0.14–0.42, 0.42–1.2, 1.2–3.5, 3.5–10 mm.
D01201 FUZZI ET AL.: BIOMASS-BURNING AEROSOL COMPOSITION
32 of 35
D01201

rates. Nitrate was as abundant as sulphate at nighttime in thedry period, whereas sulphates dominated the inorganiccomposition in the wet period. The WSOC represent themajor fraction of the aerosol OC in the submicron sizerange throughout the experiment, in agreement withresults from the previous LBA campaign, which wereobtained from samples collected in the dry and transitionperiods in 1999 [Mayol-Bracero et al., 2002]. In contrast,coarse aerosol particles are characterized by a largefraction of insoluble carbonaceous material of primarybiogenic origin. These coarse-mode primary biogenicparticles were present throughout the experiment. Someof these particles could act as ‘‘giant CCN’’ and contrib-ute significantly to cloud formation [McFiggans et al.,2006].[71] Size-resolved average aerosol chemical compositions
were obtained for the dry, transition and wet periods.However, significant variations in the aerosol compositionand concentrations were observed within each period. Suchvariations can be classified into two categories:[72] 1. Diurnal variations, caused by the diurnal cycle of
the boundary layer, the marked difference in ambientconditions (T and RH) between day and night, and thedifferent prevalent combustion phase active during day(flaming) or night (smouldering). The magnitude of varia-tion in all these factors is higher in the dry period, leading tolarge variations in the aerosol chemical composition andoscillating trends of concentration. Typically, very highconcentrations of freshly emitted smoke particles, rich inorganic material (with anhydrosugars as markers) andnitrate but poor in sulphate, are found at nighttime. Bycontrast, lower concentrations due to efficient mixing of theboundary layer were encountered in daytime, and theaerosol composition was characterized by a high contentof refractory carbon, humic-like material and sulphates.[73] 2. Day-to-day variations, due to alternating phases of
relatively wet and dry conditions. The development ofwidespread convection in the region was sporadic in thedry period but its frequency increased toward the end of theexperiment. During the dry period, Rondonia experiencedabout seven days with no intense precipitation events (asidefrom local convection), so that biomass-burning particlesemitted from a number of fires in the region were able toaccumulate in the boundary layer. Data from chemicalanalyses show that the aerosols in the transition and wetperiods exhibit a more aged character compared to the dryperiod, showing a higher sulphate/potassium and sulphate/WSOC ratios. Finally, in the wet period, a lower K/WSOCratio was found in the submicron fraction of the aerosol,suggesting that sources of organic material other thanbiomass burning significantly contributed to the aerosolOC at that time.[74] The analysis of the impactor samples collected
during the LBA-SMOCC experiment has provided a com-prehensive data set of aerosol size-resolved chemical com-position over areas affected by biomass burning. Comparedto previous studies conducted both in the same area [Artaxoet al., 2002] and other regions [Ruellan et al., 1999;Formenti et al., 2003], the LBA-SMOCC aerosol charac-terization experiment was uniquely comprehensive withrespect to the chemical determinations and the coverageof aerosol climatology (i.e., seasonal trends and diurnal
variations). The chemical data set provided by the SMOCCfield experiment was used to characterize the aerosolhygroscopic properties and ability to act as cloud conden-sation nuclei (CCN) [Mircea et al., 2005]. The high contentof WSOC in biomass-burning particles was found to beresponsible for the observed low hygroscopic growth fac-tors and for the measured CCN spectra characterized by asteady increase in the CCN ability with supersaturation[Andreae et al., 2004; Mircea et al., 2005; Rissler et al.,2006]. Such studies have shown that the changes in theaerosol chemical composition with particle size are relevantto the hygroscopic properties of the aerosol. Indeed, sizedistribution information indicates that the relative amount ofinorganic ionic material versus the organic compounds isalmost half for particles of diameter of 100 nm compared tolarger particles of 1 mm size. Moreover, potassium saltswere enriched in small (Dp � 100 nm) biomass-burningparticles, whereas larger (Dp � 1 mm) particles containedlarger amounts of more soluble ammonium salts. Suchvariations in the chemical composition with particle size,which are important in determining the interaction ofaerosol with water in the atmosphere (hygroscopic growthand cloud droplet formation), were clearly measured bythe multistage impactors, whereas they eluded the filter-based sampling techniques, which have been previouslyemployed. The present work within the LBA-SMOCCexperiment represents, to our knowledge, the most exten-sive characterization of size-segregated biomass-burningaerosol to date. Given the importance of biomass burningfor the global atmosphere and in order to provide reliableinput data and parameterizations to models, it would behighly important that a similar experimental approach isused in other regions of the world affected by extensivebiomass burning (e.g., Africa, Indonesia, Australia, South-ern Europe) to evaluate similarities and differences inphysical and chemical properties of biomass-burning aero-sol at the global level. Improved sampling/analytical tech-niques should also be implemented which allow airborneaerosol measurements of a similar complexity as theground-level measurements presented here.
[75] Acknowledgments. This work was carried out within the framework of the Smoke, Aerosols, Clouds, Rainfall, and Climate (SMOCC)project, a European contribution to the Large-Scale Biosphere-AtmosphereExperiment in Amazonia (LBA). It was financially supported by theEnvironmental and Climate Program of the European Commission (contractEVK2-CT-2001-00110 SMOCC), the Max Planck Society (MPG), theItalian Ministry of Environment (Italy USA Cooperation on Science andTechnology of Climate Change), the Belgian Federal Science Policy Office(Project ‘‘Characterization and sources of carbonaceous atmospheric aero-sols’’, contracts EV/02/11A and EV/06/11B), the Fundacao de Amparo aPesquisa do Estado de Sao Paulo, and the Conselho Nacional deDesenvolvimento Cientıfico (Instituto do Milenio LBA). We thank allmembers of the LBA-SMOCC and LBA-RACCI science teams for theirsupport during the field campaign, especially A. C. Ribeiro, M. A. L.Moura, J. von Jouanne, L. Tarozzi and J. Cafmeyer. We also acknowl-edge T. W. Andreae, H.-J. Voss and W. Elbert (MPIC), S. Dunphy(UGent) and R. Vermeylen (UA) for analysis of samples.
ReferencesAndreae, M. O., et al. (1998), Airborne studies of aerosol emissions fromsavanna fires in southern Africa: 2. Aerosol chemical composition,J. Geophys. Res., 103, 32,119–32,128.
Andreae, M. O., W. Elbert, R. Gabriel, D. W. Johnson, S. Osborne, andR. Wood (2000), Soluble ion chemistry of the atmospheric aerosol andSO2 concentrations over the eastern North Atlantic during ACE-2,Tellus, Ser. B, 52, 1066–1087.
D01201 FUZZI ET AL.: BIOMASS-BURNING AEROSOL COMPOSITION
33 of 35
D01201

Andreae, M. O., et al. (2002), Biogeochemical cycling of carbon, water,energy, trace gases, and aerosols in Amazonia: The LBA-EUSTACH ex-periments, J.Geophys. Res., 107(D20), 8066, doi:10.1029/2001JD000524.
Andreae, M. O., D. Rosenfeld, P. Artaxo, A. A. Costa, G. P. Frank, K. M.Longo, and M. A. F. Silva-Dias (2004), Smoking rain clouds over theAmazon, Science, 303, 1337–1342.
Artaxo, P., and H. C. Hansson (1995), Size distribution of biogenic aerosolparticles from the Amazon basin, Atmos. Environ., 29(3), 393–402.
Artaxo, P., E. T. Fernandez, J. V. Martins, M. A. Yamasoe, P. V. Hobbs,W. Maenhaut, K. M. Longo, and A. Castanho (1998), Large scale aerosolsource apportionment in Amazonia, J. Geophys. Res., 103, 31,837–31,848.
Artaxo, P., R. C. de Campos, E. T. Fernandez, J. V. Martins, Z. Xiao,O. Lindqvist, M. T. Fernandez-Jimenez, and W. Maenhaut (2000),Large scale mercury and trace element measurements in the AmazonBasin, Atmos. Environ., 34, 4085–4096.
Artaxo, P., J. Vanderlei Martins, M. A. Yamasoe, A. S. Procopio, T. M.Pauliquevis, M. O. Andreae, P. Guyon, L. V. Gatti, and A. M. CordovaLeal (2002), Physical and chemical properties of aerosols in the wet anddry seasons in Rondonia, Amazonia, J. Geophys. Res., 107(D20), 8081,doi:10.1029/2001JD000666.
Chand, D., P. Guyon, P. Artaxo, O. Schmid, G. P. Frank, L. V. Rizzo,O. L. Mayol-Bracero, L. V. Gatti, and M. O. Andreae (2006), Optical andphysical properties of aerosols in the boundary layer and free troposphereover the Amazon Basin during the biomass burning season, Atmos. Chem.Phys., 6, 2911–2925.
Claeys, M., et al. (2004a), Formation of secondary organic aerosols throughphotooxidation of isoprene, Science, 303, 1173–1176.
Claeys, M., W. Wang, A. C. Ion, I. Kourtchev, A. Gelencser, andW. Maenhaut (2004b), Formation of secondary organic aerosols fromisoprene and its gas-phase oxidation products through reaction withhydrogen peroxide, Atmos. Environ., 38, 4093–4098.
Decesari, S., et al. (2006), Characterization of the organic composition ofaerosols from Rondonia, Brazil, during the LBA-SMOCC 2002 experi-ment and its representation through model compounds, Atmos. Chem.Phys., 6, 375–402.
Falkovich, A. H., E. R. Graber, G. Schkolnik, Y. Rudich, W. Maenhaut, andP. Artaxo (2005), Low molecular weight organic acids in aerosol particlesfrom Rondonia, Brazil, during the biomass burning, transition and wetperiods, Atmos. Chem. Phys., 5, 781–797.
Ferreira da Costa, R., J. R. P. Feitosa, G. Fisch, S. S. Souza, and C. A.Nobre (1998), Variabilidade diaria da precipitacao em regioes de florestae pastagem na Amazonia, Acta Amazonica, 28(4), 395–408.
Formenti, P., W. Elbert, W. Maenhaut, J. Haywood, S. Osborne, and M. O.Andreae (2003), Inorganic and carbonaceous aerosols during the SouthernAfrican Regional Science Initiative (SAFARI 2000) experiment: Chemicalcharacteristics, physical properties, and emission data for smoke fromAfri-can biomass burning, J. Geophys. Res., 108(D13), 8488, doi:10.1029/2002JD002408.
Freitas, S., R. M. A. F. Silva Dias, P. L. Silva Dias, K. M. Longo, P. Artaxo,M. O. Andreae, and H. Fischer (2000), A convective kinematic trajectorytechnique for low resolution atmospheric models, J. Geophys. Res.,105(D19), 24,375–24,386.
Gabriel, R., O. L. Mayol-Bracero, and M. O. Andreae (2002), Chemicalcharacterization of submicron aerosol collected over the Indian Ocean,J. Geophys. Res., 107(D19), 8005, doi:10.1029/2000JD000034.
Gao, S., D. A. Hegg, P. V. Hobbs, T. W. Kirchstetter, B. I. Magi, andM. Sadilek (2003), Water-soluble organic components in aerosols as-sociated with savanna fires in southern Africa: Identification, evolu-tion, and distribution, J. Geophys. Res., 108(D13), 8491, doi:10.1029/2002JD002324.
Gelencser, A., A. Hoffer, G. Kiss, E. Tombacz, R. Kurdi, and L. Bencze(2003), In-situ formation of light-absorbing organic matter in cloud water,J. Atmos. Chem., 45, 25–33.
Graham, B., O. L. Mayol-Bracero, P. Guyon, G. C. Roberts, S. Decesari,M. C. Facchini, P. Artaxo, W. Maenhaut, P. Koll, and M. O. Andreae(2002), Water-soluble organic compounds in biomass burning aerosolsover Amazonia: 1. Characterization by NMR and GC/MS, J. Geophys.Res., 107(D20), 8047, doi:10.1029/2001JD000336.
Graham, B., P. Guyon, P. E. Taylor, P. Artaxo, W. Maenhaut, M. M.Glovsky, R. C. Flagan, and M. O. Andreae (2003), Organic compoundspresent in the natural Amazonian aerosol: Characterization by gas chro-matography-mass spectrometry, J. Geophys. Res., 108(D24), 4766,doi:10.1029/2003JD003990.
Guyon, P., B. Graham, G. C. Roberts, O. L. Mayol-Bracero, W. Maenhaut,P. Artaxo, and M. O. Andreae (2003), In-canopy gradients, composition,sources, and optical properties of aerosol over the Amazon forest,J. Geophys. Res., 108(D18), 4591, doi:10.1029/2003JD003465.
Guyon, P., W. Maenhaut, M. Blazso, S. Janitsek, A. Gelencser, P. Artaxo,and M. O. Andreae (2004a), Study of tropical organic aerosol by ther-
mally assisted alkylation-gas chromatography mass spectrometry, J. Anal.Appl. Pyrolysis, 71(2), 1027–1029.
Guyon, P., B. Graham, G. C. Roberts, O. L. Mayol-Bracero, W. Maenhaut,P. Artaxo, and M. O. Andreae (2004b), Sources of optically active aerosolparticles over the Amazon forest, Atmos. Environ., 38, 1039–1051.
Guyon, P., et al. (2005), Airborne measurements of trace gases and aerosolparticle emissions from biomass burning in Amazonia, Atmos. Chem.Phys., 5, 2989–3002.
Herrmann, H. (2003), Kinetics of aqueous phase reactions relevant foratmospheric chemistry, Chem. Rev., 103, 4691–4716.
Hoffer, A., A. Gelencser, M. Blazso, P. Guyon, P. Artaxo, and M. O.Andreae (2005), Chemical transformations in organic aerosol from bio-mass burning, Atmos. Chem. Phys. Discuss., 5, 8027–8054.
Kawamura, K., R. Sempere, Y. Imai, Y. Fujii, and M. Hayashi (1996),Water-soluble dicarboxylic acids and related compounds in Antarcticaerosols, J. Geophys. Res., 101(D13), 18,721–18,728.
Maenhaut, W., R. Hillamo, T. Makela, J.-L. Jaffrezo, M. H. Bergin, and C. I.Davidson (1996), A new cascade impactor for aerosol sampling withsubsequent PIXE analysis, Nucl. Instr. Meth. Phys. Res., Sec. B, 109/110, 482–487.
Maenhaut, W., J. Schwarz, J. Cafmeyer, and X. Chi (2002), Aerosol che-mical mass closure during the EUROTRAC-2 AEROSOL Intercompar-ison 2000, Nucl. Instr. Meth. Phys. Res., Sec. B, 189, 233–237.
Maenhaut, W., N. Raes, J. Cafmeyer, and P. Artaxo (2004), Study of ele-mental mass size distributions in Amazonia during the LBA/CLAIRE/SMOCC-2002 campaign, paper presented at the 10th InternationalConference on Particle-Induced X-ray Emission and Its AnalyticalApplications, Jozef Stefan Institute, Portoro, Slovenia, 4–8 June.
Matta, E., M. C. Facchini, S. Decesari, M. Mircea, F. Cavalli, S. Fuzzi, J-.P.Putaud, and A. Dell’Acqua (2003), Mass closure on the chemical speciesin size-segregated atmospheric aerosol collected in a urban area of the PoValley, Italy, Atmos. Chem. Phys., 3, 623–637.
Mayol-Bracero, O. L., P. Guyon, B. Graham, G. C. Roberts, M. O.Andreae, S. Decesari, M. C. Facchini, S. Fuzzi, and P. Artaxo(2002), Water-soluble organic compounds in biomass burning aerosolsover Amazonia: 2. Apportionment of the chemical composition andimportance of the polyacidic fraction, J. Geophys. Res., 107(D20),8091, doi:10.1029/2001JD000522.
McFiggans, G., et al. (2006), The effect of aerosol composition andproperties on warm cloud droplet activation, Atmos. Chem. Phys., 6,2593–2649.
Mircea, M., et al. (2005), Importance of the organic aerosol fraction formodeling aerosol hygroscopic growth and activation: A case study in theAmazon Basin, Atmos. Chem. Phys., 5, 3111–3126.
Novakov, T., and C. E. Corrigan (1996), Cloud condensation nucleusactivity of the organic component of biomass smoke particles, Geophys.Res. Lett., 23, 2141–2144.
Novakov, T., C. E. Corrigan, J. E. Penner, C. C. Chuang, O. Rosario, andO. L. Mayol-Bracero (1997), Organic aerosols in the Caribbean tradewinds: A natural source?, J. Geophys. Res., 102, 21,307–21,313.
Rau, J. A. (1989), Composition and size distribution of residential woodsmoke particles, Aerosol Sci. Technol., 10, 181–192.
Reid, J. S., P. V. Hobbs, R. J. Ferek, D. R. Blake, J. V. Martins, M. R.Dunlap, and C. Liousse (1998), Physical, chemical, and optical propertiesof regional hazes dominated by smoke in Brazil, J. Geophys. Res., 103,32,059–32,080.
Ricard, V., J.-L. Jaffrezo, V.-M. Kerminen, R. E. Hillamo, K. Teinila, andW. Maenhaut (2002), Size distributions and modal parameters ofaerosol constituents in northern Finland during the European ArcticAerosol Study, J. Geophys. Res., 107(D14), 4208, doi:10.1029/2001JD001130.
Rissler, J., E. Swietlicki, J. Zhou, L. V. Gatti, G. Roberts, M. O. Andreae,and P. Artaxo (2004), Physical properties of the sub-micrometer aerosolover the Amazon rain forest during the wet-to-dry season transition:Comparison of modeled and measured CCN concentrations, Atmos.Chem. Phys., 4, 2119–2143.
Rissler, J., A. Vestin, E. Swietlicki, G. Fisch, J. Zhou, P. Artaxo, and M. O.Andreae (2006), Size distribution and hygroscopic properties of aerosolparticles from dry-season biomass burning in Amazonia, Atmos. Chem.Phys., 6, 471–491.
Roberts, G. C., P. Artaxo, J. Zhou, E. Swietlicki, and M. O. Andreae(2002), Sensitivity of CCN spectra on chemical and physical propertiesof aerosol: A case study from the Amazon Basin, J. Geophys. Res.,107(D20), 8070, doi:10.1029/2001JD000583.
Ruellan, S., H. Cachier, A. Gaudichet, P. Masclet, and J.-P. Lacaux (1999),Airborne aerosols over central Africa during the Experiment for RegionalSources and Sinks of Oxidants (EXPRESSO), J. Geophys. Res.,104(D23), 30,673–30,690.
Schkolnik, G., A. H. Falkovich, Y. Rudich, W. Maenhaut, and P. Artaxo(2005), A new analytical method for the determination of levoglucosan,
D01201 FUZZI ET AL.: BIOMASS-BURNING AEROSOL COMPOSITION
34 of 35
D01201

polyhydroxy compounds and 2-methylerythrol and its application tosmoke and rainwater samples, Environ. Sci. Technol., 39, 2744–2752.
Simoneit, B. R. T., J. J. Schauer, C. G. Nolte, D. R. Oros, V. O. Elias, M. P.Fraser, W. F. Rogge, and G. R. Cass (1999), Levoglucosan, a tracer forcellulose in biomass burning and atmospheric particles, Atmos. Environ.,33, 173–182.
Simoneit, B. R. T., V. O. Elias, M. Kobayashi, K. Kawamura, A. I. Rushdi,P. M. Medeiros, W. F. Rogge, and B. M. Didyk (2004), Sugars: Dominantwater-soluble organic components in soils and characterization as tracersin atmospheric particulate matter, Environ. Sci. Technol., 38, 5939–5949.
Tagliavini, E., F. Moretti, S. Decesari, M. C. Facchini, S. Fuzzi, andW. Maenhaut (2006), Functional group analysis by H NMR/chemicalderivatization for the characterization of organic aerosol from the SMOCCfield campaign, Atmos. Chem. Phys., 6, 1003–1019.
Trebs, I., F. X. Meixner, J. Slanina, R. Otjes, P. Jongejan, and M. O.Andreae (2004), Real-time measurements of ammonia, acidic trace gasesand water-soluble inorganic aerosol species at a rural site in the AmazonBasin, Atmos. Chem. Phys., 4, 967–987.
Trebs, I., et al. (2005), The NH4+-NO3
�-Cl�-SO42�-H2O aerosol system and
its gas phase precursors at a pasture site in the Amazon Basin: Howrelevant are mineral cations and soluble organic acids?, J. Geophys.Res., 110, D07303, doi:10.1029/2004JD005478.
Trebs, I., L. L. Lara, L. M. M. Zeri, L. V. Gatti, P. Artaxo, R. Dlugi,J. Slanina, M. O. Andreae, and F. X. Meiner (2006), Dry and wetdeposition of inorganic nitrogen compounds to a tropical pasture site(Rondonia, Brazil), Atmos. Chem. Phys., 6, 447–469.
Wang, W., I. Kourtchev, B. Graham, J. Cafmeyer, W. Maenhaut, andM. Claeys (2005), Characterization of oxygenated derivatives of
isoprene related to 2-methyltetrols in Amazonian aerosols usingtrimethylsilylation and gas chromatography/ion trap mass spectrome-try, Rapid Commun. Mass Spectrom., 19, 1343–1351.
�����������������������M. O. Andreae, P. Guyon, A. Hoffer, and I. Trebs, Biogeochemistry
Department, Max Planck Institute for Chemistry, D-55020 Mainz,Germany.P. Artaxo, L. L. Lara, T. Pauliquevis, and L. V. Rizzo, Instituto de Fisica,
Universidade de Sao Paulo, 05508-900 Sao Paulo, SP, Brazil.F. Cavalli, S. Decesari, L. Emblico, M. C. Facchini, S. Fuzzi, and
M.Mircea, Institute ofAtmospheric Sciences andClimate, National ResearchCouncil, I-40129 Bologna, Italy. ([email protected]; [email protected])X. Chi, W. Maenhaut, and N. Raes, Department of Analytical Chemistry,
Institute for Nuclear Sciences, Ghent University, BE-9000 Ghent, Belgium.M. Claeys and I. Kourtchev, Department of Pharmaceutical Sciences,
University of Antwerp, BE-2610 Antwerp, Belgium.A. H. Falkovich, Y. Rudich, and G. Schkolnik, Department of
Environmental Sciences, Weizmann Institute, Rehovot 76100, Israel.G. Fisch, Centro Tecnico Aeroespacial, Instituto de Aeronautica e Espaco,
Divisao de Ciencias Atmosfericas, 12228-904, Sao Jose dos Campos, SP,Brazil.L. V. Gatti, Divisao de Quimica Ambiental, Instituto de Pesquisas
Energeticas e Nucleares, 05508-900 Sao Paulo, SP, Brazil.O. L. Mayol-Bracero and L. L. Soto-Garcıa, Institute for Tropical
Ecosystem Studies, University of Puerto Rico, San Juan, PR 00931-3341,USA.J. Rissler and E. Swietlicki, Division of Nuclear Physics, Department of
Physics, Lund University, S-221 00 Lund, Sweden.E. Tagliavini, Centro di Ricerche per le Scienze Ambientali, University of
Bologna, I-48100 Ravenna, Italy.
D01201 FUZZI ET AL.: BIOMASS-BURNING AEROSOL COMPOSITION
35 of 35
D01201