Outcomes Associated with Planned Home and Planned Hospital Births in Low-Risk Women Attended by...
10
180 BIRTH 36:3 September 2009 Outcomes Associated with Planned Home and Planned Hospital Births in Low-Risk Women Attended by Midwives in Ontario, Canada, 2003–2006: A Retrospective Cohort Study Eileen K. Hutton, PhD, Angela H. Reitsma, BSc, BHSc(Midwifery), and Karyn Kaufman, DrPH ABSTRACT: Background: Midwives in Ontario, Canada, provide care in the home and hospital and are required to submit data for all births to the Ontario Ministry of Health database. The purpose of this study was to compare maternal and perinatal/neonatal mortality and morbidity and intrapartum intervention rates for women attended by Ontario midwives who planned a home birth compared with similar low-risk women who planned a hospital birth between 2003 and 2006. Methods: The database provided outcomes for all women planning a home birth at the onset of labor (n = 6, 692) and for a cohort, stratified by parity, of similar low-risk women planning a hospital birth. Results: The rate of perinatal and neonatal mortality was very low (1/1,000) for both groups, and no difference was shown between groups in perinatal and neonatal mortality or serious morbidity (2.4% vs 2.8%; relative risk [RR], 95% confidence intervals [CI]: 0.84 [0.68–1.03]). No maternal deaths were reported. All measures of serious maternal morbidity were lower in the planned home birth group as were rates for all interventions including cesarean section (5.2% vs 8.1%; RR [95% CI]: 0.64 [0.56, 0.73]). Nulliparas were less likely to deliver at home, and had higher rates of ambulance transport from home to hospital than multiparas planning home birth and had rates of intervention and outcomes similar to, or lower than, nulliparas planning hospital births. Conclusions: Midwives who were integrated into the health care system with good access to emergency services, consultation, and transfer of care provided care resulting in favorable outcomes for women planning both home or hospital births. (BIRTH 36:3 September 2009) Key words: birth outcomes, cesarean section rates, home birth, midwifery care Midwives in Ontario, Canada, provide care to low-risk women in a model of continuity or case-based care whereby a woman is attended by the same small group of midwives throughout pregnancy, birth, and the post- partum period. Women who meet selective criteria have the choice of a hospital birth or a planned home birth. Midwives are expected to attend both home and hospital births to the extent that maintenance of registration with the regulatory college depends on a record of providing care in both settings. Midwives are well integrated into the Ontario health care system; they have admission and discharge Eileen K. Hutton is an Assistant Dean, Faculty of Health Sciences, Director Midwifery Education Program and Associate Professor in the Department of Obstetrics and Gynecology, McMaster University, Hamilton; Angela H. Reitsma is a Registered Midwife, Practicing Member at The Hamilton Midwives, Hamilton; and Karyn Kaufman is a Professor Emeritus Faculty of Health Sciences, McMaster University, Hamilton, Ontario, Canada. Address correspondence to Dr. Eileen K. Hutton, McMaster University Midwifery Program, 1200 Main Street West, MDCL 2210, Hamilton, Ontario, Canada L8N 3Z5. Accepted March 23, 2009 © 2009, Copyright the Authors Journal compilation © 2009, Wiley Periodicals, Inc.
Transcript of Outcomes Associated with Planned Home and Planned Hospital Births in Low-Risk Women Attended by...

180 BIRTH 36:3 September 2009
Outcomes Associated with Planned Home and
Planned Hospital Births in Low-Risk Women
Attended by Midwives in Ontario, Canada,
2003–2006: A Retrospective Cohort Study
Eileen K. Hutton, PhD, Angela H. Reitsma, BSc, BHSc(Midwifery), and
Karyn Kaufman, DrPH
ABSTRACT: Background: Midwives in Ontario, Canada, provide care in the home andhospital and are required to submit data for all births to the Ontario Ministry of Healthdatabase. The purpose of this study was to compare maternal and perinatal/neonatal mortalityand morbidity and intrapartum intervention rates for women attended by Ontario midwiveswho planned a home birth compared with similar low-risk women who planned a hospital birthbetween 2003 and 2006. Methods: The database provided outcomes for all women planning ahome birth at the onset of labor (n = 6, 692) and for a cohort, stratified by parity, of similarlow-risk women planning a hospital birth. Results: The rate of perinatal and neonatal mortalitywas very low (1/1,000) for both groups, and no difference was shown between groups inperinatal and neonatal mortality or serious morbidity (2.4% vs 2.8%; relative risk [RR], 95%confidence intervals [CI]: 0.84 [0.68–1.03]). No maternal deaths were reported. All measuresof serious maternal morbidity were lower in the planned home birth group as were rates forall interventions including cesarean section (5.2% vs 8.1%; RR [95% CI]: 0.64 [0.56, 0.73]).Nulliparas were less likely to deliver at home, and had higher rates of ambulance transportfrom home to hospital than multiparas planning home birth and had rates of intervention andoutcomes similar to, or lower than, nulliparas planning hospital births. Conclusions: Midwiveswho were integrated into the health care system with good access to emergency services,consultation, and transfer of care provided care resulting in favorable outcomes for womenplanning both home or hospital births. (BIRTH 36:3 September 2009)
Key words: birth outcomes, cesarean section rates, home birth, midwifery care
Midwives in Ontario, Canada, provide care to low-riskwomen in a model of continuity or case-based carewhereby a woman is attended by the same small groupof midwives throughout pregnancy, birth, and the post-partum period. Women who meet selective criteria havethe choice of a hospital birth or a planned home birth.
Midwives are expected to attend both home and hospitalbirths to the extent that maintenance of registration withthe regulatory college depends on a record of providingcare in both settings.
Midwives are well integrated into the Ontariohealth care system; they have admission and discharge
Eileen K. Hutton is an Assistant Dean, Faculty of Health Sciences,Director Midwifery Education Program and Associate Professor inthe Department of Obstetrics and Gynecology, McMaster University,Hamilton; Angela H. Reitsma is a Registered Midwife, PracticingMember at The Hamilton Midwives, Hamilton; and Karyn Kaufman isa Professor Emeritus Faculty of Health Sciences, McMaster University,Hamilton, Ontario, Canada.
Address correspondence to Dr. Eileen K. Hutton, McMaster UniversityMidwifery Program, 1200 Main Street West, MDCL 2210, Hamilton,Ontario, Canada L8N 3Z5.
Accepted March 23, 2009
© 2009, Copyright the AuthorsJournal compilation © 2009, Wiley Periodicals, Inc.
BIRTH 36:3 September 2009 181
privileges at their local hospital(s), and access to otherhealth care providers for consultation or transfer of careas required. Two midwives are in attendance at birthseither in the home or in the hospital. The regulatorybody, the College of Midwives of Ontario, sets out eligi-bility criteria for a home birth: women with twin, breech,or medically complicated pregnancies; with more thanone previous cesarean section; or with gestation lessthan 37 weeks or more than 43 weeks at labor onsetare ineligible. The college also prescribes the prenatal,intrapartum, and postpartum conditions for which con-sultation and transfer of care to a physician are manda-tory (1,2). Random practice audits are undertaken by theCollege of Midwives to ensure that standards and regu-lations are followed.
We sought to compare the outcomes of home andhospital births to inform the midwifery professionand the wider obstetric community, because birth athome remains controversial (3–9), and practitioners aresubjected to criticism for attending home births (10).Although a single study cannot provide a definitive con-clusion about the relative safety of birth setting, wethought it was important to assess the relatively recentexperience within Ontario.
Evaluating the outcomes of home births poses sev-eral challenges. Because adverse outcomes are infre-quent, large samples are needed to detect importantdifferences; however, the number of births occurring athome is not large in most Western countries. Studies ofhome birth have been limited by sample size (4,11–24);absence of a comparison group (15,18,20–22,25–30);comparison with care provided by other practition-ers (17,23,24,29,31,32); use of self-reporting surveymethods (25,27,30); or inclusion of both planned andunplanned home births (31,33).
Midwifery care in Ontario is part of publicly fundedhealth care in the province. All midwives are requiredto submit a “client tracking form,” which includes pre-natal, intrapartum, and postpartum information for eachwoman in care. A database of midwifery care has
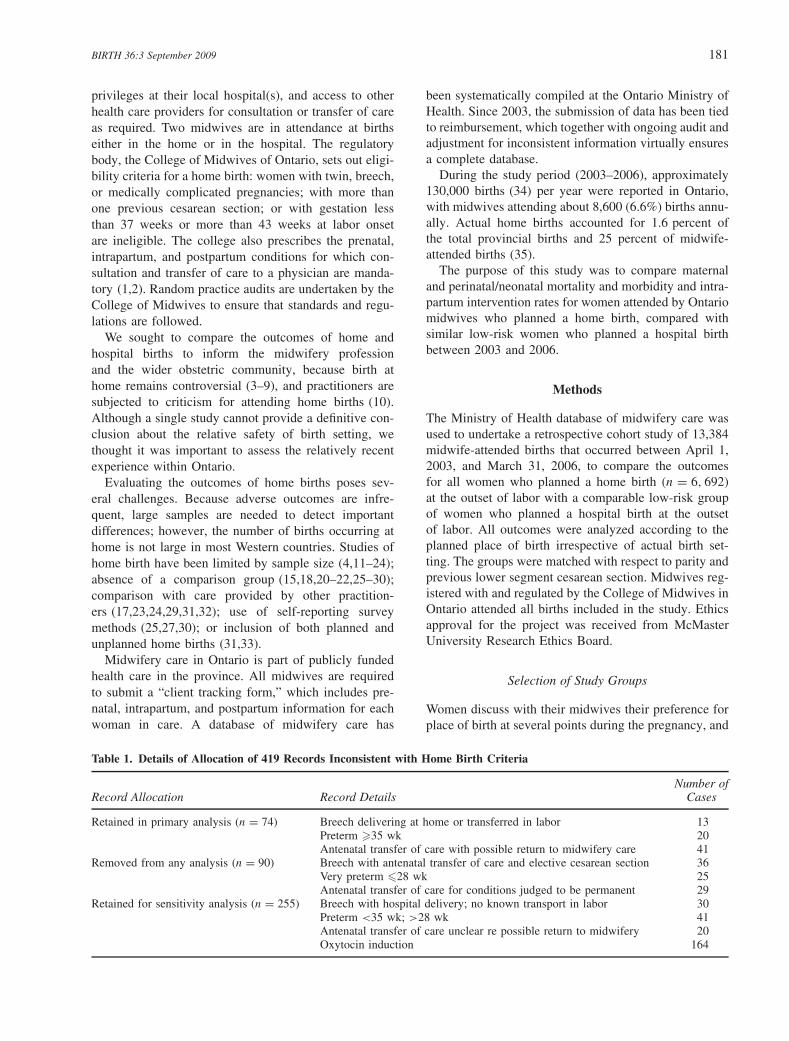
Table 1. Details of Allocation of 419 Records Inconsistent with Home Birth Criteria
Number ofRecord Allocation Record Details Cases
Retained in primary analysis (n = 74) Breech delivering at home or transferred in labor 13Preterm �35 wk 20Antenatal transfer of care with possible return to midwifery care 41
Removed from any analysis (n = 90) Breech with antenatal transfer of care and elective cesarean section 36Very preterm �28 wk 25Antenatal transfer of care for conditions judged to be permanent 29
Retained for sensitivity analysis (n = 255) Breech with hospital delivery; no known transport in labor 30Preterm <35 wk; >28 wk 41Antenatal transfer of care unclear re possible return to midwifery 20Oxytocin induction 164
been systematically compiled at the Ontario Ministry ofHealth. Since 2003, the submission of data has been tiedto reimbursement, which together with ongoing audit andadjustment for inconsistent information virtually ensuresa complete database.
During the study period (2003–2006), approximately130,000 births (34) per year were reported in Ontario,with midwives attending about 8,600 (6.6%) births annu-ally. Actual home births accounted for 1.6 percent ofthe total provincial births and 25 percent of midwife-attended births (35).
The purpose of this study was to compare maternaland perinatal/neonatal mortality and morbidity and intra-partum intervention rates for women attended by Ontariomidwives who planned a home birth, compared withsimilar low-risk women who planned a hospital birthbetween 2003 and 2006.
Methods
The Ministry of Health database of midwifery care wasused to undertake a retrospective cohort study of 13,384midwife-attended births that occurred between April 1,2003, and March 31, 2006, to compare the outcomesfor all women who planned a home birth (n = 6, 692)at the outset of labor with a comparable low-risk groupof women who planned a hospital birth at the outsetof labor. All outcomes were analyzed according to theplanned place of birth irrespective of actual birth set-ting. The groups were matched with respect to parity andprevious lower segment cesarean section. Midwives reg-istered with and regulated by the College of Midwives inOntario attended all births included in the study. Ethicsapproval for the project was received from McMasterUniversity Research Ethics Board.
Selection of Study Groups
Women discuss with their midwives their preference forplace of birth at several points during the pregnancy, and
182 BIRTH 36:3 September 2009
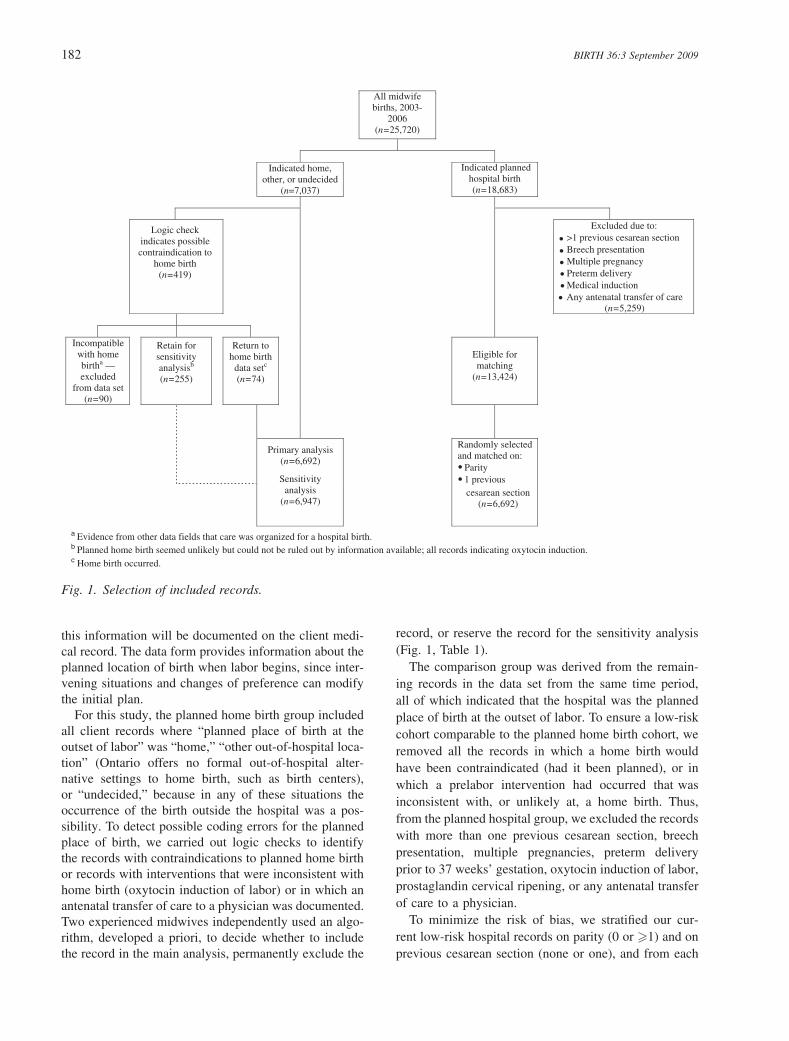
a Evidence from other data fields that care was organized for a hospital birth.b Planned home birth seemed unlikely but could not be ruled out by information available; all records indicating oxytocin induction.c Home birth occurred.
All midwifebirths, 2003-
2006(n=25,720)
Indicated home,other, or undecided
(n=7,037)
Indicated plannedhospital birth(n=18,683)
Logic checkindicates possiblecontraindication to
home birth(n=419)
Excluded due to:>1 previous cesarean section Breech presentationMultiple pregnancyPreterm deliveryMedical induction Any antenatal transfer of care
(n=5,259)
Incompatiblewith homebirtha —excluded
from data set(n=90)
Retain forsensitivityanalysisb
(n=255)
Return tohome birth
data setc
(n=74)
Eligible formatching
(n=13,424)
Primary analysis(n=6,692)
Randomly selectedand matched on:
Parity1 previouscesarean section
(n=6,692)
••
••••••
Sensitivityanalysis
(n=6,947)
Fig. 1. Selection of included records.
this information will be documented on the client medi-cal record. The data form provides information about theplanned location of birth when labor begins, since inter-vening situations and changes of preference can modifythe initial plan.
For this study, the planned home birth group includedall client records where “planned place of birth at theoutset of labor” was “home,” “other out-of-hospital loca-tion” (Ontario offers no formal out-of-hospital alter-native settings to home birth, such as birth centers),or “undecided,” because in any of these situations theoccurrence of the birth outside the hospital was a pos-sibility. To detect possible coding errors for the plannedplace of birth, we carried out logic checks to identifythe records with contraindications to planned home birthor records with interventions that were inconsistent withhome birth (oxytocin induction of labor) or in which anantenatal transfer of care to a physician was documented.Two experienced midwives independently used an algo-rithm, developed a priori, to decide whether to includethe record in the main analysis, permanently exclude the
record, or reserve the record for the sensitivity analysis(Fig. 1, Table 1).
The comparison group was derived from the remain-ing records in the data set from the same time period,all of which indicated that the hospital was the plannedplace of birth at the outset of labor. To ensure a low-riskcohort comparable to the planned home birth cohort, weremoved all the records in which a home birth wouldhave been contraindicated (had it been planned), or inwhich a prelabor intervention had occurred that wasinconsistent with, or unlikely at, a home birth. Thus,from the planned hospital group, we excluded the recordswith more than one previous cesarean section, breechpresentation, multiple pregnancies, preterm deliveryprior to 37 weeks’ gestation, oxytocin induction of labor,prostaglandin cervical ripening, or any antenatal transferof care to a physician.
To minimize the risk of bias, we stratified our cur-rent low-risk hospital records on parity (0 or �1) and onprevious cesarean section (none or one), and from each

BIRTH 36:3 September 2009 183
strata selected a random sample of records matching thegroups on parity and previous cesarean section (36).
Outcomes
Our primary outcome was a composite measure of peri-natal and neonatal mortality or serious morbidity, definedas the presence of one or more of the following: death(stillbirth or neonatal death 0–27 days, excluding lethalanomalies and fetal demise before the onset of labor);Apgar score of less than 4 at 5 minutes of age; neonatalresuscitation requiring both positive pressure ventilationsand cardiac compressions; admission to a neonatal orpediatric intensive care unit with a length of stay greaterthan 4 days; or birthweight less than 2,500 g. We notethat although birthweight is not an outcome that canbe a result of birth place, failure to screen adequatelyfor extremes of weight can result in planning for aninappropriate place of birth. Thus, low birthweight wasincluded as part of the composite. Perinatal or neonatalmortality cases that listed a lethal anomaly were inde-pendently reviewed by two authors blinded to group, and
Table 2. Baseline Characteristics of Women PlanningHome and Hospital Birth
Planned PlannedHome Hospital
(n = 6,692) (n = 6,692)Characteristic No. (%) No. (%)
Age (yr)<25 729 (10.9) 844 (12.6)
25–34 4, 428 (66.1) 4, 630 (69.2)
�35 1, 503 (22.5) 1, 199 (17.9)
Missing 32 (0.5) 19 (0.3)
Parity0 2, 293 (34.3) 2, 298 (34.3)
1–4 4, 172 (62.3) 4, 289 (64.1)
>4 221 (3.3) 105 (1.6)
Missing 6 (0.1) –Geographical location
South rural 1, 022 (15.3) 901 (13.5)
South urban 5, 305 (79.3) 4, 937 (73.8)
North rural 91 (1.4) 192 (2.9)
North urban 271 (4.0) 661 (9.9)
Missing 3 (0.0) 1 (0.0)
Repeat Ontario midwifery clientYes 3, 044 (45.5) 2, 331 (34.8)
No 3, 642 (54.4) 4, 357 (65.1)
Missing 6 (0.1) 4 (0.1)
Previous cesarean section0 6, 479 (96.8) 6, 485 (96.9)
1 200 (3.0) 207 (3.1)
>1 6 (0.1) –Missing 7 (0.1) –
Median gestation at booking 11.0 11.0Median gestation at birth 40.0 40.0
a consensus decision was made with respect to exclusionfrom the composite outcome.
Other outcomes included maternal mortality, signifi-cant morbidity, rates of intrapartum interventions, andbreastfeeding. We included any maternal death froma direct obstetrical cause (as determined by a provin-cial coroner’s review of all maternal deaths) occurringbetween the onset of labor and 6 weeks postpartum. Sig-nificant maternal morbidity included blood loss greaterthan 1,000 mL or bleeding requiring a consultation witha physician; any infection after onset of labor requir-ing a consultation with a physician; any third or fourthdegree laceration; and any postpartum transfer of care toa physician. Any situation requiring a consultation or atransfer of care was deemed to be a significant outcomebecause the indications for consultation and/or transferof care are well defined by the College of Midwives ofOntario. So, whereas practitioners might typically under-estimate blood loss greater than 1,000 mL, any symp-tomatic blood loss or transfusion would be captured inour analysis by including the consultation or transfer ofcare in the postpartum period.
Intrapartum interventions included rates of labor aug-mentation, use of any pharmaceutical pain relief, epi-siotomy and perineal trauma, assisted vaginal delivery,and cesarean section. Rates of infant feeding with for-mula supplementing breastfeeding or exclusive formulafeeding were compared at 1 and 6 weeks of age.
Data Analysis
All the analyses were conducted using SPSS 15.0 (37).We used descriptive statistics to report baseline char-acteristics. Comparative analyses used chi-square andrelative risk (RR) and 95 percent confidence inter-vals (CI). We removed the possible misclassified homebirth records from the primary analysis and retained themfor a sensitivity analysis of the primary outcome. We alsoconducted a subgroup analysis of nulliparas and multi-paras using descriptive statistics.
Results
Data Cleaning
We found 7,037 records indicating that at the outsetof labor, birth was intended to take place at home. Ofthese, we identified 419 records in which an interventioninconsistent with home birth was undertaken (inductionwith oxytocin [n = 164]) or a contraindication to homebirth existed (breech delivery [n = 79], preterm labor[n = 86]), or an antenatal transfer of care had occurred(n = 90). These records were analyzed as described inFig. 1 and Table 1, resulting in 6,692 records for theprimary analysis, and 6,947 for the sensitivity analysis.

184 BIRTH 36:3 September 2009
Table 3. Comparison of Variables in Planned Home and Hospital Groups with Relative Risk Presented for SelectedOutcomes
Planned Home Planned Hospital(n = 6,692) (n = 6,692)
Variable No. (%) No. (%) p RR [95% CI]
BirthActual place of birth
Home 5, 259 (78.6) 208 (3.1)Hospital 1, 371 (20.5) 6, 467 (96.6)Other location 62 (0.9) 17 (0.3)
Ambulance transport from homeduring or immediately after birthYes 361 (5.4) 44 (0.7)No 6, 307 (94.2) 6, 544 (97.8)Missing 24 (0.4) 104 (1.5)
Estimated intrapartum blood loss<500 mL 6, 048 (90.4) 5, 909 (88.3)500–1000 mL 568 (8.5) 678 (10.1)>1000 mL 56 (0.8) 82 (1.2) 0.026 0.68 [0.49–0.96]Missing 20 (0.3) 23 (0.3)
Consultation or transfer of care forbleeding
79 (1.2) 106 (1.6) 0.046 0.75 [0.56–1.00]
LacerationAny laceration 3, 612 (54.0) 4, 081 (61.0)
1st degree perineal 1, 109 (16.6) 1, 186 (17.7)2nd degree perineal 1, 695 (25.3) 1, 939 (29.0)3rd degree perineal 78 (1.2) 123 (1.8)4th degree perineal 21 (0.3) 22 (0.3)Labial 413 (6.2) 381 (5.7)Vaginal 474 (7.1) 542 (8.1)
Any 2nd–4th degree perineal, labialor vaginal tear, or episiotomy
2, 589 (38.7) 2, 979 (44.5) 0.000 0.87 [0.83–0.90]
Intrapartum transfer of care 837 (12.5) 1, 270 (19.0) 0.000 0.66 [0.61–0.71]Postpartum transfer of care 119 (1.8) 104 (1.6) 0.311 1.14 [0.88–1.49]
Intrapartum interventionLabor induction∗
None 6, 586 (98.4) 6, 524 (97.5)ARM before labor 73 (1.1) 136 (2.0)Prostaglandin 27 (0.4) —Unknown/missing 15 (0.2) 21 (0.3)
Labor augmentationNone 4, 797 (71.7) 4, 203 (62.8)Any augmentation 1, 852 (27.7) 2, 426 (36.3) 0.000 0.76 [0.72–0.80]ARM 1, 496 (22.4) 1, 889 (28.2)Oxytocin 551 (8.2) 878 (13.1)Unknown/missing 43 (0.6) 63 (0.9)
Pharmaceutical pain reliefNone 5, 570 (83.2) 3, 667 (54.8)Any pharmaceutical pain relief 1, 122 (16.8) 3, 025 (45.2) 0.000 0.37 [0.35–0.39]
Nitrous oxide 221 (3.3) 1, 206 (18.0)Narcotic analgesia 117 (1.7) 423 (6.3)Regional anesthesiaEpidural 655 (9.8) 1405 (21.0)Spinal 114 (1.7) 199 (3.0)
General anesthesia 26 (0.4) 48 (0.7)Local anesthesia 191 (2.9) 352 (5.3)
Episiotomy 286 (4.3) 393 (5.9) 0.000 0.73 [0.63–0.84]Mode of delivery
Spontaneous vaginal 6, 146 (91.8) 5, 852 (87.4)Assisted vaginal 195 (2.9) 293 (4.4) 0.000 0.67 [0.56–0.80]Forceps 81 (1.2) 141 (2.1)Vacuum 124 (1.9) 168 (2.5)Cesarean section 348 (5.2) 544 (8.1) 0.000 0.64 [0.56–0.73]
*Oxytocin induction is not undertaken at home and was an exclusion for the hospital birth cohort.ARM = artificial rupture of membranes.

BIRTH 36:3 September 2009 185
Table 4. Comparison of Neonatal Variables in Planned Home and Hospital Groups with Relative Risk Presented forSelected Outcomes
Planned Home Planned Hospital(n = 6,692) (n = 6,692)
Variable No. (%) No. (%) p RR [95% CI]
Breech presentation 12 (0.2) —Multiple birth — —Gestational age (wk)
<37 17 (0.3) —37–41, 6 days 6, 555 (98.0) 6, 638 (99.2)
>41, 6 days 117 (1.7) 54 (0.8)
Missing 3 (0.0) —Birthweight (g)
<2,500 38 (0.6) 56 (0.8)
2,500–4,000 5, 364 (80.2) 5, 410 (80.8)
>4,000 1, 279 (19.1) 1, 220 (18.2)
Missing 11 (0.2) 6 (0.1)
Apgar scores<4 at 1 min 89 (1.3) 107 (1.6)
Missing 49 (0.7) 36 (0.5)
<7 at 5 min 47 (0.7) 58 (0.9)
Missing 40 (0.6) 34 (0.5)
Infant resuscitationPPV 432 (6.5) 382 (5.7)
PPV and chest compressions 21 (0.3) 23 (0.3)
Significant congenital anomaliesNone 6, 515 (97.4) 6, 513 (97.3)
Major 28 (0.4) 24 (0.4)
Minor 140 (2.1) 144 (2.2)
Life threatening 5 (0.1) 4 (0.1)
Unknown/missing 4 (0.1) 7 (0.1)
Infant feeding at 1 wkExclusively breastfed 6, 122 (91.5) 5, 638 (84.2)
Breastfed with supplement, or exclusively formula fed 544 (8.1) 1, 016 (15.2) 0.000 0.53 [0.48–0.59]Unknown 26 (0.4) 38 (0.6)
Infant feeding at 6 wkExclusively breastfed 5, 853 (87.5) 5, 140 (76.8)
Breastfed with supplement, or exclusively formula fed 620 (9.3) 1, 260 (18.8) 0.000 0.49 [0.44–0.53]Unknown/missing 219 (3.3) 292 (4.4)
Any mortality 9 (0.1) 9 (0.1)
Stillbirth∗ 3 (0.0) 4 (0.1)
Neonatal mortality† 6 (0.1) 4 (0.1)
Infant death 28–42 days — 1 (0.0)
*No congenital anomalies noted in either group.†Includes 2 infants with a major congenital anomaly in the planned hospital group (1 brain tumor, 1 liver cirrhosis).PPV = positive pressure ventilation.
Participants
Once the records were classified, the planned homebirth group comprised 6,692 women. A sample of 6,692women was then randomly selected and stratified for par-ity and one previous cesarean section from the low-riskplanned hospital group for the analysis. The groups weresimilar on baseline characteristics (Table 2). Most womenwere between 25 and 34 years of age, multiparous, andlived in the southern urban part of the province. Morewomen planning home births (45.5%) had received carefrom a midwife in a previous pregnancy compared withthose in the hospital birth group (34.8%).
Outcomes
Of 6,692 women in each group, 5,259 (78.6%) of thosein the planned home birth group gave birth at homeand 6,467 (96.6%) of those in the planned hospitalbirth group gave birth in hospital (Table 3). Overall,98.6 percent of newborns were born between 37 and 41completed weeks of pregnancy (Table 4). The plannedhome birth group had more babies with a gestational agegreater than 42 weeks (1.7% vs 0.8%).
Table 5 displays the perinatal/neonatal composite out-come (2.4% vs 2.8% RR [95% CI]: 0.84 [0.68, 1.03]).No differences were reported in the rates of perinatal or
186 BIRTH 36:3 September 2009
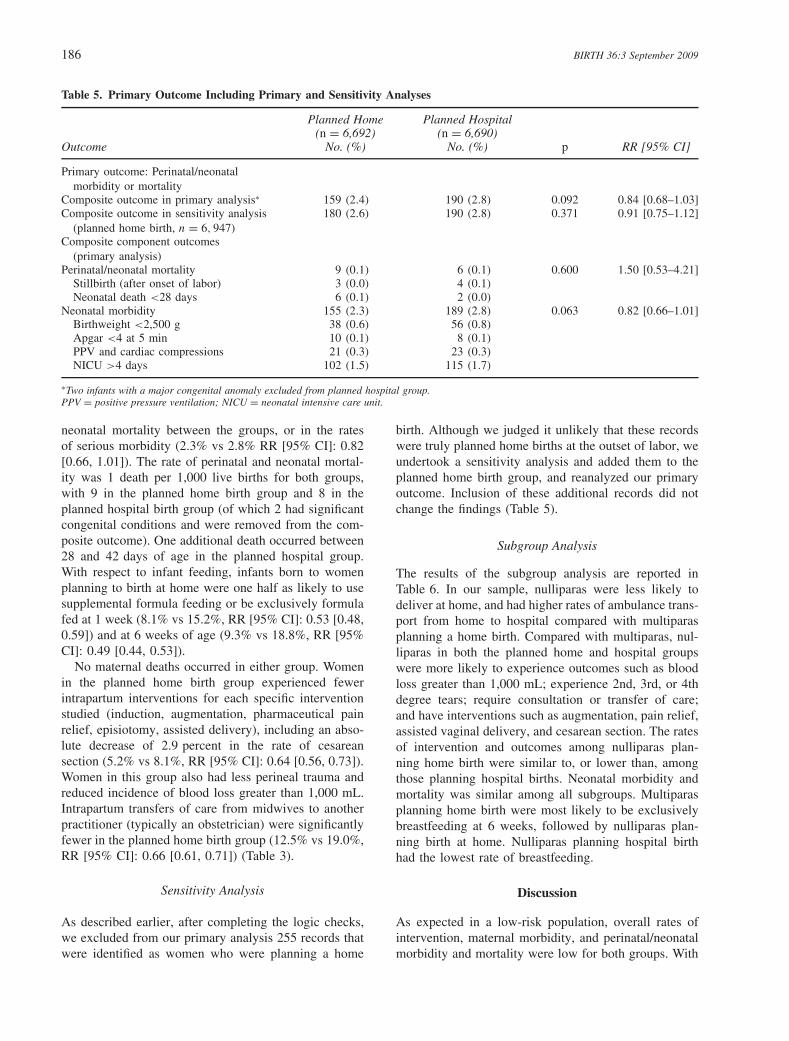
Table 5. Primary Outcome Including Primary and Sensitivity Analyses
Planned Home Planned Hospital(n = 6,692) (n = 6,690)
Outcome No. (%) No. (%) p RR [95% CI]
Primary outcome: Perinatal/neonatalmorbidity or mortality
Composite outcome in primary analysis∗ 159 (2.4) 190 (2.8) 0.092 0.84 [0.68–1.03]Composite outcome in sensitivity analysis
(planned home birth, n = 6, 947)180 (2.6) 190 (2.8) 0.371 0.91 [0.75–1.12]
Composite component outcomes(primary analysis)
Perinatal/neonatal mortality 9 (0.1) 6 (0.1) 0.600 1.50 [0.53–4.21]Stillbirth (after onset of labor) 3 (0.0) 4 (0.1)
Neonatal death <28 days 6 (0.1) 2 (0.0)
Neonatal morbidity 155 (2.3) 189 (2.8) 0.063 0.82 [0.66–1.01]Birthweight <2,500 g 38 (0.6) 56 (0.8)
Apgar <4 at 5 min 10 (0.1) 8 (0.1)
PPV and cardiac compressions 21 (0.3) 23 (0.3)
NICU >4 days 102 (1.5) 115 (1.7)
∗Two infants with a major congenital anomaly excluded from planned hospital group.PPV = positive pressure ventilation; NICU = neonatal intensive care unit.
neonatal mortality between the groups, or in the ratesof serious morbidity (2.3% vs 2.8% RR [95% CI]: 0.82[0.66, 1.01]). The rate of perinatal and neonatal mortal-ity was 1 death per 1,000 live births for both groups,with 9 in the planned home birth group and 8 in theplanned hospital birth group (of which 2 had significantcongenital conditions and were removed from the com-posite outcome). One additional death occurred between28 and 42 days of age in the planned hospital group.With respect to infant feeding, infants born to womenplanning to birth at home were one half as likely to usesupplemental formula feeding or be exclusively formulafed at 1 week (8.1% vs 15.2%, RR [95% CI]: 0.53 [0.48,0.59]) and at 6 weeks of age (9.3% vs 18.8%, RR [95%CI]: 0.49 [0.44, 0.53]).
No maternal deaths occurred in either group. Womenin the planned home birth group experienced fewerintrapartum interventions for each specific interventionstudied (induction, augmentation, pharmaceutical painrelief, episiotomy, assisted delivery), including an abso-lute decrease of 2.9 percent in the rate of cesareansection (5.2% vs 8.1%, RR [95% CI]: 0.64 [0.56, 0.73]).Women in this group also had less perineal trauma andreduced incidence of blood loss greater than 1,000 mL.Intrapartum transfers of care from midwives to anotherpractitioner (typically an obstetrician) were significantlyfewer in the planned home birth group (12.5% vs 19.0%,RR [95% CI]: 0.66 [0.61, 0.71]) (Table 3).
Sensitivity Analysis
As described earlier, after completing the logic checks,we excluded from our primary analysis 255 records thatwere identified as women who were planning a home
birth. Although we judged it unlikely that these recordswere truly planned home births at the outset of labor, weundertook a sensitivity analysis and added them to theplanned home birth group, and reanalyzed our primaryoutcome. Inclusion of these additional records did notchange the findings (Table 5).
Subgroup Analysis
The results of the subgroup analysis are reported inTable 6. In our sample, nulliparas were less likely todeliver at home, and had higher rates of ambulance trans-port from home to hospital compared with multiparasplanning a home birth. Compared with multiparas, nul-liparas in both the planned home and hospital groupswere more likely to experience outcomes such as bloodloss greater than 1,000 mL; experience 2nd, 3rd, or 4thdegree tears; require consultation or transfer of care;and have interventions such as augmentation, pain relief,assisted vaginal delivery, and cesarean section. The ratesof intervention and outcomes among nulliparas plan-ning home birth were similar to, or lower than, amongthose planning hospital births. Neonatal morbidity andmortality was similar among all subgroups. Multiparasplanning home birth were most likely to be exclusivelybreastfeeding at 6 weeks, followed by nulliparas plan-ning birth at home. Nulliparas planning hospital birthhad the lowest rate of breastfeeding.
Discussion
As expected in a low-risk population, overall rates ofintervention, maternal morbidity, and perinatal/neonatalmorbidity and mortality were low for both groups. With

BIRTH 36:3 September 2009 187
Table 6. Subgroup Analysis of Selected Variables for Nulliparas and Multiparas by Planned Home and Hospital Groups
Planned Home Planned HospitalNulliparas (n = 2,293) Nulliparas (n = 2,298)Multiparas (n = 4,393) Multiparas (n = 4,394)
Variable No.a (%) No.a (%)
Actual place of birth—homeNulliparas 1, 364 (59.5) 76 (3.3)
Multiparas 3, 891 (88.6) 132 (3.0)
Ambulance transport from home during orimmediately after birthNulliparasb 188 (8.2) 14 (0.6)
Multiparasc 173 (3.9) 30 (0.7)
Estimated intrapartum blood loss >1,000 mLNulliparasd 29 (1.3) 31 (1.3)
Multiparase 27 (0.6) 51 (1.2)
Consultation or transfer of care for bleedingNulliparas 32 (1.4) 39 (1.7)
Multiparas 47 (1.1) 67 (1.5)
Laceration–any 2nd–4th degree perineal, labial,or vaginal tear, or episiotomyNulliparas 1, 406 (61.3) 1, 382 (60.1)
Multiparas 1, 182 (26.9) 1, 597 (36.3)
Intrapartum transfer of careNulliparas 638 (27.8) 798 (34.7)
Multiparas 197 (4.5) 472 (10.7)
Postpartum transfer of careNulliparas 66 (2.9) 49 (2.1)
Multiparas 53 (1.2) 55 (1.3)
Any labor augmentationNulliparasf 817 (35.8) 1, 038 (45.5)
Multiparasg 1, 032 (23.7) 1, 388 (31.9)
Any pharmaceutical pain reliefNulliparas 782 (34.1) 1, 434 (62.4)
Multiparas 338 (7.7) 1, 591 (36.2)
EpisiotomyNulliparas 229 (10.0) 277 (12.1)
Multiparas 57 (1.3) 116 (2.6)
Assisted vaginal deliveryNulliparas 166 (7.2) 221 (9.6)
Multiparas 28 (0.6) 72 (1.6)
Cesarean SectionNulliparas 276 (12.0) 365 (15.9)
Multiparas 71 (1.6) 179 (4.1)
Infant feeding at 1 wk—exclusively breastfedNulliparash 1, 996 (87.4) 1, 825 (79.9)
Multiparasi 4, 122 (94.2) 3, 813 (87.2)
Infant feeding at 6 wk—exclusively breastfedNulliparasj 1, 962 (89.1) 1, 680 (76.7)
Multiparask 3, 887 (91.1) 3, 460 (82.2)
Composite perinatal neonatal morbidity/mortalityl
Nulliparas 80 (3.5) 85 (3.7)
Multiparas 79 (1.8) 105 (2.4)
Perinatal/neonatal mortalityl
Nulliparas 5 (0.2) 4 (0.2)
Multiparas 4 (0.1) 2 (0.1)
Neonatal morbidityNulliparas 78 (3.4) 84 (3.7)
Multiparas 77 (1.8) 105 (2.4)
aDenominator has been adjusted for missing data with missing data in home birth group and hospital birth group as follows: b8, 35; c16, 68; d6, 6;e14, 15; f 12, 15; g31, 48; h10, 15; i16, 23; j 91, 107; k127, 185; l2 infants with a major congenital anomaly excluded from planned hospital group.

188 BIRTH 36:3 September 2009
an overall rate of maternal mortality in Canada approx-imately 7 per 100,000 live births, it is clear that catas-trophic events in the low-risk population are very rare,and that this study cannot address this issue (38). Peri-natal mortality rates in our study were 1 death per 1,000live births in both groups. Statistics Canada reports aperinatal mortality rate of 6.7 per 1,000 in Ontario in2003, and 6.3 in all of Canada (39). This rate, however,includes outcomes for pregnancies of all risk categories,and is not directly comparable with the low-risk termpopulation that is reported in our study. Our findingswere comparable to, or lower than, those reported in2002 of home birth in British Columbia, Canada, wherethe perinatal mortality rate reported for home birth groupwas 3.5 per 1,000 and for a similar group of physicianattended hospital births 1.3 per 1,000 (14).
We found no increase in risk of adverse perinatal andneonatal outcomes in morbidity or mortality betweengroups, but we found significantly lower rates of intra-partum intervention and of serious maternal morbidity inthe planned home birth group compared with the plannedhospital group. With respect to the cases included in thesensitivity analysis, it is possible that desire for homebirth at the outset of labor (despite a contraindication)is construed at times to be a “plan” for a home birth.We judged that for some of the 419 cases, where thedata file indicated that home birth was planned at theoutset of labor in the presence of a clear contraindi-cation, some midwives might have erroneously enteredresponses to indicate that a home birth had at some pointin the pregnancy been planned or desired. We believethat our careful categorization of the two study groups,our approach to these cases, and the sensitivity analysisminimize the overestimation or underestimation of theoutcome rates for the planned home birth cohort.
Although the planned hospital birth group experiencedsomewhat higher rates of labor augmentation, epiduraluse, assisted vaginal birth, and an increase in cesareansection, the women’s outcomes are reassuring. In con-sidering explanations for the very favorable outcomes ofthe planned home birth group, we believe it is unlikelythat variations in midwifery practice are responsible. Thesame midwives cared for both groups of women. Whenmidwives provide care in the home, they may use differ-ent skills to enhance normal labor and birth, but it seemsunlikely that such differences would extend systematicallyacross the number of midwives who provided care to thestudy women. We cannot discount the possibility of biasedreporting of outcomes for the planned home birth group,but audits of midwifery data forms compared with hospi-tal records have not shown systematic underreporting ofproblems for women transported from home to hospital.In addition, one or more midwives are present for eachbirth, and typically a student is in attendance, so severalindividuals contribute to completing a client record.
It is far more likely that differences are due to thewomen themselves, since they self-select the plannedplace of birth. We noted no major confounders betweenthe two groups; however, more subtle but important dif-ferences likely exist between the women planning homeand those planning hospital births. In Ontario, midwivesare already caring for a self-selected subgroup of thepopulation who has selected midwifery care over themore typical obstetrical model. Women who plan a homebirth are often more motivated to avoid interventionssuch as epidural analgesia, which reduces the potentialfor other interventions compared with other women (16).A finding that supports the hypothesis of differencesbetween the groups is the decreased rate of supple-mented or formula fed infants at 6 weeks of age inthe planned home birth group. It is also possible thatmultiparas in our sample who planned a home birthdid so because they had an uncomplicated first birth,whereas those who experienced problems with previousbirths were more likely to choose a hospital setting. Wewere unable to verify this hypothesis, since we did nothave access to actual medical records with detailed clienthistories.
It is also plausible that the setting itself influences theoutcomes. Being in one’s own home environment maygo beyond mere comfort and enhance the very process oflabor and birth. We found the 40 percent decrease in therate of cesarean section, an absolute difference of nearly3 percent, surprising and speculated about the possibleinfluence of the hospital setting. Several hospitals in theprovince require that midwives transfer care to a physi-cian according to institutional criteria, the result beingmore transfers than if criteria of the College of Midwiveswere followed. This factor is borne out with our findingof an increased rate of intrapartum transfer of care in theplanned hospital group, and leads to a greater number ofwomen having care in labor managed by hospital staff.Distress at losing a known midwife as the attendant, amore interventionist style of care, or both may contributeto an increase in assisted or operative births.
Conclusions
Whatever their relative balance, we conclude that multi-ple factors contribute to the decreased rate of interven-tions and of maternal morbidity we found in the groupwho planned home birth. Appropriate self-selection bythe women themselves and good screening by mid-wives likely contribute to the observed results. A well-integrated midwifery care system is known to have apositive impact on outcomes (40), and it is likely thatthe Ontario context of self-regulation, good integrationinto the health care system with access to emergencyservices, and consultation and transfer of care when nec-essary also contribute to favorable outcomes.

BIRTH 36:3 September 2009 189
References
1. College of Midwives of Ontario. Statement of Homebirth. Toronto,Canada: Author, 1994.
2. College of Midwives of Ontario. Indications for Mandatory Dis-cussion, Consultation and Transfer of Care. (updated June 15).Toronto, Canada: Author, 2000.
3. Royal College of Obstetricians and Gynaecologists/Royal Col-lege of Midwives. Home Births. Joint statement No. 2. London:Authors, 2007.
4. Wiegers TA, Keirse MJNC, van der Zee J, Berghs GAH. Out-comes of planned home and planned hospital births in low riskpregnancies: Prospective study in midwifery practices in theNetherlands. BMJ 1996;313:1309–1313.
5. Campbell R, Macfarlane A. Where to Be Born: The Debate andthe Evidence. Oxford, England: National Perinatal EpidemiologyUnit, 1987.
6. Tew M. Safer Childbirth? A Critical History of Maternity Care.2nd ed. London: Chapman and Hall, 1998.
7. Olsen O. Meta-analysis of the safety of home birth. Birth1997;24(1):4–13.
8. Olsen O, Jewell D. Home versus hospital births. CochraneDatabase Syst Rev. 1998, Issue 3. Art. No.: CD000352. DOI:10.1002/14651858.CD000352.
9. Amelink-Verburg MP, Verloove-Vanhorick SP, Hakkenberg RMA,et al. Evaluation of 280,000 cases in Dutch midwifery practices:A descriptive study. BJOG 2008;115:570–578.
10. American College of Obstetrics and Gynecology. American Col-lege of Obstetrics and Gynecology (ACOG) Statement on HomeBirths . News release February 6, 2008. Accessed March 11,2009. Available at: http://www.acog.org/from_home/publications/press_releases/nr02-06-08-2.cfm.
11. Berghs G, Spnjaards E, Driessen L, et al. Neonatal neurologicaloutcome after low-risk pregnancies. Eur J Obstet Gynecol ReprodBiol 1995;62:167–171.
12. Shearer JML. Five year prospective survey of risk of booking fora home birth in Essex. Br Med J 1985;291:1478–1480.
13. Mehl LE, Peterson GH, Whitt M, et al. Outcomes of elec-tive home births: A series of 1,146 cases. J Reprod Med1977;19:281–290.
14. Janssen PA, Lee SK, Ryan EM, et al. Outcomes of planned homebirths versus planned hospital births after regulation of midwiferyin British Columbia. CMAJ 2002;166(3):315–323.
15. Crotty M, Ramsay AT. Smart R, Chan A. Planned home births inSouth Australia 1976–1987. Med J Aust 1990;153:664–671.
16. Ackermann-Liebrich U, Voegeli T, Gunter-Witt K, et al. ZurichStudy Team. Home versus hospital deliveries: Follow upstudy of matched pairs for procedures and outcome. BMJ1996;313:1313–1318.
17. McKenna P, Mathews T. Safety of home delivery compared withhospital delivery in the Eastern Region Health Authority in Irelandin the years 1999–2002. Ir Med J 2003;96(7):198–200.
18. Murphy PA, Fullerton J. Outcomes of planned home birth innurse-midwifery practice: A prospective descriptive study. ObstetGynecol 1998;92:461–470.
19. Hinds MW, Bergersen GH, Allen DT. Neonatal outcomesplanned versus unplanned out-of-hospital births in Kentucky.JAMA 1985;253:1578–1582.
20. Davies J, Hey E, Reid W, Young G, Home Birth Study SteeringGroup. Prospective regional study of planned home birthday. BMJ1996;313:1302–1306.
21. Ford C, Iliffe S, Franklin O. Outcome of planned home birth inan inner city practice. BMJ 1991;303:1517–1519.
22. Schneider G, Soderstrom B. Analysis of 275 planned and10 unplanned home births. Can Fam Physician 1987;33:1163–1171.
23. Woodcock HC, Read AW, Bower C, Stanley FJ, et al. A matchedcohort study of planned home and hospital births in Western Aus-tralia 1981–1987. Midwifery 1994;10:125–135.
24. Durand AM. The safety of home birth: The farm study. Am JPublic Health 1992;82(3):450–452.
25. Bastian H, Keirse M, Lancaster P. Perinatal death associated withplanned home birth in Australia: Population based study. BMJ1998;317:384–388.
26. Aikens Murphy P, Fullerton J. Outcomes of intended home birthsin nurse midwifery practice: A prospective descriptive study.Obstet Gynecol 1998;92(3):461–469.
27. Johnson KC, Davis BA. Outcomes of planned home birthday withcertified professional midwives: Large prospective study in NorthAmerica. BMJ 2005;330:1416–1422.
28. Tyson H. Outcomes of 1,001 midwife-attended home birthday inToronto, 1983–1988. Birth 1991;18(1):14–19.
29. Woodcock HC, Read AE, Moore DJ, et al. Planned homebirthsin Western Australia 1981–1987: A descriptive study. Med J Aust1990;153:672–678.
30. Anderson RE, Aikins Murphy P. Outcomes of 11,788 plannedhome births attended by certified nurse-midwives: A ret-rospective descriptive study. J Nurse Midwifery 1995;40(6):483–492.
31. Pang JW, Heffelfinger JD, Huang GJ, et al. Outcomes of plannedhome birth in Washington State: 1989–1996. Obstet Gynecol2002;100(2):253–259.
32. Schramm WF, Barnes DE, Bakewell JM. Neonatal mortalityin Missouri home births, 1978–84. Am J Public Health1987;77(8):930–935.
33. Mori R, Dougherty M, Whittle M. An estimation of intrapartum-related perinatal mortality rates for booked home births inEngland and Wales between 1994 and 2003. BJOG 2008;115:554–559.
34. Statistics Canada. Births 2005 . Statistics Canada Cataloguenumber 84F0210X1E (1): Table 1, Births by geography,Canada, 2004 and 2005;Accessed March 11, 2009. Available at:http://www.statcan.ca/english/freepub/84F0210XIE/84F0210XIE2005001.pdf.
35. Perinatal Partnership Program of Eastern and SoutheasternOntario, Provincial Perinatal Surveillance System Committee.2006 Provincial Perinatal Report . Ottawa, Canada: Author,August 5, 2008; Accessed March 11, 2009. Available athttp://www.pppeso.on.ca/en/pppeso/NIDAY_Perinatal_Database_p484.html.
36. College of Midwives of Ontario. Statement on VBAC and Choiceof Birthplace. Toronto, Canada: Author, 2002.
37. SPSS Inc. SPPS Version 15.0. Chicago, Illinois: Author, 2006.38. World Health Organisation. Maternal Mortality in 2005 –Es-
timates Developed by WHO, NICEF, UNFPA and The WorldBank. World Health Organisation 2007;23, Annex 3: Estimatesof number of maternal deaths, lifetime risk, MMR and rangeof uncertainty (2005). Accessed March 11, 2009. Available atwww.who.int/making_pregnancy_safer/documents.
39. Statistics Canada. Deaths 2003 . StatsCan Catalogue No.84F0211XIE, Table 7: Perinatal mortality and components bygeography. 2005;12:47. Accessed March 11, 2009. Available atwww.statcan.gc.ca.
40. Weigers TA. Home or hospital birth: A prospective study of mid-wifery care in the Netherlands. Eur J Obstet Gynecol Reprod Biol1998;79:139–141.